Embed Size (px)
Citation preview
Louisiana State UniversityLSU Digital Commons
LSU Master's Theses Graduate School
2005
Winter bird use of the Chinese tallow tree inLouisianaMichael John BaldwinLouisiana State University and Agricultural and Mechanical College, [email protected]
Follow this and additional works at: https://digitalcommons.lsu.edu/gradschool_theses
Part of the Environmental Sciences Commons
This Thesis is brought to you for free and open access by the Graduate School at LSU Digital Commons. It has been accepted for inclusion in LSUMaster's Theses by an authorized graduate school editor of LSU Digital Commons. For more information, please contact [email protected].
Recommended CitationBaldwin, Michael John, "Winter bird use of the Chinese tallow tree in Louisiana" (2005). LSU Master's Theses. 2468.https://digitalcommons.lsu.edu/gradschool_theses/2468
WINTER BIRD USE OF THE CHINESE TALLOW TREE IN LOUISIANA
A Thesis
Submitted to the Graduate Faculty of the Louisiana State University and
Agricultural and Mechanical College in partial fulfillment of the
requirements for the degree of Master of Science
In
The School of Renewable Natural Resources
by Michael John Baldwin
B.S., University of Wyoming, 1997 May 2005

ii
DEDICATION
To my wife. Your patience, support, and encouragement were invaluable.
iii
ACKNOWLEDGEMENTS
First I would like to thank Dr. Frank Rohwer, for taking over the reigns as my
committee chair so late in the game and for all your comments and advice on the
manuscript. I would like to thank Dr. Wylie Barrow for serving on my graduate
committee, providing funding, and offering much needed guidance along the way. I am
especially grateful for you giving me an opportunity to further my education. I also
would like to thank Dr. Phil Stouffer for serving on the committee and for the useful
comments and suggestions on the manuscript. A well deserved thanks goes to Dr.
Vernon Wright for initially accepting me as a graduate student and serving as my major
advisor until his retirement.
This project was funded by the U. S. Geological Survey, National Wetlands
Research Center, Lafayette, Louisiana. I thank Dr. Bob Stewart, Dr. Jerry Grau, and Dr.
Virginia Burkett for allowing me to undertake this momentous task. I also thank Dr. Clint
Jeske for his assistance with the captive bird study. Field and laboratory support were
provided by D. Pearson, K. Mack, J. McCoy, R. Boudreaux, L. Randall, K. Krauss and
H. Baldwin. I am grateful to P. Chadwick for answering many GIS questions. I thank
Dr. Jim Grace and Rassa Dale for reviewing my research proposal and Judy Buys for
helping me locate manuscripts not available at the NWRC library. Thanks to P. Hamel
and J. Sauer for advice and answering questions about point counts and species
detectability. I also thank D. Johnson for answering some statistics questions.
I am very grateful to the staff of Cameron Prairie and Lacassine National Wildlife
Refuges and the following landowners for granted me access their property: J. Breaux,
C. Broussard, H. Crappell, Republic Rice Mill, B. Hollier, B. Navarre, W. Broussard, Jr.,
iv
J. Ardoin, E. Wild, D. Miller, Sweet Lake Land Company, F. Woods, M. E. Blanchard, L.
and S. Bruchhaus, T. Campbell, E. Morcantel, R. and E. Doucet, J. Joseph, C. Herbert,
D. Courville, J. Miller, A. and M. Stanford, S. Baggett, N. Clement, D. Thibodeaux, N.
Haines, J. T. Gillespie, A. Hanks, Mrs. Z. Carrouth, G. and G. Broussard, M. Fox,
Lacassine Land Company, M. Leblanc, P. Cline, D. and L. Bertrand, T. and P. Lejeune,
J. Miller, H. Doucet, D. Ewing, S. Stagg, J. Gravot, J. Mesh, B. and S. Fitzgerald, L.
Beard, and E. Bieber. A special thanks goes to P. Fontenot and J. Thompson for
allowing me to mistnet birds on their property.
v
TABLE OF CONTENTS
DEDICATION.................................................................................................................... ii
ACKNOWLEDGMENTS…............................................................................................... iii
LIST OF TABLES…......................................................................................................... vi
LIST OF FIGURES......…..……....................................................................................... vii
ABSTRACT……............................................................................................................. viii
CHAPTER 1. INTRODUCTION....................................................................................... 1
CHAPTER 2. COMPARISON OF WINTER BIRD COMMUNITIES UTILIZING CHINESE TALLOW-TREE DOMINATED WOODLANDS AND BOTTOMLAND HARDWOOD FORESTS................................................. 5
STUDY AREA AND METHODS.............................................................................6 RESULTS............................................................................................................ 17 DISCUSSION....................................................................................................... 30
CHAPTER 3. ENERGY ASSIMILATION OF TALLOW FRUIT BY YELLOW-RUMPED WARBLERS, NORTHERN CARDINALS AND AMERICAN ROBINS................................................................................................... 34
METHODS........................................................................................................... 36 RESULTS............................................................................................................ 43 DISCUSSION...................................................................................................… 47
SUMMARY AND CONCLUSIONS..............................................................................… 50
LITERATURE CITED..................................................................................................... 51
APPENDIX A. SPECIES DETECTIONS IN BOTTOMLAND HARDWOODS........................ 61 B. SPECIES DETECTIONS IN CHINESE TALLOW WOODLANDS.................. 63 C. INFORMATION-THEORY MODEL SELECTION RESULTS..........................65 D. NITROGEN CORRECTED METABOLIZABLE ENERGY OF DIFFERENT
FRUITS BY INDIVIDUAL................................................................................ 76
VITA................................................................................................................................ 78
vi
LIST OF TABLES
1.1 Fatty acid composition of Chinese tallow fruit (pulp only)...............................…....4
2.1 Results from the species richness data analysis................................................. 19
2.2 Relative abundance of the most common species by woodland type, both years combined. Habitat comparisons were performed using the Friedmann’s test.... 20
2.3 Model selection results by species for models with a ∆AICc ≤4........................... 21 2.4 Mean (standard error) for landscape variables by habitat type.....................…... 25
2.5 Model-averaged parameter estimates, unconditional standard errors, and relative Akaike weights (3wi) for each explanatory variable by species and winter…… 27
3.1 Nutritional qualities of fruits used in this study using a random sample of fruits
(N=30)....……………………………………………………………………………….. 44 3.2 Summary of AME results by bird and plant species…................………….…….. 44 3.3 Nitrogen budget and weight loss during AME trials………………………………. 44
3.4 Food requirements to satisfy daily energy needs (EMavg) based on AME results. Calculations are based on pulp only.................................................................... 47
vii
LIST OF FIGURES
2.1 Locations of point count stations, Mermentau River Basin, Louisiana................... 7
2.2 Species richness (mean number of species detected per point ± standard error) according to habitat type, year, and month.......................................................... 18
3.1 AME of Chinese tallow pulp by Yellow-rumped Warblers (YRWA), Northern
Cardinal (NOCA), and American Robin (AMRO)................................................. 45 3.2 Yellow-rumped Warbler AME for Chinese tallow, wax myrtle, and poison ivy
fruit....................................................................................................................... 46 3.3 Northern Cardinal AME for Chinese tallow, deciduous holly, and hackberry
fruit....................................................................................................................... 46
viii
ABSTRACT
Chinese tallow (Triadica sebifera) is a non-native invasive tree that is of particular
concern in the Southeastern United States. It has become naturalized in a variety of
habitats and can be found in monospecific stands. The use of tallow woodlands by
overwintering birds is poorly documented. I compared use of tallow woodlands to use
of bottomland hardwood forests by birds in the Mermentau River Basin, Louisiana.
Species richness and evenness were greater in the bottomland hardwood sites. Three
species were more abundant in tallow woodlands, six species were more common in
bottomland hardwoods, and six species exhibited no difference between habitats.
Information-theory methodology was used to determine the relative importance of
woodland type and certain landscape variables to species richness and bird abundance.
Model-averaged parameter estimates and relative Akaike weights were calculated. In
most cases, woodland type was a better predictor of species richness and abundance
than percent forest cover, distance to nearest forest patch, or the number of forest
patches within 1 km. Energy assimilation of tallow fruit by captive birds was measured
to determine if apparent metabolizable energy differed between bird species and plant
species. Assimilation of tallow fruit pulp differed significantly between birds. Yellow-
rumped Warblers (Dendroica coronata) exhibited the highest assimilation of tallow,
followed by American Robins (Turdus migratorius) and then Northern Cardinals
(Cardinalis cardinalis). Yellow-rumped Warblers, which where more common in the
tallow woodlands, were able to metabolize tallow fruit more effectively than wax myrtle
(Morella cerifera) and poison ivy (Toxicodendron radicans) fruit. Metabolization of wax
myrtle and poison ivy fruit did not differ significantly. Cardinals metabolized deciduous
ix
holly fruit (Ilex decidua) more efficiently than either hackberry (Celtis laevigata) or tallow.
Overall, bottomland hardwoods supported more bird species and exhibited a higher
measure of species evenness. Tallow may provide an alternate food source for some
species and could potentially influence the local winter distribution of Yellow-rumped
Warblers.
1
CHAPTER 1: INTRODUCTION
Invasive species pose a serious threat to native ecosystems by altering
community structure and composition and ecosystem function (Stein and Flack 1996,
Schmitz et al. 1997, Wall and Darwin 1999, Mack et al. 2000, Wittenberg and Cock
2001, National Research Council 2002). More than 40% of the species on the U. S.
Threatened or Endangered Species List are in decline due in part to exotic species
(Stein and Flack 1996). The United Nations Secretariat of the Convention on Biological
Diversity (2001) declared invasive alien species to be one of the four leading factors
causing declines in biodiversity. Economic losses from non-native organisms to
agricultural crops, pastures and forests range from $78 billion to $137 billion per year in
the United States (Invasive Species Program 2000, Pimentel et al. 2001). Non-native
plants alone cause $33.9 billion in losses per year. In extreme cases, native habitats
can be overrun by exotic plants and converted into single-species dominated systems,
causing declines in native fauna and flora (Westbrooks 1998). Examples of this have
occurred with the Australian paperbark tree (Melaleuca quinquenervia) in Florida
(Schmitz et al. 1997, Westbrooks 1998), Mimosa pigra in Australia (Braithwaite et al.
1989), Acacia mearnsii in South Africa (de Witt et al. 2001), leafy spurge (Euphorbia
esula) in the northern United States and southern Canada (Westbrooks 1998) and salt
cedar (Tamarix spp.) along riparian zones of the Southwest (Wittenberg and Cock
2001). Similarly, the Chinese tallow tree (Triadica sebifera) is invading habitats in the
southeastern United States, often forming near monospecific woodlands.
Chinese tallow is a member of the Euphorbiaceae (spurge family). The tree sap
is toxic and the leaves are poor forage for cattle, causing diarrhea and even death
2
(Russell et al. 1969). Common names for tallow include chicken tree, popcorn tree,
Florida aspen, and it has been placed in the genera Sapium sebiferum, Croton sebifera,
and Stillingia sebifera (Jubinsky 1994, Jubinsky and Anderson 1996, Rogers et al.
2000). Tallow is capable of growing in a variety of habitats including bottomland
hardwood forests, coastal prairie, abandoned agricultural fields, cheniers, levees and
spoil banks (Duke 1983, Jones and McLeod 1989, Bruce et al. 1995, Neyland and
Meyer 1997, Wall and Darwin 1999, Cameron et al. 2000). It is considered a threat to
coastal prairie in Texas and Louisiana (Bruce et al. 1995, Grace 1998, Barrilleaux and
Grace 2000). Expansion of tallow into more northerly regions of the United States may
be limited by temperature (Charron et al. 2000). Like other invasive plants, tallow
possesses several competitive advantages over native flora, including: low insect
herbivory and pathogen load; rapid seedling growth equal to or greater than native
species; early maturation; high fecundity; ability to grow in full sun or low light; and
tolerance of poor soils, flooding, drought, and low salt levels (Tsing et al. 1956, Jones
and McLeod 1989, Jones and Sharitz 1990, Houran and Pengxin 1991, Conner and
Askew 1993, Bruce et al. 1997, Grace 1998, Wall and Darwin 1999).
Chinese tallow is native to southeast Asia where it is grown as an agricultural
crop, primarily for its seed oil (stilingia oil) (Singh et al. 1993, Sharma et al. 1996, Bruce
et al. 1997). Products manufactured using tallow include soap, dyes, fuel, paint and
varnish, candles, honey and wood pulp (Scheld and Cowles 1981, Duke 1983, Xu et al.
1991, Cameron et al. 2000). Tallow was first introduced into the United States in
Georgia by Benjamin Franklin circa 1772 (Bruce et al. 1997) and in Texas and
Louisiana by the Bureau of Plant Industry (U. S. Department of Agriculture) in the early
3
1900’s in the hopes of establishing tallow as a seed crop (Cameron and Spencer 1989,
Jubinsky 1994, Barrow, pers. comm.). Earlier plantings may have occurred in the Gulf
Coast, since a herbarium sample was collected in the late 1800’s from Louisiana
(Barrow, pers. comm.). Later introductions in the 1900’s occurred due to horticultural
plantings because of its fast growth and showy red colors as the leaves change color in
the fall.
The effects of tallow on avifauna are not fully understood and are likely
dependent on the species of interest and time of year. Tallow produces an abundant
late-fall fruit crop, which persists through winter and is primarily bird-dispersed (Jones
and McLeod 1989). Conway et al. (2002) documented foraging on tallow fruit by fall
migrants in coastal Texas and recorded use by 24 species. Barrow and Fontenot
(unpubl. data) have observed 64 species feeding on tallow fruit. Renne et al. (2000)
stated that about 40% of the tallow fruit crop is consumed by birds. This is an indication
that certain species may benefit from tallow fruit, mid-fall through early spring. In
contrast, previous research on spring Neotropical migrants suggests that tallow trees do
not provide sufficient food resources for certain insectivorous trans-Gulf migrants
because of a lack of foliage-eating insects (Barrow and Renne 2001). Consequently,
tallow woodlands may provide poor stop-over habitat; worse yet, tallow may serve as an
ecological trap for these migrants.
Few birds may be able to efficiently assimilate the energy in tallow. The pulp
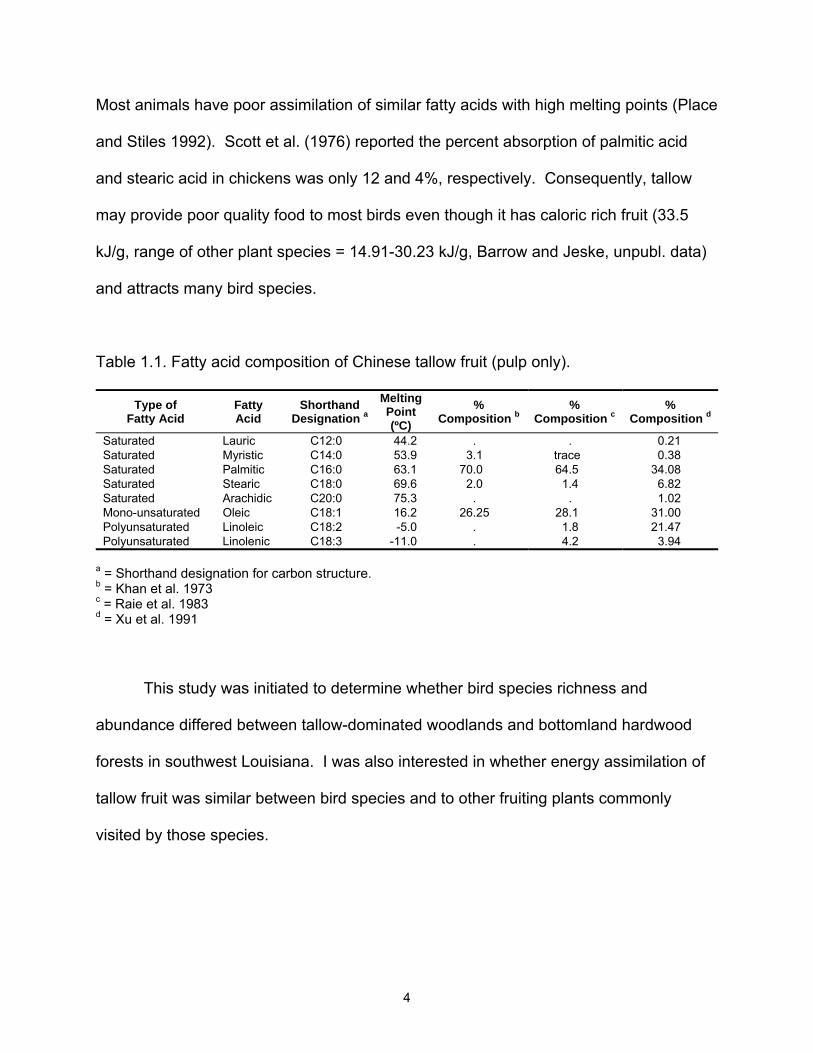
(aril) layer of tallow fruit is high in fatty acids, primarily palmitic acid and oleic acid (Table
1.1) (Khan et al. 1973, Raie et al. 1983, Xu et al. 1991). Palmitic acid, the most
abundant fatty acid in tallow pulp, is a saturated fatty acid with a high melting point.
4
Most animals have poor assimilation of similar fatty acids with high melting points (Place
and Stiles 1992). Scott et al. (1976) reported the percent absorption of palmitic acid
and stearic acid in chickens was only 12 and 4%, respectively. Consequently, tallow
may provide poor quality food to most birds even though it has caloric rich fruit (33.5
kJ/g, range of other plant species = 14.91-30.23 kJ/g, Barrow and Jeske, unpubl. data)
and attracts many bird species.
Table 1.1. Fatty acid composition of Chinese tallow fruit (pulp only).
Type of Fatty Acid
Fatty Acid
Shorthand Designation a
Melting Point (ºC)
% Composition b
% Composition c
% Composition d
Saturated Lauric C12:0 44.2 . . 0.21 Saturated Myristic C14:0 53.9 3.1 trace 0.38 Saturated Palmitic C16:0 63.1 70.0 64.5 34.08 Saturated Stearic C18:0 69.6 2.0 1.4 6.82 Saturated Arachidic C20:0 75.3 . . 1.02 Mono-unsaturated Oleic C18:1 16.2 26.25 28.1 31.00 Polyunsaturated Linoleic C18:2 -5.0 . 1.8 21.47 Polyunsaturated Linolenic C18:3 -11.0 . 4.2 3.94
a = Shorthand designation for carbon structure. b = Khan et al. 1973 c = Raie et al. 1983 d = Xu et al. 1991
This study was initiated to determine whether bird species richness and
abundance differed between tallow-dominated woodlands and bottomland hardwood
forests in southwest Louisiana. I was also interested in whether energy assimilation of
tallow fruit was similar between bird species and to other fruiting plants commonly
visited by those species.
5
CHAPTER 2: COMPARISON OF WINTER BIRD COMMUNITIES UTILIZING CHINESE TALLOW-TREE DOMINATED WOODLANDS AND BOTTOMLAND
HARDWOOD FORESTS
Non-native, invasive species are a major concern to the conservation of fauna and
flora in the United States. Exotics are the primary cause for declines in 18% of the
species listed on the U. S. Threatened and Endangered Species List and are a
contributing factor for declines for an additional 24% (Stein and Flack 1996). No
ecosystem in the U. S. has been left unaffected by this problem (Invasive Species
Program 2000). Particularly severe invasions by non-native organisms have converted
diverse ecosystems into single-species dominated systems (Westbrooks 1998, Mack et
al. 2000).
In the Southeast, an invasive plant of particular concern is the Chinese tallow tree.
Tallow is native to southeast Asia and was introduced into the United States in the late
1700’s as a potential agriculture crop for its seed oil (Singh et al. 1993, Sharma et al.
1996, Bruce et al. 1997). It is now spread throughout the northern Gulf Coast and south
Atlantic states and can be found in near monospecific stands (Scheld and Cowles 1981,
Harcombe et al. 1993, Renne et al. 2000). Little is known about the use of this new
woodland type by birds during the winter months. Many birds consume tallow fruit and
are the primary dispersal agent of the seeds (Jones and McLeod 1989, Barrow and
Fontenot, unpubl. data). However, plant diversity within tallow woodlands tends to be
low (pers. obs.) and may not provide suitable habitat for most woodland birds. With
current declines in Neotropical migratory birds (DeGraaf and Rappole 1995), it is
important to document bird use of tallow woodlands to indicate potential effects that
tallow will have on these populations.
6
The objectives of this study were to compare species richness and relative
abundance of species between tallow-dominated woodlands and nearby stands of
hardwoods during winter in southwest Louisiana. I also examined the relative
importance of specific landscape variables and woodland type to avian abundance and
species richness. Results from this study may provide insight into the role Chinese
tallow in shaping winter bird assemblages.
STUDY AREA AND METHODS
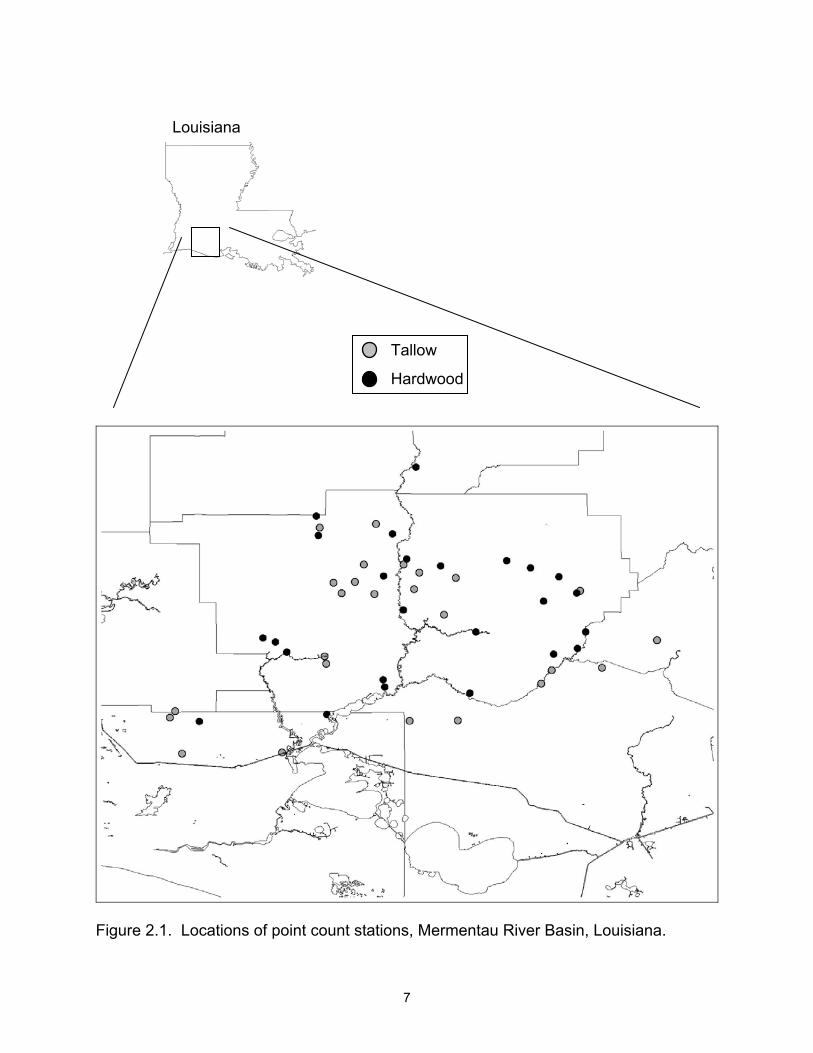
Sites were located in the Mermentau River Basin of southwest Louisiana. This
basin was historically dominated by tallgrass prairie and riparian gallery forests, most of
which has been converted into agricultural fields. Remaining riparian woodlands occur
along natural water drainages and man-made canals. In the fall of 2001, 50 sites were
selected in bottomland hardwood forests with some mixed pine (n=25) and tallow-
dominated (n=25) woodlands on private (n=48) and public land (n=2) (Figure 2.1).
Tallow-dominated stands were characterized as having an estimated ≥70% tallow in the
canopy. The majority of these stands occurred on fallow agriculture fields. Most
hardwood stands had some tallow present. Only hardwood sites with less than 10%
tallow in the canopy were used. All woodland stands were greater than 0.5 ha in area.
Independence between sites was achieved by selecting sites at least 1 km apart for
sites of a particular woodland type. This criterion was relaxed for minimum distances
between tallow and bottomland sites, where sites were at least 0.8 km apart.
Birds were surveyed using 50-m fixed-radius point counts based on methods
established by Hamel et al. (1996). Sites were sampled once per month over a 7 – 10
day period in mid-December, mid-January, and mid-February in the winters of 2001-02
7
Figure 2.1. Locations of point count stations, Mermentau River Basin, Louisiana.
Tallow
Hardwood
Louisiana
8
and 2002-03. Surveys were conducted from 07:00 to 13:45, which is longer than the
interval used for breeding surveys, but has been shown to be valid for winter point count
studies in other geographic locations (Rollfinke and Yahner 1990, Gutzwiller 1991).
Counts were conducted in pairs of one tallow site and one bottomland hardwood site,
with three or four pairs were randomly sampled per day. All birds detected visually or
aurally within a 10-min period were recorded on a data sheet according to their azimuth
and distance from observer. If any bird was flushed within the point count circle while
walking to the site, the initial location of the bird was recorded. Flyovers and birds
detected outside 50 meters were recorded, but not included in analyses because of
uncertainties on whether the birds were occupying the stand or adjacent habitats. The
10-min period was divided into 3 time intervals (0-3 min, 3-5 min, and 5-10 min), and
bird observations were recorded according to the interval of detection. Estimated
position of a bird was recorded on the data sheet. All observations fell into two distance
bands: 0-25 m and >25-50 m. I conducted all counts and wore neutral-colored clothing
during counts (Gutzwiller and Marcum 1997). Surveys were not conducted if winds
were greater than 20 km/h, at temperatures less than 0°C, or during rain or snow.
Detection Probability
Recently, researchers have suggested that point counts uncorrected for
detectability may produce biased or imprecise measurements of bird abundance
(Barker and Sauer 1995, Boulinier et al. 1998, Bart and Earnst 2002, Farnsworth et al.
2002, MacKenzie and Kendall 2002, Rosenstock et al. 2002). Their assertion is that
detection probabilities differ between species and individuals and can be influenced by
a variety of factors (e.g., season, weather conditions, time of day, habitat). Three types
9
of factors that influence species detection rates have been described: 1) observer
abilities, skills, and behavior; 2) environmental variables; and 3) physical and behavioral
characteristics of birds (Rosenstock et al. 2002). For these reasons, it has been argued
that accurate estimates of bird abundance cannot be determined without accounting for
these effects.
One technique that deals with this issue is the removal model (Farnsworth et al.
2002). This method determines detection probabilities of birds based on the first
interval of detection out of three or more periods. This method is useful for counts
where most detections are aural, a characteristic of this study. However the model is
not appropriate in this study because it requires an assumption of a closed population
within the count radius during the survey period. Since surveys were conducted in the
winter and contained many non-territorial birds and also mixed species flocks, this
assumption cannot be satisfied (John Sauer, pers. comm.). Neither does this model
work well for wide-ranging species such as Pileated Woodpecker (Dryocopus pileatus)
or American Crow (Corvus brachyrhynchos) (Farnsworth et al. 2002). Shortening
counts to 5 minutes was suggested as a way to improve the likelihood of meeting this
assumption; however, even at this shorter length, the presence of primarily non-
territorial birds, mixed foraging flocks, and wide-ranging species still precludes the use
of this technique. Also, shortening counts results in fewer detections of uncommon
species. For example, in this study, species richness in tallow woodlands would decline
by 7 (15.9%) and by 5 species (10.4%) in the bottomland hardwoods.
Distance sampling (Buckland et al. 1993) is another method that has been used
to estimate bird densities and species detection rates. Distances to birds are recorded
10
in radial distances or in 3 or more distance bands. Bird densities are determined from
these distances using program DISTANCE (Thomas et al. 2004). Minimal sample size
is 60 to 80, but 100 or more is recommended (Buckland et al. 1993). For this study,
seven species had 100 observations (2 in Year 1, 5 in Year 2); however, because one
objective of this study was to examine relationships between species abundance and
landscape variables, none of the species satisfied this requirement on a site-by-site
basis. Also, detections were recorded into two distance bands using perpendicular
distances from the observer to the birds. This is according to standard point count
procedure (Paul Hamel, pers. comm.). Radial distances (i.e., angle and perpendicular
distance), as required by DISTANCE, were not recorded and may not be equivalent to
perpendicular distances (Buckland, pers. comm.). Also, because detections were
lumped into two distance bands, the data are restricted to a single-parameter detection
function and model fit cannot be adequately tested (Buckland et al. 1993). In addition to
these problems, serious concerns have been raised as to whether avian point count
data meet model assumptions for DISTANCE (Hutto and Young 2003). The issues
raised by the authors’ are discussed in length and are not trivial. Their most critical
statement is that three of the four model assumptions are probably always violated
when applied to avian point counts in forest settings.
MacKenzie et al. (2002) proposed a method to estimate detection probabilities
based on species occupancy rates. This method was not considered because it
requires a closed population, which, as mentioned previously, is not reasonable for
winter point count data. For the same reason, the methods presented by MacKenzie
and Kendall (2002) for estimating detection probabilities (i.e., hypothesis testing,

11
equivalence testing, and model averaging) were not used due to the closed population
assumption.
Other field methods have been suggested as an alternative to standard point
count procedures. Double sampling (Cochran 1977, Bart and Earnst 2002) involves a
larger sample of incomplete counts (estimated densities) and a random sample of
thorough, complete counts (actual densities). The latter is used to adjust the results
from the incomplete counts. It has been used for shorebird surveys (Handel and Gill
1992, Bart and Earnst 2002) and deer pellet surveys (Eberhardt and Simmons 1987),
but may have problems when applied to avian point counts in forested settings
(Thompson 2002) since it is not reasonable to assume that all individuals will be
recorded in the complete counts. In addition, fewer sites can be surveyed with this
technique in the same amount of time, so more personnel are required or fewer data
are collected.
Another count method is the double-observer approach (Nichols et al. 2000).
This method employs two observers, a primary and a secondary observer. The
secondary observer records all bird detections from the primary observer and also any
other bird sightings that the primary missed. Detection probabilities are derived from
each observer’s counts. Problems with this method include lack of independence
between observer sightings and reduced detections by the secondary observer in high
bird density areas due to his/her dual role as recorder and observer. Nichols et al.
(2000) suggest ways to deal with this including adding a third person as a recorder.
The problem with this approach is that the authors do not adequately consider the effect
a second or third person has on bird behavior. Observer effects on bird behavior are
12
well documented (McShea and Rappole 1997, Bye et al. 2001) and adding observers
can only compound the problem. In addition, the method does not work well for species
and/or individuals with low detection probabilities. Finally, the requirement of a second
observer precludes the use of this method in many avian studies due to higher costs,
including this one.
As mentioned above, three factors have been described that influence species
detection rates (Rosenstock et al. 2002). The first of these deals with observer skills
and ability. Since all of my counts were made by the same person and neutral colored
clothing was worn during counts, this should not be a major concern. The second factor
consists of environmental variables that may influence species detectability. In this
study, counts were not conducted with winds greater than 20 km/h, at temperatures less
than 0°C, or during rain or snow. Topography was not an issue as site elevations were
near level. Vegetation characteristics can influence detectability of birds. In this study, I
argue that habitat comparisons made without accounting for species detectability are
acceptable, since the majority of bird detections in southeastern forests are auditory,
often greater than 90 percent (Hamel et al. 1996, 87% in northern Rockies - Hutto and
Young 2003), and auditory detection thresholds in forests were found to be 70 meters
and beyond in earlier studies (Emlen and DeJong 1981, Wolf et al. 1995). In addition,
stem density (i.e., all woody plants at breast height or greater) and shrub density (i.e.,
shrubs at breast height or greater) at my study sites did not differ significantly between
woodland type (stem density: P = 0.729; shrub density: P = 0.555). Therefore,
differences in vegetation density between habitats should not be a significant concern.
Also, the goal of this study is to compare relative abundance of species between
13
woodland types, not estimate bird densities. Finally, the third factor discussed is
concerned with “...physical and behavioral attributes of birds that make them more or
less conspicuous...” (e.g., body size, color, vocalization characteristics, flight behavior).
Again, I am not concerned with estimating densities and most detections are aural. In
addition, I am only comparing species ‘X’ in tallow woodlands to species ‘X’ in native
woodlands, not species ‘X’ to ‘Y’. Therefore, due to the aforementioned reasons, this
study does not include detection probabilities, nor are the data adjusted for this factor.
However, I do test for differences in detection rates between distance bands to
determine if bird detectability differs between woodland type (see below).
Landscape Metrics
Landscape variables were measured to determine their relationship to species
richness and abundance. These metrics were chosen under the presumption that they
were important factors affecting species richness and abundance. Variables measured
included forest patch size (ha) (PatchSize), distance to nearest forest patch (km)
(DistPatch), distance to nearest road (km) (DistRoad), percent forest cover within 1 km
radius (ForCover), forest perimeter within 1 km radius (km) (ForPerim), and number of
distinct forest patches within 1 km of the site (NumPatch). Landscape variables were
measured using Digital Ortho Quarter Quads in ArcView® 3.3 Geographic Information
Systems (Environmental Services Research Institute 2002). Some of the 1 km radius
survey areas overlapped with nearby sites; therefore, one of the overlapping sites was
randomly removed from the analysis. Four sites were removed leaving 23 tallow sites
and 23 bottomland hardwood sites. Forest patches were defined as woodlands ≥25 m
wide. Any linear patch of trees (e.g., treeline along a fence) would not be included
14
unless it met these width requirements. Patch boundaries were defined as woodlands
isolated from other woodlands by either watercourses or forest clearings greater than 25
m wide or separated by roadways. DistPatch was measured as the straight-line
distance from the edge of the patch containing the point count to the nearest forest
patch. DistRoad was measured as the distance from the point count center to the
nearest road.
In October 2002, Hurricane Lili hit Louisiana, causing damage to many of the
plots. Damage ranged from none to several trees blown down in one plot. Because
this damage could affect avian use of the woodlands, a hurricane damage index was
created. Each site was visually ranked from 1 to 5 based on extent of damage
according to the following criteria:
1. Little or no damage.
2. Moderate limb damage, few if any topped trees.
3. Major limb damage, topped trees, a few felled trees, small canopy gaps.
4. Several felled trees, large canopy gaps.
5. Major blowdown, most trees lost with little canopy remaining.
Statistical Analysis
For species comparisons, only species with at least 30 detections and a
frequency of occurrence of 0.20 across all sites in both years combined were included
in the analysis. Species richness comparisons included all species. To determine if
species detection rates were similar between habitats, 2x2 contingency tables were
created using distance from plot center (i.e., 0-25 m or 25-50 m) and habitat type.
These tables were analyzed using log-linear analysis (Proc CATMOD, SAS Institute Inc.
15
1999). Three species exhibited significant habitat/distance interactions: American
Goldfinch (Carduelis tristis), American Robin (Turdus migratorius), and Downy
Woodpecker (Picoides pubsecens), while the other 14 species did not. For these three
species, detections recorded beyond 25 meters were excluded. Consequently,
Goldfinches and Downy Woodpeckers were dropped from further analyses, due to
fewer than 30 observations remaining.
Habitat comparisons of species abundance were made using Freidmann’s
nonparametric test (Conover 1980), controlling for year and month (Proc FREQ, SAS
Institute Inc. 1999). Because multiple species comparisons were made, a more
conservative alpha of 0.01 was used. Species richness data met parametric
assumptions and were analyzed as repeated measures analysis of variance, with year
and month repeated (Proc MIXED, SAS Institute Inc. 1999). Pielou’s J′ (Pielou 1969)
was calculated to measure species evenness between habitats. Evenness data were
logit transformed and analyzed as repeated measures analysis of variance, with year
and month repeated (Proc MIXED).
An information-theoretic approach (Burnham and Anderson 2002) was used to
examine the relative importance of landscape variables (i.e., PatchSize, DistPatch,
ForCover, ForPerim, and NumPatch), habitat/woodland type (Hab), and hurricane
damage (Damage) to species richness (SppRich) and abundance. Correlations were
calculated for each pair of explanatory variables to remove highly correlated variables (r
> 0.80). PatchSize was positively correlated to ForCover (r = 0.858), so the former was
excluded from the analysis. Preliminary regression analyses indicated multicollinearity
problems when including ForPerim in the global model, so this variable was also
16
excluded. Additionally, little support was found for including DistRoad in the analysis,
so it was also excluded. Damage from Hurricane Lili occurred between field seasons;
therefore, each year was analyzed separately. All linear combinations of the remaining
variables were used in the analyses.
Second order Akaike’s Information Criterion (AICc) for small sample size (Sugiura
1978) was used to rank model importance, with a lower AICc meaning a better model fit.
Use of AICc is recommended over AIC when the number of explanatory variables is less
than 40 times the number of observations (Anderson et al. 2001). Models were ranked
and differences calculated (∆AICc) based on the best model (model with the minimum
AICc) so that the highest ranked model had a ∆AICc equal to 0. Models with ∆AICc #2
are considered to have substantial support, models with ∆AICc between 4 and 7 have
considerably less support, and those with ∆AICc ≥10 have essentially no support
(Burnham and Anderson 2002). Standardized Akaike model weights (wi) were
calculated to rank model importance, such that the sum of wi across models is 1. Each
wi is a measure of the strength of evidence or a probability that a particular model is the
true model. The greater the wi, the more likely that that model is the true model. If
support for a single best model is lacking (i.e., wi ≤0.90), it is useful to examine the
relative importance of each variable. This may be done by examining wi across models
known as multimodel inference (Burnham and Anderson 2002). This technique was
used to examine the relative importance of the explanatory variables by summing wi
(3wi) for each model in the set that contains the variable of interest. The larger 3wi, the
more important that variable is relative to the other variables. Model-averaged
17
parameter estimates and unconditional standard errors were calculated for each
species.
Proc MIXED (SAS Institute, Inc. 1999) was used to calculate model fit statistics
using log+1-transformed data for SppRich and the more abundant species (Northern
Cardinal, Ruby-crowned Kinglet-Year 2 only, and Yellow-rumped Warbler-Year 2 only).
Proc REG (SAS Institute, Inc. 1999) was used to calculate parameter estimates and
standard errors. Less common species were analyzed with logistic regression as
presence/absence data (Proc LOGISTIC, SAS Institute, Inc. 1999). A goodness-of-fit
test (Hosmer and Lemeshow 1989) was performed to test the fit of the global model for
each species and data were checked for potential problems of overdispersion (Proc
GENMOD was used for SppRich and common species, while Proc LOGISTIC was used
for the less common species, SAS Institute, Inc. 1999). All possible subsets of the
explanatory variables were modeled. Model-averaged parameter estimates for Hab are
either positive for species tending to respond favorably to native sites or negative for
those responding more favorably to tallow.
RESULTS
A total of 54 species were observed in this study; 48 species were detected in
the hardwood sites and 44 species were detected in tallow (See Appendices A and B
for complete species list). Species richness was lower in tallow woodlands with 4.8 (SE
= 0.19) species detected per point versus 6.0 (SE = 0.27) species per point in
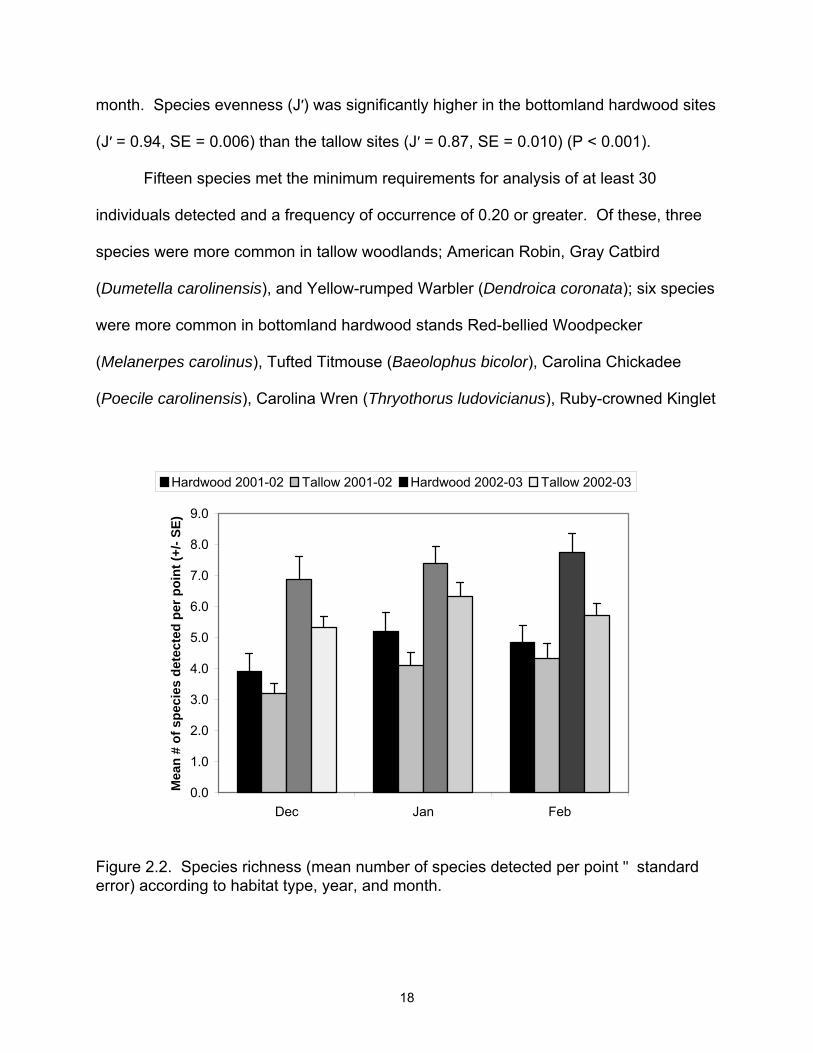
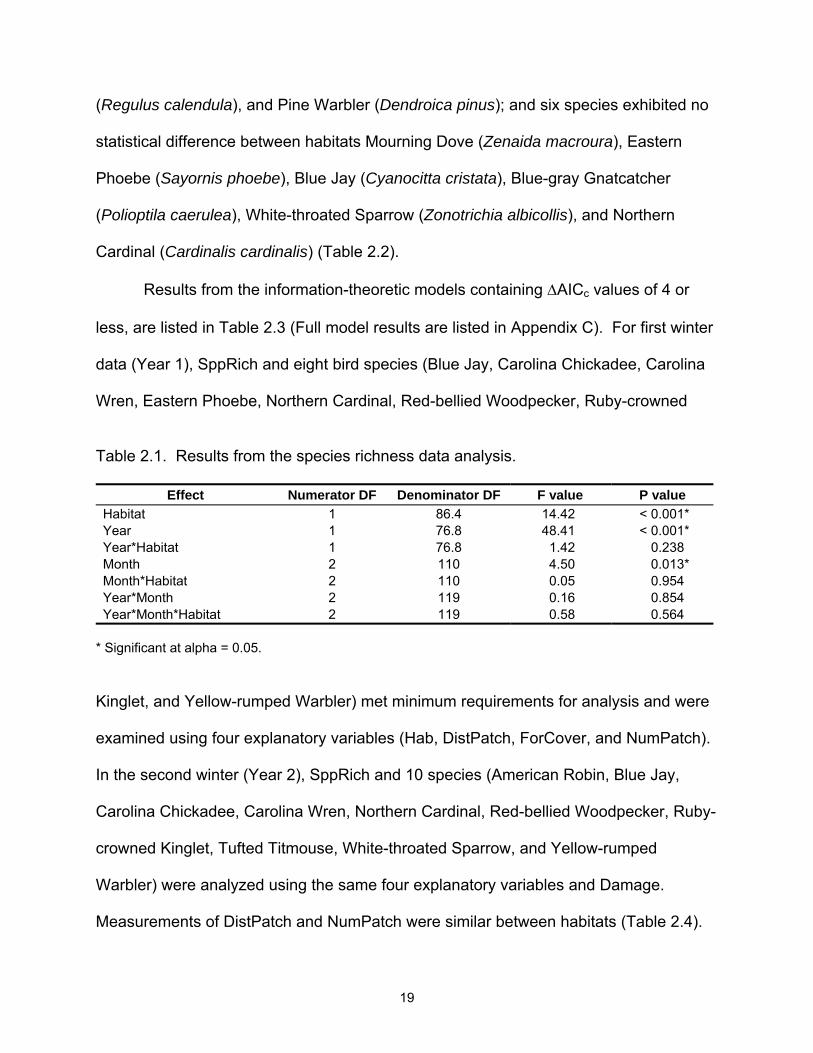
bottomland hardwood sites (Table 2.1). Species richness also varied between years
and months (Figure 2.2), but no interactions were detected between habitat, year and/or
18
month. Species evenness (J′) was significantly higher in the bottomland hardwood sites
(J′ = 0.94, SE = 0.006) than the tallow sites (J′ = 0.87, SE = 0.010) (P < 0.001).
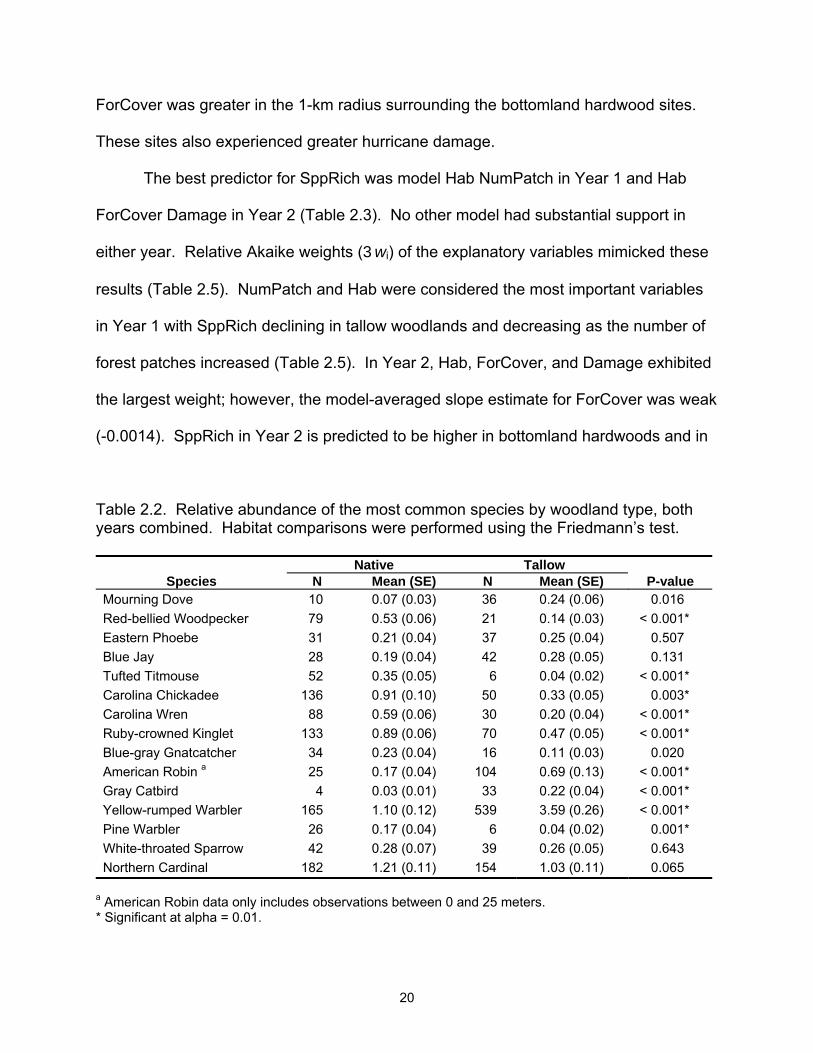
Fifteen species met the minimum requirements for analysis of at least 30
individuals detected and a frequency of occurrence of 0.20 or greater. Of these, three
species were more common in tallow woodlands; American Robin, Gray Catbird
(Dumetella carolinensis), and Yellow-rumped Warbler (Dendroica coronata); six species
were more common in bottomland hardwood stands Red-bellied Woodpecker
(Melanerpes carolinus), Tufted Titmouse (Baeolophus bicolor), Carolina Chickadee
(Poecile carolinensis), Carolina Wren (Thryothorus ludovicianus), Ruby-crowned Kinglet
Figure 2.2. Species richness (mean number of species detected per point " standard error) according to habitat type, year, and month.
0.0
1.0
2.0
3.0
4.0
5.0
6.0
7.0
8.0
9.0
Dec Jan Feb
Mea
n #
of s
peci
es d
etec
ted
per p
oint
(+/-
SE)
Hardwood 2001-02 Tallow 2001-02 Hardwood 2002-03 Tallow 2002-03
19
(Regulus calendula), and Pine Warbler (Dendroica pinus); and six species exhibited no
statistical difference between habitats Mourning Dove (Zenaida macroura), Eastern
Phoebe (Sayornis phoebe), Blue Jay (Cyanocitta cristata), Blue-gray Gnatcatcher
(Polioptila caerulea), White-throated Sparrow (Zonotrichia albicollis), and Northern
Cardinal (Cardinalis cardinalis) (Table 2.2).
Results from the information-theoretic models containing ∆AICc values of 4 or
less, are listed in Table 2.3 (Full model results are listed in Appendix C). For first winter
data (Year 1), SppRich and eight bird species (Blue Jay, Carolina Chickadee, Carolina
Wren, Eastern Phoebe, Northern Cardinal, Red-bellied Woodpecker, Ruby-crowned
Table 2.1. Results from the species richness data analysis.
Effect Numerator DF Denominator DF F value P value
Habitat 1 86.4 14.42 < 0.001* Year 1 76.8 48.41 < 0.001* Year*Habitat 1 76.8 1.42 0.238 Month 2 110 4.50 0.013* Month*Habitat 2 110 0.05 0.954 Year*Month 2 119 0.16 0.854 Year*Month*Habitat 2 119 0.58 0.564
* Significant at alpha = 0.05.
Kinglet, and Yellow-rumped Warbler) met minimum requirements for analysis and were
examined using four explanatory variables (Hab, DistPatch, ForCover, and NumPatch).
In the second winter (Year 2), SppRich and 10 species (American Robin, Blue Jay,
Carolina Chickadee, Carolina Wren, Northern Cardinal, Red-bellied Woodpecker, Ruby-
crowned Kinglet, Tufted Titmouse, White-throated Sparrow, and Yellow-rumped
Warbler) were analyzed using the same four explanatory variables and Damage.
Measurements of DistPatch and NumPatch were similar between habitats (Table 2.4).
20
ForCover was greater in the 1-km radius surrounding the bottomland hardwood sites.
These sites also experienced greater hurricane damage.
The best predictor for SppRich was model Hab NumPatch in Year 1 and Hab
ForCover Damage in Year 2 (Table 2.3). No other model had substantial support in
either year. Relative Akaike weights (3wi) of the explanatory variables mimicked these
results (Table 2.5). NumPatch and Hab were considered the most important variables
in Year 1 with SppRich declining in tallow woodlands and decreasing as the number of
forest patches increased (Table 2.5). In Year 2, Hab, ForCover, and Damage exhibited
the largest weight; however, the model-averaged slope estimate for ForCover was weak
(-0.0014). SppRich in Year 2 is predicted to be higher in bottomland hardwoods and in
Table 2.2. Relative abundance of the most common species by woodland type, both years combined. Habitat comparisons were performed using the Friedmann’s test.
Native Tallow Species N Mean (SE) N Mean (SE) P-value
Mourning Dove 10 0.07 (0.03) 36 0.24 (0.06) 0.016 Red-bellied Woodpecker 79 0.53 (0.06) 21 0.14 (0.03) < 0.001* Eastern Phoebe 31 0.21 (0.04) 37 0.25 (0.04) 0.507 Blue Jay 28 0.19 (0.04) 42 0.28 (0.05) 0.131 Tufted Titmouse 52 0.35 (0.05) 6 0.04 (0.02) < 0.001* Carolina Chickadee 136 0.91 (0.10) 50 0.33 (0.05) 0.003* Carolina Wren 88 0.59 (0.06) 30 0.20 (0.04) < 0.001* Ruby-crowned Kinglet 133 0.89 (0.06) 70 0.47 (0.05) < 0.001* Blue-gray Gnatcatcher 34 0.23 (0.04) 16 0.11 (0.03) 0.020 American Robin a 25 0.17 (0.04) 104 0.69 (0.13) < 0.001* Gray Catbird 4 0.03 (0.01) 33 0.22 (0.04) < 0.001* Yellow-rumped Warbler 165 1.10 (0.12) 539 3.59 (0.26) < 0.001* Pine Warbler 26 0.17 (0.04) 6 0.04 (0.02) 0.001* White-throated Sparrow 42 0.28 (0.07) 39 0.26 (0.05) 0.643 Northern Cardinal 182 1.21 (0.11) 154 1.03 (0.11) 0.065
a American Robin data only includes observations between 0 and 25 meters. * Significant at alpha = 0.01.
21
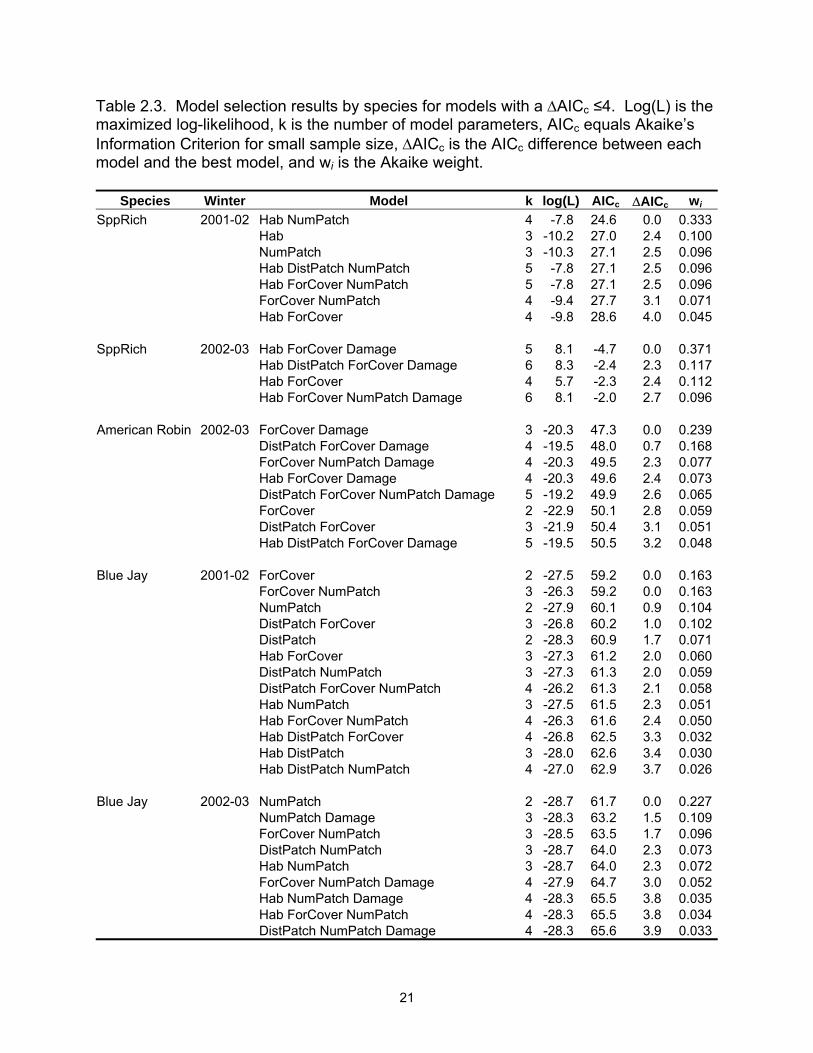
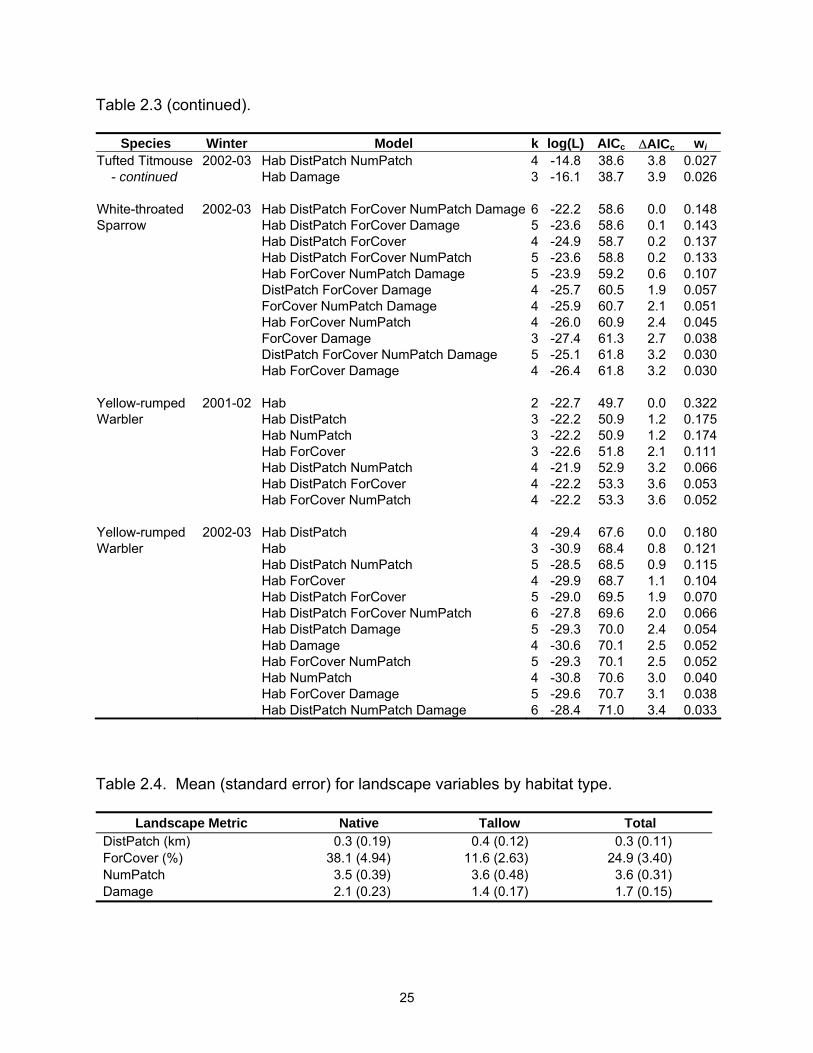
Table 2.3. Model selection results by species for models with a ∆AICc ≤4. Log(L) is the maximized log-likelihood, k is the number of model parameters, AICc equals Akaike’s Information Criterion for small sample size, ∆AICc is the AICc difference between each model and the best model, and wi is the Akaike weight.
Species Winter Model k log(L) AICc ∆AICc wi SppRich 2001-02 Hab NumPatch 4 -7.8 24.6 0.0 0.333 Hab 3 -10.2 27.0 2.4 0.100 NumPatch 3 -10.3 27.1 2.5 0.096 Hab DistPatch NumPatch 5 -7.8 27.1 2.5 0.096 Hab ForCover NumPatch 5 -7.8 27.1 2.5 0.096 ForCover NumPatch 4 -9.4 27.7 3.1 0.071 Hab ForCover 4 -9.8 28.6 4.0 0.045 SppRich 2002-03 Hab ForCover Damage 5 8.1 -4.7 0.0 0.371 Hab DistPatch ForCover Damage 6 8.3 -2.4 2.3 0.117 Hab ForCover 4 5.7 -2.3 2.4 0.112 Hab ForCover NumPatch Damage 6 8.1 -2.0 2.7 0.096 American Robin 2002-03 ForCover Damage 3 -20.3 47.3 0.0 0.239 DistPatch ForCover Damage 4 -19.5 48.0 0.7 0.168 ForCover NumPatch Damage 4 -20.3 49.5 2.3 0.077 Hab ForCover Damage 4 -20.3 49.6 2.4 0.073 DistPatch ForCover NumPatch Damage 5 -19.2 49.9 2.6 0.065 ForCover 2 -22.9 50.1 2.8 0.059 DistPatch ForCover 3 -21.9 50.4 3.1 0.051 Hab DistPatch ForCover Damage 5 -19.5 50.5 3.2 0.048 Blue Jay 2001-02 ForCover 2 -27.5 59.2 0.0 0.163 ForCover NumPatch 3 -26.3 59.2 0.0 0.163 NumPatch 2 -27.9 60.1 0.9 0.104 DistPatch ForCover 3 -26.8 60.2 1.0 0.102 DistPatch 2 -28.3 60.9 1.7 0.071 Hab ForCover 3 -27.3 61.2 2.0 0.060 DistPatch NumPatch 3 -27.3 61.3 2.0 0.059 DistPatch ForCover NumPatch 4 -26.2 61.3 2.1 0.058 Hab NumPatch 3 -27.5 61.5 2.3 0.051 Hab ForCover NumPatch 4 -26.3 61.6 2.4 0.050 Hab DistPatch ForCover 4 -26.8 62.5 3.3 0.032 Hab DistPatch 3 -28.0 62.6 3.4 0.030 Hab DistPatch NumPatch 4 -27.0 62.9 3.7 0.026 Blue Jay 2002-03 NumPatch 2 -28.7 61.7 0.0 0.227 NumPatch Damage 3 -28.3 63.2 1.5 0.109 ForCover NumPatch 3 -28.5 63.5 1.7 0.096 DistPatch NumPatch 3 -28.7 64.0 2.3 0.073 Hab NumPatch 3 -28.7 64.0 2.3 0.072 ForCover NumPatch Damage 4 -27.9 64.7 3.0 0.052 Hab NumPatch Damage 4 -28.3 65.5 3.8 0.035 Hab ForCover NumPatch 4 -28.3 65.5 3.8 0.034 DistPatch NumPatch Damage 4 -28.3 65.6 3.9 0.033
22
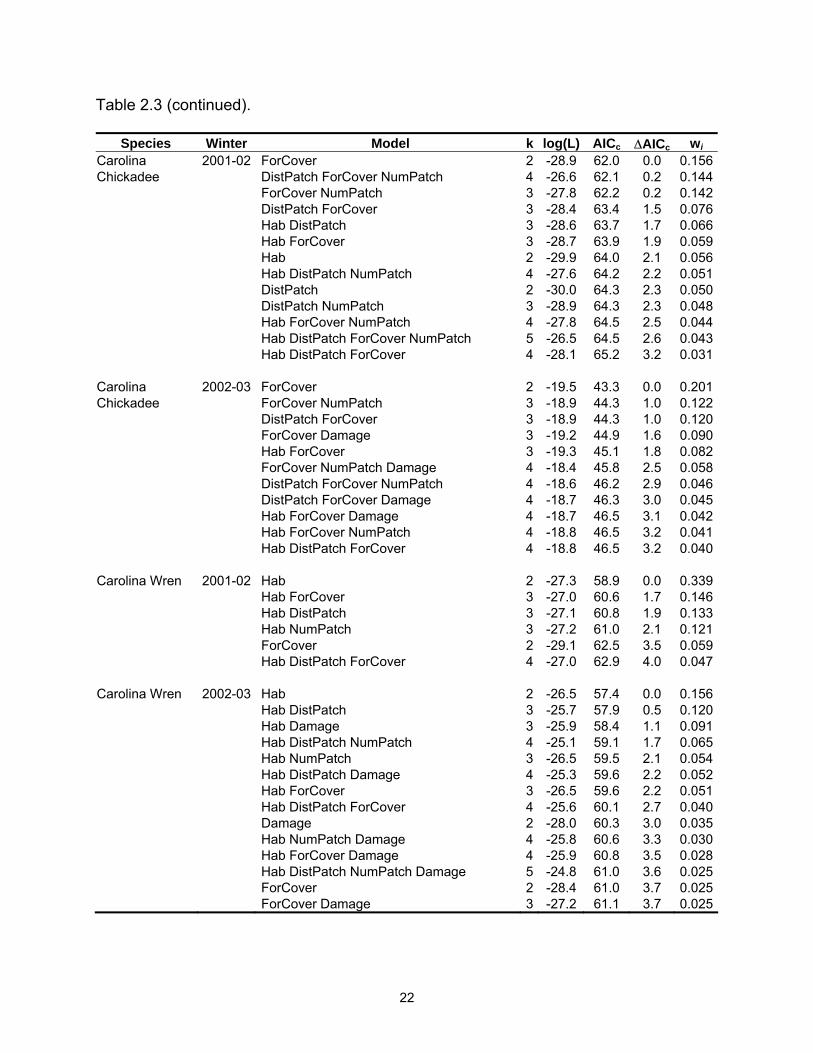
Table 2.3 (continued).
Species Winter Model k log(L) AICc ∆AICc wi Carolina 2001-02 ForCover 2 -28.9 62.0 0.0 0.156Chickadee DistPatch ForCover NumPatch 4 -26.6 62.1 0.2 0.144 ForCover NumPatch 3 -27.8 62.2 0.2 0.142 DistPatch ForCover 3 -28.4 63.4 1.5 0.076 Hab DistPatch 3 -28.6 63.7 1.7 0.066 Hab ForCover 3 -28.7 63.9 1.9 0.059 Hab 2 -29.9 64.0 2.1 0.056 Hab DistPatch NumPatch 4 -27.6 64.2 2.2 0.051 DistPatch 2 -30.0 64.3 2.3 0.050 DistPatch NumPatch 3 -28.9 64.3 2.3 0.048 Hab ForCover NumPatch 4 -27.8 64.5 2.5 0.044 Hab DistPatch ForCover NumPatch 5 -26.5 64.5 2.6 0.043 Hab DistPatch ForCover 4 -28.1 65.2 3.2 0.031 Carolina 2002-03 ForCover 2 -19.5 43.3 0.0 0.201Chickadee ForCover NumPatch 3 -18.9 44.3 1.0 0.122 DistPatch ForCover 3 -18.9 44.3 1.0 0.120 ForCover Damage 3 -19.2 44.9 1.6 0.090 Hab ForCover 3 -19.3 45.1 1.8 0.082 ForCover NumPatch Damage 4 -18.4 45.8 2.5 0.058 DistPatch ForCover NumPatch 4 -18.6 46.2 2.9 0.046 DistPatch ForCover Damage 4 -18.7 46.3 3.0 0.045 Hab ForCover Damage 4 -18.7 46.5 3.1 0.042 Hab ForCover NumPatch 4 -18.8 46.5 3.2 0.041 Hab DistPatch ForCover 4 -18.8 46.5 3.2 0.040 Carolina Wren 2001-02 Hab 2 -27.3 58.9 0.0 0.339 Hab ForCover 3 -27.0 60.6 1.7 0.146 Hab DistPatch 3 -27.1 60.8 1.9 0.133 Hab NumPatch 3 -27.2 61.0 2.1 0.121 ForCover 2 -29.1 62.5 3.5 0.059 Hab DistPatch ForCover 4 -27.0 62.9 4.0 0.047 Carolina Wren 2002-03 Hab 2 -26.5 57.4 0.0 0.156 Hab DistPatch 3 -25.7 57.9 0.5 0.120 Hab Damage 3 -25.9 58.4 1.1 0.091 Hab DistPatch NumPatch 4 -25.1 59.1 1.7 0.065 Hab NumPatch 3 -26.5 59.5 2.1 0.054 Hab DistPatch Damage 4 -25.3 59.6 2.2 0.052 Hab ForCover 3 -26.5 59.6 2.2 0.051 Hab DistPatch ForCover 4 -25.6 60.1 2.7 0.040 Damage 2 -28.0 60.3 3.0 0.035 Hab NumPatch Damage 4 -25.8 60.6 3.3 0.030 Hab ForCover Damage 4 -25.9 60.8 3.5 0.028 Hab DistPatch NumPatch Damage 5 -24.8 61.0 3.6 0.025 ForCover 2 -28.4 61.0 3.7 0.025 ForCover Damage 3 -27.2 61.1 3.7 0.025
23
Table 2.3 (continued).
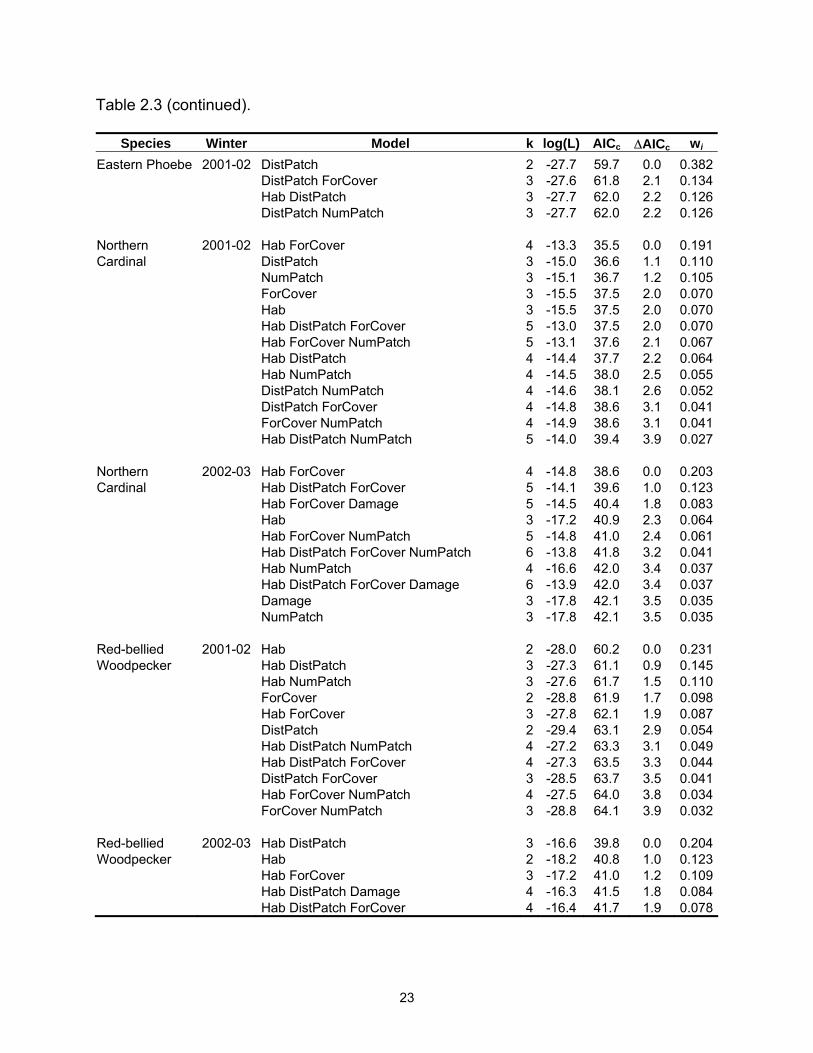
Species Winter Model k log(L) AICc ∆AICc wi Eastern Phoebe 2001-02 DistPatch 2 -27.7 59.7 0.0 0.382 DistPatch ForCover 3 -27.6 61.8 2.1 0.134 Hab DistPatch 3 -27.7 62.0 2.2 0.126 DistPatch NumPatch 3 -27.7 62.0 2.2 0.126 Northern 2001-02 Hab ForCover 4 -13.3 35.5 0.0 0.191Cardinal DistPatch 3 -15.0 36.6 1.1 0.110 NumPatch 3 -15.1 36.7 1.2 0.105 ForCover 3 -15.5 37.5 2.0 0.070 Hab 3 -15.5 37.5 2.0 0.070 Hab DistPatch ForCover 5 -13.0 37.5 2.0 0.070 Hab ForCover NumPatch 5 -13.1 37.6 2.1 0.067 Hab DistPatch 4 -14.4 37.7 2.2 0.064 Hab NumPatch 4 -14.5 38.0 2.5 0.055 DistPatch NumPatch 4 -14.6 38.1 2.6 0.052 DistPatch ForCover 4 -14.8 38.6 3.1 0.041 ForCover NumPatch 4 -14.9 38.6 3.1 0.041 Hab DistPatch NumPatch 5 -14.0 39.4 3.9 0.027 Northern 2002-03 Hab ForCover 4 -14.8 38.6 0.0 0.203Cardinal Hab DistPatch ForCover 5 -14.1 39.6 1.0 0.123 Hab ForCover Damage 5 -14.5 40.4 1.8 0.083 Hab 3 -17.2 40.9 2.3 0.064 Hab ForCover NumPatch 5 -14.8 41.0 2.4 0.061 Hab DistPatch ForCover NumPatch 6 -13.8 41.8 3.2 0.041 Hab NumPatch 4 -16.6 42.0 3.4 0.037 Hab DistPatch ForCover Damage 6 -13.9 42.0 3.4 0.037 Damage 3 -17.8 42.1 3.5 0.035 NumPatch 3 -17.8 42.1 3.5 0.035 Red-bellied 2001-02 Hab 2 -28.0 60.2 0.0 0.231Woodpecker Hab DistPatch 3 -27.3 61.1 0.9 0.145 Hab NumPatch 3 -27.6 61.7 1.5 0.110 ForCover 2 -28.8 61.9 1.7 0.098 Hab ForCover 3 -27.8 62.1 1.9 0.087 DistPatch 2 -29.4 63.1 2.9 0.054 Hab DistPatch NumPatch 4 -27.2 63.3 3.1 0.049 Hab DistPatch ForCover 4 -27.3 63.5 3.3 0.044 DistPatch ForCover 3 -28.5 63.7 3.5 0.041 Hab ForCover NumPatch 4 -27.5 64.0 3.8 0.034 ForCover NumPatch 3 -28.8 64.1 3.9 0.032 Red-bellied 2002-03 Hab DistPatch 3 -16.6 39.8 0.0 0.204Woodpecker Hab 2 -18.2 40.8 1.0 0.123 Hab ForCover 3 -17.2 41.0 1.2 0.109 Hab DistPatch Damage 4 -16.3 41.5 1.8 0.084 Hab DistPatch ForCover 4 -16.4 41.7 1.9 0.078
24
Table 2.3 (continued).
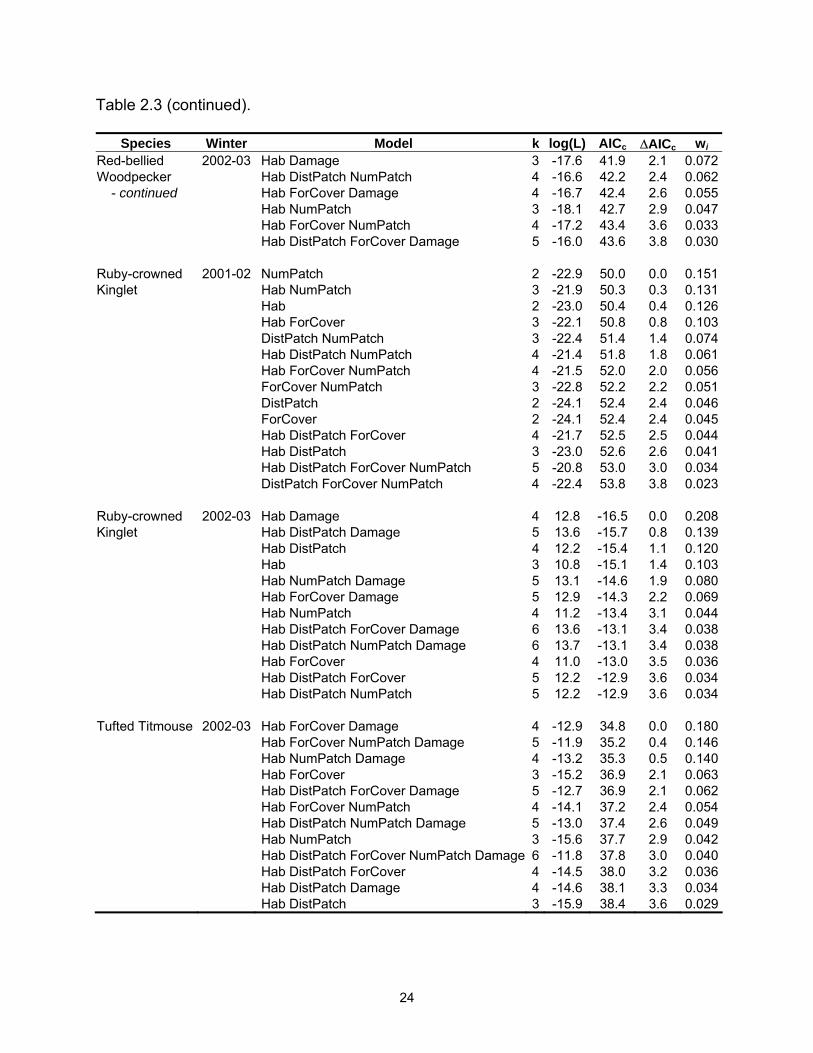
Species Winter Model k log(L) AICc ∆AICc wi Red-bellied 2002-03 Hab Damage 3 -17.6 41.9 2.1 0.072Woodpecker Hab DistPatch NumPatch 4 -16.6 42.2 2.4 0.062 - continued Hab ForCover Damage 4 -16.7 42.4 2.6 0.055 Hab NumPatch 3 -18.1 42.7 2.9 0.047 Hab ForCover NumPatch 4 -17.2 43.4 3.6 0.033 Hab DistPatch ForCover Damage 5 -16.0 43.6 3.8 0.030 Ruby-crowned 2001-02 NumPatch 2 -22.9 50.0 0.0 0.151Kinglet Hab NumPatch 3 -21.9 50.3 0.3 0.131 Hab 2 -23.0 50.4 0.4 0.126 Hab ForCover 3 -22.1 50.8 0.8 0.103 DistPatch NumPatch 3 -22.4 51.4 1.4 0.074 Hab DistPatch NumPatch 4 -21.4 51.8 1.8 0.061 Hab ForCover NumPatch 4 -21.5 52.0 2.0 0.056 ForCover NumPatch 3 -22.8 52.2 2.2 0.051 DistPatch 2 -24.1 52.4 2.4 0.046 ForCover 2 -24.1 52.4 2.4 0.045 Hab DistPatch ForCover 4 -21.7 52.5 2.5 0.044 Hab DistPatch 3 -23.0 52.6 2.6 0.041 Hab DistPatch ForCover NumPatch 5 -20.8 53.0 3.0 0.034 DistPatch ForCover NumPatch 4 -22.4 53.8 3.8 0.023 Ruby-crowned 2002-03 Hab Damage 4 12.8 -16.5 0.0 0.208Kinglet Hab DistPatch Damage 5 13.6 -15.7 0.8 0.139 Hab DistPatch 4 12.2 -15.4 1.1 0.120 Hab 3 10.8 -15.1 1.4 0.103 Hab NumPatch Damage 5 13.1 -14.6 1.9 0.080 Hab ForCover Damage 5 12.9 -14.3 2.2 0.069 Hab NumPatch 4 11.2 -13.4 3.1 0.044 Hab DistPatch ForCover Damage 6 13.6 -13.1 3.4 0.038 Hab DistPatch NumPatch Damage 6 13.7 -13.1 3.4 0.038 Hab ForCover 4 11.0 -13.0 3.5 0.036 Hab DistPatch ForCover 5 12.2 -12.9 3.6 0.034 Hab DistPatch NumPatch 5 12.2 -12.9 3.6 0.034 Tufted Titmouse 2002-03 Hab ForCover Damage 4 -12.9 34.8 0.0 0.180 Hab ForCover NumPatch Damage 5 -11.9 35.2 0.4 0.146 Hab NumPatch Damage 4 -13.2 35.3 0.5 0.140 Hab ForCover 3 -15.2 36.9 2.1 0.063 Hab DistPatch ForCover Damage 5 -12.7 36.9 2.1 0.062 Hab ForCover NumPatch 4 -14.1 37.2 2.4 0.054 Hab DistPatch NumPatch Damage 5 -13.0 37.4 2.6 0.049 Hab NumPatch 3 -15.6 37.7 2.9 0.042 Hab DistPatch ForCover NumPatch Damage 6 -11.8 37.8 3.0 0.040 Hab DistPatch ForCover 4 -14.5 38.0 3.2 0.036 Hab DistPatch Damage 4 -14.6 38.1 3.3 0.034 Hab DistPatch 3 -15.9 38.4 3.6 0.029
25
Table 2.3 (continued).
Species Winter Model k log(L) AICc ∆AICc wi Tufted Titmouse 2002-03 Hab DistPatch NumPatch 4 -14.8 38.6 3.8 0.027 - continued Hab Damage 3 -16.1 38.7 3.9 0.026 White-throated 2002-03 Hab DistPatch ForCover NumPatch Damage 6 -22.2 58.6 0.0 0.148Sparrow Hab DistPatch ForCover Damage 5 -23.6 58.6 0.1 0.143 Hab DistPatch ForCover 4 -24.9 58.7 0.2 0.137 Hab DistPatch ForCover NumPatch 5 -23.6 58.8 0.2 0.133 Hab ForCover NumPatch Damage 5 -23.9 59.2 0.6 0.107 DistPatch ForCover Damage 4 -25.7 60.5 1.9 0.057 ForCover NumPatch Damage 4 -25.9 60.7 2.1 0.051 Hab ForCover NumPatch 4 -26.0 60.9 2.4 0.045 ForCover Damage 3 -27.4 61.3 2.7 0.038 DistPatch ForCover NumPatch Damage 5 -25.1 61.8 3.2 0.030 Hab ForCover Damage 4 -26.4 61.8 3.2 0.030 Yellow-rumped 2001-02 Hab 2 -22.7 49.7 0.0 0.322Warbler Hab DistPatch 3 -22.2 50.9 1.2 0.175 Hab NumPatch 3 -22.2 50.9 1.2 0.174 Hab ForCover 3 -22.6 51.8 2.1 0.111 Hab DistPatch NumPatch 4 -21.9 52.9 3.2 0.066 Hab DistPatch ForCover 4 -22.2 53.3 3.6 0.053 Hab ForCover NumPatch 4 -22.2 53.3 3.6 0.052 Yellow-rumped 2002-03 Hab DistPatch 4 -29.4 67.6 0.0 0.180Warbler Hab 3 -30.9 68.4 0.8 0.121 Hab DistPatch NumPatch 5 -28.5 68.5 0.9 0.115 Hab ForCover 4 -29.9 68.7 1.1 0.104 Hab DistPatch ForCover 5 -29.0 69.5 1.9 0.070 Hab DistPatch ForCover NumPatch 6 -27.8 69.6 2.0 0.066 Hab DistPatch Damage 5 -29.3 70.0 2.4 0.054 Hab Damage 4 -30.6 70.1 2.5 0.052 Hab ForCover NumPatch 5 -29.3 70.1 2.5 0.052 Hab NumPatch 4 -30.8 70.6 3.0 0.040 Hab ForCover Damage 5 -29.6 70.7 3.1 0.038 Hab DistPatch NumPatch Damage 6 -28.4 71.0 3.4 0.033 Table 2.4. Mean (standard error) for landscape variables by habitat type.
Landscape Metric Native Tallow Total
DistPatch (km) 0.3 (0.19) 0.4 (0.12) 0.3 (0.11) ForCover (%) 38.1 (4.94) 11.6 (2.63) 24.9 (3.40) NumPatch 3.5 (0.39) 3.6 (0.48) 3.6 (0.31) Damage 2.1 (0.23) 1.4 (0.17) 1.7 (0.15)
26
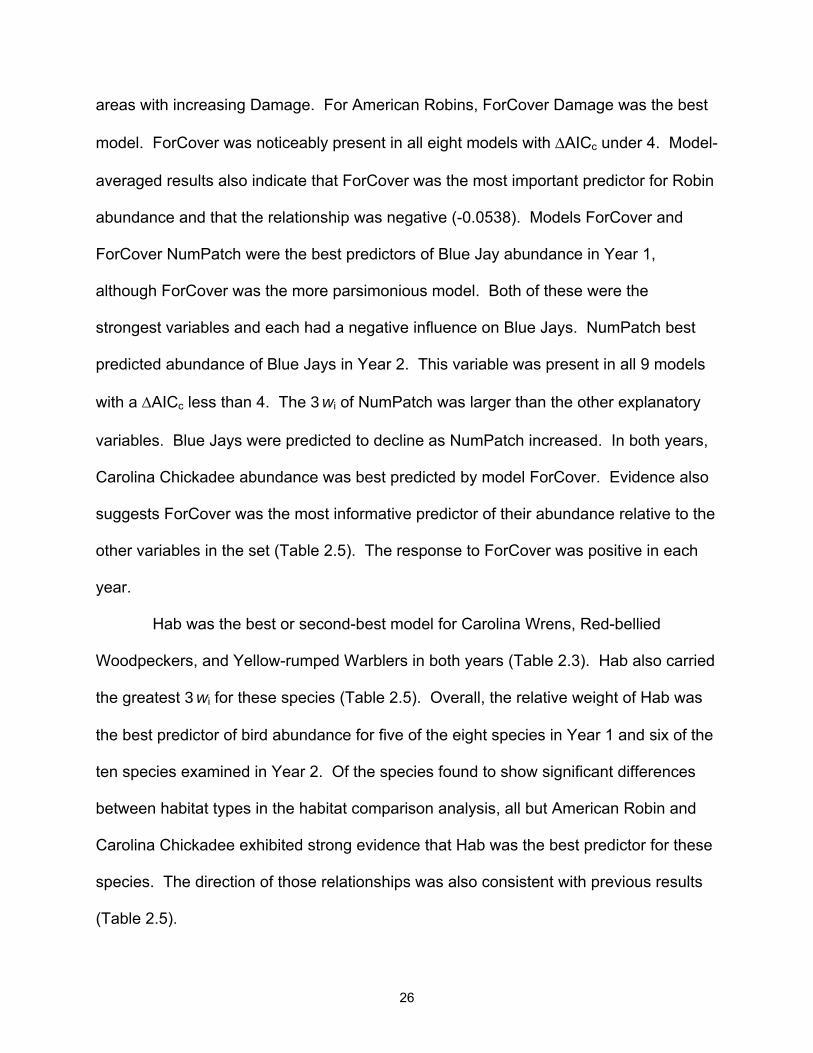
areas with increasing Damage. For American Robins, ForCover Damage was the best
model. ForCover was noticeably present in all eight models with ∆AICc under 4. Model-
averaged results also indicate that ForCover was the most important predictor for Robin
abundance and that the relationship was negative (-0.0538). Models ForCover and
ForCover NumPatch were the best predictors of Blue Jay abundance in Year 1,
although ForCover was the more parsimonious model. Both of these were the
strongest variables and each had a negative influence on Blue Jays. NumPatch best
predicted abundance of Blue Jays in Year 2. This variable was present in all 9 models
with a ∆AICc less than 4. The 3wi of NumPatch was larger than the other explanatory
variables. Blue Jays were predicted to decline as NumPatch increased. In both years,
Carolina Chickadee abundance was best predicted by model ForCover. Evidence also
suggests ForCover was the most informative predictor of their abundance relative to the
other variables in the set (Table 2.5). The response to ForCover was positive in each
year.
Hab was the best or second-best model for Carolina Wrens, Red-bellied
Woodpeckers, and Yellow-rumped Warblers in both years (Table 2.3). Hab also carried
the greatest 3wi for these species (Table 2.5). Overall, the relative weight of Hab was
the best predictor of bird abundance for five of the eight species in Year 1 and six of the
ten species examined in Year 2. Of the species found to show significant differences
between habitat types in the habitat comparison analysis, all but American Robin and
Carolina Chickadee exhibited strong evidence that Hab was the best predictor for these
species. The direction of those relationships was also consistent with previous results
(Table 2.5).
27
Table 2.5. Model-averaged parameter estimates, unconditional standard errors, and relative Akaike weights (3wi) of each explanatory variable by species and winter.
Species Winter Variable Estimate St. Error 3wi SppRich a 2001-02 Hab 0.1983 0.0955 0.753 DistPatch 0.0000 0.0001 0.248 ForCover 0.0002 0.0009 0.289 NumPatch -0.0480 0.0222 0.767 SppRich a 2002-03 Hab 0.2542 0.0907 0.940 DistPatch 0.0000 0.0001 0.277 ForCover -0.0014 0.0006 0.820 NumPatch -0.0037 0.0184 0.227 Damage 0.0739 0.0342 0.771 American Robin b 2002-03 Hab -0.4968 1.0435 0.272 DistPatch 0.0037 0.0036 0.465 ForCover -0.0538 0.0212 0.926 NumPatch 0.1169 0.2270 0.259 Damage -0.7768 0.3757 0.762 Blue Jay b 2001-02 Hab -0.0962 0.8579 0.281 DistPatch 0.0006 0.0007 0.395 ForCover -0.0323 0.0190 0.644 NumPatch -0.3069 0.2167 0.527 Blue Jay b 2002-03 Hab 0.1517 0.7778 0.259 DistPatch 0.0000 0.0005 0.257 ForCover -0.0168 0.0171 0.357 NumPatch -0.4087 0.2013 0.837 Damage 0.3056 0.3211 0.340 Carolina Chickadee b 2001-02 Hab 0.7319 0.7906 0.371 DistPatch -0.0009 0.0007 0.509 ForCover 0.0346 0.0193 0.696 NumPatch -0.2741 0.1975 0.506 Carolina Chickadee b 2002-03 Hab -0.5400 1.0217 0.276 DistPatch -0.0006 0.0007 0.329 ForCover 0.0851 0.0384 0.962 NumPatch 0.2566 0.2646 0.348 Damage 0.4006 0.4769 0.311 Carolina Wren b 2001-02 Hab 1.7823 0.7084 0.886 DistPatch -0.0002 0.0004 0.265 ForCover 0.0187 0.0198 0.355 NumPatch 0.0440 0.1728 0.252 a Abundance data analyzed with linear regression. For every unit increase in the explanatory variable, the change in the species abundance is the parameter estimate (Perkins et al. 2003). b Abundance data analyzed with logistic regression. For every unit increase in the explanatory variable, the odds of presence increase/decrease by exp(Estimate) (Perkins et al. 2003).
28
Table 2.5 (continued).
Species Winter Variable Estimate St. Error 3wi Carolina Wren b 2002-03 Hab 1.5979 0.7705 0.779 DistPatch -0.0006 0.0005 0.297 ForCover 0.0083 0.0231 0.432 NumPatch -0.1425 0.1816 0.308 Damage 0.4411 0.4021 0.386 Eastern Phoebe b 2001-02 Hab 0.2708 0.7342 0.258 DistPatch 0.0028 0.0017 0.912 ForCover -0.0110 0.0172 0.291 NumPatch -0.0742 0.1864 0.269 Northern Cardinal a 2001-02 Hab 0.1908 0.1333 0.566 DistPatch 0.0001 0.0001 0.401 ForCover -0.0013 0.0010 0.517 NumPatch -0.0264 0.0271 0.383 Northern Cardinal a 2002-03 Hab 0.2838 0.1438 0.765 DistPatch -0.0001 0.0001 0.331 ForCover -0.0018 0.0010 0.673 NumPatch -0.0229 0.0291 0.313 Damage 0.0458 0.0551 0.316 Red-bellied Woodpecker b 2001-02 Hab 1.3271 0.7023 0.714 DistPatch -0.0006 0.0007 0.376 ForCover 0.0141 0.0178 0.363 NumPatch 0.1039 0.1684 0.300 Red-bellied Woodpecker b 2002-03 Hab 3.9755 1.4256 0.997 DistPatch -0.0009 0.0006 0.515 ForCover 0.0346 0.0335 0.357 NumPatch 0.0127 0.2264 0.242 Damage 0.4586 0.4937 0.318 Ruby-crowned Kinglet b 2001-02 Hab 1.4454 1.0419 0.595 DistPatch -0.0004 0.0005 0.337 ForCover -0.0186 0.0270 0.369 NumPatch -0.2724 0.1785 0.580 Ruby-crowned Kinglet a 2002-03 Hab 0.28784 0.06471 0.999 DistPatch 0.00005 0.00004 0.424 ForCover -0.00013 0.00054 0.232 NumPatch -0.00794 0.01502 0.251 Damage -0.05244 0.02936 0.605 a Abundance data analyzed with linear regression. For every unit increase in the explanatory variable, the change in the species abundance is the parameter estimate (Perkins et al. 2003). b Abundance data analyzed with logistic regression. For every unit increase in the explanatory variable, the odds of presence increase/decrease by exp(Estimate) (Perkins et al. 2003).
29
Table 2.5 (continued).
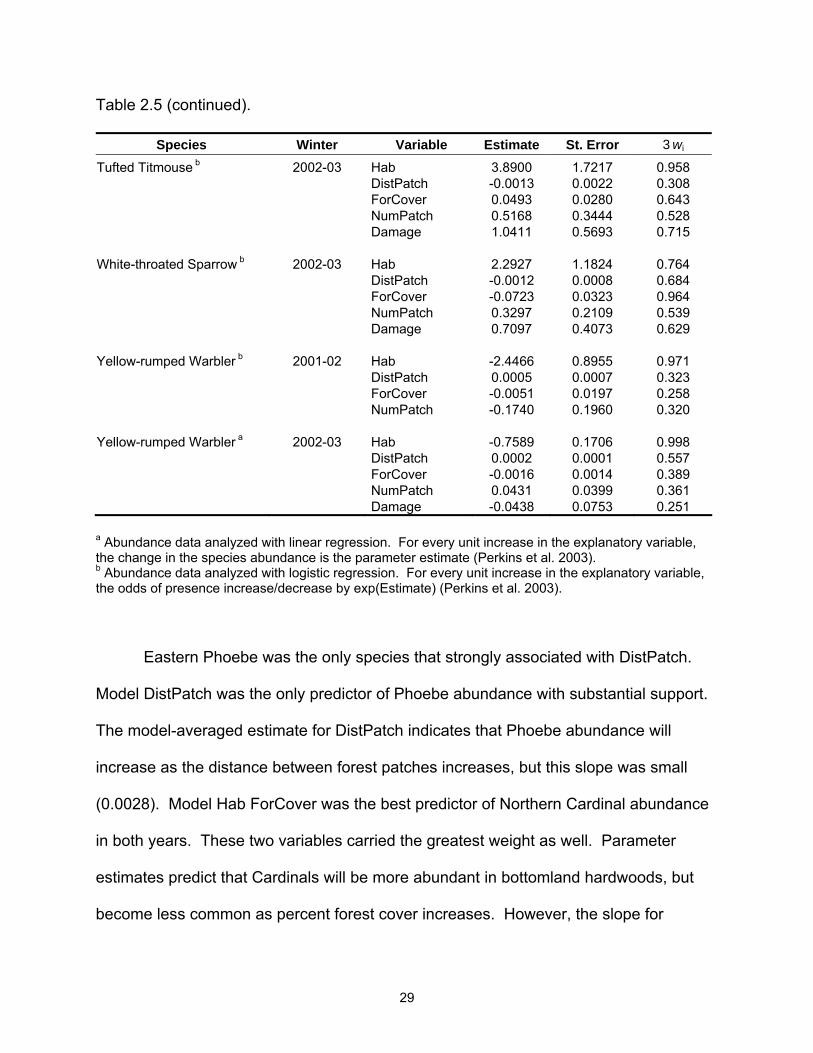
Species Winter Variable Estimate St. Error 3wi Tufted Titmouse b 2002-03 Hab 3.8900 1.7217 0.958 DistPatch -0.0013 0.0022 0.308 ForCover 0.0493 0.0280 0.643 NumPatch 0.5168 0.3444 0.528 Damage 1.0411 0.5693 0.715 White-throated Sparrow b 2002-03 Hab 2.2927 1.1824 0.764 DistPatch -0.0012 0.0008 0.684 ForCover -0.0723 0.0323 0.964 NumPatch 0.3297 0.2109 0.539 Damage 0.7097 0.4073 0.629 Yellow-rumped Warbler b 2001-02 Hab -2.4466 0.8955 0.971 DistPatch 0.0005 0.0007 0.323 ForCover -0.0051 0.0197 0.258 NumPatch -0.1740 0.1960 0.320 Yellow-rumped Warbler a 2002-03 Hab -0.7589 0.1706 0.998 DistPatch 0.0002 0.0001 0.557 ForCover -0.0016 0.0014 0.389 NumPatch 0.0431 0.0399 0.361 Damage -0.0438 0.0753 0.251 a Abundance data analyzed with linear regression. For every unit increase in the explanatory variable, the change in the species abundance is the parameter estimate (Perkins et al. 2003). b Abundance data analyzed with logistic regression. For every unit increase in the explanatory variable, the odds of presence increase/decrease by exp(Estimate) (Perkins et al. 2003).
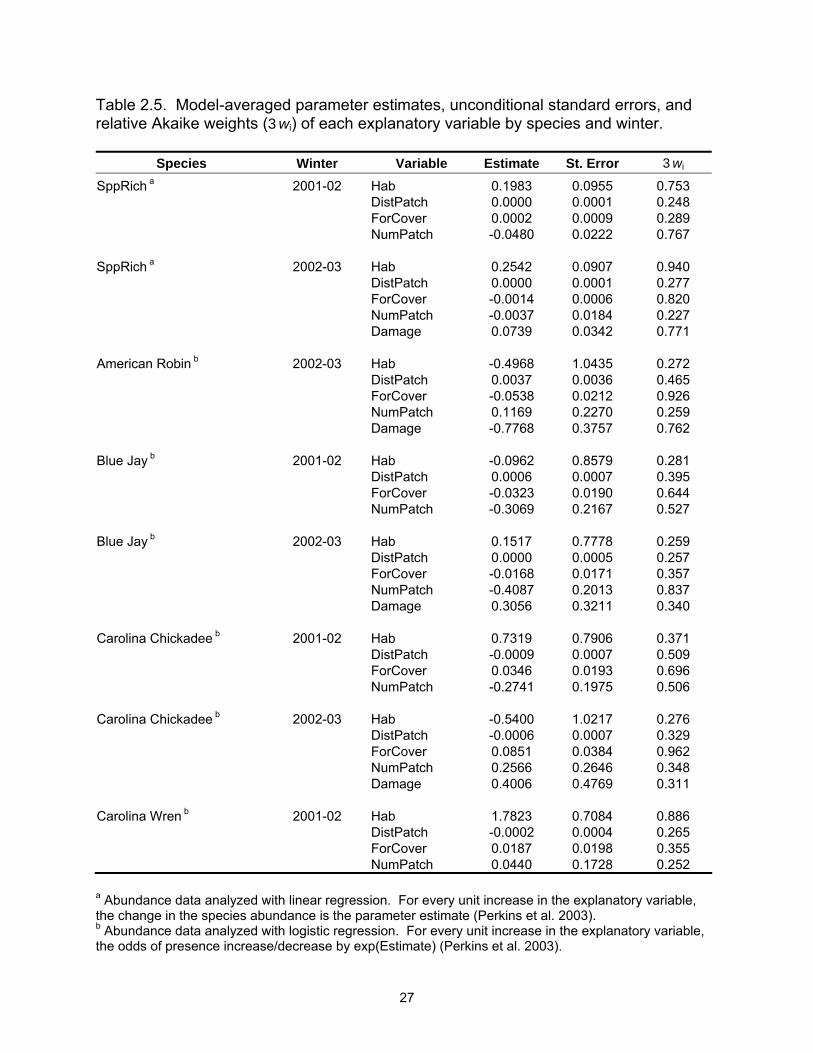
Eastern Phoebe was the only species that strongly associated with DistPatch.
Model DistPatch was the only predictor of Phoebe abundance with substantial support.
The model-averaged estimate for DistPatch indicates that Phoebe abundance will
increase as the distance between forest patches increases, but this slope was small
(0.0028). Model Hab ForCover was the best predictor of Northern Cardinal abundance
in both years. These two variables carried the greatest weight as well. Parameter
estimates predict that Cardinals will be more abundant in bottomland hardwoods, but
become less common as percent forest cover increases. However, the slope for
30
ForCover in both years was near zero (Year 1 = -0.0013; Year 2 = -0.0018), an
indication that ForCover may not be important. Predictors of Ruby-crowned Kinglet
abundance were models NumPatch in Year 1 and Hab Damage in Year 2. In both
years, parameter estimates indicate that Kinglets are less abundant in tallow
woodlands. Besides Hab in Year 1, NumPatch was also important to Kinglets, as they
tended to decrease in abundance as NumPatch increased. Hab and Damage were the
most important variables to Kinglets in Year 2. Damage was predicted to decrease
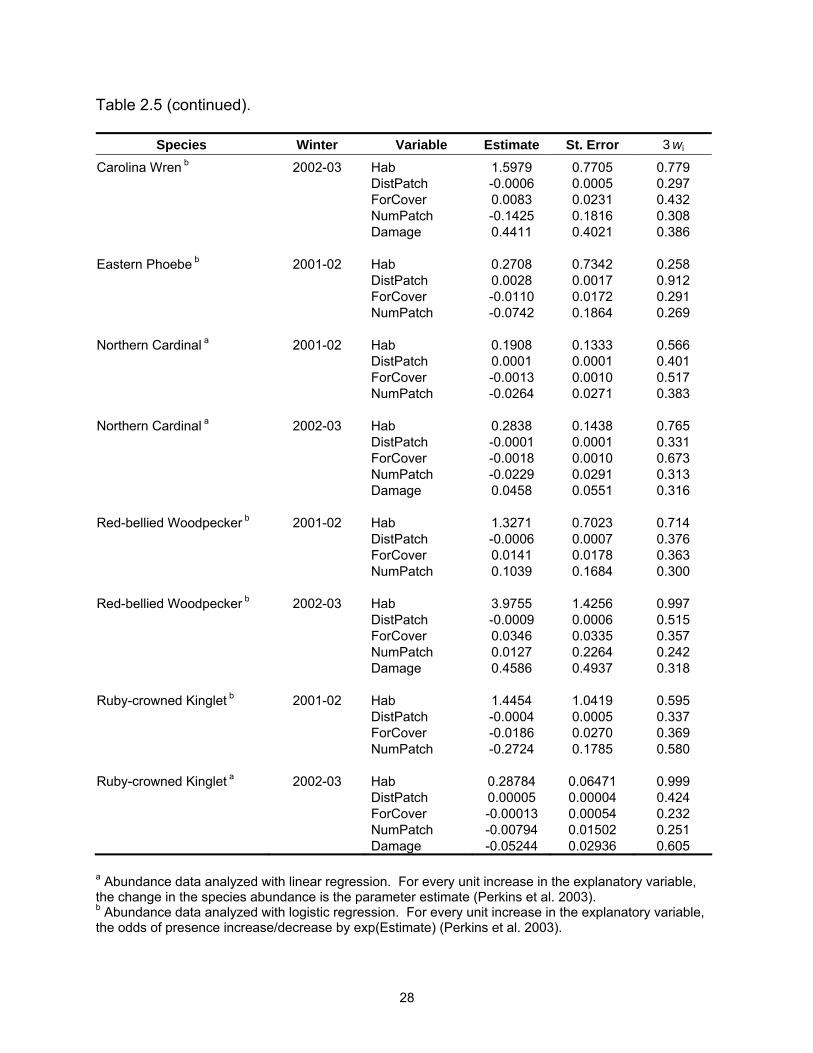
Kinglet abundance. The best model for fitting Tufted Titmice abundance was Hab
ForCover Damage. These variables also had the largest weight, with Hab being the
greatest (3wi = 0.958). Of note, Hab was present in each of the 14 models with a ∆AICc
less than 4. The global model was the best predictor for White-throated Sparrows;
however, the third best model, Hab DistPatch ForCover, is likely the better choice
because of two fewer parameters and a ∆AICc of only 0.2. ForCover had the largest
3wi (0.964) and was a strong predictor of White-throated Sparrow abundance
suggesting that they decline as ForCover increased.
DISCUSSION
Species richness and evenness were lower in the tallow woodlands. This is an
indication that winter bird communities in tallow woodlands are less diverse and tend to
be dominated by fewer, but more abundant species. Differences were observed in the
relative abundance of the certain species between woodland types. Six species (Red-
bellied Woodpecker, Tufted Titmouse, Carolina Chickadee, Carolina Wren, Ruby-
crowned Kinglet, and Pine Warber) exhibited higher detections in the bottomland
hardwoods than the tallow woodlands. However, three species (American Robin, Gray
31
Catbird, Yellow-rumped Warbler) were more common in tallow and six species
(Mourning Dove, Eastern Phoebe, Blue Jay, Blue-gray Gnatcatcher, White-throated
Sparrow, and Northern Cardinal) showed no difference in abundance between habitats.
Eight of theses aforementioned species are commonly associated with edge habitat
(Cimprich and Moore 1995, Falls and Kopachena 1994, Halkin and Linville 1999, Hunt
and Flaspohler 1998, Mirarchi and Baskett 1994, Salabanks and James 1999, Tarvin
and Woolfenden 1999, Weeks 1994), which was a common characteristic of the tallow
stands.
Differences in species richness between years may be linked to weather-related
differences between years. The first field season was preceded by a drought that
began in the late 1990’s that did not subside until 2001 (National Weather Service
2004). In addition, the winter of 2001-02 was relatively warm in the northern United
States, but in 2002-03 a more typical winter occurred to our north. The large increase in
American Robins on my sites from Year 1 to Year 2 may be a product of these weather
conditions. Christmas Bird Count data from the same period in Louisiana also shows a
similar pattern between winters (2001-02 = 11.8/party hour, 2002-03 = 21.7/party hour)
(National Audubon Society 2005). Robins tend to be variable in their migration patterns
and their distribution has been linked to weather patterns (Sallabanks and James 1999).
While the landscape variables DistPatch, ForCover, NumPatch, and Damage
were sometimes important predictors of species abundance; overall, Hab was the best
predictor. This is not unanticipated since 11 of the 15 most abundant species differed
significantly between woodland types. Model-averaged results closely resembled those
from the habitat comparison analyses. The model-predicted importance of Damage to
32
the abundance of Robins, Ruby-crowned Kinglets, and Tufted Titmice and SppRich in
Year 2 may be an artifact of the less severe hurricane damage that tallow sites received
compared to bottomland hardwood sites. Eastern Phoebe was the only species that
responded to DistPatch. DistPatch was expected to have a greater influence on the
other species studied, since DistPatch is a measure of patch isolation. The lack of
effect of DistPatch may be related to the timing of this study. Non-breeding birds may
be less affected by patch isolation than during the breeding season, but this is
dependent on other factors such as patch size and forest/edge ratio. NumPatch was
relatively important to SppRich (Year 1), Blue Jays, (Year 2), and Ruby-crowned
Kinglets (both years). In each case, as the number of forest patches increased within 1
km of the point count, abundance declined. As with DistPatch, I would expect the
importance of NumPatch to increase during the breeding season, since landscape
forest patchiness likely affects nesting success. Following Hab, ForCover was
observed more frequently as a strong predictor of bird abundance. For species that
responded to ForCover, all but Carolina Chickadees exhibited a negative response.
Species predicted to decline in abundance as percentage forest cover increased, were
all species common in forest-edge habitats.
Including additional landscape/habitat variables may have been informative in the
information theory analyses; however, I was constrained by an already saturated model.
Had more data been available, it would have been useful to include more variables such
as canopy height, stand age, and snag density, because these variables likely affect
bird abundance. A possible alternative to the approach used in this study would be to
analyze models consisting of groups of related variables instead of an all subsets
33
approach (see Weyrauch and Grubb 2004). This technique might be useful for
comparing the relative importance of landscape variables versus habitat variables (e.g.,
stem density, shrub density, canopy height).
In summary, bottomland hardwoods supported more bird species than tallow
woodlands. Tallow woodlands may provide adequate habitat for certain species, but
those individuals tend to be edge-associated species. I found information-theory
modeling to be a useful tool for examining the relative importance of habitat type versus
specific landscape metrics.
34
CHAPTER 3: ENERGY ASSIMILATION OF TALLOW FRUIT BY YELLOW-RUMPED WARBLERS, NORTHERN CARDINALS AND AMERICAN ROBINS
Chinese tallow is an invasive non-native tree from southeast Asia. It was
introduced into the United States in the late 1700’s (Bruce et al. 1997). It is now
common in many habitats along the northern Gulf Coast and south Atlantic (Scheld and
Cowles 1981, Harcombe et al. 1993, Renne et al. 2000). Tallow is primarily a bird-
dispersed plant producing an abundant fruit crop in the fall that can persist until early
spring. At least 64 species of birds feed on tallow fruit (Barrow and Fontenot, unpubl.
data), more than any other fruiting plant species in Louisiana. Of the tallow consumers,
43 are considered seed dispersers, while the rest are known only to scrape or peck off
portions of the pulp with their bill.
Tallow pulp consists of a waxy coating that has more energy (33.5 kJ/g) than any
known fruit in Louisiana (Barrow and Jeske, unpubl. data). Saturated fatty acids
comprise a significant proportion of tallow pulp (Khan et al. 1973, Raie et al. 1983, Xu et
al. 1991). Many animals exhibit poor assimilation of high melting point fatty acids,
especially palmitic and stearic acids (Scott et al. 1976, Place and Stiles 1992).
Therefore, birds consuming tallow may not effectively assimilate the available energy in
the pulp. One species that may be an exception is the Yellow-rumped Warbler
(Dendroica coronata). Yellow-rumped Warblers are known to possess a specialized
digestive system enabling them to assimilate waxy foods such as bayberry (Morella
spp.) and wax myrtle fruit (M. cerifera) (Place and Stiles 1992), which are important
winter food sources for this species (Wilz and Giampa 1978). These digestive system
traits include “...reflux of intestinal contents to the gizzard, elevated gall-bladder and
intestinal bile-salt concentration, and a slow gastrointestinal transit of dietary lipids.”
35
Yellow-rumped Warblers show a facultative migration that is dependent on food
abundance and climate conditions (Terrill and Ohmart 1984). Wax myrtle fruit
abundance has been positively correlated with Yellow-rumped Warbler abundance in
South Carolina (Kwit et al. 2004) and Florida (Borgmann et al. 2004). Like tallow fruit,
wax myrtle produces abundant fruit that is high in saturated fatty acids (Place and Stiles
1992, Conway et al. 2000). Yellow-rumped Warblers were the most common tallow
consumers on the upper coastal prairie region of Texas (Conway 1997). Consequently,
Chinese tallow has the potential of influencing their winter distribution. Such a pattern
has been documented with the Northern Mockingbird (Mimus polyglottos) and the
introduced multiflora rose (Rosa multiflora) in the Northeast (Stiles 1982). Mockingbirds
have expanded their winter range northward in concert with the spread of this non-
native plant. Stiles suggests that Northern Mockingbirds would not be able to maintain
a positive daily energy balance in the winter in their northern range without multiflora
rose fruit.
The first step at understanding the association of Yellow-rumped Warblers to
tallow is to determine how much of the available energy in tallow fruit can they
assimilate. Although Yellow-rumped Warblers can assimilate high-melting point fatty
acids, they prefer unsaturated fatty acids to saturated fatty acids (McWilliams et al.
2002). Therefore, it is important to quantify metabolizable energy of tallow fruit in
relation to other diets, specifically other fruiting plants with overlapping fruiting
phenology. Of interest are wax myrtle and poison ivy (Toxicodendron radicans) fruit,
both are waxy, lipid-rich fruit (White 1989) commonly eaten by Yellow-rumped Warblers.
36
The ability of other avifauna to metabolize tallow fruit is also of interest.
American Robins (Turdus migratorius) and Northern Cardinals (Cardinalis cardinalis)
are two species that frequently consume tallow fruit (Renne et al. 2000, 2002). In
choice trials, Robins preferred sugar-rich fruits to lipid-rich fruits and metabolized a
greater amount of the sugar-rich fruit (Lepczyk et al. 2000). Robins prefer foods
containing unsaturated lipids over those containing saturated lipids, even though
assimilation rates did not vary for three test diets differing only in lipid concentration
(Zurovchak 1997). Zurovchak hypothesized that this was due to changes in gut
retention time, with passage time increasing as lipid levels increased. Cardinals’ seed
preferences have received some study (Willson and Harmeson 1973), but no
information is available on fruit preferences based on lipid content.
In this study, I compared apparent metabolizable energy (AME) of tallow fruit by
Yellow-rumped Warblers, Northern Cardinals and American Robins. For Yellow-
rumped Warblers, tallow assimilation was compared to that of wax myrtle and poison
ivy. For Cardinals, tallow was compared to hackberry (Celtis laevigata) and deciduous
holly (Ilex decidua). These fruits were chosen for comparison because they are
relatively common during the winter, have overlapping fruiting phenology with tallow,
and are known food items for the bird species examined.
METHODS
Capture and Care of Birds
In the winters of 2001-02 and 2002-03, Yellow-rumped Warblers, Northern
Cardinals and American Robins were captured with mist-nets near Lafayette, Louisiana.
For each bird, I recorded weight, wing chord, culmen, bill depth, bill width, tarsus, tail
37
length and sex if known. Birds were transported to an environmental chamber at the
National Wetlands Research Center where they were kept in under controlled
temperatures (20˚C) and photoperiod (10.5 hr light:13.5 hr dark) for the duration of the
feeding trials (IACUC Permit No. 2001-8717-037). Each bird was held individually in 30
x 36 x 36 cm metal cages. Water and maintenance diet were provided ad libitum in
plastic cups. For Yellow-rumped Warblers, this diet consisted of Avian-Fare and /or
Softbilled-Fare (Reliable Protein Products®, commercial diets designed for omnivorous
birds), fruit from wax myrtle, poison ivy, and tallow, and mealworms. Robins and
Cardinals were fed Softbilled-Fare, fruit from hackberry, deciduous holly, and tallow,
and mealworms. Cardinals were also provided a mixture of commercially available
birdseed including black oil sunflower, striped sunflower, and safflower. Fruit was
collected in the field, placed in Ziploc bags, and stored in a refrigerator. The cage
bottoms were lined with absorbent laboratory bench paper with polyethylene backing
and were changed regularly. Small sticks were placed in each cage to allow birds to
perch. Previously used cages were cleaned with a wire brush, rinsed, soaked in a mild
bleach solution, rinsed again, and air-dried prior to reuse.
Birds were allowed to acclimate to captivity and their test diets for 7 to 10 days
prior to onset of AME trials. During this acclimation period, three Yellow-rumped
Warblers were released due to poor adjustment to captivity and one Warbler and one
Robin died. During the AME trials, 27 Yellow-rumped Warblers, 27 Cardinals and 5
Robins were studied. Nine Warblers were placed each on diets of wax myrtle (February
2002), poison ivy (n=3, February 2002; n=6, December 2002), and tallow (n=9,
February 2002). Ten Cardinals were placed each on deciduous holly (February 2003)
38
and tallow (n=7, December 2002; n=3, February 2003), and seven on hackberry (n=6,
February 2003; n=1, March 2003). All five Robins were given tallow (n=2, December
2002; n=3, January 2003).
AME was determined via the total collection method (Haufler and Servello 1994).
Each individual was placed on a diet of one fruit species for the duration of the trial (2-5
days). Whole fruit (seed included) were fed to Northern Cardinals and American
Robins, while Yellow-rumped Warblers were presented with whole wax myrtle and
poison ivy fruit (seed included), and tallow (pulp only). Yellow-rumped Warblers are not
able to swallow tallow fruit because of their size. Instead, they feed on tallow by
pecking or scraping off the outer-waxy layer. Warblers might not be able to efficiently
handle and feed on whole tallow fruit not attached to the plant, so only the pulp was
offered. Pulp was removed from tallow fruit using either a dissecting needle or by
rubbing them over a 2-mm sieve.
Fruit was placed into a plastic food cup and weighed prior to feeding. The first
day of the AME trial was used to ‘clean’ the digestive tract of non-experimental foods;
therefore, no fecal material was collected. After day 1, food was removed daily and
weighed, and then fresh food was provided and reweighed. Food and fecal samples
were collected into scintillation vials, vacuum-dried in a lyophilizer and stored in an ultra-
cold freezer at –80ºC.
Gross energy in food and fecal samples was measured using a Parr 1261
Isoperibol Bomb Calorimeter. Benzoic acid was used as the standard (6.318 kcal/g)
and mineral oil (11.002 kcal/g, SD=0.018) was used as a combustion aid to compensate
39
for low sample weights. Samples were ground with a mortar and pestle. Three sub-
samples were analyzed for each species.
AME values may be influenced by nitrogen loss/gain flux during feeding trials due
to protein tissue growth/catabolism (Scott et al. 1976). This would affect endogenous
urinary nitrogen levels in individual’s feces, so zero nitrogen balance AME calculations
were needed. Percent total nitrogen in food and fecal samples was measured with a
Thermo Finnigan® FlashEA 1112 Elemental Analyzer. Previous studies have used the
Kjeldahl technique to measure nitrogen composition (Scott et al. 1976, Carl and Brown
1985, Harder and Kirkpatrick 1994, Haufler and Servello 1994). The method used by
the elemental analyzer, dry combustion or Dumas method, was chosen because it is as
accurate as the Kjeldahl method, allows for smaller sample size, and requires less
preparation and run time (Matejovic 1995). Aspartic acid (N: 10.52 % ± 0.009) was
used as a nitrogen standard while peach leaves (N: 2.94% ± 0.12) and domestic sludge
(N: 4.78% ± 0.11) were used as reference checks. All samples were run in duplicates.
Percent crude protein in the fruits was calculated by multiplying percent nitrogen by 6.25
(Scott et al. 1976). Nitrogen corrected AME values were calculated using the following
equation:
1) AME (kcal/g) = [(F * FE) – (X * XE + 8.22 * N)] / F,
where F and X equal the dry weights (g) of food ingested and excrement, FE and XE
equal the energy (kcal/g) of food ingested and excrement, 8.22 is the energy constant
(kcal/g) of nitrogen in uric acid, and N equals the grams of nitrogen retained/lost per dry
gram of diet (Scott et al. 1976). AME may also be expressed in kiloJoules according to
the following equation:

40
2) AME (kJ/g) = AME (kcal/g) * 4.1841.
AME calculations for whole fruits are influenced by energy in seeds as well as
the pulp. For fruit-eating birds that do not digest the seeds, AME calculations will
underestimate the true metabolizability of fruit pulp. For these frugivorous birds, the
seed holds no nutritional value. Yellow-rumped Warblers consumed the entire fruit of
poison ivy and wax myrtle and defecated the whole seed; therefore the average mass
per fruit used in the calculations included the seed and pulp. Rarely did Cardinals
swallow whole tallow fruit and were not observed consuming whole fruit of hackberry or
deciduous holly. Most frequently, they worked the fruit in their bill to scrape off portions
of the pulp. A few instances occurred when tallow was ingested, but the seed was
regurgitated each time. Robins frequently ingested whole tallow fruit, but regurgitated
the seed. No instance of a bird defecating a tallow seed was observed Robins or
Cardinals. Regurgitated seeds showed no signs of damage to the seed coat.
Therefore, seed mass and energy for all fruit were excluded in the AME calculations for
both Cardinals and Robins. To compare metabolizable energy of tallow by Yellow-
rumped Warblers to wax myrtle and poison ivy, seed energy in the food and feces was
excluded from AME calculations.
The usefulness of metabolizable energy values is limited without information on
average fruit mass or daily energy requirements of the birds. Therefore, AME estimates
were used to calculate the mass of food (g) each bird needed to consume per day to
meet its daily metabolic needs. Energy demands are often reported as basal metabolic
rate (BMR), however BMR is only relevant for a nonactive, awake, unexcited, healthy,
nonreproductive adult at thermoneutral conditions (Peters 1983). Existence metabolism

41
(EM, kcal/bird-day) is a more appropriate measure since it also includes energy
required for locomotion and other daily activities (Kendeigh 1969, 1970). EM
calculations are typically for birds at either 30ºC or 0ºC (i.e., at or below thermoneutral
temperature) (Kendeigh 1969, 1970). In southwest Louisiana, mean daily temperatures
during the months of December, January, and February range from 10.0 to 14.4ºC
(National Weather Service 2004). To approximate conditions in southwest Louisiana,
an average EM was determined using the two calculations. Kendeigh’s (1969, 1970)
equation for EM (kcal/bird-day) for passerines at 30ºC is:
3. log (EM30) = 0.1965 + 0.6210 * log (Bg),
and at 0ºC is:
4) log (EM0) = 0.6372 + 0.5300 * log (Bg),
where Bg equals bird mass (g) at the start of the trials. The average EMavg was
computed and converted to kilojoules as follows:
5) EMavg = 4.1841 * [log (EM30) + log (EM0)] / 2.
Mass of food Mf needed per day to satisfy EMavg can be calculated for each plant
species by:
6) Mf (g/day) = EMavg * AME (kJ/g).
To calculate the number of fruit that would have to be consumed per day to satisfy
EMavg:
7) Number of fruit = Mf (g/day) / Mb (g/fruit),
where Mb is the average pulp mass for each plant species.
As mentioned previously, Yellow-rumped Warblers do not ingest whole tallow
fruit and Cardinals rarely did. To quantify the amount of pulp flaked off per scrape/peck,
42
I video recorded captive birds feeding on fruit. Each bird was deprived of food for one
hour and then given a weighed amount of fruit. Whole tallow fruit were provided to six
Yellow-rumped Warblers and three Cardinals. For the Warblers, a small tallow branch
with several clusters of tallow fruit was supplied. Cardinals were fed tallow fruit that had
been removed from the branch and placed into a feeding cup. Two additional Cardinals
were given deciduous holly and four were given hackberry. Feeding was recorded for
two hours on videotape and then the food was reweighed. The video was reviewed and
each feeding activity was counted. An average weight of food ingested per scrape/peck
was determined and used to calculate the number of scrapes/pecks required to satisfy
EMavg.
Statistical Analysis
Nitrogen corrected AME values (kJ/g) for tallow pulp were compared between
Northern Cardinals, Yellow-rumped Warblers and American Robins. Additional
comparisons were made between tallow fruit and native plant species fed to Northern
Cardinals and Yellow-rumped Warblers. The data did not satisfy normality assumptions
and data transformations did not ameliorate the problem. Therefore data were analyzed
using the Kruskal-Wallis nonparametric test (Conover 1980) in SAS (Proc NPAR1WAY,
SAS Institute Inc. 1999). When the null hypothesis of no difference between groups
was rejected, contrasts were performed on the ranks using Tukey’s pairwise
comparisons (Proc MIXED, SAS Institute Inc. 1999). Log-linear analysis was used to
test for differences between death rates in Cardinals according to sex (Proc CATMOD,
SAS Institute Inc. 1999).
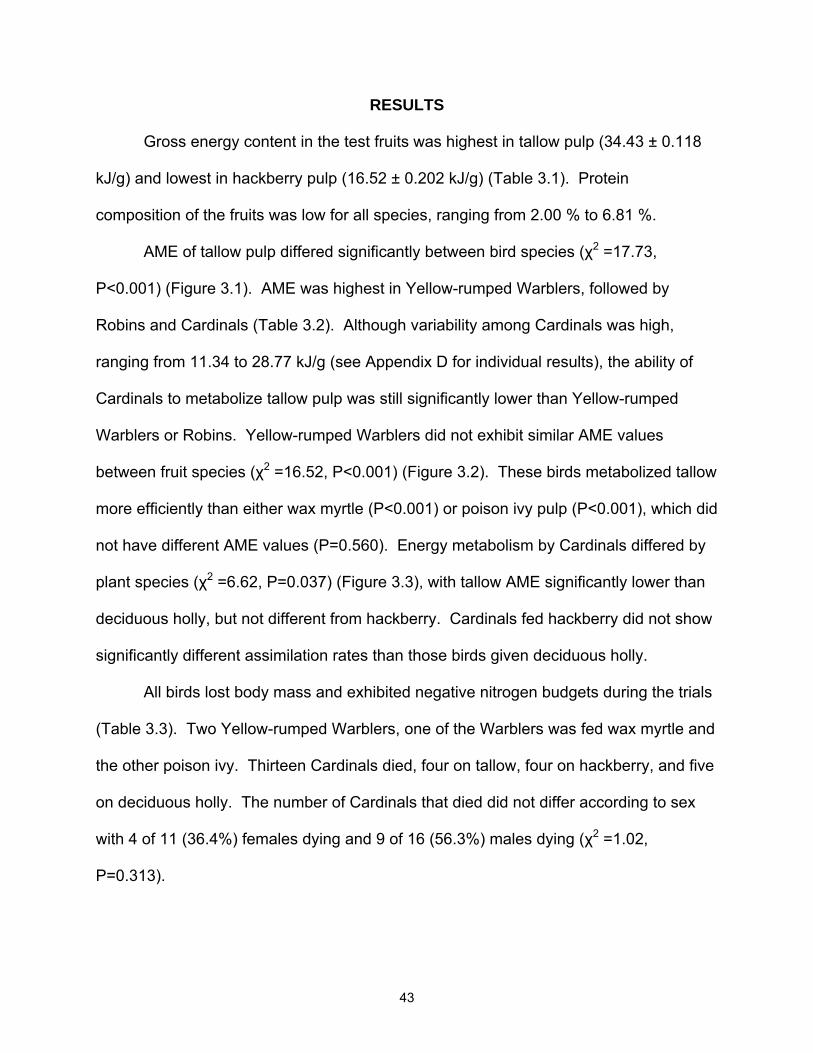
43
RESULTS
Gross energy content in the test fruits was highest in tallow pulp (34.43 ± 0.118
kJ/g) and lowest in hackberry pulp (16.52 ± 0.202 kJ/g) (Table 3.1). Protein
composition of the fruits was low for all species, ranging from 2.00 % to 6.81 %.
AME of tallow pulp differed significantly between bird species (χ2 =17.73,
P<0.001) (Figure 3.1). AME was highest in Yellow-rumped Warblers, followed by
Robins and Cardinals (Table 3.2). Although variability among Cardinals was high,
ranging from 11.34 to 28.77 kJ/g (see Appendix D for individual results), the ability of
Cardinals to metabolize tallow pulp was still significantly lower than Yellow-rumped
Warblers or Robins. Yellow-rumped Warblers did not exhibit similar AME values
between fruit species (χ2 =16.52, P<0.001) (Figure 3.2). These birds metabolized tallow
more efficiently than either wax myrtle (P<0.001) or poison ivy pulp (P<0.001), which did
not have different AME values (P=0.560). Energy metabolism by Cardinals differed by
plant species (χ2 =6.62, P=0.037) (Figure 3.3), with tallow AME significantly lower than
deciduous holly, but not different from hackberry. Cardinals fed hackberry did not show
significantly different assimilation rates than those birds given deciduous holly.
All birds lost body mass and exhibited negative nitrogen budgets during the trials
(Table 3.3). Two Yellow-rumped Warblers, one of the Warblers was fed wax myrtle and
the other poison ivy. Thirteen Cardinals died, four on tallow, four on hackberry, and five
on deciduous holly. The number of Cardinals that died did not differ according to sex
with 4 of 11 (36.4%) females dying and 9 of 16 (56.3%) males dying (χ2 =1.02,
P=0.313).
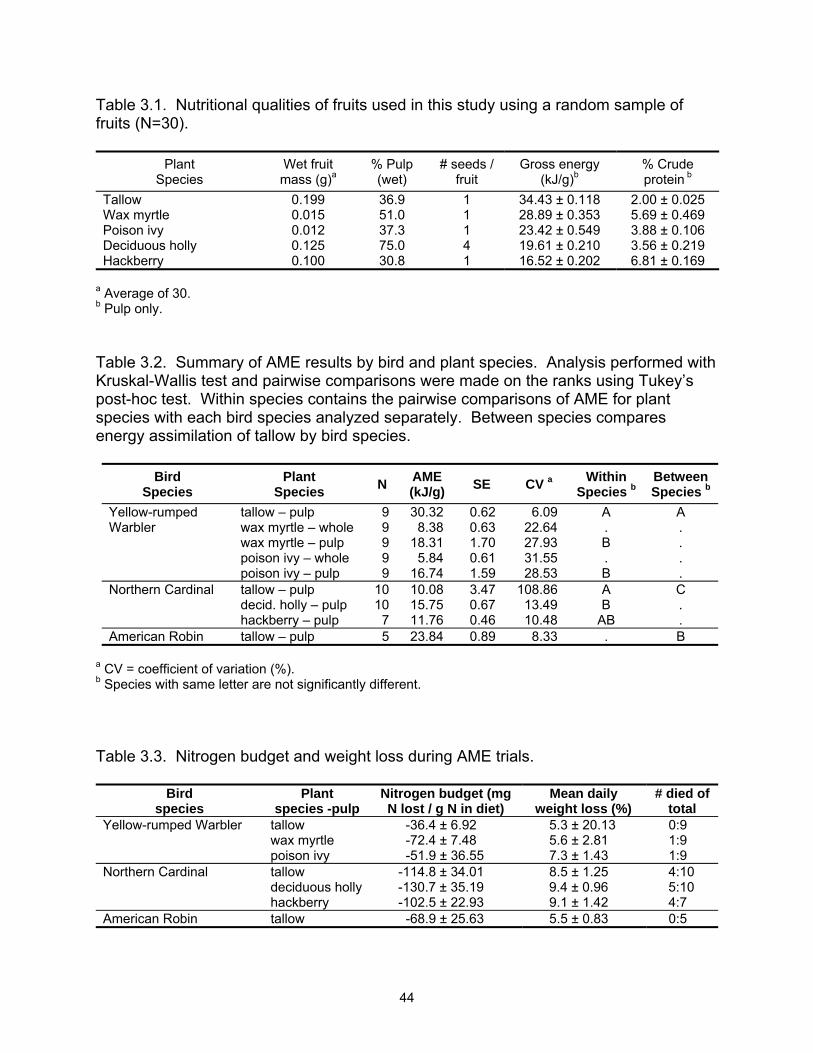
44
Table 3.1. Nutritional qualities of fruits used in this study using a random sample of fruits (N=30).
Plant
Species Wet fruit mass (g)a
% Pulp (wet)
# seeds / fruit
Gross energy (kJ/g)b
% Crude protein b
Tallow 0.199 36.9 1 34.43 ± 0.118 2.00 ± 0.025 Wax myrtle 0.015 51.0 1 28.89 ± 0.353 5.69 ± 0.469 Poison ivy 0.012 37.3 1 23.42 ± 0.549 3.88 ± 0.106 Deciduous holly 0.125 75.0 4 19.61 ± 0.210 3.56 ± 0.219 Hackberry 0.100 30.8 1 16.52 ± 0.202 6.81 ± 0.169
a Average of 30. b Pulp only.
Table 3.2. Summary of AME results by bird and plant species. Analysis performed with Kruskal-Wallis test and pairwise comparisons were made on the ranks using Tukey’s post-hoc test. Within species contains the pairwise comparisons of AME for plant species with each bird species analyzed separately. Between species compares energy assimilation of tallow by bird species.
Bird Species
Plant Species N AME
(kJ/g) SE CV a Within Species b
Between Species b
tallow – pulp 9 30.32 0.62 6.09 A A wax myrtle – whole 9 8.38 0.63 22.64 . . wax myrtle – pulp 9 18.31 1.70 27.93 B . poison ivy – whole 9 5.84 0.61 31.55 . .
Yellow-rumped Warbler
poison ivy – pulp 9 16.74 1.59 28.53 B . tallow – pulp 10 10.08 3.47 108.86 A C decid. holly – pulp 10 15.75 0.67 13.49 B .
Northern Cardinal
hackberry – pulp 7 11.76 0.46 10.48 AB . American Robin tallow – pulp 5 23.84 0.89 8.33 . B
a CV = coefficient of variation (%). b Species with same letter are not significantly different. Table 3.3. Nitrogen budget and weight loss during AME trials.
Bird
species Plant
species -pulp Nitrogen budget (mg N lost / g N in diet)
Mean daily weight loss (%)
# died of total
tallow -36.4 ± 6.92 5.3 ± 20.13 0:9 wax myrtle -72.4 ± 7.48 5.6 ± 2.81 1:9
Yellow-rumped Warbler
poison ivy -51.9 ± 36.55 7.3 ± 1.43 1:9 Northern Cardinal tallow -114.8 ± 34.01 8.5 ± 1.25 4:10 deciduous holly -130.7 ± 35.19 9.4 ± 0.96 5:10 hackberry -102.5 ± 22.93 9.1 ± 1.42 4:7 American Robin tallow -68.9 ± 25.63 5.5 ± 0.83 0:5
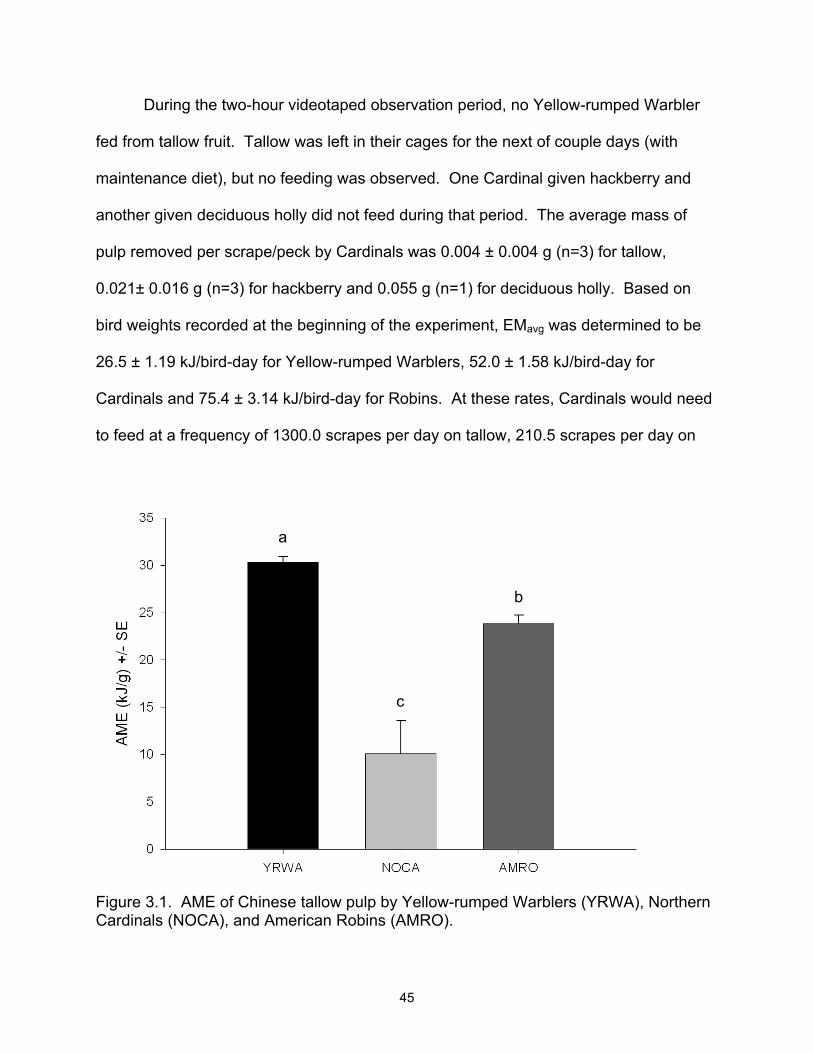
45
During the two-hour videotaped observation period, no Yellow-rumped Warbler
fed from tallow fruit. Tallow was left in their cages for the next of couple days (with
maintenance diet), but no feeding was observed. One Cardinal given hackberry and
another given deciduous holly did not feed during that period. The average mass of
pulp removed per scrape/peck by Cardinals was 0.004 ± 0.004 g (n=3) for tallow,
0.021± 0.016 g (n=3) for hackberry and 0.055 g (n=1) for deciduous holly. Based on
bird weights recorded at the beginning of the experiment, EMavg was determined to be
26.5 ± 1.19 kJ/bird-day for Yellow-rumped Warblers, 52.0 ± 1.58 kJ/bird-day for
Cardinals and 75.4 ± 3.14 kJ/bird-day for Robins. At these rates, Cardinals would need
to feed at a frequency of 1300.0 scrapes per day on tallow, 210.5 scrapes per day on
Figure 3.1. AME of Chinese tallow pulp by Yellow-rumped Warblers (YRWA), Northern Cardinals (NOCA), and American Robins (AMRO).
a
c
b
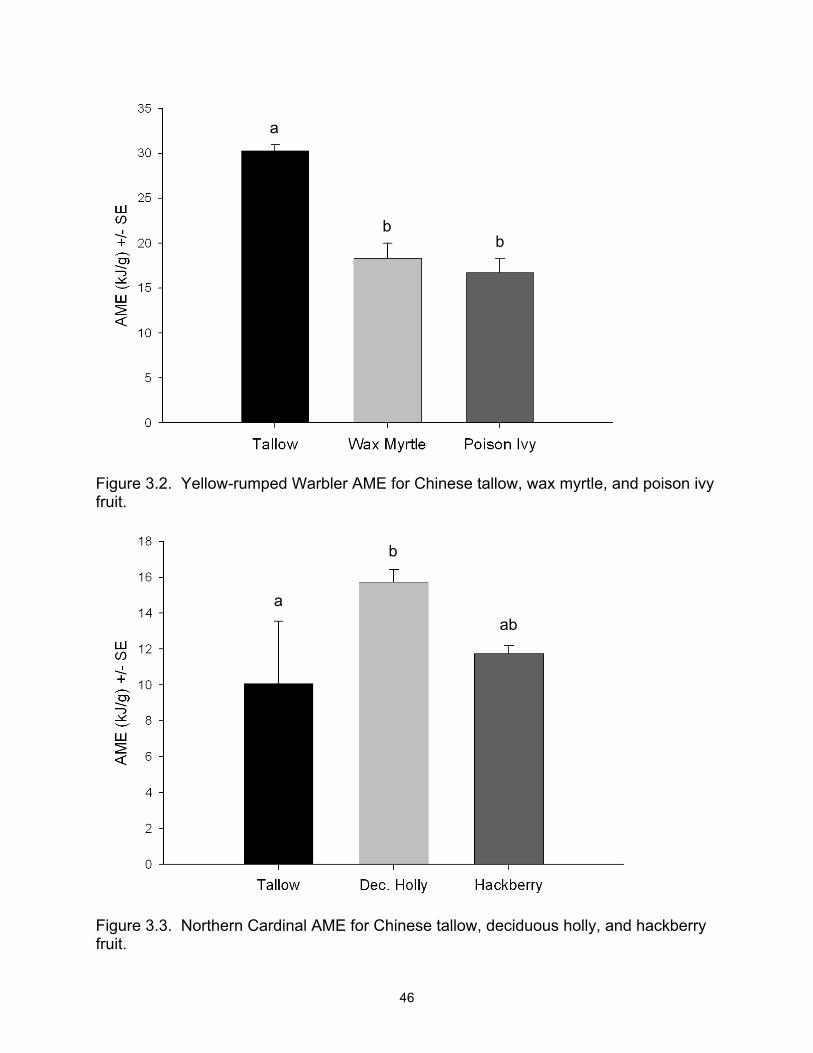
46
Figure 3.2. Yellow-rumped Warbler AME for Chinese tallow, wax myrtle, and poison ivy fruit.
Figure 3.3. Northern Cardinal AME for Chinese tallow, deciduous holly, and hackberry fruit.
a
b b
a
b
ab
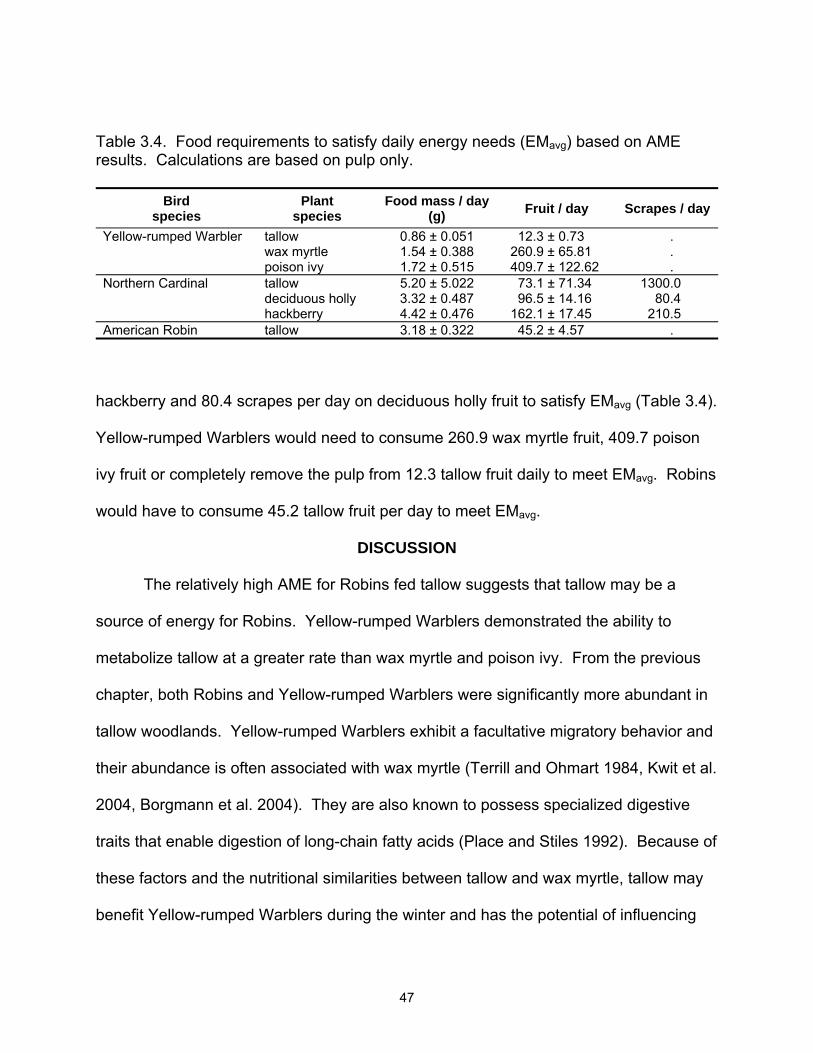
47
Table 3.4. Food requirements to satisfy daily energy needs (EMavg) based on AME results. Calculations are based on pulp only.
Bird
species Plant
species Food mass / day
(g) Fruit / day Scrapes / day
tallow 0.86 ± 0.051 12.3 ± 0.73 . wax myrtle 1.54 ± 0.388 260.9 ± 65.81 .
Yellow-rumped Warbler
poison ivy 1.72 ± 0.515 409.7 ± 122.62 . Northern Cardinal tallow 5.20 ± 5.022 73.1 ± 71.34 1300.0 deciduous holly 3.32 ± 0.487 96.5 ± 14.16 80.4 hackberry 4.42 ± 0.476 162.1 ± 17.45 210.5 American Robin tallow 3.18 ± 0.322 45.2 ± 4.57 .
hackberry and 80.4 scrapes per day on deciduous holly fruit to satisfy EMavg (Table 3.4).
Yellow-rumped Warblers would need to consume 260.9 wax myrtle fruit, 409.7 poison
ivy fruit or completely remove the pulp from 12.3 tallow fruit daily to meet EMavg. Robins
would have to consume 45.2 tallow fruit per day to meet EMavg.
DISCUSSION
The relatively high AME for Robins fed tallow suggests that tallow may be a
source of energy for Robins. Yellow-rumped Warblers demonstrated the ability to
metabolize tallow at a greater rate than wax myrtle and poison ivy. From the previous
chapter, both Robins and Yellow-rumped Warblers were significantly more abundant in
tallow woodlands. Yellow-rumped Warblers exhibit a facultative migratory behavior and
their abundance is often associated with wax myrtle (Terrill and Ohmart 1984, Kwit et al.
2004, Borgmann et al. 2004). They are also known to possess specialized digestive
traits that enable digestion of long-chain fatty acids (Place and Stiles 1992). Because of
these factors and the nutritional similarities between tallow and wax myrtle, tallow may
benefit Yellow-rumped Warblers during the winter and has the potential of influencing
48
their local distributions in the Southeast. I suggest that tallow is not an important food
source for Cardinals.
None of the birds maintained body mass during the trials, suggesting that the
nutritional qualities of the fruits examined were deficient of certain components. Fruits
in general contain low amounts of protein compared to other dietary items (Snow 1971,
Morton 1973), and the species in this study were no exception. Birds fed low protein
diets or diets deficient in certain amino acids may be unable to maintain a positive
nitrogen balance and consequently lose body mass (Parrish and Martin 1977, Witmer
1998). Izhaki and Safriel (1989) described weight loss in captive birds fed single-
species fruit diets and suggested that secondary compounds in the fruit limited the
birds’ ability to effectively digest protein. Mack (1990) and Sedinger (1990) suggest that
amino acid deficiency and not secondary compounds is the more likely cause of weight
loss for birds fed fruit diets. Certain plant proteins in chicken feed are contain proteins
that lower the nutritional value of the feed (Scott et al. 1976). These proteins can inhibit
digestive enzymes, lower growth rate, cause enlargement of the pancreas, decrease
protein and fat digestibility and can induce in vitro agglutination of red blood cells.
Consequently, these proteins must be removed by heat treatment prior to feeding. It is
not known whether the fruits used in this study contain anti-nutritional attributes.
Future AME experiments using the total collection method should be designed so
that test diets contain all of the necessary daily nutritional requirements for the species
of interest. Otherwise the total collection method is not recommended and alternative
techniques, such as the indicator method (Scott et al. 1976, Haufler and Servello 1994),
should be considered. This method uses an indigestible indicator such as radioactive
49
chromic chloride or chromic oxide, which is added to the test diet. The indicator is not
absorbed or changed during the digestion process, so its concentration in the diet and
excrement can be used to calculate energy assimilation in a shorter time span.
Therefore, eliminating the confounding effects of weight loss. I controlled for weight
loss by adjusting AME calculations for zero nitrogen balance.
Cardinals that were fed tallow fruit exhibited highly variable AME values between
individuals. Time of year is not a likely cause of this variability, which was observed in
both December (n=7) and February (n=3). Cardinals fed hackberry or deciduous holly
did not display the same degree of variability between individuals as Cardinals
consuming tallow. A possible cause of variation may be poor acclimation to tallow
during the pre-trial period. Cardinals tended to avoid eating tallow during this time and
may not have acclimated to tallow. It is also possible that Cardinals require more time
to acclimate to tallow fruit than Yellow-rumped Warblers and Robins due to the elevated
concentrations of saturated fatty acids. Another cause for the large variation in tallow
assimilation may be due to inherent differences of individual Cardinals in digestibility of
tallow fruits. Results do not indicate that sex is a factor; however, sample size was low.
50
SUMMARY AND CONCLUSIONS
Winter bird communities occupying Chinese tallow woodlands differed from those
found in bottomland hardwood stands in the Mermentau River Basin, Louisiana.
Species richness was lower in tallow stands. Information-theoretic modeling allowed
me to make inferences about the relative importance of habitat type and specific
landscape variables to species richness and bird abundance. Habitat type was a better
predictor of species abundance than landscape variables for 5 of 8 species in Year 1
and 6 of 10 species in Year 2.
Energy assimilation of tallow fruit differed between bird species. Yellow-rumped
Warblers were able to metabolize tallow fruit pulp more effectively than either wax
myrtle or poison ivy. Northern Cardinals were not able to metabolize tallow pulp as well
as deciduous holly fruit. Yellow-rumped Warblers likely performed better in these trials
due to their specialized digestive system.
Chinese tallow woodlands may provide adequate habitat for certain species, but
those tend to be edge-associated species whose population numbers are either stable
or not declining significantly. In general, bottomland hardwoods sites supported more
species and possessed a higher measure of species evenness. Tallow woodlands may
influence the local winter distribution of Yellow-rumped Warblers because of that
species’ ability to effectively metabolize tallow fruit pulp and because they were very
abundant in tallow-dominated woodlands. Future research should consider food
availability in tallow woodlands and the choices birds make when offered tallow fruit
versus fruits from native plants.
51
LITERATURE CITED
Anderson, D. R., W. A. Link, D. H. Johnson, and K. P. Burnham. 2001. Suggestions for presenting the results of data analyses. Journal of Wildlife Management 65:373-378.
Barker, R. J. and J. R. Sauer. 1995. Statistical aspects of point count sampling. Pages
125-130 in Monitoring bird populations by point counts (C. J. Ralph, J. R. Sauer, and S. Droege, Eds.). Gen. Tech. Rep. PSW-GTR-149. Albany, CA: Pacific Southwest Research Station. Forest Service, U. S. Department of Agriculture.
Barrilleaux, T. C. and J. B. Grace. 2000. Growth and invasive potential of Sapium
sebiferum (Euphorbiaceae) within the coastal prairie region: the effects of soil and moisture regime. American Journal of Botany 87:1099-1106.
Barrow, W. C. Jr. and I. Renne. 2001. Interactions between migrant landbirds and an
invasive exotic plant: the Chinese tallow tree. Flyway newsletter 8:11. Bart, J. and S. Earnst. 2002. Double sampling to estimate density and population
trends in birds. Auk 119:36-45. Borgmann, K. L., S. F. Pearson, D. J. Levey, and C. H. Greenberg. 2004. Wintering
Yellow-rumped Warblers (Dendroica coronata) track manipulated abundance of Myrica cerifera fruits. Auk 121:74-87.
Boulinier, T., J. D. Nichols, J. R. Sauer, J. E. Hines, and K. H. Pollock. 2002.
Estimating species richness: the importance of heterogeneity in species detectability. Ecology 79:1018-1028.
Braithwaite, R. W., W. M. Lonsdale, and J. A. Estbergs. 1989. Alien vegetation and
native biota in tropical Australia: The impact of Mimosa pigra. Biological Conservation 48:189-210.
Bruce, K. A., G. N. Cameron, and P. A. Harcombe. 1995. Initiation of a new woodland
type on the Texas Coastal Prairie by the Chinese tallow tree (Sapium sebiferum (L.) Roxb.). Journal of the Torrey Botanical Society 122:215-225.
Bruce, K. A., G. N. Cameron, P. A. Harcombe, and G. Jubinsky. 1997. Introduction,
impact on native habitats, and management of a woody invader, the Chinese tallow tree, Sapium sebiferum (L.) Roxb. Natural Areas Journal 17:255-260.
Buckland, S. T., D. R. Anderson, K. P. Burnham, and J. L. Laake. 1993. Distance
sampling: estimating abundance of biological populations. Chapman and Hall, London. 446 pp.
52
Burnham, K. P. and D. R. Anderson. 2002. Model selection and multimodel inference: a practical information-theoretic approach, 2nd ed. Springer-Verlag, New York. 488 pp.
Bye, S. L., R. J. Robel, and K. E. Kemp. 2001. Effects of human presence on
vocalizations of grassland birds in Kansas. The Prairie Naturalist 33:249-256. Cameron, G. N., E. G. Glumac, and B. D. Eshelman. 2000. Germination and dormancy
in seeds of Sapium sebiferum (Chinese tallow tree). Journal of Coastal Research 16:391-395.
Cameron, G. N. and S. R. Spencer. 1989. Rapid leaf decay and nutrient release in a
Chinese tallow forest. Oecologia 80:222-228. Carl, G. R. and R. D. Brown, 1985. Protein requirement of adult collared peccaries.
Journal of Wildlife Management 49:351-355. Charron, T., R. F. Davis, and B. A. Vairin. 2000. Invasive species science strategy for
Department of the Interior lands in the USGS Central Region. U. S. Geological Survey, Lafayette, LA. 18 pp.
Cimprich, D. A. and F. R. Moore. 1995. Gray Catbird (Dumetella carolinensis). In The
Birds of North America, No. 167 (A. Poole and F. Gill, Eds.). The Birds of North America, Inc., Philadelphia, PA.
Cochran, W. G. 1977. Sampling Techniques, 3rd ed. John Wiley and Sons, New York.
428 pp. Conner, W. H. and G. R. Askew. 1993. Impact of saltwater flooding on red maple,
redbay, and Chinese tallow seedlings. Castanea 58:214-219. Conover, W. J. 1980. Practical nonparametric statistics, 2nd ed. John Wiley and Sons,
New York. 493 pp. Conway, W. C. 1997. Avian behavior in Chinese tallow woodlands and evaluating the
potential control and allelopathic interference of Chinese tallow. Master of Science Thesis. Texas Tech University, Lubbock, TX. 139 pp.
Conway, W. C., L. M. Smith, and J. F. Bergan. 2002. Avian use of Chinese tallow
seeds in coastal Texas. Southwestern Naturalist 47:550-556. DeGraaf, R. M. and J. H. Rappole. 1995. Neotropical migratory birds: natural history,
distribution, and population change. Cornell University Press, Ithaca, New York. 676 pp.
53
De Wit, M. P., D. J. Crookes, and B. W. Van Wilgen. 2001. Conflicts of interest in environmental management: estimating the costs and benefits of a tree invasion. Biological Invasions 3:167-178.
Duke, J. A. 1983. Handbook of energy crops. unpublished (October 2, 1996). Eberhardt, L. L. and M. A. Simmons. 1987. Calibrating population indices by double
sampling. Journal of Wildlife Management 51:665-675. Emlen, J. T. and M. J. DeJong. 1981 The application of song detection threshold
distance to census operations. Studies in Avian Biology 6:346-352. Environmental Systems Research Institute. 2002. ARCVIEW Version 3.3.
Environmental Systems Research Institute, Inc., Redlands, California. Falls, J. B. and J. G. Kopachena. 1994. White-throated Sparrow (Zonotrichia
albicollis). In The Birds of North America, No. 128 (A. Poole and F. Gill, Eds.). The Birds of North America, Inc., Philadelphia, PA.
Farnsworth, G. L., K. H. Pollock, J. D. Nichols, Simons, T. R., J. E. Hines, and J. R.
Sauer. 2002. A removal model for estimating detection probabilities from point-count surveys. Auk 119:414-425.
Grace, J. B. 1998. Can prescribed fire save the endangered coastal prairie ecosystem
from Chinese tallow invasion? Endangered Species Update 15:70-76. Gutzwiller, K. J. 1991. Estimating winter species richness with unlimited-distance point
counts. Auk 108:853-862. Gutzwiller, K. J. and H. A. Marcum. 1997. Bird reactions to observer clothing color:
implications for distance-sampling techniques. Journal of Wildlife Management 61:935-947.
Halkin, S. L. and S. U. Linville. 1999. Northern Cardinal (Cardinalis cardinalis). In The
Birds of North America, No. 440 (A. Poole and F. Gill, Eds.). The Birds of North America, Inc., Philadelphia, PA.
Hamel, P. B., W. P. Smith, D. J. Twedt, J. R. Woehr, E. Morris, R. B. Hamilton, and R.
J. Cooper. 1996. A land manager’s guide to point counts of birds in the southeast. U. S. Forest Service, Gen. Tech. Report SO-120, Southern Research Station. 39pp.
Handel, C. M. and R. E. Gill, Jr. 1992. Breeding distribution of the Black Turnstone.
Wilson Bulletin 104:122-135.
54
Harcombe, P. A., G. N. Cameron, and E. G. Glumac. 1993. Above-ground net primary productivity in adjacent grassland and woodland on the coastal prairie of Texas, USA. Journal of Vegetation Science 4:521-530.
Harder, J. D. and R. L. Kirkpatrick. 1994. Physiological methods in wildlife research.
Pages 275-306 in Research and management techniques for wildlife and habitats, 5th ed. (T. A. Bookhout, Ed.). The Wildlife Society, Bethesda, Maryland.
Haulfer, J. B. and F. A. Servello. 1994. Techniques for wildlife nutritional analyses.
Pages 307-323 in Research and management techniques for wildlife and habitats, 5th ed. (T. A. Bookhout, Ed.). The Wildlife Society, Bethesda, Maryland.
Hosmer, D. W. and S. Lemeshow. 1989. Applied logistic regression. John Wiley &
Sons, Inc., New York. 307 pp. Houran, W. and L. Pengxin. 1991. Spotlight on species: Sapium sebiferum – a cash
tree crop. Farm Forestry News 4:10. Hunt, P. D. and D. J. Flaspohler. 1998. Yellow-rumped Warbler (Dendroica coronata).
In The Birds of North America, No. 376 (A. Poole and F. Gill, Eds.). The Birds of North America, Inc., Philadelphia, PA.
Hutto, R. L., and J. S. Young. 2003. On the design of monitoring programs and the use
of population indices: a reply to Ellingson and Lukacs. Wildlife Society Bulletin 31:903-910.
Invasive Species Program. 2000. Microbes to mammals: invasive species program
element review. Annapolis, Maryland October 23-25, 2000. Biological Resources Division, U. S. Geological Survey, Reston, Virginia.
Izhaki, I. and U. N. Safriel. 1989. Why are there so few exclusively frugivorous birds?
Experiments on fruit digestibility. Oikos 54:23-32. Jones, R. H. and K. W. McLeod. 1989. Shade tolerance in seedlings of Chinese tallow
tree, American sycamore, and cherrybark oak. Bulletin of the Torrey Botanical Club 116:371-377.
Jones, R. H. and R. R. Sharitz. 1990. Effects of root competition and flooding on
growth of Chinese tallow tree seedlings. Canadian Journal of Forest Research 20:573-578.
Jubinsky, G. 1994. A review of the literature: Chinese tallow (Sapium sebiferum).
Florida Department of Environmental Protection, Bureau of Aquatic Plant Management. Technical Services Section, TSS-93-03. 12 pp.
55
Jubinsky, G. and L. C. Anderson. 1996. The invasive potential of Chinese tallow-tree (Sapium sebiferum Roxb.) in the Southeast. Castanea 61:226-231.
Kendeigh, S. C. 1969. Tolerance of cold and Bergmann’s Rule. Auk 86:13-25. Kendeigh, S. C. 1970. Energy requirements for existence in relation to size of bird.
Condor 72:60-65. Khan, F. W., K. Khan, and M. N. Malik. 1973. Vegetable tallow and stillingia oil from
the fruits of Sapium sebiferum Roxb. The Pakistan Journal of Forestry 23:257-266. Kwit, C., D. J. Levey, C. H. Greenberg, S. F. Pearson, J. P. McCarty, S. Sargent, and R.
L. Mumme. 2004. Fruit abundance and local distribution of wintering Hermit Thrushes (Cathaus guttatus) and Yellow-rumped Warblers (Dendroica coronata) in South Carolina. Auk 121:46-57.
Lepczyk, C. A., K. G. Murray, K. Winnett-Murray, P. Bartell, E. Geyer, and T. Work.
2000. Seasonal fruit preferences for lipids and sugars by American Robins. Auk 117:709-717.
Mack, A. L. 1990. Is frugivory limited by secondary compounds in fruits? Oikos
57:135-138. Mack, R. N., D. Simberloff, W. M. Lonsdale, H. Evans, M. Clout, and F. A. Bazzaz.
2000. Biotic invasions: causes, epidemiology, global consequences, and control. Ecological Applications 10:689-710.
MacKenzie, D. I. and W. L. Kendall. 2002. How should detection probability be
incorporated into estimates of relative abundance? Ecology 83:2387-2393. MacKenzie, D. I., J. D. Nichols, G. B. Lachman, S. Droege, J. A. Royle, and C. A.
Langtimm. 2002. Estimating site occupancy rates when detection probabilities are less than one. Ecology 83:2248-2255.
Matejovic, I. 1995. Total nitrogen in plant material determination by means of dry
combustion: a possible alternative to determination by Kjeldahl digestion. Communications in Soil Science and Plant Analysis 26:2217-2229.
McShea, W. J. and J. H. Rappole. 1997. Variable song rates in three species of
passerines and implications for estimating bird populations. Journal of Field Ornithology 68:367-375.
McWilliams, S. R., S. B. Kearney, and W. H. Karasov. 2002. Diet preferences of
warblers for specific fatty acids in relation to nutritional requirements and digestive capabilities. Journal of Avian Biology 33:167-174.
56
Mirarchi, R. E. and T. S. Baskett. 1994. Mourning Dove (Zenaida macroura). In The Birds of North America, No. 117 (A. Poole and F. Gill, Eds.). The Birds of North America, Inc., Philadelphia, PA.
Morton, E. S. 1973. On the evolutionary advantages and disadvantages of fruit eating
in tropical birds. American Naturalist 107:8-22. National Audubon Society, Christmas Bird Count data.
http://audubon2.org/birds/cbc/hr/table.html. Accessed April 11, 2005. National Research Council. 2002. Predicting invasions of nonindigenous plants and
plant pests. Committee on the Scientific Basis for Predicting the Invasive Potential of Nonindigenous Plants and Plant Pests in the United States. National Academy Press, Washington, D. C. 194 pp.
National Weather Service Forecast Office, National Oceanic and Atmospheric
Administration. http://www.srh.noaa.gov/lch/climate/climate.htm. Accessed July 11, 2004.
Neyland, R. and H. A. Meyer. 1997. Species diversity of Louisiana chenier woody
vegetation remnants. Journal of the Torrey Botanical Society 124:254-261. Nichols, J. D., J. E. Hines, J. R. Sauer, F. W. Fallon, J. E. Fallon, and P. J. Heglund.
2000. A double-observer approach for estimating detection probability and abundance from point counts. Auk 117:393-408.
Parrish, J. W. Jr. and E. W. Martin. 1977. The effect of dietary lysine level on the
energy and nitrogen balance of the Dark-eyed Junco. Condor 79:24-30. Perkins, M. W., R. J. Johnson, and E. E. Blankenship. 2003. Response of riparian
avifauna to percentage and pattern of woody cover in an agricultural landscape. Wildlife Society Bulletin 31:642-660.
Peters, R. H. 1983. The ecological implications of body size. Cambridge University
Press, New York, New York. 329 pp. Pielou, E. C. 1969. An introduction to mathematical ecology. John Wiley & Sons, New
York, New York. 286 pp. Pimentel, D., S. McNair, J. Janecka, J. Wightman, C. Simmonds, C. O’Connell, E.
Wong, L. Russel, J. Zern, T. Aquino, and T. Tsomondo. 2001. Economic and environmental threats of alien plant, animal, and microbe invasions. Agriculture, Ecosystems and Environment 84:1-20.
Place, A. and E. W. Stiles. 1992. Living off the wax of the land: bayberries and Yellow-
rumped Warblers. Auk 109:334-345.
57
Raie, M. Y., S. Zaka, S. Iqbal, A. W. Sabir, and S. A. Khan. 1983. Sapium sebiferum
oil and fat analysis by chromatography. Fette Seifen Anstrichmittel 85:359-362. Renne, I. J., S. A. Gauthreaux, Jr., and C. A. Gresham. 2000. Seed dispersal of the
Chinese tallow tree (Sapium sebiferum (L.) Roxb.) by birds in coastal South Carolina. American Midland Naturalist 144:202-215.
Renne, I. J, W. C. Barrow Jr., L. A. Johnson Randall, and W. C. Bridges Jr. 2002.
Generalized avian dispersal syndrome contributes to Chinese tallow tree (Sapium sebiferum, Euphorbiaceae) invasiveness in South Carolina and Louisiana, USA. Diversity and Distributions 8:285-295.
Rogers, W. E., S. Nijjer, C. L. Smith, and E. Siemann. 2000. Effects of resources and
herbivory on leaf morphology and physiology of Chinese tallow (Sapium sebiferum) tree seedlings. Texas Journal of Science 52:43-56.
Rollfinke, B. F. and R. H. Yahner. 1990. Effects of time of day and season on winter
bird counts. Condor 92:215-219. Rosenstock, S. S., D. R. Anderson, K. M. Giesen, T. Leukering, and M. F. Carter. 2002.
Landbird counting techniques: current practices and an alternative. Auk 119:46-53. Russel, L. H., W. L. Schwartz, and J. W. Dollahite. 1969. Toxicity of Chinese tallow
tree (Sapium sebiferum) for ruminants. American Journal of Veterinary Research 30:1233-1238.
Sallabanks, R. and F. C. James. 1999. American Robin (Turdus migratorius). In The
Birds of North America, No. 462 (A. Poole and F. Gill, Eds.). The Birds of North America, Inc., Philadelphia, PA.
SAS Institute Inc. 1999. SAS OnlineDoc®, Version 8, SAS Institute Inc., Cary, North
Carolina, USA. Scheld, H. W. and J. R. Cowles. 1981. Woody biomass potential of the Chinese tallow
tree. Economic Botany 35:391-397. Schmitz, D. C., D. Simberloff, R. H. Hofstetter, W. Haller, and D. Sutton. 1997. The
ecological impact of nonindigenous plants. Pages 39-61 in Strangers in paradise: Impact and management of nonindigenous species in Florida (D. Simberloff, D. C. Schmitz, and T. C. Brown, Eds.). Island Press, Washington, D. C.
Scott, M. L., M. C. Nesheim, and R. J. Young. 1976. Nutrition of the chicken. M. L.
Scott and Associates, Ithaca, New York. 555 pp.
58
Secretariat of the Convention on Biological Diversity. 2001. Assessment and management of alien species that threaten ecosystems, habitats and species. Abstracts of keynote addresses and posters presented at the sixth meeting of the Subsidiary Board on Scientific, Technical and Technological Advice, held in Montreal, Canada, 12-16 March 2001. Montreal, SCBD (CBD Technical Paper no. 1), 146 pp.
Sedinger, J. S. 1990. Are plant secondary compounds responsible for negative
apparent metabolizability of fruits by passerine birds? A comment on Izhaki and Safriel. Oikos 57:138-140.
Sharma, S., H. C. Rikhari, and L. M. S. Palni. 1996. Adoption of a potential plantation
tree crop as an agroforestry species but for the wrong reasons: a case study of the Chinese tallow tree from central Himalaya. International Tree Crops Journal 9:37-45.
Singh, K., S. K. Kapur, and Y. K. Sarin. 1993. Domestication of Sapium sebiferum
under Jammu conditions. Indian Forester 119:36-42. Snow, D. W. 1971. Evolutionary aspects of fruit-eating by birds. Ibis 113:194-202. Stein, B. A. and S. R. Flack, eds. 1996. America’s least wanted: alien species
invasions of U. S. Ecosystems. The Nature Conservancy, Arlington, Virginia. 31 pp.
Stiles, E. W. 1982. Expansions of Mockingbird and multiflora rose in the northeastern
United States and Canada. American Birds 36:358-364. Sugiura, N. 1978. Further analysis of the data by Akaike’s information criterion and the
finite corrections. Communications in Statistics, Theory and Methods A7:13-26. Tarvin, K. A. and G. E. Woolfenden. 1999. Blue Jay (Cyanocitta cristata). In The Birds
of North America, No. 469 (A. Poole and F. Gill, Eds.). The Birds of North America, Inc., Philadelphia, PA.
Terrill, S. B. and R. D. Ohmart. 1984. Facultative extension of fall migration by Yellow-
rumped Warblers (Dendroica coronata). Auk 101:427-438. Thomas, L., J. L. Laake, S. Strindberg, F. F. C. Marques, S. T. Buckland, D. L.
Borchers, D. R. Anderson, K. P. Burnham, S. L. Hedley, J. H. Pollard, and J. R. B. Bishop. 2004. DISTANCE 4.1, Release 4.2. Research Unit for Wildlife Population Assessment, University of St. Andrews, UK.
Thompson, W. L. 2002. Towards reliable bird surveys: accounting for individuals
present but not detected. Auk 119:18-25.
59
Tsing, T., F. Yi-Hsiung, and W. Wan-Li. 1956. Salt tolerance of some popular trees in North Kiangsu. Acta Botanica Sinica 5:174-176.
Wall, D. P. and S. P. Darwin. 1999. Vegetation and elevational gradients within a
bottomland hardwood forest of southeastern Louisiana. American Midland Naturalist 142:17-30.
Weeks, H. P., Jr. 1994. Eastern Phoebe (Sayornis phoebe). In The Birds of North
America, No. 94 (A. Poole and F. Gill, Eds.). The Birds of North America, Inc., Philadelphia, PA.
Westbrooks, R. 1998. Invasive plants, changing the landscape of America: Fact book.
Federal Interagency Committee for the Management of Noxious and Exotic Weeds (FICMNEW), Washington, D. C. 109pp.
Weyrauch, S. L. and T. C. Grubb, Jr. 2004. Patch and landscape characteristics
associated with the distribution of woodland amphibians in an agricultural fragmented landscape: an information-theoretic approach. Biological Conservation 115:443-450.
White, D. W. 1989. North American bird-dispersed fruits: ecological and adaptive
significance of nutritional and structural traits. Ph. D. Dissertation. Rutgers University, New Brunswick, New Jersey.
Willson, M. F. and J. C. Harmeson. 1973. Seed preferences and digestive efficiency of
Cardinals and Song Sparrows. Condor 75:225-234. Wilz, K. J. and V. Giampa. 1978. Habitat use by Yellow-rumped Warblers at the
northern extremities of their winter range. Wilson Bulletin 90:566-574. Witmer, M. C. 1998. Ecological and evolutionary implications of energy and protein
requirements of avain frugivores eating sugary diets. Wittenberg, R. and M. J. W. Cock. (eds.). 2001. Invasive alien species: a toolkit of best
prevention and management practices. CAB International, Wallingford, Oxon, UK, 228 pp.
Wolf, A. T., R. W. Howe, and G. J. Davis. 1995. Detectability of forest birds from
stationary points in northern Wisconsin. Pages 19-23 in Monitoring bird populations by point counts (C. J. Ralph, J. R. Sauer, and S. Droege, Eds.). Gen. Tech. Rep. PSW-GTR-149. Albany, CA: Pacific Southwest Research Station. Forest Service, U. S. Department of Agriculture.
Xu, J., T. Chikashige, S. Meguro, and S. Kawachi. 1991. Effective utilization of
Stillingia or Chinese tallow-tree (Sapium sebiferum) fruits. Mokuzai Gakkaishi 37:494-498.

60
Zurovchak, J. G. 1997. Nutritional role of high-lipid fruits in the diet of migrant thrushes.
PhD. Dissertation. Rutgers University, New Brunswick, New Jersey.
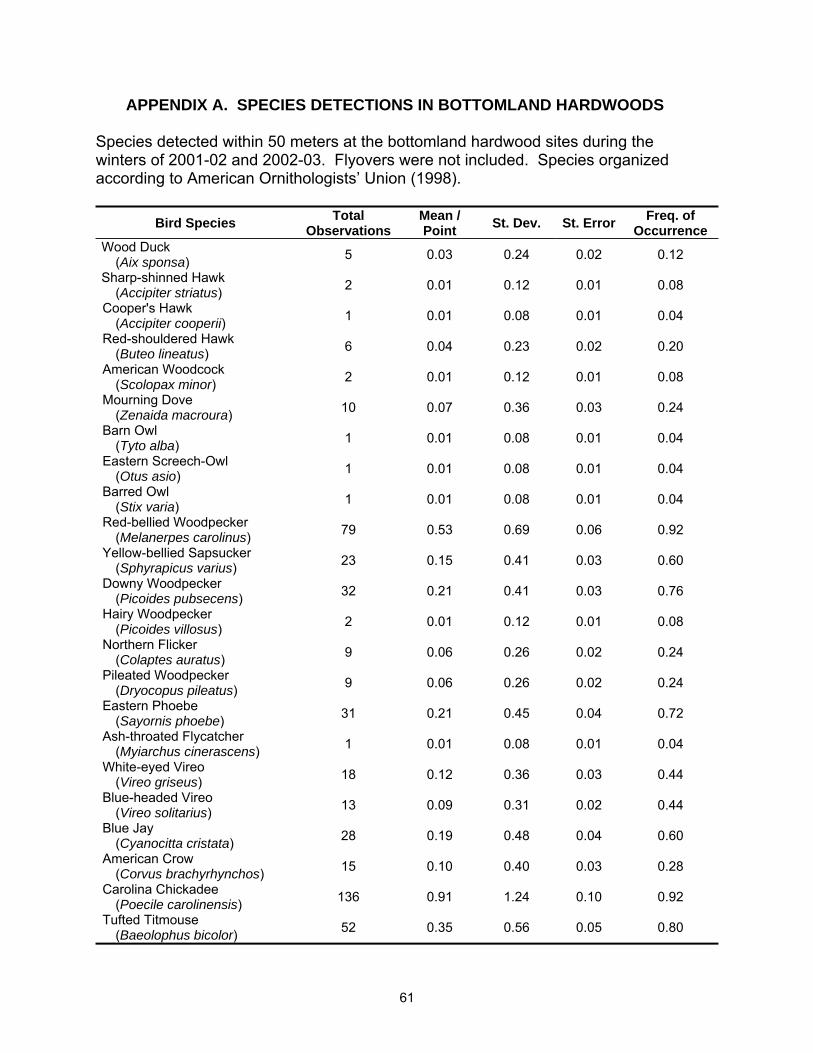
61
APPENDIX A. SPECIES DETECTIONS IN BOTTOMLAND HARDWOODS Species detected within 50 meters at the bottomland hardwood sites during the winters of 2001-02 and 2002-03. Flyovers were not included. Species organized according to American Ornithologists’ Union (1998).
Bird Species Total
Observations Mean / Point St. Dev. St. Error Freq. of
Occurrence Wood Duck (Aix sponsa) 5 0.03 0.24 0.02 0.12
Sharp-shinned Hawk (Accipiter striatus) 2 0.01 0.12 0.01 0.08
Cooper's Hawk (Accipiter cooperii) 1 0.01 0.08 0.01 0.04
Red-shouldered Hawk (Buteo lineatus) 6 0.04 0.23 0.02 0.20
American Woodcock (Scolopax minor) 2 0.01 0.12 0.01 0.08
Mourning Dove (Zenaida macroura) 10 0.07 0.36 0.03 0.24
Barn Owl (Tyto alba) 1 0.01 0.08 0.01 0.04
Eastern Screech-Owl (Otus asio) 1 0.01 0.08 0.01 0.04
Barred Owl (Stix varia) 1 0.01 0.08 0.01 0.04
Red-bellied Woodpecker (Melanerpes carolinus) 79 0.53 0.69 0.06 0.92
Yellow-bellied Sapsucker (Sphyrapicus varius) 23 0.15 0.41 0.03 0.60
Downy Woodpecker (Picoides pubsecens) 32 0.21 0.41 0.03 0.76
Hairy Woodpecker (Picoides villosus) 2 0.01 0.12 0.01 0.08
Northern Flicker (Colaptes auratus) 9 0.06 0.26 0.02 0.24
Pileated Woodpecker (Dryocopus pileatus) 9 0.06 0.26 0.02 0.24
Eastern Phoebe (Sayornis phoebe) 31 0.21 0.45 0.04 0.72
Ash-throated Flycatcher (Myiarchus cinerascens) 1 0.01 0.08 0.01 0.04
White-eyed Vireo (Vireo griseus) 18 0.12 0.36 0.03 0.44
Blue-headed Vireo (Vireo solitarius) 13 0.09 0.31 0.02 0.44
Blue Jay (Cyanocitta cristata) 28 0.19 0.48 0.04 0.60
American Crow (Corvus brachyrhynchos) 15 0.10 0.40 0.03 0.28
Carolina Chickadee (Poecile carolinensis) 136 0.91 1.24 0.10 0.92
Tufted Titmouse (Baeolophus bicolor) 52 0.35 0.56 0.05 0.80
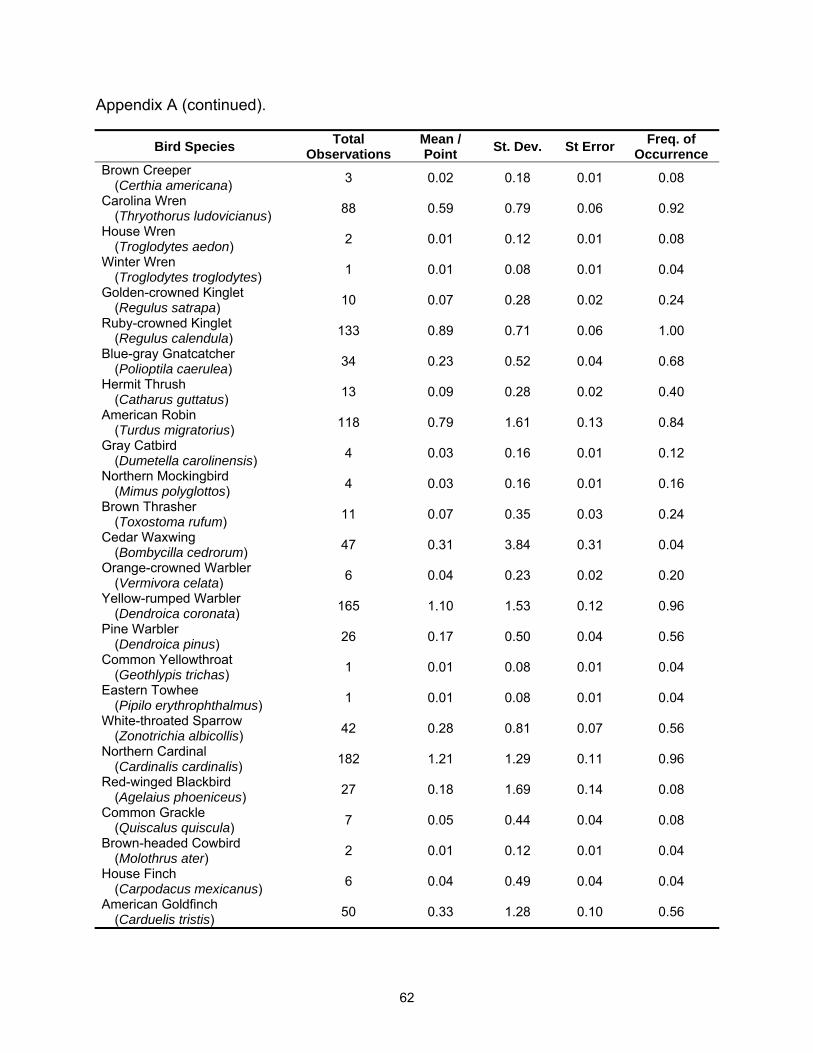
62
Appendix A (continued).
Bird Species Total Observations
Mean / Point St. Dev. St Error Freq. of
Occurrence Brown Creeper (Certhia americana) 3 0.02 0.18 0.01 0.08
Carolina Wren (Thryothorus ludovicianus) 88 0.59 0.79 0.06 0.92
House Wren (Troglodytes aedon) 2 0.01 0.12 0.01 0.08
Winter Wren (Troglodytes troglodytes) 1 0.01 0.08 0.01 0.04
Golden-crowned Kinglet (Regulus satrapa) 10 0.07 0.28 0.02 0.24
Ruby-crowned Kinglet (Regulus calendula) 133 0.89 0.71 0.06 1.00
Blue-gray Gnatcatcher (Polioptila caerulea) 34 0.23 0.52 0.04 0.68
Hermit Thrush (Catharus guttatus) 13 0.09 0.28 0.02 0.40
American Robin (Turdus migratorius) 118 0.79 1.61 0.13 0.84
Gray Catbird (Dumetella carolinensis) 4 0.03 0.16 0.01 0.12
Northern Mockingbird (Mimus polyglottos) 4 0.03 0.16 0.01 0.16
Brown Thrasher (Toxostoma rufum) 11 0.07 0.35 0.03 0.24
Cedar Waxwing (Bombycilla cedrorum) 47 0.31 3.84 0.31 0.04
Orange-crowned Warbler (Vermivora celata) 6 0.04 0.23 0.02 0.20
Yellow-rumped Warbler (Dendroica coronata) 165 1.10 1.53 0.12 0.96
Pine Warbler (Dendroica pinus) 26 0.17 0.50 0.04 0.56
Common Yellowthroat (Geothlypis trichas) 1 0.01 0.08 0.01 0.04
Eastern Towhee (Pipilo erythrophthalmus) 1 0.01 0.08 0.01 0.04
White-throated Sparrow (Zonotrichia albicollis) 42 0.28 0.81 0.07 0.56
Northern Cardinal (Cardinalis cardinalis) 182 1.21 1.29 0.11 0.96
Red-winged Blackbird (Agelaius phoeniceus) 27 0.18 1.69 0.14 0.08
Common Grackle (Quiscalus quiscula) 7 0.05 0.44 0.04 0.08
Brown-headed Cowbird (Molothrus ater) 2 0.01 0.12 0.01 0.04
House Finch (Carpodacus mexicanus) 6 0.04 0.49 0.04 0.04
American Goldfinch (Carduelis tristis) 50 0.33 1.28 0.10 0.56
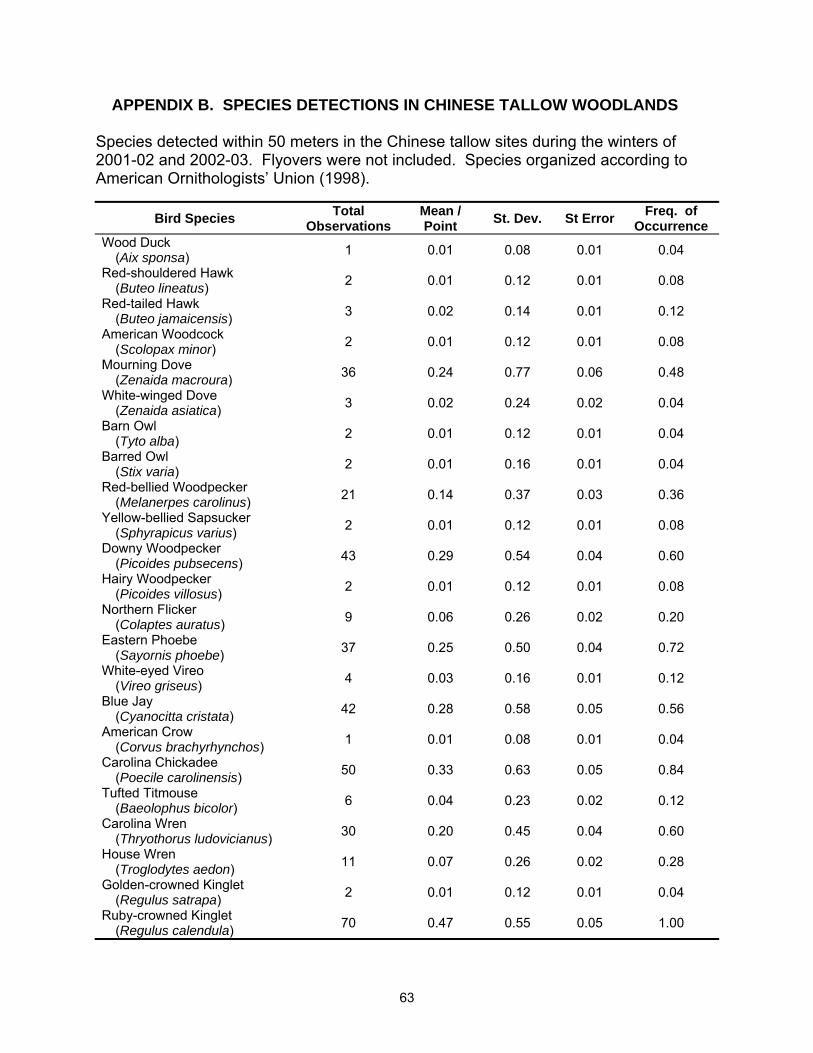
63
APPENDIX B. SPECIES DETECTIONS IN CHINESE TALLOW WOODLANDS
Species detected within 50 meters in the Chinese tallow sites during the winters of 2001-02 and 2002-03. Flyovers were not included. Species organized according to American Ornithologists’ Union (1998).
Bird Species Total Observations
Mean / Point St. Dev. St Error Freq. of
Occurrence Wood Duck (Aix sponsa) 1 0.01 0.08 0.01 0.04
Red-shouldered Hawk (Buteo lineatus) 2 0.01 0.12 0.01 0.08
Red-tailed Hawk (Buteo jamaicensis) 3 0.02 0.14 0.01 0.12
American Woodcock (Scolopax minor) 2 0.01 0.12 0.01 0.08
Mourning Dove (Zenaida macroura) 36 0.24 0.77 0.06 0.48
White-winged Dove (Zenaida asiatica) 3 0.02 0.24 0.02 0.04
Barn Owl (Tyto alba) 2 0.01 0.12 0.01 0.04
Barred Owl (Stix varia) 2 0.01 0.16 0.01 0.04
Red-bellied Woodpecker (Melanerpes carolinus) 21 0.14 0.37 0.03 0.36
Yellow-bellied Sapsucker (Sphyrapicus varius) 2 0.01 0.12 0.01 0.08
Downy Woodpecker (Picoides pubsecens) 43 0.29 0.54 0.04 0.60
Hairy Woodpecker (Picoides villosus) 2 0.01 0.12 0.01 0.08
Northern Flicker (Colaptes auratus) 9 0.06 0.26 0.02 0.20
Eastern Phoebe (Sayornis phoebe) 37 0.25 0.50 0.04 0.72
White-eyed Vireo (Vireo griseus) 4 0.03 0.16 0.01 0.12
Blue Jay (Cyanocitta cristata) 42 0.28 0.58 0.05 0.56
American Crow (Corvus brachyrhynchos) 1 0.01 0.08 0.01 0.04
Carolina Chickadee (Poecile carolinensis) 50 0.33 0.63 0.05 0.84
Tufted Titmouse (Baeolophus bicolor) 6 0.04 0.23 0.02 0.12
Carolina Wren (Thryothorus ludovicianus) 30 0.20 0.45 0.04 0.60
House Wren (Troglodytes aedon) 11 0.07 0.26 0.02 0.28
Golden-crowned Kinglet (Regulus satrapa) 2 0.01 0.12 0.01 0.04
Ruby-crowned Kinglet (Regulus calendula) 70 0.47 0.55 0.05 1.00
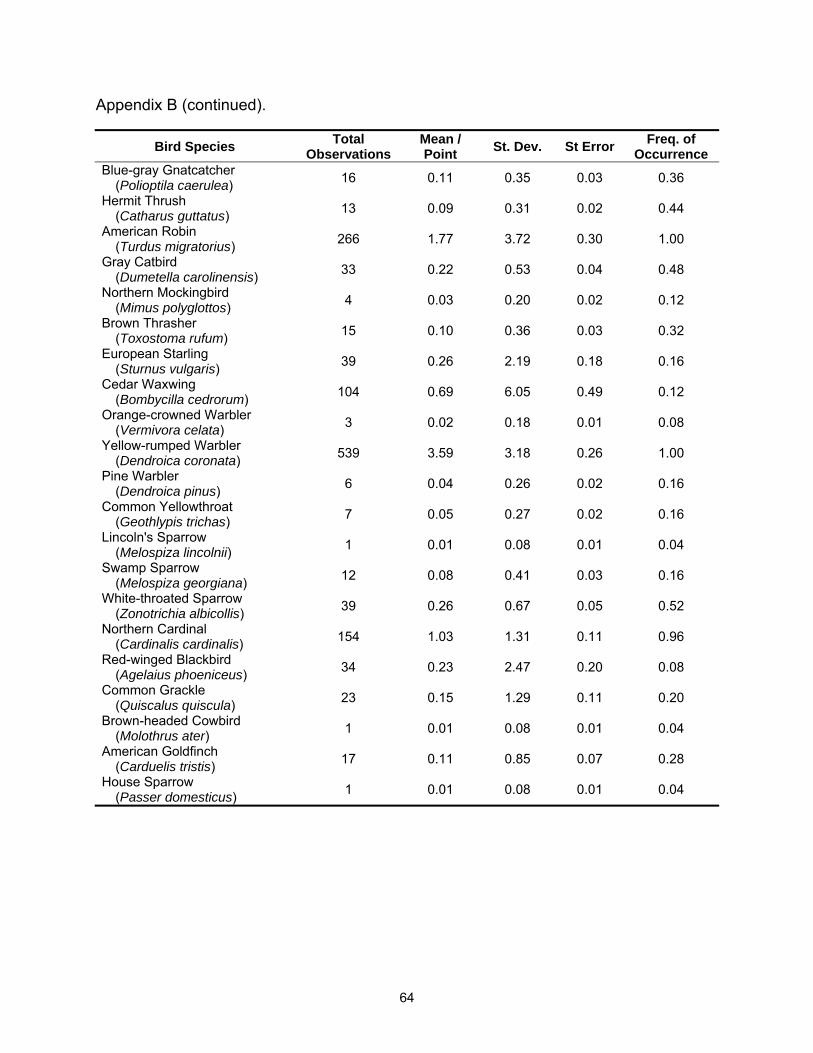
64
Appendix B (continued).
Bird Species Total Observations
Mean / Point St. Dev. St Error Freq. of
Occurrence Blue-gray Gnatcatcher (Polioptila caerulea) 16 0.11 0.35 0.03 0.36
Hermit Thrush (Catharus guttatus) 13 0.09 0.31 0.02 0.44
American Robin (Turdus migratorius) 266 1.77 3.72 0.30 1.00
Gray Catbird (Dumetella carolinensis) 33 0.22 0.53 0.04 0.48
Northern Mockingbird (Mimus polyglottos) 4 0.03 0.20 0.02 0.12
Brown Thrasher (Toxostoma rufum) 15 0.10 0.36 0.03 0.32
European Starling (Sturnus vulgaris) 39 0.26 2.19 0.18 0.16
Cedar Waxwing (Bombycilla cedrorum) 104 0.69 6.05 0.49 0.12
Orange-crowned Warbler (Vermivora celata) 3 0.02 0.18 0.01 0.08
Yellow-rumped Warbler (Dendroica coronata) 539 3.59 3.18 0.26 1.00
Pine Warbler (Dendroica pinus) 6 0.04 0.26 0.02 0.16
Common Yellowthroat (Geothlypis trichas) 7 0.05 0.27 0.02 0.16
Lincoln's Sparrow (Melospiza lincolnii) 1 0.01 0.08 0.01 0.04
Swamp Sparrow (Melospiza georgiana) 12 0.08 0.41 0.03 0.16
White-throated Sparrow (Zonotrichia albicollis) 39 0.26 0.67 0.05 0.52
Northern Cardinal (Cardinalis cardinalis) 154 1.03 1.31 0.11 0.96
Red-winged Blackbird (Agelaius phoeniceus) 34 0.23 2.47 0.20 0.08
Common Grackle (Quiscalus quiscula) 23 0.15 1.29 0.11 0.20
Brown-headed Cowbird (Molothrus ater) 1 0.01 0.08 0.01 0.04
American Goldfinch (Carduelis tristis) 17 0.11 0.85 0.07 0.28
House Sparrow (Passer domesticus) 1 0.01 0.08 0.01 0.04
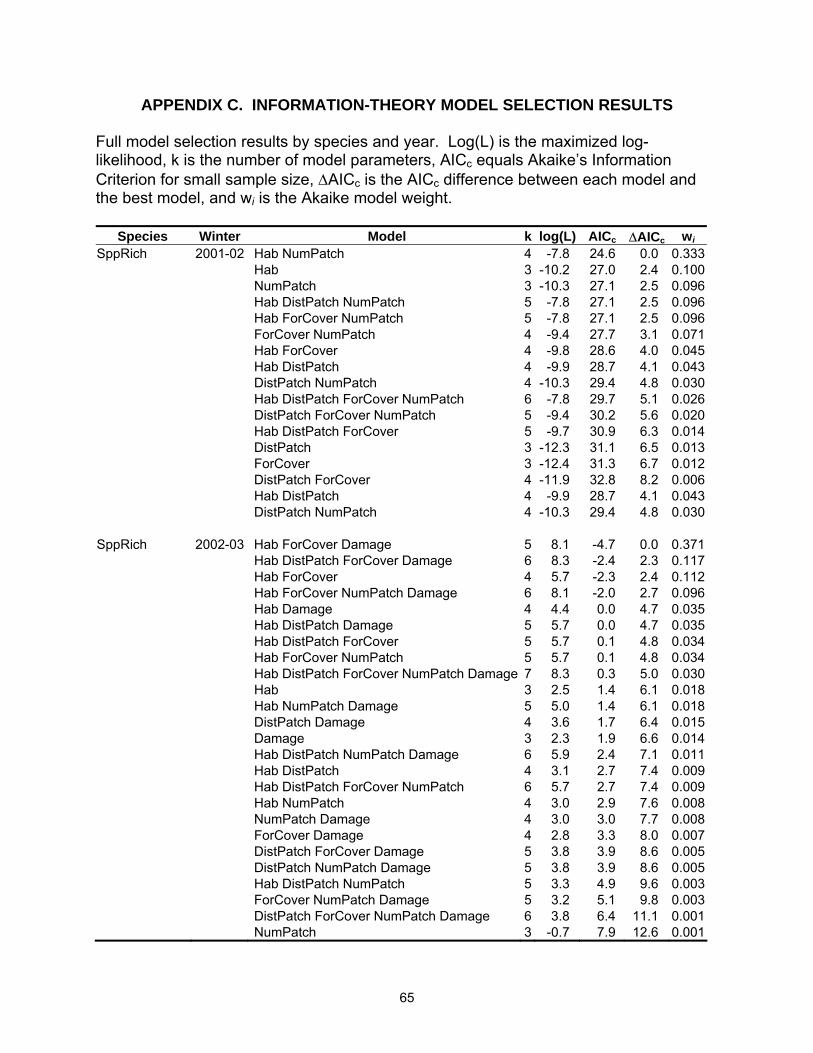
65
APPENDIX C. INFORMATION-THEORY MODEL SELECTION RESULTS
Full model selection results by species and year. Log(L) is the maximized log-likelihood, k is the number of model parameters, AICc equals Akaike’s Information Criterion for small sample size, ∆AICc is the AICc difference between each model and the best model, and wi is the Akaike model weight.
Species Winter Model k log(L) AICc ∆AICc wi SppRich 2001-02 Hab NumPatch 4 -7.8 24.6 0.0 0.333 Hab 3 -10.2 27.0 2.4 0.100 NumPatch 3 -10.3 27.1 2.5 0.096 Hab DistPatch NumPatch 5 -7.8 27.1 2.5 0.096 Hab ForCover NumPatch 5 -7.8 27.1 2.5 0.096 ForCover NumPatch 4 -9.4 27.7 3.1 0.071 Hab ForCover 4 -9.8 28.6 4.0 0.045 Hab DistPatch 4 -9.9 28.7 4.1 0.043 DistPatch NumPatch 4 -10.3 29.4 4.8 0.030 Hab DistPatch ForCover NumPatch 6 -7.8 29.7 5.1 0.026 DistPatch ForCover NumPatch 5 -9.4 30.2 5.6 0.020 Hab DistPatch ForCover 5 -9.7 30.9 6.3 0.014 DistPatch 3 -12.3 31.1 6.5 0.013 ForCover 3 -12.4 31.3 6.7 0.012 DistPatch ForCover 4 -11.9 32.8 8.2 0.006 Hab DistPatch 4 -9.9 28.7 4.1 0.043 DistPatch NumPatch 4 -10.3 29.4 4.8 0.030 SppRich 2002-03 Hab ForCover Damage 5 8.1 -4.7 0.0 0.371 Hab DistPatch ForCover Damage 6 8.3 -2.4 2.3 0.117 Hab ForCover 4 5.7 -2.3 2.4 0.112 Hab ForCover NumPatch Damage 6 8.1 -2.0 2.7 0.096 Hab Damage 4 4.4 0.0 4.7 0.035 Hab DistPatch Damage 5 5.7 0.0 4.7 0.035 Hab DistPatch ForCover 5 5.7 0.1 4.8 0.034 Hab ForCover NumPatch 5 5.7 0.1 4.8 0.034 Hab DistPatch ForCover NumPatch Damage 7 8.3 0.3 5.0 0.030 Hab 3 2.5 1.4 6.1 0.018 Hab NumPatch Damage 5 5.0 1.4 6.1 0.018 DistPatch Damage 4 3.6 1.7 6.4 0.015 Damage 3 2.3 1.9 6.6 0.014 Hab DistPatch NumPatch Damage 6 5.9 2.4 7.1 0.011 Hab DistPatch 4 3.1 2.7 7.4 0.009 Hab DistPatch ForCover NumPatch 6 5.7 2.7 7.4 0.009 Hab NumPatch 4 3.0 2.9 7.6 0.008 NumPatch Damage 4 3.0 3.0 7.7 0.008 ForCover Damage 4 2.8 3.3 8.0 0.007 DistPatch ForCover Damage 5 3.8 3.9 8.6 0.005 DistPatch NumPatch Damage 5 3.8 3.9 8.6 0.005 Hab DistPatch NumPatch 5 3.3 4.9 9.6 0.003 ForCover NumPatch Damage 5 3.2 5.1 9.8 0.003 DistPatch ForCover NumPatch Damage 6 3.8 6.4 11.1 0.001 NumPatch 3 -0.7 7.9 12.6 0.001
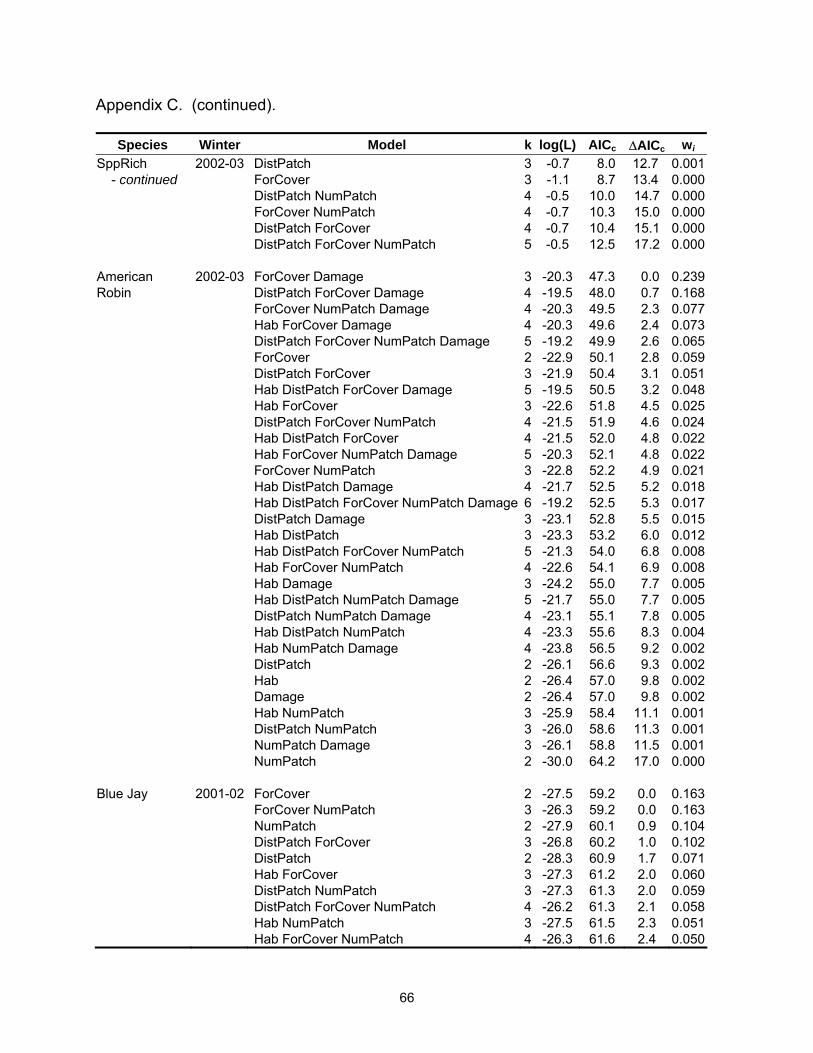
66
Appendix C. (continued).
Species Winter Model k log(L) AICc ∆AICc wi SppRich 2002-03 DistPatch 3 -0.7 8.0 12.7 0.001 - continued ForCover 3 -1.1 8.7 13.4 0.000 DistPatch NumPatch 4 -0.5 10.0 14.7 0.000 ForCover NumPatch 4 -0.7 10.3 15.0 0.000 DistPatch ForCover 4 -0.7 10.4 15.1 0.000 DistPatch ForCover NumPatch 5 -0.5 12.5 17.2 0.000 American 2002-03 ForCover Damage 3 -20.3 47.3 0.0 0.239Robin DistPatch ForCover Damage 4 -19.5 48.0 0.7 0.168 ForCover NumPatch Damage 4 -20.3 49.5 2.3 0.077 Hab ForCover Damage 4 -20.3 49.6 2.4 0.073 DistPatch ForCover NumPatch Damage 5 -19.2 49.9 2.6 0.065 ForCover 2 -22.9 50.1 2.8 0.059 DistPatch ForCover 3 -21.9 50.4 3.1 0.051 Hab DistPatch ForCover Damage 5 -19.5 50.5 3.2 0.048 Hab ForCover 3 -22.6 51.8 4.5 0.025 DistPatch ForCover NumPatch 4 -21.5 51.9 4.6 0.024 Hab DistPatch ForCover 4 -21.5 52.0 4.8 0.022 Hab ForCover NumPatch Damage 5 -20.3 52.1 4.8 0.022 ForCover NumPatch 3 -22.8 52.2 4.9 0.021 Hab DistPatch Damage 4 -21.7 52.5 5.2 0.018 Hab DistPatch ForCover NumPatch Damage 6 -19.2 52.5 5.3 0.017 DistPatch Damage 3 -23.1 52.8 5.5 0.015 Hab DistPatch 3 -23.3 53.2 6.0 0.012 Hab DistPatch ForCover NumPatch 5 -21.3 54.0 6.8 0.008 Hab ForCover NumPatch 4 -22.6 54.1 6.9 0.008 Hab Damage 3 -24.2 55.0 7.7 0.005 Hab DistPatch NumPatch Damage 5 -21.7 55.0 7.7 0.005 DistPatch NumPatch Damage 4 -23.1 55.1 7.8 0.005 Hab DistPatch NumPatch 4 -23.3 55.6 8.3 0.004 Hab NumPatch Damage 4 -23.8 56.5 9.2 0.002 DistPatch 2 -26.1 56.6 9.3 0.002 Hab 2 -26.4 57.0 9.8 0.002 Damage 2 -26.4 57.0 9.8 0.002 Hab NumPatch 3 -25.9 58.4 11.1 0.001 DistPatch NumPatch 3 -26.0 58.6 11.3 0.001 NumPatch Damage 3 -26.1 58.8 11.5 0.001 NumPatch 2 -30.0 64.2 17.0 0.000 Blue Jay 2001-02 ForCover 2 -27.5 59.2 0.0 0.163 ForCover NumPatch 3 -26.3 59.2 0.0 0.163 NumPatch 2 -27.9 60.1 0.9 0.104 DistPatch ForCover 3 -26.8 60.2 1.0 0.102 DistPatch 2 -28.3 60.9 1.7 0.071 Hab ForCover 3 -27.3 61.2 2.0 0.060 DistPatch NumPatch 3 -27.3 61.3 2.0 0.059 DistPatch ForCover NumPatch 4 -26.2 61.3 2.1 0.058 Hab NumPatch 3 -27.5 61.5 2.3 0.051 Hab ForCover NumPatch 4 -26.3 61.6 2.4 0.050
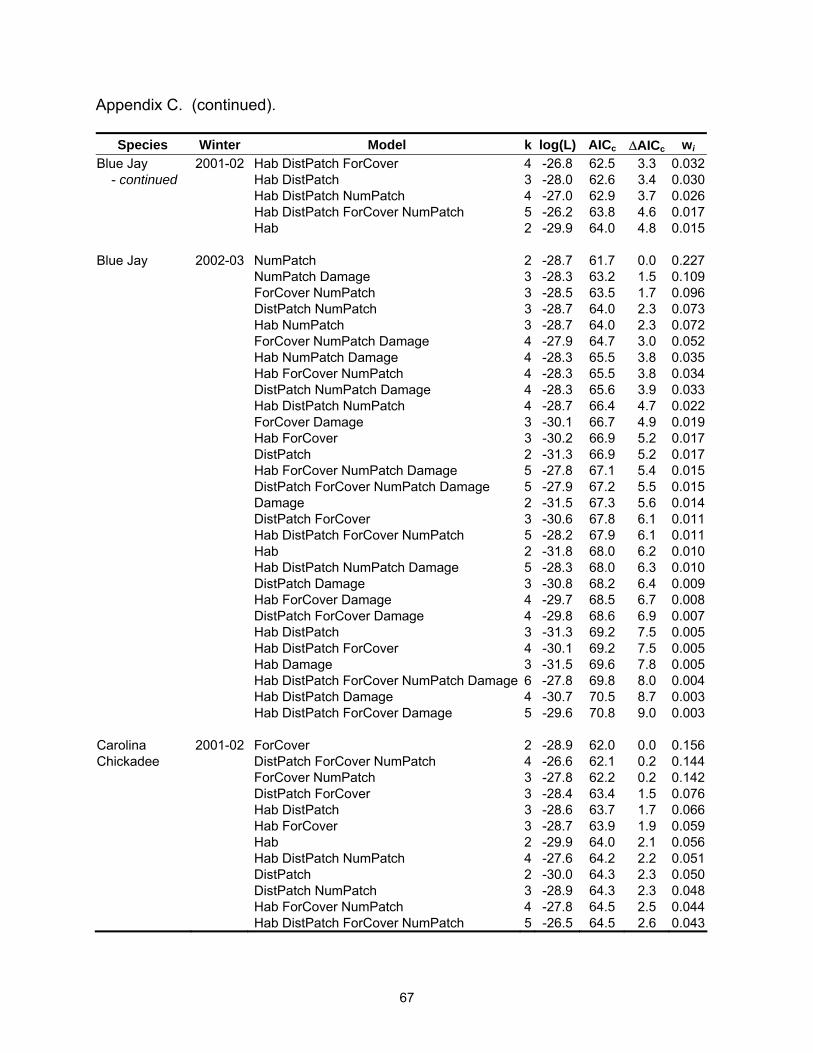
67
Appendix C. (continued).
Species Winter Model k log(L) AICc ∆AICc wi Blue Jay 2001-02 Hab DistPatch ForCover 4 -26.8 62.5 3.3 0.032 - continued Hab DistPatch 3 -28.0 62.6 3.4 0.030 Hab DistPatch NumPatch 4 -27.0 62.9 3.7 0.026 Hab DistPatch ForCover NumPatch 5 -26.2 63.8 4.6 0.017 Hab 2 -29.9 64.0 4.8 0.015 Blue Jay 2002-03 NumPatch 2 -28.7 61.7 0.0 0.227 NumPatch Damage 3 -28.3 63.2 1.5 0.109 ForCover NumPatch 3 -28.5 63.5 1.7 0.096 DistPatch NumPatch 3 -28.7 64.0 2.3 0.073 Hab NumPatch 3 -28.7 64.0 2.3 0.072 ForCover NumPatch Damage 4 -27.9 64.7 3.0 0.052 Hab NumPatch Damage 4 -28.3 65.5 3.8 0.035 Hab ForCover NumPatch 4 -28.3 65.5 3.8 0.034 DistPatch NumPatch Damage 4 -28.3 65.6 3.9 0.033 Hab DistPatch NumPatch 4 -28.7 66.4 4.7 0.022 ForCover Damage 3 -30.1 66.7 4.9 0.019 Hab ForCover 3 -30.2 66.9 5.2 0.017 DistPatch 2 -31.3 66.9 5.2 0.017 Hab ForCover NumPatch Damage 5 -27.8 67.1 5.4 0.015 DistPatch ForCover NumPatch Damage 5 -27.9 67.2 5.5 0.015 Damage 2 -31.5 67.3 5.6 0.014 DistPatch ForCover 3 -30.6 67.8 6.1 0.011 Hab DistPatch ForCover NumPatch 5 -28.2 67.9 6.1 0.011 Hab 2 -31.8 68.0 6.2 0.010 Hab DistPatch NumPatch Damage 5 -28.3 68.0 6.3 0.010 DistPatch Damage 3 -30.8 68.2 6.4 0.009 Hab ForCover Damage 4 -29.7 68.5 6.7 0.008 DistPatch ForCover Damage 4 -29.8 68.6 6.9 0.007 Hab DistPatch 3 -31.3 69.2 7.5 0.005 Hab DistPatch ForCover 4 -30.1 69.2 7.5 0.005 Hab Damage 3 -31.5 69.6 7.8 0.005 Hab DistPatch ForCover NumPatch Damage 6 -27.8 69.8 8.0 0.004 Hab DistPatch Damage 4 -30.7 70.5 8.7 0.003 Hab DistPatch ForCover Damage 5 -29.6 70.8 9.0 0.003 Carolina 2001-02 ForCover 2 -28.9 62.0 0.0 0.156Chickadee DistPatch ForCover NumPatch 4 -26.6 62.1 0.2 0.144 ForCover NumPatch 3 -27.8 62.2 0.2 0.142 DistPatch ForCover 3 -28.4 63.4 1.5 0.076 Hab DistPatch 3 -28.6 63.7 1.7 0.066 Hab ForCover 3 -28.7 63.9 1.9 0.059 Hab 2 -29.9 64.0 2.1 0.056 Hab DistPatch NumPatch 4 -27.6 64.2 2.2 0.051 DistPatch 2 -30.0 64.3 2.3 0.050 DistPatch NumPatch 3 -28.9 64.3 2.3 0.048 Hab ForCover NumPatch 4 -27.8 64.5 2.5 0.044 Hab DistPatch ForCover NumPatch 5 -26.5 64.5 2.6 0.043
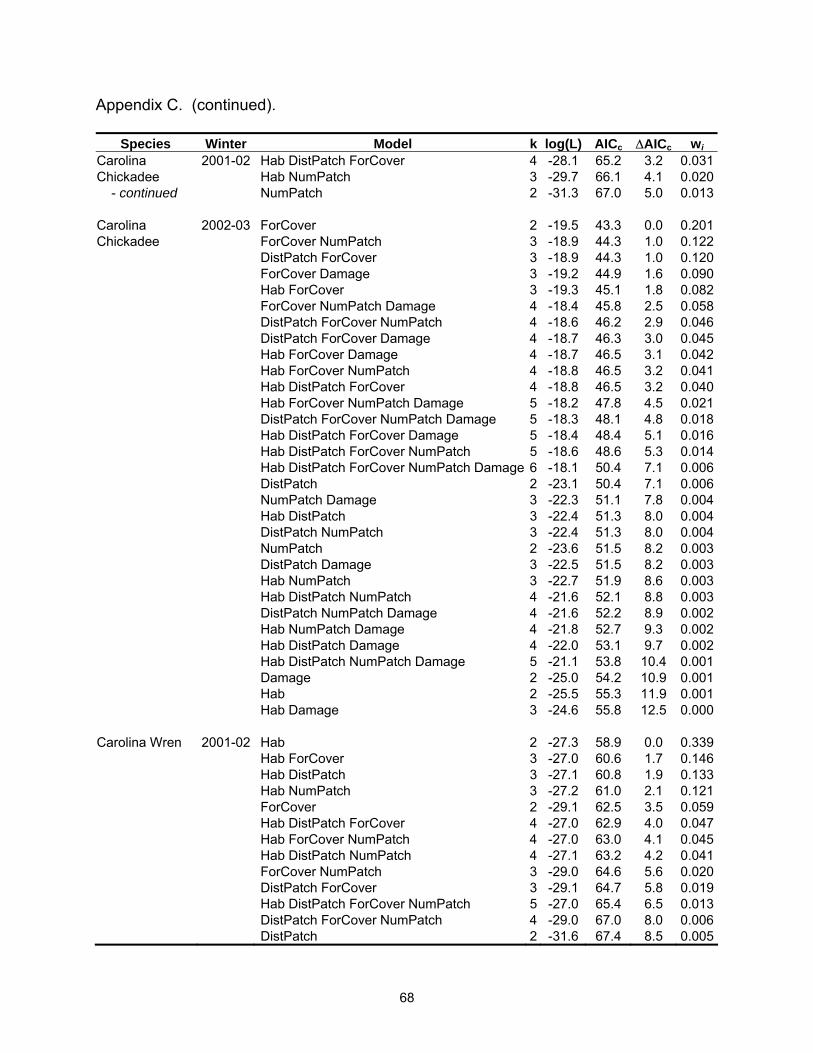
68
Appendix C. (continued).
Species Winter Model k log(L) AICc ∆AICc wi Carolina 2001-02 Hab DistPatch ForCover 4 -28.1 65.2 3.2 0.031Chickadee Hab NumPatch 3 -29.7 66.1 4.1 0.020 - continued NumPatch 2 -31.3 67.0 5.0 0.013 Carolina 2002-03 ForCover 2 -19.5 43.3 0.0 0.201Chickadee ForCover NumPatch 3 -18.9 44.3 1.0 0.122 DistPatch ForCover 3 -18.9 44.3 1.0 0.120 ForCover Damage 3 -19.2 44.9 1.6 0.090 Hab ForCover 3 -19.3 45.1 1.8 0.082 ForCover NumPatch Damage 4 -18.4 45.8 2.5 0.058 DistPatch ForCover NumPatch 4 -18.6 46.2 2.9 0.046 DistPatch ForCover Damage 4 -18.7 46.3 3.0 0.045 Hab ForCover Damage 4 -18.7 46.5 3.1 0.042 Hab ForCover NumPatch 4 -18.8 46.5 3.2 0.041 Hab DistPatch ForCover 4 -18.8 46.5 3.2 0.040 Hab ForCover NumPatch Damage 5 -18.2 47.8 4.5 0.021 DistPatch ForCover NumPatch Damage 5 -18.3 48.1 4.8 0.018 Hab DistPatch ForCover Damage 5 -18.4 48.4 5.1 0.016 Hab DistPatch ForCover NumPatch 5 -18.6 48.6 5.3 0.014 Hab DistPatch ForCover NumPatch Damage 6 -18.1 50.4 7.1 0.006 DistPatch 2 -23.1 50.4 7.1 0.006 NumPatch Damage 3 -22.3 51.1 7.8 0.004 Hab DistPatch 3 -22.4 51.3 8.0 0.004 DistPatch NumPatch 3 -22.4 51.3 8.0 0.004 NumPatch 2 -23.6 51.5 8.2 0.003 DistPatch Damage 3 -22.5 51.5 8.2 0.003 Hab NumPatch 3 -22.7 51.9 8.6 0.003 Hab DistPatch NumPatch 4 -21.6 52.1 8.8 0.003 DistPatch NumPatch Damage 4 -21.6 52.2 8.9 0.002 Hab NumPatch Damage 4 -21.8 52.7 9.3 0.002 Hab DistPatch Damage 4 -22.0 53.1 9.7 0.002 Hab DistPatch NumPatch Damage 5 -21.1 53.8 10.4 0.001 Damage 2 -25.0 54.2 10.9 0.001 Hab 2 -25.5 55.3 11.9 0.001 Hab Damage 3 -24.6 55.8 12.5 0.000 Carolina Wren 2001-02 Hab 2 -27.3 58.9 0.0 0.339 Hab ForCover 3 -27.0 60.6 1.7 0.146 Hab DistPatch 3 -27.1 60.8 1.9 0.133 Hab NumPatch 3 -27.2 61.0 2.1 0.121 ForCover 2 -29.1 62.5 3.5 0.059 Hab DistPatch ForCover 4 -27.0 62.9 4.0 0.047 Hab ForCover NumPatch 4 -27.0 63.0 4.1 0.045 Hab DistPatch NumPatch 4 -27.1 63.2 4.2 0.041 ForCover NumPatch 3 -29.0 64.6 5.6 0.020 DistPatch ForCover 3 -29.1 64.7 5.8 0.019 Hab DistPatch ForCover NumPatch 5 -27.0 65.4 6.5 0.013 DistPatch ForCover NumPatch 4 -29.0 67.0 8.0 0.006 DistPatch 2 -31.6 67.4 8.5 0.005
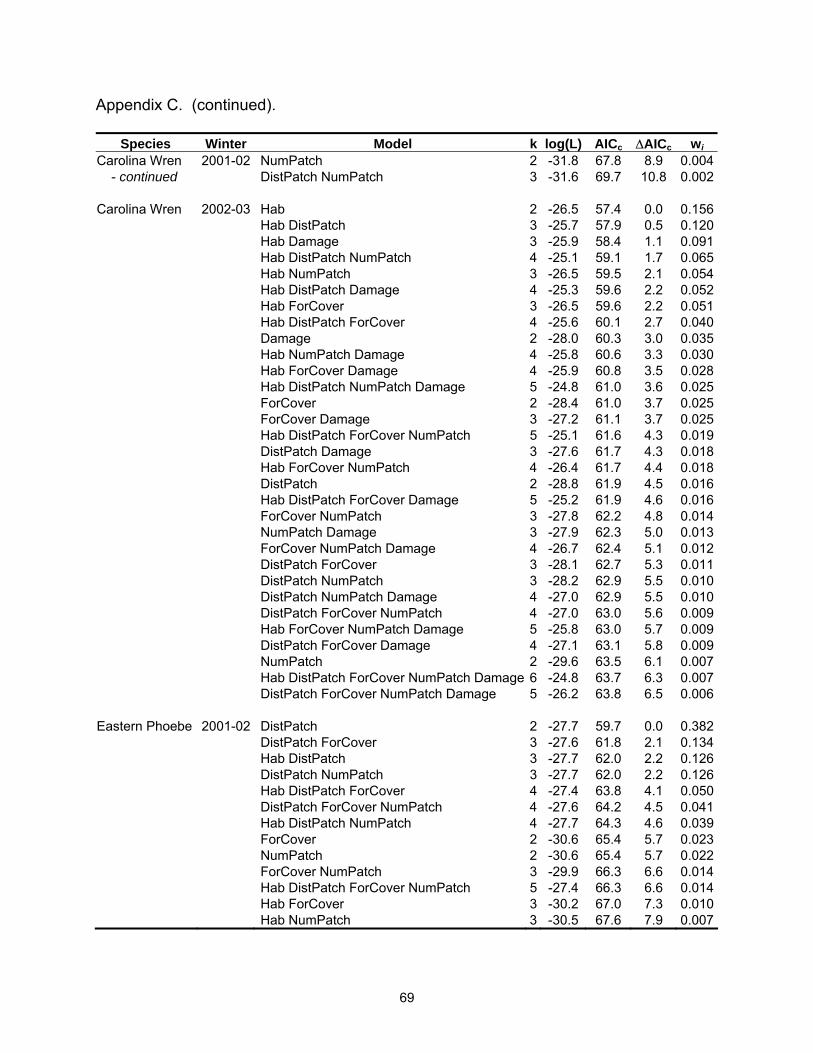
69
Appendix C. (continued).
Species Winter Model k log(L) AICc ∆AICc wi Carolina Wren 2001-02 NumPatch 2 -31.8 67.8 8.9 0.004 - continued DistPatch NumPatch 3 -31.6 69.7 10.8 0.002 Carolina Wren 2002-03 Hab 2 -26.5 57.4 0.0 0.156 Hab DistPatch 3 -25.7 57.9 0.5 0.120 Hab Damage 3 -25.9 58.4 1.1 0.091 Hab DistPatch NumPatch 4 -25.1 59.1 1.7 0.065 Hab NumPatch 3 -26.5 59.5 2.1 0.054 Hab DistPatch Damage 4 -25.3 59.6 2.2 0.052 Hab ForCover 3 -26.5 59.6 2.2 0.051 Hab DistPatch ForCover 4 -25.6 60.1 2.7 0.040 Damage 2 -28.0 60.3 3.0 0.035 Hab NumPatch Damage 4 -25.8 60.6 3.3 0.030 Hab ForCover Damage 4 -25.9 60.8 3.5 0.028 Hab DistPatch NumPatch Damage 5 -24.8 61.0 3.6 0.025 ForCover 2 -28.4 61.0 3.7 0.025 ForCover Damage 3 -27.2 61.1 3.7 0.025 Hab DistPatch ForCover NumPatch 5 -25.1 61.6 4.3 0.019 DistPatch Damage 3 -27.6 61.7 4.3 0.018 Hab ForCover NumPatch 4 -26.4 61.7 4.4 0.018 DistPatch 2 -28.8 61.9 4.5 0.016 Hab DistPatch ForCover Damage 5 -25.2 61.9 4.6 0.016 ForCover NumPatch 3 -27.8 62.2 4.8 0.014 NumPatch Damage 3 -27.9 62.3 5.0 0.013 ForCover NumPatch Damage 4 -26.7 62.4 5.1 0.012 DistPatch ForCover 3 -28.1 62.7 5.3 0.011 DistPatch NumPatch 3 -28.2 62.9 5.5 0.010 DistPatch NumPatch Damage 4 -27.0 62.9 5.5 0.010 DistPatch ForCover NumPatch 4 -27.0 63.0 5.6 0.009 Hab ForCover NumPatch Damage 5 -25.8 63.0 5.7 0.009 DistPatch ForCover Damage 4 -27.1 63.1 5.8 0.009 NumPatch 2 -29.6 63.5 6.1 0.007 Hab DistPatch ForCover NumPatch Damage 6 -24.8 63.7 6.3 0.007 DistPatch ForCover NumPatch Damage 5 -26.2 63.8 6.5 0.006 Eastern Phoebe 2001-02 DistPatch 2 -27.7 59.7 0.0 0.382 DistPatch ForCover 3 -27.6 61.8 2.1 0.134 Hab DistPatch 3 -27.7 62.0 2.2 0.126 DistPatch NumPatch 3 -27.7 62.0 2.2 0.126 Hab DistPatch ForCover 4 -27.4 63.8 4.1 0.050 DistPatch ForCover NumPatch 4 -27.6 64.2 4.5 0.041 Hab DistPatch NumPatch 4 -27.7 64.3 4.6 0.039 ForCover 2 -30.6 65.4 5.7 0.023 NumPatch 2 -30.6 65.4 5.7 0.022 ForCover NumPatch 3 -29.9 66.3 6.6 0.014 Hab DistPatch ForCover NumPatch 5 -27.4 66.3 6.6 0.014 Hab ForCover 3 -30.2 67.0 7.3 0.010 Hab NumPatch 3 -30.5 67.6 7.9 0.007
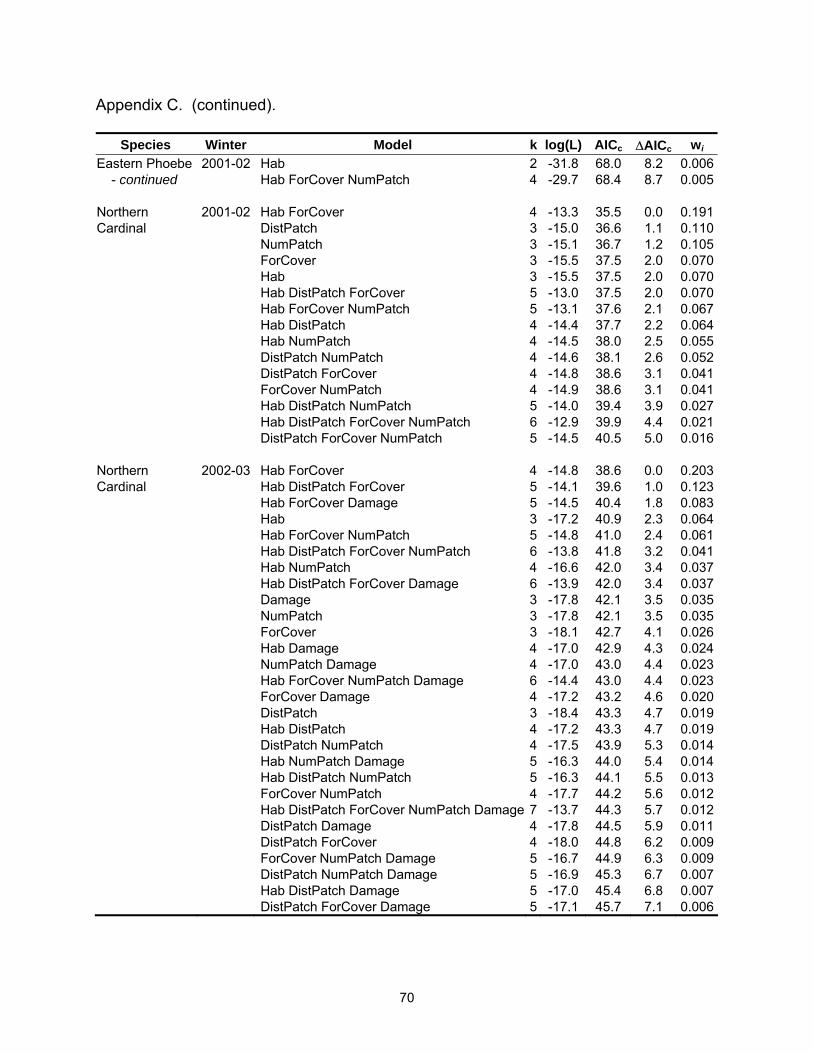
70
Appendix C. (continued).
Species Winter Model k log(L) AICc ∆AICc wi Eastern Phoebe 2001-02 Hab 2 -31.8 68.0 8.2 0.006 - continued Hab ForCover NumPatch 4 -29.7 68.4 8.7 0.005 Northern 2001-02 Hab ForCover 4 -13.3 35.5 0.0 0.191Cardinal DistPatch 3 -15.0 36.6 1.1 0.110 NumPatch 3 -15.1 36.7 1.2 0.105 ForCover 3 -15.5 37.5 2.0 0.070 Hab 3 -15.5 37.5 2.0 0.070 Hab DistPatch ForCover 5 -13.0 37.5 2.0 0.070 Hab ForCover NumPatch 5 -13.1 37.6 2.1 0.067 Hab DistPatch 4 -14.4 37.7 2.2 0.064 Hab NumPatch 4 -14.5 38.0 2.5 0.055 DistPatch NumPatch 4 -14.6 38.1 2.6 0.052 DistPatch ForCover 4 -14.8 38.6 3.1 0.041 ForCover NumPatch 4 -14.9 38.6 3.1 0.041 Hab DistPatch NumPatch 5 -14.0 39.4 3.9 0.027 Hab DistPatch ForCover NumPatch 6 -12.9 39.9 4.4 0.021 DistPatch ForCover NumPatch 5 -14.5 40.5 5.0 0.016 Northern 2002-03 Hab ForCover 4 -14.8 38.6 0.0 0.203Cardinal Hab DistPatch ForCover 5 -14.1 39.6 1.0 0.123 Hab ForCover Damage 5 -14.5 40.4 1.8 0.083 Hab 3 -17.2 40.9 2.3 0.064 Hab ForCover NumPatch 5 -14.8 41.0 2.4 0.061 Hab DistPatch ForCover NumPatch 6 -13.8 41.8 3.2 0.041 Hab NumPatch 4 -16.6 42.0 3.4 0.037 Hab DistPatch ForCover Damage 6 -13.9 42.0 3.4 0.037 Damage 3 -17.8 42.1 3.5 0.035 NumPatch 3 -17.8 42.1 3.5 0.035 ForCover 3 -18.1 42.7 4.1 0.026 Hab Damage 4 -17.0 42.9 4.3 0.024 NumPatch Damage 4 -17.0 43.0 4.4 0.023 Hab ForCover NumPatch Damage 6 -14.4 43.0 4.4 0.023 ForCover Damage 4 -17.2 43.2 4.6 0.020 DistPatch 3 -18.4 43.3 4.7 0.019 Hab DistPatch 4 -17.2 43.3 4.7 0.019 DistPatch NumPatch 4 -17.5 43.9 5.3 0.014 Hab NumPatch Damage 5 -16.3 44.0 5.4 0.014 Hab DistPatch NumPatch 5 -16.3 44.1 5.5 0.013 ForCover NumPatch 4 -17.7 44.2 5.6 0.012 Hab DistPatch ForCover NumPatch Damage 7 -13.7 44.3 5.7 0.012 DistPatch Damage 4 -17.8 44.5 5.9 0.011 DistPatch ForCover 4 -18.0 44.8 6.2 0.009 ForCover NumPatch Damage 5 -16.7 44.9 6.3 0.009 DistPatch NumPatch Damage 5 -16.9 45.3 6.7 0.007 Hab DistPatch Damage 5 -17.0 45.4 6.8 0.007 DistPatch ForCover Damage 5 -17.1 45.7 7.1 0.006
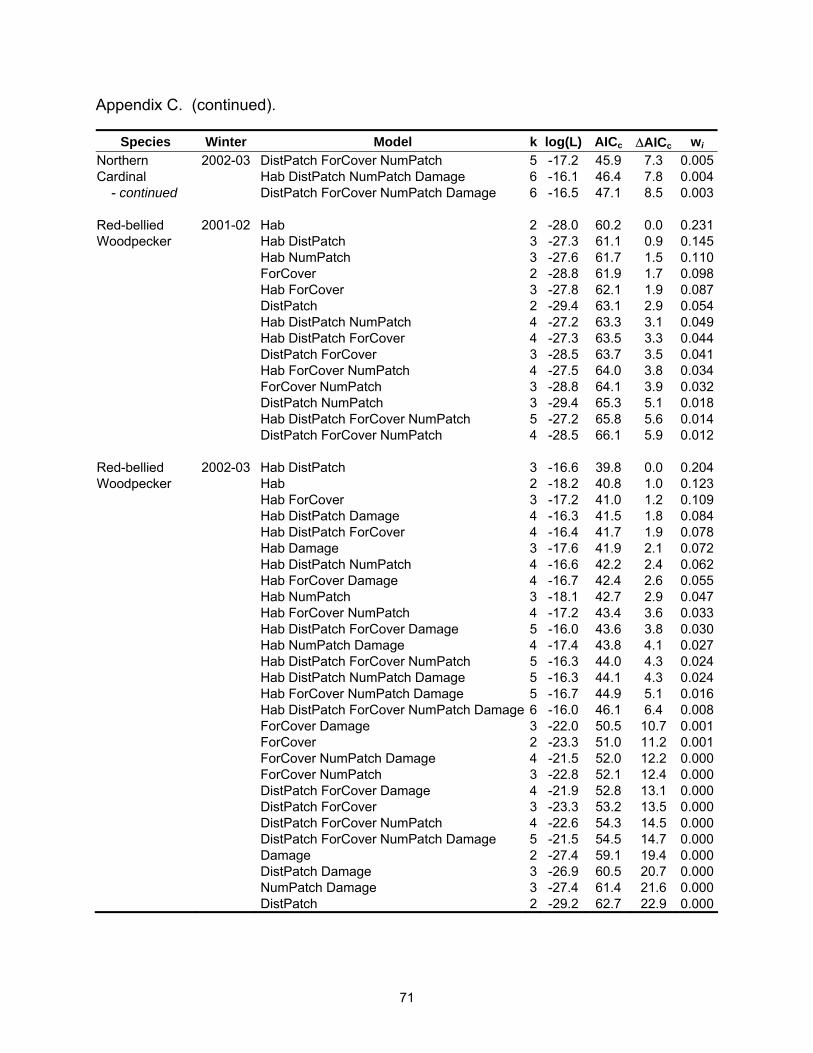
71
Appendix C. (continued).
Species Winter Model k log(L) AICc ∆AICc wi Northern 2002-03 DistPatch ForCover NumPatch 5 -17.2 45.9 7.3 0.005Cardinal Hab DistPatch NumPatch Damage 6 -16.1 46.4 7.8 0.004 - continued DistPatch ForCover NumPatch Damage 6 -16.5 47.1 8.5 0.003 Red-bellied 2001-02 Hab 2 -28.0 60.2 0.0 0.231Woodpecker Hab DistPatch 3 -27.3 61.1 0.9 0.145 Hab NumPatch 3 -27.6 61.7 1.5 0.110 ForCover 2 -28.8 61.9 1.7 0.098 Hab ForCover 3 -27.8 62.1 1.9 0.087 DistPatch 2 -29.4 63.1 2.9 0.054 Hab DistPatch NumPatch 4 -27.2 63.3 3.1 0.049 Hab DistPatch ForCover 4 -27.3 63.5 3.3 0.044 DistPatch ForCover 3 -28.5 63.7 3.5 0.041 Hab ForCover NumPatch 4 -27.5 64.0 3.8 0.034 ForCover NumPatch 3 -28.8 64.1 3.9 0.032 DistPatch NumPatch 3 -29.4 65.3 5.1 0.018 Hab DistPatch ForCover NumPatch 5 -27.2 65.8 5.6 0.014 DistPatch ForCover NumPatch 4 -28.5 66.1 5.9 0.012 Red-bellied 2002-03 Hab DistPatch 3 -16.6 39.8 0.0 0.204Woodpecker Hab 2 -18.2 40.8 1.0 0.123 Hab ForCover 3 -17.2 41.0 1.2 0.109 Hab DistPatch Damage 4 -16.3 41.5 1.8 0.084 Hab DistPatch ForCover 4 -16.4 41.7 1.9 0.078 Hab Damage 3 -17.6 41.9 2.1 0.072 Hab DistPatch NumPatch 4 -16.6 42.2 2.4 0.062 Hab ForCover Damage 4 -16.7 42.4 2.6 0.055 Hab NumPatch 3 -18.1 42.7 2.9 0.047 Hab ForCover NumPatch 4 -17.2 43.4 3.6 0.033 Hab DistPatch ForCover Damage 5 -16.0 43.6 3.8 0.030 Hab NumPatch Damage 4 -17.4 43.8 4.1 0.027 Hab DistPatch ForCover NumPatch 5 -16.3 44.0 4.3 0.024 Hab DistPatch NumPatch Damage 5 -16.3 44.1 4.3 0.024 Hab ForCover NumPatch Damage 5 -16.7 44.9 5.1 0.016 Hab DistPatch ForCover NumPatch Damage 6 -16.0 46.1 6.4 0.008 ForCover Damage 3 -22.0 50.5 10.7 0.001 ForCover 2 -23.3 51.0 11.2 0.001 ForCover NumPatch Damage 4 -21.5 52.0 12.2 0.000 ForCover NumPatch 3 -22.8 52.1 12.4 0.000 DistPatch ForCover Damage 4 -21.9 52.8 13.1 0.000 DistPatch ForCover 3 -23.3 53.2 13.5 0.000 DistPatch ForCover NumPatch 4 -22.6 54.3 14.5 0.000 DistPatch ForCover NumPatch Damage 5 -21.5 54.5 14.7 0.000 Damage 2 -27.4 59.1 19.4 0.000 DistPatch Damage 3 -26.9 60.5 20.7 0.000 NumPatch Damage 3 -27.4 61.4 21.6 0.000 DistPatch 2 -29.2 62.7 22.9 0.000
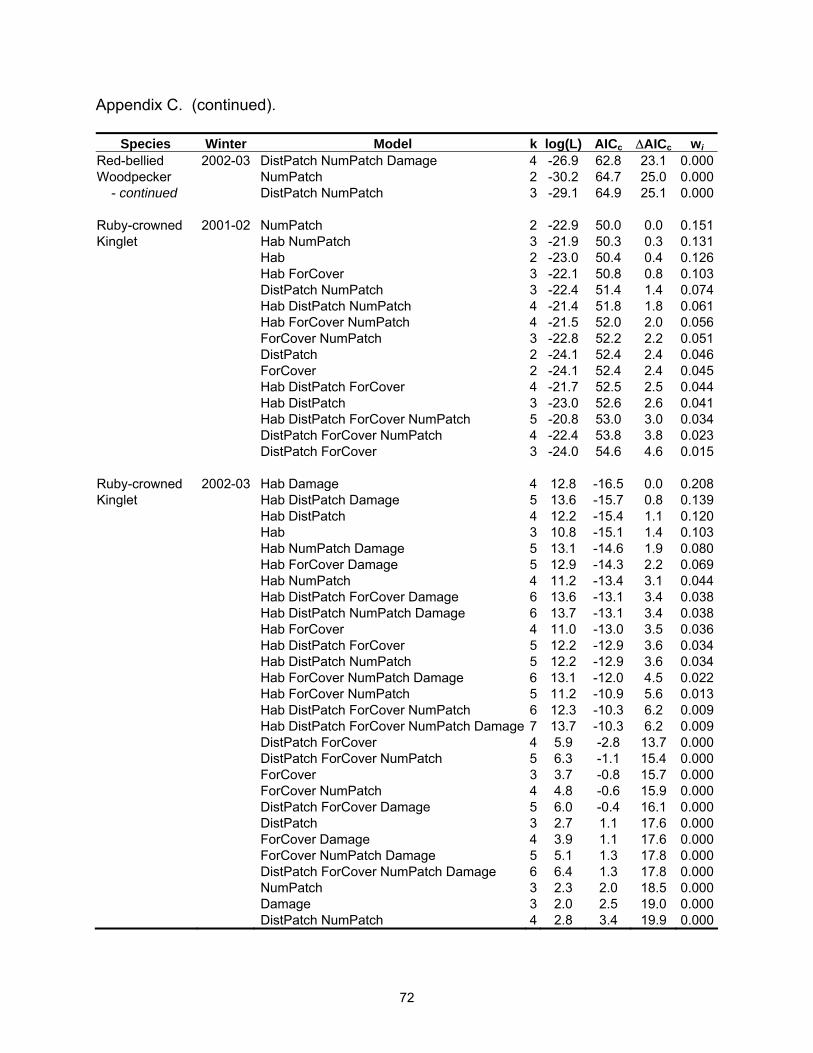
72
Appendix C. (continued).
Species Winter Model k log(L) AICc ∆AICc wi Red-bellied 2002-03 DistPatch NumPatch Damage 4 -26.9 62.8 23.1 0.000Woodpecker NumPatch 2 -30.2 64.7 25.0 0.000 - continued DistPatch NumPatch 3 -29.1 64.9 25.1 0.000 Ruby-crowned 2001-02 NumPatch 2 -22.9 50.0 0.0 0.151Kinglet Hab NumPatch 3 -21.9 50.3 0.3 0.131 Hab 2 -23.0 50.4 0.4 0.126 Hab ForCover 3 -22.1 50.8 0.8 0.103 DistPatch NumPatch 3 -22.4 51.4 1.4 0.074 Hab DistPatch NumPatch 4 -21.4 51.8 1.8 0.061 Hab ForCover NumPatch 4 -21.5 52.0 2.0 0.056 ForCover NumPatch 3 -22.8 52.2 2.2 0.051 DistPatch 2 -24.1 52.4 2.4 0.046 ForCover 2 -24.1 52.4 2.4 0.045 Hab DistPatch ForCover 4 -21.7 52.5 2.5 0.044 Hab DistPatch 3 -23.0 52.6 2.6 0.041 Hab DistPatch ForCover NumPatch 5 -20.8 53.0 3.0 0.034 DistPatch ForCover NumPatch 4 -22.4 53.8 3.8 0.023 DistPatch ForCover 3 -24.0 54.6 4.6 0.015 Ruby-crowned 2002-03 Hab Damage 4 12.8 -16.5 0.0 0.208Kinglet Hab DistPatch Damage 5 13.6 -15.7 0.8 0.139 Hab DistPatch 4 12.2 -15.4 1.1 0.120 Hab 3 10.8 -15.1 1.4 0.103 Hab NumPatch Damage 5 13.1 -14.6 1.9 0.080 Hab ForCover Damage 5 12.9 -14.3 2.2 0.069 Hab NumPatch 4 11.2 -13.4 3.1 0.044 Hab DistPatch ForCover Damage 6 13.6 -13.1 3.4 0.038 Hab DistPatch NumPatch Damage 6 13.7 -13.1 3.4 0.038 Hab ForCover 4 11.0 -13.0 3.5 0.036 Hab DistPatch ForCover 5 12.2 -12.9 3.6 0.034 Hab DistPatch NumPatch 5 12.2 -12.9 3.6 0.034 Hab ForCover NumPatch Damage 6 13.1 -12.0 4.5 0.022 Hab ForCover NumPatch 5 11.2 -10.9 5.6 0.013 Hab DistPatch ForCover NumPatch 6 12.3 -10.3 6.2 0.009 Hab DistPatch ForCover NumPatch Damage 7 13.7 -10.3 6.2 0.009 DistPatch ForCover 4 5.9 -2.8 13.7 0.000 DistPatch ForCover NumPatch 5 6.3 -1.1 15.4 0.000 ForCover 3 3.7 -0.8 15.7 0.000 ForCover NumPatch 4 4.8 -0.6 15.9 0.000 DistPatch ForCover Damage 5 6.0 -0.4 16.1 0.000 DistPatch 3 2.7 1.1 17.6 0.000 ForCover Damage 4 3.9 1.1 17.6 0.000 ForCover NumPatch Damage 5 5.1 1.3 17.8 0.000 DistPatch ForCover NumPatch Damage 6 6.4 1.3 17.8 0.000 NumPatch 3 2.3 2.0 18.5 0.000 Damage 3 2.0 2.5 19.0 0.000 DistPatch NumPatch 4 2.8 3.4 19.9 0.000
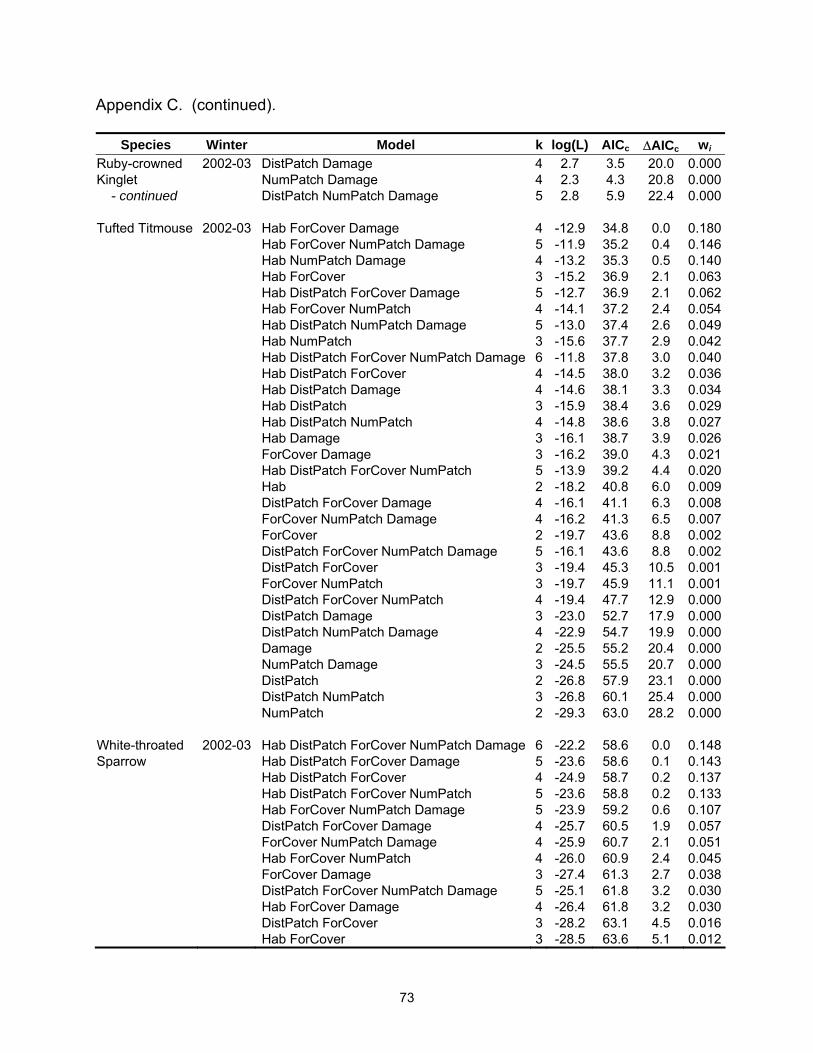
73
Appendix C. (continued).
Species Winter Model k log(L) AICc ∆AICc wi Ruby-crowned 2002-03 DistPatch Damage 4 2.7 3.5 20.0 0.000Kinglet NumPatch Damage 4 2.3 4.3 20.8 0.000 - continued DistPatch NumPatch Damage 5 2.8 5.9 22.4 0.000 Tufted Titmouse 2002-03 Hab ForCover Damage 4 -12.9 34.8 0.0 0.180 Hab ForCover NumPatch Damage 5 -11.9 35.2 0.4 0.146 Hab NumPatch Damage 4 -13.2 35.3 0.5 0.140 Hab ForCover 3 -15.2 36.9 2.1 0.063 Hab DistPatch ForCover Damage 5 -12.7 36.9 2.1 0.062 Hab ForCover NumPatch 4 -14.1 37.2 2.4 0.054 Hab DistPatch NumPatch Damage 5 -13.0 37.4 2.6 0.049 Hab NumPatch 3 -15.6 37.7 2.9 0.042 Hab DistPatch ForCover NumPatch Damage 6 -11.8 37.8 3.0 0.040 Hab DistPatch ForCover 4 -14.5 38.0 3.2 0.036 Hab DistPatch Damage 4 -14.6 38.1 3.3 0.034 Hab DistPatch 3 -15.9 38.4 3.6 0.029 Hab DistPatch NumPatch 4 -14.8 38.6 3.8 0.027 Hab Damage 3 -16.1 38.7 3.9 0.026 ForCover Damage 3 -16.2 39.0 4.3 0.021 Hab DistPatch ForCover NumPatch 5 -13.9 39.2 4.4 0.020 Hab 2 -18.2 40.8 6.0 0.009 DistPatch ForCover Damage 4 -16.1 41.1 6.3 0.008 ForCover NumPatch Damage 4 -16.2 41.3 6.5 0.007 ForCover 2 -19.7 43.6 8.8 0.002 DistPatch ForCover NumPatch Damage 5 -16.1 43.6 8.8 0.002 DistPatch ForCover 3 -19.4 45.3 10.5 0.001 ForCover NumPatch 3 -19.7 45.9 11.1 0.001 DistPatch ForCover NumPatch 4 -19.4 47.7 12.9 0.000 DistPatch Damage 3 -23.0 52.7 17.9 0.000 DistPatch NumPatch Damage 4 -22.9 54.7 19.9 0.000 Damage 2 -25.5 55.2 20.4 0.000 NumPatch Damage 3 -24.5 55.5 20.7 0.000 DistPatch 2 -26.8 57.9 23.1 0.000 DistPatch NumPatch 3 -26.8 60.1 25.4 0.000 NumPatch 2 -29.3 63.0 28.2 0.000 White-throated 2002-03 Hab DistPatch ForCover NumPatch Damage 6 -22.2 58.6 0.0 0.148Sparrow Hab DistPatch ForCover Damage 5 -23.6 58.6 0.1 0.143 Hab DistPatch ForCover 4 -24.9 58.7 0.2 0.137 Hab DistPatch ForCover NumPatch 5 -23.6 58.8 0.2 0.133 Hab ForCover NumPatch Damage 5 -23.9 59.2 0.6 0.107 DistPatch ForCover Damage 4 -25.7 60.5 1.9 0.057 ForCover NumPatch Damage 4 -25.9 60.7 2.1 0.051 Hab ForCover NumPatch 4 -26.0 60.9 2.4 0.045 ForCover Damage 3 -27.4 61.3 2.7 0.038 DistPatch ForCover NumPatch Damage 5 -25.1 61.8 3.2 0.030 Hab ForCover Damage 4 -26.4 61.8 3.2 0.030 DistPatch ForCover 3 -28.2 63.1 4.5 0.016 Hab ForCover 3 -28.5 63.6 5.1 0.012
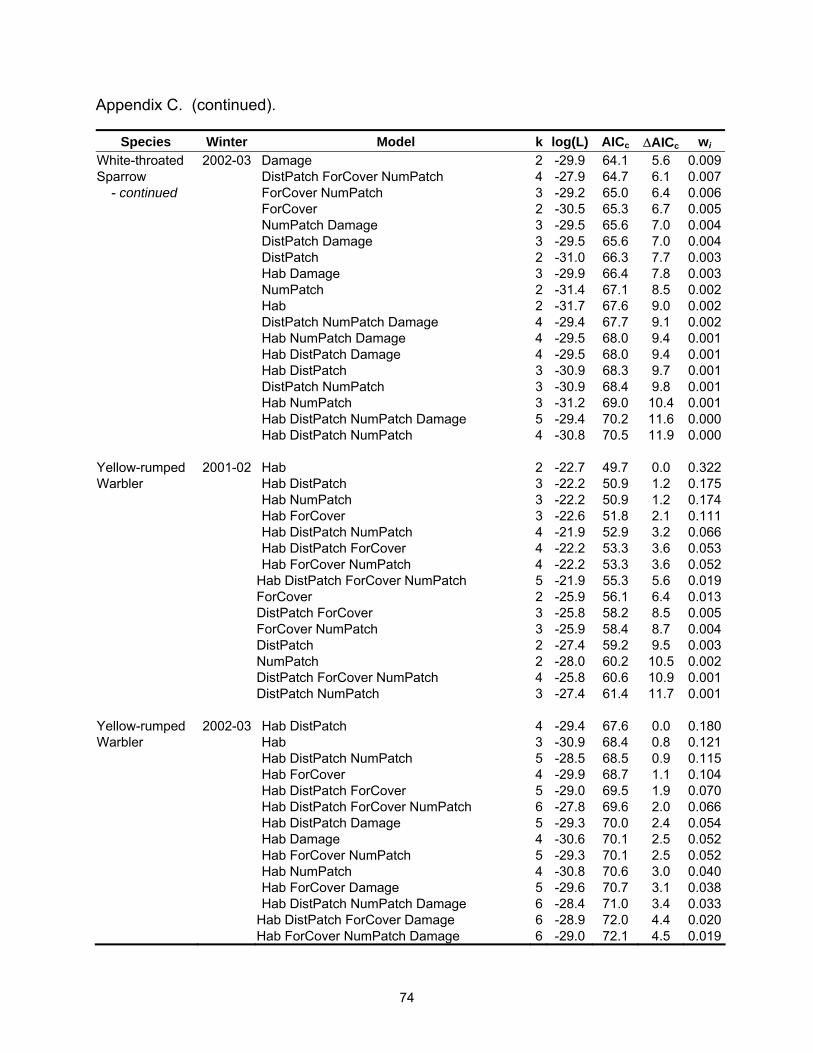
74
Appendix C. (continued).
Species Winter Model k log(L) AICc ∆AICc wi White-throated 2002-03 Damage 2 -29.9 64.1 5.6 0.009Sparrow DistPatch ForCover NumPatch 4 -27.9 64.7 6.1 0.007 - continued ForCover NumPatch 3 -29.2 65.0 6.4 0.006 ForCover 2 -30.5 65.3 6.7 0.005 NumPatch Damage 3 -29.5 65.6 7.0 0.004 DistPatch Damage 3 -29.5 65.6 7.0 0.004 DistPatch 2 -31.0 66.3 7.7 0.003 Hab Damage 3 -29.9 66.4 7.8 0.003 NumPatch 2 -31.4 67.1 8.5 0.002 Hab 2 -31.7 67.6 9.0 0.002 DistPatch NumPatch Damage 4 -29.4 67.7 9.1 0.002 Hab NumPatch Damage 4 -29.5 68.0 9.4 0.001 Hab DistPatch Damage 4 -29.5 68.0 9.4 0.001 Hab DistPatch 3 -30.9 68.3 9.7 0.001 DistPatch NumPatch 3 -30.9 68.4 9.8 0.001 Hab NumPatch 3 -31.2 69.0 10.4 0.001 Hab DistPatch NumPatch Damage 5 -29.4 70.2 11.6 0.000 Hab DistPatch NumPatch 4 -30.8 70.5 11.9 0.000 Yellow-rumped 2001-02 Hab 2 -22.7 49.7 0.0 0.322Warbler Hab DistPatch 3 -22.2 50.9 1.2 0.175 Hab NumPatch 3 -22.2 50.9 1.2 0.174 Hab ForCover 3 -22.6 51.8 2.1 0.111 Hab DistPatch NumPatch 4 -21.9 52.9 3.2 0.066 Hab DistPatch ForCover 4 -22.2 53.3 3.6 0.053 Hab ForCover NumPatch 4 -22.2 53.3 3.6 0.052 Hab DistPatch ForCover NumPatch 5 -21.9 55.3 5.6 0.019 ForCover 2 -25.9 56.1 6.4 0.013 DistPatch ForCover 3 -25.8 58.2 8.5 0.005 ForCover NumPatch 3 -25.9 58.4 8.7 0.004 DistPatch 2 -27.4 59.2 9.5 0.003 NumPatch 2 -28.0 60.2 10.5 0.002 DistPatch ForCover NumPatch 4 -25.8 60.6 10.9 0.001 DistPatch NumPatch 3 -27.4 61.4 11.7 0.001 Yellow-rumped 2002-03 Hab DistPatch 4 -29.4 67.6 0.0 0.180Warbler Hab 3 -30.9 68.4 0.8 0.121 Hab DistPatch NumPatch 5 -28.5 68.5 0.9 0.115 Hab ForCover 4 -29.9 68.7 1.1 0.104 Hab DistPatch ForCover 5 -29.0 69.5 1.9 0.070 Hab DistPatch ForCover NumPatch 6 -27.8 69.6 2.0 0.066 Hab DistPatch Damage 5 -29.3 70.0 2.4 0.054 Hab Damage 4 -30.6 70.1 2.5 0.052 Hab ForCover NumPatch 5 -29.3 70.1 2.5 0.052 Hab NumPatch 4 -30.8 70.6 3.0 0.040 Hab ForCover Damage 5 -29.6 70.7 3.1 0.038 Hab DistPatch NumPatch Damage 6 -28.4 71.0 3.4 0.033 Hab DistPatch ForCover Damage 6 -28.9 72.0 4.4 0.020 Hab ForCover NumPatch Damage 6 -29.0 72.1 4.5 0.019
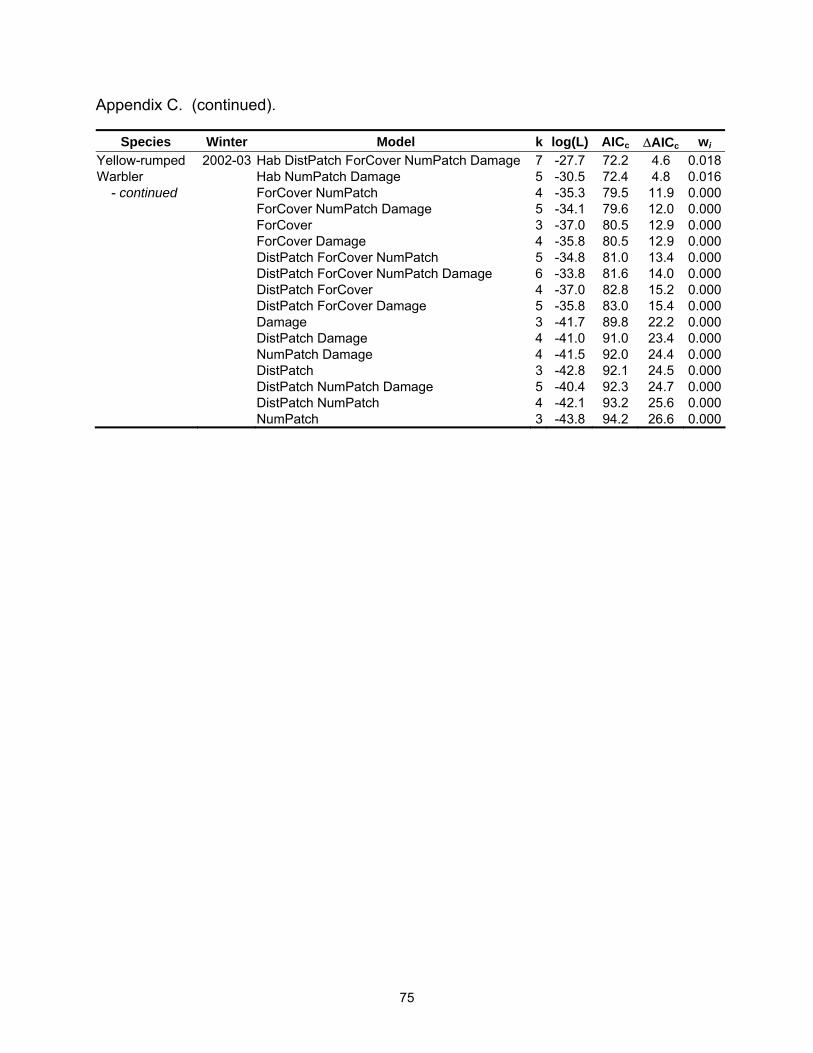
75
Appendix C. (continued).
Species Winter Model k log(L) AICc ∆AICc wi Yellow-rumped 2002-03 Hab DistPatch ForCover NumPatch Damage 7 -27.7 72.2 4.6 0.018Warbler Hab NumPatch Damage 5 -30.5 72.4 4.8 0.016 - continued ForCover NumPatch 4 -35.3 79.5 11.9 0.000 ForCover NumPatch Damage 5 -34.1 79.6 12.0 0.000 ForCover 3 -37.0 80.5 12.9 0.000 ForCover Damage 4 -35.8 80.5 12.9 0.000 DistPatch ForCover NumPatch 5 -34.8 81.0 13.4 0.000 DistPatch ForCover NumPatch Damage 6 -33.8 81.6 14.0 0.000 DistPatch ForCover 4 -37.0 82.8 15.2 0.000 DistPatch ForCover Damage 5 -35.8 83.0 15.4 0.000 Damage 3 -41.7 89.8 22.2 0.000 DistPatch Damage 4 -41.0 91.0 23.4 0.000 NumPatch Damage 4 -41.5 92.0 24.4 0.000 DistPatch 3 -42.8 92.1 24.5 0.000 DistPatch NumPatch Damage 5 -40.4 92.3 24.7 0.000 DistPatch NumPatch 4 -42.1 93.2 25.6 0.000 NumPatch 3 -43.8 94.2 26.6 0.000
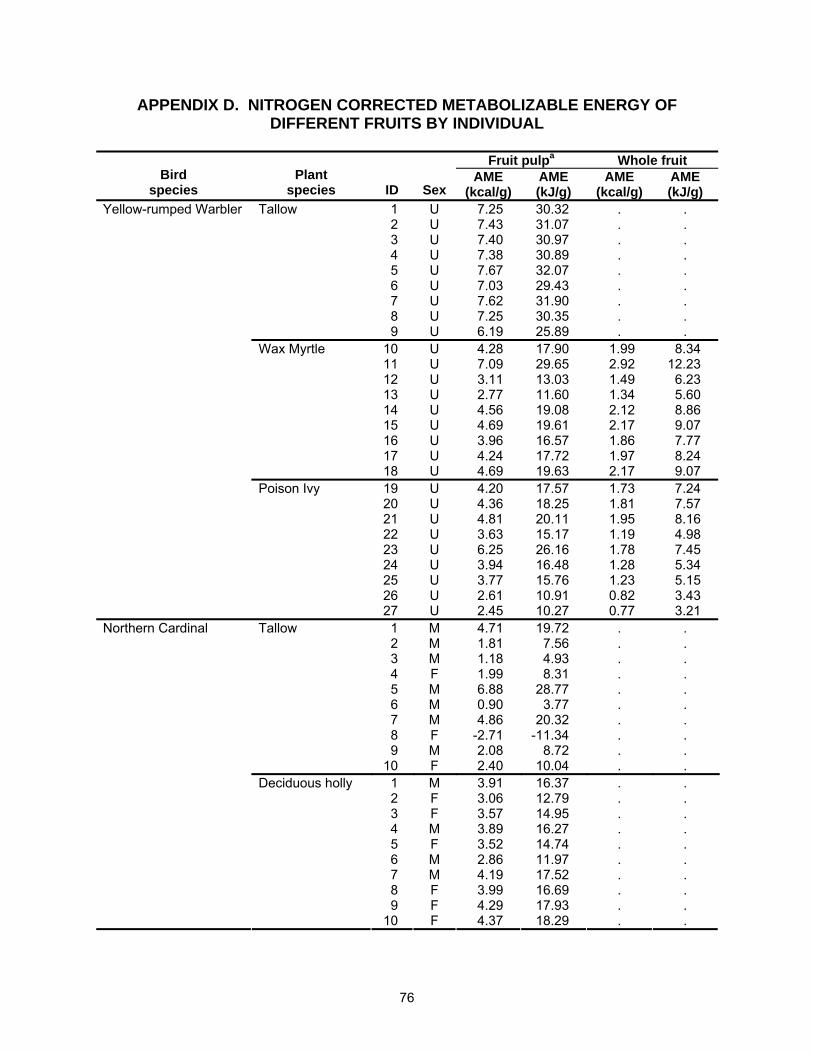
76
APPENDIX D. NITROGEN CORRECTED METABOLIZABLE ENERGY OF DIFFERENT FRUITS BY INDIVIDUAL
Fruit pulpa Whole fruit
Bird species
Plant species ID Sex
AME (kcal/g)
AME (kJ/g)
AME (kcal/g)
AME (kJ/g)
1 U 7.25 30.32 . . 2 U 7.43 31.07 . . 3 U 7.40 30.97 . . 4 U 7.38 30.89 . . 5 U 7.67 32.07 . . 6 U 7.03 29.43 . . 7 U 7.62 31.90 . . 8 U 7.25 30.35 . .
Tallow
9 U 6.19 25.89 . . 10 U 4.28 17.90 1.99 8.34 11 U 7.09 29.65 2.92 12.23 12 U 3.11 13.03 1.49 6.23 13 U 2.77 11.60 1.34 5.60 14 U 4.56 19.08 2.12 8.86 15 U 4.69 19.61 2.17 9.07 16 U 3.96 16.57 1.86 7.77 17 U 4.24 17.72 1.97 8.24
Wax Myrtle
18 U 4.69 19.63 2.17 9.07 19 U 4.20 17.57 1.73 7.24 20 U 4.36 18.25 1.81 7.57 21 U 4.81 20.11 1.95 8.16 22 U 3.63 15.17 1.19 4.98 23 U 6.25 26.16 1.78 7.45 24 U 3.94 16.48 1.28 5.34 25 U 3.77 15.76 1.23 5.15 26 U 2.61 10.91 0.82 3.43
Yellow-rumped Warbler
Poison Ivy
27 U 2.45 10.27 0.77 3.21 1 M 4.71 19.72 . . 2 M 1.81 7.56 . . 3 M 1.18 4.93 . . 4 F 1.99 8.31 . . 5 M 6.88 28.77 . . 6 M 0.90 3.77 . . 7 M 4.86 20.32 . . 8 F -2.71 -11.34 . . 9 M 2.08 8.72 . .
Northern Cardinal Tallow
10 F 2.40 10.04 . . 1 M 3.91 16.37 . . 2 F 3.06 12.79 . . 3 F 3.57 14.95 . . 4 M 3.89 16.27 . . 5 F 3.52 14.74 . . 6 M 2.86 11.97 . . 7 M 4.19 17.52 . . 8 F 3.99 16.69 . . 9 F 4.29 17.93 . .
Deciduous holly
10 F 4.37 18.29 . .
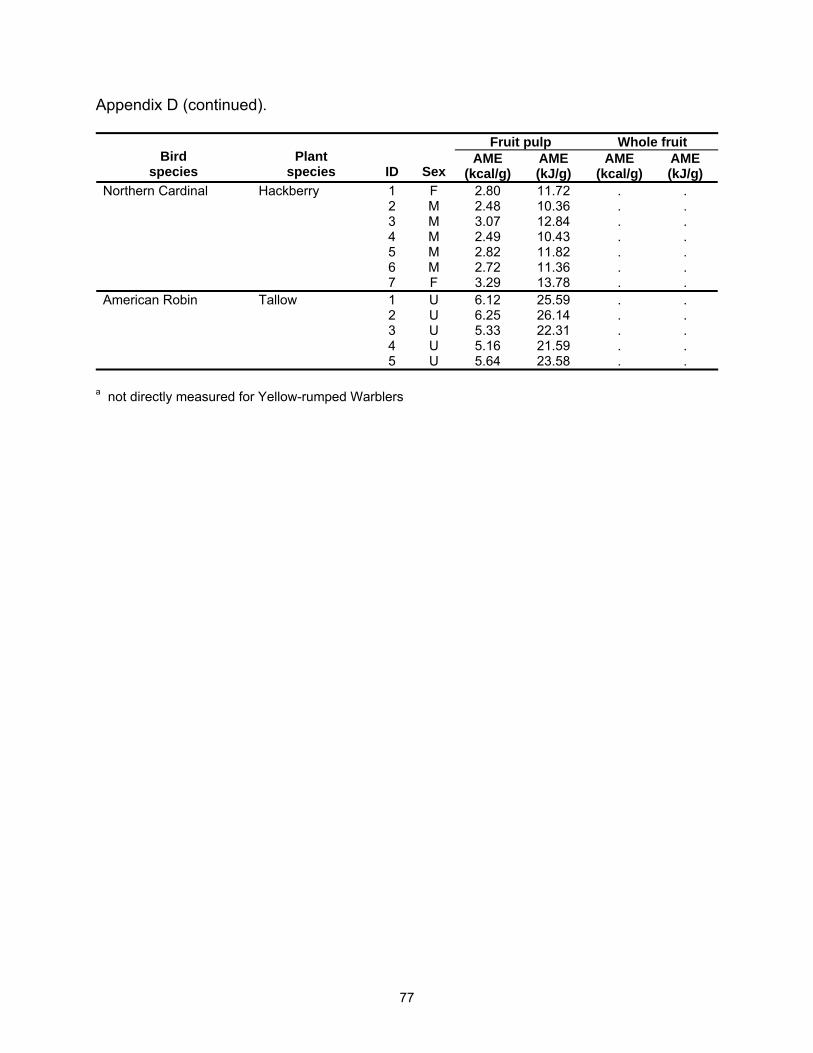
77
Appendix D (continued).
Fruit pulp Whole fruit Bird
species Plant
species ID Sex AME
(kcal/g) AME (kJ/g)
AME (kcal/g)
AME (kJ/g)
1 F 2.80 11.72 . . 2 M 2.48 10.36 . . 3 M 3.07 12.84 . . 4 M 2.49 10.43 . . 5 M 2.82 11.82 . . 6 M 2.72 11.36 . .
Northern Cardinal Hackberry
7 F 3.29 13.78 . . 1 U 6.12 25.59 . . 2 U 6.25 26.14 . . 3 U 5.33 22.31 . . 4 U 5.16 21.59 . .
American Robin Tallow
5 U 5.64 23.58 . .
a not directly measured for Yellow-rumped Warblers
78
VITA
Michael Baldwin was born in Rapid City, South Dakota, to parents Colleen and
John. He developed an interest in wildlife and the outdoors at an early age. Most of his
childhood was spent in and around the Black Hills area where many days where spent
hiking, camping and exploring the pine forests and granite outcroppings. He graduated
from Belle Fourche High School, in Belle Fourche, South Dakota, in May 1991. He
attended the University of Nebraska for two years, before transferring to the University
of Wyoming where he received a Bachelor of Science degree with a double major in
wildlife biology and management and in biology in May 1997. In July of that year, he
accepted a position as an ecologist with the United States Geological Survey, National
Wetlands Research Center in Lafayette, Louisiana, where he is still employed. In 2001,
he entered graduate school at Louisiana State University. He is happily married to wife
Heather. Michael is a candidate for a Master of Science degree in wildlife.