Embed Size (px)
Citation preview

0
ANIMAL FAT (TALLOW) AS FUEL FOR STATIONARY INTERNAL COMBUSTION ENGINES
by
JAKUB PIASZYK
A thesis submitted to The University of Birmingham
for the degree of
DOCTOR OF PHILOSOPHY
School of Mechanical Engineering The University of Birmingham March 2012

University of Birmingham Research Archive
e-theses repository This unpublished thesis/dissertation is copyright of the author and/or third parties. The intellectual property rights of the author or third parties in respect of this work are as defined by The Copyright Designs and Patents Act 1988 or as modified by any successor legislation. Any use made of information contained in this thesis/dissertation must be in accordance with that legislation and must be properly acknowledged. Further distribution or reproduction in any format is prohibited without the permission of the copyright holder.

i
Abstract
Power generation is the largest single source of greenhouse gas emissions, accounting for
some 40% of the world total (1). The situation can be improved by usage of renewable
fuels. There is a lot of controversy and growing concerns regarding usage of so called first
generation bio fuels produced from food crops. The attention of industry and researchers is
moving towards second generation fuels obtained from non edible sources. Waste food or
meat by-products can be processed into tallow. This thesis focuses on the suitability and
feasibility of animal fat usage as a fuel for internal combustion engines. The applied
approach can be characterised by acknowledging the challenges and difficulties of using
untreated fat in the engine, where modifications to the fuel supply system are minimal; the
consequences are described and analysed. This work is an attempt to provide guidance and
minimal requirements for animal fat to be utilised as fuel.
Animal fat (tallow) has been used by humans as source of energy since the Palaeolithic
age. The main area of application was combustion in various types of lamps. Tallow is
obtained from animal by-products in a process called rendering. The raw material is
crushed and heated. The process eliminates water, sterilises the material and allows it to be
separated into fats, meat and bone meal. It may regarded to be a waste product, however,
access to the raw material, such as whales washed on shore, was regulated by law from as
early as the 12th century. The feasibility of alternative fuel usage may often be a critical
factor affecting power plant type selection. The renewable electricity generation
ii
subsidising system in the United Kingdom has been reviewed. A basic feasibility study for
the installed generating set was prepared and the highest tallow price at which electricity
generation is profitable was determined. It was proven that usage of tallow can be feasible,
provided that some form of incentive for biomass or waste technology is implemented.
The properties of tallow were monitored on a weekly basis throughout a period of one
year. By performing an analysis of laboratory test results, it was established whether the
product quality is in statistical control. Some properties, such as acidity, moisture or ash
content, showed significant variability throughout the year. Possible reasons causing
variable and high acidity are given together with a proposal for an acidity removal method.
The proposed method of evaporating free fatty acid under reduced pressure was tested in a
laboratory installation and a promising reduction efficiency of 50 % was achieved.
The effect of storage and supply temperatures on the properties of tallow was investigated.
The available laboratory facilities enabled the verification of changes in fat’s viscosity,
density and surface tension. Pre heating to 90°C enables reduction of all tested properties,
however, the achieved results are comparable with Heavy Fuel Oil (HFO) rather than
automotive diesel fuel. Lubricity of tallow was tested, to predict possible effects of its
usage on the longevity of the engine fuel supply system. Elevated temperature does not
have a negative impact on the lubricating properties of tallow. Storage conditions are an
important factor affecting the quality of bio fuels. The impact of storage temperature on
deterioration in tallow quality was investigated over a period of one month. It was proven
iii
that animal fat can be stored in a liquid form for a prolonged period of time without
deterioration of its properties.
The combustion process of animal fat was compared with that of diesel fuel. Tests were
conducted at three different loads. Usage of animal fat results in higher cylinder pressures,
and the heat release rate for the premixed combustion phase is significantly lower. For high
load operation, all measured emissions were lower for animal fat with exception of
nitrogen oxides. Due to low sulphur content there is no requirement for a sulphur dioxide
abatement system. The available emission control systems have been reviewed and a
solution choice has been made, based on legal and economic criteria. Cooled Exhaust Gas
Recirculation (cEGR) was designed and installed. Trial test results are presented and
analysed. The system enabled reduction of nitrogen oxides’ emissions by 75%.
A summary of two thousand hours operation of the 800 kW generating set using neat fat is
provided. The performance of injectors and fuel pumps was investigated. It was proven
that appropriate filtration and supply strategy can enable problem free operation of the
internal combustion engine. An increased tendency for deposit formation was recorded.
Two types of lubricating oil were tested. By adhering to the manufacturer’s
recommendation for the lubricating oil centrifuge cleaning frequency, enabled the
achievement of a 1000 hours oil change interval, the same as for fossil fuel operation.
Usage of tallow causes an increase in oil viscosity.

iv
Acknowledgements
I would like to express my deepest gratitude and sincere thanks to my Supervisors
Professor Miroslaw L. Wyszynski and Doctor Athanasios Tsolakis, for their guidance and
support throughout this project.
Thanks go to the host company – John Pointon & Sons Ltd. for providing facilities and
fuel to conduct the research described in this thesis. In particular the input from Paul A.
Latham and Barney Williams was invaluable.
Support by Arthur Garlant and North Lincs Engineering was highly valuable and
appreciated.
The Technology Strategy Board of HM Government is gratefully acknowledged for part-
funding of the Knowledge Transfer Partnership Project which made this work possible.
The School of Mechanical Engineering at the University of Birmingham (UK) is also
gratefully acknowledged for the PhD scholarship to Mr. J. Piaszyk.
Some equipment used in this study was funded by Advantage West Midlands and the
European Regional Development Fund as part of the Science City Research Alliance
Energy Efficiency project.

v
List of Publications, Related Work and Achievements
1. Tallow combustion in a large diesel engine and hydrogen production via tallow
reforming.
J. Piaszyk, P. Leung, M. L. Wyszynski, A. Tsolakis, B. Williams, P. Latham, A.
York, Energy & Fuels, submitted 2011.
2. The economics of renewable energy generation by gas engines in the United
Kingdom.
J. Piaszyk, M. L. Wyszynski, A. Tsolakis, P. Latham, in Gas Engines - chosen
topics, A. Duzynski, Ed. (Wydawnictwo Politechniki Czestochowskiej,
Czestochowa, 2010), pp. 404-417.
3. Acidity of Tallow (Animal Fat) and Its Effect on Suitability of Tallow as Fuel
in Electricity Generating Engines.
J. Piaszyk, M. L. Wyszynski, A. Tsolakis, Archivum Combustionis 30, 471 (2010).
4. Possible application of animal fat as engine fuel - lubricity aspects.
J. Piaszyk, M. L. Wyszynski, Combustion Engines 147, 35 (2011).
5. Animal fat combustion in diesel engine as a way of renewable electricity
generation.
J. Piaszyk, M. L. Wyszynski, A. Tsolakis, B. Williams, P. Latham , poster at
Research Poster Conference 2011, University of Birmingham (2011).
6. Chartered Management Institute – Diploma in Management (2010).
7. Knowledge Transfer Partnership (KTP) Associate Certificate (2010).

vi
Table of Contents
Abstract ................................................................................................................................... i
Acknowledgements .............................................................................................................. iv
List of Publications, Related Work and Achievements ......................................................... v
Table of Contents ................................................................................................................. vi
List of Figures ...................................................................................................................... xii
List of Tables ..................................................................................................................... xvii
List of Definitions and Abbreviations .............................................................................. xviii
Chapter 1 Introduction .................................................................................................. 1
1.1 Thesis Background .............................................................................................. 1
1.2 Objectives ............................................................................................................ 2
1.3 Thesis Outline ..................................................................................................... 2
Chapter 2 Literature Review ........................................................................................ 6
2.1 Introduction ......................................................................................................... 6
2.2 Definition of Tallow ............................................................................................ 6
2.3 History of Tallow Usage ..................................................................................... 8
2.4 Production Process ............................................................................................ 11
2.5 Categories and Grades ....................................................................................... 14
2.6 Legal Status ....................................................................................................... 15
2.7 Usage of Triacylglycerols as Engine Fuels ....................................................... 16
vii
2.8 Potential of Tallow for Biodiesel Production .................................................... 27
2.9 Combustion of Neat Fat in Internal Compressed Ignition Engine .................... 27
2.10 Emissions Abatement Methods for Large Engines ....................................... 34
2.10.1 Nitrogen Oxides Emissions Abatement ..................................................... 34
2.10.1.1 Classification of Abatement Methods ................................................. 34
2.10.1.2 Exhaust Gas Recirculation .................................................................. 35
2.10.1.3 Optimisation of Injection Strategy ...................................................... 37
2.10.1.4 SCR – Selective Catalytic Reduction ................................................. 40
2.10.1.5 Usage of Water ................................................................................... 42
2.10.2 Reduction of Sulphur Oxides Emissions ................................................... 42
2.11 Summary ........................................................................................................ 43
Chapter 3 Feasibility of Electricity Generation when Using an Internal Combustion
Engine Fuelled with Tallow as the Prime Mover ............................................................ 44
3.1 Factors Affecting Feasibility of Electricity Generation .................................... 44
3.2 Supporting Legislation for Renewable Electricity Generation ......................... 45
3.2.1 The History of Renewable Energy Support System .................................. 45
3.2.1.1 Fossil Fuel Levy and Non Fossil Fuel Obligation ................................ 45
3.2.1.2 Renewable Obligation ........................................................................... 49
3.2.2 Existing Support Policy ............................................................................. 52
3.2.2.1 Climate Change Levy and Levy Exemption Certificates ..................... 52
3.2.2.2 Renewable Obligation ........................................................................... 55

viii
3.2.2.3 Feed-in Tariffs ...................................................................................... 56
3.2.2.4 Renewable Heat Incentive .................................................................... 56
3.2.3 Combined Heat and Power ........................................................................ 58
3.2.4 Summary .................................................................................................... 59
3.3 Tallow Prices ..................................................................................................... 60
3.4 Feasibility Study of 0.8 MWe Generating Plant ............................................... 61
3.5 Feasibility Study of Large Scale 20 MWe Generating Plant ............................ 63
3.6 Economics of Electricity Generation ................................................................ 64
Chapter 4 Experimental Facilities .............................................................................. 66
4.1 Introduction ....................................................................................................... 66
4.2 Engine Facility .................................................................................................. 66
4.2.1 Engine Specifications................................................................................. 66
4.2.2 Monitoring Equipment ............................................................................... 69
4.2.3 Fuel Supply System ................................................................................... 73
4.2.4 Emissions Abatement System .................................................................... 79
4.3 Fuel Laboratory Facilities ................................................................................. 81
4.3.1 Density Test ............................................................................................... 81
4.3.2 Surface Tension Test ................................................................................. 82
4.3.3 Viscosity Test............................................................................................. 83
4.3.4 Lubricity Test ............................................................................................. 84
4.3.5 Free Fatty Acids Removal ......................................................................... 86
ix
Chapter 5 Consistency of Tallow Properties .............................................................. 88
5.1 Introduction ....................................................................................................... 88
5.2 Long Term Monitoring Programme .................................................................. 89
5.2.1 Results ........................................................................................................ 91
5.3 Available Acidity Reduction Methods .............................................................. 97
5.4 Acidity Reduction by Evaporation – Trial Test ................................................ 97
5.4.1 Preliminary Information............................................................................. 97
5.4.2 Large Scale Plant Utilising Rothoterm® Technology by Artisan Industries
Inc. 98
5.4.3 Small Scale Test Results and Discussion .................................................. 98
5.5 Conclusions ....................................................................................................... 99
Chapter 6 Determination of Appropriate Storage and Supply Temperatures .......... 100
6.1 Effect of Temperature on Properties of Animal Fat ........................................ 100
6.1.1 Viscosity .................................................................................................. 101
6.1.2 Lubricity ................................................................................................... 104
6.1.3 Surface Tension ....................................................................................... 110
6.1.4 Density ..................................................................................................... 111
6.2 Maximum Allowable Long Term Storage Temperature ................................. 112
6.3 Conclusions ..................................................................................................... 115
Chapter 7 Combustion Process Analysis .................................................................. 117
7.1 Combustion Characteristics ............................................................................ 117

x
7.2 Emissions Comparison .................................................................................... 127
7.3 Use of EGR ..................................................................................................... 130
7.4 Conclusions ..................................................................................................... 134
Chapter 8 Long Term Effect of Using Tallow ......................................................... 137
8.1 Introduction ..................................................................................................... 137
8.2 Lubricating Oil ................................................................................................ 137
8.2.1 Requirements for Lubricating Oils Used in Generating Sets................... 137
8.2.2 Testing Programme .................................................................................. 138
8.2.3 Results ...................................................................................................... 141
8.3 Impact on Injectors and Fuel Pumps ............................................................... 144
8.4 Conclusions ..................................................................................................... 150
Chapter 9 Conclusions and further Work ................................................................. 152
9.1 Summary of Presented Findings ..................................................................... 152
9.1.1 Consistency of Tallow Properties ............................................................ 152
9.1.2 Determination of Appropriate Storage and Supply Temperatures .......... 153
9.1.3 Combustion Process Analysis .................................................................. 155
9.1.4 Long Term Effects of Using Tallow on Engine Components ................. 156
9.1.5 Economics of Electricity Generation ....................................................... 156
9.2 Suggestions for Future Work .......................................................................... 157
9.2.1 Engine Modifications ............................................................................... 157
9.2.2 Emissions Abatement .............................................................................. 158
xi
9.2.3 Animal Fat Quality .................................................................................. 158
References ......................................................................................................................... 160
Appendices ........................................................................................................................ 168
Appendix 1 – cEGR Calculations and Technical Drawings.............................................. 169
Appendix 2 – Feasibility price estimates for FFA removal systems including Artisan
Rototherm® E evaporators. ............................................................................................... 177
Appendix 3 – Certificates of Analysis ............................................................................... 181
Appendix 4 – Summary of the KTP Project ...................................................................... 184

xii
List of Figures
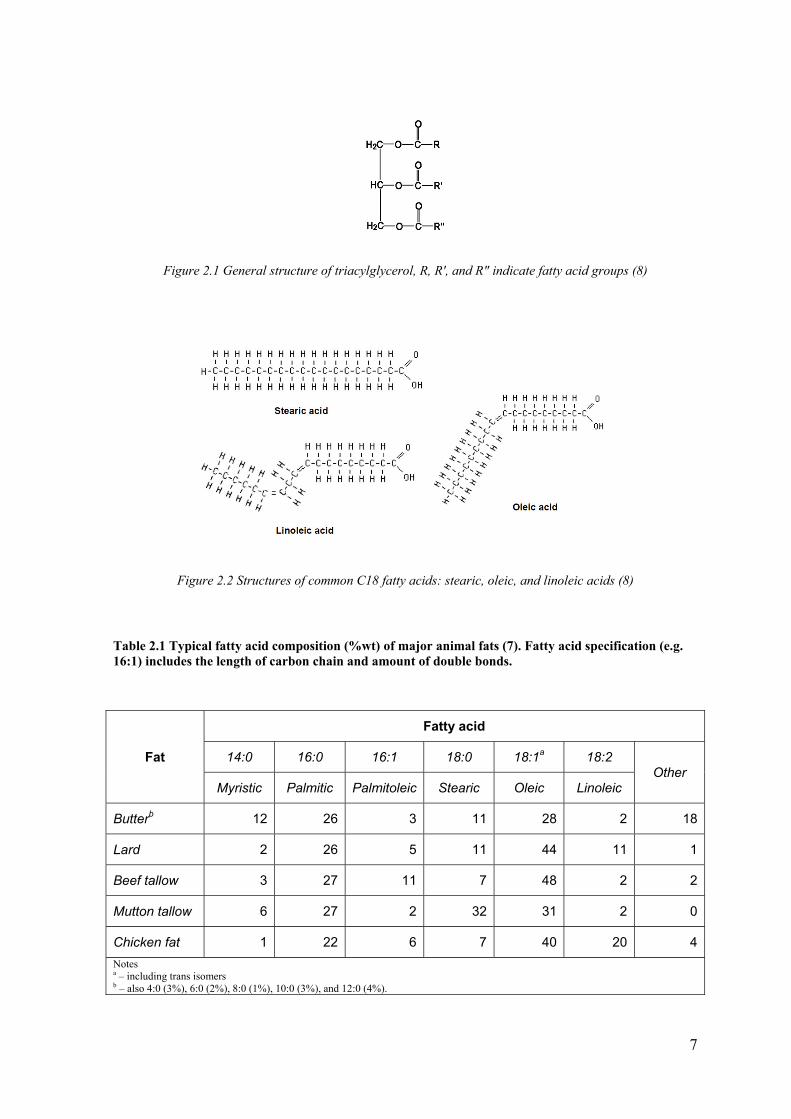
Figure 2.1 General structure of triacylglycerol, R, R', and R" indicate fatty acid groups (8) 7
Figure 2.2 Structures of common C18 fatty acids: stearic, oleic, and linoleic acids (8) ....... 7
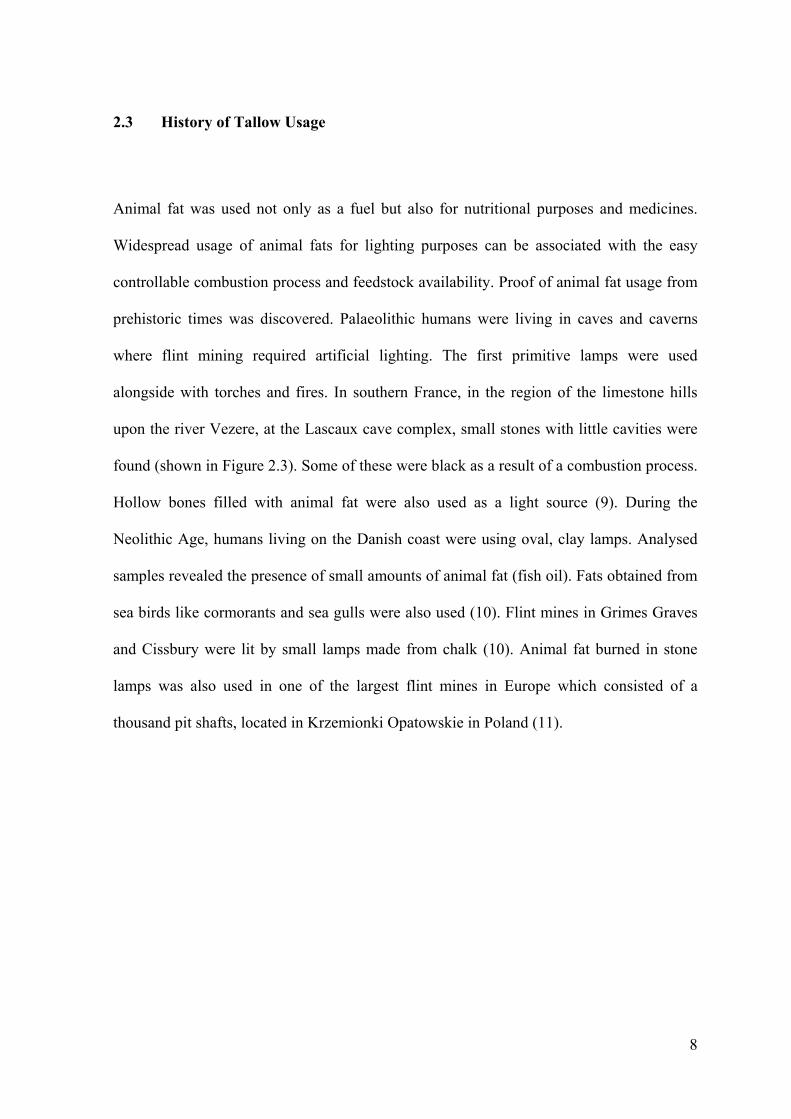
Figure 2.3 A deer fat lamp, found in a Lascaux cave. It can be viewed in the National
Prehistory Museum in Les Eyzies-de-Tayac (12) ................................................................. 9
Figure 2.4 Large Rorqual stranded at Tynemouth in August, 1532 (14) ............................ 10
Figure 2.5 Tallow lamp - 19th century (15) ........................................................................ 10
Figure 2.6 Rendering process schematic diagram ............................................................... 12
Figure 2.7 Cooker used for rendering process (17) ............................................................. 13
Figure 2.8 Haarslev screw press (18) .................................................................................. 13
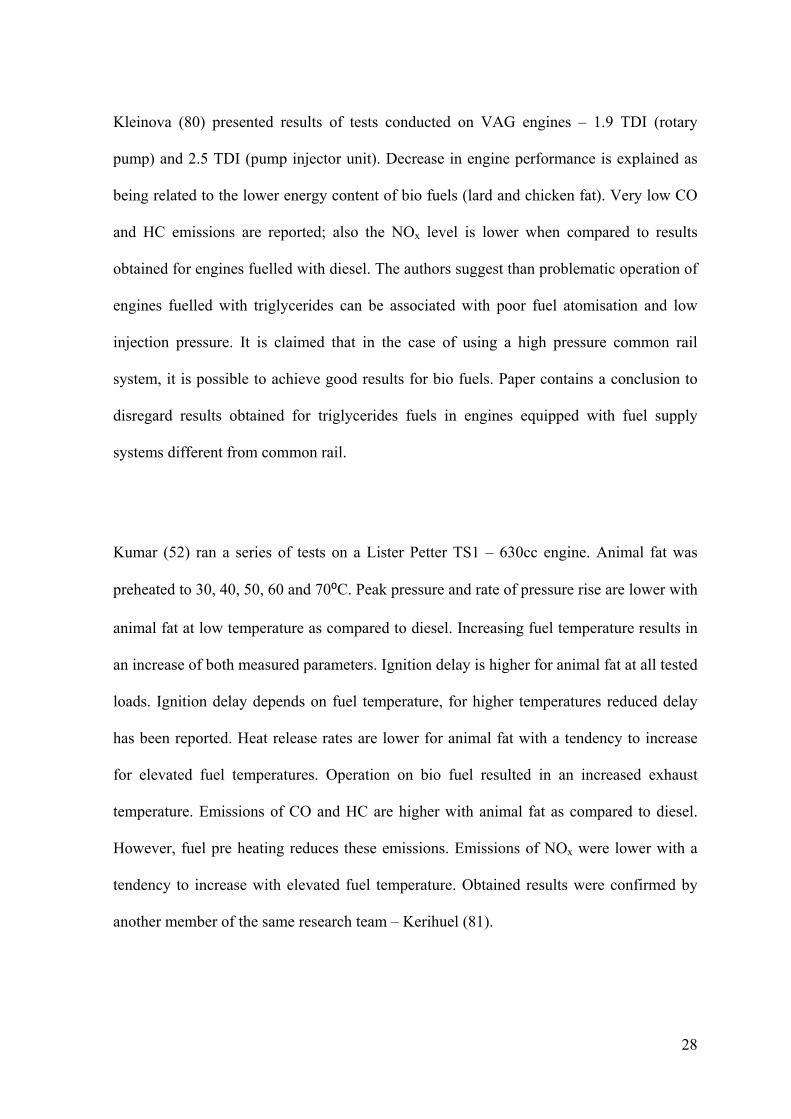
Figure 2.9 Typical engine test bed with dual fuel supply system used for triacylglycerol
fuels testing (52) .................................................................................................................. 29
Figure 2.10 Pieksamaki research power plant (69) ............................................................. 31
Figure 2.11 Different layouts for EGR system; case 1 – high pressure EGR, case 2- low
pressure EGR, case 3 – charge dilution (44) ....................................................................... 36
Figure 2.12 Effect of EGR on the 4T50MX engine emission (44) ..................................... 36
Figure 2.13 Fuel injection patterns, including pre-injection and the effects on SFOC and
NOx emissions (44) .............................................................................................................. 38
Figure 2.14 MAN ME engine control system layout .......................................................... 39
Figure 2.15 SCR system layout for MAN B&W S46 MC-C engine (87) ........................... 41
Figure 3.1 Total output by year and technology (GWh) (96) .............................................. 47
xiii
Figure 3.2 Real average contracted price for each technology (2000 prices). The average is
a capacity-weighted average of the contracted price and does not account for the length of
the contract. PPP is the Pool Purchase Price in the electricity market (96) ........................ 49
Figure 3.3 Track record for ROC auction prices by Compliance Period (CP) (98) ............ 51
Figure 3.4 Comparison of animal fat (grade 6) and crude oil (Brent) prices in 2009 (114,
115) ...................................................................................................................................... 61
Figure 3.5 Impact of animal fat price on electricity generation feasibility. Assumptions:
electricity selling price - 92 £/MWh, ROC price - 45 £/MWh ............................................ 63
Figure 4.1 Ruston 6AR engine installed at John Pointon and Sons Ltd. premises at
Cheddleton ........................................................................................................................... 67
Figure 4.2 Generating station single line diagram showing Ruston 6AR engine (Gen 11kV)
and dedicated electricity metering system complying with OFGEM requirements ............ 69
Figure 4.3 Kistler 6613CA pressure transmitter (116) ........................................................ 71
Figure 4.4 Standard fuel system layout (119) ..................................................................... 74
Figure 4.5 Fuel supply system layout .................................................................................. 76
Figure 4.6 Fuel supply system - diesel mode ...................................................................... 77
Figure 4.7 Fuel supply system - tallow mode ...................................................................... 78
Figure 4.8 cEGR system layout - including gas cooling and humidification chamber ....... 79
Figure 4.9 Water injecting nozzles ...................................................................................... 80
Figure 4.10 EGR cyclone chamber...................................................................................... 81
Figure 4.11 Hydrometer scale reading for opaque fluids (120) .......................................... 82
Figure 4.12 PCS Ultra Shear Viscometer ............................................................................ 83
Figure 4.13 USV main parts (122) ...................................................................................... 84
Figure 4.14 Schematic diagram of HFRR (124).................................................................. 85

xiv
Figure 4.15 Test rig for FFA removal via evaporation at reduced pressure ........................ 87
Figure 5.1 Moisture, insoluble impurities, ash levels in tallow during 2009 ...................... 91
Figure 5.2 Iodine number and polyethylene levels in tallow during 2009 .......................... 92
Figure 5.3 Free fatty acids (FFA) level in tallow and weekly average ambient temperature
during 2009 .......................................................................................................................... 92
Figure 5.4 Calorific value (higher) and density of tallow during 2009 ............................... 93
Figure 5.5 EWMA control charts for monitored tallow properties ..................................... 96
Figure 6.1 Comparison of dynamic viscosity of animal fat and ULSD at range of
temperatures ...................................................................................................................... 102
Figure 6.2 Effect of temperature on animal fat kinematic viscosity ................................. 103
Figure 6.3 Relationship between shear stress and shear rate for animal fat and ULSD at a
range of temperatures ........................................................................................................ 104
Figure 6.4 Wear scar captured by digital microscope; ULSD at 60⁰C.............................. 106
Figure 6.5 Wear scar captured by digital microscope; Animal Fat at 60⁰C ...................... 106
Figure 6.6 Film percentages for ULSD and animal fat at a range of temperatures. .......... 107
Figure 6.7 Film percentages for ULSD and animal fat at a range of temperatures - first 5
minutes of HFRR test ........................................................................................................ 108
Figure 6.8 Friction coefficients for ULSD and animal fat at a range of temperatures ...... 108
Figure 6.9 Wear scar captured by digital microscope; Animal Fat at 90⁰C ...................... 109
Figure 6.10 Comparison of surface tension measured at a range of temperatures for ULSD
and animal fat .................................................................................................................... 111
Figure 6.11 Impact of fat temperature on density ............................................................. 112
Figure 6.12 Free fatty acids content in animal fat stored for four weeks at various
temperatures ...................................................................................................................... 114

xv
Figure 7.1 Combustion process comparison – 75% load .................................................. 120
Figure 7.2 Cylinder pressure rise rate – 75% load ............................................................ 120
Figure 7.3 Combustion process comparison - 50% load ................................................... 121
Figure 7.4 Cylinder pressure rise rate - 50% load ............................................................. 121
Figure 7.5 Combustion process comparison - 25% load ................................................... 122
Figure 7.6 Cylinder pressure rise rate - 25% load ............................................................. 122
Figure 7.7 Premixed combustion net heat release (NHRR) patterns for both tested fuels at
three tested loads. Local maxima for premixed combustion phase are marked. ............... 124
Figure 7.8 Effect of fuel on the specific fuel consumption (not adjusted for calorific value)
........................................................................................................................................... 124
Figure 7.9 Daily fuel consumption curve .......................................................................... 126
Figure 7.10 Weekly fuel consumption curve..................................................................... 126
Figure 7.11 Effect of fuel type on the engine exhaust emissions - 75% load ................... 128
Figure 7.12 Effect of fuel type on the engine exhaust emissions - 50% load ................... 129
Figure 7.13 Effect of fuel type on the engine exhaust emissions - 25% load ................... 130
Figure 7.14 Impact of the EGR on tallow combustion ...................................................... 131
Figure 7.15 Impact of the cooled EGR (cEGR) on tallow combustion ............................. 131
Figure 7.16 Impact of EGR concentration on engine emissions when fuelled with tallow -
75% load ............................................................................................................................ 133
Figure 7.17 Impact of cooled EGR concentration on engine emissions when fuelled with
tallow - 75% load ............................................................................................................... 133
Figure 7.18 Effect of EGR and cEGR concentration on nitrogen oxides reduction potential
and fuel consumption at 75% load .................................................................................... 134
Figure 8.1 Ruston 6AR lubricating system ....................................................................... 140

xvi
Figure 8.2 Long term effect of animal fat usage on lubricating oil viscosity .................... 141
Figure 8.3 Long term effect of animal fat usage on engine wear - iron concentration ..... 142
Figure 8.4 Assembly of fuel pump (119) .......................................................................... 145
Figure 8.5 Fuel leaking from fuel pumps damaged by fat containing polyethylene ......... 147
Figure 8.6 Deposit build-up ............................................................................................... 148
Figure 8.7 Injector nozzle damage caused by high temperature ....................................... 149
Figure 8.8 Burned exhaust valve ....................................................................................... 149
Figure 8.9 Ruston 6AR cylinder head - valve damage visible .......................................... 150

xvii
List of Tables
Table 2.1 Typical fatty acid composition (%wt) of major animal fats (7). Fatty acid
specification (e.g. 16:1) includes the length of carbon chain and amount of double bonds. . 7
Table 2.2 Tallow categories and its permitted applications (6, 19-21) ............................... 14
Table 2.3 Properties of technical tallows and animal greases (22) ..................................... 15
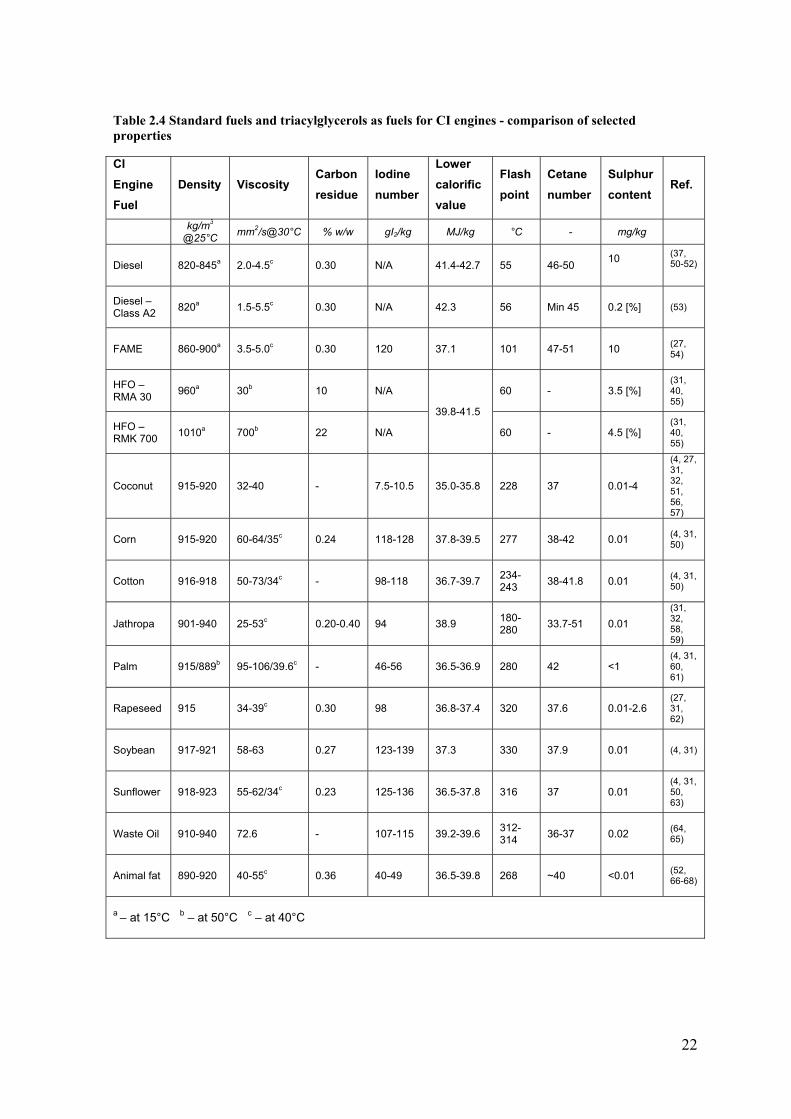
Table 2.4 Standard fuels and triacylglycerols as fuels for CI engines - comparison of
selected properties ............................................................................................................... 22
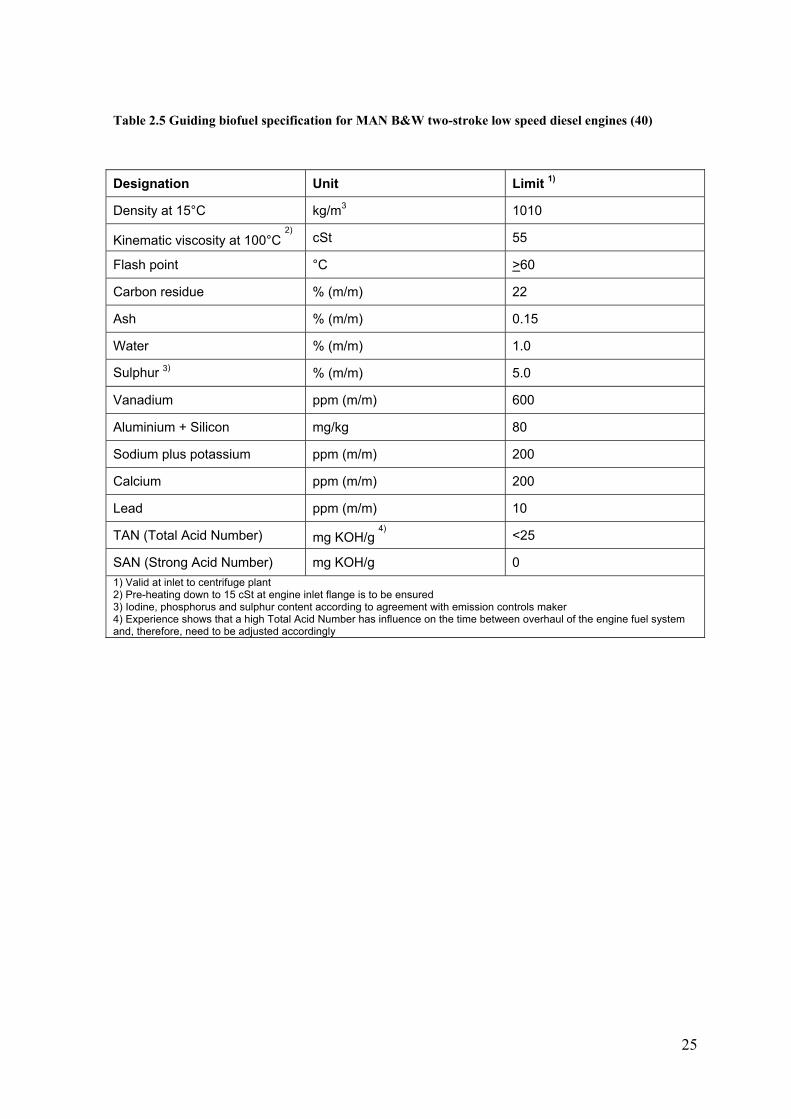
Table 2.5 Guiding biofuel specification for MAN B&W two-stroke low speed diesel
engines (40) ......................................................................................................................... 25
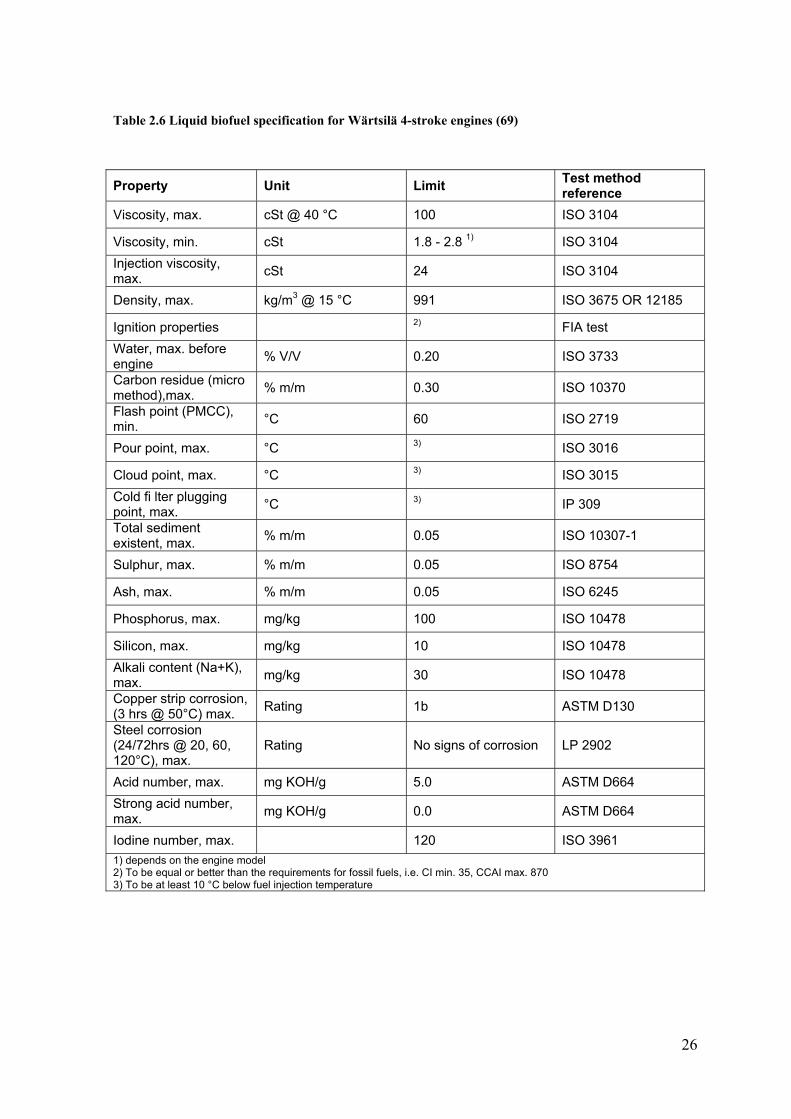
Table 2.6 Liquid biofuel specification for Wärtsilä 4-stroke engines (69) ......................... 26
Table 2.7 Comparison of combustion characteristics and emissions obtained at a range of
testing conditions for engines fuelled with animal fat with values obtained for fossil fuels
............................................................................................................................................. 32
Table 3.1 Fossil Fuel Levy rates (94) ................................................................................. 46
Table 3.2 Renewables Obligation percentage and buy-out price for different obligation
periods (97) .......................................................................................................................... 50
Table 3.3 Climate Change Levy rates (99-102) .................................................................. 53
Table 3.4 Renewable Obligation scheme technologies banding (95) ................................. 55
Table 3.5 Coefficients for the calculation of QI for various sizes and types of new CHP
scheme (113) ....................................................................................................................... 59
Table 4.1 Engine technical data ........................................................................................... 68
Table 4.2 Sita Proline T15 technical data ............................................................................ 82

xviii
Table 4.3 PCS HFRR technical specification ...................................................................... 85
Table 4.4 Test conditions based on ISO 12156 ................................................................... 86
Table 5.1 Required tallow properties .................................................................................. 89
Table 5.2 Summary of statistical analysis and compliance with various specifications ..... 95
Table 5.3 FFA evaporation at low pressure – 6.5 – 9.5 hPa ................................................ 98
Table 6.1 Animal fat typical specification, tested sample properties ................................ 101
Table 6.2 HFRR test results ............................................................................................... 105
Table 6.3 Animal fat acidity - long term storage ............................................................... 114
Table 7.1 Combustion analysis results .............................................................................. 123
Table 8.1 Lubricating oil properties (145, 146)................................................................. 139
Table 8.2 Effect of ageing during operation on animal fat on various types of lubricating
oil ....................................................................................................................................... 143
Table 8.3 Fuel pump specification .................................................................................... 144
List of Definitions and Abbreviations
AD Anaerobic Digestion
AN Acid Number
ANSI American National Standards Institute
ASTM formerly known as American Society for Testing and Materials
ATDC After Top Dead Centre
xix
BOTS Ball on Three Seats
BSFC Brake Specific Fuel Consumption
BSE Bovine Spongiform Encephalopathy
BTDC Before Top Dead Centre
CASS Combustion Air Saturation System
CCL Climate Change Levy
cEGR Cooled Exhaust Gas Recirculation
CHP Combined Heat and Power
CHPQA Quality Assurance for Combined Heat and Power
CI Compression Ignition
CO Carbon Monoxide
CO2 Carbon Dioxide
COV Coefficient of Variance
CP Compliance Period
CPO Crude Palm Oil
DC Direct Current
DECC Department of Energy and Climate Change
degCA Crank Angle Degree
DNC Declared Net Capacity
EfW Energy from Waste
EGR Exhaust Gas Recirculation
EWMA Exponentially Weighted Moving Average
xx
FAME Fatty Acid Methyl Ester
FFA Free Fatty Acid
FID Flame Ionisation Detector
FIT Feed In Tariff
FYP Final Year Project
GFC Gas Filter Correlation
HC Hydrocarbons
HFO Heavy Fuel Oil
HFRR High Frequency Reciprocating Rig
HOC Heat Obligation Certificate
HRC Rockwell Hardness
HV Vickers Hardness
IMEP Indicated Mean Effective Pressure
IP Indicated Pressure
ISO International Organisation for Standardisation
KTP Knowledge Transfer Partnership
LCL Lower Control Limit
LEC Levy Exemption Certificate
LFG Landfill Gas
MBM Meat and Bone Meal
MEP Mean Effective Pressure
MFB Mass Fraction Burned

xxi
MR Moving Range
MWSD Mean Wear Scar Diameter
NFFO Non Fossil Fuel Obligation
NFPA Non Fossil Purchasing Agency
NH3 Ammonia
NHRR Net Heat Release Rate
NOx Nitrogen Oxides
OFGEM Office of the Gas and Electricity Markets
OH Hydroxyl Group
PDA Phase Doppler Anemometry
PE Power Efficiency
PM Particulate Matter
PP Peak Pressure
ppm Parts per Million
PPP Pool Purchase Price
PV Photovoltaics
QI Quality Index
Ra Profile Roughness Parameter
REC Regional Electricity Company
RHI Renewable Heat Incentive
RHO Renewable Heat Obligation
RO Renewables Obligation
xxii
ROC Renewables Obligation Certificate
rpm Revolutions per Minute
SAN Strong Acid Number
SCR Selective Catalytic Reduction
SECA Sulphur Emission Control Area
SFOC Specific Fuel Oil Consumption
SLBOCLE Scuffing Load Ball on Cylinder Lubricity Evaluator
SMD Sauter Mean Diameter
SRM Specified Risk Material
TAN Total Acid Number
TBN Total Base Number
TSB Technology Strategy Board
TSE Transmissible Spongiform Encephalopathies
UCL Upper Control Limit
ULSD Ultra Low Sulphur Diesel
USV Ultra Shear Viscometer
VAG Volkswagen Audi Group
VOC Volatile Organic Compound
VTT Technical Research Centre of Finland
WID Waste Incineration Directive
WSD Wear Scar Diameter
1
Chapter 1 INTRODUCTION
1.1 Thesis Background
The UK Government has set strategic targets for both the energy market and industry.
Documents such as the Low Carbon Transition Plan and Renewable Energy Strategy
specify that emissions, expressed as metric tonne carbon dioxide equivalent (MtCO2e),
must be cut by 18% by 2020 (compared to the 2008 level) (2) and 15% of energy should be
generated from renewable sources by 2020 (3). The targets can be achieved by extended
usage of biomass as a source of renewable energy. There is a potential in using crude fats,
like tallow, as fuel for internal combustion engines. By adopting the right working
practices and procedures and implementing appropriate treatment methods, the rendering
industry may play an important role in the renewable energy sector.
This thesis is one of the outputs of a collaborative project established between The School
of Mechanical Engineering at The University of Birmingham and a leader in the UK
rendering industry, Staffordshire based, John Pointon & Sons. Cooperation was in the form
of a TSB (Technology Strategy Board) funded KTP (Knowledge Transfer Partnership).

2
1.2 Objectives
The main aim of the research process described in this thesis is to verify suitability of
animal fat as fuel for internal combustion engines. The objectives of this research were to:
- identify, analyse and solve fuel flow-related problems with close attention given to
the fuel supply system and fuel injection system
- study the impact of raw and treated tallow on the combustion quality, emissions,
performance and economy
- study the mechanical and chemical effects of animal fat fuel on the engine
components and longevity
- optimise the engine operation, prepare procedures for operation of gen-set engines
using tallow fuels
- improve or modify fuel quality by varying the tallow preparation, fuel production
or pre-treatment
- verify the feasibility of the usage of tallow for power generation application by
conducting analysis of existing support policies for biomass/waste fuels.
1.3 Thesis Outline
The thesis is divided into nine consecutive chapters which cover various aspects of animal
fat usage as fuel for reciprocating engines.

3
A literature review is presented in Chapter 2, which introduces a definition of animal fat
(tallow), describes the production process and also provides basic information regarding
how tallow is divided into grades and categories. Available information regarding neat
triglycerides’ usage as an engine fuel is analysed to obtain guidance for engine test trials. A
short review of the emissions abatement systems available for large engines is also given.
A very limited amount of published data regarding usage of animal fat as fuel for large
internal combustion engines justifies the necessity of a conducted research programme.
An electricity generation feasibility study is presented in Chapter 3. It contains calculations
for a small scale plant (<1MW) and also a large scale plant (20MW). The relationship that
links animal fat price with fossil fuel price is analysed. The effect of fuel price change on
generation feasibility is given.
The experimental set up is described in Chapter 4. It contains a description of the 800 kW
research power plant located at John Pointon & Sons Ltd. premises at Cheddleton, Staffs,
UK. Usage of animal fat required modification of the fuel supply system to enable dual
fuel operation – the working principle is explained. The designed emission abatement
system in a form of EGR with gases cooling and humidification, (cEGR), is presented
together with technical drawings appended. Tests conducted at the research power plant
were accompanied by laboratory tests, of which main the objective was fuel properties’
testing – a laboratory facilities description is provided.

4
Chapter 5 presents results of an investigation that focused on the consistency of fuel
properties. Changes of properties during the calendar year are statistically analysed. A
possible reason for variable acidity is given together with a review of available acidity
reduction methods. One of the physical methods has been tested in a laboratory scale
experiment.
Chapter 6 is devoted to analysis of fuel temperature effect on its properties. The main
objective of this chapter is to verify if pre heating is a correct way of animal fat pre-
treatment.
Combined results of tests described in Chapters 5-6 lead to establishing a suitable fuel
specification. Another outcome is the creation of an engine testing programme where
operating conditions, such as fuel temperature, are considered.
Analysis of the combustion process together with emissions data are given in Chapter 7.
All data is recorded for fossil fuel (diesel), hence reference data is obtained, and then
compared with results for animal fat. Tests were performed at synchronous speed for three
different engine loads.

5
The long term effect of animal fat usage on engine components’ longevity is described in
Chapter 8. Analysis is divided into sub sections describing fuel pumps, injectors and
lubricating oil.
Conclusions and suggestions for future work constitute the final chapter of this thesis.

6
Chapter 2 LITERATURE REVIEW
2.1 Introduction
This chapter contains a short summary of information available in literature concerning the
possible application of animal fat and other triglycerides as fuel for compressed ignition
engines. Emissions abatement methods used for marine and stationary applications are
briefly described.
2.2 Definition of Tallow
Tallow is an animal fat obtained by rendering animal carcases and waste from the food
industry. Crude fats primarily consist of triacylglycerols but also contain non glyceride
substances (unsaponifiable fraction), that affect chemical and physical properties (4). A
triacylglycerol consists of a three carbon glycerol head group to which are added three
fatty acid chains (5). A structure of triacylglycerol is shown in Figure 2.1. All
triacylglycerols have the same basic structure, and the differences in properties and use of
commercial triglycerides depend largely on the length, degree of unsaturation and other
chemical modifications to the fatty acid chains (6, 7). Examples of the structures of
common C18 fatty acids are given in Figure 2.2, as C18:0 (stearic acid, octadecanoic acid),
C18:1 (oleic acid, 9-octadecenoic acid), and C18:2 (linoleic acid, 9,12-octadecenoic acid)
(8). Typical fatty acid composition of tallow and other animal fats is given in Table 2.1.
7
Figure 2.1 General structure of triacylglycerol, R, R', and R" indicate fatty acid groups (8)
Figure 2.2 Structures of common C18 fatty acids: stearic, oleic, and linoleic acids (8)
Table 2.1 Typical fatty acid composition (%wt) of major animal fats (7). Fatty acid specification (e.g. 16:1) includes the length of carbon chain and amount of double bonds.
Fat
Fatty acid
14:0 16:0 16:1 18:0 18:1a 18:2 Other
Myristic Palmitic Palmitoleic Stearic Oleic Linoleic
Butterb 12 26 3 11 28 2 18
Lard 2 26 5 11 44 11 1
Beef tallow 3 27 11 7 48 2 2
Mutton tallow 6 27 2 32 31 2 0
Chicken fat 1 22 6 7 40 20 4
Notes a – including trans isomers b – also 4:0 (3%), 6:0 (2%), 8:0 (1%), 10:0 (3%), and 12:0 (4%).
8
2.3 History of Tallow Usage
Animal fat was used not only as a fuel but also for nutritional purposes and medicines.
Widespread usage of animal fats for lighting purposes can be associated with the easy
controllable combustion process and feedstock availability. Proof of animal fat usage from
prehistoric times was discovered. Palaeolithic humans were living in caves and caverns
where flint mining required artificial lighting. The first primitive lamps were used
alongside with torches and fires. In southern France, in the region of the limestone hills
upon the river Vezere, at the Lascaux cave complex, small stones with little cavities were
found (shown in Figure 2.3). Some of these were black as a result of a combustion process.
Hollow bones filled with animal fat were also used as a light source (9). During the
Neolithic Age, humans living on the Danish coast were using oval, clay lamps. Analysed
samples revealed the presence of small amounts of animal fat (fish oil). Fats obtained from
sea birds like cormorants and sea gulls were also used (10). Flint mines in Grimes Graves
and Cissbury were lit by small lamps made from chalk (10). Animal fat burned in stone
lamps was also used in one of the largest flint mines in Europe which consisted of a
thousand pit shafts, located in Krzemionki Opatowskie in Poland (11).

9
Figure 2.3 A deer fat lamp, found in a Lascaux cave. It can be viewed in the National Prehistory Museum in Les Eyzies-de-Tayac (12)
In the polar zone, seal fat was used for heating and as a light source till modern times.
Obtaining fat was inevitably linked with waste or a by-product conversion process and
feedstock availability. In some cases fat was obtained from hunted animals. Whales thrown
on the seashores (shown in Figure 2.4) were considered as a valuable resource. Magnus
(13) listed possible ways of utilising one whale for: meat, fat for heating and lighting,
leather for clothing, and bones for heating (small) and construction (large). Often people
fought over it. Since the 12th century this issue was regulated by law (10).
10
Figure 2.4 Large Rorqual stranded at Tynemouth in August, 1532 (14)
Usage of animal fat as a source of light in mining extends even up to the 19th century.
Metal lamps (shown in Figure 2.5) burning with an open flame, where a textile wick was
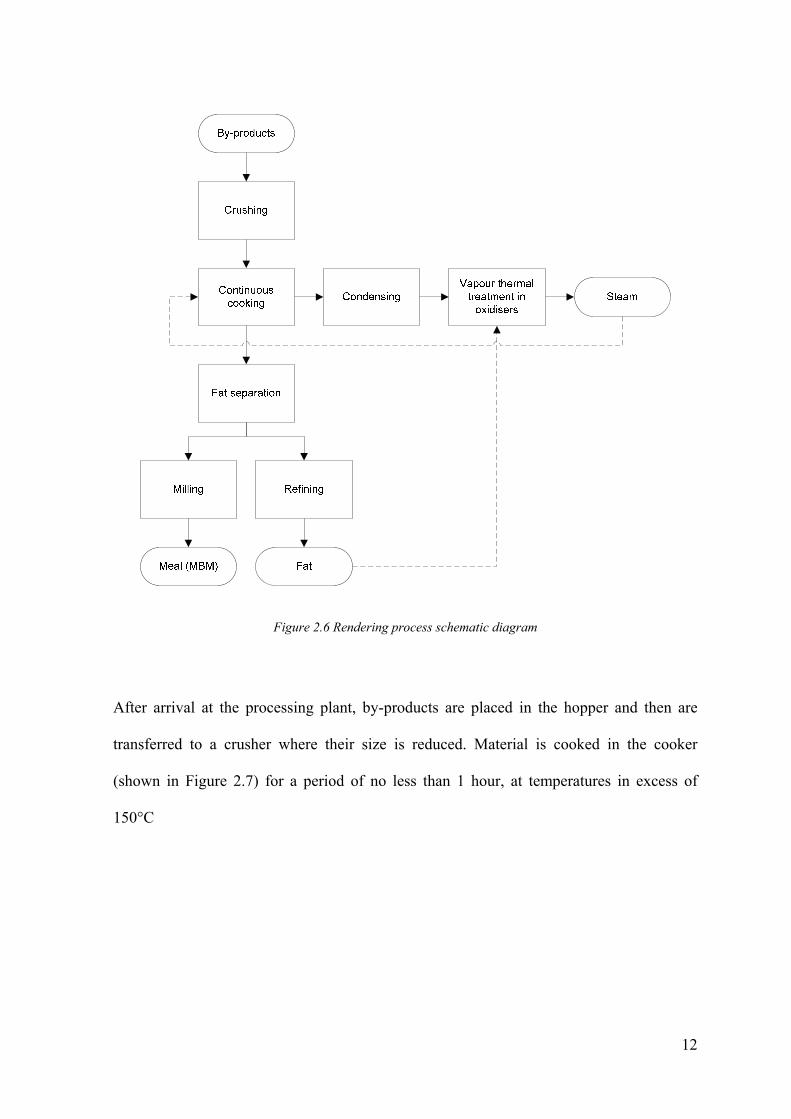
pushed into the spout, were fitted into miners’ cloth caps.
Figure 2.5 Tallow lamp - 19th century (15)

11
Tallow was used for candle making for centuries. Even nowadays it is possible to purchase
tallow candles that, according to a manufacturer, are not only a source of light and heat
(used to aid lighting a fire), but in a survival situation can be eaten (16).
From this short summary it can be seen that animal fat is a resource that has been used by
humans since prehistory. Sourcing fat and other products obtained from stranded whales
can be seen as an exemplary way of the sustainable processing of waste. The rendering
process can be seen as a modern follower of this route.
2.4 Production Process
Rendering is a straightforward process in which animal carcases and trimmings are crushed
and heated. This process drives off the water, sterilises the material and allows it to be
separated into the fats (tallow) and meat and bone meal (MBM). Raw materials are all the
unusable parts of a carcass, including bones, internal organs and trimmings. Raw materials
are collected for processing from abattoirs and from butchers and food processing sites.
Two types of the process can be distinguished: batch and continuous rendering.
Continuous systems are suitable for higher capacities. A process schematic diagram is
shown in Figure 2.6.
12
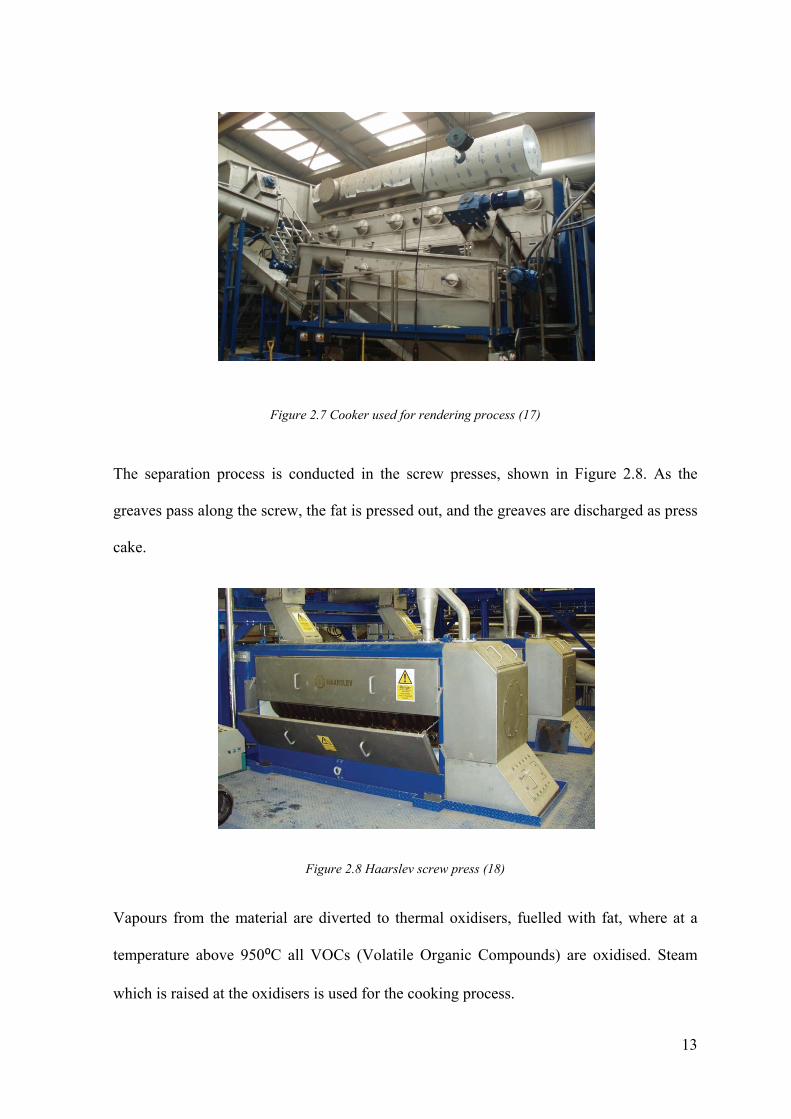
Figure 2.6 Rendering process schematic diagram
After arrival at the processing plant, by-products are placed in the hopper and then are
transferred to a crusher where their size is reduced. Material is cooked in the cooker
(shown in Figure 2.7) for a period of no less than 1 hour, at temperatures in excess of
150°C
13
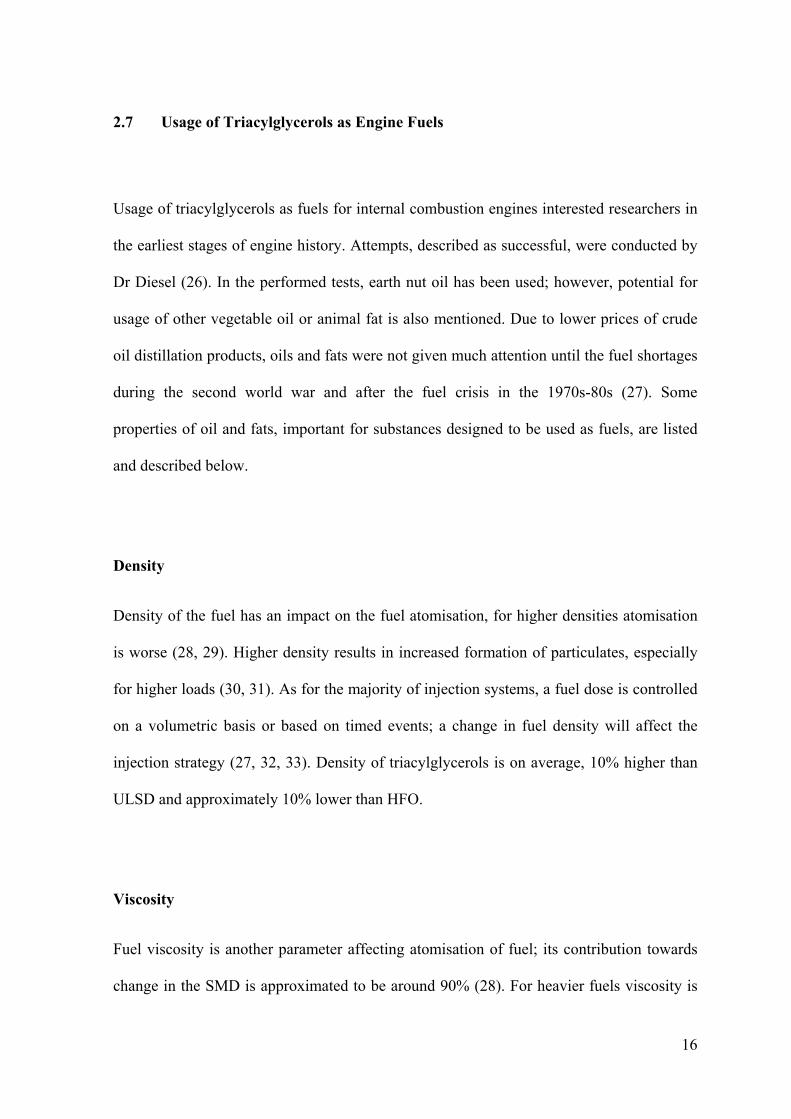
Figure 2.7 Cooker used for rendering process (17)
The separation process is conducted in the screw presses, shown in Figure 2.8. As the
greaves pass along the screw, the fat is pressed out, and the greaves are discharged as press
cake.
Figure 2.8 Haarslev screw press (18)
Vapours from the material are diverted to thermal oxidisers, fuelled with fat, where at a
temperature above 950⁰C all VOCs (Volatile Organic Compounds) are oxidised. Steam
which is raised at the oxidisers is used for the cooking process.

14
2.5 Categories and Grades
Animal by-products are divided into three categories depending on their potential risk to
human and animal health or to the environment. There are different rules for disposing of
waste in each category (19). Categories of tallow and permitted applications were defined
by Animal By-Products Regulations (20). A summary is given in Table 2.2.
Table 2.2 Tallow categories and its permitted applications (6, 19-21)
Category Feedstock Application
1 – very high risk
animals and materials suspected or confirmed to be infected by TSEs (transmissible spongiform encephalopathies) such as scrapie in sheep or BSE (bovine spongiform encephalopathy) in cattle, animals that have been experimented on, zoo and pet animal carcasses, catering waste from international transport, specified risk material (SRM) (tissues from cattle, sheep or goats that are, or may be, infected with BSE)
Fuel
2 – high risk
diseased animals (this excludes animals infected by TSEs), manure or animal by-products that could be contaminated with animal diseases, animals kept for human consumption, which die by means other than slaughtering, animals that die on farms that do not contain SRM
Fuel, production of tallow derivatives for technical use only
3 – low risk
raw meat and fish from food manufacturers and retailers, former foodstuffs other than catering waste, this includes manufacturing or packaging defects, eggs and other by-products that do not show signs of transmissible disease, raw milk, fish and other sea animals
Fuel, pet food production, production of tallow derivatives
Tallow is also graded in terms of quality. The two key grades for the UK market are:
- grade 2 – high quality, low colour, used for demanding applications such as soap;
- grade 6 – low quality, highly coloured, used for technical applications (6). Specifications for various tallow grades are given in Table 2.3.

15
Table 2.3 Properties of technical tallows and animal greases (22)
Grade FFA max.
Moisture and dirt
Unsaponifiable matter
Titre Iodine
number max % (m/m) % (m/m) max % (m/m) min °C max
1 3.0 0.5 0.5 40.0 55 2 5.0 1.0 1.0 40.0 55 3 8.0 1.0 1.0 40.0 55 4 12.0 1.0 1.5 40.0 58 5 15.0 1.0 1.5 40.0 58 6 20.0 1.0 2.0 40.0 58
Animal greases
20.0 2.0 2.0 36.0-40.0 61
2.6 Legal Status
According to current legislation, in the UK, animal fat is treated as waste (23). Therefore,
the Waste Incineration Directive applies. One of the requirements is that exhaust gas
resulting from the process is raised to a temperature of 850ºC for 2 seconds (23). For the
purpose of this research project – a Knowledge Transfer Partnership, the Environment
Agency issued a permit to operate a generating set fuelled with animal fat (24).
Products of the animal fat esterification process conducted in accordance with quality
requirements described in Quality Protocol (25) are not classed as waste.
The rendering industry is working on developing End of Waste Test criteria so tallow will
be excluded from the Waste Incineration Directive.
16
2.7 Usage of Triacylglycerols as Engine Fuels
Usage of triacylglycerols as fuels for internal combustion engines interested researchers in
the earliest stages of engine history. Attempts, described as successful, were conducted by
Dr Diesel (26). In the performed tests, earth nut oil has been used; however, potential for
usage of other vegetable oil or animal fat is also mentioned. Due to lower prices of crude
oil distillation products, oils and fats were not given much attention until the fuel shortages
during the second world war and after the fuel crisis in the 1970s-80s (27). Some
properties of oil and fats, important for substances designed to be used as fuels, are listed
and described below.
Density
Density of the fuel has an impact on the fuel atomisation, for higher densities atomisation
is worse (28, 29). Higher density results in increased formation of particulates, especially
for higher loads (30, 31). As for the majority of injection systems, a fuel dose is controlled
on a volumetric basis or based on timed events; a change in fuel density will affect the
injection strategy (27, 32, 33). Density of triacylglycerols is on average, 10% higher than
ULSD and approximately 10% lower than HFO.
Viscosity
Fuel viscosity is another parameter affecting atomisation of fuel; its contribution towards
change in the SMD is approximated to be around 90% (28). For heavier fuels viscosity is
17
an important parameter used to determine the appropriate design of auxiliary fuel supply
systems such as centrifuges and pre-heaters. Changes in viscosity have an impact on the
efficiency of the fuel pumps, for higher viscosities leaks are reduced resulting in increased
efficiency accompanied with larger fuel dose (27, 34).
Surface Tension
Surface tension affects fuel atomisation. For higher tensions, droplet radius increases and
atomisation is worse (35, 36).
Contamination
For road fuels a contamination is defined as all un-dissolved substances retained on a filter
after filtration under test conditions (37). For residual fuels contamination is called a
sediment and is a sum of insoluble organic and inorganic material, separated from the bulk
of the sample by filtration through a specified filter, and also insoluble in a predominantly
paraffinic solvent (38). The standard specific for the rendering industry includes also a
mineral matter combined as soaps (22). Particles present in the fuel will increase wear of
the injection system elements.
For fuels of vegetable origin potential for contamination is lower than for crude fuels,
however, in the case of fats, contamination with finely divided particles of protein, bone
and fibre requires close monitoring (31, 39).
18
Water Content
Water content in the fuel despite lowering its calorific value may lead to corrosion of the
fuel system elements. The problem of corrosion applies especially to crude fuels that may
be contaminated with sea water containing salt (31, 40). Water presence reduces
lubricating properties of fuels. At lower temperatures, ice crystals together with solid
impurities are the nucleus of crystallisation for waxes and paraffins (27). In the case of bio
fuels, water can speed up the biodegradation of the fuel. For animal fats moisture content
characterises the efficiency of the filtration and separation processes. It is desirable to keep
moisture at low levels. High moisture content may encourage hydrolysis and increase
acidity as a result (39).
Carbon Residue/Ash Content
Ash represents solid contaminants as well as metals bound in the fuel (e.g. vanadium and
nickel). Part of the ash could be catalyst particles from the refining process for mineral
fuels. Solid ash should be removed to the widest possible extent by centrifuging, and
cleaning can be improved by installing a fine filter after the centrifuge (e.g. 50 μm) (40).
The carbon residue is measured as Conradson Carbon or Microcarbon. Carbon residue is
an amount left after evaporation and pyrolysis to provide some indication of relative coke
forming propensity (41). Fuels with a high carbon residue content could cause increased
fouling of the gas ways, necessitating more frequent cleaning, especially of the
turbocharger (40).

19
Acidity
Acidity is expressed as an Acid Number (AN) [or Total Acid Number (TAN)] and
measured in mg KOH/g or Free Fatty Acid content (in %). FFA results may be expressed
in terms of acid value by multiplying the FFA percent by 1.99 (4). Monitoring of this
parameter is important due to the corrosive impact of high acidity fuels on the fuel
injection systems (31, 42).
Acid number (AN) – the quantity of base, expressed in milligrams of potassium hydroxide
per gram of sample, required to titrate a sample in the solvent from its initial meter reading
to a meter reading corresponding to a freshly prepared non-aqueous basic buffer solution,
or a well defined inflection point, as specified in the test method (43).
Strong acid number (SAN) – the quantity of base, expressed as milligrams of potassium
hydroxide per gram of sample, required to titrate a sample in the solvent from its initial
meter reading to a meter reading corresponding to a freshly prepared non-aqueous acidic
buffer solution, or a well defined inflection point, as specified in the test method (43).
Iodine number
Properties of oils and fats depend on the ratio of saturated and unsaturated acids. Iodine
number is the parameter describing the unsaturation level of the fat (4, 7).

20
Sulphur
All sulphur entering the engine combustion chamber is oxidized to SOX, which is emitted
into the atmosphere with the exhaust gases. The SOX emissions from the engine depend on
the fuel sulphur content and fuel consumption (44, 45). Low sulphur content is one the
most significant advantages of bio fuels.
Calorific Value
The upper (higher or gross) calorific value is the heat of combustion, calculated assuming
that all of the water in the products has condensed to liquid. Lower (or net) value is
obtained in the case where none of the water is assumed to condense (46).
The use of gross or net calorific value varies with type of industry. Engine and gas turbine
manufacturers, for example, use net calorific value, whereas UK boiler manufacturers use
gross when stating the efficiency of their plant (47).
The calorific value for oils and fats is lower when compared to mineral fuels due to the
oxygen content.

21
Flash Point
Flash point temperature is measured to assess the tendency of the fuel to form a flammable
mixture with air. The flash point can indicate the possible presence of highly volatile and
flammable materials in a relatively non-volatile or non-flammable material (48). Crude bio
fuels have a higher flash point compared to mineral fuels (31).
Cetane Number
The cetane number characterizes the time between injection and combustion in a diesel
engine. The higher the number, the more flammable the fuel. The cetane numbers obtained
for most vegetable oils are between 29 and 43 as opposed to 45–55 for diesel (32).
It has been noted that a cetane number is not applicable for heavy residual fuels as an
indicator of ignition quality. The concept of an ignition index based on viscosity and
density was developed (31, 32). The CCAI (Calculated Carbon Aromaticity Index) is a
unit-less number allowing ranking the ignition qualities of different residual fuel oils: the
lower the number, the better the ignition characteristics. The CCAI does not give an
absolute measure of ignition performance since this is much more dependent upon engine
design and operating conditions (49).
Due to the complex structure and composition of tallow, a cetane number or calculated
indexes may not be appropriate criteria for assessment of its ignition quality.
22
Table 2.4 Standard fuels and triacylglycerols as fuels for CI engines - comparison of selected properties
CI
Engine
Fuel
Density Viscosity Carbon
residue
Iodine
number
Lower
calorific
value
Flash
point
Cetane
number
Sulphur
content Ref.
kg/m3
@25°C mm2/s@30°C % w/w gI2/kg MJ/kg °C - mg/kg
Diesel 820-845a 2.0-4.5c 0.30 N/A 41.4-42.7 55 46-50 10 (37,
50-52)
Diesel – Class A2
820a 1.5-5.5c 0.30 N/A 42.3 56 Min 45 0.2 [%] (53)
FAME 860-900a 3.5-5.0c 0.30 120 37.1 101 47-51 10 (27, 54)
HFO – RMA 30
960a 30b 10 N/A
39.8-41.5
60 - 3.5 [%] (31, 40, 55)
HFO – RMK 700
1010a 700b 22 N/A 60 - 4.5 [%] (31, 40, 55)
Coconut 915-920 32-40 - 7.5-10.5 35.0-35.8 228 37 0.01-4
(4, 27, 31, 32, 51, 56, 57)
Corn 915-920 60-64/35c 0.24 118-128 37.8-39.5 277 38-42 0.01 (4, 31, 50)
Cotton 916-918 50-73/34c - 98-118 36.7-39.7 234-243
38-41.8 0.01 (4, 31, 50)
Jathropa 901-940 25-53c 0.20-0.40 94 38.9 180-280
33.7-51 0.01
(31, 32, 58, 59)
Palm 915/889b 95-106/39.6c - 46-56 36.5-36.9 280 42 <1 (4, 31, 60, 61)
Rapeseed 915 34-39c 0.30 98 36.8-37.4 320 37.6 0.01-2.6 (27, 31, 62)
Soybean 917-921 58-63 0.27 123-139 37.3 330 37.9 0.01 (4, 31)
Sunflower 918-923 55-62/34c 0.23 125-136 36.5-37.8 316 37 0.01 (4, 31, 50, 63)
Waste Oil 910-940 72.6 - 107-115 39.2-39.6 312-314
36-37 0.02 (64, 65)
Animal fat 890-920 40-55c 0.36 40-49 36.5-39.8 268 ~40 <0.01 (52, 66-68)
a – at 15°C b – at 50°C c – at 40°C

23
A comparison of selected properties of various vegetable oils and animal fat is given in
Table 2.4. Many of the physical and chemical properties of liquid vegetable oils are similar
to those of fossil fuels. However, there are also differences that affect engine operation.
The main differences are (27, 69):
- The energy content is about 8–14% lower.
- The flash point is very high.
- The sulphur content is very low.
- The acidity of certain vegetable oils is higher.
- The cloud point / cold filter plugging point of certain vegetable oils is higher.
- The viscosity and surface tension are higher
- Vegetable oils have a different distillation curve – up to 250°C little volume of
vegetable oil can be distilled, above that temperature, oil can be thermo cracked
and follows a decomposition process.
Researchers from Wartsila (69) recommend paying attention to the following issues when
comparing the properties of liquid bio fuels and fossil fuels:
- Solidification properties - the fuel injection equipment and fuel system must be
designed to avoid filter clogging and breakage.
- Acidity corrosion should be avoided.
- Contents of ash constituents fouling the exhaust gas system, combustion chamber
components, and the catalyst elements in the SCR and oxidation catalyst, should be
avoided.

24
- Lower energy content - an adequate flow capacity in the fuel injection system is
needed.
Usage of tricylglycerols as engine fuels has several considerable advantages (32):
- They are produced in rural areas and can contribute to the local economy.
- They are biodegradable and they are a renewable fuel with a short carbon cycle
period (1–2 years compared to millions of years for petroleum fuels) and are
environmentally friendly.
- They have physical and combustion characteristics similar to those of pure diesel
oil.
- They have a low sulphur content compared to pure diesel oil.
- They have a flash point higher than that of diesel oil thus are safer for use.
Some manufacturers allow usage of crude biofuels in their engines. Guiding specifications
are given for two stroke engines (Table 2.5) and four stroke engines (Table 2.6).
25
Table 2.5 Guiding biofuel specification for MAN B&W two-stroke low speed diesel engines (40)
Designation Unit Limit 1)
Density at 15°C kg/m3 1010
Kinematic viscosity at 100°C 2)
cSt 55
Flash point °C >60
Carbon residue % (m/m) 22
Ash % (m/m) 0.15
Water % (m/m) 1.0
Sulphur 3) % (m/m) 5.0
Vanadium ppm (m/m) 600
Aluminium + Silicon mg/kg 80
Sodium plus potassium ppm (m/m) 200
Calcium ppm (m/m) 200
Lead ppm (m/m) 10
TAN (Total Acid Number) mg KOH/g 4)
<25
SAN (Strong Acid Number) mg KOH/g 0
1) Valid at inlet to centrifuge plant 2) Pre-heating down to 15 cSt at engine inlet flange is to be ensured 3) Iodine, phosphorus and sulphur content according to agreement with emission controls maker 4) Experience shows that a high Total Acid Number has influence on the time between overhaul of the engine fuel system and, therefore, need to be adjusted accordingly
26
Table 2.6 Liquid biofuel specification for Wärtsilä 4-stroke engines (69)
Property Unit Limit Test method reference
Viscosity, max. cSt @ 40 °C 100 ISO 3104
Viscosity, min. cSt 1.8 - 2.8 1) ISO 3104
Injection viscosity, max.
cSt 24 ISO 3104
Density, max. kg/m3 @ 15 °C 991 ISO 3675 OR 12185
Ignition properties 2) FIA test
Water, max. before engine
% V/V 0.20 ISO 3733
Carbon residue (micro method),max.
% m/m 0.30 ISO 10370
Flash point (PMCC), min.
°C 60 ISO 2719
Pour point, max. °C 3) ISO 3016
Cloud point, max. °C 3) ISO 3015
Cold fi lter plugging point, max.
°C 3) IP 309
Total sediment existent, max.
% m/m 0.05 ISO 10307-1
Sulphur, max. % m/m 0.05 ISO 8754
Ash, max. % m/m 0.05 ISO 6245
Phosphorus, max. mg/kg 100 ISO 10478
Silicon, max. mg/kg 10 ISO 10478
Alkali content (Na+K), max.
mg/kg 30 ISO 10478
Copper strip corrosion, (3 hrs @ 50°C) max.
Rating 1b ASTM D130
Steel corrosion (24/72hrs @ 20, 60, 120°C), max.
Rating No signs of corrosion LP 2902
Acid number, max. mg KOH/g 5.0 ASTM D664
Strong acid number, max.
mg KOH/g 0.0 ASTM D664
Iodine number, max. 120 ISO 3961
1) depends on the engine model 2) To be equal or better than the requirements for fossil fuels, i.e. CI min. 35, CCAI max. 870 3) To be at least 10 °C below fuel injection temperature

27
2.8 Potential of Tallow for Biodiesel Production
Usage of tallow for biodiesel production has been described by other researchers (70-79).
High and variable acidity level (free fatty acid - FFA content) required a two stage
transesterification process. The FFA removal stage has an impact on yield and feasibility
of biodiesel production. Therefore, this use of tallow has not been described in this thesis.
2.9 Combustion of Neat Fat in Internal Compressed Ignition Engine
The majority of researchers focused on the combustion of triacylglycerols of vegetable
origin. Animal fat, due to its different chemical composition and production process may
present challenges in application as fuel, hence should be described separately.
Some researchers attempted to use preheated animal fat as fuel for automotive scale
engines. Takayuki (66) used a 411cc Mitsubishi engine and animal fat preheated to 60°C.
A decrease in NOx emissions by 10-15% is reported accompanied by an increase of CO
and HC emissions, especially for low loads. PM emissions were higher than for diesel fuel
at high load. Lower cylinder pressure and shorter ignition delay was recorded for animal
fat. Decreased engine output is associated with lower calorific value of the fat.
28
Kleinova (80) presented results of tests conducted on VAG engines – 1.9 TDI (rotary
pump) and 2.5 TDI (pump injector unit). Decrease in engine performance is explained as
being related to the lower energy content of bio fuels (lard and chicken fat). Very low CO
and HC emissions are reported; also the NOx level is lower when compared to results
obtained for engines fuelled with diesel. The authors suggest than problematic operation of
engines fuelled with triglycerides can be associated with poor fuel atomisation and low
injection pressure. It is claimed that in the case of using a high pressure common rail
system, it is possible to achieve good results for bio fuels. Paper contains a conclusion to
disregard results obtained for triglycerides fuels in engines equipped with fuel supply
systems different from common rail.
Kumar (52) ran a series of tests on a Lister Petter TS1 – 630cc engine. Animal fat was
preheated to 30, 40, 50, 60 and 70⁰C. Peak pressure and rate of pressure rise are lower with
animal fat at low temperature as compared to diesel. Increasing fuel temperature results in
an increase of both measured parameters. Ignition delay is higher for animal fat at all tested
loads. Ignition delay depends on fuel temperature, for higher temperatures reduced delay
has been reported. Heat release rates are lower for animal fat with a tendency to increase
for elevated fuel temperatures. Operation on bio fuel resulted in an increased exhaust
temperature. Emissions of CO and HC are higher with animal fat as compared to diesel.
However, fuel pre heating reduces these emissions. Emissions of NOx were lower with a
tendency to increase with elevated fuel temperature. Obtained results were confirmed by
another member of the same research team – Kerihuel (81).
29
Figure 2.9 Typical engine test bed with dual fuel supply system used for triacylglycerol fuels testing (52)
Research published by Mormino (67) was conducted at a test bed incorporating a four
stroke turbocharged diesel engine without charge air cooler .A Volvo TD 60 B six cylinder
engine has a swept volume of 913 cc per cylinder. The combustion process and resulting
emissions from diesel, vegetable oils and animal fat were compared. Animal fat was
preheated to 70 ⁰C. Ignition delay for animal fat was shorter; the difference was more
significant for lower test speeds (rpm). The lower emissions of nitrogen oxides were
explained by a limited premixed combustion phase and lower temperature in the
combustion chamber. Lower emissions of soot were reported, the difference was
30
associated with the oxygen content and lack of aromatic compounds in fat. Hydrocarbons’
emissions were higher for oils and fat when compared to diesel as a result of less effective
atomization.
Kapusta (68) briefly described research conducted by Wartsila with regard to potential
usage of various bio fuels for large generating sets. Tests were performed at two research
power plants (VTT and Pieksamaki) equipped with Wartsila 4R32LN and 6L20 engines. A
view of the Pieksamaki research power plant with a description of its main components is
given in Figure 2.10. Significant reduction in soot emissions was observed for animal fat
(up to 60%). While emission of nitrogen oxides was comparable for all tested fuels, a
slight increase in hydrocarbons’ emission was detected. Researchers concluded that fuel
quality and preparation is crucial for problem free engine operation.

31
Figure 2.10 Pieksamaki research power plant (69)
Reported results are combined together and presented in Table 2.7. It has to be noted that
conclusions made by other researchers are not consistent. For example, in the case of
nitrogen oxides’ emissions, the assessment varies from a significant reduction in the case
of a small engine fuelled with animal fat supplied at low temperature, while on the other
hand, for a large engine with a fuel preheating system, an increase of those emissions is
reported.

32
Table 2.7 Comparison of combustion characteristics and emissions obtained at a range of testing conditions for engines fuelled with animal fat with values obtained for fossil fuels
Ref
Test Conditions Combustion Characteristics Emissions Specific Fuel Consumption Engine Load Fuel
temp Peak
Pressure Ignition delay
Heat Release
Rate NOx CO HC Smoke
Takayuki (66) Mitsubishi D800
LL 60 - - - + + ~a + HL 60 - - - - - - +
Kleinova (80) VW 1.9 TDI & 2.5 TDI
LLb - + ~ + + HLc - ~ + + +
Kumar (52) Lister Petter TS1
LL 30 - - + + - + LL 70 - ~ ~ - + HL 30 - - + + - - - - + + + + - + HL 70 - + - - - - ~ - - +
Mormino (67) Volvo TD60B
Range 70 - - - - + d +
Kapusta (68) Wartsila 6L20
LL + + ~ - - HL + + + - -
Where: ‘+’ – increase, ‘+ +’ - significant increase, ‘-‘ – decrease, ‘- -‘ - significant decrease, ‘~’ – comparable result, LL – low load, HL – high load, a – decrease in PM emissions was also reported, b - at speed of 60 km/h, c - at speed of 120 km/h, d – decrease in soot emissions also reported, not significant difference for low speeds

33
There is no full set of test results (including emissions and combustion characteristics) for
a large diesel engine, which may be used by the rendering industry to offset part of their
electricity demand by utilising animal fat for renewable electricity generation. Hence,
conducting a research programme, as described in this thesis, which aims to investigate
various aspects of neat animal fat application as fuel for internal combustion engines, is
justified.

34
2.10 Emissions Abatement Methods for Large Engines
The research power plant described in this thesis was granted special permission by the
Environment Agency to conduct a trial test of the animal fat combustion in a large diesel
engine. At the end of the trial, an abatement system enabling compliance with given limits
should be proposed and installed. Review of available methods typical for large diesel
engines is presented in following section.
2.10.1 Nitrogen Oxides Emissions Abatement
2.10.1.1 Classification of Abatement Methods
There are various method classification criteria. Wartsila segregates methods as ‘dry’ or
‘wet’. ‘Dry’ methods can be characterised by modification and optimisation of engine
operation through fuel injection strategy alteration and modification of combustion
chamber shape. NOx reduction in ‘wet’ methods is achieved thanks to water presence in
the combustion chamber. MAN B&W divides methods into ‘primary’ – where
modifications prevent NOx formation and ‘secondary’ where exhaust after treatment needs
to be applied.

35
2.10.1.2 Exhaust Gas Recirculation
The Exhaust Gas Recirculation method’s working principle is the feeding of a portion of
the exhaust gas back to the cylinder. Nitrogen oxides emission depends on partial pressure
of reagents – oxygen and nitrogen. The partial pressure can be altered by modification of
charge composition in the cylinder. NOx emission can be reduced if oxygen concentration
is lowered (dilution effect). Exhaust recirculation results in increased heat capacity of the
cylinder charge (thermal effect). Carbon dioxide and water, present in the exhaust, can
potentially, dissociate at high temperatures and take part in the combustion process
(chemical effect) (82). EGR cooling is necessary to prevent soot emissions from rising to
unacceptable levels and to avoid a significant drop in engine efficiency. The need for EGR
cooling is more evident at high EGR rates and low engine speeds (83).
Possible layouts of the EGR system are shown in Figure 2.11. Exhaust gas can be fed back
before (case 1) or after (case 2) the turbocharger. Other researchers point out that charge
dilution should be applied in circumstances where clean gas with low oxygen content is
available (case 3) (44). For this reason, the EGR is disregarded as a NOx abatement method
for marine applications by Wartsila (45). However, high reduction potential has to be
noted, according to (44, 84), 5% recirculation can reduce NOx emission by 30%. Results of
tests conducted by MAN B&W on a 4T50MX engine are given in Figure 2.12.

36
Figure 2.11 Different layouts for EGR system; case 1 – high pressure EGR, case 2- low pressure EGR, case 3 – charge dilution (44)
Figure 2.12 Effect of EGR on the 4T50MX engine emission (44)

37
2.10.1.3 Optimisation of Injection Strategy
NOx emissions can be lowered by alteration of injector type. Large engine manufacturers
implemented various solutions to improve fuel atomisation and provide better injection
control. Wartsila introduced the RT-flex engine family equipped with a common rail
injection system. MAN B&W introduced the ME engine family equipped with an
individual electronic module responsible for fuel injection for each cylinder and a
hydraulic exhaust valve actuator. The ME engine control system layout is shown in Figure
2.14.
Figure 2.13 presents a development process, starting with basic injection flow (InFl basic)
optimised for low fuel consumption and used in production engines (Standard MC).
Injection strategy management can lead to NOx emission reduction by even 20% (fuel
consumption penalty of 3%) – for example via pilot injection introduction (pre-injection).
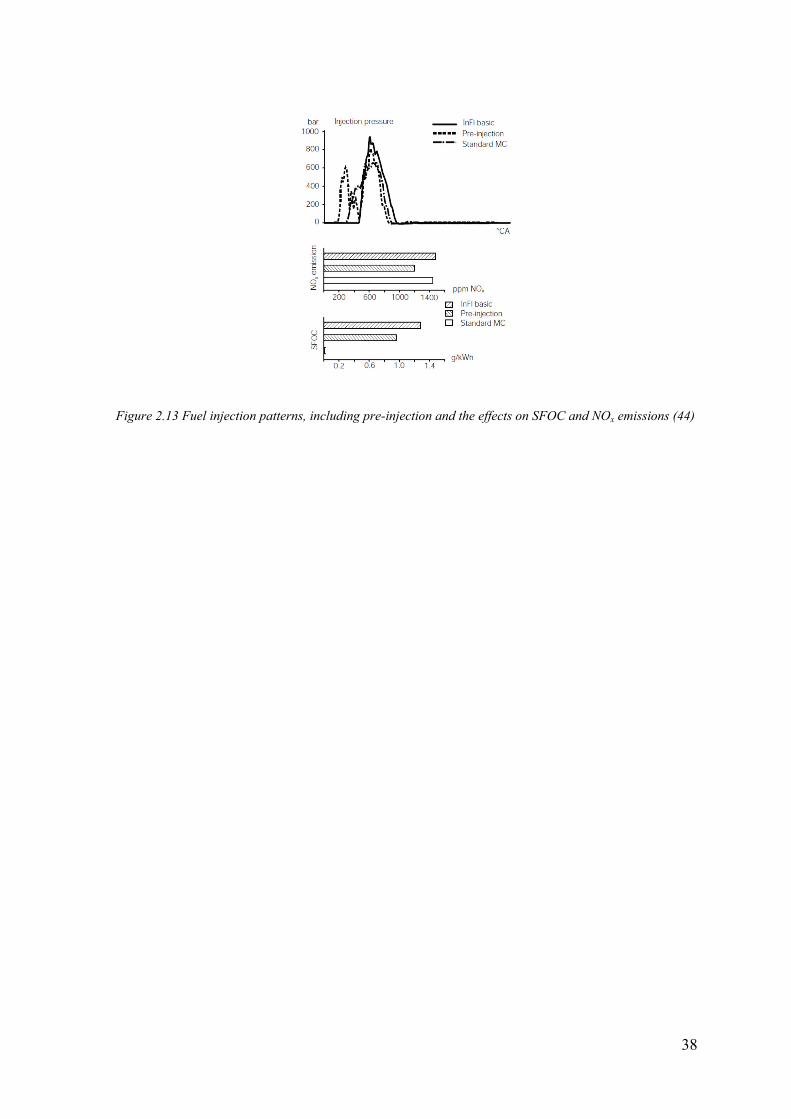
38
Figure 2.13 Fuel injection patterns, including pre-injection and the effects on SFOC and NOx emissions (44)

39
Figure 2.14 MAN ME engine control system layout

40
2.10.1.4 SCR – Selective Catalytic Reduction
The working principle of the method is mixing exhaust gases with ammonia NH3, typically
supplied as urea, and passing it through a catalytic reactor where nitrogen oxides are
reduced to N2 and H20 at a temperature of 300 – 400⁰C. The following reactions occur
once the urea has been decomposed and hydrolysed (85, 86):
4 NO + 4 NH3 + O2 = 4 N2 + 6 H2O (NO SCR)
6 NO2 + 8 NH3 = 7 N2 + 12 H2O (NO2 SCR)
NO + NO2 + 2NH3 = 2N2 + 3H2O (Fast SCR)
The main advantage of this method is very high efficiency, reaching even 98%.
Complicated installation, shown in Figure 2.15, resulting in higher capital expenditure and
maintenance cost is a disadvantage. Despite the reaction of NOx reduction – a reversion
process occurs as well. Calculation of both reaction coefficients at various temperatures
can determine the appropriate operational temperature for the reactor. For low
temperatures the reactor will not achieve its desired reduction efficiency. For higher
temperatures ammonia will be burned before reduction reaction occurs. NOx reduction
depends also on the amount of added ammonia – for higher concentrations, ammonia slip
may occur – therefore a precise dosing system is required for efficient SCR operation.
Another variable that may have impact on the SCR system reduction efficiency is location
and type of ammonia injectors (44, 84).
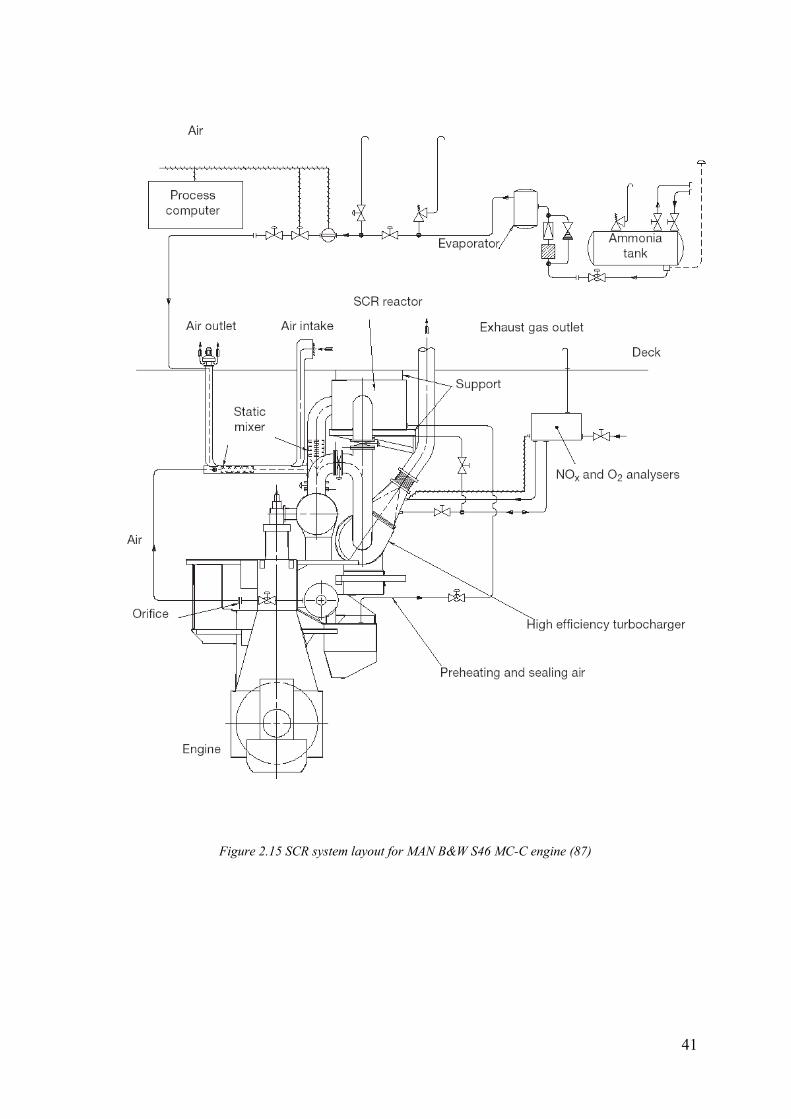
41
Figure 2.15 SCR system layout for MAN B&W S46 MC-C engine (87)

42
2.10.1.5 Usage of Water
The combustion process in a CI engine can be characterised by high local air excess ratios.
Formation of nitrogen oxides can be reduced by lowering the temperature in the
combustion chamber. It can be achieved through introduction of water, which absorbs heat
via evaporation. Water can be delivered to the combustion chamber in various ways: with
an additional water injector, through injection into the engine intake, supply the engine
with water-fuel emulsion (88). CASS – (Combustion Air Saturation System) is an example
of a system using water injection into the engine intake. A reported high reduction
efficiency of 50-60% with no fuel penalty is accompanied by high fresh water
consumption. Lower water consumption can be achieved through direct water injection
(45).
2.10.2 Reduction of Sulphur Oxides Emissions
Sulphur present in fuel is oxidised to sulphur oxides in the combustion chamber. Sulphur
oxides’ emission is proportional to sulphur content in the fuel (45). The only viable method
of SOx emission is usage of low fuels with low sulphur content. It is reflected in the
introduction of SECAs (Sulphur Emission Control Area) (89-91) where ships have to use
low sulphur fuels.
43
2.11 Summary
The following conclusions and predictions can be made based on the presented literature
review:
- Animal fat atomisation can be affected by its physical properties.
- Atomisation can be assessed by optical methods – changes in Sauter Mean
Diameter (SMD).
- Emission of carbon monoxide can be used as an indicator of atomisation quality.
- Atomisation can be improved by:
o Increase of fuel temperature
o Increase of injection pressure.
- For good atomisation the benefit of the oxygen content may lead to a decrease of
CO, HC and soot emissions.
- Emissions of NOx may increase for high fuel temperatures.
- Calorific value of the tallow is lower – it may decrease the engine performance
(max power).
- High acidity may lead to corrosion of the fuel supply system.
- No abatement system for SO2 should be required due to low sulphur content of the
animal fat.
44
Chapter 3 FEASIBILITY OF ELECTRICITY GENERATION WHEN
USING AN INTERNAL COMBUSTION ENGINE FUELLED WITH
TALLOW AS THE PRIME MOVER
3.1 Factors Affecting Feasibility of Electricity Generation
In this chapter renewable electricity and heat production support in the UK is described.
Tallow prices recorded in 2009 are given. Fuel price, combined with additional subsidies
available in 2009, are used to calculate the feasibility of a research power plant operation.
The feasibility of electricity generation from animal fat in power plants using reciprocating
engines depends on the following factors:
- Electricity price (selling price)
- Fuel price
- Subsidies for renewable electricity/heat producers.

45
3.2 Supporting Legislation for Renewable Electricity Generation
3.2.1 The History of Renewable Energy Support System
3.2.1.1 Fossil Fuel Levy and Non Fossil Fuel Obligation
Fossil Fuel Levy
In the late 1980s the UK Government decided to privatise and deregulate the energy
industry. Privatisation of the nuclear energy sector turned out to be a challenge. Private
investors refused to accept all the risks and liabilities linked with nuclear power. Energy
generated by nuclear plants was more expensive than energy derived from fossil fuels.
The government thus kept the nuclear energy sector in public hands. To cover additional
costs and protect the generators, a Non Fossil Fuel Obligation together with a Fossil Fuel
Levy system, were then introduced in 1989 (92).
Energy distributors were forced to purchase electricity generated by nuclear power
stations. The levy was imposed on fossil fuel based power, and was set by an independent
electricity regulator. Through this mechanism, the government made all consumers pay the
extra costs for the ‘benefits’ of nuclear production by applying a broad carbon tax on the
rest of the sector (93). The Fossil Fuel Levy Rates are given in Table 3.1.
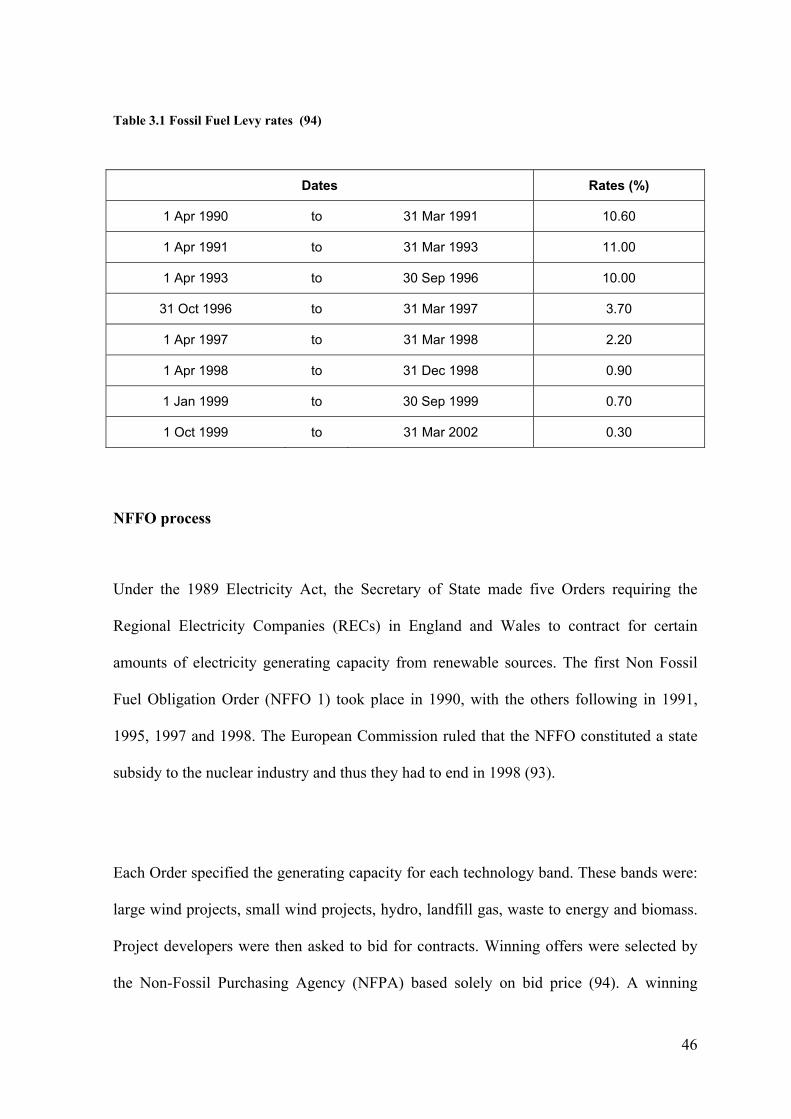
46
Table 3.1 Fossil Fuel Levy rates (94)
Dates Rates (%)
1 Apr 1990 to 31 Mar 1991 10.60
1 Apr 1991 to 31 Mar 1993 11.00
1 Apr 1993 to 30 Sep 1996 10.00
31 Oct 1996 to 31 Mar 1997 3.70
1 Apr 1997 to 31 Mar 1998 2.20
1 Apr 1998 to 31 Dec 1998 0.90
1 Jan 1999 to 30 Sep 1999 0.70
1 Oct 1999 to 31 Mar 2002 0.30
NFFO process
Under the 1989 Electricity Act, the Secretary of State made five Orders requiring the
Regional Electricity Companies (RECs) in England and Wales to contract for certain
amounts of electricity generating capacity from renewable sources. The first Non Fossil
Fuel Obligation Order (NFFO 1) took place in 1990, with the others following in 1991,
1995, 1997 and 1998. The European Commission ruled that the NFFO constituted a state
subsidy to the nuclear industry and thus they had to end in 1998 (93).
Each Order specified the generating capacity for each technology band. These bands were:
large wind projects, small wind projects, hydro, landfill gas, waste to energy and biomass.
Project developers were then asked to bid for contracts. Winning offers were selected by
the Non-Fossil Purchasing Agency (NFPA) based solely on bid price (94). A winning
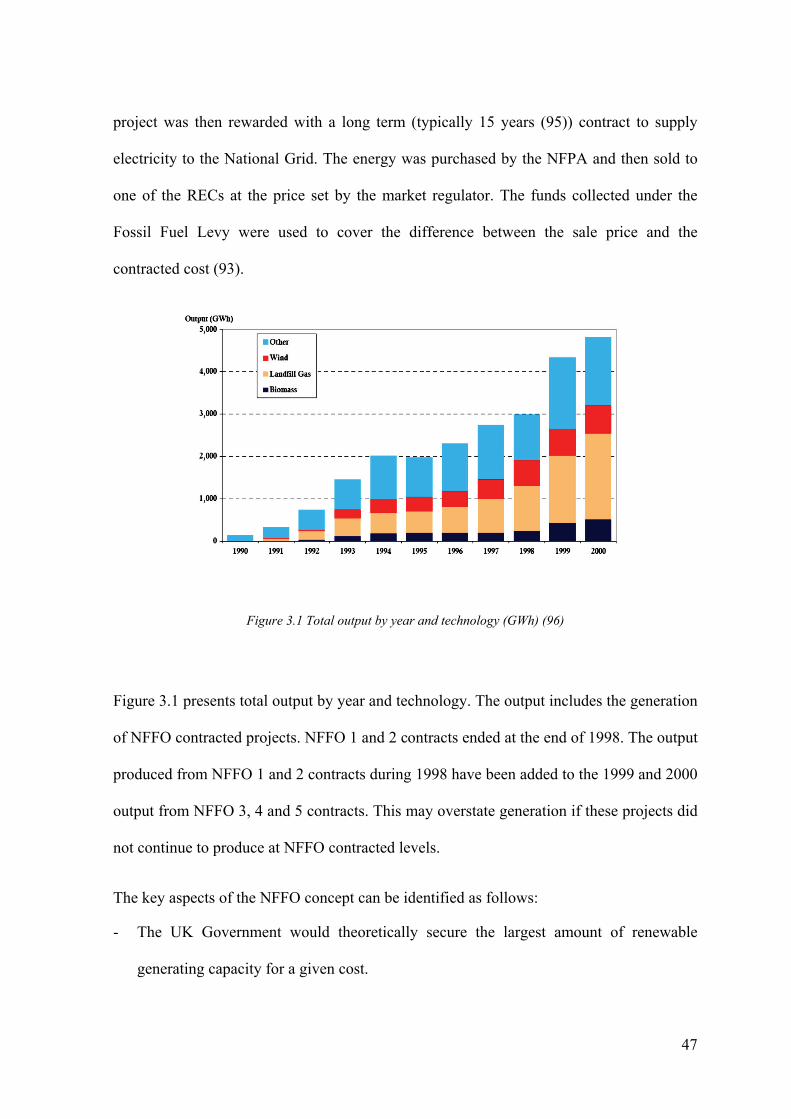
47
project was then rewarded with a long term (typically 15 years (95)) contract to supply
electricity to the National Grid. The energy was purchased by the NFPA and then sold to
one of the RECs at the price set by the market regulator. The funds collected under the
Fossil Fuel Levy were used to cover the difference between the sale price and the
contracted cost (93).
Figure 3.1 Total output by year and technology (GWh) (96)
Figure 3.1 presents total output by year and technology. The output includes the generation
of NFFO contracted projects. NFFO 1 and 2 contracts ended at the end of 1998. The output
produced from NFFO 1 and 2 contracts during 1998 have been added to the 1999 and 2000
output from NFFO 3, 4 and 5 contracts. This may overstate generation if these projects did
not continue to produce at NFFO contracted levels.
The key aspects of the NFFO concept can be identified as follows:
- The UK Government would theoretically secure the largest amount of renewable
generating capacity for a given cost.

48
- By giving developers secure long-term contracts, financing would be relatively easy to
come by and also cheap.
- The price of each technology would be revealed, and through successive competitions,
driven down (93).
The Impact of NFFO
The Department of Trade and Industry asked the Frontier Economics and Byrne O’Cleirigh
consultancy companies to evaluate support for renewable energy under the NFFO. The
final report has been prepared (96) and its results can be summarised as follows:
The NFFO has encouraged the uptake of renewable technologies, especially in landfill gas
and onshore wind. In total, over 3200 MW capacity has been contracted through the NFFO
in England and Wales. It has been estimated that nearly 24000 GWh have been produced
by the NFFO contracted plants. The competitive NFFO process has helped to identify
competitive prices for renewable energy and has enabled the government to maximise
contracted capacity at the lowest cost. Electricity from NFFO contracted plants has
replaced a significant amount of fossil-fuel production (96).
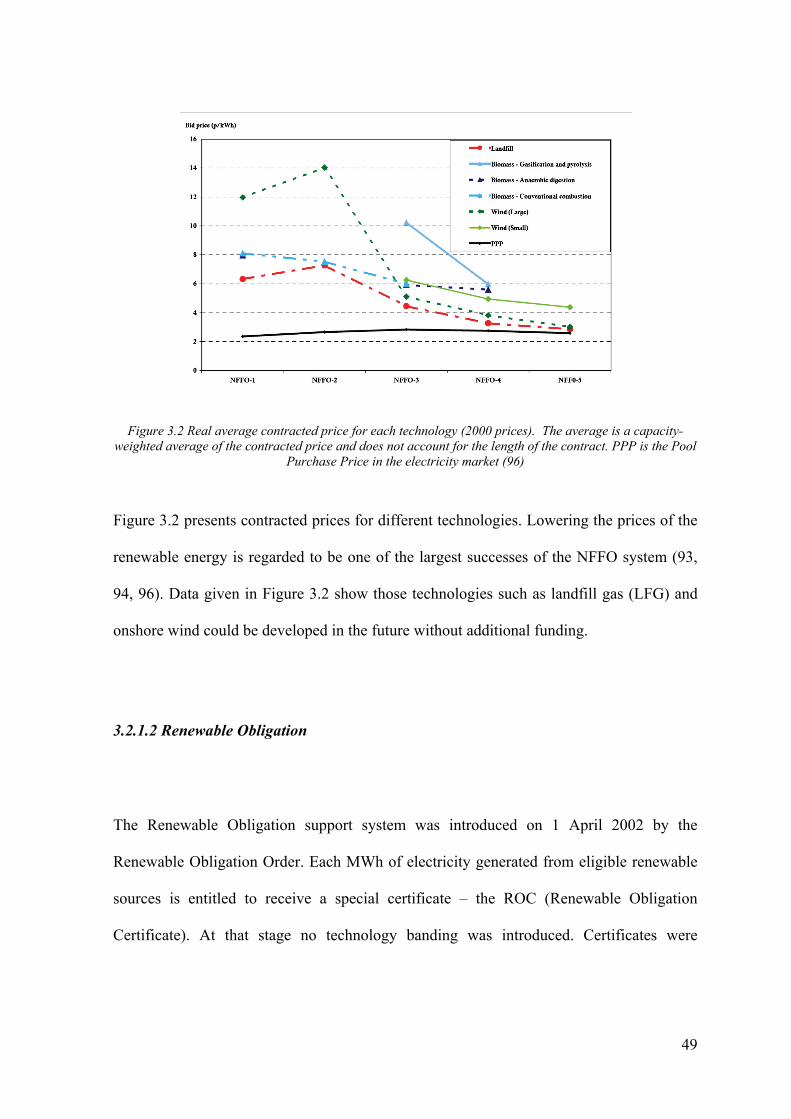
49
Figure 3.2 Real average contracted price for each technology (2000 prices). The average is a capacity-weighted average of the contracted price and does not account for the length of the contract. PPP is the Pool
Purchase Price in the electricity market (96)
Figure 3.2 presents contracted prices for different technologies. Lowering the prices of the
renewable energy is regarded to be one of the largest successes of the NFFO system (93,
94, 96). Data given in Figure 3.2 show those technologies such as landfill gas (LFG) and
onshore wind could be developed in the future without additional funding.
3.2.1.2 Renewable Obligation
The Renewable Obligation support system was introduced on 1 April 2002 by the
Renewable Obligation Order. Each MWh of electricity generated from eligible renewable
sources is entitled to receive a special certificate – the ROC (Renewable Obligation
Certificate). At that stage no technology banding was introduced. Certificates were
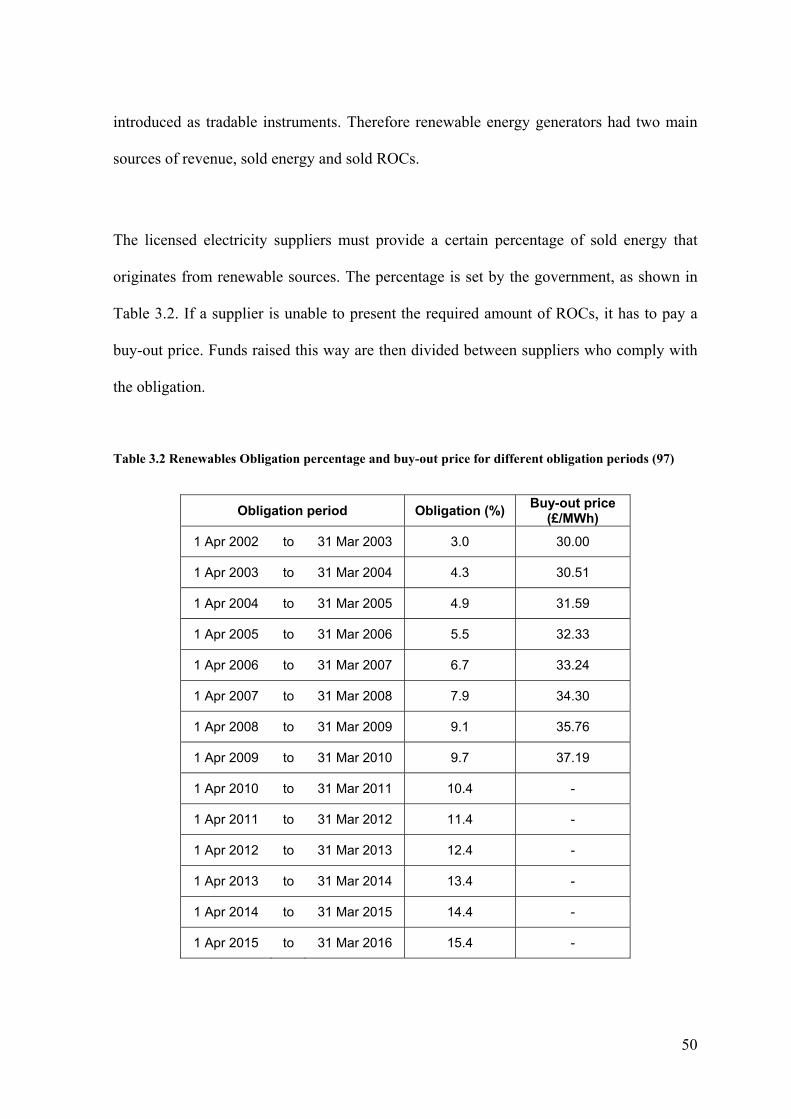
50
introduced as tradable instruments. Therefore renewable energy generators had two main
sources of revenue, sold energy and sold ROCs.
The licensed electricity suppliers must provide a certain percentage of sold energy that
originates from renewable sources. The percentage is set by the government, as shown in
Table 3.2. If a supplier is unable to present the required amount of ROCs, it has to pay a
buy-out price. Funds raised this way are then divided between suppliers who comply with
the obligation.
Table 3.2 Renewables Obligation percentage and buy-out price for different obligation periods (97)
Obligation period Obligation (%) Buy-out price
(£/MWh)
1 Apr 2002 to 31 Mar 2003 3.0 30.00
1 Apr 2003 to 31 Mar 2004 4.3 30.51
1 Apr 2004 to 31 Mar 2005 4.9 31.59
1 Apr 2005 to 31 Mar 2006 5.5 32.33
1 Apr 2006 to 31 Mar 2007 6.7 33.24
1 Apr 2007 to 31 Mar 2008 7.9 34.30
1 Apr 2008 to 31 Mar 2009 9.1 35.76
1 Apr 2009 to 31 Mar 2010 9.7 37.19
1 Apr 2010 to 31 Mar 2011 10.4 -
1 Apr 2011 to 31 Mar 2012 11.4 -
1 Apr 2012 to 31 Mar 2013 12.4 -
1 Apr 2013 to 31 Mar 2014 13.4 -
1 Apr 2014 to 31 Mar 2015 14.4 -
1 Apr 2015 to 31 Mar 2016 15.4 -

51
As the amount of ROCs is limited due to the small number of accredited generators, ROCs
are traded through auction systems. The electronic auction system is administrated by the
Non-Fossil Purchasing Agency (NFPA). Figure 3.3 presents the historic record of auction
ROCs prices.
Figure 3.3 Track record for ROC auction prices by Compliance Period (CP) (98)
As no technology banding was introduced, all power plants using internal combustion
engines fuelled with gaseous fuels such as sewage gas, landfill gas or biogas are entitled to
the same level of support. However, plants using bio fuels have to agree to and accredit the
Fuel Measurement and Sampling procedure. Since 2007 ‘own use’ electricity is also
entitled for support within the RO scheme (95). Different rules apply to micro generators
(DNC less than 50kW).

52
3.2.2 Existing Support Policy
3.2.2.1 Climate Change Levy and Levy Exemption Certificates
Climate Change Levy (CCL)
The Climate Change Levy (CCL) is an environmental tax that came into force on 1 April
2001. The levy is chargeable on the industrial and commercial supply of taxable
commodities for lighting, heating and power used by consumers in the following sectors of
business:
- industry
- commerce
- agriculture
- public administration, and
- other services.
The levy does not apply to taxable commodities used by domestic consumers, or by
charities for non-business use (99). The tax is applied as a rate per unit of energy. Each
category of commodity has a specific rate of the tax .
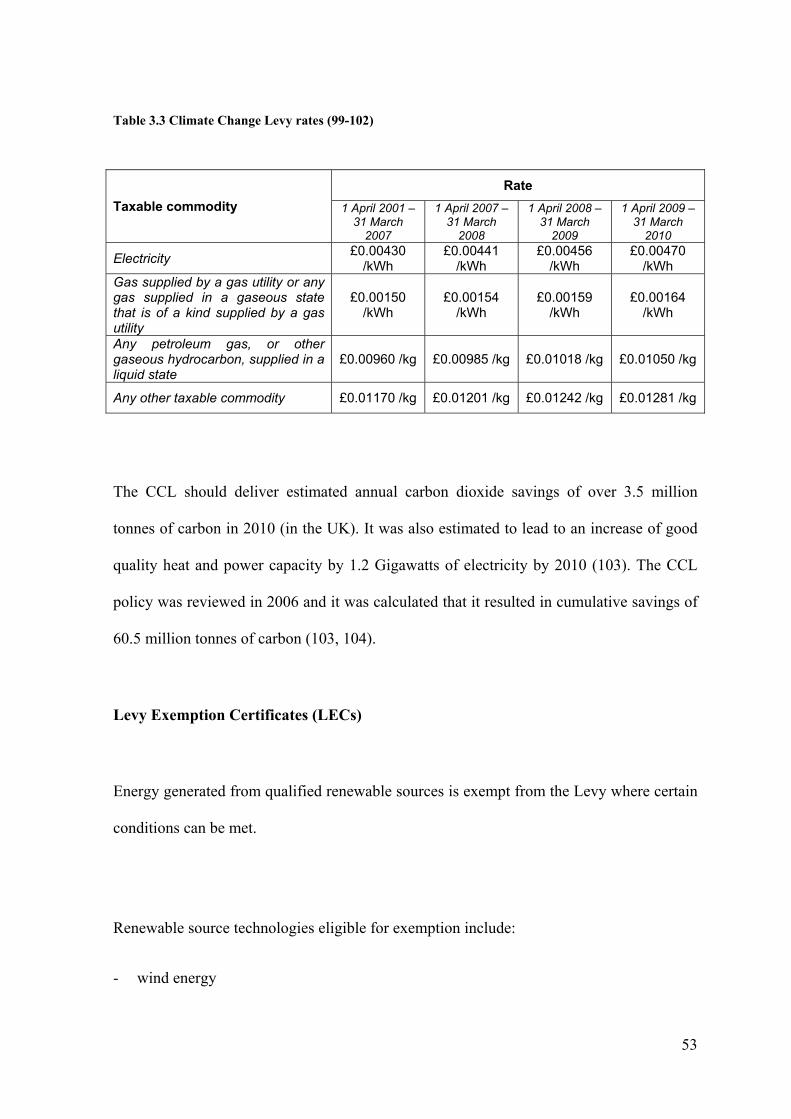
53
Table 3.3 Climate Change Levy rates (99-102)
Taxable commodity
Rate
1 April 2001 – 31 March
2007
1 April 2007 – 31 March
2008
1 April 2008 – 31 March
2009
1 April 2009 – 31 March
2010
Electricity £0.00430
/kWh £0.00441
/kWh £0.00456
/kWh £0.00470
/kWh Gas supplied by a gas utility or any gas supplied in a gaseous state that is of a kind supplied by a gas utility
£0.00150 /kWh
£0.00154 /kWh
£0.00159 /kWh
£0.00164 /kWh
Any petroleum gas, or other gaseous hydrocarbon, supplied in a liquid state
£0.00960 /kg £0.00985 /kg £0.01018 /kg £0.01050 /kg
Any other taxable commodity £0.01170 /kg £0.01201 /kg £0.01242 /kg £0.01281 /kg
The CCL should deliver estimated annual carbon dioxide savings of over 3.5 million
tonnes of carbon in 2010 (in the UK). It was also estimated to lead to an increase of good
quality heat and power capacity by 1.2 Gigawatts of electricity by 2010 (103). The CCL
policy was reviewed in 2006 and it was calculated that it resulted in cumulative savings of
60.5 million tonnes of carbon (103, 104).
Levy Exemption Certificates (LECs)
Energy generated from qualified renewable sources is exempt from the Levy where certain
conditions can be met.
Renewable source technologies eligible for exemption include:
- wind energy

54
- hydro power (up to 10 MW)
- tidal power
- wave energy
- photovoltaic cells
- photo conversion
- geothermal hot dry rock
- geothermal aquifers
- municipal and industrial wastes
- landfill gas
- agriculture and forestry wastes, and
- energy crops (105).
The Generators must be accredited by Ofgem (market regulator) for the renewable
electricity they generate. Exemption certificates (LECs) are then issued for each monthly
qualifying output. Certificates can be traded separately from the electricity for which they
were issued (106).
CHP stations are regarded to be one of the most effective ways of reducing the carbon
footprint. Therefore output from such plants may qualify for CCL exemption.
Whether a CHP Station qualifies for CCL exemption on its entire energy inputs and
outputs will be determined under the CHP Quality Assurance (CHPQA) programme
administered on behalf of the Department of Energy and Climate Change (DECC). Under

55
the programme rules, the Quality Index (QI), and Power Efficiency (PE) of a CHP station
are calculated from the fuel used, electricity generated, and heat supplied (107).
3.2.2.2 Renewable Obligation
The Renewable Obligation Order 2009 introduced several changes to the RO scheme. The
most important is technology banding, introduced to support more advanced technologies.
Banding details are given in Table 3.4. The Renewable Obligation scheme will remain
operational as support for large scale renewable projects. The Renewable Obligation Order
will implement few changes to the system. The lifetime of the scheme will be extended to
2037. The Generators will not be entitled to receive support for more than 20 years (108,
109).
Table 3.4 Renewable Obligation scheme technologies banding (95)
Technologies Level of support ROCs/MWh
Number of MWh to be
generated for 1 ROC to be
awarded
Landfill gas 0.25 4
Sewage gas, co-firing on non-energy crop (regular) biomass 0.5 2
Onshore wind; hydro-electric; co-firing of energy crops; co-firing on non-energy crop (regular) biomass with CHP; EfW with CHP; geo pressure; the use of fuels made using standard gasification or pyrolysis; other not specified
1.0 1
Offshore wind; co-firing of energy crops with CHP; dedicated regular biomass
1.5 2/3
Wave; tidal stream; fuels made using anaerobic digestion, advanced gasification or pyrolysis; dedicated biomass burning etidal impoundment; micro generation;
2.0 ½
56
3.2.2.3 Feed-in Tariffs
During the consultation regarding the 2008 Renewable Energy Strategy, many replies
indicated Feed in Tariffs (FITs) as the most appropriate support mechanism for distributed
and small scale electricity (109). Key characteristics of the mechanism are:
- Each kWh generated from an eligible source will receive a fixed payment depending
on the type of technology used (the ‘generation tariff’).
- Generators will be guaranteed a market for their exports at a long-term guaranteed
price (the ‘export tariff’). However, generators are entitled to individually negotiate the
price for exported electricity with suppliers.
- electricity can be used on-site (109).
The FITs were introduced on 1 April 2010 and cover generators with declared net capacity
(DNC) lower than 5MW (110). FIT supports generation technologies such as: anaerobic
digestion (AD), hydro, micro CHP, photovoltaic cells and wind turbines.
3.2.2.4 Renewable Heat Incentive
Choosing from many available support models the government has decided to introduce
the Renewable Heat Obligation as a support scheme for renewable heat. According to the
Ernst and Young (Consultants) report (111) the key characteristics of an RHO mechanism
would be:
57
Suppliers of heat guarantee a minimum percentage of heat demand to be met by
renewable heat applications (‘Obligation’), with the percentage increasing over
time to achieve a specific future target for renewable heat supplied as a proportion
of total heat demand.
Suppliers either pay a penalty if they fail to achieve their Obligation (‘Buy-Out’),
or obtain Heat Obligation Certificates (HOC) for metered renewable heat
generation that contributes to their Obligation.
Revenues from supplier penalties are recycled to compliant suppliers who meet
their obligation (111).
The RHI was introduced in April 2011 (112). The incentive is promoting various
technologies, including:
heat pumps,
solar thermal
biomass boilers
renewable CHP
use of biogas and bio-liquids
bio-methane injection into gas grid (112).

58
3.2.3 Combined Heat and Power
A CHP scheme must be accredited within the Good Quality CHP programme. The
accreditation process is conducted to prove that a particular plant provides significant
‘environmental and other benefits’ compared to best available energy supply alternatives
(113). Projects are assessed by analysing the Quality Index (QI). This factor was
introduced to compare the CHP schemes with other projects that generate power or heat
only. To calculate the QI the following formula (1) is used:
(1) HeatPower YXQI
(2) TFITPOPower CHPCHP /
(3) TFIQHOHeat CHPCHP / ,
Where: Total Power Output (CHPTPO) is the total registered annual power generation from a CHP Scheme
(MWhe) as measured at the generator terminals; Qualifying Heat Output (CHPQHO) is the total registered
amount of useful heat supplied annually from a CHP Scheme (MWhth). Total Fuel Input (CHPTFI) is the total
registered annual fuel input to a CHP Scheme (MWh). All numbers are based on Gross Calorific Value
(GCV)
For the proposed plants the following conditions must be met: QI > 105 and %20Power
(113). The X and Y coefficient values for new CHP schemes are given in Table 3.6.

59
Table 3.5 Coefficients for the calculation of QI for various sizes and types of new CHP scheme (113)
Technology Size [MWe]
X Y Techno- logy
Size X Y Techno- logy
Size [MWe]
X Y
Natural Gas (IC engines incl.)
≤1 249
115
By-Product Gases
≤1 294
120 Biomass or Solid Waste
≤1 370
120 1 – 10 195 1 – 25 221 1 – 25 370
10 – 25 191 > 25 193 > 25 220
25 – 50 186
Biogas
≤1 285
120 Wood Fuels
≤1 329
120 50 – 100 179 1 – 25 251 1 – 25 315
100 – 200 176 > 25 193 > 25 220
200 – 500
173 Waste Gas or Heat
≤1 329
120
> 500 172 1 – 25 299
Oil
≤1 249
115
> 25 193
1 – 25 191
Liquid Biofuels
≤1 275
120 > 25 176 1 – 25 191
Coal
≤1 249
115
> 25 176
1 – 25 191
Liquid Waste
≤1 275
120 > 25 176 1 – 25 260
Fuel Cell 180 120 > 25 176
3.2.4 Summary
It is very important to correctly determine all sources of revenue for a feasibility study of a
planned generating station. The majority of the data required to prepare a good feasibility
study is specific for the chosen engine and fuel type. Moreover, the revenue from the sale
of energy or offset, depends on agreement with the regional electricity supplier, thus it is
different for each project.
The RO banding introduced in 2009 resulted in reduced support for proven technologies
like landfill gas or sewage gas. Anaerobic digestion (AD) was granted a double value ROC
band. Landfill gas and sewage gas will not be supported under the new FIT scheme

60
designed for plants with DNC < 5MW. Small and medium scale biogas (AD) projects will
be supported with the highest subsidy reaching even £115/MWh.
Animal fat combustion can be supported only in the case of large (> 5MW) projects within
the RO scheme. Generating plants equipped with reciprocating engines can be used also as
sources of heat – combined heat and power – therefore additional support can be granted
from the RHI scheme.
3.3 Tallow Prices
The tallow market in the UK is limited to a few types of organizations, such as rendering
companies (producers), oleo chemical companies, biodiesel production companies, pet
food industry (clients). There is no open market for tallow – trade is done via direct
contracts between companies. Therefore data regarding tallow consumption and prices is
commercially sensitive. It corresponds with AEA findings presented in their report (6). For
the purpose of the project described in this thesis, the up to date price for Grade 6 Category
3 tallow has been obtained weekly. The data have been used for an electricity generation
feasibility analysis. Crude oil prices were obtained from BP (114, 115) – those reported are
weekly average prices of Brent crude oil. Comparison of tallow and crude oil prices is
shown in Figure 3.4. It has to be noted that animal fat price is given in GBP per tonne
while oil price is reported in USD per barrel. The presented data proves that to some extent
animal fat prices are linked with fossil fuel prices. The lack of consistency in the last few
weeks of 2009 can be explained by the higher availability of animal fat during the winter,

61
this could have stopped the price from rising along the trend line which was visible during
the earlier months of the year.
Figure 3.4 Comparison of animal fat (grade 6) and crude oil (Brent) prices in 2009 (114, 115)
3.4 Feasibility Study of 0.8 MWe Generating Plant
The following approach has been followed to assess a feasibility study of the research
power plant installed at the host company premises at Cheddleton, Staffs, England.
40
45
50
55
60
65
70
75
80
0
50
100
150
200
250
300
350
400
1 3 5 7 9 11 13 15 17 19 21 23 25 27 29 31 33 35 37 39 41 43 45 47 49 51 53
US
D/b
bl
GB
P/t
on
ne
Week
Animal Fat Brent Oil

62
Each kWh of energy generated by the test generator results in a lower electricity bill for the
host company. As the company has signed a long term contract, the price of energy units
can be treated as constant.
Energy is generated from a renewable source so it is entitled to be supported by the
Renewable Obligation System. The amount of money is related to the amount of MWh
generated. Therefore:
Income = MWh * ( A + B )
Where:
A – Electricity price (£/MWh)
B – Subsidy (£/MWh)
Fixed costs such as: emission monitoring system hire (£/week) or engine servicing cost
(£/year) were identified. The main variable cost is the price of fuel:
Expenditure = MWh * C
Where: C – fuel price (£/tonne)
The used model does not take depreciation into account as the engine used for the study
was not an up to date model and it was difficult to correctly estimate the cost of replacing
it. Analysis of animal price effect on generation feasibility has been conducted. Results are
given in Figure 3.5. It can be seen that for the given engine, at prices of animal fat

63
exceeding 300 GBP/tonne electricity production is not feasible. Only additional support in
form of ROCs can make electricity production from animal fat profitable, however, in the
case of a fuel price rise above 500 GBP/tonne, even subsidised production is not profitable.
Depending on the price, the fuel forms between 80-90% of total production cost.
Figure 3.5 Impact of animal fat price on electricity generation feasibility. Assumptions: electricity selling price - 92 £/MWh, ROC price - 45 £/MWh
3.5 Feasibility Study of Large Scale 20 MWe Generating Plant
A feasibility study for a proposed large (20 MW) power plant fuelled with animal fat has
been prepared. Two documents: Electrical Production Cost Study and Feasibility
Calculation, have been prepared by MAN B&W in cooperation with the Author for the
0
20
40
60
80
100
120
140
160
‐80
‐60
‐40
‐20
0
20
40
60
80
300 320 340 360 380 400 420 440 460 480 500
Pro
du
ctio
n c
ost
(£/
MW
h)
Pro
fit/
Lo
ss (
£/M
Wh
)
Animal Fat price (GBP/tonne)
Profit/Loss Profit/Loss (subsidised) Production cost
64
host company – John Pointon & Sons Ltd. The electrical production cost analysis gives a
total description of the economic flow in the financial period. The electricity, heat
production and the running costs were assumed to be constant throughout the financial
period. The sensitivity analysis covers the most important economical parameters, in order
to show the influence the changed values on the comparison between the plant alternatives.
The findings can be summarised as follows: electricity production from animal fat even in
a high efficiency (48%) two stroke reciprocating engine driven plant is not feasible without
additional support in the form of ROC or another scheme. Fuel price is responsible for
approximately 85% of the total running cost (including staff costs, servicing and
maintenance etc.). For a long payback time (25 years), electricity generation cost does not
fall below 85 £/MWh. At the time of the study preparation, price paid to electricity
generators was approximately at a level of 40 £/MWh.
3.6 Economics of Electricity Generation
Currently power plants using engine driven generators and fuelled with animal fat are
entitled to government subsidies in the form of Renewable Obligation Certificates. This
scheme supports the production of electricity in large (>5MW) stations using biomass.
Animal fat is currently classed as biomass. Each MWh receives a virtual certificate that
can be traded with other generators and suppliers. Heat generated by a CHP plant fuelled
with tallow can be classed as output enabling the generator to obtain Climate Change Levy

65
Exemption Certificates (LECs). The recently introduced RHI creates another possible
source of income by subsidising heat production.
The analysis of animal fat prices was a difficult task as there is no open market for this
commodity trade. The collected data showed that a link between animal fat and fossil fuels
exists, in consequence it makes tallow price very volatile which can possibly lead to the
wrong process of feasibility assessment. On the other hand, animal fat price can be
predicted to some level of accuracy by the usage of similar methods which are used for
fossil fuel prices’ prediction.
The feasibility analysis prepared for the research plant showed that fuel price can
constitute up to 90% of total electricity production cost. Therefore, animal fat price has a
major impact on feasibility. Electricity generation was only profitable in the case of
receiving support in the form of ROCs. For tallow prices above 500 £/tonne it was not
feasible to operate the plant.
Similar findings are included in the feasibility study for the proposed large power plant.
Very efficient two stroke diesel engines were proposed for this particular application but
still fuel price contributes to approximately 85% of the total generation cost. Also in the
case of the proposed plant, feasibility is very sensitive to fuel price change. Electricity
production from animal fat can be profitable only when additional support such as the
Renewable Obligation or Renewable Heat Incentive is available.
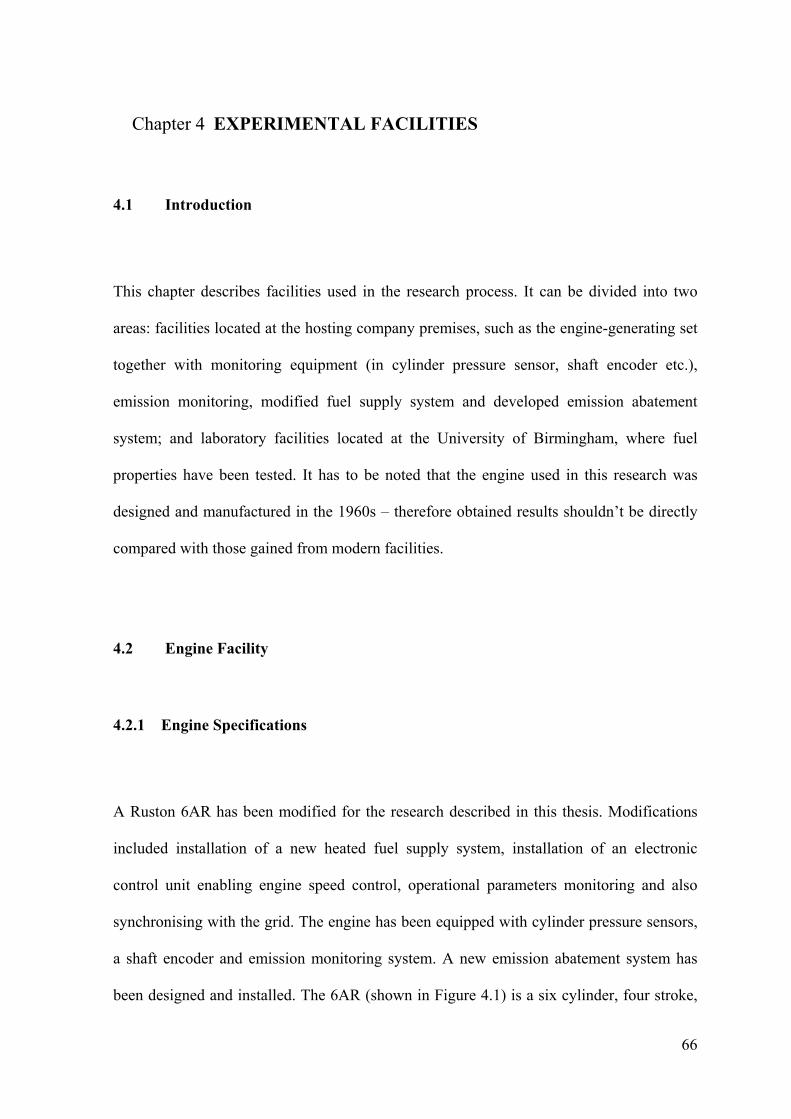
66
Chapter 4 EXPERIMENTAL FACILITIES
4.1 Introduction
This chapter describes facilities used in the research process. It can be divided into two
areas: facilities located at the hosting company premises, such as the engine-generating set
together with monitoring equipment (in cylinder pressure sensor, shaft encoder etc.),
emission monitoring, modified fuel supply system and developed emission abatement
system; and laboratory facilities located at the University of Birmingham, where fuel
properties have been tested. It has to be noted that the engine used in this research was
designed and manufactured in the 1960s – therefore obtained results shouldn’t be directly
compared with those gained from modern facilities.
4.2 Engine Facility
4.2.1 Engine Specifications
A Ruston 6AR has been modified for the research described in this thesis. Modifications
included installation of a new heated fuel supply system, installation of an electronic
control unit enabling engine speed control, operational parameters monitoring and also
synchronising with the grid. The engine has been equipped with cylinder pressure sensors,
a shaft encoder and emission monitoring system. A new emission abatement system has
been designed and installed. The 6AR (shown in Figure 4.1) is a six cylinder, four stroke,
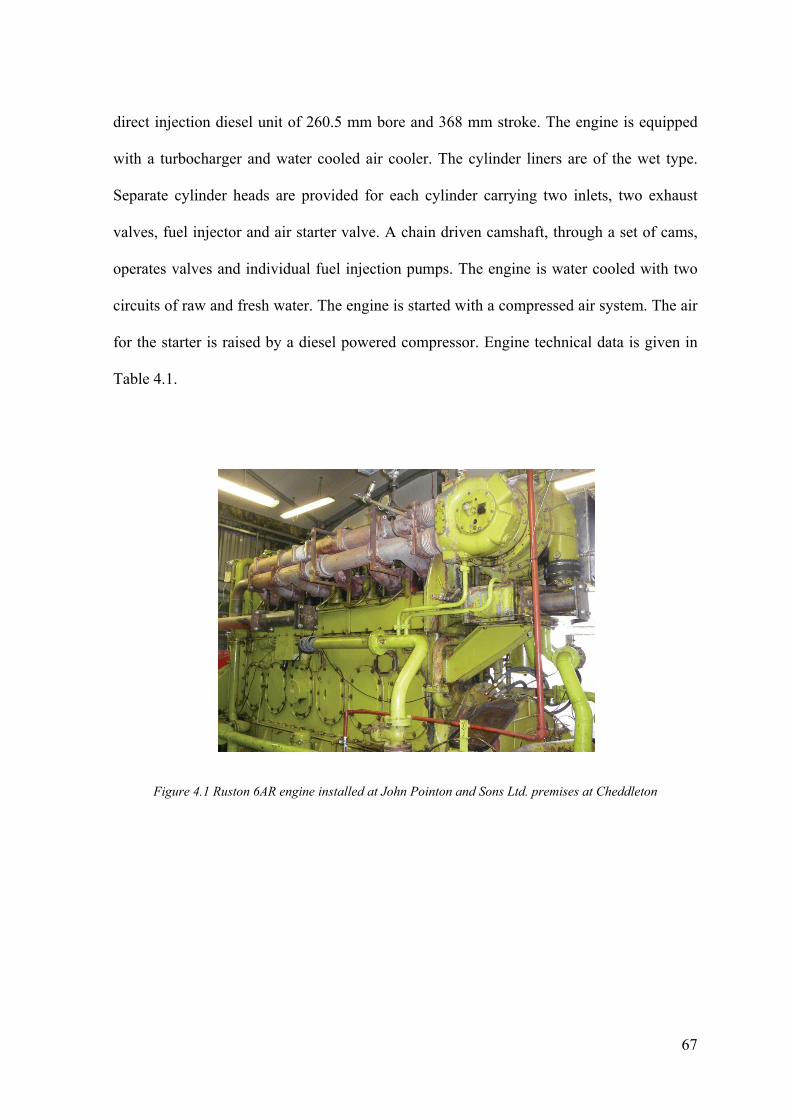
67
direct injection diesel unit of 260.5 mm bore and 368 mm stroke. The engine is equipped
with a turbocharger and water cooled air cooler. The cylinder liners are of the wet type.
Separate cylinder heads are provided for each cylinder carrying two inlets, two exhaust
valves, fuel injector and air starter valve. A chain driven camshaft, through a set of cams,
operates valves and individual fuel injection pumps. The engine is water cooled with two
circuits of raw and fresh water. The engine is started with a compressed air system. The air
for the starter is raised by a diesel powered compressor. Engine technical data is given in
Table 4.1.
Figure 4.1 Ruston 6AR engine installed at John Pointon and Sons Ltd. premises at Cheddleton

68
Table 4.1 Engine technical data
No. of cylinders 6 -
Nominal speed 600 rpm
Power 809 kW
Bore 260.5 mm
Stroke 368 mm
MEP 1.4 MPa
Compression ratio 12.3:1 -
Injection pressure 200 Bar
Injection commences 22 ºBTDC
The engine is mechanically coupled to a Brush 11 kV alternator and exciter. The
generating set has been installed at the hosting company premises at Cheddleton,
Staffordshire, England and registered with OFGEM as ‘Pointon_gen4’ station. A single
line diagram showing the local electrical grid configuration with the newly designed
metering system is given in Figure 4.2.
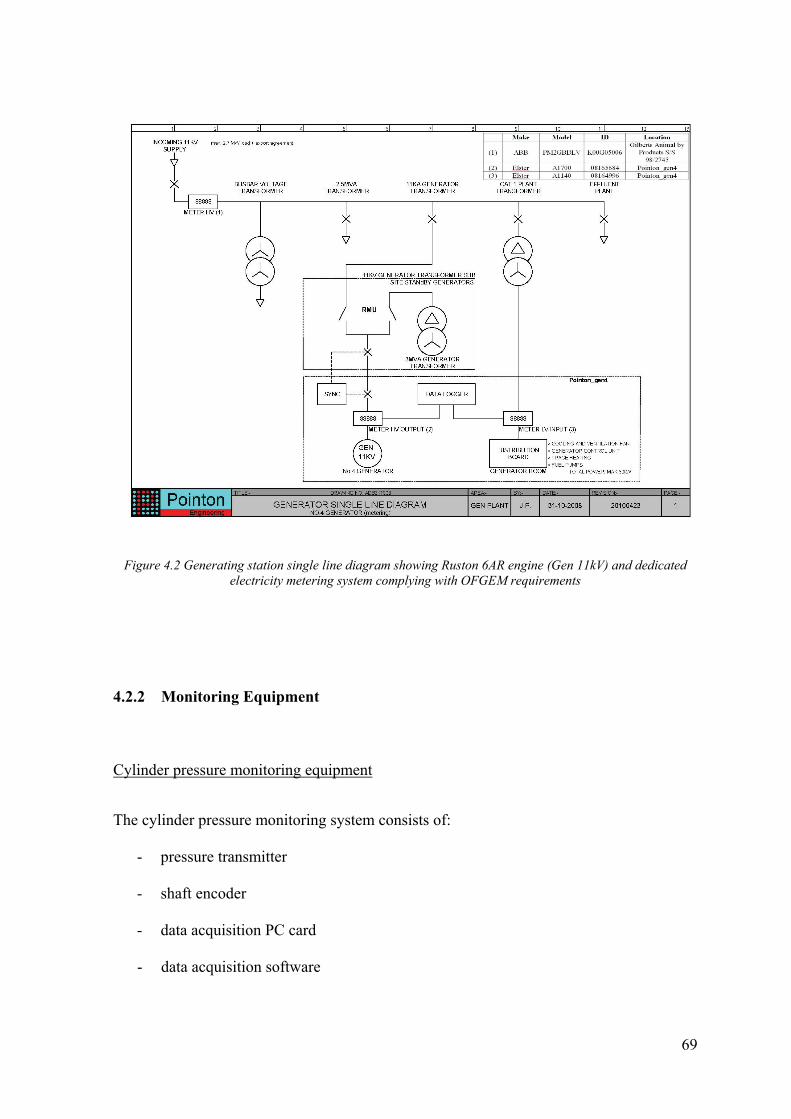
69
Figure 4.2 Generating station single line diagram showing Ruston 6AR engine (Gen 11kV) and dedicated electricity metering system complying with OFGEM requirements
4.2.2 Monitoring Equipment
Cylinder pressure monitoring equipment
The cylinder pressure monitoring system consists of:
- pressure transmitter
- shaft encoder
- data acquisition PC card
- data acquisition software
70
Pressure transmitter
The pressure transmitter Kistler 6613CA, shown in Figure 4.3, contains a piezoelectric
sensor and an integrated charge amplifier. The pressure transmitter is made for continuous
cylinder pressure monitoring of large engines. The integrated charge amplifier provides a
uniform output and can be connected directly to a data acquisition unit. There are no
individual sensitivity adjustments necessary, since the output has uniform sensitivity. The
sensor has a voltage output of 0 - 5 V with a zero line of 2 V (if pressure is 0 MPa) (116).
The sensor can record pressure within two ranges: the first up to 25 MPa, and the second
up to 10 MPa with sensitivities of 100 mV/MPa and 250 mV/MPa respectively.
The calibration of the pressure transducer was performed on an oil weight bench machine
in the range of 0MPa/1.5V to 9MPa/2.5V. The obtained characteristics of the pressure
transducer were applied to the data acquisition software as a tuned coefficient.
Working principle
The cylinder pressure is acting on the diaphragm. The diaphragm converts the pressure in
proportional force on the sensor element. The piezoelectric sensor element converts the
force into a charge. The charge is converted by a charge amplifier into a voltage. The
complete measuring chain is designed for easy operation and very long life time.

71
The advantages of the piezoelectric principle are:
- It operates safely up to high temperatures and therefore is ideally suited for
accurate measurements in harsh conditions.
- It has a very small sensitivity change over a temperature range.
- Its high stiffness results in small diaphragm stress.
- It has high reproducibility since the piezoelectric constant of the measuring element
is a constant of nature and does not change over time (116).
Figure 4.3 Kistler 6613CA pressure transmitter (116)
Data acquisition software
The software used is a LabView based programme developed at the University of
Birmingham. The cylinder pressure signal is recorded and then various parameters can be
calculated, for example:
- maximum pressure (comparison between cycles)
- heat release rate
72
- IMEP (indicated mean effective pressure)
- compression and exhaust polytrope factor – k
- pressure vs. crank angle
- pressure vs. volume.
Emission monitoring system
The emission monitoring system was provided by CBISS Ltd. The system consisted of:-
- MIR9000 – an infra red spectrophotometer that uses a Gas Filter Correlation
technique. The advantage of the GFC technique is that it uses a pair of narrow band
pass interference filters, specific to each gaseous species, to establish and remove
any cross interference from other gases (117).
- FID – Flame Ionisation Detector – Gas is sampled with a heated pump and led to
the burner supplied with pure hydrogen and air filtered and purified through an
internal generator. The separation of the hydrocarbon molecules at high
temperature in the cone of the flame provides an ionizing current, the strength of
which is directly proportional to the number of carbon atoms of the analysed
mixture (117).
- PCME LMS 181 probe - The LMS181 measures the scattered forward light from a
laser source. The measurement volume in the sensor probe is positioned in a
representative location within the stack. The scattered light response is directly
proportional to soot concentration. The instrument optimises its resolution and zero
drift characteristics (118).
73
The emission data was recorded continuously and stored in the system memory. The daily
report contained half hourly averages and the daily average of the following exhaust
components and parameters: sulphur dioxide – SO2, nitrogen monoxide – NO, nitrogen
oxides – NOx , carbon monoxide – CO, carbon dioxide – CO2, flow, temperature, soot,
hydrocarbons – HC.
4.2.3 Fuel Supply System
According to the engine manual (119) the standard fuel supply system comprises of the
following items:
- Daily service tank
- Fuel filters: before fuel pumps and edge filters in each injector
- Individual fuel pumps for each cylinder
- Injectors
- Interconnecting piping.
A standard fuel system diagram is given in Figure 4.4.

74
Figure 4.4 Standard fuel system layout (119)
As animal fat is solid at room temperature, the fuel supply system had to be modified to
enable operation on alternative fuel. The following assumptions were made:
- The engine should start and stop on diesel fuel
- The fuel supply system should be able to switch back to standard fuel in case of an
alarm condition such as grid voltage loss, engine overheating, synchronisation loss etc.
The fuel system has been modified by adding a second fuel tank with a heating coil for
animal fat storage. Pipe work connecting the tank with the fuel supply panel has been fitted
with trace heating preventing fat from solidification and non return valves were also fitted.
The fuel supply panel consisted of two fuel boost pumps, one for diesel and another for
liquid fat, powered by electric motors, four sets of filters, where two were preliminary

75
filters located before the boost pumps, and main filters located before the engine inlet.
Three interlinked valves, one for diesel supply, second for fat supply and third for fuel
return, were operated by a pneumatic actuator. The described arrangement enabled smooth
transition between the fuels. The system layout is given in Figure 4.5. The valve
arrangement and the fuels’ flow patterns for diesel operation (engine start up and warm up
or alarm state) are given in Figure 4.6. The system state for animal fat operation is given in
Figure 4.7.
Fuel consumption has been measured with two flow meters. Coriolis mass flow meter,
Promass 83F supplied by Endress+Hauser, has been used for animal fat consumption
measurement. The flow meter was linked to a PC with a data acquisition software package
installed. Diesel consumption was recorded with a positive displacement type flow meter,
MP 025S supplied by Trimec.

76
Figure 4.5 Fuel supply system layout

77
Figure 4.6 Fuel supply system - diesel mode
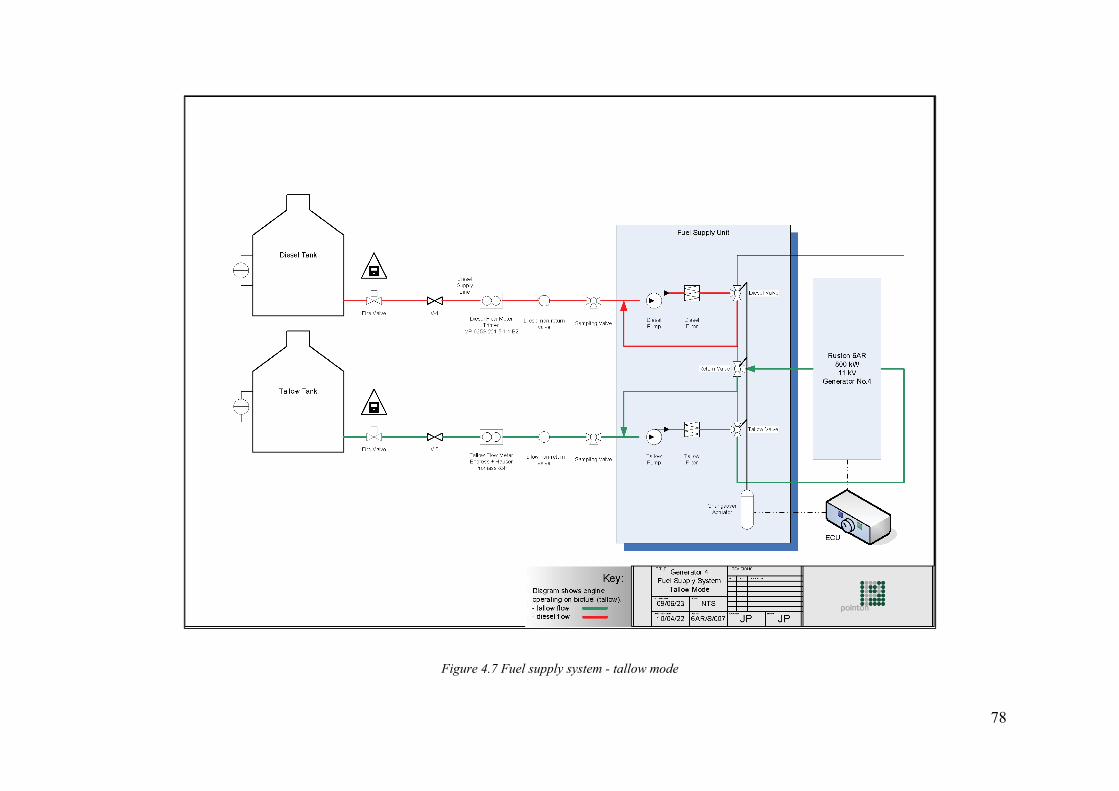
78
Figure 4.7 Fuel supply system - tallow mode
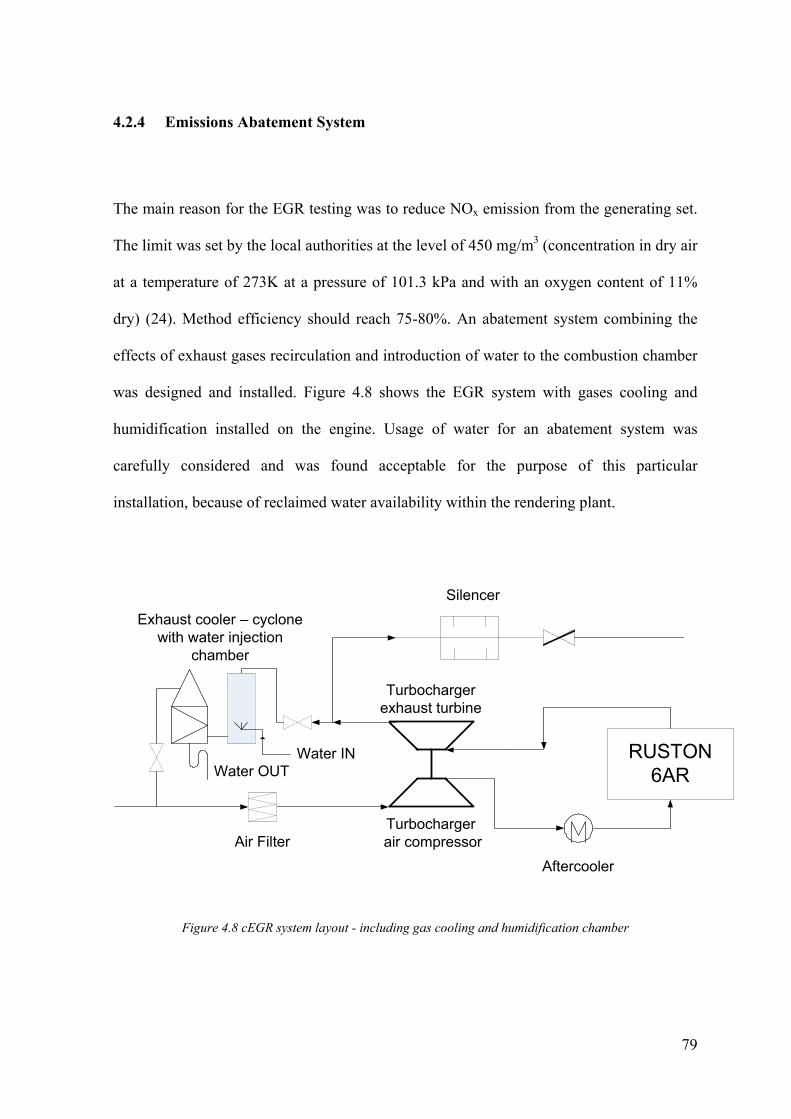
79
4.2.4 Emissions Abatement System
The main reason for the EGR testing was to reduce NOx emission from the generating set.
The limit was set by the local authorities at the level of 450 mg/m3 (concentration in dry air
at a temperature of 273K at a pressure of 101.3 kPa and with an oxygen content of 11%
dry) (24). Method efficiency should reach 75-80%. An abatement system combining the
effects of exhaust gases recirculation and introduction of water to the combustion chamber
was designed and installed. Figure 4.8 shows the EGR system with gases cooling and
humidification installed on the engine. Usage of water for an abatement system was
carefully considered and was found acceptable for the purpose of this particular
installation, because of reclaimed water availability within the rendering plant.
RUSTON 6AR
Exhaust cooler – cyclone with water injection
chamber
Aftercooler
Air Filter
Silencer
Turbochargerexhaust turbine
Turbocharger air compressor
Water INWater OUT
Figure 4.8 cEGR system layout - including gas cooling and humidification chamber
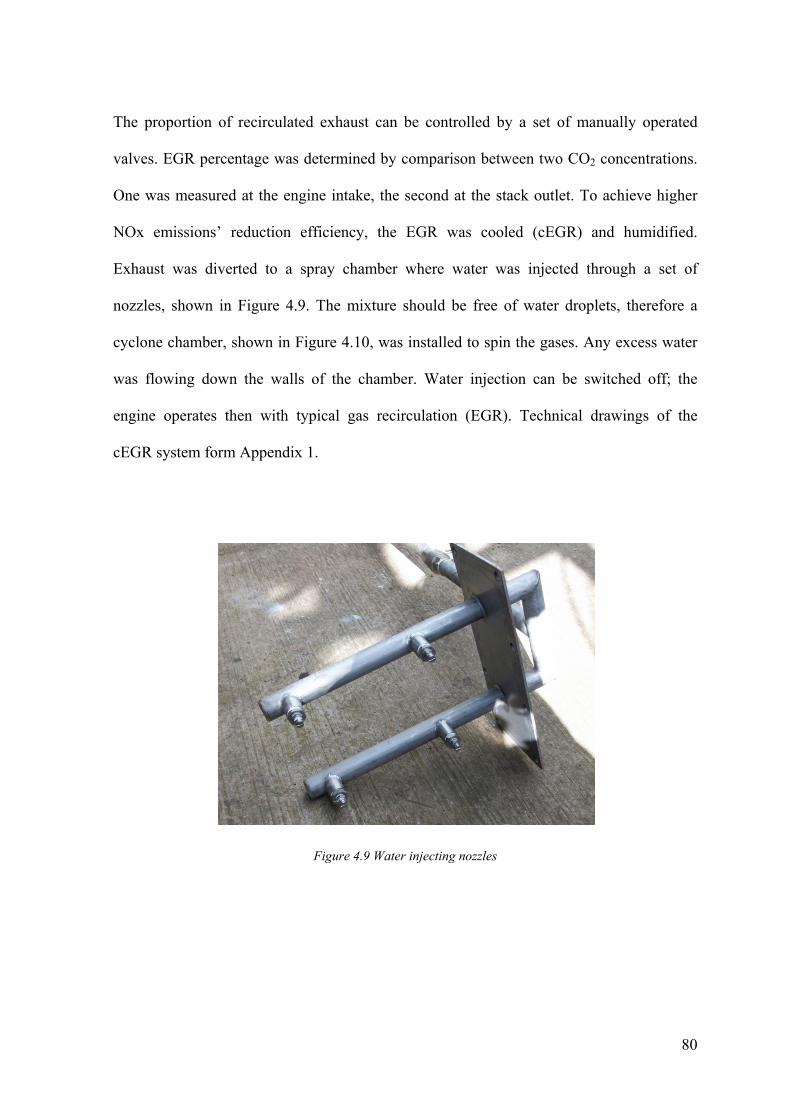
80
The proportion of recirculated exhaust can be controlled by a set of manually operated
valves. EGR percentage was determined by comparison between two CO2 concentrations.
One was measured at the engine intake, the second at the stack outlet. To achieve higher
NOx emissions’ reduction efficiency, the EGR was cooled (cEGR) and humidified.
Exhaust was diverted to a spray chamber where water was injected through a set of
nozzles, shown in Figure 4.9. The mixture should be free of water droplets, therefore a
cyclone chamber, shown in Figure 4.10, was installed to spin the gases. Any excess water
was flowing down the walls of the chamber. Water injection can be switched off; the
engine operates then with typical gas recirculation (EGR). Technical drawings of the
cEGR system form Appendix 1.
Figure 4.9 Water injecting nozzles

81
Figure 4.10 EGR cyclone chamber
4.3 Fuel Laboratory Facilities
4.3.1 Density Test
The hydrometer method has been used for determination of animal fat density. A tested
fuel sample was placed in a water bath with a thermostat to minimise sample temperature
variation. Animal fat is an opaque liquid in all conditions, therefore the scale reading
method described in ASTM standard D1298-99 (2005) (120) and shown in Figure 4.11,
was used.
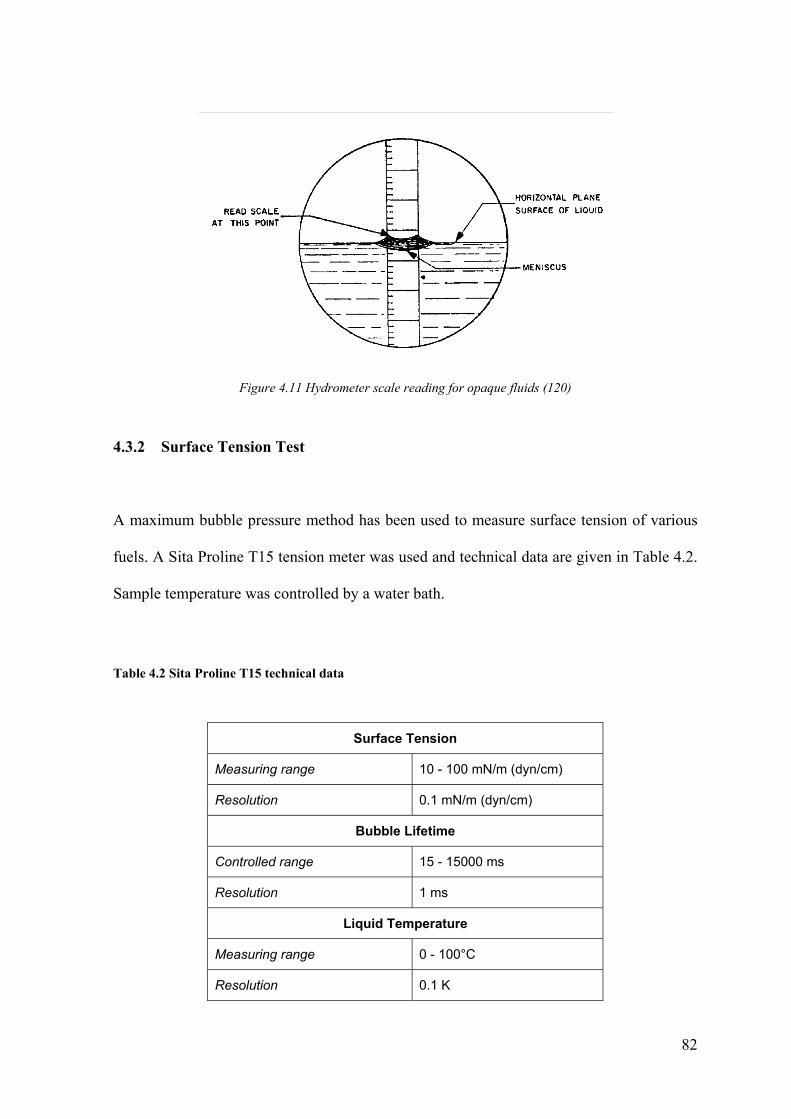
82
Figure 4.11 Hydrometer scale reading for opaque fluids (120)
4.3.2 Surface Tension Test
A maximum bubble pressure method has been used to measure surface tension of various
fuels. A Sita Proline T15 tension meter was used and technical data are given in Table 4.2.
Sample temperature was controlled by a water bath.
Table 4.2 Sita Proline T15 technical data
Surface Tension
Measuring range 10 - 100 mN/m (dyn/cm)
Resolution 0.1 mN/m (dyn/cm)
Bubble Lifetime
Controlled range 15 - 15000 ms
Resolution 1 ms
Liquid Temperature
Measuring range 0 - 100°C
Resolution 0.1 K

83
Variable bubble lifetime makes obtaining results comparable with static methods possible.
Bubble pressure method suitability, for measurement of viscous fluids, has been positively
verified by Fainerman (121).
4.3.3 Viscosity Test
Fuel viscosity has been analysed with an Ultra Shear Viscometer provided by PCS. The
Ultra Shear Viscometer can carry out fully automated viscosity measurements over a shear
rate range from 106 s-1 to 107
s-1 and temperatures between 40 and 150°C. The meter is
fitted with a DC servo motor capable of speeds of over 20,000 rpm and an electromagnetic
clutch which engages the rotor for only a very short period of time (typically 30 ms). This
brief shearing interval minimizes the shear heating in the lubricant (122). The viscometer is
shown in Figure 4.12 and its main parts are shown in Figure 4.13.
Figure 4.12 PCS Ultra Shear Viscometer
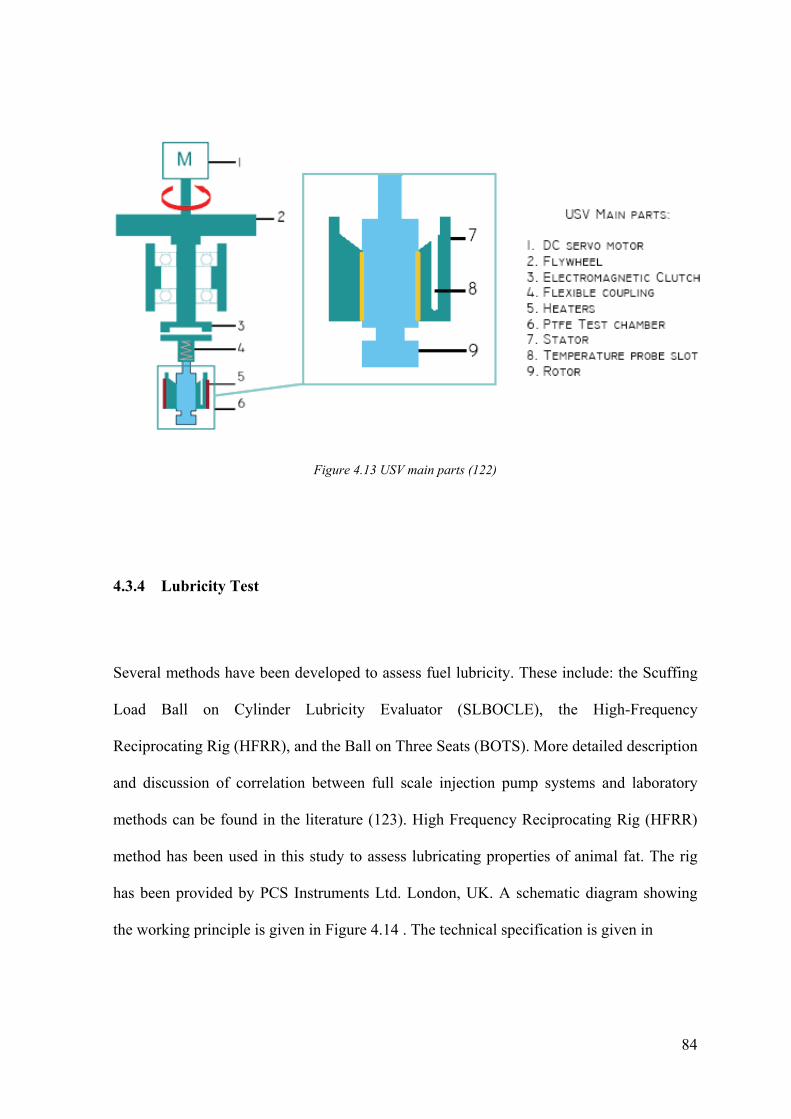
84
Figure 4.13 USV main parts (122)
4.3.4 Lubricity Test
Several methods have been developed to assess fuel lubricity. These include: the Scuffing
Load Ball on Cylinder Lubricity Evaluator (SLBOCLE), the High-Frequency
Reciprocating Rig (HFRR), and the Ball on Three Seats (BOTS). More detailed description
and discussion of correlation between full scale injection pump systems and laboratory
methods can be found in the literature (123). High Frequency Reciprocating Rig (HFRR)
method has been used in this study to assess lubricating properties of animal fat. The rig
has been provided by PCS Instruments Ltd. London, UK. A schematic diagram showing
the working principle is given in Figure 4.14 . The technical specification is given in

85
Table 4.3.
Figure 4.14 Schematic diagram of HFRR (124)
Table 4.3 PCS HFRR technical specification
To increase test repeatability and reduce scatter the rig has been fitted with a temperature
and humidity controlled cabinet so tests can be carried out at constant temperature and
relative humidity. The wear scar diameter is measured with a Meiji metallurgical
Frequency 10 – 200 Hz
Stroke 20 µm – 2.0 mm
Load 0 – 1.0 kg
Max. friction force 10.0 N
Temperature Up to 400 °C
Upper specimen 6.0 mm diameter ball
Lower specimen 10.0 mm diameter x 3.0 mm thick disc
Camera resolution 2048 x 1536 pixels
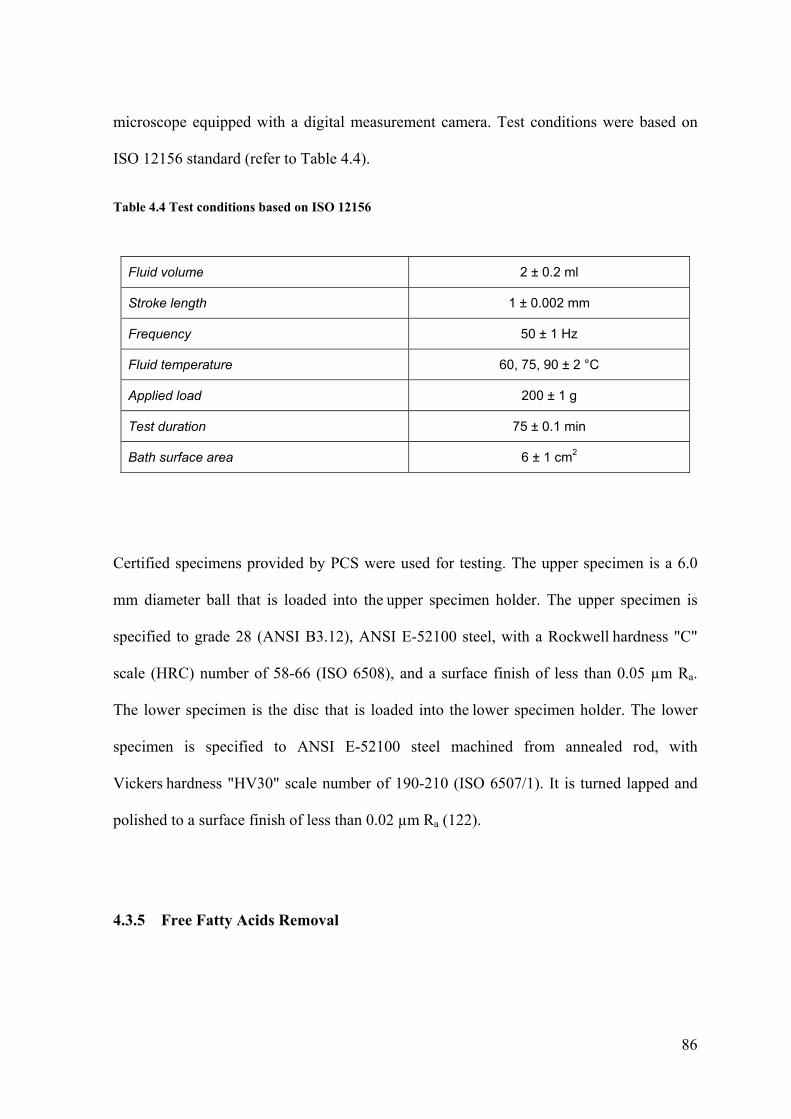
86
microscope equipped with a digital measurement camera. Test conditions were based on
ISO 12156 standard (refer to Table 4.4).
Table 4.4 Test conditions based on ISO 12156
Fluid volume 2 ± 0.2 ml
Stroke length 1 ± 0.002 mm
Frequency 50 ± 1 Hz
Fluid temperature 60, 75, 90 ± 2 °C
Applied load 200 ± 1 g
Test duration 75 ± 0.1 min
Bath surface area 6 ± 1 cm2
Certified specimens provided by PCS were used for testing. The upper specimen is a 6.0
mm diameter ball that is loaded into the upper specimen holder. The upper specimen is
specified to grade 28 (ANSI B3.12), ANSI E-52100 steel, with a Rockwell hardness "C"
scale (HRC) number of 58-66 (ISO 6508), and a surface finish of less than 0.05 µm Ra.
The lower specimen is the disc that is loaded into the lower specimen holder. The lower
specimen is specified to ANSI E-52100 steel machined from annealed rod, with
Vickers hardness "HV30" scale number of 190-210 (ISO 6507/1). It is turned lapped and
polished to a surface finish of less than 0.02 µm Ra (122).
4.3.5 Free Fatty Acids Removal
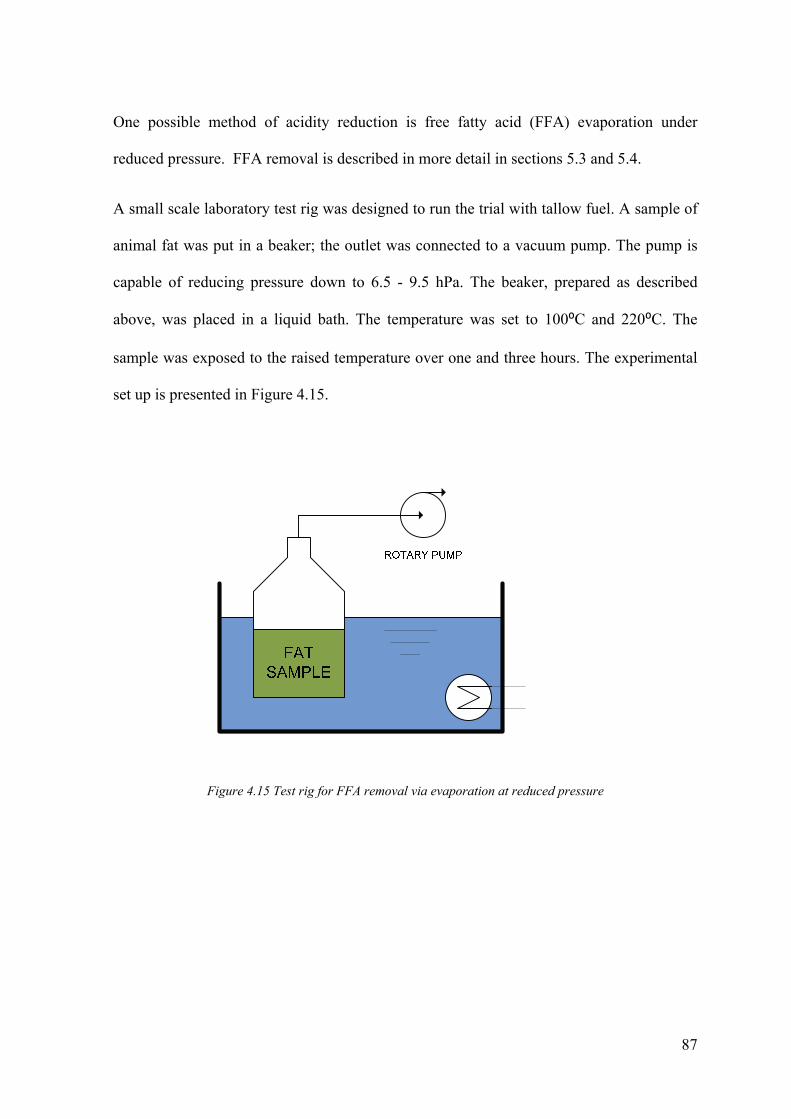
87
One possible method of acidity reduction is free fatty acid (FFA) evaporation under
reduced pressure. FFA removal is described in more detail in sections 5.3 and 5.4.
A small scale laboratory test rig was designed to run the trial with tallow fuel. A sample of
animal fat was put in a beaker; the outlet was connected to a vacuum pump. The pump is
capable of reducing pressure down to 6.5 - 9.5 hPa. The beaker, prepared as described
above, was placed in a liquid bath. The temperature was set to 100⁰C and 220⁰C. The
sample was exposed to the raised temperature over one and three hours. The experimental
set up is presented in Figure 4.15.
Figure 4.15 Test rig for FFA removal via evaporation at reduced pressure

88
Chapter 5 CONSISTENCY OF TALLOW PROPERTIES
5.1 Introduction
There are properties that are widely used to determine tallow quality and suitability for
applications within the chemical and food industry. Usually the free fatty acid content,
polyethylene contamination, moisture, insoluble impurities, ash and iodine values are
measured. Those properties are tested on a regular basis in the host company’s on-site
laboratory. Analysis presented in this chapter is based on test results obtained there.
The amount of free fatty acid an animal fat contains is a good indication of whether the fats
were properly handled before rendering. Meat tissues contain fat-splitting enzymes, which
start to hydrolyze the fat to form free fatty acid as soon as the animal dies. Rendering must
be performed as soon as possible after the animals are slaughtered for a minimum of free
fatty acid development (4). The raw material is usually contaminated with polyethylene
that will melt and disperse in the tallow during the rendering process. Polyethylene may
solidify as the tallow is cooled and contaminate pipe work and valves or damage the fuel
injection system. Moisture content characterises the efficiency of tallow filtration and
separation processes. It is desirable to keep moisture at low levels. High moisture content
may encourage hydrolysis and increase acidity as a result. Insoluble impurities are usually
small particles of protein, bone and fibre. Animal fats are highly saturated and the iodine
value is a parameter describing the level of saturation.

89
Industrial requirements for grade 6 tallow and crude bio-fuel specifications for two- and
four-stroke heavy fuel oil engines are given in Table 5.1.
Table 5.1 Required tallow properties
Property Limit value
Grade 6 tallow 4-stroke engine spec (69)
2-stroke engine spec (42)
Free fatty acids (FFA) <15 % <10% <15%
Polyethylene <200 ppm - -
Moisture <0.03% 0.2% 1.0%
Insoluble impurities <0.05% 0.05% -
Ash <0.02% 0.05% 0.15%
Iodine value <60 120 -
Calorific value 36-40 MJ/kg - -
5.2 Long Term Monitoring Programme
A category 3 grade 6 tallow batch was prepared on a weekly basis and pumped to a heated
tank supplying the test generator. Samples were taken weekly throughout 2009 and tests
were also conducted on a weekly basis with the exemption of density and calorific value,
where monthly composite samples were tested.
Results were statistically analysed to determine whether the data came from a process
which is subject to statistical description. A two stage approach was chosen. The first step
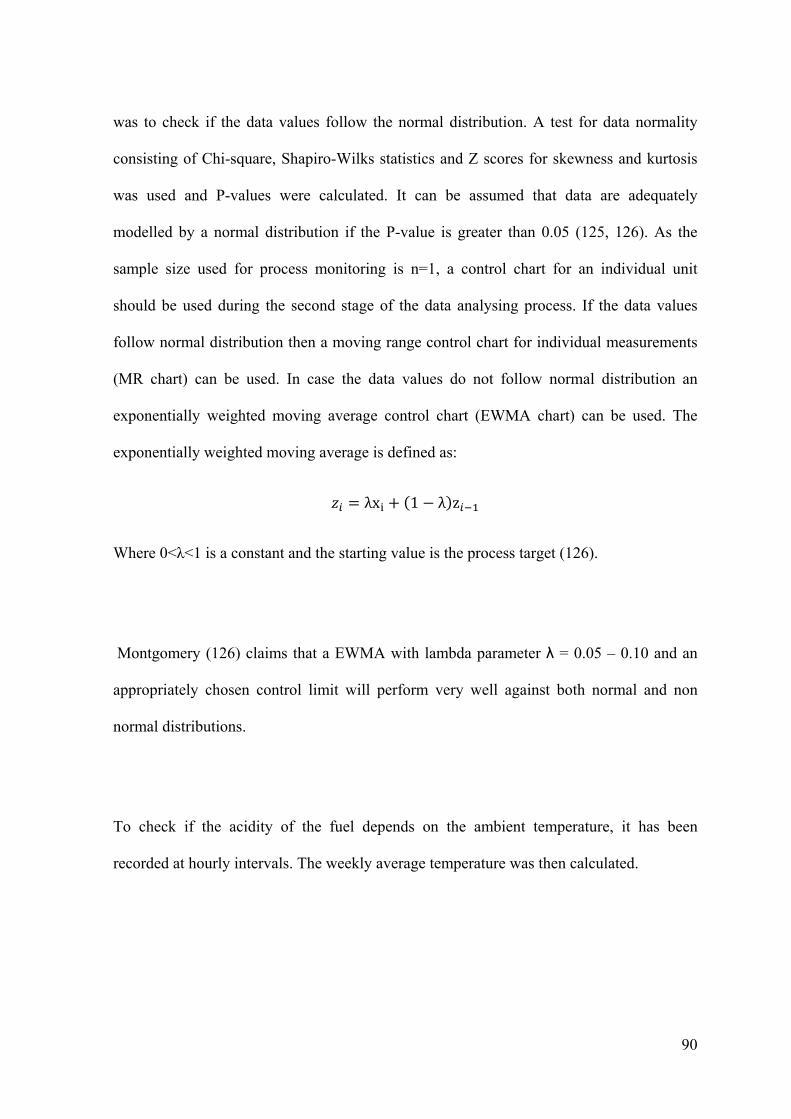
90
was to check if the data values follow the normal distribution. A test for data normality
consisting of Chi-square, Shapiro-Wilks statistics and Z scores for skewness and kurtosis
was used and P-values were calculated. It can be assumed that data are adequately
modelled by a normal distribution if the P-value is greater than 0.05 (125, 126). As the
sample size used for process monitoring is n=1, a control chart for an individual unit
should be used during the second stage of the data analysing process. If the data values
follow normal distribution then a moving range control chart for individual measurements
(MR chart) can be used. In case the data values do not follow normal distribution an
exponentially weighted moving average control chart (EWMA chart) can be used. The
exponentially weighted moving average is defined as:
λx 1 λ z
Where 0<λ<1 is a constant and the starting value is the process target (126).
Montgomery (126) claims that a EWMA with lambda parameter λ = 0.05 – 0.10 and an
appropriately chosen control limit will perform very well against both normal and non
normal distributions.
To check if the acidity of the fuel depends on the ambient temperature, it has been
recorded at hourly intervals. The weekly average temperature was then calculated.

91
Calculated annual mean values were compared with industrial requirements for grade 6
tallow and bio fuel specification for large four and two stroke engines used for power
generation.
5.2.1 Results
Results of tests for weeks 6-8 are excluded due to a failure of the filtration system which
resulted in ‘off spec’ fuel provided for the research engine. Other data are graphically
presented in Figure 5.1 and Figure 5.2. Acidity test results are presented in Figure 5.3
together with the weekly average ambient temperatures. Monthly composite samples
results are presented in Figure 5.4.
Figure 5.1 Moisture, insoluble impurities, ash levels in tallow during 2009
0.00
0.10
0.20
0.30
0.40
0.50
0.60
0.70
0.80
1 3 5 10 12 14 16 18 20 22 24 26 28 30 32 34 36 38 40 42 44 46 48 50 52
Co
nce
ntr
atio
ns
[%]
Week
Moisture Insoluble impurities Ash

92
Figure 5.2 Iodine number and polyethylene levels in tallow during 2009
Figure 5.3 Free fatty acids (FFA) level in tallow and weekly average ambient temperature during 2009
0
10
20
30
40
50
60
70
0
10
20
30
40
50
60
70
1 4 7 10 13 16 19 22 25 28 31 34 37 40 43 46 49
Po
lyet
hyl
ene
[pp
m]
Iod
ine
valu
e [g
I2/1
00g
]
Week
Iodine value Polyethylene
0
5
10
15
20
25
30
35
0
5
10
15
20
25
30
35
Wee
kly
aver
age
amb
ien
t te
mp
erat
ure
[d
egC
]
Fre
e fa
tty
acid
[%
]
Week
FFA
Temperature
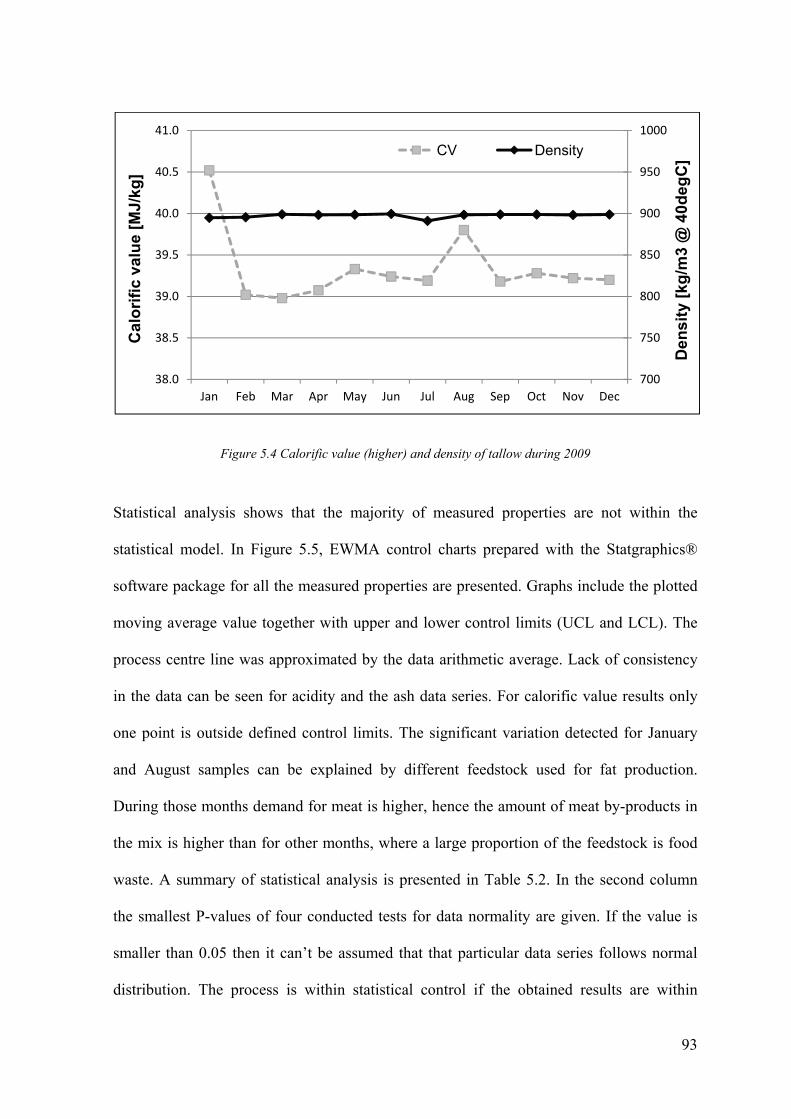
93
Figure 5.4 Calorific value (higher) and density of tallow during 2009
Statistical analysis shows that the majority of measured properties are not within the
statistical model. In Figure 5.5, EWMA control charts prepared with the Statgraphics®
software package for all the measured properties are presented. Graphs include the plotted
moving average value together with upper and lower control limits (UCL and LCL). The
process centre line was approximated by the data arithmetic average. Lack of consistency
in the data can be seen for acidity and the ash data series. For calorific value results only
one point is outside defined control limits. The significant variation detected for January
and August samples can be explained by different feedstock used for fat production.
During those months demand for meat is higher, hence the amount of meat by-products in
the mix is higher than for other months, where a large proportion of the feedstock is food
waste. A summary of statistical analysis is presented in Table 5.2. In the second column
the smallest P-values of four conducted tests for data normality are given. If the value is
smaller than 0.05 then it can’t be assumed that that particular data series follows normal
distribution. The process is within statistical control if the obtained results are within
700
750
800
850
900
950
1000
38.0
38.5
39.0
39.5
40.0
40.5
41.0
Jan Feb Mar Apr May Jun Jul Aug Sep Oct Nov Dec
Den
sity
[kg
/m3
@ 4
0deg
C]
Cal
ori
fic
valu
e [M
J/kg
]CV Density
94
designed limits – EWMA upper and lower control limits (UCL and LCL) in the case of the
analysis presented in this paragraph. In the fourth column it is stated whether a particular
tested property is within statistical control. A comparison of the calculated annual average
and highest recorded values with three specifications (grade 6 tallow, 4- and 2-stroke
engines) is also included; Y – means that the calculated/measured value complies with the
specification, N – means that the calculated/measured value does not comply with the
particular specification. It can be concluded that although some properties, like
polyethylene contamination, are not consistent during the sampling period, they do not
prevent the tallow from being used in industrial applications, as calculated averages exceed
the required specification (grade 6). The only parameter that disqualifies the tested tallow
from being used as a fuel in any available combustion engine is the acidity expressed as
free fatty acids level. The highest measured value of FFA exceeds the specification for a
two stroke low speed engine by 100%. Moisture content in the tested fuel seems to be
within the statistical limits, however, the mean value does not meet requirements of grade
6 tallow and bio fuel for a four stroke engine.
As shown in Figure 5.3, there is a relationship between ambient temperature and free fatty
acids’ level. Acidity is considerably higher during the summer period. The collected data
are very random so it was difficult to create a detailed model or equation linking ambient
temperature with acidity level. However, a very coarse approximation can be formulated:
increase of ambient temperature by one degree can increase acidity of tallow by 0.75%.
Acidity level depends on the intensity of the decomposition process and fat hydrolysis by
enzymes. Clearly, the ambient temperature is one of the factors affecting the reaction rate.

95
Table 5.2 Summary of statistical analysis and compliance with various specifications
Data series SmallestP-value
Normal distribution
Process in
statistical control
Annual average
Highest reading
Unit
Compliance with
specification
G6 4S 2S
Moisture 0.0008 No Yes 0.28 0.69 % N/N N/N Y/Y
Insoluble impurities
1.05*10-8 No No 0.13 0.54 % N/N N/N -
Ash 1.77*10-
13 No No 0.04 0.11 % N/N Y/N Y/Y
Iodine value 0.0150 No Yes 50.9 55.8 gI2/100g Y/Y Y/Y -
Polyethylene 0.0017 No No 13.7 34.0 ppm Y/Y - -
FFA 5.11*10-6 No No 21.9 32.6 % N/N N/N N/N
Density 0.0008 No Yes 897.4 899.5 kg/m3 - Y/Y Y/Y
Calorific value
0.0005 No No 39.34 38.98 MJ/kg Y/Y - -
Where: G6 – grade 6 specification, 4S – four stroke specification, 2S – two stroke specification

96
Figure 5.5 EWMA control charts for monitored tallow properties
97
5.3 Available Acidity Reduction Methods
Acidity can be lowered in many ways. Bhosle et al. (127) describe three main groups of
methods: chemical, physical and miscella deacidification. The chemical method of
lowering acidity comprises of the addition of an alkali to degummed oil, thereby turning
the FFA into soap, which is then removed by mechanical separation from the neutral oil.
This method has been widely researched by Zheng et al. (78) and Meher et al. (128) and
applied in first generation biodiesel production by Canakci et al. (129). An alternative
approach is presented by Cmolik et al. (130), where advantages of physical methods like
lower environment pollution due to lack of chemicals, higher yields achieved, are
described. The most common physical methods are steam refining and inert gas stripping.
Further investigation is required to determine the best solution for deacidification
technology that can be implemented in the case of tallow used as fuel in engines.
5.4 Acidity Reduction by Evaporation – Trial Test
5.4.1 Preliminary Information
In the case of the project described in this thesis, it was desirable to find an acidity
lowering method that will not involve the usage of chemicals. Chemical FFA removal is a
well known process and is already used in the biodiesel production industry, even for
treatment of the fat sourced from the host company.
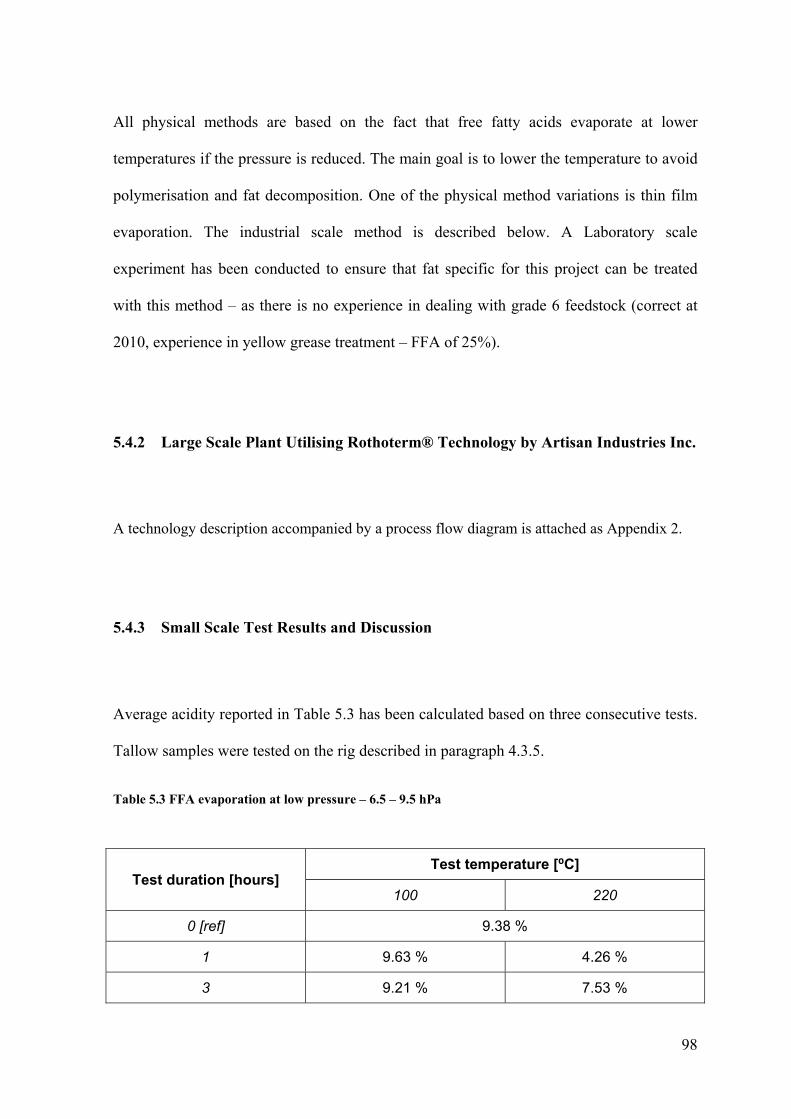
98
All physical methods are based on the fact that free fatty acids evaporate at lower
temperatures if the pressure is reduced. The main goal is to lower the temperature to avoid
polymerisation and fat decomposition. One of the physical method variations is thin film
evaporation. The industrial scale method is described below. A Laboratory scale
experiment has been conducted to ensure that fat specific for this project can be treated
with this method – as there is no experience in dealing with grade 6 feedstock (correct at
2010, experience in yellow grease treatment – FFA of 25%).
5.4.2 Large Scale Plant Utilising Rothoterm® Technology by Artisan Industries Inc.
A technology description accompanied by a process flow diagram is attached as Appendix 2.
5.4.3 Small Scale Test Results and Discussion
Average acidity reported in Table 5.3 has been calculated based on three consecutive tests.
Tallow samples were tested on the rig described in paragraph 4.3.5.
Table 5.3 FFA evaporation at low pressure – 6.5 – 9.5 hPa
Test duration [hours] Test temperature [⁰C]
100 220
0 [ref] 9.38 %
1 9.63 % 4.26 %
3 9.21 % 7.53 %
99
It can be seen that heating animal fat at low pressure will encourage evaporation of free
fatty acids. In the case of prolonged heating, high acidity can probably be explained by
hydrolysis reaction affected by the higher temperature. As expected, the acids’ removal
process should be fast – in industrial applications it is achieved either by supplying fats to
stripping columns in the form of spray or in the case of evaporators in a thin film layer.
The conducted test proves that fat produced by the host company can be potentially treated
with one of the physical deacidification methods. No negative impact of the treatment on
fat has been detected.
5.5 Conclusions
Data collected throughout the duration of the project proved that acidity of the tallow is
high and does not meet any requirements given by engine manufacturers. An appropriate
method of deacidification must be implemented to modify tallow properties to enable its
usage as fuel for engine driven power plants. Moreover, high variability of acidity was
detected. Ambient temperature affects the speed of the decomposition process, hence the
acidity level. Observations proved the possible suitability of tallow as a fuel, due to high
calorific value, which is consistent during the year. The quality of the fuel preparation
process must be improved so that moisture content can be lowered. Tallow can be treated
as a potential fuel for renewable energy power plants, however, its quality and pre-
treatment have to be developed and improved.
100
Chapter 6 DETERMINATION OF APPROPRIATE STORAGE AND
SUPPLY TEMPERATURES
6.1 Effect of Temperature on Properties of Animal Fat
This chapter describes an attempt to establish the appropriate temperature for animal fat to
be supplied as a fuel for reciprocating engines. Tallow is solid at ambient conditions and
melts in temperatures above 35 °C. The following aspects have been discussed in this part
of the study; elevating temperature will reduce the fat’s viscosity and surface tension thus
improving spray characteristics. At the same time, high temperature may have an impact
on the lubricating properties of the fuel. In the light of findings presented in Chapter 5,
acidity seems to be one of the fuel properties that need close monitoring; therefore the
possible contribution of high storage temperature towards increased acidity was also
investigated. The main objective of this part of the study was to determine optimal feed
and storage temperature for animal fat.
The investigation concluded in Chapter 5 focused on properties’ consistency. Despite
acidity variation associated with ambient temperature influencing the decomposition
process, other properties presented some level of consistency, enabling the establishment
of a set of typical values for animal fat. The next step was to establish limits – the internal
specification when fuel would be rejected and not used for engine trials. Fuel used for tests
presented in the current chapter was within the limits given in Table 6.1.
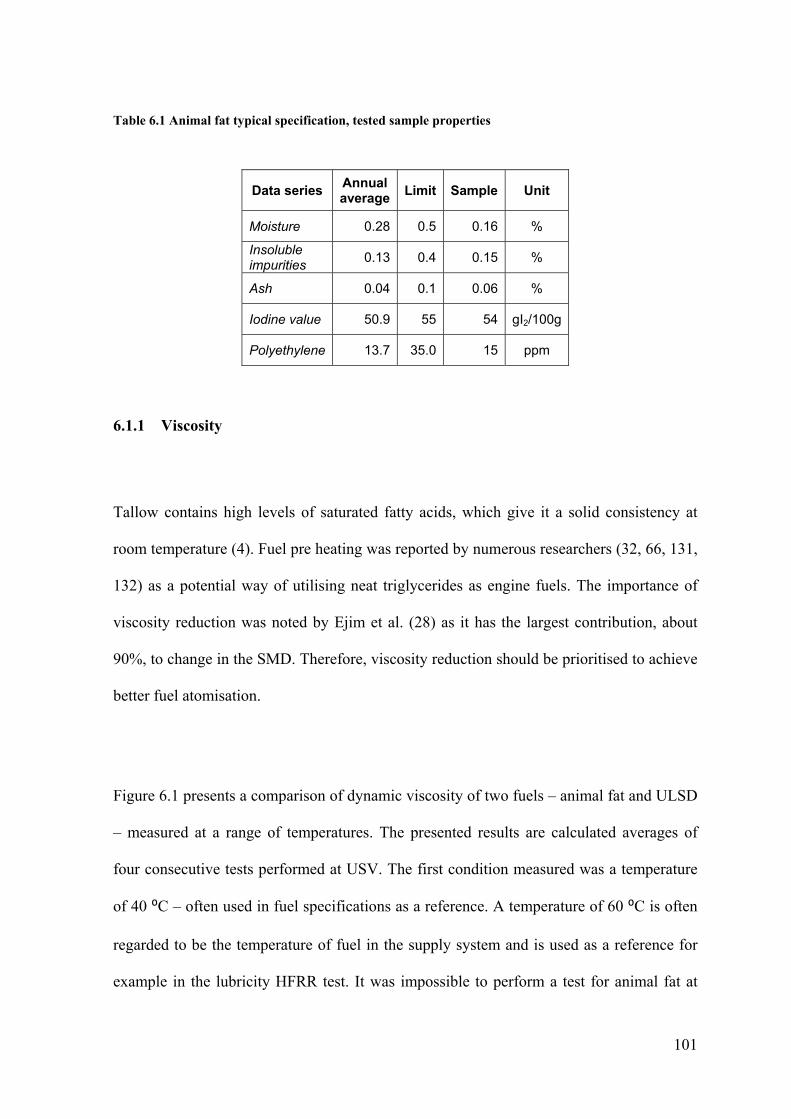
101
Table 6.1 Animal fat typical specification, tested sample properties
Data series Annual average
Limit Sample Unit
Moisture 0.28 0.5 0.16 %
Insoluble impurities
0.13 0.4 0.15 %
Ash 0.04 0.1 0.06 %
Iodine value 50.9 55 54 gI2/100g
Polyethylene 13.7 35.0 15 ppm
6.1.1 Viscosity
Tallow contains high levels of saturated fatty acids, which give it a solid consistency at
room temperature (4). Fuel pre heating was reported by numerous researchers (32, 66, 131,
132) as a potential way of utilising neat triglycerides as engine fuels. The importance of
viscosity reduction was noted by Ejim et al. (28) as it has the largest contribution, about
90%, to change in the SMD. Therefore, viscosity reduction should be prioritised to achieve
better fuel atomisation.
Figure 6.1 presents a comparison of dynamic viscosity of two fuels – animal fat and ULSD
– measured at a range of temperatures. The presented results are calculated averages of
four consecutive tests performed at USV. The first condition measured was a temperature
of 40 ⁰C – often used in fuel specifications as a reference. A temperature of 60 ⁰C is often
regarded to be the temperature of fuel in the supply system and is used as a reference for
example in the lubricity HFRR test. It was impossible to perform a test for animal fat at

102
lower temperatures and higher shear rates as viscosity values were reported to be too high.
The impact of temperature on the viscosity of animal fat is significant; raising the
temperature from 40⁰C up to 60⁰C results in viscosity reduction from approximately 40 cP
down to 20 cP. Further heating up to 90⁰C reduces viscosity to 9 cP (for low shear rate)
and 8 cP (for high shear rate). It has to be noted that even heating up to 90⁰C does not
reduce viscosity to levels comparable with ULSD. However, calculated kinematic viscosity
(presented in Figure 6.2) of 13.5 cSt (for 80⁰C) and 10.8 cSt (for 90⁰C) is lower than the
limit of 15 cSt at the engine inlet flange defined for large two stroke engines (133).
Therefore, it should be possible to use animal fat as fuel in large engines equipped with a
fuel supply system capable of handling viscous fuels such as HFO or crude oil. The engine
used in trials presented in this thesis can be supplied with fuel of viscosity limited to 14.5
cSt at 40⁰C (119).
Figure 6.1 Comparison of dynamic viscosity of animal fat and ULSD at range of temperatures
0
5
10
15
20
25
30
35
40
45
1 2 3 4 5 6 7 8
Dyn
amic
Vis
cosi
ty [
cP]
Shear Rate [x10^6]
Diesel 40degC Diesel 60degC Tallow 40degCTallow 60degC Tallow 80degC Tallow 90degC

103
Figure 6.2 Effect of temperature on animal fat kinematic viscosity
Presented results prove that pre heating above 80⁰C is required to reduce viscosity to a
level comparable with that required by the engine manufacturer.
The character of animal fat as a fluid can be determined by analysis of the relationship
between stress and shear rate. Shear stress for animal fat and ULSD at various
temperatures is shown in Figure 6.3. For ULSD at both tested temperatures a linear
relationship between shear stress and shear rate was observed. A similar conclusion can be
drawn for animal fat for temperatures of 80 and 90⁰C. It proves that tallow is Newtonian
fluid. For lower test temperatures animal fat shows minimal signs of shear-thinning as
curve gradient (viscosity) reduces with increasing shear rate.
0.0
5.0
10.0
15.0
20.0
25.0
30.0
35.0
40.0
45.0
50.0
30 40 50 60 70 80 90 100
Kin
emat
ic V
isco
sity
[cS
t]
Temperature [degC]
limit for HFO RMA30 @ 50 degC
limit for FAME @ 40 degC

104
Figure 6.3 Relationship between shear stress and shear rate for animal fat and ULSD at a range of temperatures
6.1.2 Lubricity
Verification of lubricating properties initially applied only to fuels used in the aviation
industry (123). Introduction of low sulphur diesel fuels resulted in fuel injection pump and
distributor pump failures, particularly in Sweden (134). Low sulphur fuels possess poorer
lubricity than non-desulphurised fuels, mainly due to the removal of polar oxygen and
nitrogen containing compounds (135, 136). Products of the triglycerides’
transesterification process are regarded to be good lubricity enhancers, especially when
blended at a level of 1-2% with ULSD (136-138). Lubricity of neat fatty compounds
0
10000
20000
30000
40000
50000
60000
70000
80000
90000
100000
1 2 3 4 5 6 7 8
Sh
ear
Str
ess
[Pa]
Shear Rate [x10^6]
Diesel 40degC Diesel 60degC Tallow 40degCTallow 60degC Tallow 80degC Tallow 90degC

105
depends on various features such as saturation, oxygen presence, number of OH groups
(136).
The test for each temperature has been repeated three times, calculated averages are
reported in Table 6.2. The wear scar measured for ULSD is shown in Figure 6.4. The
measured diameter of 320 µm is consistent with values available in literature (138, 139).
Table 6.2 HFRR test results
Fuel Temperature MWSD WS1.4 Avg. Film
Avg. Friction coefficient
[degC] [µm] [µm] [%] [-]
ULSD 60 315.0 320.0 83 0.176
Fat 60 85.5 102.3 100 0.069
Fat 75 86.5 104.2 100 0.078
Fat 90 89.5 108.9 100 0.082
Where: MWSD – uncorrected mean wear scar diameter; WS1.4 – corrected wear scar diameter
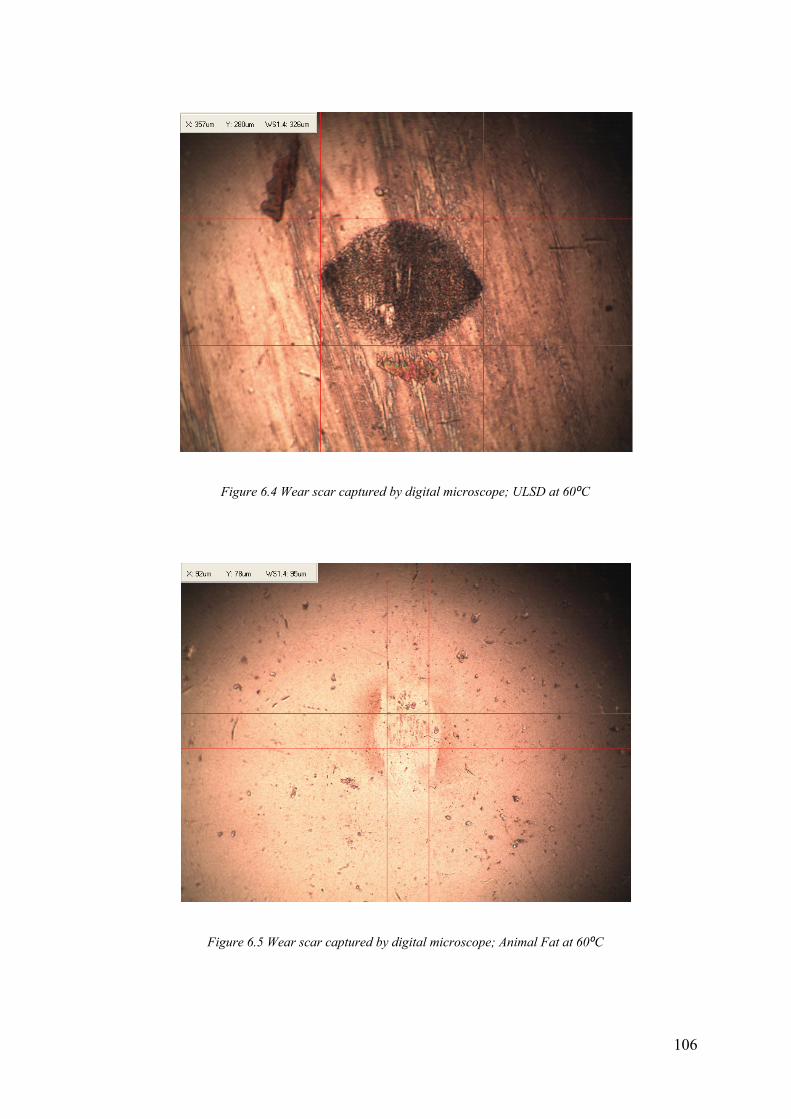
106
Figure 6.4 Wear scar captured by digital microscope; ULSD at 60⁰C
Figure 6.5 Wear scar captured by digital microscope; Animal Fat at 60⁰C

107
As expected wear scar diameter is significantly lower for animal fat than for diesel fuel.
The measurement result is shown in Figure 6.5. It can be explained by high unsaturation of
animal fat - presence of double bonds, indicated by a iodine number. Animal fat contains
10% oxygen which improves lubricity. According to Knothe et al. (140) oleic and linoleic
acids have excellent lubricating properties, as no wear scar has been recorded. These two
components constitute more than 50% of animal fat composition (7). Differences in
lubricity of animal fat and ULSD are even more significant if film thickness is compared.
For animal fat, film is developed after less than 5 minutes of the HFRR test, whilst for
ULSD it never exceeds 85% of thickness. Comparison of film thickness for both analysed
fuels is given in Figure 6.6 and a more detailed comparison focusing on the first 5 minutes
of the test is given in Figure 6.7. Better lubricity of animal fat can also be proved by lower
friction coefficients; in all cases the difference is significant. Comparison is given in Figure
6.8.
Figure 6.6 Film percentages for ULSD and animal fat at a range of temperatures.
0%
20%
40%
60%
80%
100%
0 10 20 30 40 50 60 70
Film
per
cen
tag
e
Test duration [minutes]
Fat 90 Fat 75 Fat 60 ULSD 60

108
Figure 6.7 Film percentages for ULSD and animal fat at a range of temperatures - first 5 minutes of HFRR test
Figure 6.8 Friction coefficients for ULSD and animal fat at a range of temperatures
0%
20%
40%
60%
80%
100%
0 1 2 3 4 5
Film
per
cen
tag
e
Test duration [minutes]
Fat 90 Fat 75 Fat 60 ULSD 60
0.000
0.050
0.100
0.150
0.200
0.250
0 10 20 30 40 50 60 70
Fri
ctio
n c
oef
fici
ent
Test duration [minutes]
Fat 90 Fat 75 Fat 60 ULSD 60

109
No significant impact of elevated temperature on lubricating properties has been detected.
The wear scar diameter increased for the highest test point (90⁰C) by 7 µm; the wear scar
is shown in Figure 6.9. Friction coefficient increased by 0.013 indicating worse lubrication.
HFRR test results are consistent with those expected from the literature review. Further
investigation is required to find correlation between the HFRR test parameters and the
working conditions of the injection equipment of stationary engines. Conducted tests
proved that impurities present in fuel prepared for engine trials do not affect lubricating
properties. Lack of significant increase of wear scar diameter for the high temperature test
ensures that fuel pre heating, necessary for viscosity reduction, will not have a negative
impact on fuel pumps’ wear. This conclusion was verified by long term tests of fuel pumps
which are described in section 8.3.
Figure 6.9 Wear scar captured by digital microscope; Animal Fat at 90⁰C
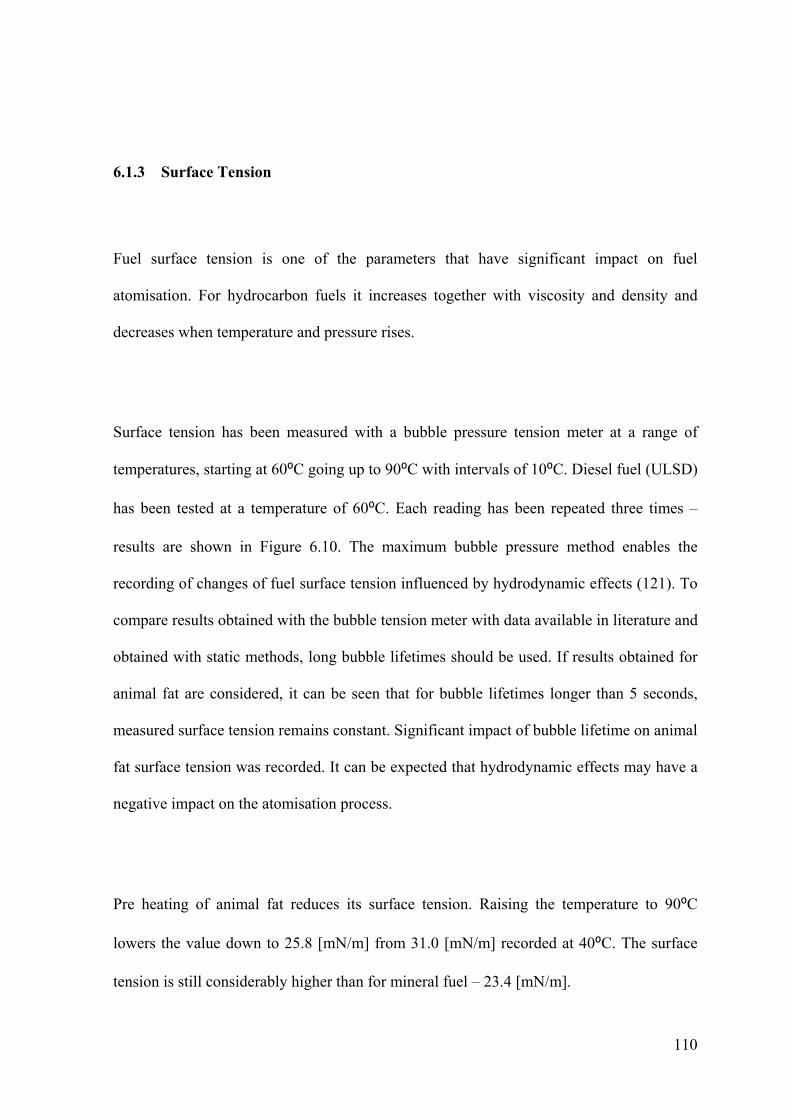
110
6.1.3 Surface Tension
Fuel surface tension is one of the parameters that have significant impact on fuel
atomisation. For hydrocarbon fuels it increases together with viscosity and density and
decreases when temperature and pressure rises.
Surface tension has been measured with a bubble pressure tension meter at a range of
temperatures, starting at 60⁰C going up to 90⁰C with intervals of 10⁰C. Diesel fuel (ULSD)
has been tested at a temperature of 60⁰C. Each reading has been repeated three times –
results are shown in Figure 6.10. The maximum bubble pressure method enables the
recording of changes of fuel surface tension influenced by hydrodynamic effects (121). To
compare results obtained with the bubble tension meter with data available in literature and
obtained with static methods, long bubble lifetimes should be used. If results obtained for
animal fat are considered, it can be seen that for bubble lifetimes longer than 5 seconds,
measured surface tension remains constant. Significant impact of bubble lifetime on animal
fat surface tension was recorded. It can be expected that hydrodynamic effects may have a
negative impact on the atomisation process.
Pre heating of animal fat reduces its surface tension. Raising the temperature to 90⁰C
lowers the value down to 25.8 [mN/m] from 31.0 [mN/m] recorded at 40⁰C. The surface
tension is still considerably higher than for mineral fuel – 23.4 [mN/m].
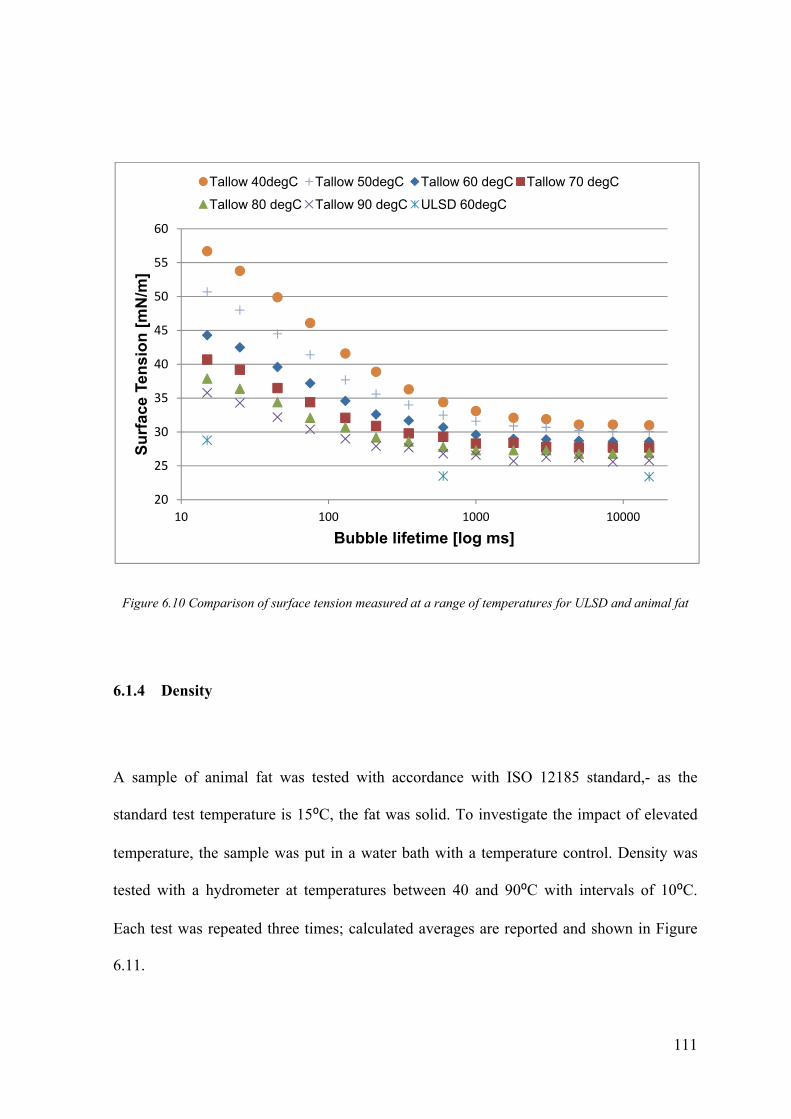
111
Figure 6.10 Comparison of surface tension measured at a range of temperatures for ULSD and animal fat
6.1.4 Density
A sample of animal fat was tested with accordance with ISO 12185 standard,- as the
standard test temperature is 15⁰C, the fat was solid. To investigate the impact of elevated
temperature, the sample was put in a water bath with a temperature control. Density was
tested with a hydrometer at temperatures between 40 and 90⁰C with intervals of 10⁰C.
Each test was repeated three times; calculated averages are reported and shown in Figure
6.11.
20
25
30
35
40
45
50
55
60
10 100 1000 10000
Su
rfac
e Te
nsi
on
[m
N/m
]
Bubble lifetime [log ms]
Tallow 40degC Tallow 50degC Tallow 60 degC Tallow 70 degC
Tallow 80 degC Tallow 90 degC ULSD 60degC

112
Figure 6.11 Impact of fat temperature on density
The obtained results present a linear trend where density decreases as temperature rises.
The measured density at standard conditions (temperature 15⁰C) – 915 kg/m3 – is higher
than the maximum density for diesel fuels (800 – 845 kg/m3 (37)) and FAME (860 – 900
kg/m3 (54)). The density is similar to values reported in the literature (4).
6.2 Maximum Allowable Long Term Storage Temperature
Animal fat is usually stored in a solid state and preheated before transportation or usage. In
a small generating station with power below 1 MW, this regime does not seem to be
practical as a multiple tank arrangement will increase installation and maintenance costs.
For large plants, where fuel is transferred from storage tanks to daily service tanks, animal
840
860
880
900
920
940
960
0 10 20 30 40 50 60 70 80 90 100
Den
sity
[kg
/m3]
Test Temperature [degC]
limit for HFO RMA30 @ 15 degC
limit for ULSD @ 15 degC
limit for FAME @ 15 degC
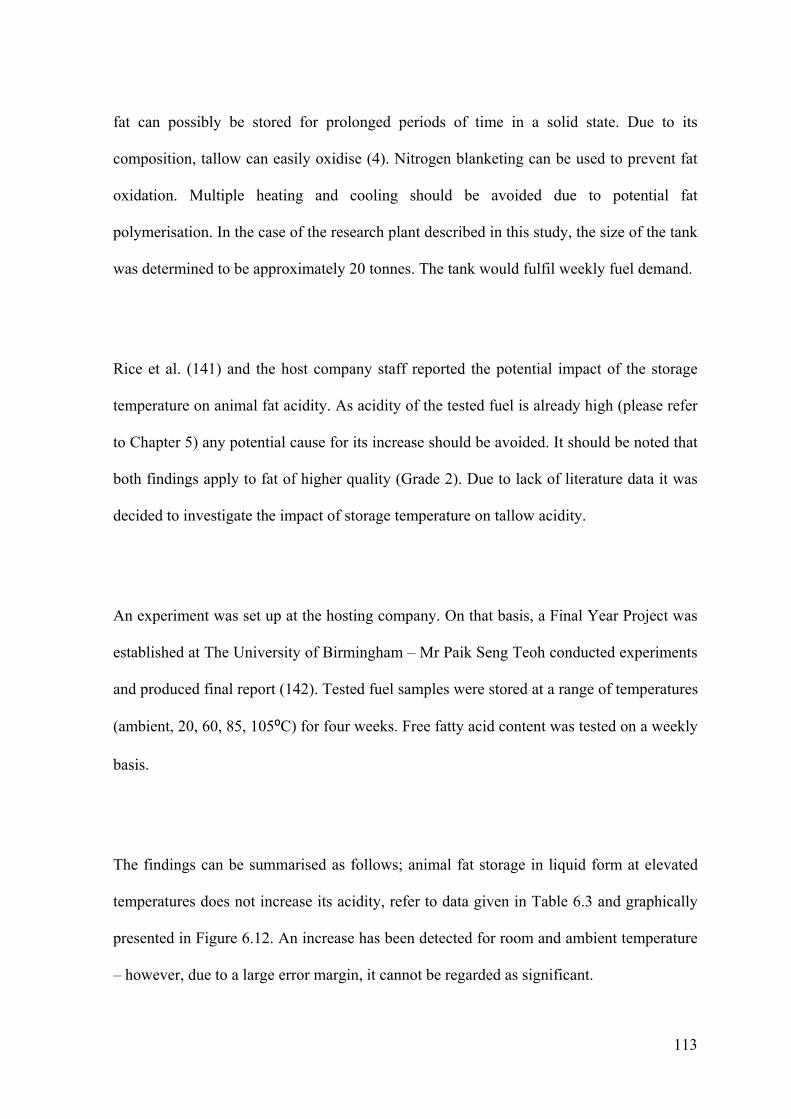
113
fat can possibly be stored for prolonged periods of time in a solid state. Due to its
composition, tallow can easily oxidise (4). Nitrogen blanketing can be used to prevent fat
oxidation. Multiple heating and cooling should be avoided due to potential fat
polymerisation. In the case of the research plant described in this study, the size of the tank
was determined to be approximately 20 tonnes. The tank would fulfil weekly fuel demand.
Rice et al. (141) and the host company staff reported the potential impact of the storage
temperature on animal fat acidity. As acidity of the tested fuel is already high (please refer
to Chapter 5) any potential cause for its increase should be avoided. It should be noted that
both findings apply to fat of higher quality (Grade 2). Due to lack of literature data it was
decided to investigate the impact of storage temperature on tallow acidity.
An experiment was set up at the hosting company. On that basis, a Final Year Project was
established at The University of Birmingham – Mr Paik Seng Teoh conducted experiments
and produced final report (142). Tested fuel samples were stored at a range of temperatures
(ambient, 20, 60, 85, 105⁰C) for four weeks. Free fatty acid content was tested on a weekly
basis.
The findings can be summarised as follows; animal fat storage in liquid form at elevated
temperatures does not increase its acidity, refer to data given in Table 6.3 and graphically
presented in Figure 6.12. An increase has been detected for room and ambient temperature
– however, due to a large error margin, it cannot be regarded as significant.

114
Table 6.3 Animal fat acidity - long term storage
Temp (0C)Content of Free Fatty Acid (%)
Reference Week 1 Week 2 Week 3 Week 4
Ambient 9.4 9.1 9.3 9.1 9.7
20 9.4 9.1 9.3 9.1 9.3
65 9.4 9.1 9.3 9.3 9.7
85 9.4 9.2 9.1 8.9 9.0
105 9.4 9.0 8.7 8.6 7.9
Figure 6.12 Free fatty acids content in animal fat stored for four weeks at various temperatures
7.5
8
8.5
9
9.5
10
Reference Week 1 Week 2 Week 3 Week 4
FFA
Co
nce
ntr
atio
ns
[%]
Ambient 20 degC 65degC 85 degC 105 degC

115
6.3 Conclusions
The investigation presented in this chapter can be summarised as follows. Animal fat
viscosity can be reduced by pre heating, however, even raising the temperature up to 90⁰C
does not bring the viscosity down to a level comparable with conventional diesel fuel. For
lower temperatures, like 40⁰C, when viscosity is high, a shear heating effect was observed.
A linear relationship between fat temperature and its density was proved. The measured
density is higher than conventional fuel and FAME, despite elevating the fuel temperature.
A similar relationship was detected for fuel surface tension where pre heating reduces fat
surface tension for various bubble lifetimes. The applied method – maximum bubble
pressure – enabled detection of a significant difference between diesel fuel and fat,
especially for short bubble lifetimes. Investigation of the hydrodynamic effect on fuel
atomisation requires further analysis. Lubricating properties were tested at HFRR. Tests
proved the excellent lubricity of animal fat at a range of temperatures. The impact of
elevating the temperature up to 90⁰C was studied and no significant change in the wear
scar diameter was detected. Acidity dependence on storage temperature was another area
investigated in this chapter. Results of tests performed as part of FYP proved that animal
fat storage at higher temperatures does not have an impact on fuels’ acidity.
Two samples of tallow were sent for more detailed analysis to external laboratories.
Certificates of analysis form Appendix 3.

116
The general conclusion of the tests presented in this chapter is that pre heating can be used
as a method of altering physical properties to match those of conventional fuel. It has to be
noted that raising fuel temperature even above 90⁰C does not result in achieving properties
similar to ULSD. Animal fat should be treated as an alternative to heavy fuel oil (HFO). As
no negative consequences of pre heating were detected, fat temperature of 80-90⁰C was
chosen for engine trials.

117
Chapter 7 COMBUSTION PROCESS ANALYSIS
7.1 Combustion Characteristics
Heat release analysis is conducted in a way proposed and described by Stone (143). Net
heat release rate is calculated with the following equation:
1
1
1
where k is approximated to be the polytropic exponent of compression and expansion, for
which a different value is calculated for the respective parts of the cycle. Presented results
are averages obtained from 100 cycles.
The in-cylinder pressure and heat release rate patterns, accompanied by cylinder pressure
rise rates for three rated loads from the engine operation on diesel and animal fat, are
shown in Figures 47-52. A summary of combustion analysis is given in Table 7.1. Fossil
diesel fuel has a higher calorific value than animal fat, thus the mass flow of animal fat was
increased on average by 10-15 %, whereas volumetric flow rose by 5-7 %. The peak
engine load for animal fat fuelling was reduced by 10%, as the fuel injection system was
not modified to deliver higher quantities of fuels.
Figure 7.1 presents pressure and heat release patterns for diesel and tallow combustion at
high load (75%). It can be seen that peak pressure for tallow combustion is higher and
occurs approximately two crank angle degrees later than for diesel. The difference in heat
release patterns is evident. Net heat release rate (NHRR) during the premixed combustion
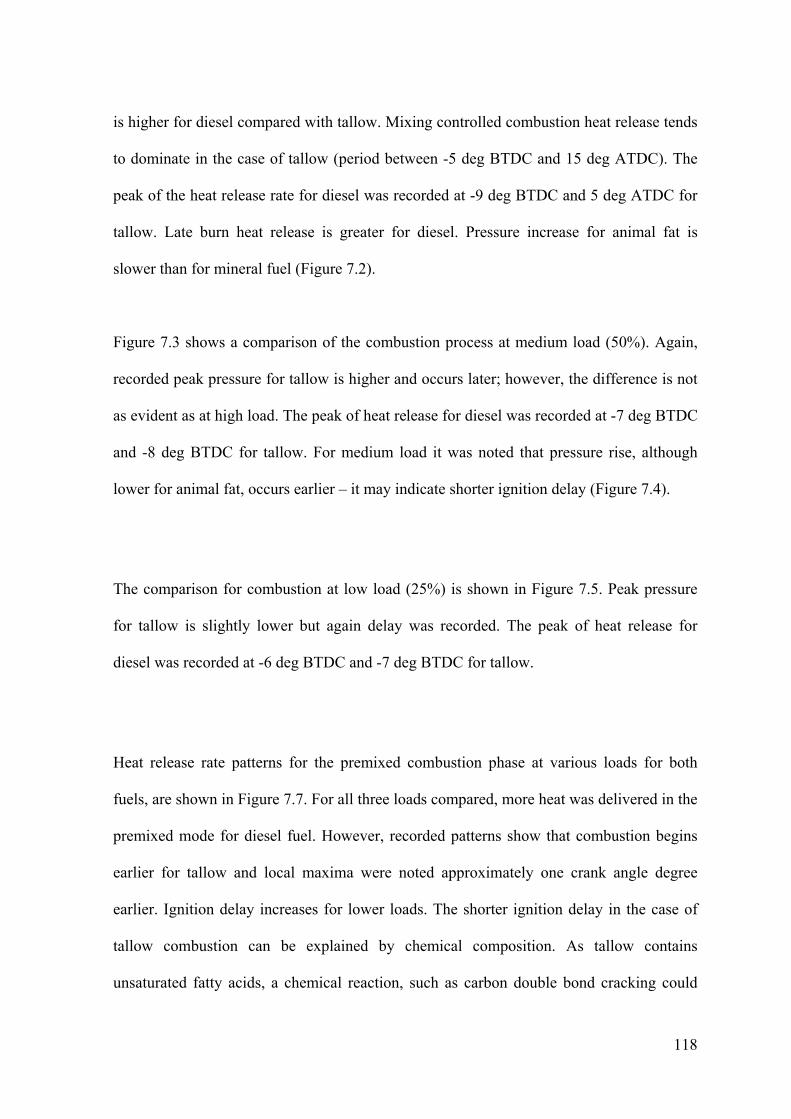
118
is higher for diesel compared with tallow. Mixing controlled combustion heat release tends
to dominate in the case of tallow (period between -5 deg BTDC and 15 deg ATDC). The
peak of the heat release rate for diesel was recorded at -9 deg BTDC and 5 deg ATDC for
tallow. Late burn heat release is greater for diesel. Pressure increase for animal fat is
slower than for mineral fuel (Figure 7.2).
Figure 7.3 shows a comparison of the combustion process at medium load (50%). Again,
recorded peak pressure for tallow is higher and occurs later; however, the difference is not
as evident as at high load. The peak of heat release for diesel was recorded at -7 deg BTDC
and -8 deg BTDC for tallow. For medium load it was noted that pressure rise, although
lower for animal fat, occurs earlier – it may indicate shorter ignition delay (Figure 7.4).
The comparison for combustion at low load (25%) is shown in Figure 7.5. Peak pressure
for tallow is slightly lower but again delay was recorded. The peak of heat release for
diesel was recorded at -6 deg BTDC and -7 deg BTDC for tallow.
Heat release rate patterns for the premixed combustion phase at various loads for both
fuels, are shown in Figure 7.7. For all three loads compared, more heat was delivered in the
premixed mode for diesel fuel. However, recorded patterns show that combustion begins
earlier for tallow and local maxima were noted approximately one crank angle degree
earlier. Ignition delay increases for lower loads. The shorter ignition delay in the case of
tallow combustion can be explained by chemical composition. As tallow contains
unsaturated fatty acids, a chemical reaction, such as carbon double bond cracking could
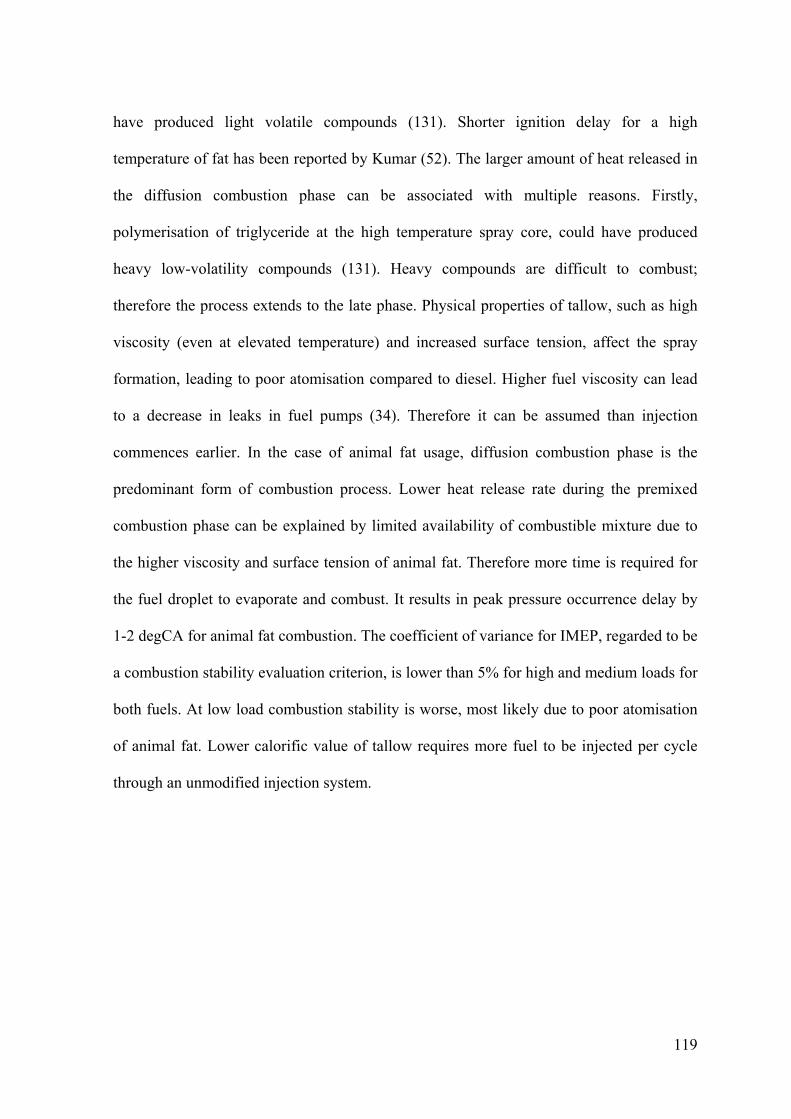
119
have produced light volatile compounds (131). Shorter ignition delay for a high
temperature of fat has been reported by Kumar (52). The larger amount of heat released in
the diffusion combustion phase can be associated with multiple reasons. Firstly,
polymerisation of triglyceride at the high temperature spray core, could have produced
heavy low-volatility compounds (131). Heavy compounds are difficult to combust;
therefore the process extends to the late phase. Physical properties of tallow, such as high
viscosity (even at elevated temperature) and increased surface tension, affect the spray
formation, leading to poor atomisation compared to diesel. Higher fuel viscosity can lead
to a decrease in leaks in fuel pumps (34). Therefore it can be assumed than injection
commences earlier. In the case of animal fat usage, diffusion combustion phase is the
predominant form of combustion process. Lower heat release rate during the premixed
combustion phase can be explained by limited availability of combustible mixture due to
the higher viscosity and surface tension of animal fat. Therefore more time is required for
the fuel droplet to evaporate and combust. It results in peak pressure occurrence delay by
1-2 degCA for animal fat combustion. The coefficient of variance for IMEP, regarded to be
a combustion stability evaluation criterion, is lower than 5% for high and medium loads for
both fuels. At low load combustion stability is worse, most likely due to poor atomisation
of animal fat. Lower calorific value of tallow requires more fuel to be injected per cycle
through an unmodified injection system.
120
Figure 7.1 Combustion process comparison – 75% load
Figure 7.2 Cylinder pressure rise rate – 75% load
‐400
0
400
800
1200
1600
2000
0
10
20
30
40
50
60
70
‐20 ‐10 0 10 20 30 40 50 60
NH
RR
(J/
deg
CA
)
Cyl
ind
er P
ress
ure
(b
ar)
Crank Angle (deg)
Tallow
Diesel
‐0.5
0
0.5
1
1.5
2
2.5
3
3.5
‐14 ‐12 ‐10 ‐8 ‐6 ‐4 ‐2 0 2 4 6 8 10
Cyl
ind
er P
ress
ure
Ris
e R
ate
(bar
/deg
CA
)
Crank Angle (deg)
Tallow
Diesel
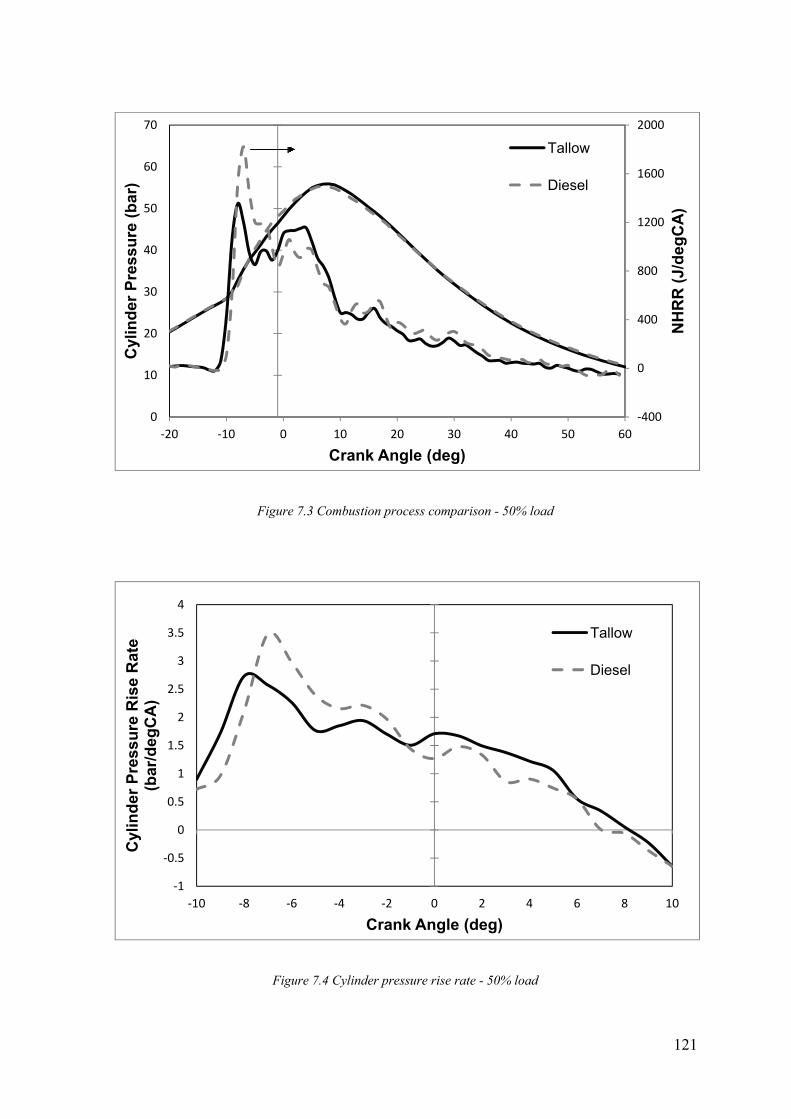
121
Figure 7.3 Combustion process comparison - 50% load
Figure 7.4 Cylinder pressure rise rate - 50% load
‐400
0
400
800
1200
1600
2000
0
10
20
30
40
50
60
70
‐20 ‐10 0 10 20 30 40 50 60
NH
RR
(J/
deg
CA
)
Cyl
ind
er P
ress
ure
(b
ar)
Crank Angle (deg)
Tallow
Diesel
‐1
‐0.5
0
0.5
1
1.5
2
2.5
3
3.5
4
‐10 ‐8 ‐6 ‐4 ‐2 0 2 4 6 8 10
Cyl
ind
er P
ress
ure
Ris
e R
ate
(bar
/deg
CA
)
Crank Angle (deg)
Tallow
Diesel
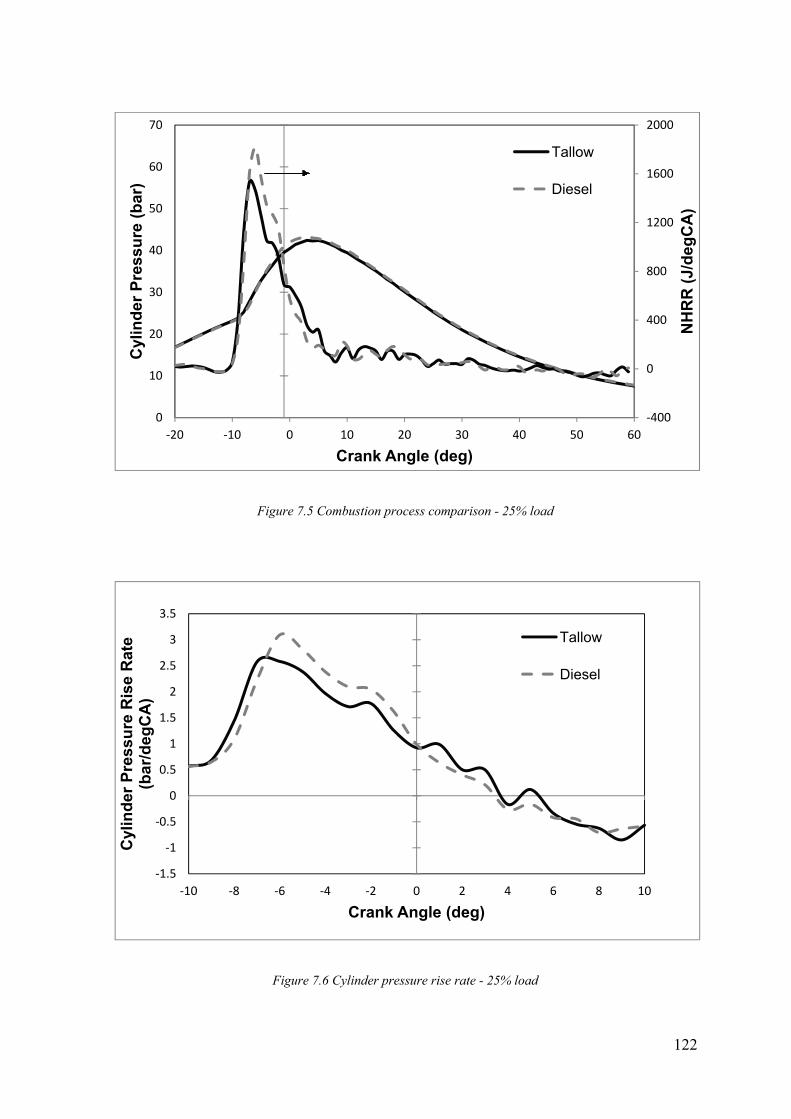
122
Figure 7.5 Combustion process comparison - 25% load
Figure 7.6 Cylinder pressure rise rate - 25% load
‐400
0
400
800
1200
1600
2000
0
10
20
30
40
50
60
70
‐20 ‐10 0 10 20 30 40 50 60
NH
RR
(J/
deg
CA
)
Cyl
ind
er P
ress
ure
(b
ar)
Crank Angle (deg)
Tallow
Diesel
‐1.5
‐1
‐0.5
0
0.5
1
1.5
2
2.5
3
3.5
‐10 ‐8 ‐6 ‐4 ‐2 0 2 4 6 8 10
Cyl
ind
er P
ress
ure
Ris
e R
ate
(bar
/deg
CA
)
Crank Angle (deg)
Tallow
Diesel

123
Table 7.1 Combustion analysis results
Parameter Unit Test condition
D75 T75 D50 T50 D25 T25
Ignition delay deg CA 12 12 12 12 13 13
25% HR @ deg CA 0 0 -4 -4 -6 -6
50% HR @ deg CA 10 8 3 3 -3 -3
95% HR @ deg CA 40 36 32 30 19 20
Total duration (Injection -95% MFB)
deg CA 61 57 53 51 40 41
Avg. PP bar 64.5 66.7 54.5 55.0 42.5 41.6
Avg. IP bar 102.1 103.0 69.1 67.3 36.1 34.6
Avg. IMEP bar 10.1 10.2 6.8 6.6 3.6 3.4
COV PP % 2.7 2.2 1.8 2.1 2.8 1.5
COV IP % 2.0 1.2 1.8 2.5 1.7 5.1
COV IMEP % 2.0 1.2 1.8 2.5 1.7 5.1
Fuel Mass Flow kg/h 145 160 100 110 60 65
Fuel Vol. Flow l/h 175 185 120 125 70 75
Where: HR – heat released, PP – peak pressure, IP – indicated pressure, IMEP - indicated mean effective pressure, COV – coefficient of variance
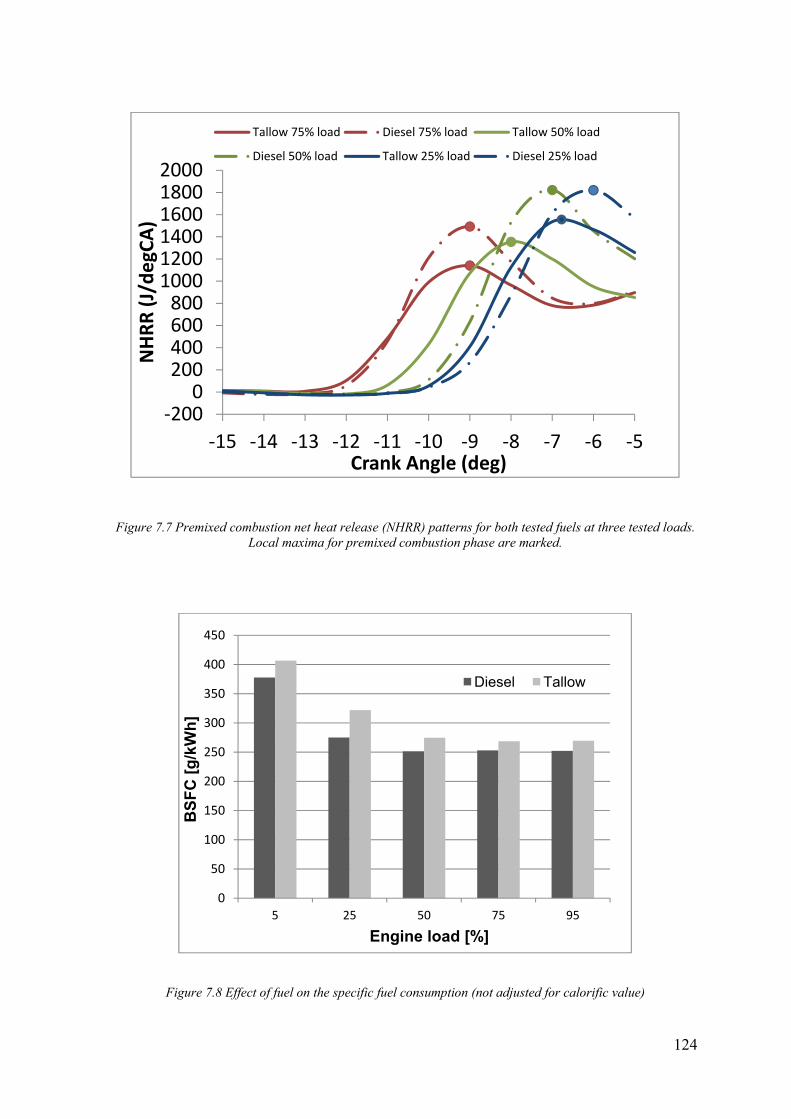
124
Figure 7.7 Premixed combustion net heat release (NHRR) patterns for both tested fuels at three tested loads. Local maxima for premixed combustion phase are marked.
Figure 7.8 Effect of fuel on the specific fuel consumption (not adjusted for calorific value)
‐2000
200400600800
100012001400160018002000
‐15 ‐14 ‐13 ‐12 ‐11 ‐10 ‐9 ‐8 ‐7 ‐6 ‐5
NHRR (J/degCA)
Crank Angle (deg)
Tallow 75% load Diesel 75% load Tallow 50% load
Diesel 50% load Tallow 25% load Diesel 25% load
0
50
100
150
200
250
300
350
400
450
5 25 50 75 95
BS
FC
[g
/kW
h]
Engine load [%]
Diesel Tallow
125
Figure 7.8 shows the variation of the specific fuel consumption for the tested engine when
fuelled with tallow and diesel. Tallow consumption is higher than diesel consumption by
10 – 15%. Specific fuel consumption remains constant at loads varying between 50 and 95
per cent for both tested fuels. Table 7.1 contains a comparison of fuel volumetric and mass
flows.
Fuel consumption has been recorded during the trial. Tallow consumption was recorded by
a mass flow meter with data acquisition module and software. The permit for the trial
specified a limit on tallow throughput to be
hkgQ 270max
. Prior to starting the engine
and switching to tallow, the fuel supply system permeability was checked by draining for a
few seconds. It resulted in high fuel flow spikes being recorded by a flow meter. In Figure
7.9 typical daily fuel consumption data is presented together with a fuel temperature curve.
A weekly tallow consumption graph is shown in Figure 7.10.

126
Figure 7.9 Daily fuel consumption curve
Figure 7.10 Weekly fuel consumption curve

127
7.2 Emissions Comparison
Engine emissions were measured for three loads and two tested fuels. Figure 7.11 contains
a comparison of emissions for the high load operation. One of the main advantages of
animal fat is its very low sulphur content resulting in sulphur dioxide emissions complying
with WID standards for all three tested loads. It eliminates the necessity of a SO2
abatement system.
As animal fat does not contain nitrogen, all nitrogen oxides are formed at high temperature
in the combustion chamber. Higher NOx emissions corresponds with higher cylinder peak
pressure and a prolonged combustion process (Figure 7.1). Higher exhaust temperature for
animal fat combustion has been recorded. Oxygen content in the animal fat improves the
combustion process, as a result, emissions of carbon monoxide and unburned hydrocarbons
are considerably lower.

128
Figure 7.11 Effect of fuel type on the engine exhaust emissions - 75% load
For the medium load, nitrogen oxides emissions are higher for animal fat (Figure 7.12),
however, the measured difference is not as significant as for the high load. Carbon
monoxide emissions are higher for animal fat. A similar observation was made for the low
load operation, but the differences in emissions’ levels are more significant. For the low
load operation (Figure 7.13) nitrogen oxides emissions are lower due to lower peak
pressure and lower temperature for fat combustion.
Increasing formation of carbon monoxide, accompanied by descending concentration of
nitrogen oxides for tallow combustion at the medium and low load operation, can be
associated with multiple reasons. Firstly, the physical properties of tallow cause poor
atomization, despite the presence of oxygen in the fuel molecule. Secondly, it can be
explained by the characteristics and efficiency of the turbocharger. The Ruston 6AR is
0
50
100
150
200
250
300
350
400
NOx * 10 CO HC Soot SO2
Em
issi
on
s (m
g/m
3)Diesel Tallow

129
equipped with a Napier turbocharger with a constant geometry setting optimised for high
load operation. Therefore cylinder filling and scavenging is worse for low loads. Finally,
implications of the engine design type may affect the atomization process and tallow
combustion. For a direct injection engine with a low compression ratio, the air temperature
before start of the injection will be lower than for high loads.
Figure 7.12 Effect of fuel type on the engine exhaust emissions - 50% load
0
50
100
150
200
250
300
350
400
NOx * 10 CO HC Soot SO2
Em
issi
on
s (m
g/m
3)
Diesel
Tallow

130
Figure 7.13 Effect of fuel type on the engine exhaust emissions - 25% load
7.3 Use of EGR
The effects of various EGR concentrations on tallow combustion have been tested, with
and without water injection. Results for the standard EGR configuration combustion
analysis are given in Figure 7.14. As expected, peak pressure decreases with increased
proportions of recirculated gases. The addition of exhaust gas prolongs the duration of the
combustion process. For low recirculation rates there is no significant impact on the
combustion process. Figure 7.15 shows the impact of cooled exhaust gas recirculation on
the tallow combustion process. Addition of more than 20% of EGR results in a significant
drop in peak pressure.
0
50
100
150
200
250
300
350
400
450
500
NOx * 10 CO HC Soot SO2
Em
issi
on
s (m
g/m
3)
Diesel Tallow

131
Figure 7.14 Impact of the EGR on tallow combustion
Figure 7.15 Impact of the cooled EGR (cEGR) on tallow combustion
‐400
0
400
800
1200
1600
2000
0
10
20
30
40
50
60
70
‐20 ‐10 0 10 20 30 40 50 60
NH
RR
(J/
deg
CA
)
Cyl
ind
er P
ress
ure
(b
ar)
Crank Angle (deg)
EGR OFF
EGR 9.3%
EGR 12.6%
EGR 18.3%
‐400
0
400
800
1200
1600
2000
0
10
20
30
40
50
60
70
‐20 ‐10 0 10 20 30 40 50 60
NH
RR
(J/
deg
CA
)
Cyl
ind
er P
ress
ure
(b
ar)
Crank Angle (deg)
cEGR OFFcEGR 9.5%cEGR 14.5%cEGR 23.3%

132
Figure 7.16 presents an emissions’ comparison for various EGR concentrations. As
expected, increasing the recirculation rate results in an increase of carbon monoxide. For
cooled EGR, (Figure 7.17), more gases can be recirculated without an increase in exhaust
temperature; better NOx reduction has been achieved. Emission of nitrogen oxides has
been reduced by 75%, below the required 450 mg/m3, compared with the 0% EGR case. At
the same time, carbon monoxide emission increased by 280%, and soot emission increased
by 300%. It should be noted that the reference level for animal fat combustion is already
low compared to fossil fuels. However, hydrocarbons emission decreased by 25%. This
can be explained by the scrubbing effect of water sprayed into the exhaust and spun in the
cyclone chamber. Visible carbon containing deposits were found in the excess water.
Addition of water cooling and gas humidification improved the efficiency of the NOx
reduction process (Figure 7.18). EGR concentrations higher than 18% were not achieved
without cooling, due to an increase of exhaust temperature above 450°C and charge air
temperature above 50°C. Gas cooling and water injection enabled the desired NOx
reduction efficiency, at the same time charge air temperature did not increase above 40°C
and exhaust temperature was stable at a 450°C level. Specific fuel consumption increased
by 7%. The results obtained are consistent with those obtained on a low speed two stroke
engine by MAN Diesel (84).
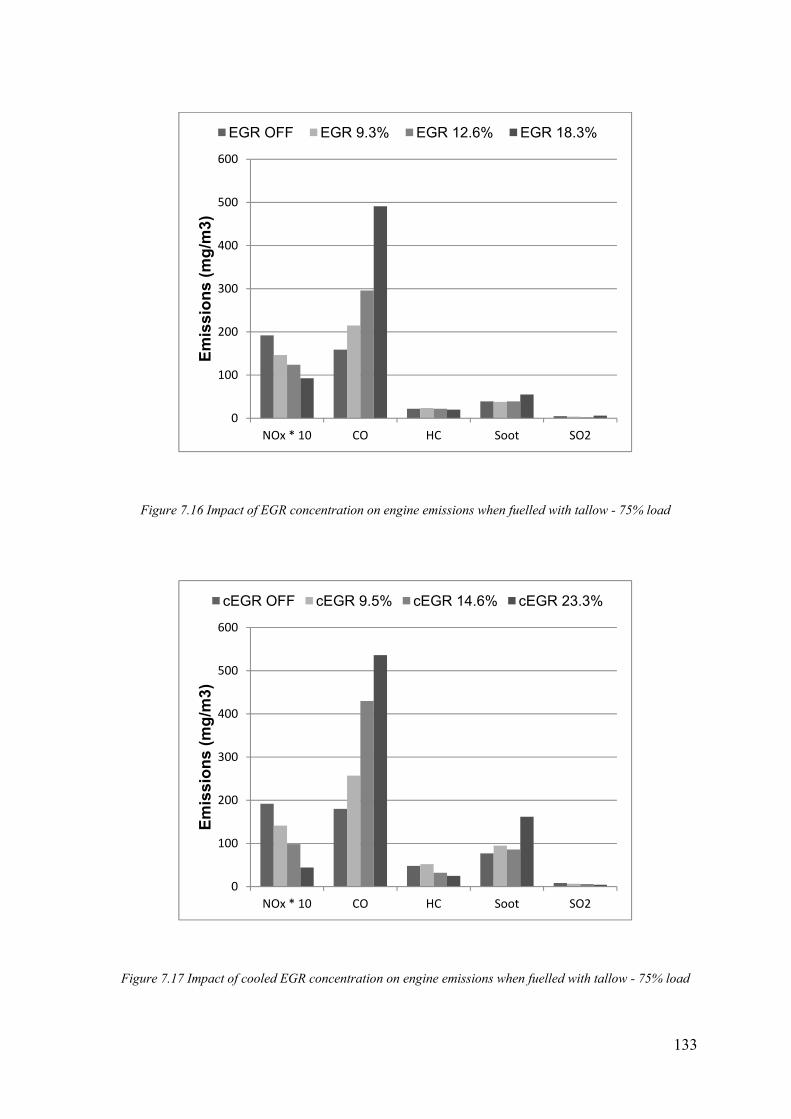
133
Figure 7.16 Impact of EGR concentration on engine emissions when fuelled with tallow - 75% load
Figure 7.17 Impact of cooled EGR concentration on engine emissions when fuelled with tallow - 75% load
0
100
200
300
400
500
600
NOx * 10 CO HC Soot SO2
Em
issi
on
s (m
g/m
3)
EGR OFF EGR 9.3% EGR 12.6% EGR 18.3%
0
100
200
300
400
500
600
NOx * 10 CO HC Soot SO2
Em
issi
on
s (m
g/m
3)
cEGR OFF cEGR 9.5% cEGR 14.6% cEGR 23.3%
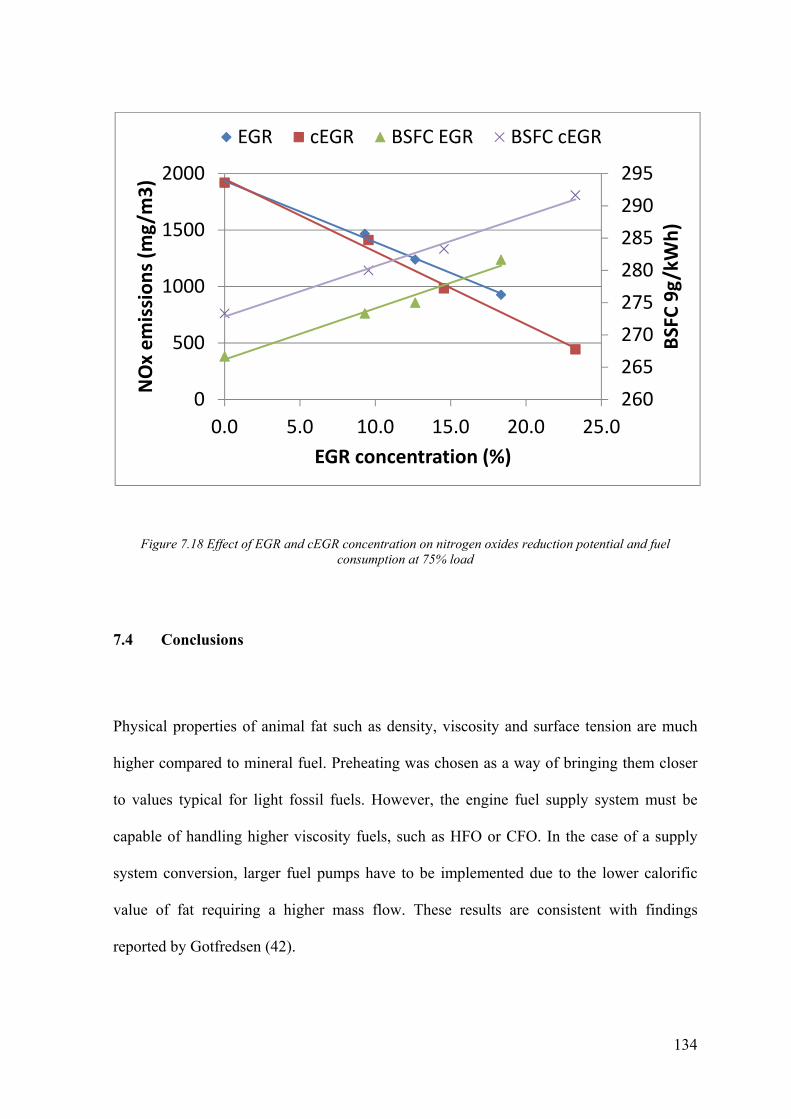
134
Figure 7.18 Effect of EGR and cEGR concentration on nitrogen oxides reduction potential and fuel consumption at 75% load
7.4 Conclusions
Physical properties of animal fat such as density, viscosity and surface tension are much
higher compared to mineral fuel. Preheating was chosen as a way of bringing them closer
to values typical for light fossil fuels. However, the engine fuel supply system must be
capable of handling higher viscosity fuels, such as HFO or CFO. In the case of a supply
system conversion, larger fuel pumps have to be implemented due to the lower calorific
value of fat requiring a higher mass flow. These results are consistent with findings
reported by Gotfredsen (42).
260
265
270
275
280
285
290
295
0
500
1000
1500
2000
0.0 5.0 10.0 15.0 20.0 25.0
BSFC 9g/kWh)
NOx emissions (m
g/m
3)
EGR concentration (%)
EGR cEGR BSFC EGR BSFC cEGR
135
Combustion of animal fat results in achieving higher peak pressures; emissions of NOx
increase as a result. The ignition delay was shorter for animal fat; the difference is evident
for low load operation. Pressure rise rate for the animal fat was lower for all tested loads.
Specific fuel consumption for the tested engine increased when fuelled with tallow.
Animal fat contains oxygen, it leads to a more complete oxidation process, as a result
emissions of carbon monoxide, hydrocarbons and soot are considerably lower at high
loads. At medium and low load conditions the negative effect of the physical properties of
the fuel on fuel atomization seem to prevail the benefits of the oxygen content, resulting in
increased CO emissions. Emissions of sulphur dioxide were very low, complying with
limits set by the local authority. Application of animal fat as fuel eliminates a necessity of
SO2 abatement system.
As described in the literature review - Table 2.7 - increased emissions of CO and HC
accompanied with lower NOx emissions for animal fat were reported. It has to be noted
that the described tests were conducted at a relatively low fuel temperature – 60 ºC.
Considering the fact that animal fat temperature for the current test was set above 80 ºC,
obtained results seem to confirm the positive effect of higher triacylglycerol supply
temperature on the combustion characteristics and emissions.
The suitability of exhaust gas recirculation as a nitrogen oxides’ reduction method for
stationary engines operating at high loads has been tested. Introduction of gas cooling and
humidification increased the method’s efficiency enabling a 75% reduction in NOx
emissions.

136
The impact of the reported higher fuel consumption on generating station feasibility has to
be considered. Combining the effect of lowering oxygen concentration by exhaust gas
recirculation with the presence of water vapour, can be considered as a feasible method of
NOx abatement, even for stationary engines designed to operate on high loads for
prolonged periods of time.
137
Chapter 8 LONG TERM EFFECT OF USING TALLOW
8.1 Introduction
This chapter presents the consequences of using neat animal fat in a medium speed, four
stroke diesel engine. The impact on the fuel supply system, injectors and lubricating oil is
described. A preliminary assessment of the possible impact of animal fat on the fuel supply
system has been conducted by analysis of the lubricating properties. Lubricity has been
measured at an HFRR (High Frequency Reciprocating Rig). As high acidity of fuel was
detected it was decided to verify the capability of the upgraded lubricating oil to withstand
an operation of the engine when fuelled with animal fat. Two lubricating oils were
compared.
8.2 Lubricating Oil
8.2.1 Requirements for Lubricating Oils Used in Generating Sets
A modern engine needs a wide range of oil qualities. Oil acts in the following processes:
- Separation of moving surfaces with oil film
- Engine cooling by combustion and friction heat dissipation
- Combustion chamber sealing
- Cleaning the engine from deposits.
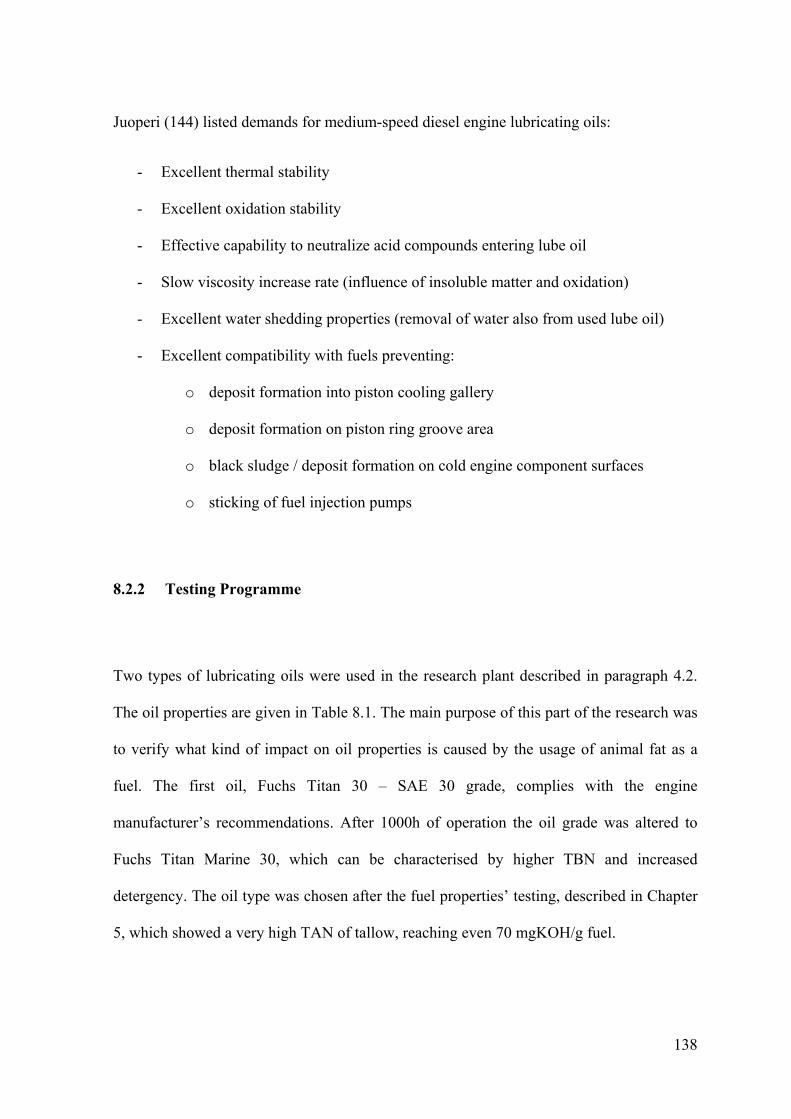
138
Juoperi (144) listed demands for medium-speed diesel engine lubricating oils:
- Excellent thermal stability
- Excellent oxidation stability
- Effective capability to neutralize acid compounds entering lube oil
- Slow viscosity increase rate (influence of insoluble matter and oxidation)
- Excellent water shedding properties (removal of water also from used lube oil)
- Excellent compatibility with fuels preventing:
o deposit formation into piston cooling gallery
o deposit formation on piston ring groove area
o black sludge / deposit formation on cold engine component surfaces
o sticking of fuel injection pumps
8.2.2 Testing Programme
Two types of lubricating oils were used in the research plant described in paragraph 4.2.
The oil properties are given in Table 8.1. The main purpose of this part of the research was
to verify what kind of impact on oil properties is caused by the usage of animal fat as a
fuel. The first oil, Fuchs Titan 30 – SAE 30 grade, complies with the engine
manufacturer’s recommendations. After 1000h of operation the oil grade was altered to
Fuchs Titan Marine 30, which can be characterised by higher TBN and increased
detergency. The oil type was chosen after the fuel properties’ testing, described in Chapter
5, which showed a very high TAN of tallow, reaching even 70 mgKOH/g fuel.

139
Table 8.1 Lubricating oil properties (145, 146)
Characteristics Unit Test Method Titan TXE 30
Oil Titan Marine
30 Oil
SAE - - 30 30
Kinematic Viscosity
mm2/s IP 71
@100⁰C 11.2 12.3
@40⁰C 96 107
Viscosity Index 102 106
Flash point ⁰C IP34 220 210
TBN mg KOH/g - 14
Sulphated ash %wt. - 1.7
Specific gravity at 20⁰C
kg/dm3 IP160 0.893 0.890
Pour Point ⁰C IP15 -20 -15
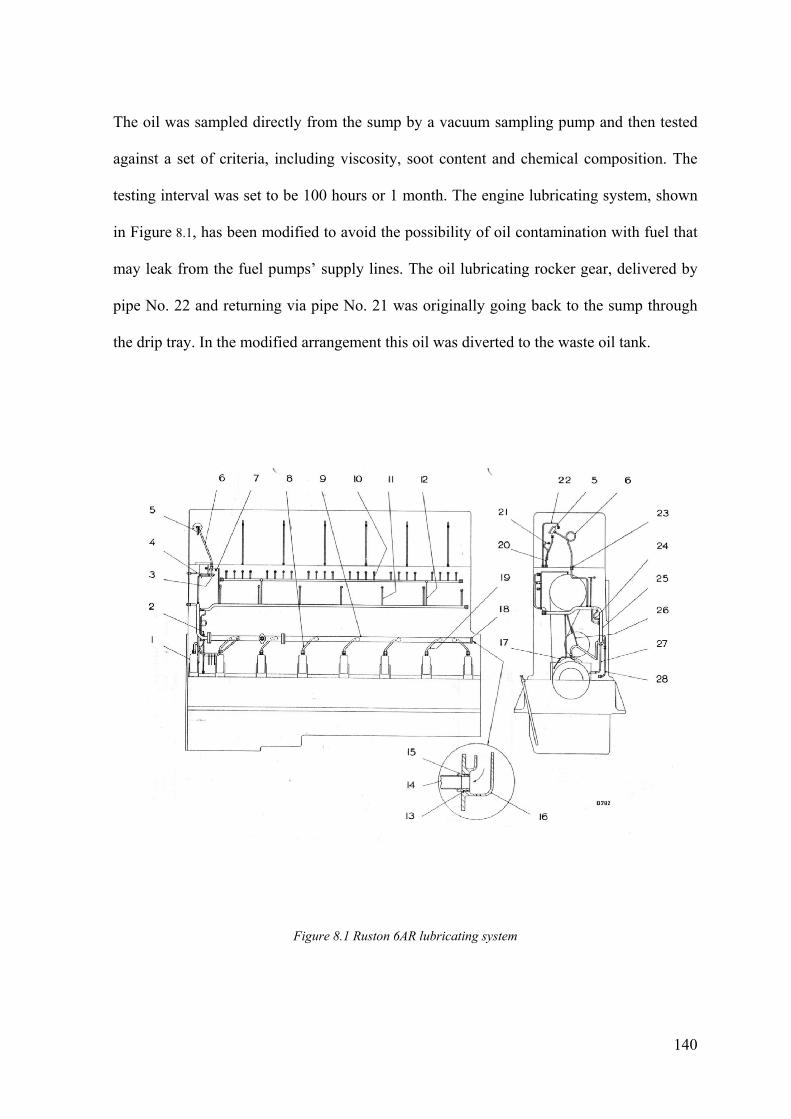
140
The oil was sampled directly from the sump by a vacuum sampling pump and then tested
against a set of criteria, including viscosity, soot content and chemical composition. The
testing interval was set to be 100 hours or 1 month. The engine lubricating system, shown
in Figure 8.1, has been modified to avoid the possibility of oil contamination with fuel that
may leak from the fuel pumps’ supply lines. The oil lubricating rocker gear, delivered by
pipe No. 22 and returning via pipe No. 21 was originally going back to the sump through
the drip tray. In the modified arrangement this oil was diverted to the waste oil tank.
Figure 8.1 Ruston 6AR lubricating system

141
8.2.3 Results
Data collected during the trials are given in Table 8.2. The table is accompanied by two
graphs showing changes in oil viscosity (Figure 8.2) and iron concentration (Figure 8.3).
Increasing viscosity can indicate fuel contamination, high iron content may be caused by
excessive engine wear.
Figure 8.2 Long term effect of animal fat usage on lubricating oil viscosity
80
85
90
95
100
105
110
115
120
125
0 200 400 600 800 1000 1200
Kin
emat
ic V
isco
sity
@ 4
0 d
egC
[cS
t]
Oil Age [h]
SAE 30 Marine SAE 30 (1) Marine SAE 30 (2)
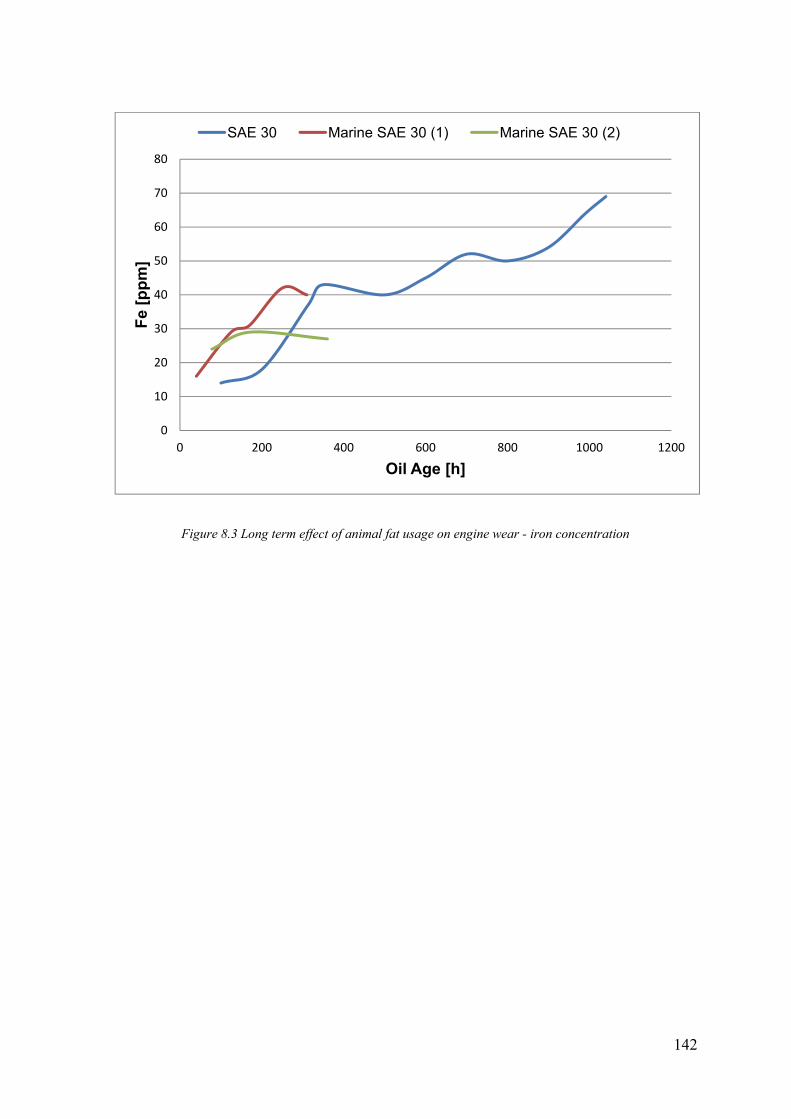
142
Figure 8.3 Long term effect of animal fat usage on engine wear - iron concentration
0
10
20
30
40
50
60
70
80
0 200 400 600 800 1000 1200
Fe
[pp
m]
Oil Age [h]
SAE 30 Marine SAE 30 (1) Marine SAE 30 (2)
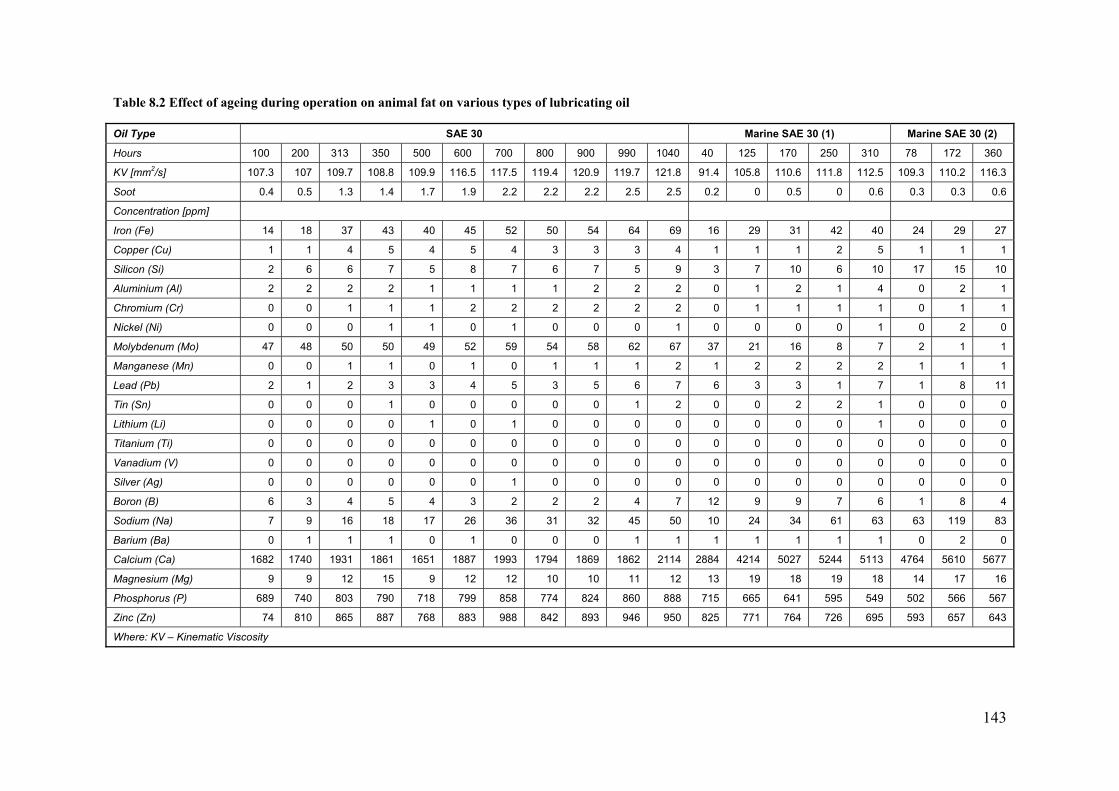
143
Table 8.2 Effect of ageing during operation on animal fat on various types of lubricating oil
Oil Type SAE 30 Marine SAE 30 (1) Marine SAE 30 (2)
Hours 100 200 313 350 500 600 700 800 900 990 1040 40 125 170 250 310 78 172 360
KV [mm2/s] 107.3 107 109.7 108.8 109.9 116.5 117.5 119.4 120.9 119.7 121.8 91.4 105.8 110.6 111.8 112.5 109.3 110.2 116.3
Soot 0.4 0.5 1.3 1.4 1.7 1.9 2.2 2.2 2.2 2.5 2.5 0.2 0 0.5 0 0.6 0.3 0.3 0.6
Concentration [ppm]
Iron (Fe) 14 18 37 43 40 45 52 50 54 64 69 16 29 31 42 40 24 29 27
Copper (Cu) 1 1 4 5 4 5 4 3 3 3 4 1 1 1 2 5 1 1 1
Silicon (Si) 2 6 6 7 5 8 7 6 7 5 9 3 7 10 6 10 17 15 10
Aluminium (Al) 2 2 2 2 1 1 1 1 2 2 2 0 1 2 1 4 0 2 1
Chromium (Cr) 0 0 1 1 1 2 2 2 2 2 2 0 1 1 1 1 0 1 1
Nickel (Ni) 0 0 0 1 1 0 1 0 0 0 1 0 0 0 0 1 0 2 0
Molybdenum (Mo) 47 48 50 50 49 52 59 54 58 62 67 37 21 16 8 7 2 1 1
Manganese (Mn) 0 0 1 1 0 1 0 1 1 1 2 1 2 2 2 2 1 1 1
Lead (Pb) 2 1 2 3 3 4 5 3 5 6 7 6 3 3 1 7 1 8 11
Tin (Sn) 0 0 0 1 0 0 0 0 0 1 2 0 0 2 2 1 0 0 0
Lithium (Li) 0 0 0 0 1 0 1 0 0 0 0 0 0 0 0 1 0 0 0
Titanium (Ti) 0 0 0 0 0 0 0 0 0 0 0 0 0 0 0 0 0 0 0
Vanadium (V) 0 0 0 0 0 0 0 0 0 0 0 0 0 0 0 0 0 0 0
Silver (Ag) 0 0 0 0 0 0 1 0 0 0 0 0 0 0 0 0 0 0 0
Boron (B) 6 3 4 5 4 3 2 2 2 4 7 12 9 9 7 6 1 8 4
Sodium (Na) 7 9 16 18 17 26 36 31 32 45 50 10 24 34 61 63 63 119 83
Barium (Ba) 0 1 1 1 0 1 0 0 0 1 1 1 1 1 1 1 0 2 0
Calcium (Ca) 1682 1740 1931 1861 1651 1887 1993 1794 1869 1862 2114 2884 4214 5027 5244 5113 4764 5610 5677
Magnesium (Mg) 9 9 12 15 9 12 12 10 10 11 12 13 19 18 19 18 14 17 16
Phosphorus (P) 689 740 803 790 718 799 858 774 824 860 888 715 665 641 595 549 502 566 567
Zinc (Zn) 74 810 865 887 768 883 988 842 893 946 950 825 771 764 726 695 593 657 643
Where: KV – Kinematic Viscosity

144
It can be seen that oil viscosity increased for both types of tested oils. During the trials the
oil centrifuge had to be cleaned more frequently than for standard fuel operation due to fast
deposit formation. The maintenance schedule was altered. Oil contamination with fuel can
be caused by increased spray penetration due to different physical properties of fuel; hence
droplets may hit liner walls and penetrate to the sump. Excessive wear has not been
detected for both types of lubricating oil as concentrations of bearing materials (Cu, Pb,
Sn) remained below warning limits. Conclusions are presented in paragraph 8.4.
8.3 Impact on Injectors and Fuel Pumps
Two sets of Ruston FAR 20000 fuel pumps (shown in Figure 8.4) were installed on the
Ruston 6AR engine. Technical data are given in Table 8.3. The fuel pumps were inspected
daily for leaks. Each set was used for approximately 1000 h.
Table 8.3 Fuel pump specification
Pump type FAR – 20000
Camshaft speed 300 rpm
Pump stroke 15 mm
Plunger diameter 22 mm
Fuel delivery at full load 200 cm3/100 strokes
Injector nozzle configuration 10 x 0.014’’
Injector release pressure 200 bar
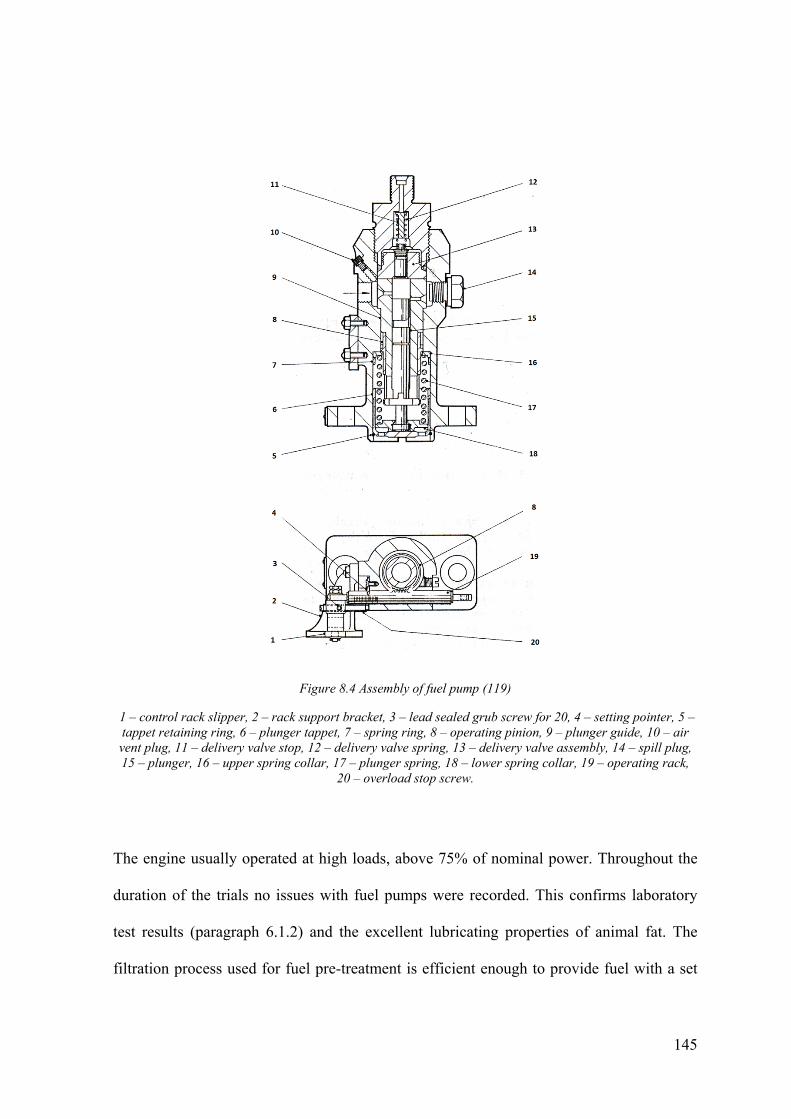
145
Figure 8.4 Assembly of fuel pump (119)
1 – control rack slipper, 2 – rack support bracket, 3 – lead sealed grub screw for 20, 4 – setting pointer, 5 – tappet retaining ring, 6 – plunger tappet, 7 – spring ring, 8 – operating pinion, 9 – plunger guide, 10 – air vent plug, 11 – delivery valve stop, 12 – delivery valve spring, 13 – delivery valve assembly, 14 – spill plug, 15 – plunger, 16 – upper spring collar, 17 – plunger spring, 18 – lower spring collar, 19 – operating rack,
20 – overload stop screw.
The engine usually operated at high loads, above 75% of nominal power. Throughout the
duration of the trials no issues with fuel pumps were recorded. This confirms laboratory
test results (paragraph 6.1.2) and the excellent lubricating properties of animal fat. The
filtration process used for fuel pre-treatment is efficient enough to provide fuel with a set
146
of properties enabling trouble-free usage in the reciprocating engine fuel supply system. It
has to be noted that implementation of these fuels for new common rail systems may
require further investigation and specification alteration.
Fuel not complying with internal specifications has also been tested. Contamination with
polyethylene, ash and insoluble impurities was noticeably higher. As a result, fuel pumps
were damaged in less than 100 hours. The seal between the plunger and the guide was lost
and fuel was leaking to the orifice below the fuel pumps, shown in Figure 8.5 (the picture
has been taken through the inspection window below the fuel pump assembly; fuel droplets
reflect flash light and are visible as a group of white points surrounding the plunger). Fuel
injection pressure could not be maintained at the required level, therefore it was impossible
to operate the engine at high load. Low injection pressure had an impact on the fuel spray
resulting in an increase of emissions of unburned hydrocarbons and carbon monoxide by
approximately 300%. The pumps were later dismantled and a visual inspection of the
plunger surface confirmed wear signs caused by a higher level of impurities present in the
fuel. It has to be highlighted that damage occurred despite having a standard fuel filter in
place (5 micron cartridge).

147
Figure 8.5 Fuel leaking from fuel pumps damaged by fat containing polyethylene
Standard injectors without nozzles’ cooling were used. Release pressure was set to 200 bar.
Deposit formation on the injector nozzles was detected. Figure 8.6 shows a blocked nozzle
(bad case). The tests proved that nozzles can be used for up to 130 hours of continuous
operation. After that period the nozzles require cleaning. Usually the nozzles required
replacement after two cleaning cycles. As described in paragraph 7.2, emissions of carbon
monoxide and unburned hydrocarbons are lower due to the oxygen content in animal fat.
Therefore any increase in monitored carbon monoxide emissions or visible smoke can
indicate deposit build-up requiring intervention. One of the possible methods of extending
cleaning intervals is periodic operation on fossil fuel. Application of this method must be
carefully considered, as there is a 10% limit for fossil fuel content in fuel mix used for
subsidised renewable electricity generation in the UK (95). The combustion of fat resulted
in a higher temperature inside the combustion chamber and in the exhaust system. It led to

148
the nozzle’s tip breaking, as shown in Figure 8.7. Part of the trial run was performed with
fuel heated up to 65⁰C. It resulted in valve damage (please refer to Figure 8.8 and Figure
8.9) and an increased tendency to deposit build-up on the injector nozzles. It can be
explained by fat’s higher density, viscosity and surface tension leading to poor atomisation
and increased spray penetration (66).
Figure 8.6 Deposit build-up

149
Figure 8.7 Injector nozzle damage caused by high temperature
Figure 8.8 Burned exhaust valve
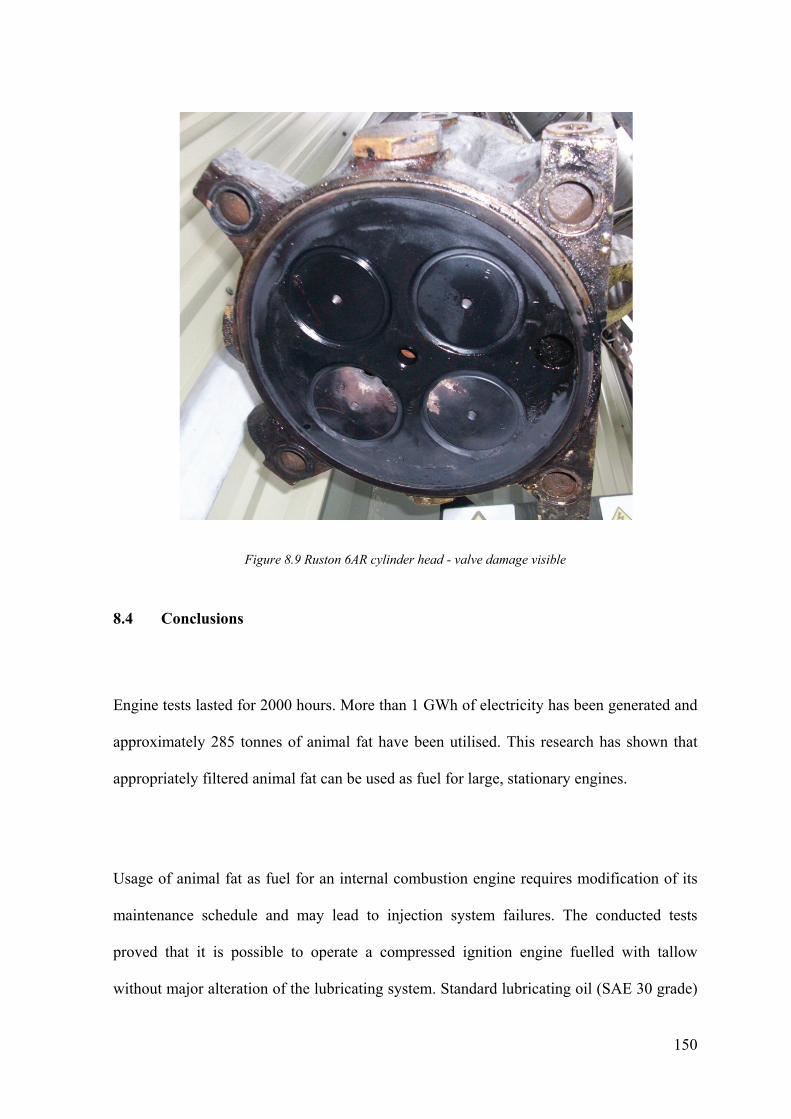
150
Figure 8.9 Ruston 6AR cylinder head - valve damage visible
8.4 Conclusions
Engine tests lasted for 2000 hours. More than 1 GWh of electricity has been generated and
approximately 285 tonnes of animal fat have been utilised. This research has shown that
appropriately filtered animal fat can be used as fuel for large, stationary engines.
Usage of animal fat as fuel for an internal combustion engine requires modification of its
maintenance schedule and may lead to injection system failures. The conducted tests
proved that it is possible to operate a compressed ignition engine fuelled with tallow
without major alteration of the lubricating system. Standard lubricating oil (SAE 30 grade)

151
withstood a 1000 hours’ change interval. Application of marine oil did not result in a
significant difference in oil contamination with various wear products. It has to be noted
that due to piston failure, the engine oil (Marine) had to be replaced before reaching the
planned 1000 hours. The capacity of the oil centrifuge should be increased to improve
removal of fat from the lubricating oil. Another modification that improved operation on
animal fat was increased diameter of the pipe feeding the centrifuge and introduction of
trace heating. It resulted in improved flow of oil to the centrifuge and ensured that
contaminated oil will not solidify in the narrow parts of the lubricating system.
Animal fat has a tendency to build up deposits on the injector nozzles’ tips. The
relationship between fuel temperature and longevity was observed. Fuel pre heating above
85⁰C improved the atomisation and emissions (CO, HC). Operation on partial loads or low
temperature fuel (below 70⁰C) resulted in increased deposit build up. Another consequence
was poor atomisation and increased spray penetration. The following remedies can be
suggested to extend intervals between injector nozzle cleaning and/or replacement: firstly,
nozzle cooling can be implemented, the fuel can be fed at a higher temperature so
atomisation is improved and cooling should prevent the nozzle from the damage described
earlier in this chapter. Another strategy is periodical operation on fossil fuel when deposits
are removed.
152
Chapter 9 CONCLUSIONS AND FURTHER WORK
9.1 Summary of Presented Findings
This thesis contains numerous findings on the use of animal fat in internal combustion
engines. The research programme focused on large compressed ignition engines used in
marine and stationary power generation applications. The most important and significant
findings and observations are presented in the following sections in the order of the
original chapters. A summary of the KTP Project – extracted from the KTP Final Report
(147) forms Appendix 4.
9.1.1 Consistency of Tallow Properties
The conducted tests identified a high variability of animal fat properties. It was also proven
that constant monitoring of the fat properties is required in order to utilise it in the engine,
as the quality can vary significantly even from batch to batch. Acidity was identified as a
crucial property that has to be improved in order to comply with the bio fuel specification
of any available generating set. The impact of ambient temperature on fat acidity has been
detected, as high temperature during summer months speeds up the feedstock
decomposition process. The most important outcome of research presented in Chapter 5 is
the understanding of what is a typical set of properties of animal fat – thus in the further
stages of the research process the appropriate fuel sample was used.
153
The possibility of free fatty acid removal by evaporation has been investigated. The trial
runs have shown a promising removal efficiency reaching more than 50%.
9.1.2 Determination of Appropriate Storage and Supply Temperatures
As animal fat is solid at room temperature, pre heating is required to reduce the viscosity
and feed the fuel through a standard fuel supply system. Investigation focused on analysis
of the effect of elevated temperature on physical properties of the animal fat. The viscosity
test showed that animal fat needs to be preheated above 80⁰C to reduce its viscosity to a
level complying with requirements given by 2-stroke large engine fuelled with HFO
(Heavy Fuel Oil). The impact of temperature on the viscosity of animal fat is significant;
raising the temperature from 40⁰C up to 60⁰C results in viscosity reduction from
approximately 40 cP down to 20 cP. Further heating up to 90⁰C reduces viscosity to 9 cP
(for low shear rate) and 8 cP (for high shear rate).
The lubricity of animal fat has been analysed – as the HFRR (High Frequency
Reciprocating Rig) method has been applied. Tallow lubricating properties are excellent as
WSD (Wear Scar Diameter) is less than 110 µm, compared with 320 µm for diesel. It can
be explained by the presence of unsaturated fatty acids in the animal fat. Tallow contains
10% oxygen that improves lubricity. No significant impact of elevated temperature on
lubricating properties has been detected. Wear scar diameter increased for the highest test
point (90⁰C) only by 7 µm

154
Pre heating of animal fat reduces its surface tension. Raising the temperature to 90⁰C
lowers the value down to 25.8 [mN/m] from 31.0 [mN/m] recorded at 40⁰C. Surface
tension is still considerably higher than that of mineral fuel – 23.4 [mN/m] recorded at
40⁰C.
The obtained density test results present a linear trend where density decreases as
temperature rises. The measured density at standard conditions (temperature 15⁰C) – 915
kg/m3 – is higher than the maximum density for diesel fuels (800 – 845 kg/m3) specified in
a standard (37).
It can be concluded that pre heating of fuel to a temperature of at least 85⁰C is required to
modify its properties to suit the requirements given by HFO fuelled engines and also the
Ruston 6AR engine available at the research power plant.
The impact of high fat storage temperature on its properties (acidity) has been studied.
Storage at a temperature of 90⁰C for a prolonged period of time (1 month) did not result in
increased acidity. Fat polymerisation did not occur.

155
9.1.3 Combustion Process Analysis
Recorded cylinder pressure patterns varied from those obtained for diesel for all tested
loads. A lower heat release rate for the premixed combustion phase is characteristic for
tallow across the tested load range. Due to fat’s properties, its atomisation is worse
resulting in prolonged combustion. Difficult atomisation is more significant at low and
medium loads causing an increase of CO and HC emissions. At high loads, however, the
benefit of oxygen presence in tallow leads to more complete oxidation, as a result,
emissions of soot, CO and HC are significantly lower. Emissions of NOx were higher for
animal fat at high load. One of the biggest advantages of using the animal fat as fuel for
reciprocating engines is its low sulphur content, which eliminates the requirement for a
SOx abatement system.
The research programme was focused on design and implementation of an appropriate
nitrogen oxides abatement system. An exhaust gas recirculation system with gases cooling
and humidification was designed and installed. The method achieved desired a NOx
reduction of 75% by recirculating approximately 23% of the exhaust at high load. The
impact of the reported higher fuel consumption on station feasibility has to be considered.
Combining the effect of lowering oxygen concentration by exhaust gas recirculation with
the presence of water vapour, can be considered as a feasible method of NOx abatement,
even for stationary engines designed to operate at high loads for prolonged periods of time.

156
9.1.4 Long Term Effects of Using Tallow on Engine Components
Findings presented in this thesis are supported with experience gained during nearly 2000
hours of extensive tests in the research power plant. One of the outcomes of the KTP
project was the establishing of procedures for generating set operation and maintenance
and also internal fuel specification. Fuel quality is crucial for problem free operation of the
engine on animal fat. It has been proven that engines can run on alternative fuel without
significant problems; however, the injectors’ maintenance schedule has to be modified to
incorporate more frequent cleaning and nozzle replacement due to deposit formation. Fuel
pre heating is a simple way to alter properties of viscous fuels like animal fat. The fuel
internal specification and operational parameters defined in Chapters 5 and 6 were proven
satisfactory for prolonged usage.
9.1.5 Economics of Electricity Generation
An open market for animal fat trade does not exist in the UK, therefore it is difficult to
assess the feasibility of electricity generation using it. The collaborative project described
in this thesis was a unique opportunity to access data regarding fat pricing. The
relationship linking animal fat prices and fossil fuels was presented – based on information
collected throughout a period of 12 months. In both analysed cases, a small research power
plant and a proposed large generating station, generation was not feasible without
additional subsidies in form of a ROC or RHI. The renewable electricity support system in
the UK has been described – currently animal fat can be used as a subsidy eligible source

157
of renewable electricity in power plants using internal combustion engines where installed
power exceeds 5 MW.
9.2 Suggestions for Future Work
9.2.1 Engine Modifications
It has been proven that fuel temperature has a critical impact on fat atomisation. However,
high temperatures may have a negative impact on the injector nozzles – therefore injectors
with nozzle cooling should be tested on the engine or the test rig to investigate the long
term effect of animal fat usage. An alternative spray system should be tested to investigate
spray penetration, cone angle etc. Ideally research should be conducted at facilities using
modern optical equipment – such as PDA.
The lubricating oil filtration system capacity should be increased to accommodate any
volume of fuel that passes to the sump. It may be interesting to investigate usage of bio
based lubricating oils for engines fuelled with animal fat or CPO.
158
9.2.2 Emissions Abatement
Additional research focusing on the nature of particulates formed during animal fat
combustion is required for better assessment of the benefits. The test engine should be
equipped with an SCR system – hence the effect of the composition of animal fat on the
catalyst longevity may be assessed. The high content of phosphorus may be challenging
here.
9.2.3 Animal Fat Quality
Acidity seems to be one of the parameters that should be targeted first if tallow is
considered as alternative fuel. A larger scale evaporator should be tested to investigate the
possible effect of high temperature exposure on other fat properties.
This thesis focused on pre heating as a way of viscosity reduction. Depending on local
circumstances – blending with light hydrocarbons may be a viable solution.
Due to variable and complex chemical composition, cetane number is not an appropriate
criterion for ignition quality assessment. A new index, possibly similar to CCAI, should be
developed.
159
The lubricity test presented in this thesis was based on conditions in line with the ISO
standard developed for automotive fuels and light marine fuels. The only parameter altered
was the fuel temperature. Further investigation should be conducted to verify whether
other test conditions such as stroke or load have an impact on the wear scar diameter.
Attempts to source syngas from animal fat were made within the Future Power Systems
Group. Up to 10% and 5% vol. of H2 and CO, respectively, were detected when 60ml/h of
tallow fuel was injected. As it has been reported in other studies, adding reformed
hydrogen syn-gas as a closed loop to a diesel engine would improve combustion efficiency
and therefore specific emissions (148). This reformed syn-gas has also been reported as
beneficial to other diesel after-treatment devices (149). Results of tests look promising
therefore investigation should be continued.

160
References
1. Snyder R. Greener Power for Europe. In Detail - Wartsila Technical Journal. 2008(01.2008):56-7. 2. OPSI. The UK Low Carbon Transition Plan - National strategy for climate and energy: Office of Public Sector Information; 2009. 3. OPSI. The UK Renewable Energy Strategy. Cm 7686 ed: Office of Public Sector Information; 2009. 4. O'Brien RD. Fats and oils: formulating and processing for applications. 3rd ed: CRC Press; 2009. 5. Moss GP, Smith PAS, Tavernier D. GLOSSARY OF CLASS NAMES OF ORGANIC-COMPOUNDS AND REACTIVE INTERMEDIATES BASED ON STRUCTURE. Pure and Applied Chemistry. 1995 Aug-Sep;67(8-9):1307-75. 6. Advice on the Economic and Environmental Impacts of Government Support for Biodiesel Production from Tallow: AEA Technology; 2008. 7. Gunstone F. Oils and Fats in the Food Industry: Wiley-Blackwell; 2008. 8. Tao BY. Industrial Applications for Plant Oils and Lipids. In: Shang-Tian Y, editor. Bioprocessing for Value-Added Products from Renewable Resources. Amsterdam: Elsevier; 2007. p. 611-27. 9. Laming A. Lascaux : paintings and engravings / Annette Laming ; translated from the French by Eleanore Frances Armstrong. Harmondsworth: Penguin; 1959. 10. Clark G. Prehistoric Europe : the economic basis. London: Methuen; 1952. 11. Bukowski Z, Dabrowski K. Swit Kultury Eurpoejskiej. Warszawa (Warsaw): Ludowa Spoldzielnia Wydawnicza; 1971. 12. Hitchcock D. Lascaux Cave - Grotte de Lascaux. 2011 [updated 09/02/2012]; Available from: http://www.donsmaps.com/lascaux.html. 13. Magnus O, Foote PG, Fisher P, Higgens H, Hakluyt Society. Historia de gentibus septentrionalibus, Romae 1555 = Description of the northern peoples, Rome 1555. translated by Peter Fisher and Humphrey Higgens ; edited by Peter Foote ; with annotation derived from the commentary by John Granlund. London: Hakluyt Society; 1996. 14. Magnus O, Foote PG, Granlund J, Hakluyt Society. Olaus Magnus : description of the northern peoples, Rome 1555. translated by Peter Fisher and Humphrey Higgens, edited by Peter Foote, with annotation derived from the commentary by John Granlund abridged and augmented. London: Hakluyt Society; 1998. 15. TallowLamp.In: http://www.eastlothianmuseums.org/exhibitions/tranent/mining/lamp1.htm, editor.: East Lothian Council Museums Service; 2012. 16. Tallow Candles. Burton on Trent: Springfields of Burton Ltd; 2012 [cited 2012 09/02/2012]; Available from: http://www.springfields.co.uk/tallow-candles-2-pack.html. 17. Supercooker. John Pointon & Sons Ltd.; 2009. 18. Haarslev. Fat Screw Presses, type HM - data sheet. Haarslev; 2011. 19. What are the animal by-product categories. Net Regs: Environment Agency; 2010. 20. OPSI. The Animal By-Product Regulations 2005: Office of Public Sector Information; 2005. 21. What is Rendering? : United Kingdom Renderers' Association; 2010; Available from: http://www.ukra.co.uk/index.php 22. BS. Technical tallow and animal grease. BS 3919:1987: British Standard; 1987.

161
23. Enviromental Permitting Guidance - The Waste Incineration Directive: Department for Environment, Food and Rural Affairs; 2010. 24. Permit BK0086IY: Environment Agency; 2006. 25. Quality Protocol - Biodiesel. The quality protocol for the production and use of biodiesel derived from waste cooking oil and rendered animal fat (quality biodiesel). Environment Agency 2008. 26. Clerk D. The Gas Petrol and Oil Engine. London, New York, Bombay, Calcutta: Longmans Green & Co.; 1913. 27. Baczewski K, Kaldonski T. Fuels for Compressed Ignition Engines (PL - Paliwa do Silnikow o Zaplonie Samoczynnym). Warsaw (Warszawa): Wydawnictwa Komunikacji i Lacznosci; 2004. 28. Ejim CE, Fleck BA, Amirfazli A. Analytical study for atomization of biodiesels and their blends in a typical injector: Surface tension and viscosity effects. Fuel. [doi: 10.1016/j.fuel.2006.11.006].86(10-11):1534-44. 29. Shu Q, Wang J, Peng B, Wang D, Wang G. Predicting the surface tension of biodiesel fuels by a mixture topological index method, at 313 K. Fuel. [doi: DOI: 10.1016/j.fuel.2008.07.007]. 2008;87(17-18):3586-90. 30. Morita A, Sugiyama G. Influence of Density and Viscosity of Diesel Fuel on Exhaust Emissions. [10.4271/2003-01-1869]. 2003. 31. Jimenez Espadafor F, Torres Garcia M, Becerra Villanueva J, Moreno Gutierrez J. The viability of pure vegetable oil as an alternative fuel for large ships. Transport Res D-Tr E. 2009 Oct;14(7):461-9. 32. Sidibé SS, Blin J, Vaitilingom G, Azoumah Y. Use of crude filtered vegetable oil as a fuel in diesel engines state of the art: Literature review. Renewable and Sustainable Energy Reviews. [doi: DOI: 10.1016/j.rser.2010.06.018]. 2010;14(9):2748-59. 33. Heywood JB. Internal combustion engine fundamentals: McGraw-Hill; 1988. 34. Tsolakis A, Megaritis A, Wyszynski ML, Theinnoi K. Engine performance and emissions of a diesel engine operating on diesel-RME (rapeseed methyl ester) blends with EGR (exhaust gas recirculation). Energy. 2007;32:2072-80. 35. Lee S-w, Tanaka D, Kusaka J, Daisho Y. Effects of diesel fuel characteristics on spray and combustion in a diesel engine. JSAE Review. [doi: 10.1016/S0389-4304(02)00221-7]. 2002;23(4):407-14. 36. Pandey RK, Rehman A, Sarviya RM. Impact of alternative fuel properties on fuel spray behavior and atomization. Renewable and Sustainable Energy Reviews. [doi: 10.1016/j.rser.2011.11.010]. 2012;16(3):1762-78. 37. BS. Automotive fuels - Diesel - Requirements and test methods. BS EN 590:2009+A1:20102010. 38. BS. Petroleum products - Total sediment in residual fuel oils. Part 1: Determination by hot filtration. BS ISO 10307-1:2009: British Standard; 2009. 39. Meat Technology - Information Sheet; Cutting edge technology for the meat processing industry. Sydney: Red Meat Innovation - Meat & Livestock Australia; 1997. 40. Guidelines for Fuels and Lubes Purchasing; Operation on Heavy Residual Fuels Copenhagen: MAN Diesel A/S; 2009. 41. Drews AW. Manual on Hydrocarbon Analysis (6th Edition): (MNL 3). ASTM International. 42. Gotfredsen H. Stationary Two-Stroke Low Speed Diesel Engines Running on Biofuel. Power Engineer - IDGTE Journal. 2010;15(1).

162
43. Kishore-Nadkarni RA. Guide to ASTM Test Methods for the Analysis of Petroleum Products and Lubricants. 2nd ed: ASTM; 2007. 44. Emission Control Two Stroke Low-Speed Diesel Engines. Copenhagen: MAN Diesel A/S; 2002. 45. Hellen G. A brief guide to controlling marine diesel exhaust emissions. Marine News [serial on the Internet]. 2005; 1. 46. Turns SR. An introduction to combustion : concepts and applications. 2nd ed. ed. Boston ; London: McGraw-Hill; 2000. 47. DECC. Combined Heat and Power Focus - Fuel Calorific Value. [18/06/2010]: Department of Energy and Climate Change 2010; Available from: http://chp.decc.gov.uk/cms/fuel-calorific-value. 48. ASTM. Standard Test Method for Flash Point by Tag Closed Cup Tester. D56-05. D56-052010. 49. Valencia FA, Armas IP. Ignition Quality of Residual Fuel Oils. Journal of Maritime Research. 2005;II(3):77-96. 50. Rakopoulos DC, Rakopoulos CD, Giakoumis EG, Dimaratos AM, Founti MA. Comparative environmental behavior of bus engine operating on blends of diesel fuel with four straight vegetable oils of Greek origin: Sunflower, cottonseed, corn and olive. Fuel. 2011;90(11):3439-46. 51. Machacon HTC, Shiga S, Karasawa T, Nakamura H. Performance and emission characteristics of a diesel engine fueled with coconut oil–diesel fuel blend. Biomass and Bioenergy. 2001;20(1):63-9. 52. Kumar AS, Kerihuel A, Bellettre J, Tazerout A. Experimental investigations on the use of preheated animal fat as fuel in a compression ignition engine. Renewable Energy. 2005;30(9):1443-56. 53. BS. Fuel oils for agricultural, domestic and industrial engines and boilers - Specification. BS 2869:2006: British Standards; 2006. 54. BS. Automotive fuels - Fatty acid methyl esters (FAME) for diesel engines - Requirements and test methods. BS EN 14214:2008+A1:20092010. 55. Karamitsos A. New Electronically Controlled 2-stroke Engines. . 3rd Iron Ore & Coal World Shipping Summit, Athens: Wartsila 2011. 56. Singh PJ, Khurma J, Singh A. Preparation, characterisation, engine performance and emission characteristics of coconut oil based hybrid fuels. Renewable Energy. 2010;35(9):2065-70. 57. Kalam MA, Husnawan M, Masjuki HH. Exhaust emission and combustion evaluation of coconut oil-powered indirect injection diesel engine. Renewable Energy. 2003;28(15):2405-15. 58. Pramanik K. Properties and use of jatropha curcas oil and diesel fuel blends in compression ignition engine. Renewable Energy. [doi: DOI: 10.1016/S0960-1481(02)00027-7]. 2003;28(2):239-48. 59. Soo-Young N. Inedible vegetable oils and their derivatives for alternative diesel fuels in CI engines: A review. Renewable and Sustainable Energy Reviews. 2011;15(1):131-49. 60. de Almeida SCA, Belchior CR, Nascimento MVG, Vieira LdSR, Fleury G. Performance of a diesel generator fuelled with palm oil. Fuel. [doi: DOI: 10.1016/S0016-2361(02)00155-2]. 2002;81(16):2097-102.
163
61. Leevijit T, Prateepchaikul G. Comparative performance and emissions of IDI-turbo automobile diesel engine operated using degummed, deacidified mixed crude palm oil-diesel blends. Fuel. [doi: DOI: 10.1016/j.fuel.2010.10.013].In Press, Corrected Proof. 62. Laza T, Bereczky Á. Basic fuel properties of rapeseed oil-higher alcohols blends. Fuel. 2011;90(2):803-10. 63. Canakci M, Ozsezen AN, Turkcan A. Combustion analysis of preheated crude sunflower oil in an IDI diesel engine. Biomass and Bioenergy. [doi: DOI: 10.1016/j.biombioe.2008.11.003]. 2009;33(5):760-7. 64. Basinger M, Reding T, Rodriguez-Sanchez FS, Lackner KS, Modi V. Durability testing modified compression ignition engines fueled with straight plant oil. Energy. [doi: DOI: 10.1016/j.energy.2010.04.004]. 2010;35(8):3204-20. 65. Pugazhvadivu M, Jeyachandran K. Investigations on the performance and exhaust emissions of a diesel engine using preheated waste frying oil as fuel. Renewable Energy. 2005;30(14):2189-202. 66. Takayuki M, Takaaki M. Diesel Engine Operation and Exhaust Emissions When Fueled with Animal Fats. SAE. [10.4271/2005-01-3673]. 2005;2005-01-3673. 67. Mormino I, Verhelst S, Sierens R, Stevens CV, De Meulenaer B. Using Vegetable Oils and Animal Fats in Diesel Engines: Chemical Analyses and Engine Tests. [10.4271/2009-01-0493]. 2009. 68. Kapusta LJ, Sundell J, Teodorczyk A. Liquid Biofuels - promising energy source for a small scale power plants. Combustion Engines. 2011;146(3/2011). 69. Juoperi K, Ollus R. Alternative fuels for medium-speed diesel engines. In Detail - Wartsila Technical Journal. 2008(01.2008):24-8. 70. Moraes MSA, Krause LC, da Cunha ME, Faccini CS, de Menezes EW, Veses RC, et al. Tallow Biodiesel: Properties Evaluation and Consumption Tests in a Diesel Engine. Energy Fuels. [doi: 10.1021/ef7006535]. 2008 2008/05/01;22(3):1949-54. 71. da Cunha ME, Krause LC, Moraes MSA, Faccini CS, Jacques RA, Almeida SR, et al. Beef tallow biodiesel produced in a pilot scale. Fuel Processing Technology. [doi: 10.1016/j.fuproc.2009.01.001]. 2009;90(4):570-5. 72. Mustafa C. The potential of restaurant waste lipids as biodiesel feedstocks. Bioresource Technology. [doi: 10.1016/j.biortech.2005.11.022]. 2007;98(1):183-90. 73. Bhatti HN, Hanif MA, Qasim M, Ata ur R. Biodiesel production from waste tallow. Fuel. [doi: DOI: 10.1016/j.fuel.2008.04.016]. 2008;87(13-14):2961-6. 74. Ma F, Clements LD, Hanna MA. Biodiesel Fuel from Animal Fat. Ancillary Studies on Transesterification of Beef Tallow†. Industrial & Engineering Chemistry Research. [doi: 10.1021/ie980162s]. 1998;37(9):3768-71. 75. Tashtoush GM, Al-Widyan MI, Al-Jarrah MM. Experimental study on evaluation and optimization of conversion of waste animal fat into biodiesel. Energy Conversion and Management. [doi: DOI: 10.1016/j.enconman.2003.12.009]. 2004;45(17):2697-711. 76. Canoira L, Rodríguez-Gamero M, Querol E, Alcántara Rn, Lapuerta Mn, Oliva Fn. Biodiesel from Low-Grade Animal Fat: Production Process Assessment and Biodiesel Properties Characterization. Industrial & Engineering Chemistry Research. [doi: 10.1021/ie8002045]. 2008;47(21):7997-8004. 77. Ngo HL, Zafiropoulos NA, Foglia TA, Samulski ET, Lin WB. Efficient two-step synthesis of biodiesel from greases. Energy Fuels. [Article]. 2008 Jan-Feb;22(1):626-34. 78. Zheng D, Hanna MA. Preparation and properties of methyl esters of beef tallow. Bioresource Technology. [doi: 10.1016/0960-8524(96)00062-4]. 1996;57(2):137-42.

164
79. Lebedevas S, Vaicekauskas A, Lebedeva G, Makareviciene V, Janulis P, Kazancev K. Use of Waste Fats of Animal and Vegetable Origin for the Production of Biodiesel Fuel: Quality, Motor Properties, and Emissions of Harmful Components. Energy Fuels. [doi: 10.1021/ef060145c]. 2006 2006/09/01;20(5):2274-80. 80. Kleinová A, Vailing I, Lábaj J, Mikulec J, Cvengros J. Vegetable oils and animal fats as alternative fuels for diesel engines with dual fuel operation. Fuel Processing Technology. [doi: 10.1016/j.fuproc.2011.05.018]. 2011;92(10):1980-6. 81. Kerihuel A, Kumar MS, Bellettre J, Tazerout M. Investigations on a CI Engine Using Animal Fat and Its Emulsions With Water and Methanol as Fuel. SAE. 2005;2005-01-1729. 82. Ladommatos N, Abdelhalim S, Zhao H. Control of oxides of nitrogen from diesel engines using diluents while minimising the impact on particulate pollutants. Applied Thermal Engineering. 1998;18(11):963-80. 83. Hountalas DT, Mavropoulos GC, Binder KB. Effect of exhaust gas recirculation (EGR) temperature for various EGR rates on heavy duty DI diesel engine performance and emissions. Energy. 2008;33(2):272-83. 84. EGR method reduces two-stroke NOx emissions by 70% - Copenhagen Test Centre Brings NOx to its Knees. Copenhagen: MAN Diesel A/S; 2007. 85. Iwasaki M, Shinjoh H. A comparative study of “standard”, “fast” and “NO2” SCR reactions over Fe/zeolite catalyst. Applied Catalysis A: General. 2010;390(1–2):71-7. 86. Twigg MV. Progress and future challenges in controlling automotive exhaust gas emissions. Applied Catalysis B: Environmental. 2007;70(1–4):2-15. 87. Project Guide. Copenhagen: MAN Diesel A/S; 2005. 88. Banot K. The use of water in the diesel fuel combustion zone to reduce of diesel engine NOx emission. Czasopismo Techniczne Mechanika 2004. 89. IMO. Air Pollution and Greenhouse Gas Emissions. International Maritime Organization; 2011 [cited 2011 12/08/2011]; Available from: http://www.imo.org/OurWork/Environment/PollutionPrevention/AirPollution/Pages/Default.aspx. 90. IMO. Special Areas under MARPOL. International Maritime Organization; 2011 [cited 2011 12/08/2011]; Available from: http://www.imo.org/OurWork/Environment/PollutionPrevention/SpecialAreasUnderMARPOL/Pages/Default.aspx. 91. Page TW. The propulsion of merchant ships: the case for LNG - the new era? IDGTE Journal. 2011;Publication 584. 92. OPSI. Fossil Fuel Levy Act 1998: Office of Public Sector Information 1998. 93. Mallon K. Renewable Energy Policy and Politics: A Handbook for decision-making: Earthscan Publications; 2005. 94. Moore C, Ihle J. Renewable energy policy outside the United States. Washington: Renewable Energy Policy Project1999. 95. Renewables Obligation: Guidance for generators over 50kW, (2009). 96. Evaluation of DTI Support for new and renewable energy under NFFO and the Supporting Programme. Final Report to the Department of Trade and Industry by Frontier Economics and Byrne O Cleirigh, (2001). 97. OPSI. The Renewables Obligation Order 2009: Office of Public Sector Information 2009. 98. NFPA. Average ROC prices. Non-fossil Fuel Purchase Agency 2010.
165
99. HMRC. Notice CCL1 – A general guide to Climate Change Levy: HM Revenue and Customs; 2009. 100. HMRC. CCL Info sheet 01/07: HM Revenue and Customs; 2007. 101. HMRC. CCL Info sheet 01/08: HM Revenue and Customs; 2008. 102. HMRC. CCL Info sheet 01/09: HM Revenue and Customs; 2009. 103. Seely A. Climate Change Levy: House of Commons Library; 2009. 104. HMSO. The climate change levy package. HM Treasury: Her Majesty's Stationery Office; 2006. 105. HMRC. Notice CCL1/4 – Electricity from renewable sources: HM Revenue and Customs; 2009. 106. HMRC. CCL info sheet 01/03 – Trading of CHP and Renewable Levy Exemption Certificates (LECs): HM Revenue and Customs; 2003. 107. HMRC. Notice CCL1/2 – Combined heat and power schemes: HM Revenue and Customs; 2009. 108. OPSI. The Renewables Obligation (Amendment) Order 2010: Office of Public Sector Information 2010. 109. DECC. Consultation on renewable electricity financial incentives 2009: Department of Energy and Climate Change; 2009. 110. DECC. Feed-in Tariffs – Government’s response to the summer 2009 consultation: Department of Energy and Climate Change 2010. 111. DEFRA/BERR. Renewable Heat Support Mechnisms: Department for Environment Food and Rural Affairs/Department for Business, Enterprise and Regulatory Reform; 2007. 112. DECC. Renewable Heat Incentive: Department of Energy and Climate Change; 2011. 113. CHPQA. CHPQA Guidance Note 10: Quality Asssurance for Combined Heat and Power; 2009. 114. BP. Brent Oil price history. 2011 [cited 2011 22/08/2011]; Available from: http://production.investis.com/bp2/download/brent_oil/. 115. BP. BP Statistical Review of World Energy June 2011. 2011; Available from: www.bp.com/statisticalreview. 116. Instruction Manual - Cylinder pressure transmitter Type 6613CA. Kistler Instrumente AG; 2005. 117. CBISS. Client Proposal - John Pointon & Sons Ltd. 2007. 118. PCME. Particulate monitoring systems - LMS1812006; (05/06). 119. Ruston-Paxman-Diesel. Ruston Instruction Manual - 6AR1 Vertical Diesel Engines. T546 ed. Lincoln: Ruston-Paxman-Diesel. 120. ASTM. Density, Relative Density (Specific Gravity), or API Gravity of Crude Petroleum and Liquid Petroleum Products by Hydrometer Method. D1298-992005. 121. Fainerman VB, Makievski AV, Miller R. The measurement of dynamic surface tensions of highly viscous liquids by the maximum bubble pressure method. Colloids and Surfaces A: Physicochemical and Engineering Aspects. [doi: DOI: 10.1016/0927-7757(93)80434-G]. 1993;75:229-35. 122. PCS-Instruments. 2011 [25/04/2011 ]; Available from: http://www.pcs-instruments.com/hfrr/specimens/hfrr-specimens.shtml. 123. Lacey PI, Mason RL. Fuel Lubricity: Statistical Analysis of Literature Data. SAE. [10.4271/2000-01-1917]. 2000;2000-01-1917. 124. ASTM. Evaluating Lubricity of Diesel Fuels by the High-Frequency
166
Reciprocating Rig (HFRR). D6079 - 112011. 125. Hoskuldsson A, editor. Statistical Process Control and QS9000. Publication No. 1103 ed: Technical University of Denmark; 2005. 126. Montgomery DC. Introduction to statistical quality control. 5th ed. ed. Chichester: John Wiley; 2005. 127. Bhosle BM, Subramanian R. New approaches in deacidification of edible oils - a review. J Food Eng. 2005 Aug;69(4):481-94. 128. Meher LC, Sagar DV, Naik SN. Technical aspects of biodiesel production by transesterification - a review. Renewable & Sustainable Energy Reviews. 2006 Jun;10(3):248-68. 129. Canakci M, Van Gerpen J. A pilot plant to produce biodiesel from high free fatty acid feedstocks. Transactions of the Asae. 2003 Jul-Aug;46(4):945-54. 130. Cmolik J, Pokorny J. Physical refining of edible oils. European Journal of Lipid Science and Technology. 2000 Jul;102(7):472-86. 131. Bari S, Lim TH, Yu CW. Effects of preheating of crude palm oil (CPO) on injection system, performance and emission of a diesel engine. Renewable Energy. [doi: DOI: 10.1016/S0960-1481(02)00010-1]. 2002;27(3):339-51. 132. Hossain AK, Davies PA. Plant oils as fuels for compression ignition engines: A technical review and life-cycle analysis. Renewable Energy. [doi: DOI: 10.1016/j.renene.2009.05.009]. 2010;35(1):1-13. 133. Operation on Heavy Residual Fuels - Guidelines for Fuels and Lubes. Copenhagen: MAN Diesel A/S; 2003. 134. Anastopoulos GL, E. Karonis, D. Kalligeros, S. Zannikos, F. Impact of oxygen and nitrogen compounds on the lubrication properties of low sulfur diesel fuels. Energy. [doi: 10.1016/j.energy.2004.04.026]. 2004;30(2-4):415-26. 135. Gomes HO, Rocha MI, da Silva RCF. Diesel Fuel Composition Effect on Lubricity. SAE. [10.4271/2003-01-3568]. 2003;2003-01-3568. 136. Knothe G. The Lubricity of Biodiesel. [10.4271/2005-01-3672]. 2005. 137. Geller DP, Goodrum JW. Effects of specific fatty acid methyl esters on diesel fuel lubricity. Fuel. [doi: 10.1016/j.fuel.2004.06.004]. 2004;83(17-18):2351-6. 138. Sulek MW, Kulczycki A, Malysa A. Assessment of lubricity of compositions of fuel oil with biocomponents derived from rape-seed. Wear. [doi: 10.1016/j.wear.2009.07.004]. 2010;268(1-2):104-8. 139. Xu Y, Wang Q, Hu X, Li C, Zhu X. Characterization of the lubricity of bio-oil/diesel fuel blends by high frequency reciprocating test rig. Energy. [doi: 10.1016/j.energy.2009.09.020]. 2010;35(1):283-7. 140. Knothe G, Steidley KR. Lubricity of components of biodiesel and petrodiesel. The origin of biodiesel lubricity. Energy Fuels. [Article]. 2005 May-Jun;19(3):1192-200. 141. Rice B, Froehlich A, Leonard R. BIO-DIESEL PRODUCTION FROM CAMELINA OIL,WASTE COOKING OIL AND TALLOW.1998: Available from: http://www.teagasc.ie/research/reports/crops/4355/eopr-4355.pdf. 142. Teoh PS. Tallow as Diesel Fuel. Birmingham: University of Birmingham; 2010. 143. Stone R. Introduction to Internal Combustion Engines. 3rd ed: Palgrave Macmillan; 1999. 144. Juoperi K. Lubricating oil quality – safe power plant operation depends on it. Energy News. (14):12-5. 145. Titan TXE Monograde Engine Oils - Product Information. Fuchs Lubricants (UK) Plc.; 2005.

167
146. Titan Marine Engine Oils - Product Information. Fuchs Lubricants (UK) Plc.; 2007. 147. Wyszynski ML, Williams B. KTP 6903 - Knowledge Partnership Final Report: University of Birmingham; John Pointon & Sons Ltd.2010. 148. Abu-Jrai A, Tsolakis A, Megaritis A. The influence of H-2 and CO on diesel engine combustion characteristics, exhaust gas emissions, and after treatment selective catalytic NOx reduction. International Journal of Hydrogen Energy. 2007;32:3565-71. 149. Sitshebo S, Tsolakis A, Theinnoi K. Promoting hydrocarbon-SCR of NOx in diesel engine exhaust by hydrogen and fuel reforming. International Journal of Hydrogen Energy. 2009;34(18):7842-50.