Embed Size (px)
Citation preview
Winter 2012-2013
Outlook for Colorado
Mike Baker
National Weather Service Boulder, Colorado October 28, 2012
Revised (Slides 34-36)
November 2012-January 2013
Temperature and Precipitation
Outlook for Colorado
Issued by the
Climate Prediction Center
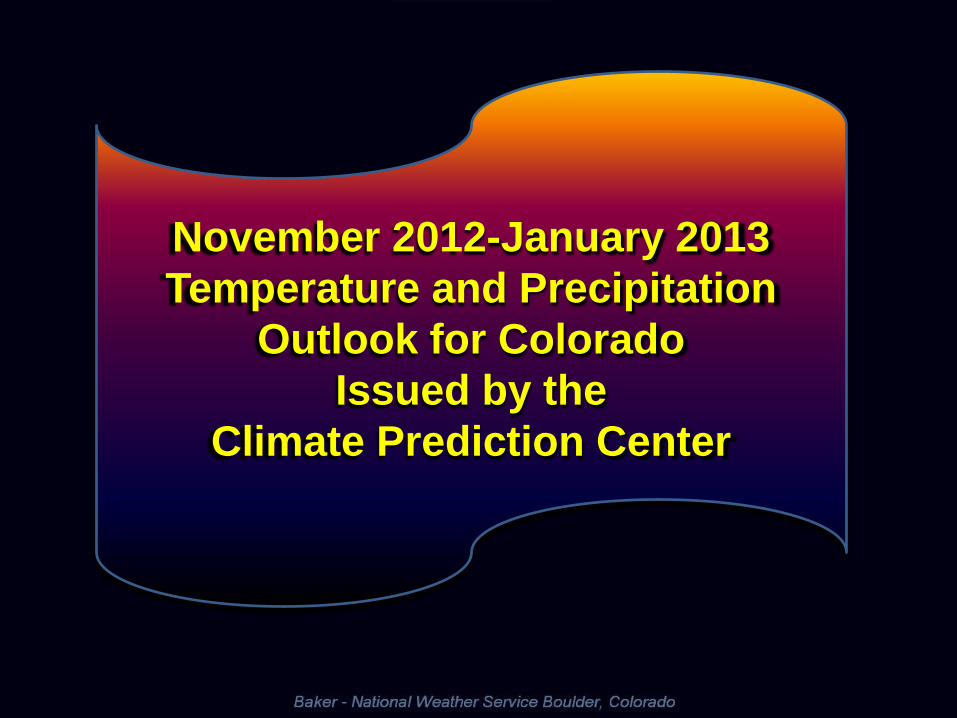
Climate Prediction Center Seasonal Outlooks
CPC outlooks do not predict the degree of warmness or coldness, or how wet or dry a
region will be; only their probability of occurrence.
Remember…
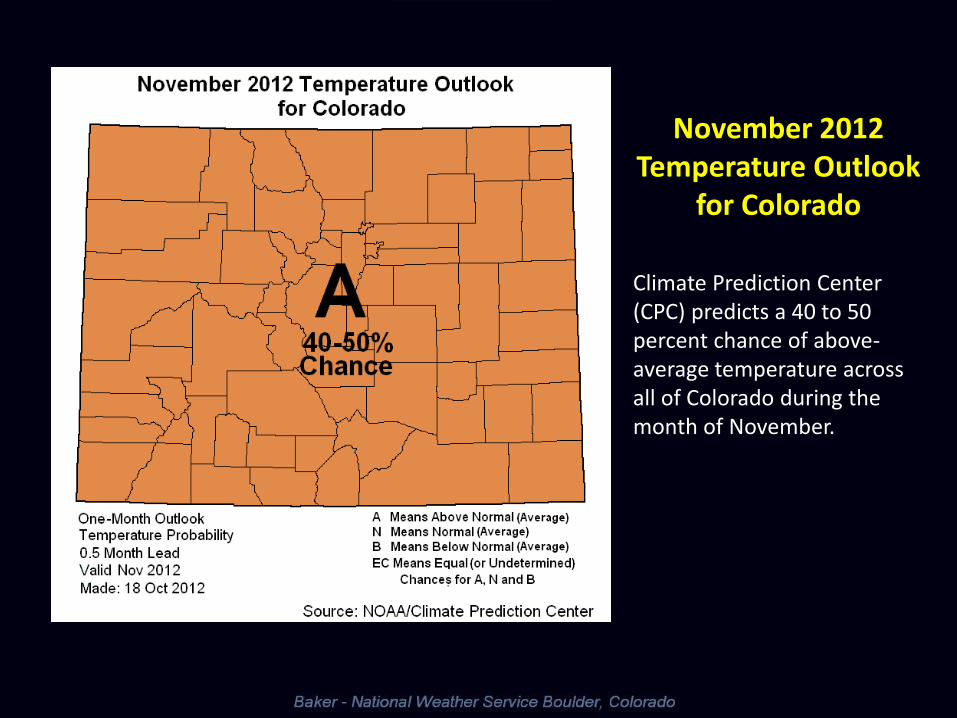
November 2012 Temperature Outlook
for Colorado
Climate Prediction Center (CPC) predicts a 40 to 50 percent chance of above- average temperature across all of Colorado during the month of November.
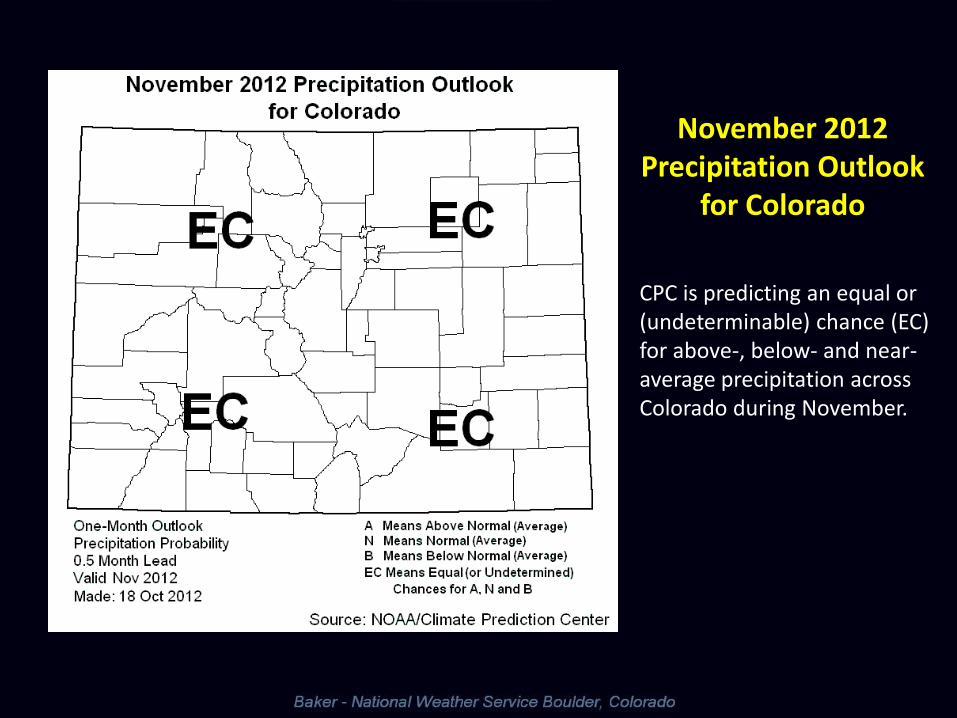
CPC is predicting an equal or (undeterminable) chance (EC) for above-, below- and near-average precipitation across Colorado during November.
November 2012 Precipitation Outlook
for Colorado
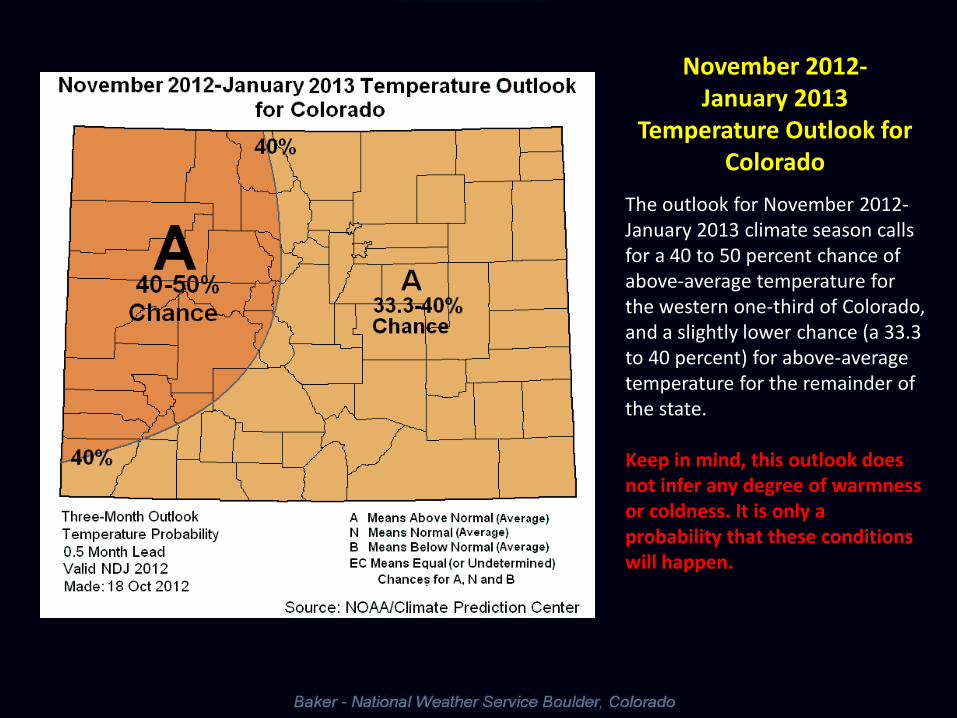
The outlook for November 2012-January 2013 climate season calls for a 40 to 50 percent chance of above-average temperature for the western one-third of Colorado, and a slightly lower chance (a 33.3 to 40 percent) for above-average temperature for the remainder of the state. Keep in mind, this outlook does not infer any degree of warmness or coldness. It is only a probability that these conditions will happen.
November 2012- January 2013
Temperature Outlook for Colorado
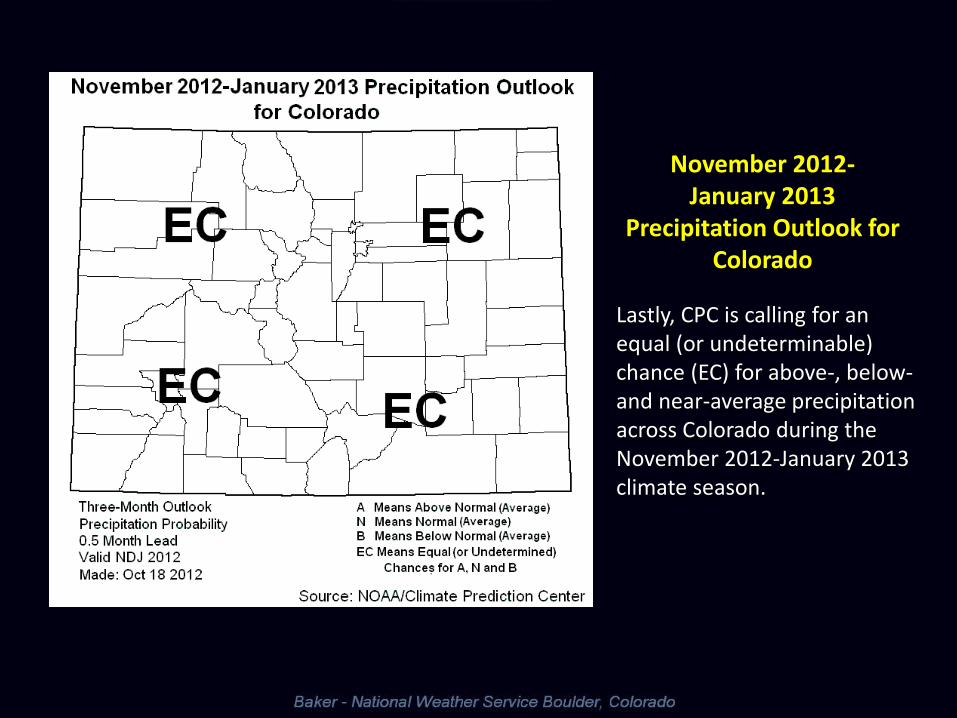
Lastly, CPC is calling for an equal (or undeterminable) chance (EC) for above-, below- and near-average precipitation across Colorado during the November 2012-January 2013 climate season.
November 2012- January 2013
Precipitation Outlook for Colorado
Recent 30- and 90-Day
Weather and Drought-Soil Moisture Conditions
Across Colorado
C O L O R A D O
Baker- National Weather Service Boulder, Colorado
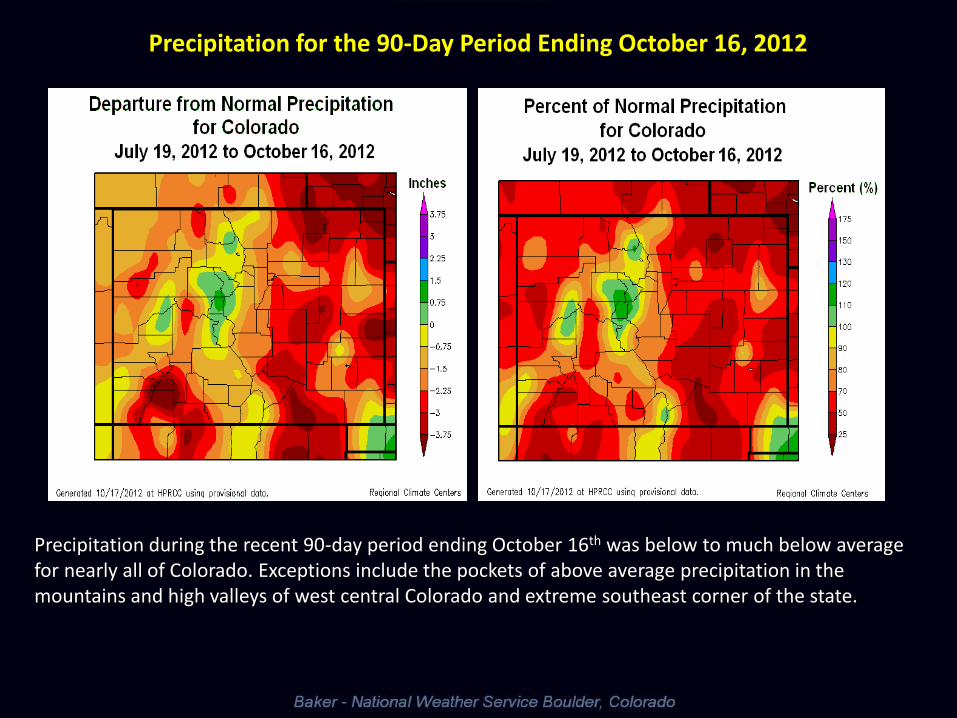
Precipitation during the recent 90-day period ending October 16th was below to much below average for nearly all of Colorado. Exceptions include the pockets of above average precipitation in the mountains and high valleys of west central Colorado and extreme southeast corner of the state.
Precipitation for the 90-Day Period Ending October 16, 2012
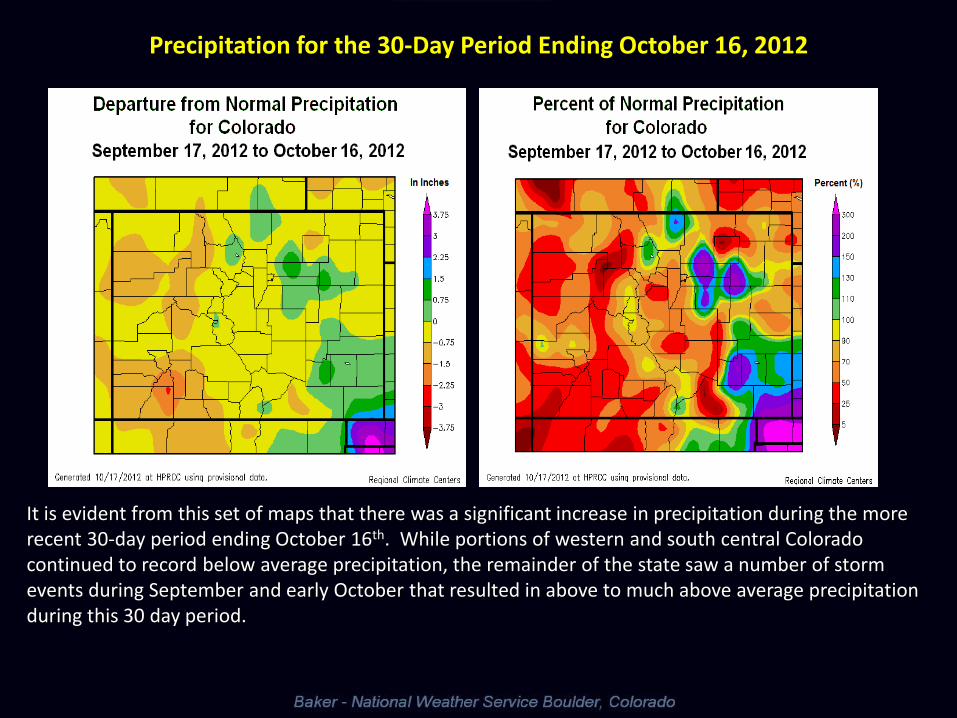
Precipitation for the 30-Day Period Ending October 16, 2012
It is evident from this set of maps that there was a significant increase in precipitation during the more recent 30-day period ending October 16th. While portions of western and south central Colorado continued to record below average precipitation, the remainder of the state saw a number of storm events during September and early October that resulted in above to much above average precipitation during this 30 day period.
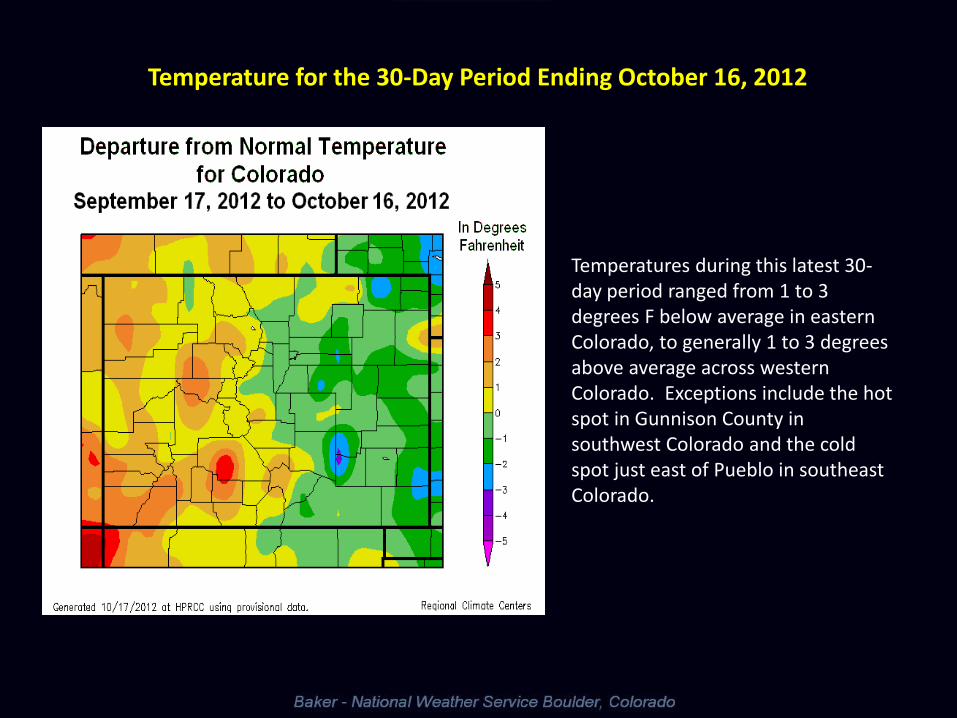
Temperatures during this latest 30-day period ranged from 1 to 3 degrees F below average in eastern Colorado, to generally 1 to 3 degrees above average across western Colorado. Exceptions include the hot spot in Gunnison County in southwest Colorado and the cold spot just east of Pueblo in southeast Colorado.
Temperature for the 30-Day Period Ending October 16, 2012
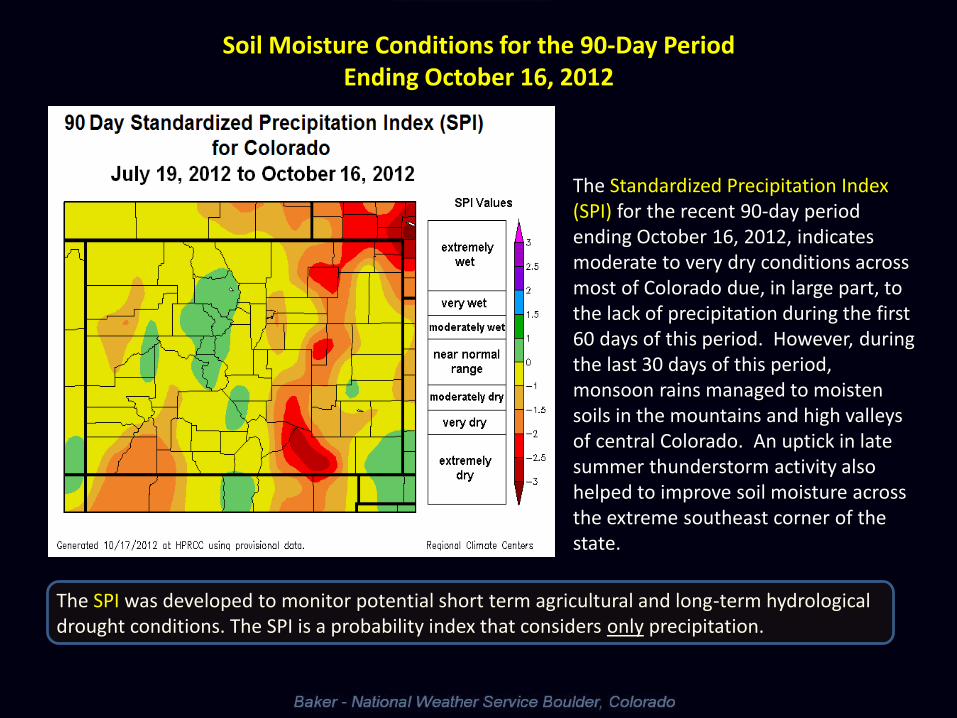
The Standardized Precipitation Index (SPI) for the recent 90-day period ending October 16, 2012, indicates moderate to very dry conditions across most of Colorado due, in large part, to the lack of precipitation during the first 60 days of this period. However, during the last 30 days of this period, monsoon rains managed to moisten soils in the mountains and high valleys of central Colorado. An uptick in late summer thunderstorm activity also helped to improve soil moisture across the extreme southeast corner of the state.
The SPI was developed to monitor potential short term agricultural and long-term hydrological drought conditions. The SPI is a probability index that considers only precipitation.
Soil Moisture Conditions for the 90-Day Period Ending October 16, 2012
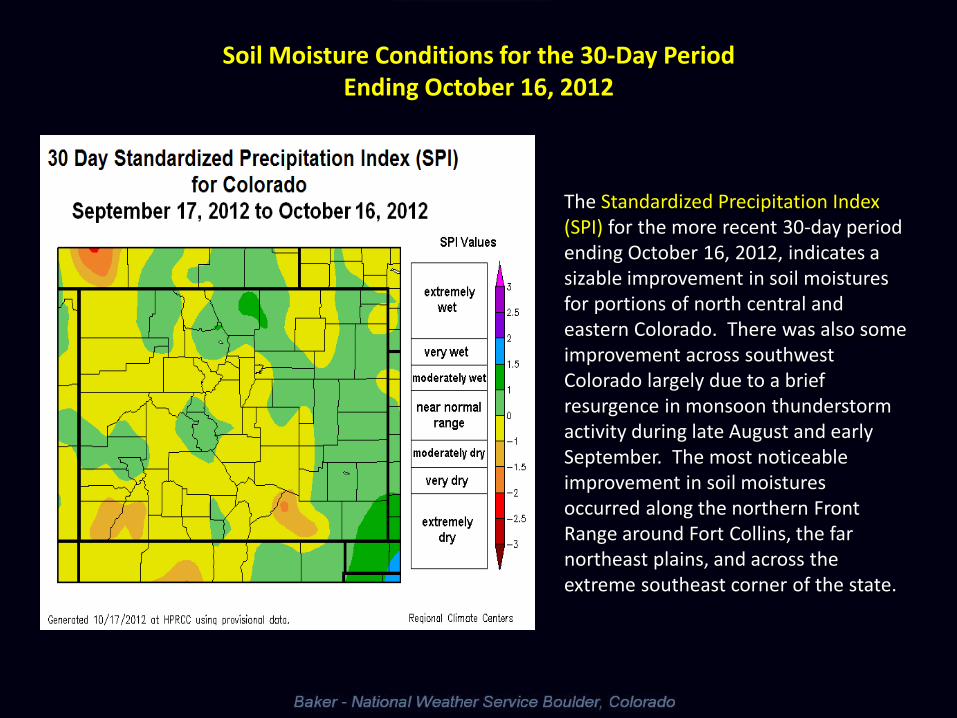
The Standardized Precipitation Index (SPI) for the more recent 30-day period ending October 16, 2012, indicates a sizable improvement in soil moistures for portions of north central and eastern Colorado. There was also some improvement across southwest Colorado largely due to a brief resurgence in monsoon thunderstorm activity during late August and early September. The most noticeable improvement in soil moistures occurred along the northern Front Range around Fort Collins, the far northeast plains, and across the extreme southeast corner of the state.
Soil Moisture Conditions for the 30-Day Period Ending October 16, 2012
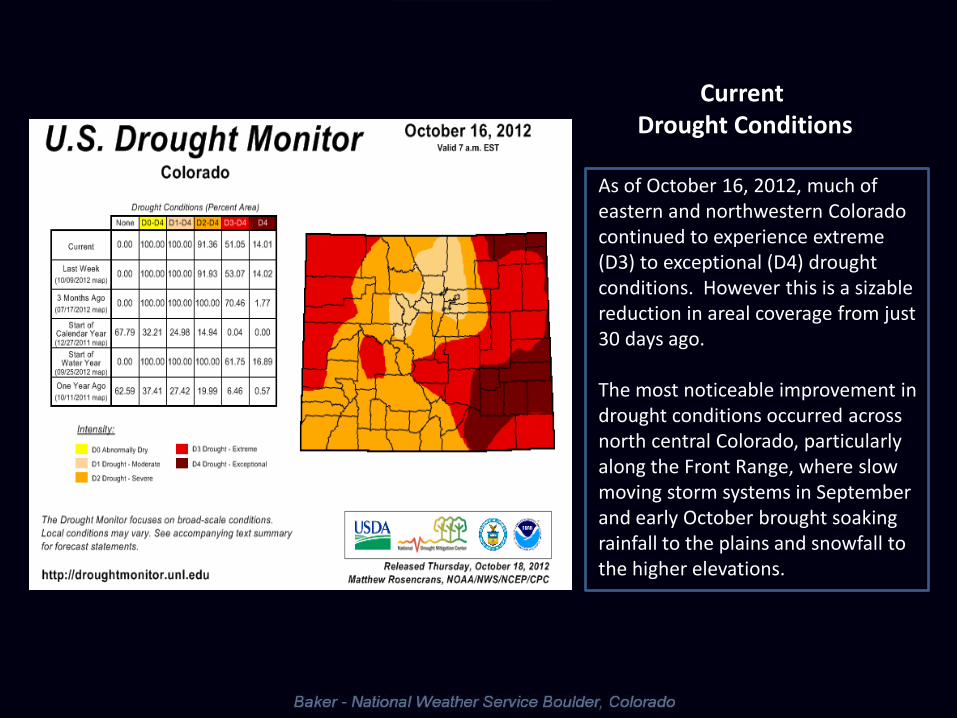
As of October 16, 2012, much of eastern and northwestern Colorado continued to experience extreme (D3) to exceptional (D4) drought conditions. However this is a sizable reduction in areal coverage from just 30 days ago. The most noticeable improvement in drought conditions occurred across north central Colorado, particularly along the Front Range, where slow moving storm systems in September and early October brought soaking rainfall to the plains and snowfall to the higher elevations.
Current Drought Conditions
Colorado
For an outlook for the entire U.S., go to www.cpc.ncep.noaa.gov/products/expert_assessment/season_drought.gif.
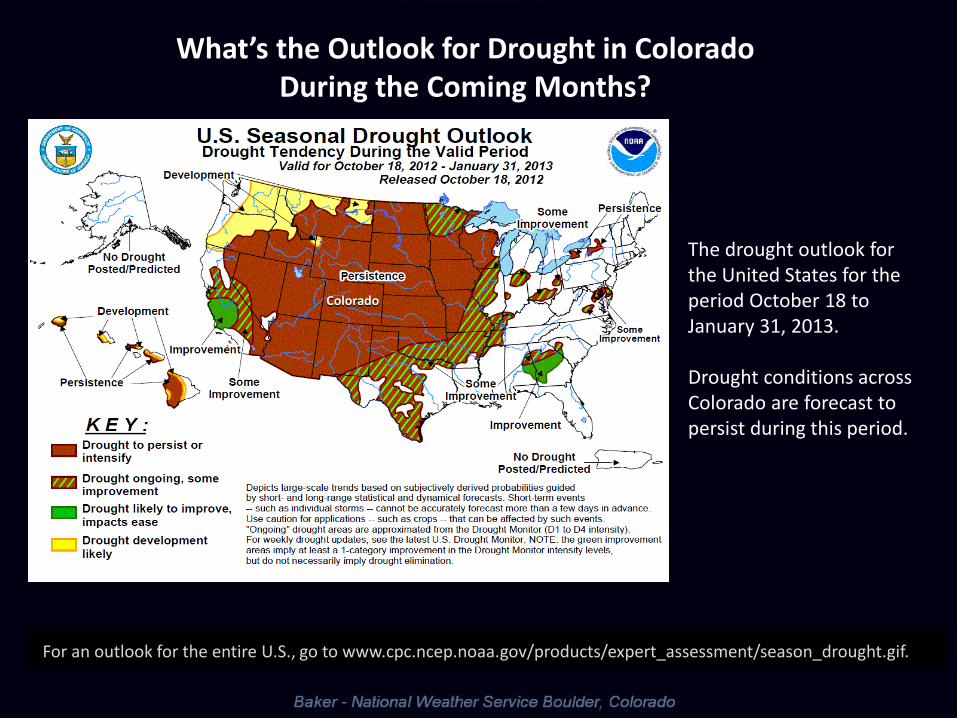
The drought outlook for the United States for the period October 18 to January 31, 2013. Drought conditions across Colorado are forecast to persist during this period.
What’s the Outlook for Drought in Colorado During the Coming Months?
Status of
El Niño/Southern Oscillation (ENSO)
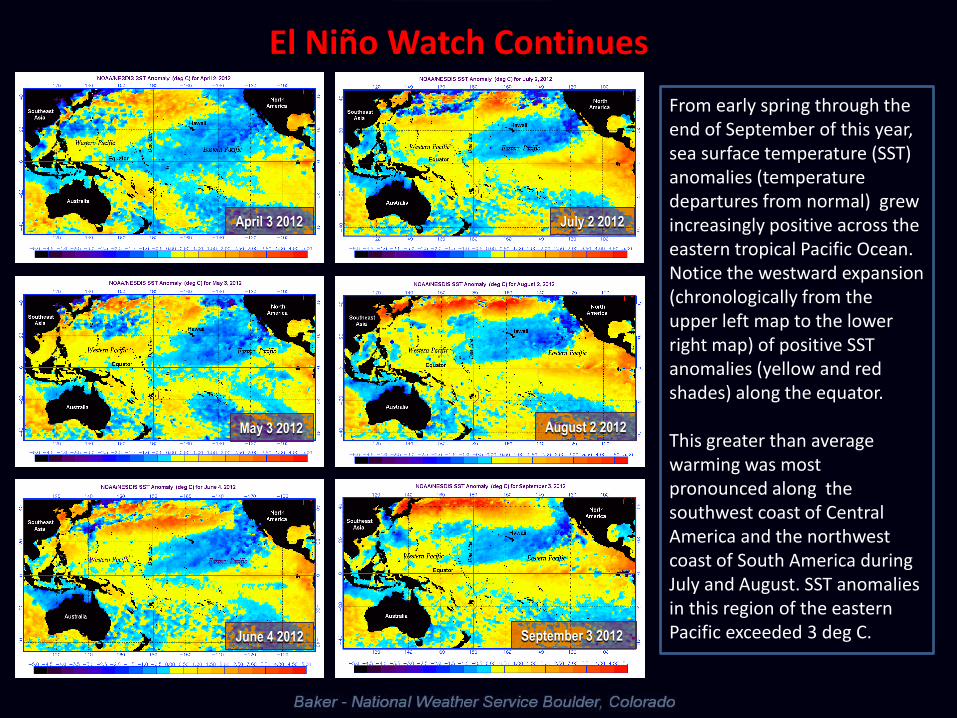
From early spring through the end of September of this year, sea surface temperature (SST) anomalies (temperature departures from normal) grew increasingly positive across the eastern tropical Pacific Ocean. Notice the westward expansion (chronologically from the upper left map to the lower right map) of positive SST anomalies (yellow and red shades) along the equator. This greater than average warming was most pronounced along the southwest coast of Central America and the northwest coast of South America during July and August. SST anomalies in this region of the eastern Pacific exceeded 3 deg C.
April 3 2012 July 2 2012
May 3 2012 August 2 2012
June 4 2012 September 3 2012
El Niño Watch Continues
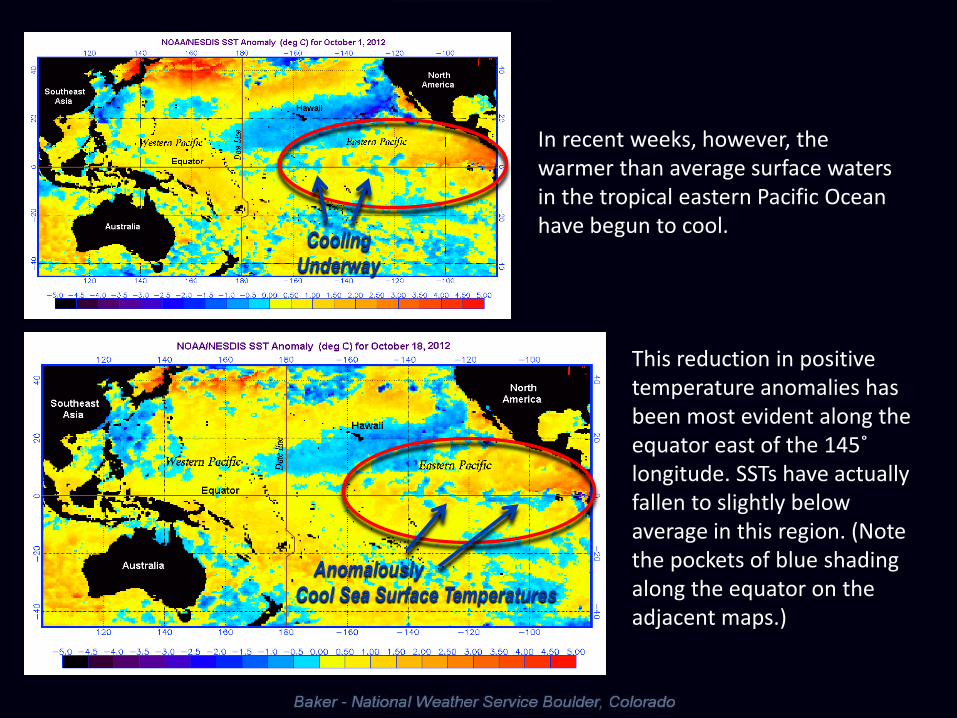
In recent weeks, however, the warmer than average surface waters in the tropical eastern Pacific Ocean have begun to cool.
Anomalously
Cool Sea Surface Temperatures
This reduction in positive temperature anomalies has been most evident along the equator east of the 145˚ longitude. SSTs have actually fallen to slightly below average in this region. (Note the pockets of blue shading along the equator on the adjacent maps.)
Cooling
Underway
1990 1991 1992 1993 1994 1995 1996 1997 1998 1999 2000 2001 2002 2003 2004 2005 2006 2007 2008 2009 2010 2011 2012
Positive (Warmer than Average) SST Anomalies Negative (Colder than Average) SST Anomalies
1997-98
Strong El Niño
1998-2001
Moderate to Strong
La Niña
2002-03
Moderate/Strong
El Niño
2007-08
Moderate/Strong
La Niña
2009-10
Moderate/Strong
El Niño
2010-11
Moderate/Strong
La Niña
2011-12
Weak/Moderate
La Niña
1994-95
Moderate El Niño
1991-92
Moderate/Strong
El Niño
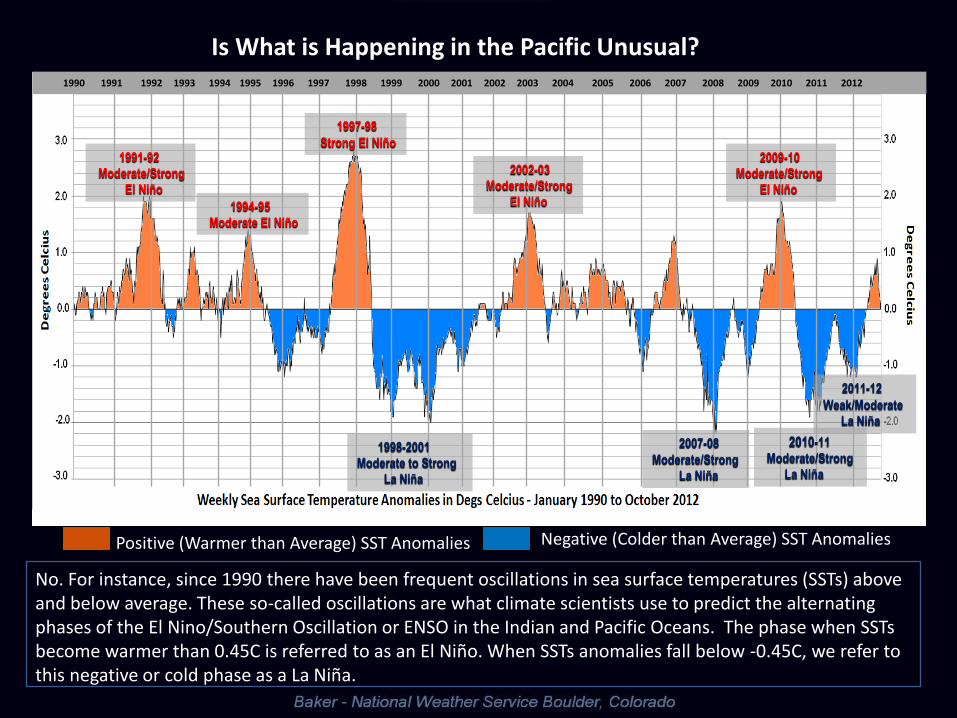
No. For instance, since 1990 there have been frequent oscillations in sea surface temperatures (SSTs) above and below average. These so-called oscillations are what climate scientists use to predict the alternating phases of the El Nino/Southern Oscillation or ENSO in the Indian and Pacific Oceans. The phase when SSTs become warmer than 0.45C is referred to as an El Niño. When SSTs anomalies fall below -0.45C, we refer to this negative or cold phase as a La Niña.
Is What is Happening in the Pacific Unusual?
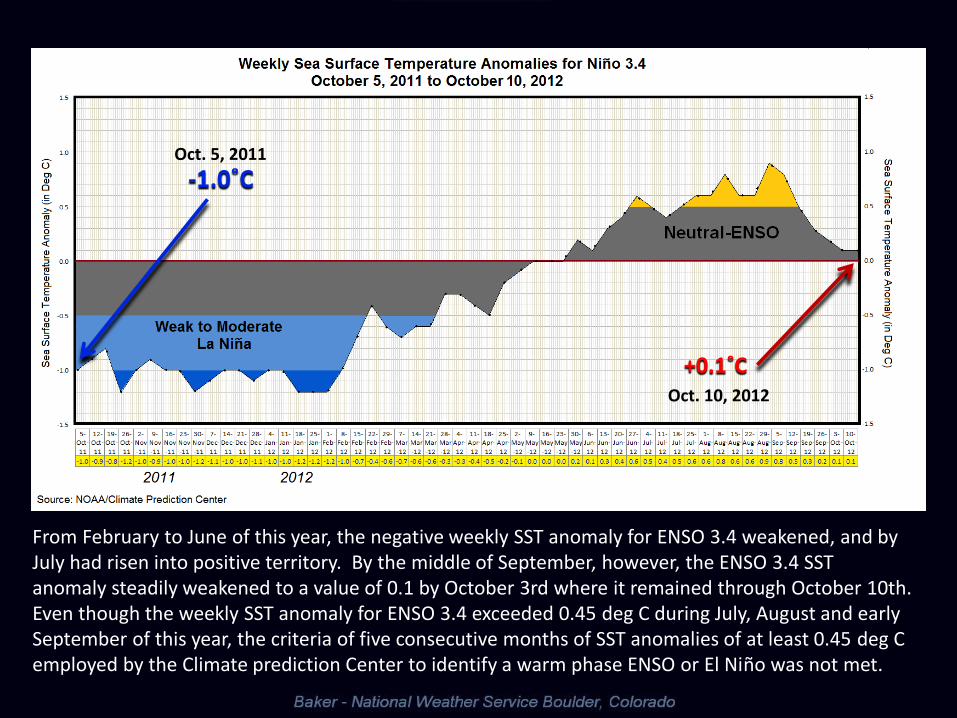
From February to June of this year, the negative weekly SST anomaly for ENSO 3.4 weakened, and by July had risen into positive territory. By the middle of September, however, the ENSO 3.4 SST anomaly steadily weakened to a value of 0.1 by October 3rd where it remained through October 10th. Even though the weekly SST anomaly for ENSO 3.4 exceeded 0.45 deg C during July, August and early September of this year, the criteria of five consecutive months of SST anomalies of at least 0.45 deg C employed by the Climate prediction Center to identify a warm phase ENSO or El Niño was not met.
-1.0˚C
+0.1˚C Oct. 10, 2012
Oct. 5, 2011
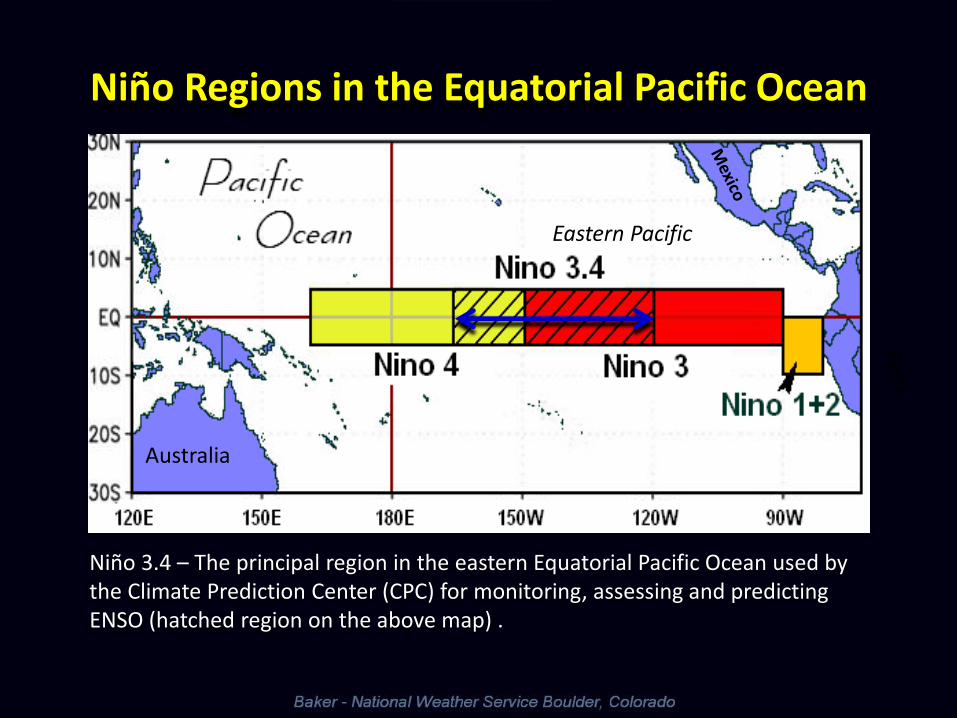
Niño Regions in the Equatorial Pacific Ocean
Niño 3.4 – The principal region in the eastern Equatorial Pacific Ocean used by the Climate Prediction Center (CPC) for monitoring, assessing and predicting ENSO (hatched region on the above map) .
Australia
Eastern Pacific
2000 -1.7 -1.5 -1.1 -0.9 -0.8 -0.7 -0.6 -0.5 -0.5 -0.6 -0.8 -0.8
2001 -0.7 -0.6 -0.5 -0.3 -0.2 -0.1 0.0 0.0 -0.1 -0.2 -0.2 -0.3
2002 -0.2 0.0 0.1 0.3 0.5 0.7 0.8 0.8 0.9 1.2 1.3 1.3
2003 1.1 0.8 0.4 0.0 -0.2 -0.1 0.2 0.4 0.4 0.4 0.4 0.3
2004 0.3 0.2 0.1 0.1 0.1 0.3 0.5 0.7 0.7 0.7 0.7 0.7
2005 0.6 0.4 0.3 0.3 0.3 0.3 0.2 0.1 0.0 -0.2 -0.5 -0.8
2006 -0.9 -0.7 -0.5 -0.3 0.0 0.1 0.2 0.3 0.5 0.8 1.0 1.0
2007 0.7 0.3 -0.1 -0.2 -0.3 -0.3 -0.3 -0.6 -0.9 -1.1 -1.2 -1.4
2008 -1.5 -1.5 -1.2 -0.9 -0.7 -0.5 -0.3 -0.2 -0.1 -0.2 -0.4 -0.7
2009 -0.9 -0.8 -0.6 -0.2 0.1 0.4 0.5 0.6 0.7 1.0 1.4 1.6
2010 1.6 1.4 1.1 0.7 0.2 -0.3 -0.8 -1.2 -1.4 -1.5 -1.5 -1.5
2011 -1.4 -1.3 -1.0 -0.7 -0.4 -0.2 -0.2 -0.3 -0.6 -0.8 -1.0 -1.0
2012 -0.9 -0.7 -0.5 -0.3 -0.1 0.0 0.1 0.3
Year DJF JFM FMA MAM AMJ MJJ JJA JAS ASO SON OND NDJ
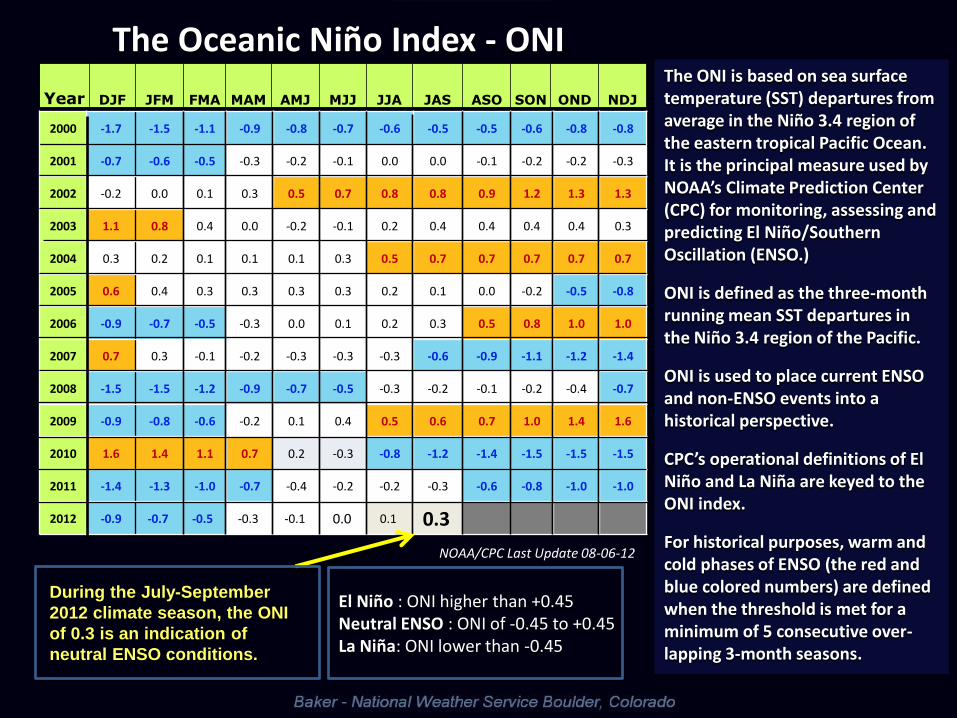
The Oceanic Niño Index - ONI The ONI is based on sea surface temperature (SST) departures from average in the Niño 3.4 region of the eastern tropical Pacific Ocean. It is the principal measure used by NOAA’s Climate Prediction Center (CPC) for monitoring, assessing and predicting El Niño/Southern Oscillation (ENSO.)
ONI is defined as the three-month running mean SST departures in the Niño 3.4 region of the Pacific.
ONI is used to place current ENSO and non-ENSO events into a historical perspective.
CPC’s operational definitions of El Niño and La Niña are keyed to the ONI index.
For historical purposes, warm and cold phases of ENSO (the red and blue colored numbers) are defined when the threshold is met for a minimum of 5 consecutive over-lapping 3-month seasons.
During the July-September
2012 climate season, the ONI
of 0.3 is an indication of
neutral ENSO conditions.
El Niño : ONI higher than +0.45 Neutral ENSO : ONI of -0.45 to +0.45 La Niña: ONI lower than -0.45
NOAA/CPC Last Update 08-06-12
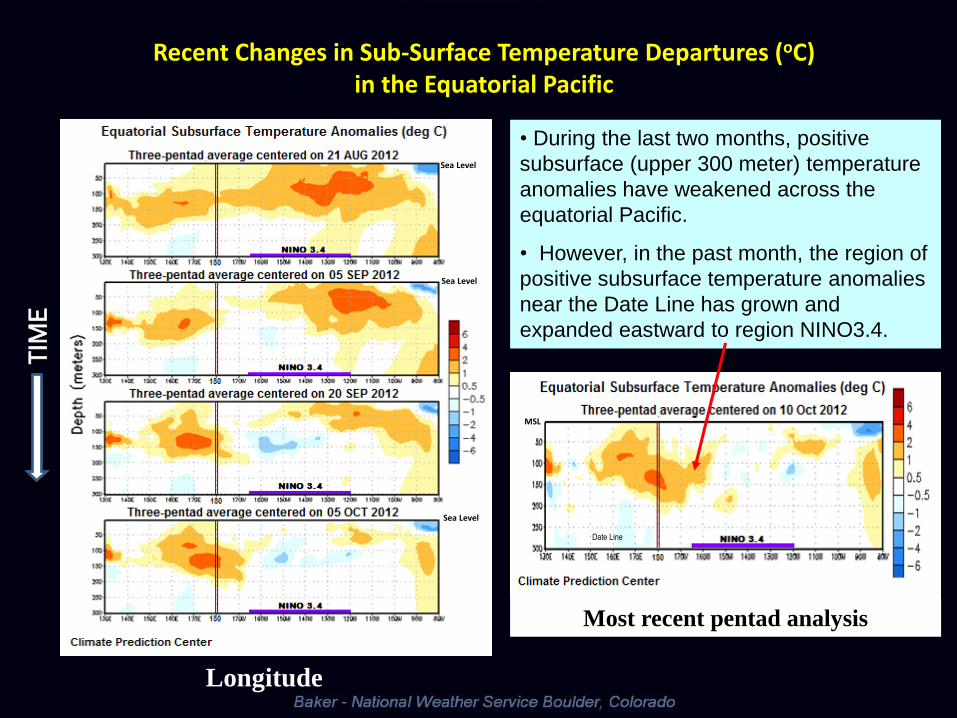
• During the last two months, positive
subsurface (upper 300 meter) temperature
anomalies have weakened across the
equatorial Pacific.
• However, in the past month, the region of
positive subsurface temperature anomalies
near the Date Line has grown and
expanded eastward to region NINO3.4.
Recent Changes in Sub-Surface Temperature Departures (oC) in the Equatorial Pacific
Most recent pentad analysis
Longitude
TIM
E
Date Line
Sea Level
Sea Level
Sea Level
MSL
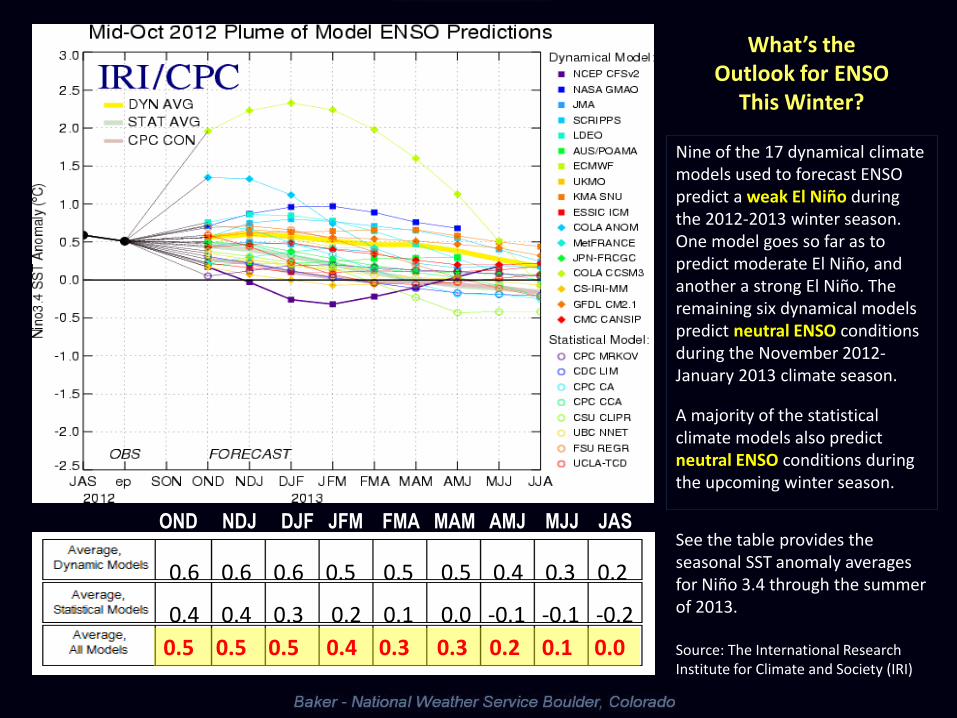
0.6 0.6 0.6 0.5 0.5 0.5 0.4 0.3 0.2 0.4 0.4 0.3 0.2 0.1 0.0 -0.1 -0.1 -0.2
0.5 0.5 0.5 0.4 0.3 0.3 0.2 0.1 0.0
Nine of the 17 dynamical climate models used to forecast ENSO predict a weak El Niño during the 2012-2013 winter season. One model goes so far as to predict moderate El Niño, and another a strong El Niño. The remaining six dynamical models predict neutral ENSO conditions during the November 2012-January 2013 climate season.
A majority of the statistical climate models also predict neutral ENSO conditions during the upcoming winter season.
See the table provides the seasonal SST anomaly averages for Niño 3.4 through the summer of 2013. Source: The International Research Institute for Climate and Society (IRI)
What’s the Outlook for ENSO
This Winter?
OND NDJ DJF JFM FMA MAM AMJ MJJ JAS
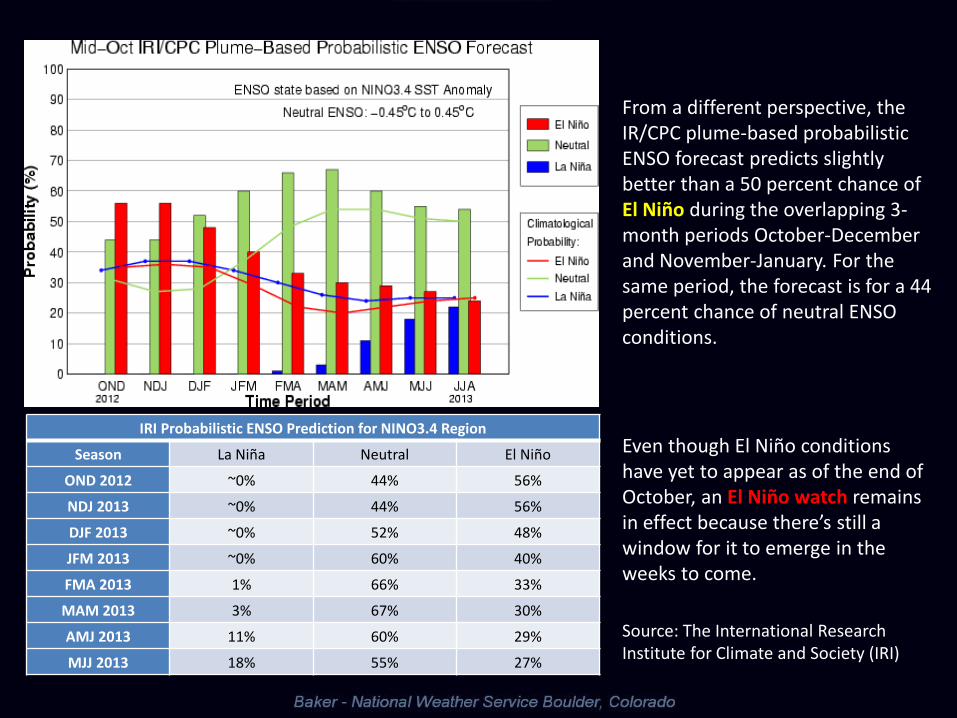
IRI Probabilistic ENSO Prediction for NINO3.4 Region
Season La Niña Neutral El Niño
OND 2012 ~0% 44% 56%
NDJ 2013 ~0% 44% 56%
DJF 2013 ~0% 52% 48%
JFM 2013 ~0% 60% 40%
FMA 2013 1% 66% 33%
MAM 2013 3% 67% 30%
AMJ 2013 11% 60% 29%
MJJ 2013 18% 55% 27%
From a different perspective, the IR/CPC plume-based probabilistic ENSO forecast predicts slightly better than a 50 percent chance of El Niño during the overlapping 3-month periods October-December and November-January. For the same period, the forecast is for a 44 percent chance of neutral ENSO conditions.
Even though El Niño conditions have yet to appear as of the end of October, an El Niño watch remains in effect because there’s still a window for it to emerge in the weeks to come.
Source: The International Research Institute for Climate and Society (IRI)
Colorado Winter Weather
Patterns Commonly Associated
ENSO and Non-ENSO Conditions
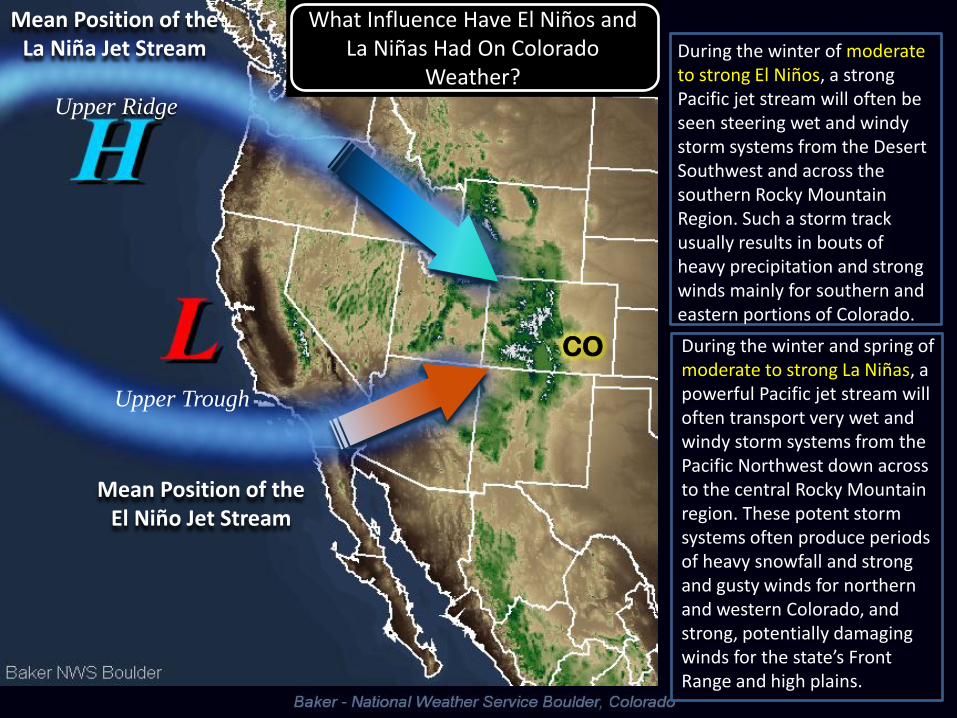
Mean Position of the La Niña Jet Stream
Mean Position of the El Niño Jet Stream
Upper Ridge
Upper Trough
CO
During the winter of moderate to strong El Niños, a strong Pacific jet stream will often be seen steering wet and windy storm systems from the Desert Southwest and across the southern Rocky Mountain Region. Such a storm track usually results in bouts of heavy precipitation and strong winds mainly for southern and eastern portions of Colorado.
During the winter and spring of moderate to strong La Niñas, a powerful Pacific jet stream will often transport very wet and windy storm systems from the Pacific Northwest down across to the central Rocky Mountain region. These potent storm systems often produce periods of heavy snowfall and strong and gusty winds for northern and western Colorado, and strong, potentially damaging winds for the state’s Front Range and high plains.
What Influence Have El Niños and La Niñas Had On Colorado
Weather?
Winter Season Temperature and
Precipitation Distributions
Observed Across Colorado
During Moderate to Strong
La Niñas and El Niños
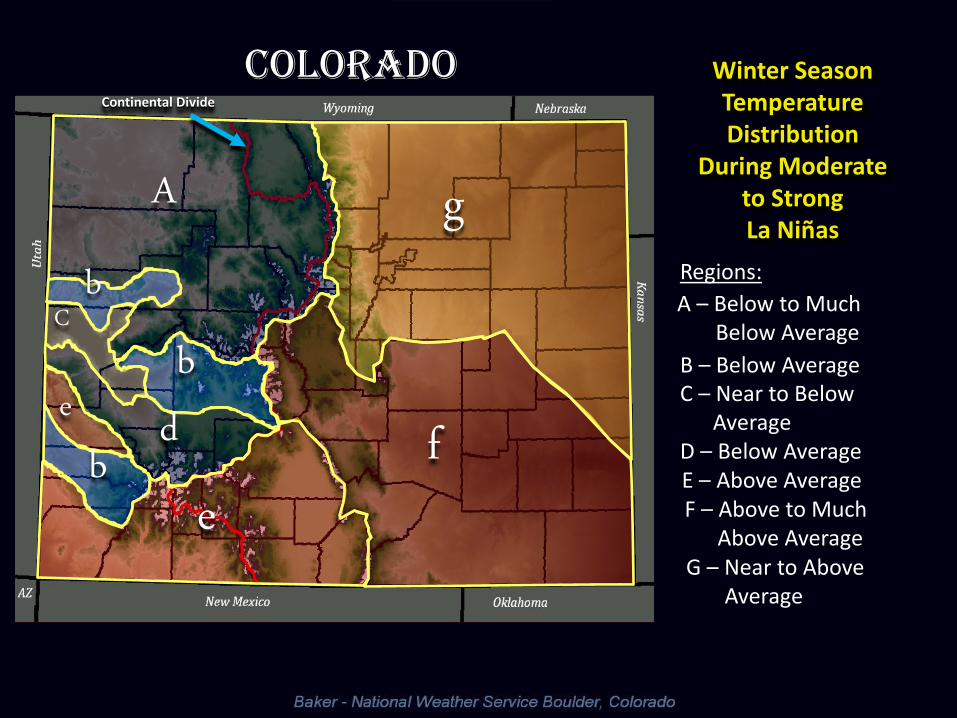
Winter Season Temperature Distribution
During Moderate to Strong La Niñas
A
b b
C
d b
e f
g Regions:
A – Below to Much Below Average
B – Below Average C – Near to Below Average D – Below Average E – Above Average F – Above to Much Above Average G – Near to Above Average
Colorado Continental Divide
e
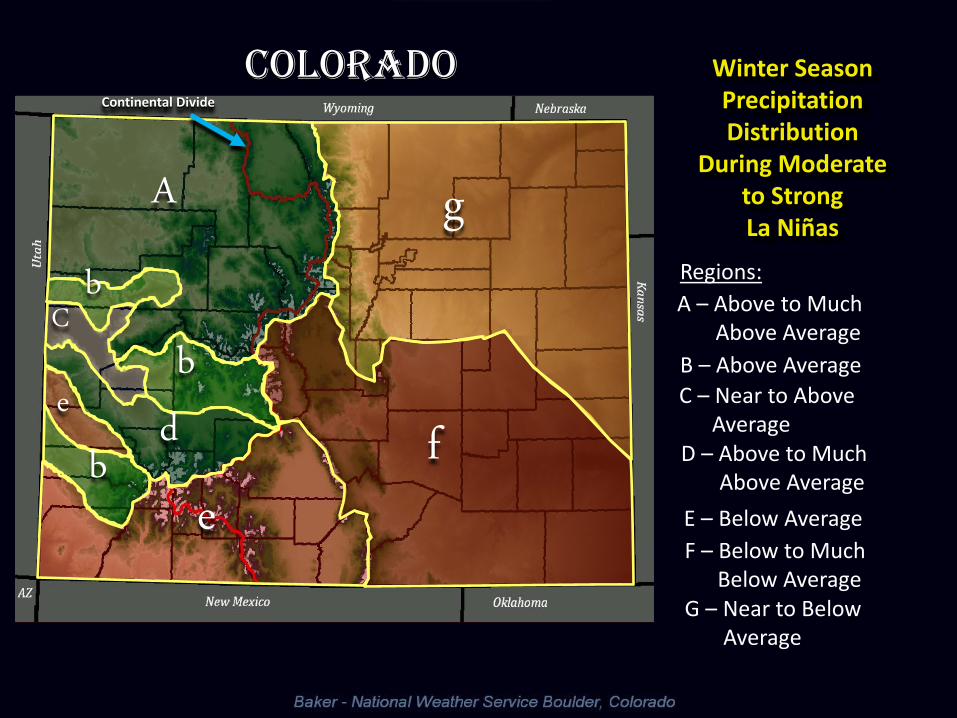
Winter Season Precipitation Distribution
During Moderate to Strong La Niñas
A
b b
C
d b
e f
g Regions:
A – Above to Much Above Average
B – Above Average
C – Near to Above Average D – Above to Much Above Average
E – Below Average
F – Below to Much Below Average G – Near to Below Average
Colorado Continental Divide
e
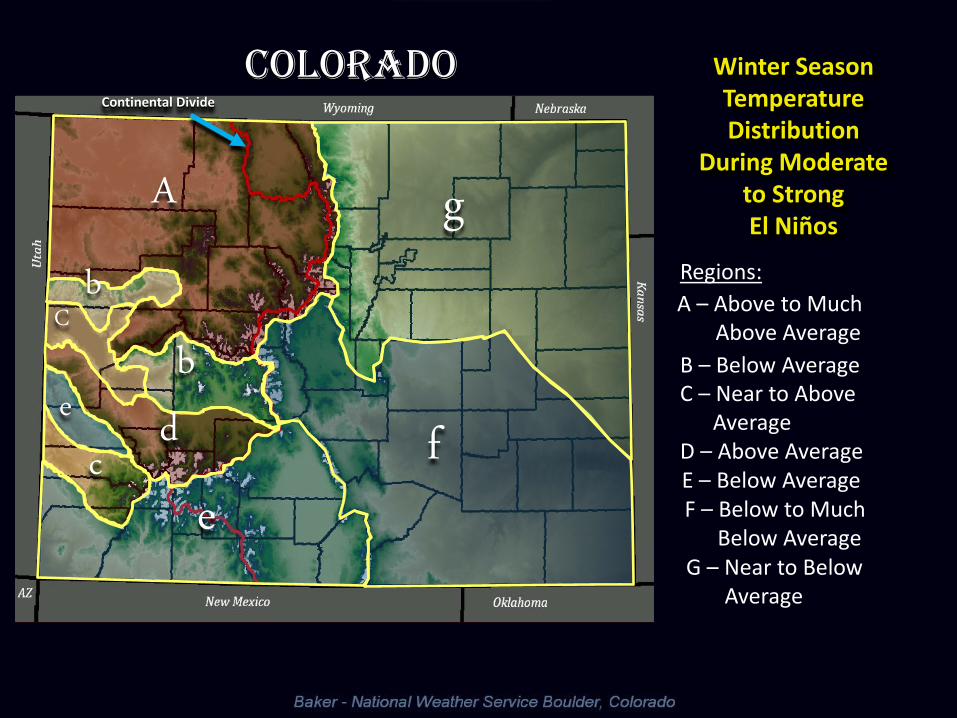
Winter Season Temperature Distribution
During Moderate to Strong El Niños
A
b b
C
d c
e f
g Regions:
A – Above to Much Above Average
B – Below Average C – Near to Above Average D – Above Average E – Below Average F – Below to Much Below Average G – Near to Below Average
Colorado Continental Divide
e
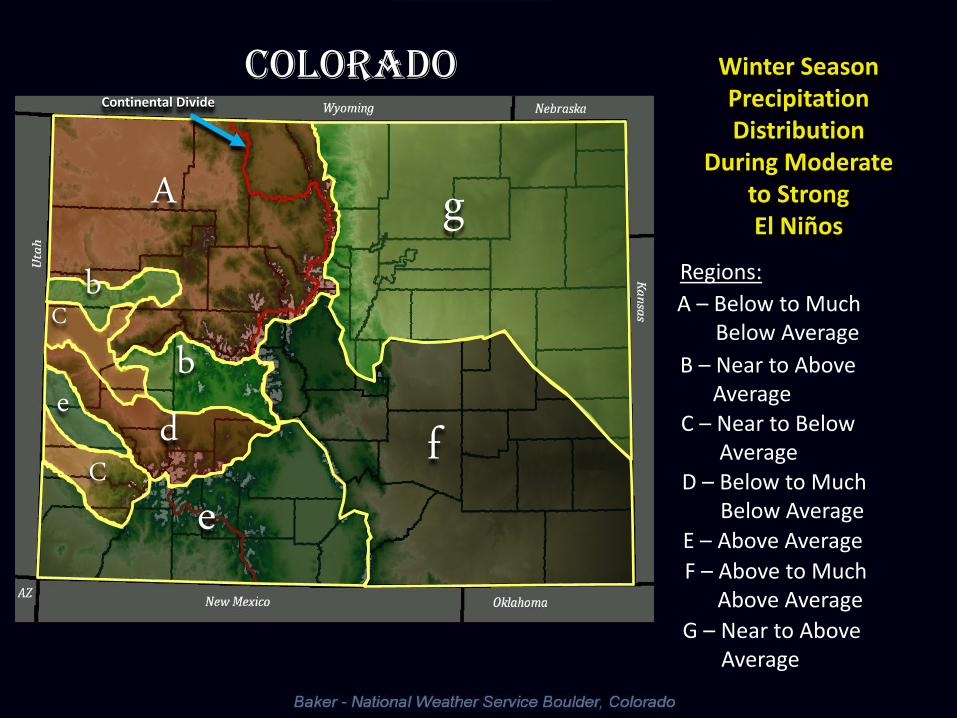
Winter Season Precipitation Distribution
During Moderate to Strong El Niños
A
b b
C
d C
e f
g Regions:
A – Below to Much Below Average
B – Near to Above Average C – Near to Below Average D – Below to Much Below Average
E – Above Average
F – Above to Much Above Average
G – Near to Above Average
Colorado Continental Divide
e
CO
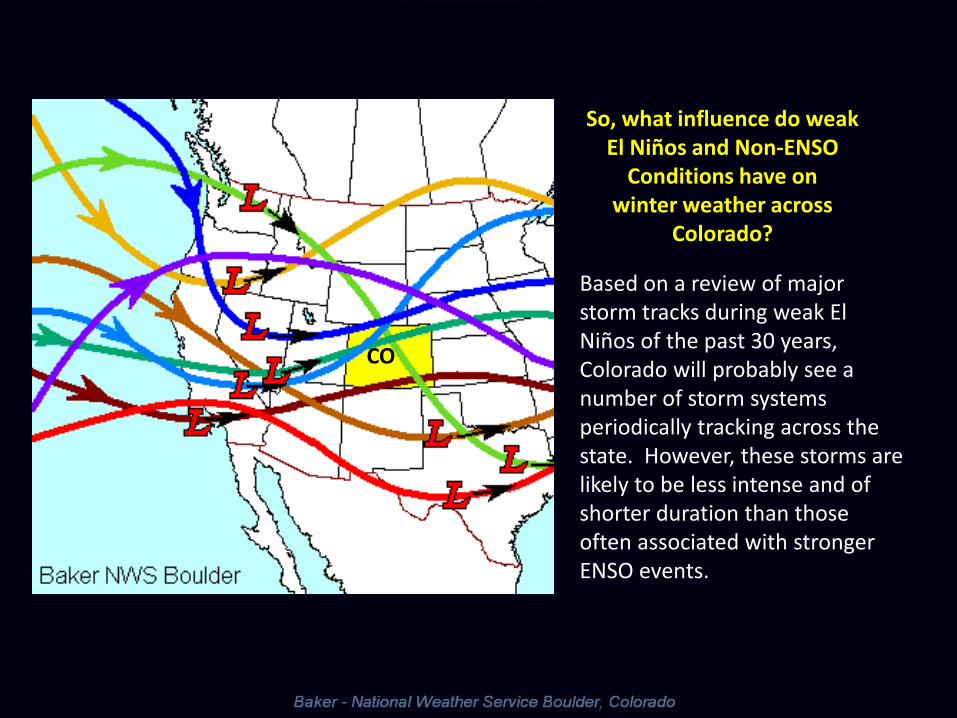
Based on a review of major storm tracks during weak El Niños of the past 30 years, Colorado will probably see a number of storm systems periodically tracking across the state. However, these storms are likely to be less intense and of shorter duration than those often associated with stronger ENSO events.
So, what influence do weak El Niños and Non-ENSO
Conditions have on winter weather across
Colorado?
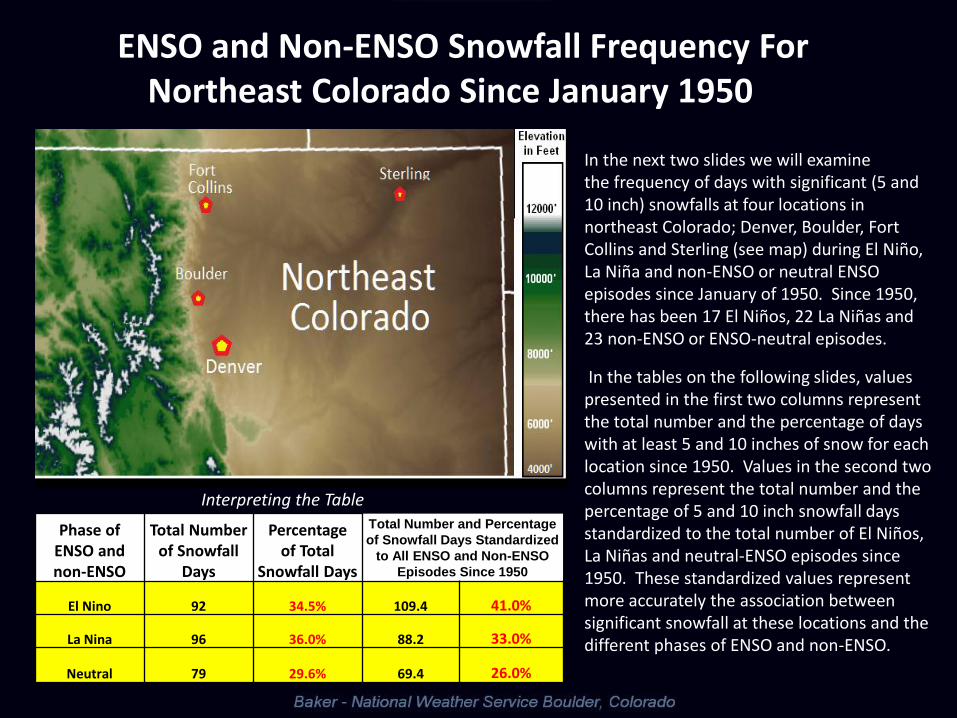
ENSO and Non-ENSO Snowfall Frequency For Northeast Colorado Since January 1950
In the next two slides we will examine the frequency of days with significant (5 and 10 inch) snowfalls at four locations in northeast Colorado; Denver, Boulder, Fort Collins and Sterling (see map) during El Niño, La Niña and non-ENSO or neutral ENSO episodes since January of 1950. Since 1950, there has been 17 El Niños, 22 La Niñas and 23 non-ENSO or ENSO-neutral episodes.
In the tables on the following slides, values presented in the first two columns represent the total number and the percentage of days with at least 5 and 10 inches of snow for each location since 1950. Values in the second two columns represent the total number and the percentage of 5 and 10 inch snowfall days standardized to the total number of El Niños, La Niñas and neutral-ENSO episodes since 1950. These standardized values represent more accurately the association between significant snowfall at these locations and the different phases of ENSO and non-ENSO.
Phase of ENSO and non-ENSO
Total Number of Snowfall
Days
Percentage of Total
Snowfall Days
Total Number and Percentage
of Snowfall Days Standardized
to All ENSO and Non-ENSO
Episodes Since 1950
El Nino 92 34.5% 109.4 41.0%
La Nina 96 36.0% 88.2 33.0%
Neutral 79 29.6% 69.4 26.0%
Interpreting the Table
Standardized
Values
El Nino 33 26.2% 40.3 32.0%
La Nina 42 33.3% 39.7 31.5%
Neutral 51 40.5% 46 36.5%
Denver
Denver
Days With Snowfall of at Least 5.0 Inches
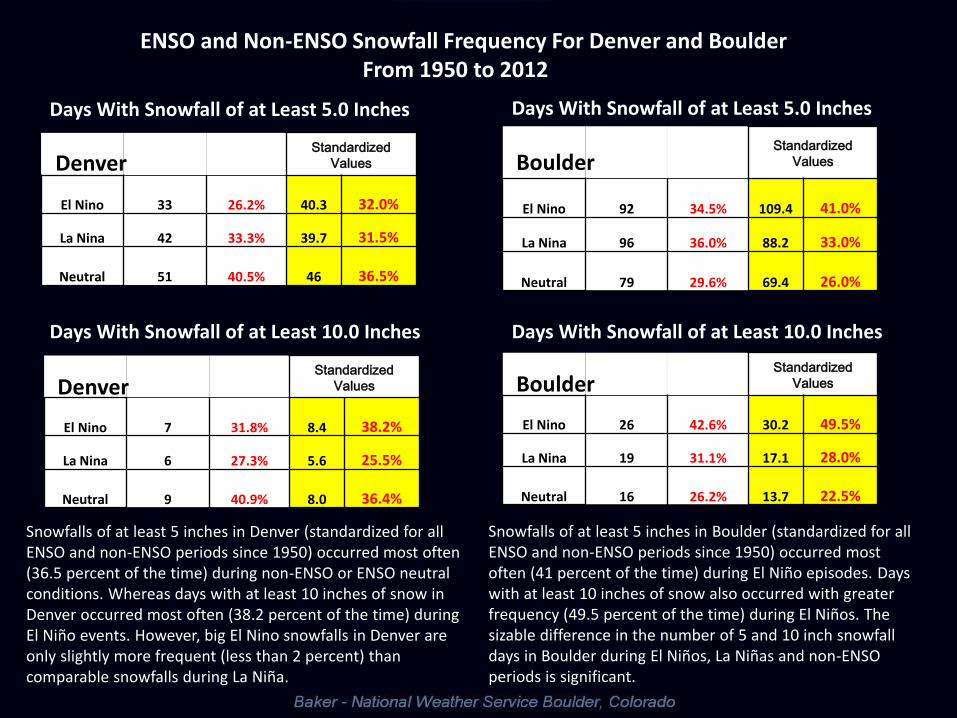
ENSO and Non-ENSO Snowfall Frequency For Denver and Boulder From 1950 to 2012
Denver
Denver
Snowfalls of at least 5 inches in Denver (standardized for all ENSO and non-ENSO periods since 1950) occurred most often (36.5 percent of the time) during non-ENSO or ENSO neutral conditions. Whereas days with at least 10 inches of snow in Denver occurred most often (38.2 percent of the time) during El Niño events. However, big El Nino snowfalls in Denver are only slightly more frequent (less than 2 percent) than comparable snowfalls during La Niña.
Standardized
Values
El Nino 7 31.8% 8.4 38.2%
La Nina 6 27.3% 5.6 25.5%
Neutral 9 40.9% 8.0 36.4%
Denver
Days With Snowfall of at Least 10.0 Inches
Standardized
Values
El Nino 92 34.5% 109.4 41.0%
La Nina 96 36.0% 88.2 33.0%
Neutral 79 29.6% 69.4 26.0%
Boulder
Days With Snowfall of at Least 5.0 Inches
Days With Snowfall of at Least 10.0 Inches
Standardized
Values
El Nino 26 42.6% 30.2 49.5%
La Nina 19 31.1% 17.1 28.0%
Neutral 16 26.2% 13.7 22.5%
Boulder
Snowfalls of at least 5 inches in Boulder (standardized for all ENSO and non-ENSO periods since 1950) occurred most often (41 percent of the time) during El Niño episodes. Days with at least 10 inches of snow also occurred with greater frequency (49.5 percent of the time) during El Niños. The sizable difference in the number of 5 and 10 inch snowfall days in Boulder during El Niños, La Niñas and non-ENSO periods is significant.
Standardized
Values
El Nino 39 27.7% 47.4 33.6%
La Nina 52 36.9% 48.8 34.6%
Neutral 50 35.5% 44.8 31.8%
Denver
Denver
Days With Snowfall of at Least 5.0 Inches
ENSO and Non-ENSO Snowfall Frequency For Fort Collins and Sterling From 1950 to 2012
Denver
Fort Collins
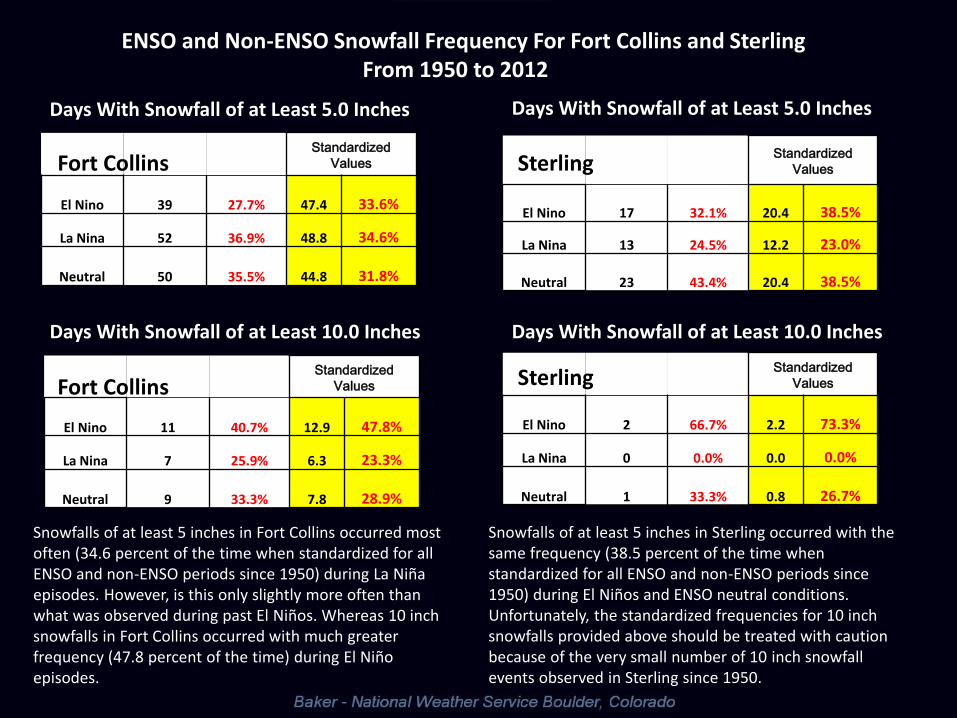
Snowfalls of at least 5 inches in Fort Collins occurred most often (34.6 percent of the time when standardized for all ENSO and non-ENSO periods since 1950) during La Niña episodes. However, is this only slightly more often than what was observed during past El Niños. Whereas 10 inch snowfalls in Fort Collins occurred with much greater frequency (47.8 percent of the time) during El Niño episodes.
Standardized
Values
El Nino 11 40.7% 12.9 47.8%
La Nina 7 25.9% 6.3 23.3%
Neutral 9 33.3% 7.8 28.9%
Fort Collins
Days With Snowfall of at Least 10.0 Inches
Standardized
Values
El Nino 17 32.1% 20.4 38.5%
La Nina 13 24.5% 12.2 23.0%
Neutral 23 43.4% 20.4 38.5%
Sterling
Days With Snowfall of at Least 5.0 Inches
Days With Snowfall of at Least 10.0 Inches
Standardized
Values
El Nino 2 66.7% 2.2 73.3%
La Nina 0 0.0% 0.0 0.0%
Neutral 1 33.3% 0.8 26.7%
Sterling
Snowfalls of at least 5 inches in Sterling occurred with the same frequency (38.5 percent of the time when standardized for all ENSO and non-ENSO periods since 1950) during El Niños and ENSO neutral conditions. Unfortunately, the standardized frequencies for 10 inch snowfalls provided above should be treated with caution because of the very small number of 10 inch snowfall events observed in Sterling since 1950.
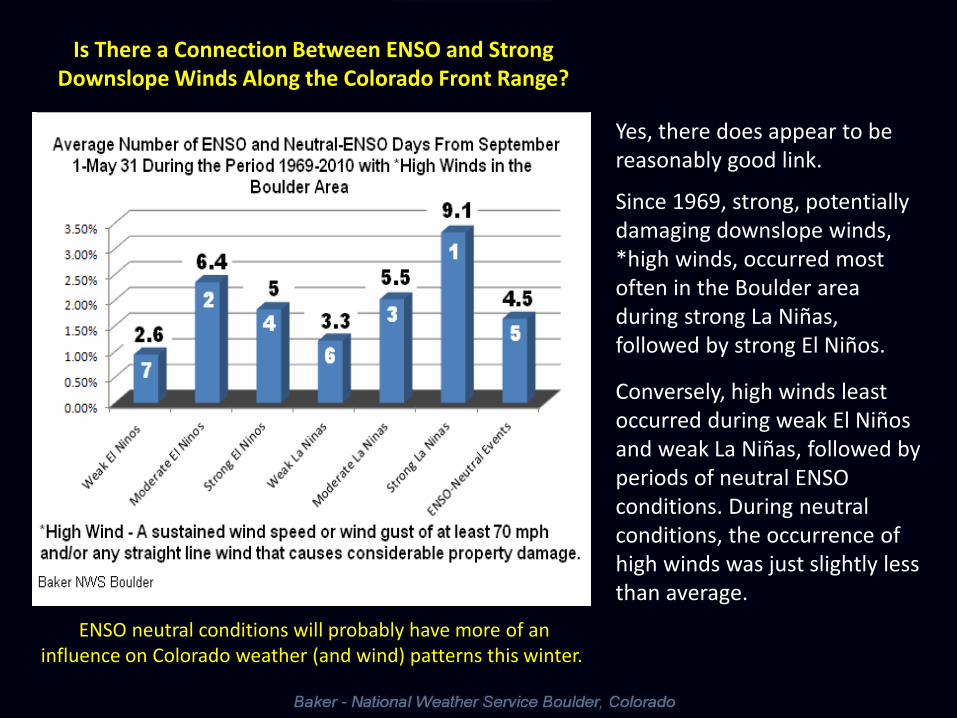
Yes, there does appear to be reasonably good link.
Since 1969, strong, potentially damaging downslope winds, *high winds, occurred most often in the Boulder area during strong La Niñas, followed by strong El Niños.
Conversely, high winds least occurred during weak El Niños and weak La Niñas, followed by periods of neutral ENSO conditions. During neutral conditions, the occurrence of high winds was just slightly less than average.
Is There a Connection Between ENSO and Strong Downslope Winds Along the Colorado Front Range?
ENSO neutral conditions will probably have more of an influence on Colorado weather (and wind) patterns this winter.
ENSO neutral conditions will probably have more of an influence
on weather (and wind) patterns across Colorado
this winter.
Historical Distribution of Temperature and Precipitation
In Colorado For
El Niño, ENSO-Neutral and La Niña Conditions
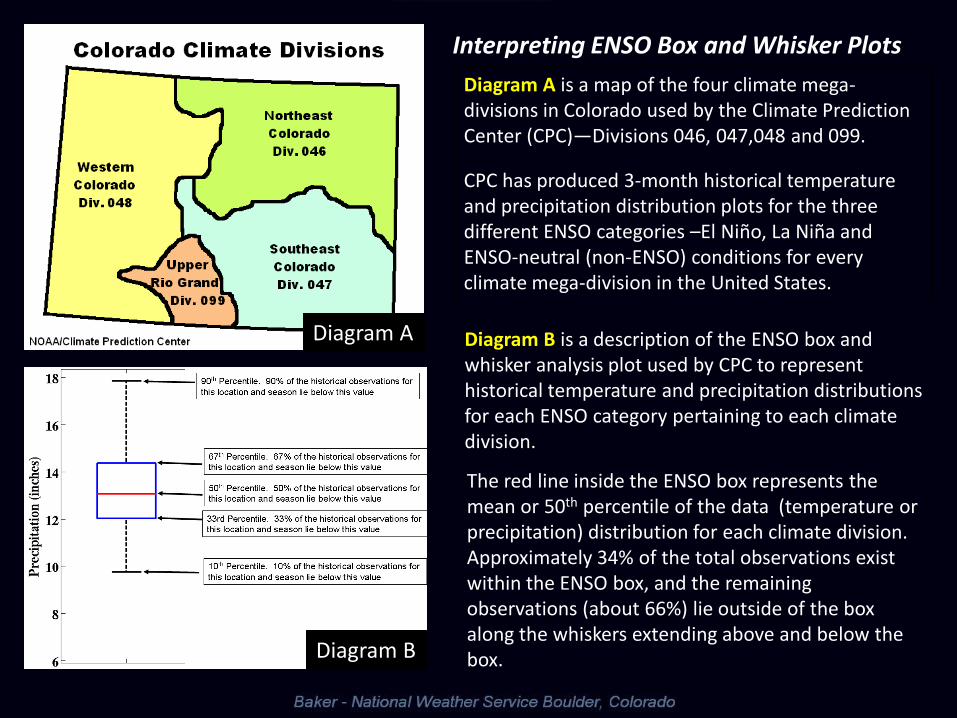
Diagram A is a map of the four climate mega-divisions in Colorado used by the Climate Prediction Center (CPC)—Divisions 046, 047,048 and 099.
CPC has produced 3-month historical temperature and precipitation distribution plots for the three different ENSO categories –El Niño, La Niña and ENSO-neutral (non-ENSO) conditions for every climate mega-division in the United States.
Diagram B is a description of the ENSO box and whisker analysis plot used by CPC to represent historical temperature and precipitation distributions for each ENSO category pertaining to each climate division.
Diagram A
Diagram B
The red line inside the ENSO box represents the mean or 50th percentile of the data (temperature or precipitation) distribution for each climate division. Approximately 34% of the total observations exist within the ENSO box, and the remaining observations (about 66%) lie outside of the box along the whiskers extending above and below the box.
Interpreting ENSO Box and Whisker Plots
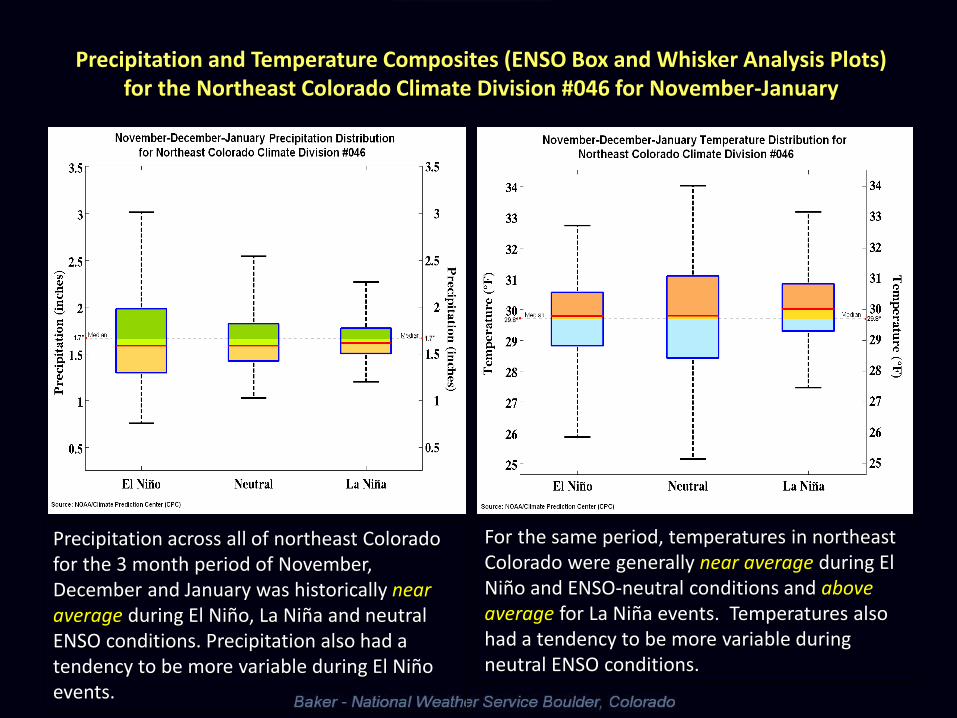
Precipitation and Temperature Composites (ENSO Box and Whisker Analysis Plots) for the Northeast Colorado Climate Division #046 for November-January
Precipitation across all of northeast Colorado for the 3 month period of November, December and January was historically near average during El Niño, La Niña and neutral ENSO conditions. Precipitation also had a tendency to be more variable during El Niño events.
For the same period, temperatures in northeast Colorado were generally near average during El Niño and ENSO-neutral conditions and above average for La Niña events. Temperatures also had a tendency to be more variable during neutral ENSO conditions.
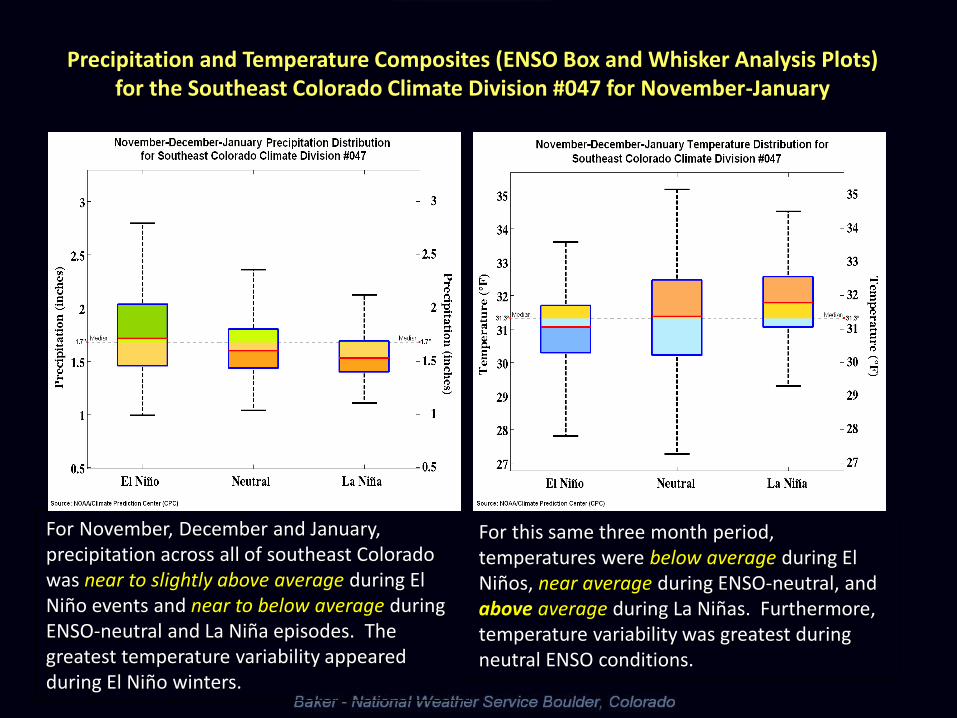
Precipitation and Temperature Composites (ENSO Box and Whisker Analysis Plots) for the Southeast Colorado Climate Division #047 for November-January
For November, December and January, precipitation across all of southeast Colorado was near to slightly above average during El Niño events and near to below average during ENSO-neutral and La Niña episodes. The greatest temperature variability appeared during El Niño winters.
For this same three month period, temperatures were below average during El Niños, near average during ENSO-neutral, and above average during La Niñas. Furthermore, temperature variability was greatest during neutral ENSO conditions.
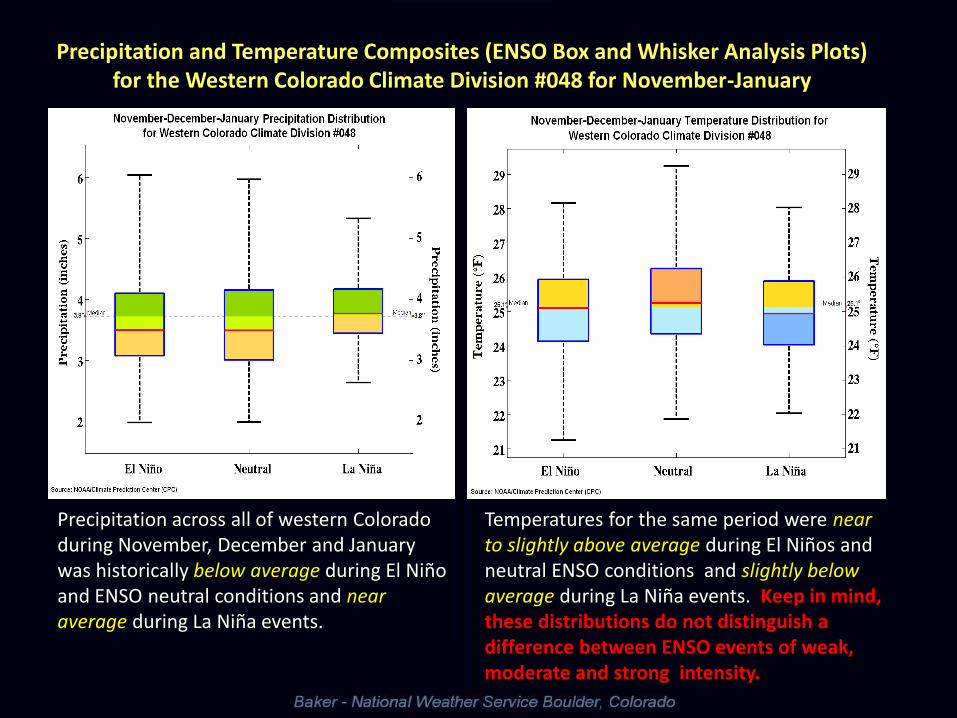
Precipitation and Temperature Composites (ENSO Box and Whisker Analysis Plots) for the Western Colorado Climate Division #048 for November-January
Precipitation across all of western Colorado during November, December and January was historically below average during El Niño and ENSO neutral conditions and near average during La Niña events.
Temperatures for the same period were near to slightly above average during El Niños and neutral ENSO conditions and slightly below average during La Niña events. Keep in mind, these distributions do not distinguish a difference between ENSO events of weak, moderate and strong intensity.
• When El Niño is present, warmer than normal ocean water in the equatorial Pacific Ocean shifts the patterns of tropical rainfall eastward that in turn influence the strength and position of the Pacific and Polar jet streams and storms over the eastern Pacific Ocean and United States. This climate pattern gives seasonal forecasters confidence in how the U.S. winter will unfold. For that reason, “an El Niño watch remains in effect because there’s still a window for it to emerge,” according to Deputy Director Halpert.
• Other climate factors can also influence winter weather to varying degrees across the country. They include the North Atlantic Oscillation (NAO), the Pacific Decadal Oscillation (PDO), the Madden-Julian Oscillation (MJO), and Pacific Inter-Decadal Oscillation (IPO). The NAO and MJO are difficult to predict more than one to two weeks in advance. Both add uncertainty to the winter outlook, the NAO for the Northeast and Mid-Atlantic and the MJO for western and southern portions of the country.
• An elusive El Niño continues to challenge seasonal climate forecasters with NOAA’s Climate Prediction Center. Forecasters say a wavering El Niño, expected to have developed by now, makes this year’s winter outlook less certain than previous years. “This is one of the most challenging outlooks we’ve produced in recent years because El Niño decided not to show up as expected,” said Mike Halpert, deputy of NOAA’s Climate Prediction Center.
Concluding Remarks
continue to next slide
2012-2013 Winter Outlook for Colorado – Summarized • According to Climate Prediction Center’s U.S. Winter Outlook, issued October 18, 2012, odds favor
warmer-than-average temperatures and an “equal chance” for above-, near-, or below-average precipitation across Colorado during the November 2012 to January 2013 climate season.
• This precipitation outlook does not project where and when snowstorms may hit or provide total seasonal snowfall accumulations. Snow forecasts are dependent upon the strength and track of winter storms, which are generally not predictable more than a week in advance.
• Based on climate records, storm track and jet stream composites, a high wind storm frequency study for the Boulder area, and seasonal climate and ENSO outlooks prepared by NOAA’s Climate Prediction Center and The International Research Institute for Climate and Society (IRI), the following weather conditions are more likely to occur in Colorado this winter season during a
• weak El Niño and/or neutral ENSO conditions:
1. Above-average temperatures statewide, with odds favoring northwest and west central portions of the state
2. Slightly above-average precipitation for southern portions of Colorado where storm tracks tend to favor during El Niño events, even weak ones. Otherwise, near- to slightly below-average precipitation is anticipated for the remainder of Colorado. Nonetheless, precipitation-snowfall across Colorado should be greater overall this winter season, compared to the meager amounts observed last winter.
continue to next slide
3. It is reasonable to assume that Colorado will see more storms this winter season compared to last winter. However, these storms are not expected to as intense or as long-lasting as those commonly observed during stronger ENSO episodes.
4. One explanation for the weaker, shorter-lived storms this winter season; the storm track normally does not linger for long periods of time over any one particular part of the state during periods of weak ENSO and non-ENSO conditions. The storm track is more likely to persist for days if not weeks at a time over northern Colorado during moderate to strong La Niñas, and for several days at a times across southern Colorado during moderate to strong El Niños.
5. Strong, potentially damaging downslope wind storms (known as Chinook and Bora) along the Colorado Front Range are more likely to develop during moderate to strong ENSO events and less often during weak ENSO and non-ENSO periods, as is expected this winter .
6. Finally, according to the U.S. Drought Outlook, issued October 18, 2012, those areas of the United States, including Colorado, that were severely impacted by extreme drought over the past year are unlikely to see much relief from drought conditions this winter.
2012-2013 Winter Outlook for Colorado - continued