Embed Size (px)
Citation preview
WINNIPEG SEWAGE TREATMENT PROGRAM
SOUTH END PLANT
PAGE
1/17
ANSWERS TO EAP PRELIMINARY REPORT
A ISSUE AFTER RECEPTION OF EAP REPORT 13/10/10 ASI
Rev NATURE OF REVISION DATE MADE APPROVED
WINNIPEG SEWAGE TREATMENT PROGRAM
SEWPCC – Answers to EAP report Page 2 of 17
Following the reception of the preliminary EAP report, the Program prepared and forwards to the EAP the answers to its questions. Before detailing the technical answers, the Program would like to remind the following :
• The work done so far on SEWPCC and presented in the Process Selection Report (PSR) and during the workshop is the work of the Program and not Veolia’s. The EAP report shall be corrected in that sense.
• The Program clearly understands the recommendations from the Manitoba CEC, especially regarding sustainability of the process and phosphorus recovery. The Program believes anyway that any recommendation has to be confronted to the cost it generates before being eventually considered as a rule for the project. The Program also reminds that all the 3 options allow at least one part of biological phosphorus removal and that recent researches have shown that at least the fertilizing power of phosphorus can be valorized from any kind of phosphorus.
• The importance of sustainability within the Program is assessed by the Management Team through the weighting of the comparison criteria.
1. PROCESS COMPARISON
1.1 OPTION 1
Note : option 1 has been eliminated by every attendee of the workshop. C1: Based on the other two items in this sections being statement of facts does the reader
assume that this is based on simulations or is this an assumption?
P1: This is based on results of simulations and calculations
C2 : It is not clear at all what is the basis of predicting any of these removal efficiencies at
maximum month conditions. The reported values do not agree with the operator stated
baluers and need to be verified. These low removal values have a profound impact on the
biological portion of the plant. Higher primary effluent TSS will increase the mass of inert
and unhelpful organic material in the biological reactor, thus requiring a higher MLSS
concentration to achieve equivalent treatment performance.
P2 : The explanation of these removal efficiencies is as given below :
WINNIPEG SEWAGE TREATMENT PROGRAM
SEWPCC – Answers to EAP report Page 3 of 17
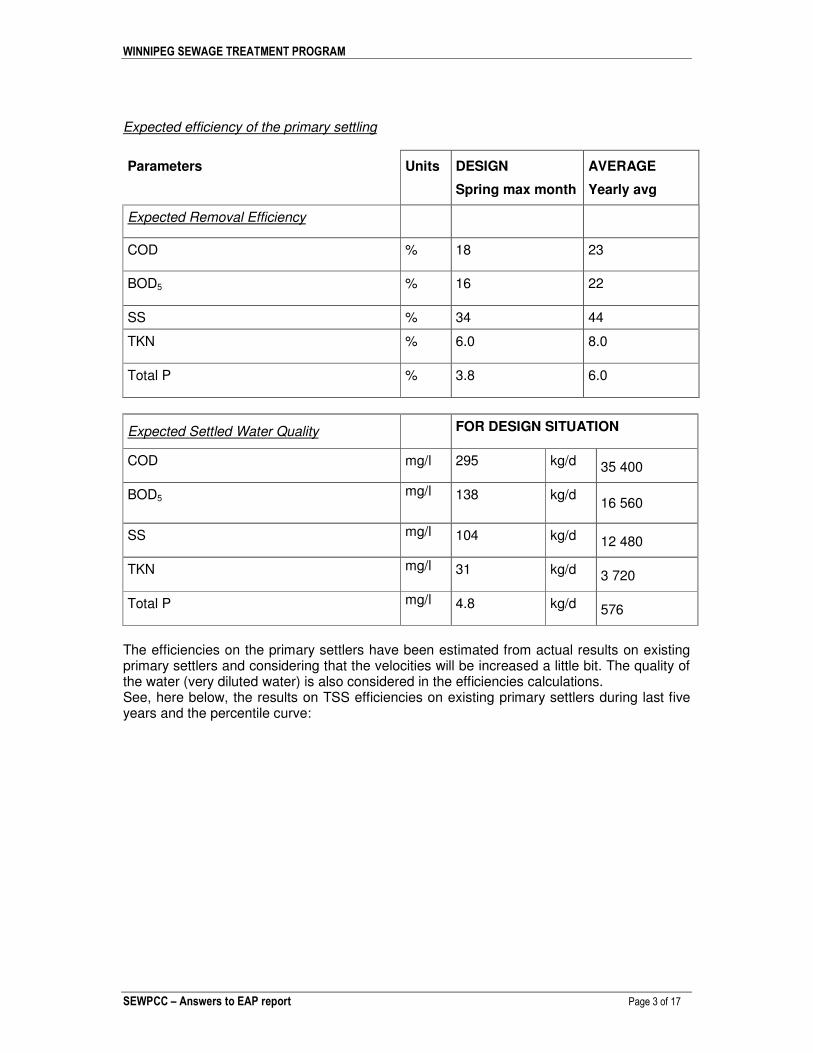
Expected efficiency of the primary settling
Parameters Units DESIGN
Spring max month
AVERAGE
Yearly avg
Expected Removal Efficiency
COD % 18 23
BOD5 % 16 22
SS % 34 44
TKN % 6.0 8.0
Total P % 3.8 6.0
Expected Settled Water Quality FOR DESIGN SITUATION
COD mg/l 295 kg/d 35 400
BOD5 mg/l 138 kg/d
16 560
SS mg/l 104 kg/d 12 480
TKN mg/l 31 kg/d 3 720
Total P mg/l 4.8 kg/d 576
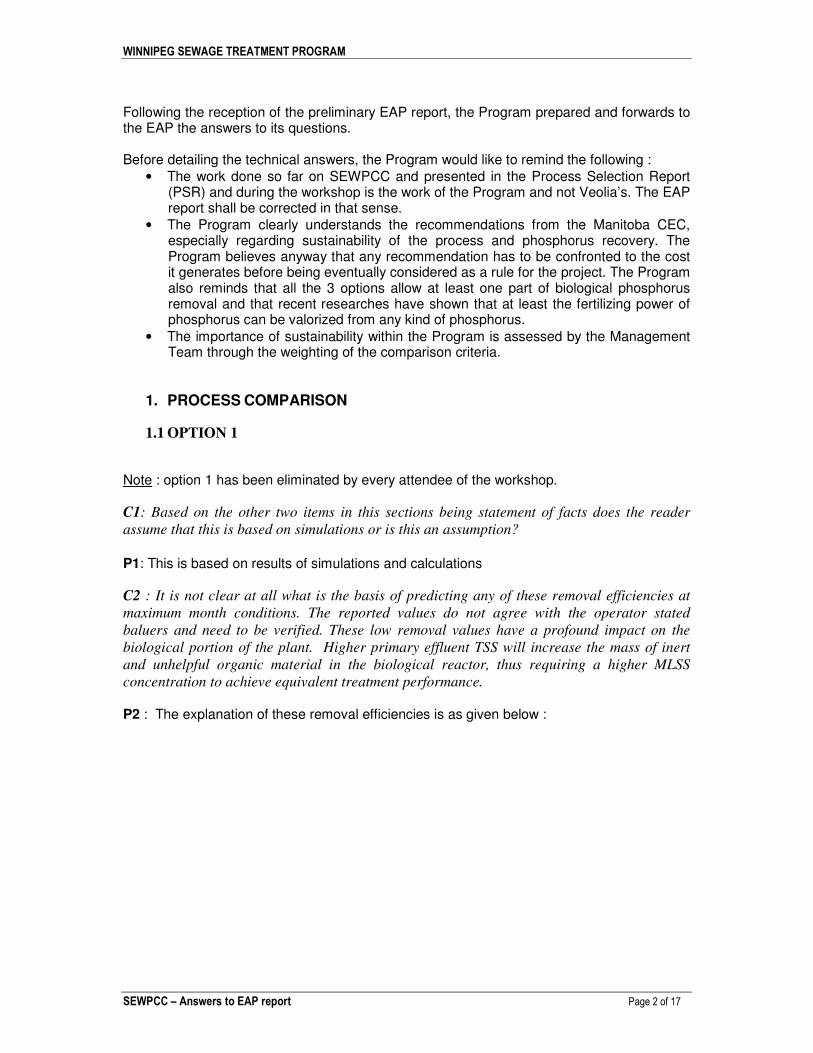
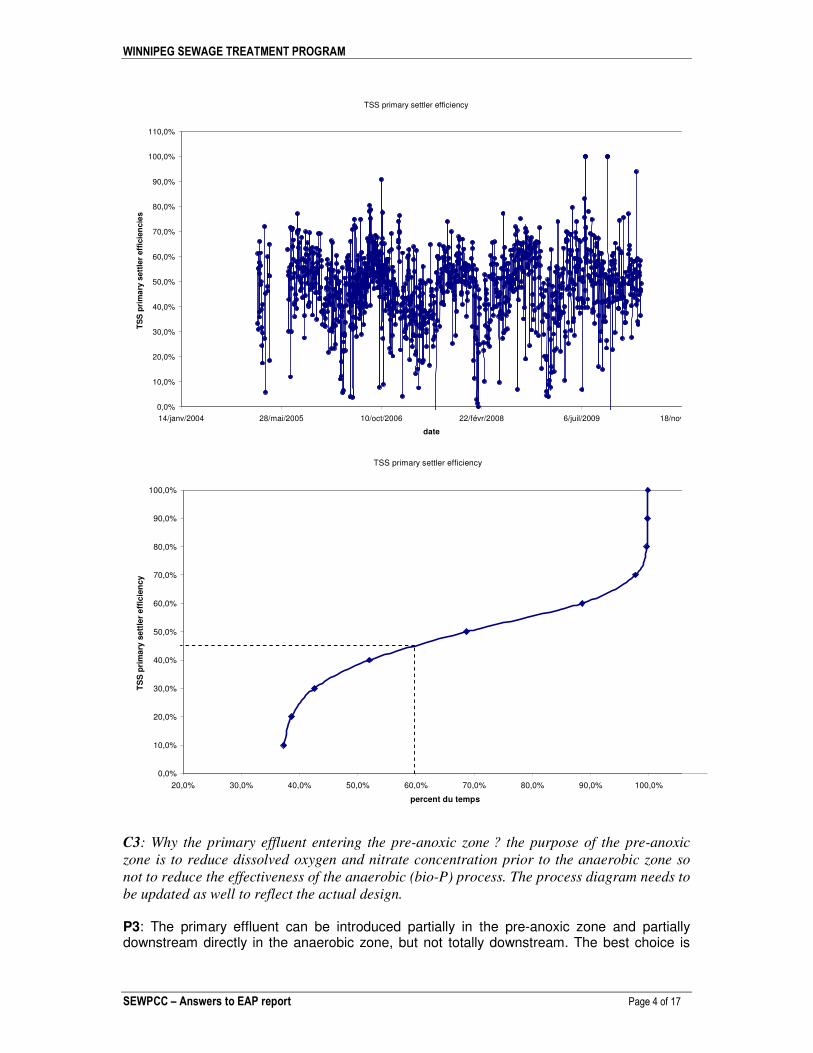
The efficiencies on the primary settlers have been estimated from actual results on existing primary settlers and considering that the velocities will be increased a little bit. The quality of the water (very diluted water) is also considered in the efficiencies calculations. See, here below, the results on TSS efficiencies on existing primary settlers during last five years and the percentile curve:
WINNIPEG SEWAGE TREATMENT PROGRAM
SEWPCC – Answers to EAP report Page 4 of 17
TSS primary settler efficiency
0,0%
10,0%
20,0%
30,0%
40,0%
50,0%
60,0%
70,0%
80,0%
90,0%
100,0%
110,0%
14/janv/2004 28/mai/2005 10/oct/2006 22/févr/2008 6/juil/2009 18/nov/2010
date
TS
S p
rim
ary
sett
ler
eff
icie
ncie
s
TSS primary settler efficiency
0,0%
10,0%
20,0%
30,0%
40,0%
50,0%
60,0%
70,0%
80,0%
90,0%
100,0%
20,0% 30,0% 40,0% 50,0% 60,0% 70,0% 80,0% 90,0% 100,0%
percent du temps
TS
S p
rim
ary
se
ttle
r e
ffic
ien
cy
C3: Why the primary effluent entering the pre-anoxic zone ? the purpose of the pre-anoxic
zone is to reduce dissolved oxygen and nitrate concentration prior to the anaerobic zone so
not to reduce the effectiveness of the anaerobic (bio-P) process. The process diagram needs to
be updated as well to reflect the actual design.
P3: The primary effluent can be introduced partially in the pre-anoxic zone and partially downstream directly in the anaerobic zone, but not totally downstream. The best choice is
WINNIPEG SEWAGE TREATMENT PROGRAM
SEWPCC – Answers to EAP report Page 5 of 17
based on the DN rates and the concentration in the tanks. We look for an optimum between the reduction of O2 in anaerobic, the concentration in the tanks and the denitrification rates. We have external source of C in this first zone, so the denitrification goes very fast and helps the endogeneous denitrification in the next zone. It’s important to keep this possibility for the flexibility of the system. C4: Sludge age at 14days- define as this was calculated. Was this including solids in the final
settling tanks, did this include the entire biological reactor or just the aerobic zones?
P4: the sludge age in based on total solids in the total biological reactor. This doesn’t include the clarifier sludge as this part is smaller compared to the biological reactor. Here below the calculation during design conditions: Average concentration MLSS in the biological reactor = 3.6 g/l Total volume of the biological reactor = 54 000 m3 Waste activated sludge from clarifier = 10 800 kg SS/d TSS outlet with treated water = 25 x 125 000 = 3 125 kg SS/d Sludge age = (3.6 x 54 000) / (10 800 + 3 125) = 13.9 days.
C5: SVI is very conservative when assuming the use of 15 mg/l FeCl3 addition to the MLSS.
This would be appropriate for non –ferric feed conditions. P5: The Program agrees that SVI of 150 can look conservative. It hasn’t been optimized as the design optimization was not the purpose at this early stage of the project. C6: Overall recommendation of 0.6 m/h is extremely low for peak hydraulic loading rate and
compared to option 2 with 0.8 m/h which has the same hydraulic and solids loading rate and
SVI. P6 : The difference between 0.6 m/h (option 1) and 0.8 m/h (option 2) was just to show the difference in settleability of different kind of sludge (low load for option 1 and similar to medium load for option 2). C7: Solids loading rate of 4.5 kg/m2/hr is also very low for a peak loading condition.
P7: This is the consequence of imposed velocity. Usually, for such clarifiers (with suction of sludge) solid loading rates between 5 and 7 kg/m2/d are applied. C8: It appears that there is a significant loading being assumed when the flow increases from
120 MLD to 240 MLD for the maximum spring week. Essentially the same influent
concentration whether the flow is 120MLD or 240 MLD to the SEWCPC.
Does this make sense based on past data? What is the basis of the higher sustained influent
loading for this entire week? Where are all of the non dry solids and pollutants coming from
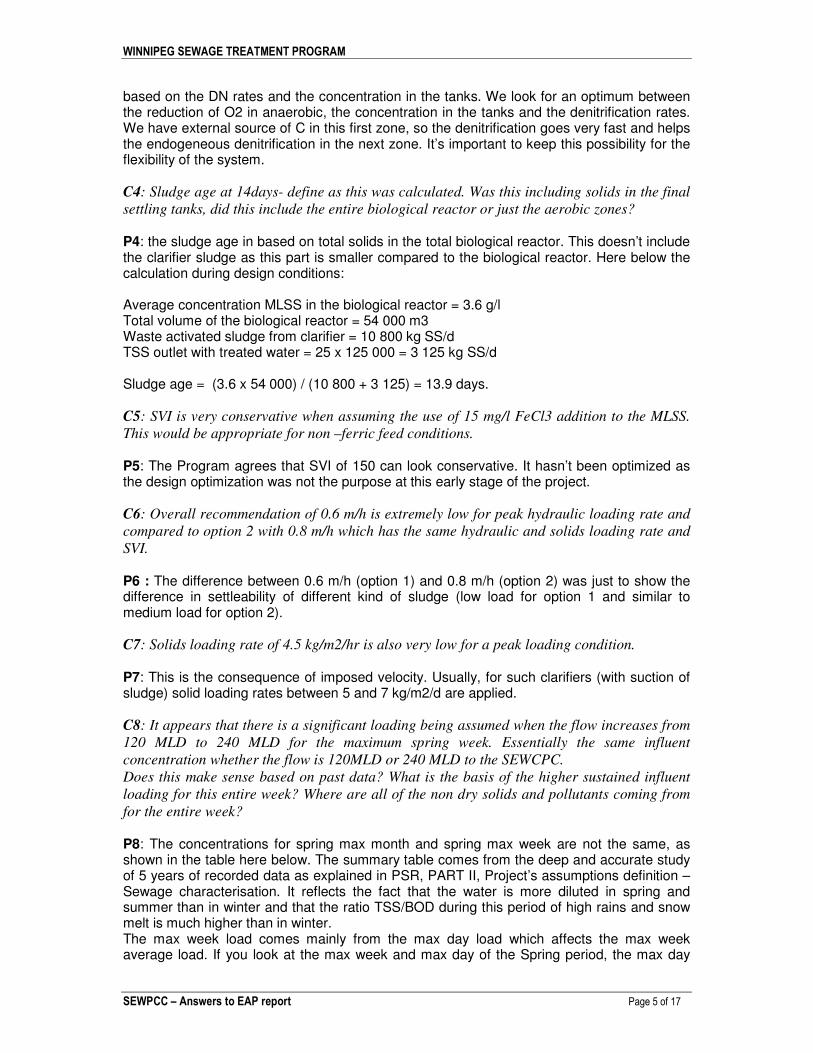
for the entire week? P8: The concentrations for spring max month and spring max week are not the same, as shown in the table here below. The summary table comes from the deep and accurate study of 5 years of recorded data as explained in PSR, PART II, Project’s assumptions definition – Sewage characterisation. It reflects the fact that the water is more diluted in spring and summer than in winter and that the ratio TSS/BOD during this period of high rains and snow melt is much higher than in winter. The max week load comes mainly from the max day load which affects the max week average load. If you look at the max week and max day of the Spring period, the max day
WINNIPEG SEWAGE TREATMENT PROGRAM
SEWPCC – Answers to EAP report Page 6 of 17
TSS load is very high. If you take one max day TSS (134 T/d) + 6 days of average flow (20.6 T/d), the average for the week is: (134 + 20.6*6)/7 = 36.8 T/d, while the value in the table is 39.79 T/d, so quite close to the calculated value. So most of the max week concentration actually comes from the max day loads associated with the sewer system flushing, which seems to occur over a one or two days period. All the calculations are based on these results.
C9: Was there an analysis done to show that it is necessary to go to high rate primary
treatment? A possible alternative would be to use chemically enhanced primary treatment
(CEPT) which can achieve TSS removals in the 75% to 80% range. P9: The Program agrees but would like to remind the advantages of using high rate primary treatments instead of a CEPT :
• The dose of chemical is less than in a classical CEPT because of the presence of micro-sand
• Compactness of the system (less civil work costs)
• Very quickly start-up required when the rain or snow melt arrives
• Flexibility (it can be used for several application during the dry periods).
• Stability of the results even if used only for few time during the year.
WINNIPEG SEWAGE TREATMENT PROGRAM
SEWPCC – Answers to EAP report Page 7 of 17
• Ease of adaptation to different applications and evolutions. C10: Performances of the Actiflo system was slightly better than CEPT. Was CEPT
considered, that is, includiong a number of addition primary settling tanks dedicated to
CEPT? These tanks could be used to store minor storm and when the flow goes high enough,
allow for CEPT to meet monthly discharge limits. P10: The classical CEPT was considered at the beginning of the study but not retained as the performances of the CEPT were lower compared to ACTIFLO with the same doses of chemicals. The Program also considered that building big concrete tanks to store rain water was not economically interesting compared to a compact system with high flexibility.
1.2 OPTION 2
"The cost to mitigate the constructability issues need to be better defined prior to eliminating this option". The construction duration is a technical criterion and not a financial one. The Program has considered to compare the options regarding their construction duration with the same construction means. C11: Why is primary effluent entering the anoxic zone? P11: The primary effluent can be introduced in the pre-anoxic zone or downstream directly in the anaerobic zone. No difference in the design or in the process comparison step. This aspect will be deeply analysed later in the detailed design of the retained solution. C12: Sludge age is noted as 8.5 days – is this the entire volume or just the aerobic zone?
Please provide how this was calculated.
P12: The sludge age in based on solids in the total biological reactor. This doesn’t include the clarifier sludge as this part is smaller compared to the biological reactor. The calculation has been as follows : Average concentration MLSS in the biological reactor = 4.0 g/l Total volume of the biological reactor = 40 000 m3 Waste activated sludge from clarifier = 16 500 kg SS/d TSS outlet with treated water = 25 x 125 000 = 3 125 kg SS/d Sludge age = (4.0 x 40 000) / (16 500 + 3 125) = 8.2 days. C13: FeCl3 addition is noted as 6 mg/l versus 15 mg/l for Option 1. Why the difference? Also
is the value based on Ferric Chloride or Iron? Whenever mentioning FeCl3 dose for chemical
phosphorus removal (and Actiflo), please state the reference of the mg/l – is it pure product,
Fe, commercial solution?
P13: The difference comes from simulations. After the review workshop in Winnipeg, the team agreed on the biological Phosphorus removal efficiencies to be increased (as for Biowin software) and so the FeCl3 doses have been recalculated. Updated doses will be provided within the new version of PSR. The dose of chemical is always expressed (for all applications) as mg/l of pure FeCl3 as indicated in the PSR and not as Iron nor commercial solution unless the contrary is mentioned.
WINNIPEG SEWAGE TREATMENT PROGRAM
SEWPCC – Answers to EAP report Page 8 of 17
C14: Confirm that the basis of design is for all nitrification to be performed by the nitrifiers
on the IFAS media… this appears to be the design criteria.
If true, then why is the MLSS still being maintained at 3.6 g/l? This impacts the clarifier
sizing. P14: A small part of the nitrification (around 25%) still takes part in the free biomass around media. The most important part of nitrification (around 75%) is realized on the media by attached biomass. The biomass which detach from the media actually seeds the suspended biomass with nitrifiers, hence some suspended growth nitrification. The necessary free biomass for total process (C removal, small part of nitrification and denitrification) is obtained with a concentration in the tank of 4 g/l and a sludge age around 8 days. The high SRT is a consequence of the need to denitrify. We don’t have enough soluble COD in the influent and hence part of the denitrification has to be done with Endogenous respiration. C15: Why is the internal mixed liquor recycle (IMLR) 450%? At peak flow it appears to be
well oversized to achieve the permit limit of 15 mg/l TN. Recycling too much IMLR will
reduce nitrogen removal due to additional dissolved oxygen concentration.
P15 : This IMLR value came from a mistake in simulations. Consequently it has been revised in the new version of the PSR to 150%. C16: Following up on the IMLR rates does the Simulo® model assume the dissolved oxygen
concentration in the anoxic zone to be zero, or does it account for the dissolved oxygen
entering the anoxic zone from the upstream tankage (if there is any) and the IMLR which is
coming from the end of the aeration tank?
P16: Simulo has been calibrated for ditch systems with intermittent aeration and uses, due to this, a high KOA value which again demand high oxygen level in the aerated tanks. This will lead to low denitrification rates in the aerated zones compared to normal, hence it has not been necessary for these kind of systems to be calculated with the recirculation of O2. Due to this it is necessary when calculating normal multi tank systems to manually apply an O2 concentration to the anoxic tank that will give the correct Oxygen respiration. For option two we have foreseen a de-oxygenation zone after the zone with high O2 and it is though not necessary to take into account any O2 recirculation. C17: With RAS nitrates the recycle is actually 550% Q – has RAS been included in the
internal recycle calculations?
P17 : Yes it has been included in calculations, but there was a mistake in the previous simulation. The new calculation will be provided within the update PSR. C18: The hydraulic, SVI and solids loading rate on the final settling tanks is similar to option
1. It is unclear why option 1 would have 125% more surface area versus option2 .
What is the basis for selection of SVI and MLSS concentrations? Can they be optimised to
reduce clarifiers size?
P18: Considered SVI in IFAS option is 140 ml/g against 150 ml/g in classical activated sludge option. This has been done to reflect a different kind of sludge (low load activated sludge with nitrifiers against average load activated sludge with presence of fixed biomass). This is a result from experience in operating several plants at such conditions. Having primary settlers up-front of the IFAS has been estimated to have a larger negative effect on
WINNIPEG SEWAGE TREATMENT PROGRAM
SEWPCC – Answers to EAP report Page 9 of 17
the SVI than the positive gain of the IFAS configuration compared to ordinary activated sludge. This is the same explanation for clarifiers’ hydraulic velocity. Their conservativeness is usual for the early design stage the Program is currently in. If the option is selected the parameter will be optimized (as far as it is possible) in the further steps. C19: Could the clarifiers be optimised for the zone settling velocity and the smaller
concentration of biomass as nitrifiers are fixed? P19: Please refer to previous answers. Anyway the program doesn’t expect some significant optimization for the clarifiers, especially according to P removal requirements. C20: The COW Operations have been concerned about the biomass settleability and
suggested Biogradex as one technology to assure settling even when sludge has bulking
tendencies. This could be investigated as a way of deleting one clarifier. Other options to
improve sludge settleability (floc loading in selectors) should be explored and may be tested
in existing plants. P20: The Program will not take the risk to delete one clarifier. Clarifiers are designed to obtain a good separation from water and sludge even when bulking is not present. So a confident velocity of the up flow water, a sludge retention time and a sludge loading rate have to be respected in every case. In case of bulking events, the presence of Biogradex or VW degassing tank or other systems can help to eliminate one cause of bulking but not all of them. The risk of bulking always exists in such systems. C11: There appears to be a disconnect between Option 1 and Option 2 in biological solids
production. Option 1 operating at a sludge age of 14 days produces 10 800 kg/d at design
value while Option 2 operating at a sludge age of 8.5 days, produces 15 000 kg/d. Essentially
the design is stating that if the SRT were increased by 5.5 days, the solids production can be
reduced by 4200 kg/d. This appears to be an overestimation of solids destruction for an
additional 5.5 days SRT. Also there is less ferric chloride addition in Option 2 which should
reduce the inert solids production. There seems to be a different methodology being used
here. P21 : The sludge production calculated initially for option 1 was wrong and should have been closer to 12 100 kg/d, as shown when the model comparison was done between Simulo and Biowin. Then, the difference between the sludge production from option 1 (12100 kg/d) and option 2 (15 000 kg/d) could be better explained by the difference in SRT. C22: The TN removal of 60% for option 2 versus 54.5% removal for Option 1 appears to
indicate the use of 450% IMLR has a minimal benefit. Unclear – could this be improved by
using another modelling software like Biowin?
P22 : The removal efficiency of TN are more or less the same for Option 1 and Option 2 (58% against 60%). The exact results of simulations were reported here. Please refer to new version of PSR for final results. Biowin was already used for Option 2 and approximately the same results were obtained for nitrification – denitrification. C23: Why are new aeration basins 7 m deep? Justify better the parameters chosen like sludge
age, SVI; solids loading etc….. Justify size and number of filters; give references for similar
plants……
WINNIPEG SEWAGE TREATMENT PROGRAM
SEWPCC – Answers to EAP report Page 10 of 17
P23 : Please refer to new version of PSR. A depth of 6.5 m was chosen for new tanks. This comes usually from an optimised calculation between aeration efficiency and concrete costs. The best depth will be chosen during detailed design for the retained solution after a deeper study of the topography and geology of the field. All design parameters for each solution are indicated in the PSR (sludge age, solids loadings, velocities, efficiencies…..). Filters numbers and references: not relevant for option 2 but will be answered for options 3 and 4.
C24 : For each option, one should calculate what flow and load can be handled with the
existing facilities, once converted (to bio-P basins , for instance) – and then decide if it is
worthwhile to add new facilities right away for the future load, or progress in a modular
manner. P24 : All calculations are based for the moment on the complete plant construction required to meet year 2031 requirements. A modular approach, or the construction staging, has not be considered so far and will be part of the detailed engineering portion of the project. C25 : Explain better the oxygen calculations and concept like : Total daily ‘real’O2 (AOR),
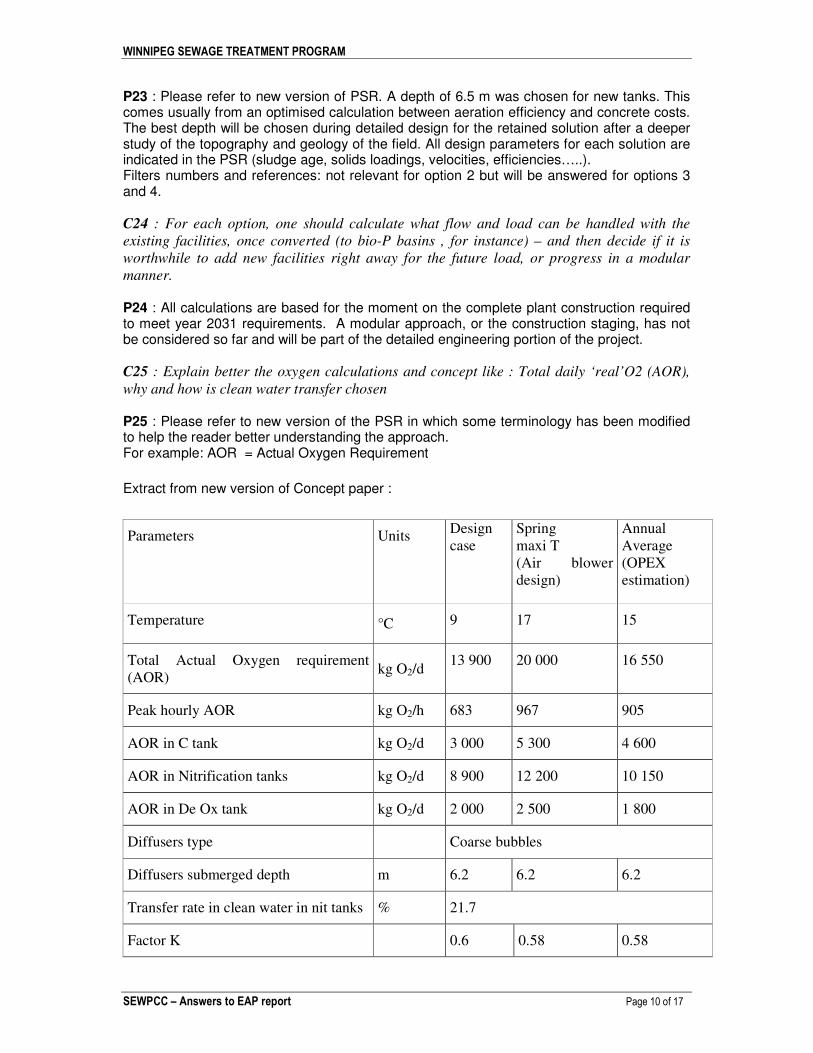
why and how is clean water transfer chosen P25 : Please refer to new version of the PSR in which some terminology has been modified to help the reader better understanding the approach. For example: AOR = Actual Oxygen Requirement
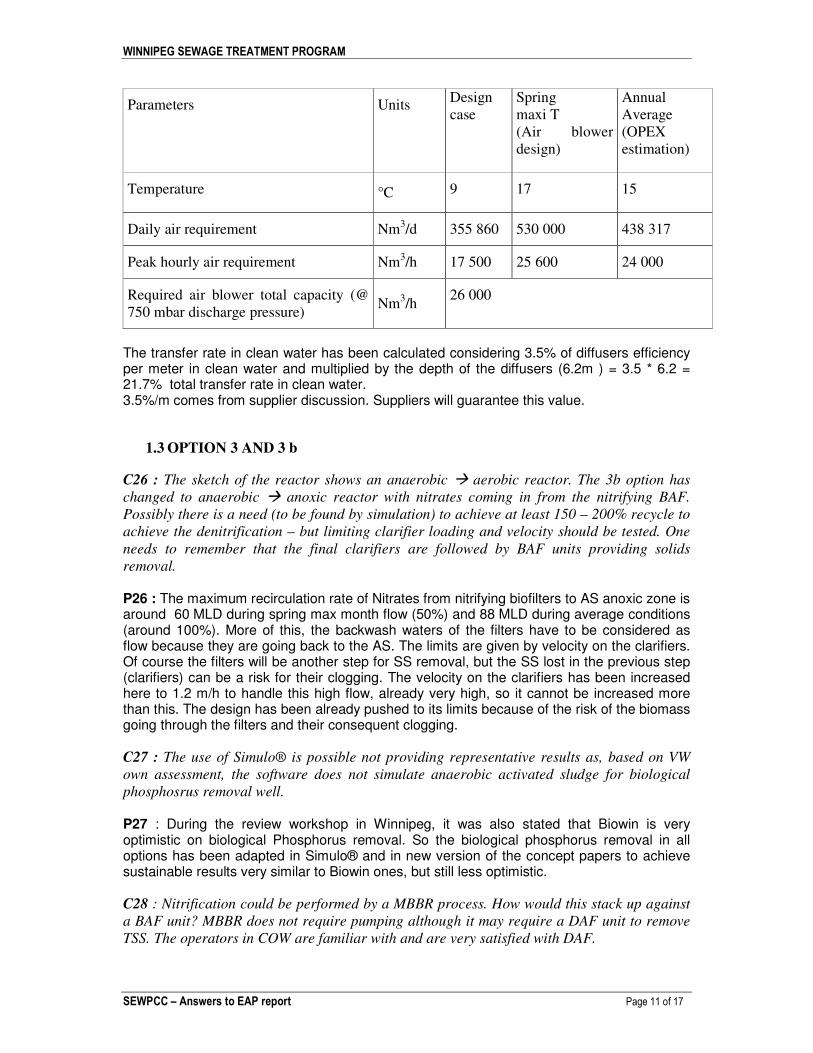
Extract from new version of Concept paper :
Parameters Units Design
case
Spring
maxi T
(Air blower
design)
Annual
Average
(OPEX
estimation)
Temperature °C 9 17 15
Total Actual Oxygen requirement
(AOR) kg O2/d
13 900 20 000 16 550
Peak hourly AOR kg O2/h 683 967 905
AOR in C tank kg O2/d 3 000 5 300 4 600
AOR in Nitrification tanks kg O2/d 8 900 12 200 10 150
AOR in De Ox tank kg O2/d 2 000 2 500 1 800
Diffusers type Coarse bubbles
Diffusers submerged depth m 6.2 6.2 6.2
Transfer rate in clean water in nit tanks % 21.7
Factor K 0.6 0.58 0.58
WINNIPEG SEWAGE TREATMENT PROGRAM
SEWPCC – Answers to EAP report Page 11 of 17
Parameters Units Design
case
Spring
maxi T
(Air blower
design)
Annual
Average
(OPEX
estimation)
Temperature °C 9 17 15
Daily air requirement Nm3/d 355 860 530 000 438 317
Peak hourly air requirement Nm3/h 17 500 25 600 24 000
Required air blower total capacity (@
750 mbar discharge pressure) Nm
3/h
26 000
The transfer rate in clean water has been calculated considering 3.5% of diffusers efficiency per meter in clean water and multiplied by the depth of the diffusers (6.2m ) = 3.5 * 6.2 = 21.7% total transfer rate in clean water. 3.5%/m comes from supplier discussion. Suppliers will guarantee this value.
1.3 OPTION 3 AND 3 b
C26 : The sketch of the reactor shows an anaerobic � aerobic reactor. The 3b option has
changed to anaerobic � anoxic reactor with nitrates coming in from the nitrifying BAF.
Possibly there is a need (to be found by simulation) to achieve at least 150 – 200% recycle to
achieve the denitrification – but limiting clarifier loading and velocity should be tested. One
needs to remember that the final clarifiers are followed by BAF units providing solids
removal. P26 : The maximum recirculation rate of Nitrates from nitrifying biofilters to AS anoxic zone is around 60 MLD during spring max month flow (50%) and 88 MLD during average conditions (around 100%). More of this, the backwash waters of the filters have to be considered as flow because they are going back to the AS. The limits are given by velocity on the clarifiers. Of course the filters will be another step for SS removal, but the SS lost in the previous step (clarifiers) can be a risk for their clogging. The velocity on the clarifiers has been increased here to 1.2 m/h to handle this high flow, already very high, so it cannot be increased more than this. The design has been already pushed to its limits because of the risk of the biomass going through the filters and their consequent clogging. C27 : The use of Simulo® is possible not providing representative results as, based on VW
own assessment, the software does not simulate anaerobic activated sludge for biological
phosphosrus removal well.
P27 : During the review workshop in Winnipeg, it was also stated that Biowin is very optimistic on biological Phosphorus removal. So the biological phosphorus removal in all options has been adapted in Simulo® and in new version of the concept papers to achieve sustainable results very similar to Biowin ones, but still less optimistic. C28 : Nitrification could be performed by a MBBR process. How would this stack up against
a BAF unit? MBBR does not require pumping although it may require a DAF unit to remove
TSS. The operators in COW are familiar with and are very satisfied with DAF.
WINNIPEG SEWAGE TREATMENT PROGRAM
SEWPCC – Answers to EAP report Page 12 of 17
P28 : actually an MBBR could be used to achieve nitrification downstream of the AS. However, there would be a need for a clarification step downstream of the MBBR. This clarification step could be a DAF or an Actiflo or any other type of clarifier, but would require chemical dosage as the MBBR solids are quite challenging to clarify. It is then a matter of cost comparison between a BAF system and a MBBR + clarification system. The Program considered that the BAF system would be a more competitive alternative. Another way to use the MBBR for nitrification, in order to save the additional clarification step (with chemicals) is to simply use the MBBR media… within the activated sludge itself, which brings us back to option 2. C29 : TSS information is not provided in the tables. It is unclear what the TSS concentration
from the activated sludge to the Biostyr NIT® unit is and what the expected effluent TSS
value. This is particularly important with the phosphorus concentration noted as 1.4 mg/l ub
the discharge from the Biostyr NIT®.
P29 : Tables with only principal parameters were given. In the new version of PSR, the complete tables at each step outlet are given for more clarity. Please refer to this last version. C30 : Why there is no table showing effluent quality from Biostyr NIT®? Accordingly it is
unclear how the effluent TP goal is to be met. There doesn’t appear to be any mechanism
other that TSS removal in the Biostyr NIT® for phosphorus removal. The only chemical noted
is methanol in a rage of 58/189 = 3.1 g Methanol/g NOx-N P30 : See answer before. Please refer to new version of PSR. Anyway, the TP goal is met by a combination of the following :
- biological removal in Activated Sludge : from 5 to 1.7 mg/l, around 67% efficiency - from 1.7 to 1.3 mg/l (23% removal) : synthesis of bacteria in Biostyr N and filtration - from 1.3 to 1.0 mg/l (23% removal) : synthesis of bacteria in Biostyr DN and filtration
C31 : The use of denitrifying BAFs needs to be revisited – are they really necessary? This
should be modelled with the recycle of nitrified effluent to anoxic activated sludge. Since BAF
is a filter can the clarifiers work at a higher load as the risk of solids carry-over is less
important? The effluent TN is 15 mg/l so we are really not seeking a high degree of nitrate
removal.
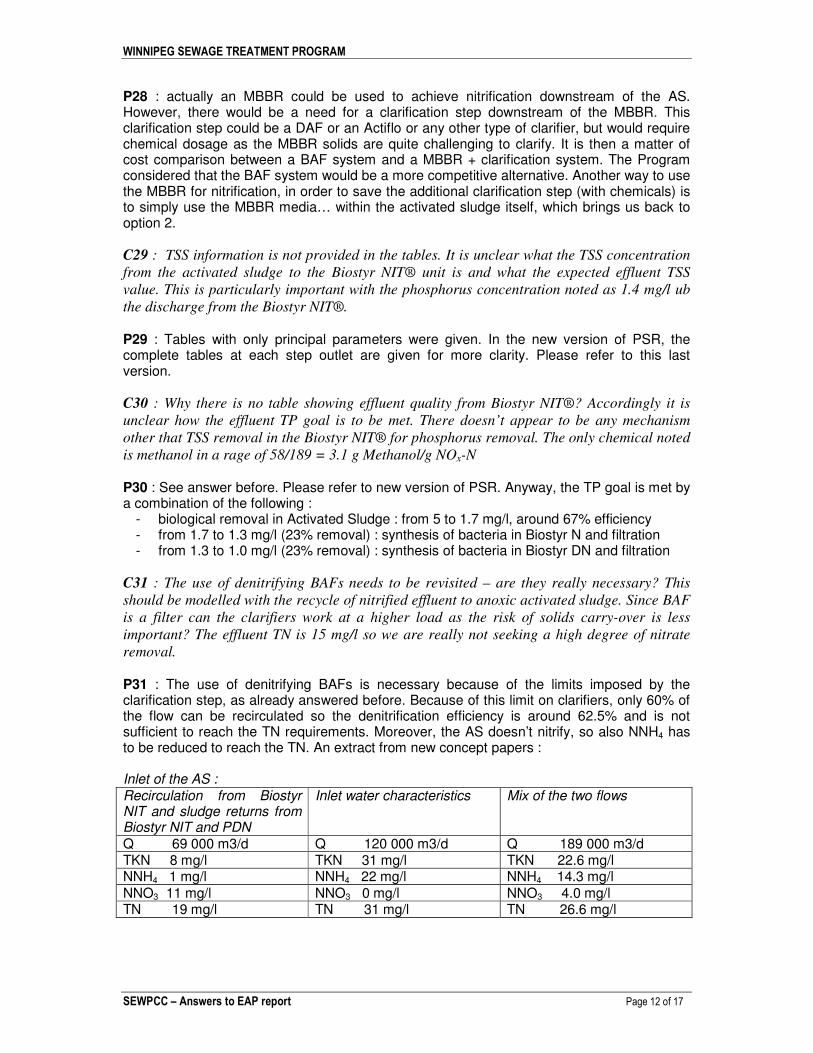
P31 : The use of denitrifying BAFs is necessary because of the limits imposed by the clarification step, as already answered before. Because of this limit on clarifiers, only 60% of the flow can be recirculated so the denitrification efficiency is around 62.5% and is not sufficient to reach the TN requirements. Moreover, the AS doesn’t nitrify, so also NNH4 has to be reduced to reach the TN. An extract from new concept papers : Inlet of the AS :
Recirculation from Biostyr NIT and sludge returns from Biostyr NIT and PDN
Inlet water characteristics Mix of the two flows
Q 69 000 m3/d Q 120 000 m3/d Q 189 000 m3/d TKN 8 mg/l TKN 31 mg/l TKN 22.6 mg/l NNH4 1 mg/l NNH4 22 mg/l NNH4 14.3 mg/l
NNO3 11 mg/l NNO3 0 mg/l NNO3 4.0 mg/l TN 19 mg/l TN 31 mg/l TN 26.6 mg/l
WINNIPEG SEWAGE TREATMENT PROGRAM
SEWPCC – Answers to EAP report Page 13 of 17
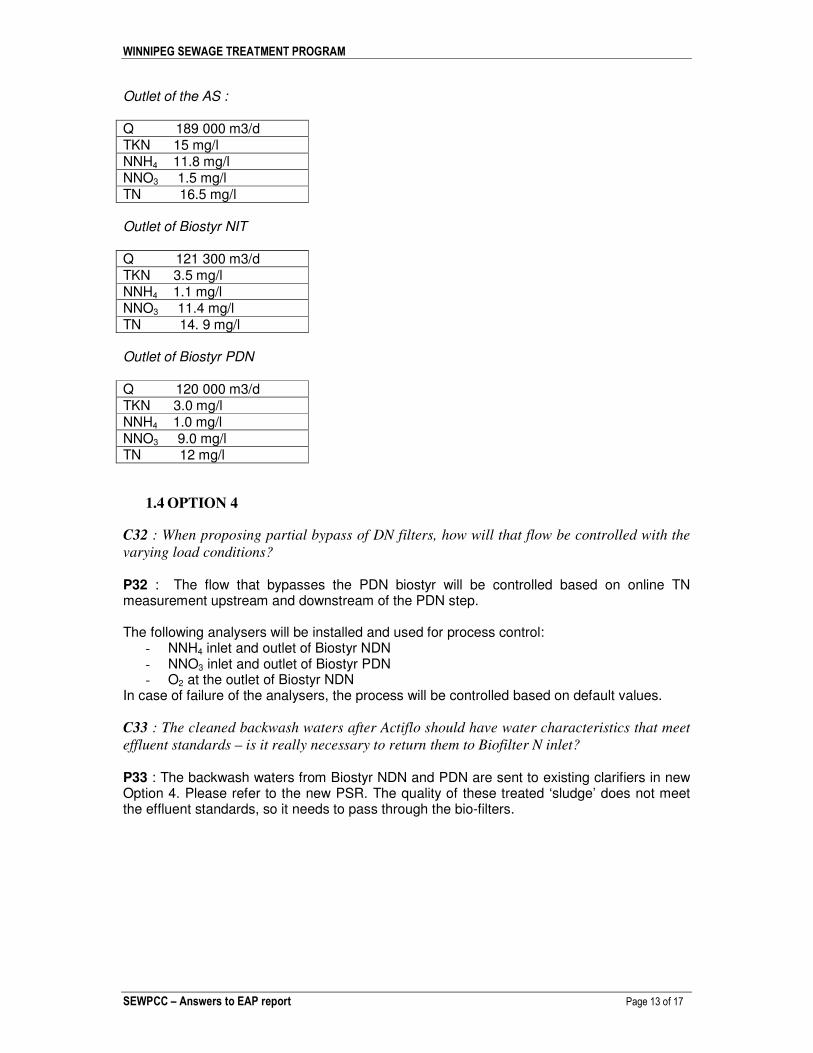
Outlet of the AS :
Q 189 000 m3/d TKN 15 mg/l NNH4 11.8 mg/l NNO3 1.5 mg/l TN 16.5 mg/l Outlet of Biostyr NIT
Q 121 300 m3/d TKN 3.5 mg/l NNH4 1.1 mg/l NNO3 11.4 mg/l TN 14. 9 mg/l
Outlet of Biostyr PDN
Q 120 000 m3/d TKN 3.0 mg/l NNH4 1.0 mg/l
NNO3 9.0 mg/l TN 12 mg/l
1.4 OPTION 4
C32 : When proposing partial bypass of DN filters, how will that flow be controlled with the
varying load conditions?
P32 : The flow that bypasses the PDN biostyr will be controlled based on online TN measurement upstream and downstream of the PDN step. The following analysers will be installed and used for process control:
- NNH4 inlet and outlet of Biostyr NDN - NNO3 inlet and outlet of Biostyr PDN - O2 at the outlet of Biostyr NDN
In case of failure of the analysers, the process will be controlled based on default values. C33 : The cleaned backwash waters after Actiflo should have water characteristics that meet
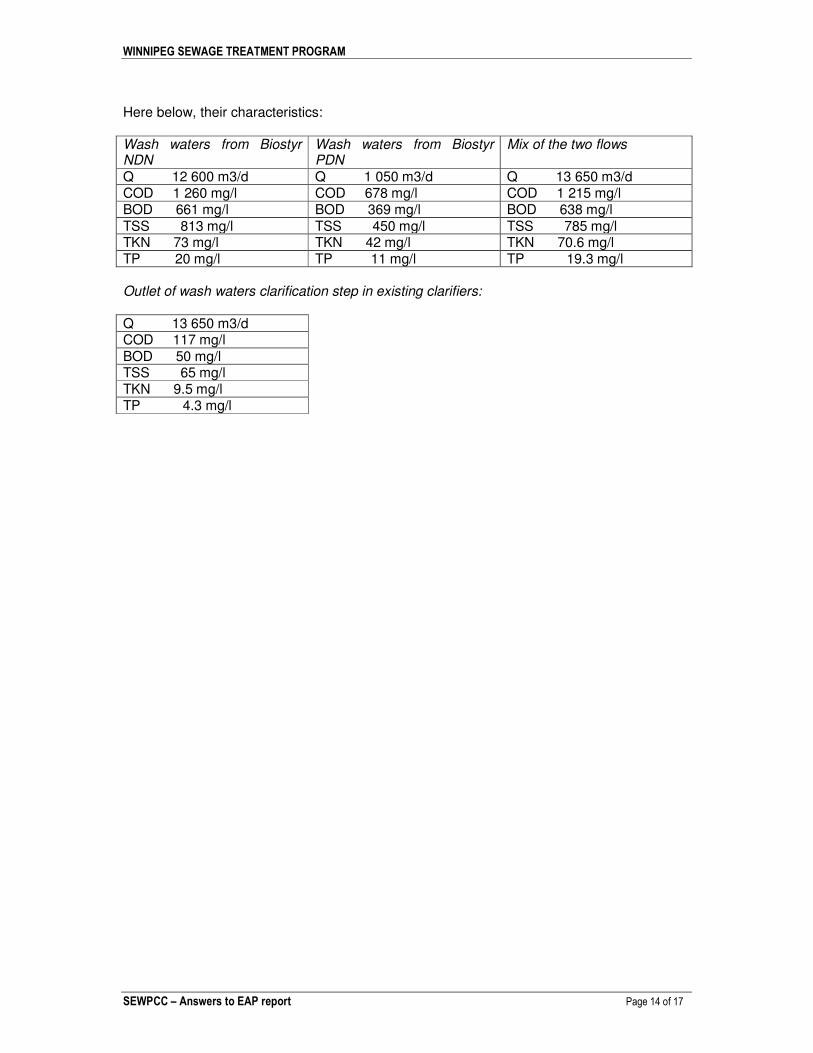
effluent standards – is it really necessary to return them to Biofilter N inlet? P33 : The backwash waters from Biostyr NDN and PDN are sent to existing clarifiers in new Option 4. Please refer to the new PSR. The quality of these treated ‘sludge’ does not meet the effluent standards, so it needs to pass through the bio-filters.
WINNIPEG SEWAGE TREATMENT PROGRAM
SEWPCC – Answers to EAP report Page 14 of 17
Here below, their characteristics: Wash waters from Biostyr NDN
Wash waters from Biostyr PDN
Mix of the two flows
Q 12 600 m3/d Q 1 050 m3/d Q 13 650 m3/d COD 1 260 mg/l COD 678 mg/l COD 1 215 mg/l BOD 661 mg/l BOD 369 mg/l BOD 638 mg/l
TSS 813 mg/l TSS 450 mg/l TSS 785 mg/l TKN 73 mg/l TKN 42 mg/l TKN 70.6 mg/l TP 20 mg/l TP 11 mg/l TP 19.3 mg/l Outlet of wash waters clarification step in existing clarifiers:
Q 13 650 m3/d COD 117 mg/l
BOD 50 mg/l TSS 65 mg/l TKN 9.5 mg/l TP 4.3 mg/l
WINNIPEG SEWAGE TREATMENT PROGRAM
SEWPCC – Answers to EAP report Page 15 of 17
GENERAL ISSUES REQUIRING RESOLUTION
1.5 Phosphorus recovery
Phosphorus biological recovery is possible in option 2 and 3, based on a phostrip-type process adapted for struvite precipitation, which is then usable for the soluble part of the incoming TP, since the particulate part is not accumulated in excess within the bioP organisms. While being technically feasible, struvite recovery has significant capital and operational costs. Regarding operation, chemicals have to be added to form the struvite :
- chemical for pH control - magnesium (often through MgCl2 addition) - and eventually ammonia depending where the struvite will be produced (which is
especially true for a phosptrip-type struvite process). Struvite could also be formed after anaerobic sludge digestion. In this case, all the particulate P (removed in the primary clarification step and secondary treatment of options 2, 3, and 4) would become soluble and struvite-precipitable downstream of sludge digestion. Particulate P represents about 20% of the incoming raw sewage TP. As for the soluble part, options 2 and 3 do allow removal of most of the soluble P biologically, which would all become struvite-precipitable downstream of digestion. Considering 1.0 mg/L TP at the plant effluent and 6.3 mg/L TP at the influent, an equivalent to 5.3 mg/L TP is removed and can become struvite-precipitable. As for option 4, about 60% of the raw sewage incoming soluble P would be chemically precipitated in the primary clarifiers, which represents about 50% of the raw sewage TP. The rest of the soluble P is used for cell synthesis, with some soluble P lost to the effluent as for options 2 and 3. So out of the 6.3 mg/L incoming TP, 3.0 mg/L is chemically precipitated and 1.0 leaves with the effluent. The remaining 2.3 mg/L is removed by clarification (for the particulate part) and through cell synthesis (soluble fraction). This portion can become struvite-precipitable downstream of anaerobic digestion. Option 4 then offers a struvite-precipitation potential of aboput 2.3/5.3=43% as compared to options 2 and 3. Important : phosphorus removal ability has not been taken into consideration in the capital nor operation costs nor NPV of the actual comparisons as it is part of the biosolid management plan.
1.6 Septage
The Program has been asked to consider that the septage handling will continue as it works today. Consequently, the septage and its characterisation are taken in consideration in inlet water quality. According to its volume, the septage doesn’t have a major impact in the wastewater treatment plant and in the achievement of the monthly average requirements. A daily variation will be noted, but this will be absorbed by the retention time of the plant. Anyway, if of interest, septage impacts can be mitigated by using an appropriate pre-treatment system as well as equalization tanks from where septage can be “dosed” to the main process stream.
1.7 Sludge handling
For sludge treatment, the Program has considered that no sludge treatment (even a dewatering step) was required for the comparison step.
WINNIPEG SEWAGE TREATMENT PROGRAM
SEWPCC – Answers to EAP report Page 16 of 17
1.8 Disinfection
We agree with the possibility to generate Chlorine or ozone on site for disinfection of the Wet weather flow line. Because this will be the same in every solution, this step was also very lightly studied at this stage of the project. It will be studied deeply during the detailed engineering of the final solution.
1.9 Preliminary treatment
C33 : Clarify the statement in the report: “Stantec report indicates existing PC depth of 4.3 m
while during our visit on site operator indicated 6 m depth”. Probably the operator included
the depth of sludge hopper P33 : No more of actuality. Depth of primary settlers has been verified on existing drawings. C34 : The expected efficiency of the primaries needs to be compared to present performance,
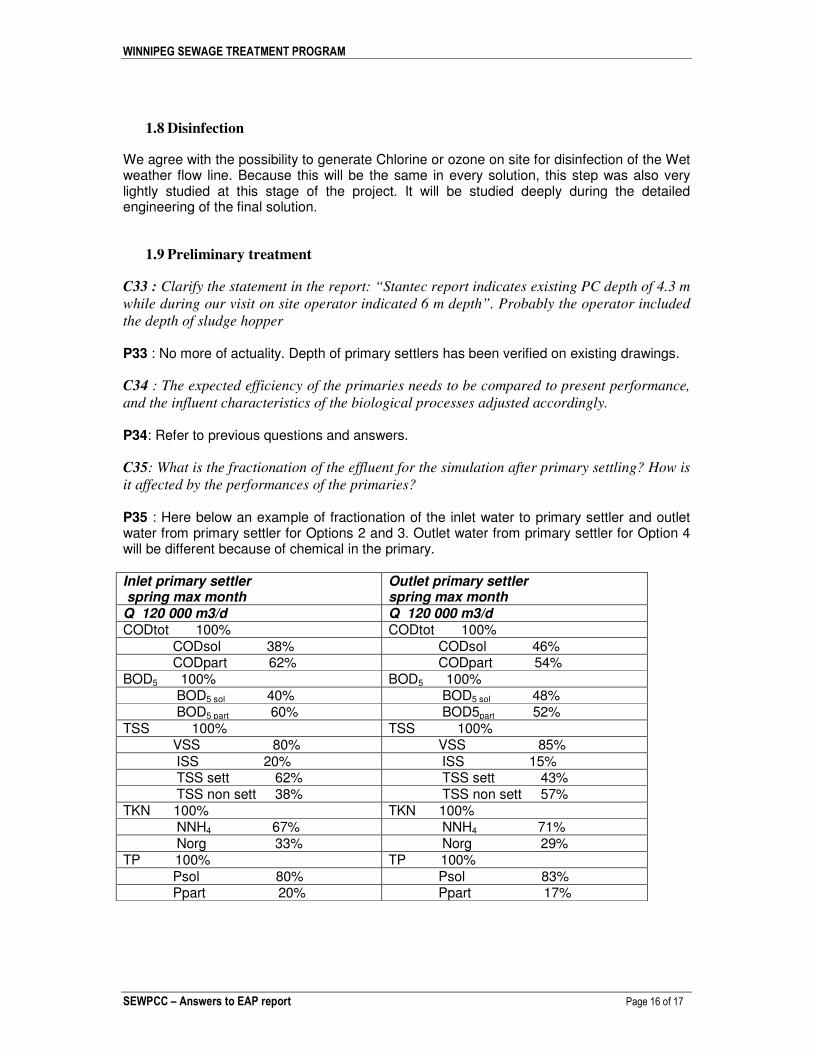
and the influent characteristics of the biological processes adjusted accordingly. P34: Refer to previous questions and answers. C35: What is the fractionation of the effluent for the simulation after primary settling? How is
it affected by the performances of the primaries?
P35 : Here below an example of fractionation of the inlet water to primary settler and outlet water from primary settler for Options 2 and 3. Outlet water from primary settler for Option 4 will be different because of chemical in the primary. Inlet primary settler spring max month
Outlet primary settler spring max month
Q 120 000 m3/d Q 120 000 m3/d CODtot 100% CODtot 100%
CODsol 38% CODsol 46% CODpart 62% CODpart 54% BOD5 100% BOD5 100% BOD5 sol 40% BOD5 sol 48% BOD5 part 60% BOD5part 52% TSS 100% TSS 100% VSS 80% VSS 85%
ISS 20% ISS 15% TSS sett 62% TSS sett 43% TSS non sett 38% TSS non sett 57% TKN 100% TKN 100% NNH4 67% NNH4 71% Norg 33% Norg 29% TP 100% TP 100%
Psol 80% Psol 83% Ppart 20% Ppart 17%
WINNIPEG SEWAGE TREATMENT PROGRAM
SEWPCC – Answers to EAP report Page 17 of 17
C36: Primary overflow rate is limited to 2.15 m/h, but without the new unit it would be 2.68
m/h – still not high – what are the consequences of slightly less quality in primary effluent?
P36 : Primary overflow rate is limited to 2.07 m/h. In case we eliminate the new unit, velocity will become 2.6 m/h. The consequence is the efficiency removal will be reduced of around 7-8% on TSS and 4%-5% on BOD5 and COD. The load going to the next step will be higher and thus the biological step will be designed bigger (at least 5%-7% more), not only civil works, but also the equipments, such as air supplier, diffusers, blowers, and so on. The Program believes it is more cost efficient to have a new primary instead of designing a bigger biological step. Anyway this could be studied more deeply during the detailed design of the retained solution.
1.10 Treatability studies and Pilot demonstration
Pilot units, especially for the Biostyr and Actiflo system, are available and could be used during the detailed engineering phase, and even during the construction phase to allow operators to get a better understanding of the technology being installed. This could be seen as part of the operators training before the actual plant commissioning.
1.11 Whole life costs
The replacement cost is very difficult to assess accurately at this early stage of the design, without PIDs and comprehensive equipment lists.