Embed Size (px)
Citation preview
1
Deliverable of the research project:
LANDSCAPE CAPACITY AND SOCIAL ATTITUDES TOWARDS WIND ENERGY PROJECTS IN BELGIUM
2006-2009
Belgian Science Policy – Science for a sustainable development Contract Number: SD/EN/01A
STATE OF THE ART OF WIND ENERGY IN BELGIUM AND EURO PE
Promoters:
Prof. A. Van Rompaey1 (coordinator) Prof S. Schmitz2
Prof. C. Kesteloot3
Scientific collaborators:
Karolien Peeters1, Bruno Moens1, Hendrik Van Hemelrijck1, Vincent Vanderheyden2, Maarten Loopmans3 and Steven Vanden Broucke3
1 Physical and Regional Geography Research Group – K.U.leuven
2 Social and Economic Geography Research Group – Université de Liège 3 Social and Economic Geography Research Group – K.U.Leuven
Project Website:
geo.kuleuven.be/geography/projects/lacsawep
2
Table of contents
Table of contents I
List of figures III
List of tables IV
Introduction p. 1
1 Wind energy in Belgium and Europe p. 2
1.1 Wind power capacity in the European Union and Belgium p. 2
1.2 Wind power developments in Belgium p. 7
1.3 Scenarios for the evolution of wind power in Belgium p. 10
2 Wind power outcomes in Belgium and neighbouring countries: 4 key p. 18
institutional explanations
2.1 Level and procedures of planning systems and decision making p. 18
2.1.1 The initiative p. 18
2.1.2 Actors involved in planning and decision-making p. 19
2.2 Attitudes towards the protection of landscape and nature p. 25
2.3 Financial support systems p. 28
2.3.1 Type p. 29
2.3.2 Stability and consistency of incentive regime p. 30
2.4 Patterns of ownership and involvement p. 32
3 Wind maps in Belgium, the Netherlands and the UK p. 38
3.1 Windplan Vlaanderen p. 38
3.2 Inpasbaarheidskaart windturbines West-Vlaanderen p. 39
3.3 Carte des contraintes paysagères et environnementales pour p. 40
l’implantation des éoliennes en région Wallonne
3.4 Suitable locations for wind turbine parks in the Netherlands in “Frisse p. 41
Wind door Nederland”

3
3.5 Sensitivity assessment of landscape character areas in Cornwall and p. 42
England and the vulnerability of these areas to the introduction of wind
turbines
Conclusion p. 45
References p. 47
Annex p. 51
Map 1 Windplan Vlaanderen Spatial map of Leuven (nr. 53) p. 51
Map 2 Inpasbaarheidskaart windturbines West-Vlaanderen p. 53
Map 3 Carte des contraintes paysagères et environnementales pour p. 54
l’implantation des éoliennes en region Wallonne
3a Overview of sensitivity to wind power developments p. 54
according to landscape/visual indicators
3b Overview of sensitivity to wind power developments p. 55
according to landscape/visual and environmental indicators
Map 4 Frisse Wind door Nederland p. 56
4 a Wind map Zuid-Holland p. 56
4 b Wind map the Netherlands p. 57
Map 5 Sensitivity assessment of landscape character areas in p. 58
Cornwall to wind power developments and the capacity of
these areas for wind turbine projects
5 a Sensitivity of landscape character areas to wind power p. 58
developments
5 b Areas with greatest potential for turbine development in p. 59
relation to landscape character
5 c Potentially suitable scales of windfarm developments in p. 60
relation to landform scale and landscape pattern in areas
with wind power potential

4
List of figures
Figure 1.1 Wind power capacity installed in the EU in 2006 in MW p. 3
Figure 1.2 Wind power capacity in kW per 1000 inhabitants in the EU p. 4
in 2006
Figure 1.3 Spatial penetration of wind power in the UK, the Netherlands, p. 5
Germany and Belgium in wind turbines per km²
Figure 1.4 Share of renewable energies in gross electrical p. 6
consumption in European Union countries in 2005 (in %)
Figure 1.5 Evolution of annual wind power capacity in MW in Belgium p. 7
Figure 1.6 Total wind power capacity in Belgium in MW per municipality p. 8
Figure 1.7 Total number of wind turbines in Belgium per municipality p. 9
Figure 1.8 Predicted growth of wind power capacity and wind power p. 14
electricity production onshore in Flanders according to 2
scenario’s (BAU and PRO)
Figure 1.9 Prediction of production of electricity from renewable energy p. 15
sources till 2020 according to BAU-scenario with low
growth of electricity demand
Figure 1.10 Prediction of production of electricity from renewable energy p. 16
sources till 2020 according to PRO-scenario with low
growth of electricity demand
Figure 3.1 Evaluation of landscape capacities for wind turbine p. 43
developments in England

5
List of tables
Table 1.1 Technical onshore wind power potential of European p. 11
OECD-countries
Table 1.2 Overview of existing and possible future (2010) wind power p. 13
projects in Flanders per province and per sector
Table 2.1 Policy shifts in the implementation of new renewable technologies p. 20
Table 2.2 Overview of planning regimes and decision-making in Belgium p. 24
Table 2.3 Suitability of locations for wind power developments in Flanders p. 26
Table 2.4 Overview of attitudes towards the protection of landscape and p. 28
nature in Belgium and neighbouring countries
Table 2.5 Overview of financial support systems in Belgium and other p. 32
countries
Table 2.6 Types of ownership and their share in the total wind power p. 35
capacity in Belgium and neighbouring countries
Table 2.7 Overview of types of ownership in Belgium and neighbouring p. 36
countries
1
Introduction
In this first report an overview will be given of the current status of the development of
wind power in Belgium.
In the first chapter we will examine the evolution of the development of wind power in
Belgium and compare this evolution to the situation in our neighbouring countries.
We will also look at the spatial implications of these different wind power evolutions in
Belgium and our neighbouring countries.
Further, we will give an overview of the current wind power capacity and the
achievements in Flanders and the Walloon Region. The evolution of this wind power
capacity and the future wind power projects which are to be realized in the nearby
future will also be discussed.
To conclude this chapter, we will also look at the prospects for wind power in Belgium
by means of different technical and spatial scenarios.
In the second chapter we will indicate the main institutional factors determining the
rate of development of wind power in Belgium and our neighbouring countries by
means of cross-country analyses. This chapter will help us during the second part of
the LACSAWEP-project where a qualitative analysis of the attitudes towards wind
power projects will be carried out.
In the third chapter we will discuss existing scientific projects which have been
developed in our country, the UK and the Netherlands, and which try to map the
possibilities for wind power developments exclusively by means of spatial, physical
and perceptual criteria. This chapter will introduce us to the first part of the
LACSAWEP-project where we will examine these relationships between physical and
perceptual criteria with regards to wind power projects in Belgium.
2
1 Wind energy in Belgium and in Europe
In this chapter the current situation of wind power in Belgium and the neighbouring
countries will be discussed.
First we will give an overview of wind power in Europe. We will look at the large wind
power countries, the evolution in this wind power capacity and the place of Belgium
among these European countries. The spatial implications of these different
evolutions will be mapped for Belgium and the neighbouring countries.
This will be followed by a closer look at the wind power developments in Belgium.
What is the current wind power capacity in Belgium and how has this evolved during
the last years? Where can we find wind turbines in Belgium, how large are they in
terms of capacity and number of wind turbines and what wind power projects are to
be realized in the nearby future.
Finally, we will look at the future of wind power in Belgium. By means of technical and
spatial prospects we will look at the different scenarios developed to predict the
evolution of wind power.
1.1 Wind power capacity in the European Union and B elgium
The European Union is still the main region of the world for wind power
developments with a wind power share of 66,8 % in 2006, followed by North America
with 18 % and Asia with 12,7 %.
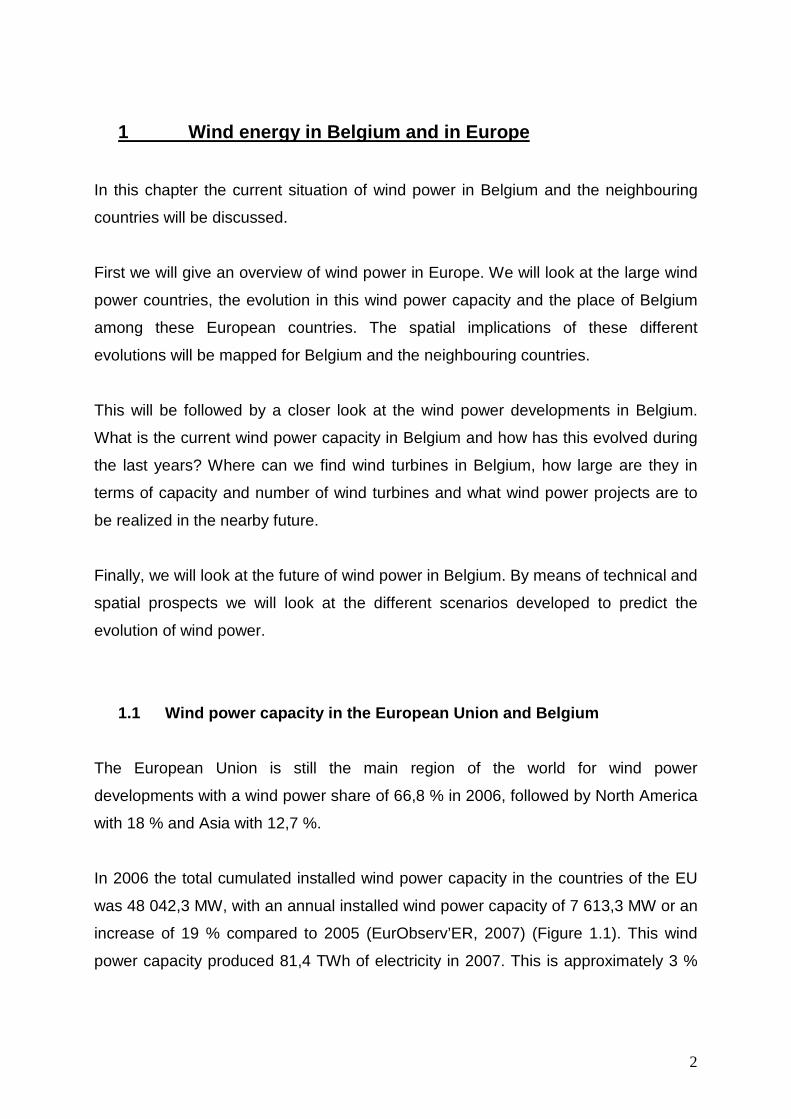
In 2006 the total cumulated installed wind power capacity in the countries of the EU
was 48 042,3 MW, with an annual installed wind power capacity of 7 613,3 MW or an
increase of 19 % compared to 2005 (EurObserv’ER, 2007) (Figure 1.1). This wind
power capacity produced 81,4 TWh of electricity in 2007. This is approximately 3 %
3
of the EU electricity production or almost the entire Belgian electricity consumption in
2004 (89,37 TWh).
Figure 1.1 Wind power capacity installed in the EU in 2006 in MW
Source: EurObserv’ER (2007). Wind energy barometer. EurObserv’ER, 02-2007,
Available on http://www.energies-
4
renouvelables.org/observer/stat_baro/observ/baro177.pdf [date of search: 01-03-
2007] [date of search: 01-03-2007]
If we look at the different countries of the EU, Germany is still the (global) leading
wind power country with a total installed capacity of 20 621,9 MW in 2006, followed
by Spain with 11 651,1 MW of wind power capacity, the wind power pioneer country
Denmark with 3 136,6 MW, Italy (2 123,4 MW), the UK (1 962,2 MW), Portugal (1
716,4 MW), France (1 635 MW) and the Netherlands (1 560 MW).
Belgium is situated on the 13th place in the EU wind power-ranking with a total wind
power capacity of 193,1 MW at the end of 2006 and an annual installed wind capacity
in 2006 of 35,3 MW or an increase of 23 % compared to 2005.
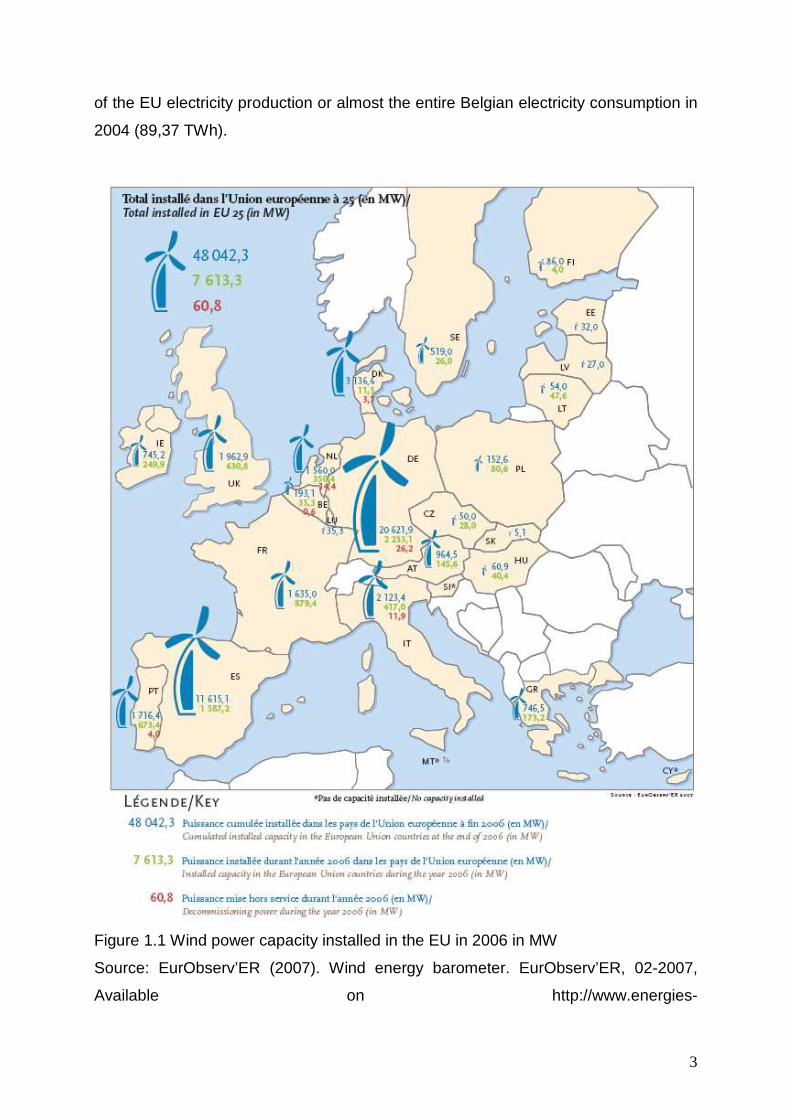
If we compare this total wind power capacity per country to the population of each
country, Belgium is located on the 15th place with a wind capacity of 18,5 kW per
1 000 inhabitants (Figure 1.2).
Denmark has the highest wind capacity per 1 000 inhabitants with 577,9 kW, followed
by Spain (265,4 kW) and Germany (250,1 kW).
Figure 1.2 Wind power capacity in kW per 1000 inhabitants in the EU in 2006
Source: EurObserv’ER (2007). Wind energy barometer. EurObserv’ER, 02-2007,
Available on http://www.energies-
5
renouvelables.org/observer/stat_baro/observ/baro177.pdf [date of search: 01-03-
2007]
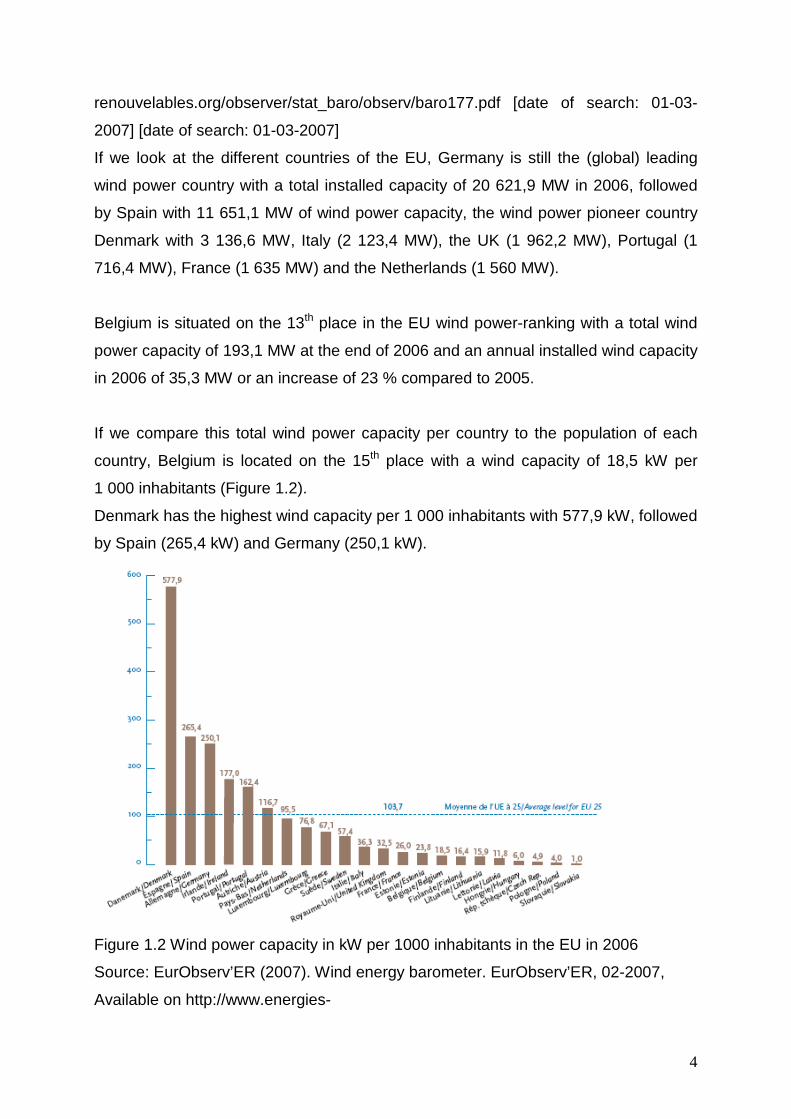
If we look at the spatial implications of the different wind power evolutions in Belgium,
the UK, the Netherlands and Germany in terms of the number of wind turbines per
km², this spatial penetration is still very limited in Belgium and the UK with less than
0,01 turbines per km². For Belgium this means less than 1 wind turbine per 100 km².
In the Netherlands and Germany this wind turbine density is (much) higher with a
penetration of 0,01 to 0,05 turbines per km² in the Netherlands and 0,05 to 0,1
turbines per km² in Germany.
In the third section of this chapter we will look at some scenarios for the development
of wind power in Belgium which will examine these spatial implications more into
detail.
Figure 1.3 Spatial penetration of wind power in the UK, the Netherlands, Germany
and Belgium in wind turbines per km²
6
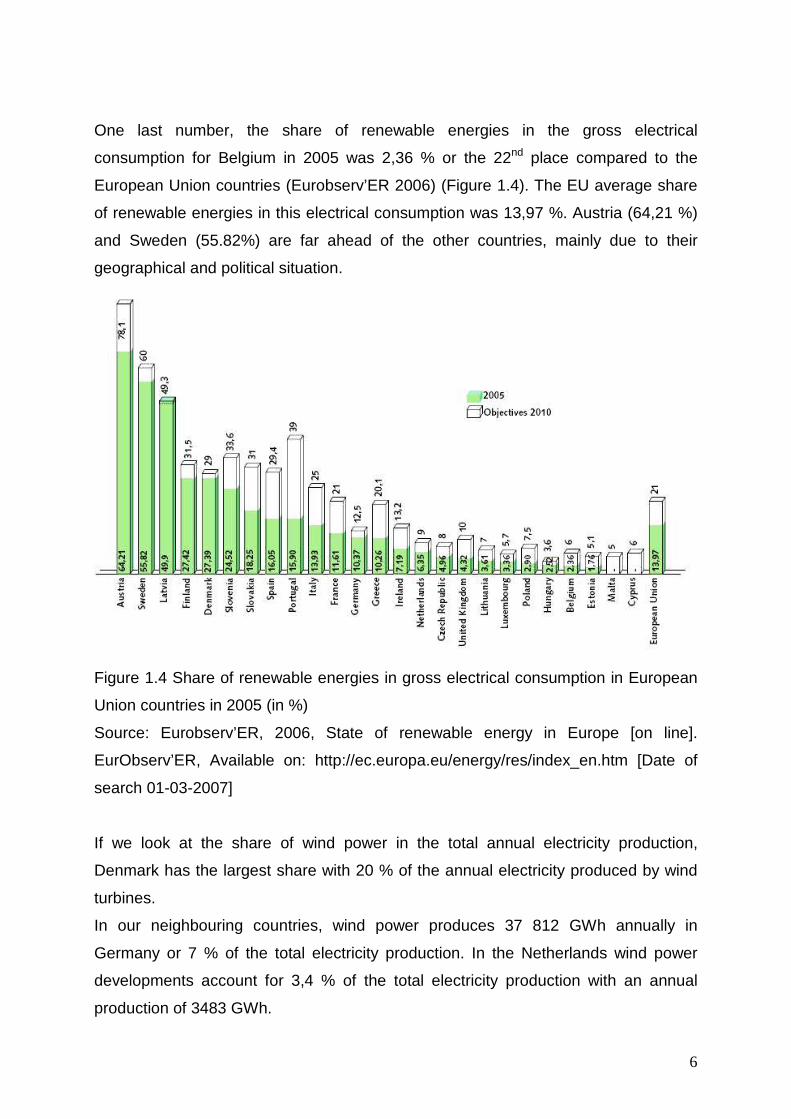
One last number, the share of renewable energies in the gross electrical
consumption for Belgium in 2005 was 2,36 % or the 22nd place compared to the
European Union countries (Eurobserv’ER 2006) (Figure 1.4). The EU average share
of renewable energies in this electrical consumption was 13,97 %. Austria (64,21 %)
and Sweden (55.82%) are far ahead of the other countries, mainly due to their
geographical and political situation.
Figure 1.4 Share of renewable energies in gross electrical consumption in European
Union countries in 2005 (in %)
Source: Eurobserv’ER, 2006, State of renewable energy in Europe [on line].
EurObserv’ER, Available on: http://ec.europa.eu/energy/res/index_en.htm [Date of
search 01-03-2007]
If we look at the share of wind power in the total annual electricity production,
Denmark has the largest share with 20 % of the annual electricity produced by wind
turbines.
In our neighbouring countries, wind power produces 37 812 GWh annually in
Germany or 7 % of the total electricity production. In the Netherlands wind power
developments account for 3,4 % of the total electricity production with an annual
production of 3483 GWh.
7
Belgium has a total electricity production by wind power of 378 GWh or 0,4 % of the
total annual electricity production.
In the next section we will look at this development of wind power in Belgium more
into detail.
1.2 Wind power developments in Belgium
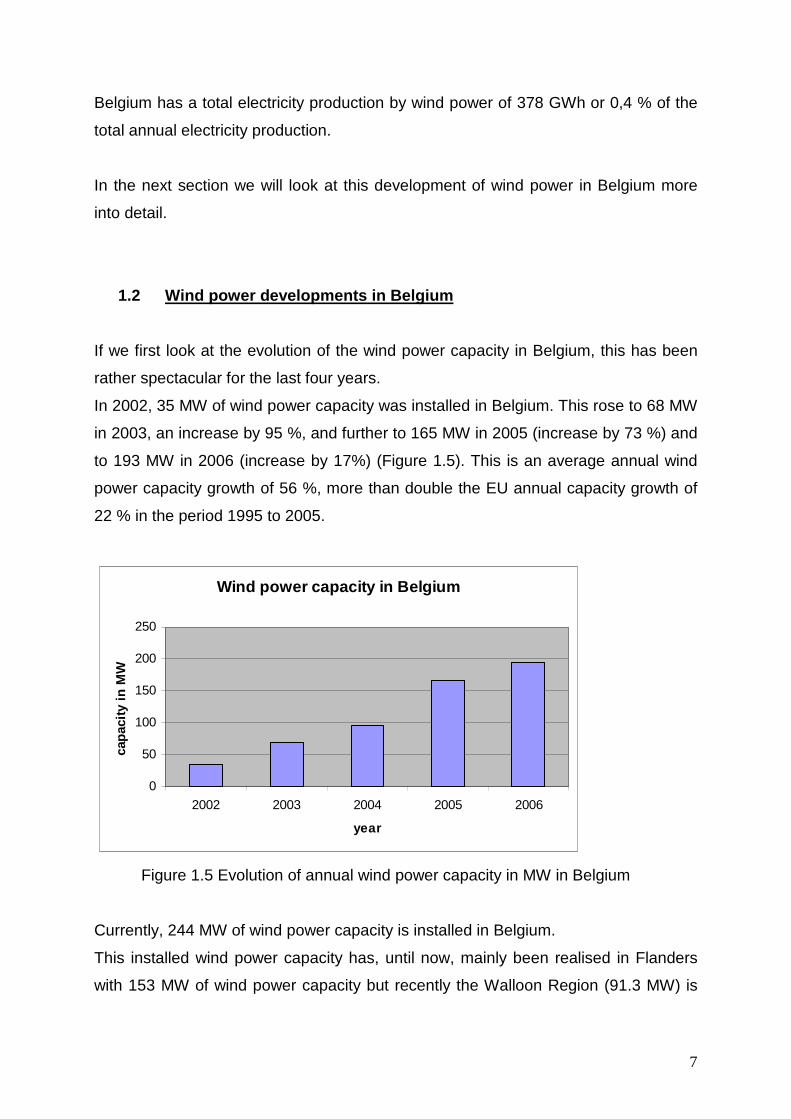
If we first look at the evolution of the wind power capacity in Belgium, this has been
rather spectacular for the last four years.
In 2002, 35 MW of wind power capacity was installed in Belgium. This rose to 68 MW
in 2003, an increase by 95 %, and further to 165 MW in 2005 (increase by 73 %) and
to 193 MW in 2006 (increase by 17%) (Figure 1.5). This is an average annual wind
power capacity growth of 56 %, more than double the EU annual capacity growth of
22 % in the period 1995 to 2005.
Wind power capacity in Belgium
0
50
100
150
200
250
2002 2003 2004 2005 2006
year
capa
city
in M
W
Figure 1.5 Evolution of annual wind power capacity in MW in Belgium
Currently, 244 MW of wind power capacity is installed in Belgium.
This installed wind power capacity has, until now, mainly been realised in Flanders
with 153 MW of wind power capacity but recently the Walloon Region (91.3 MW) is
8
catching up with a number of large wind power projects to be realized in the nearby
future.
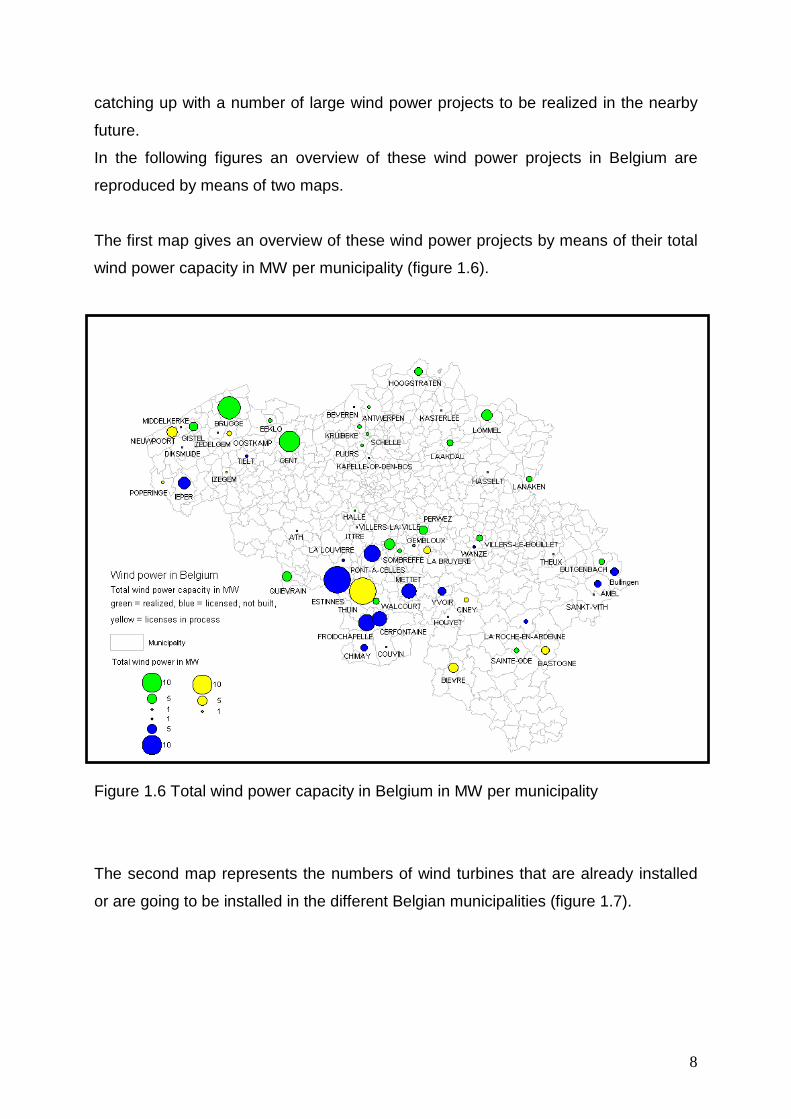
In the following figures an overview of these wind power projects in Belgium are
reproduced by means of two maps.
The first map gives an overview of these wind power projects by means of their total
wind power capacity in MW per municipality (figure 1.6).
Figure 1.6 Total wind power capacity in Belgium in MW per municipality
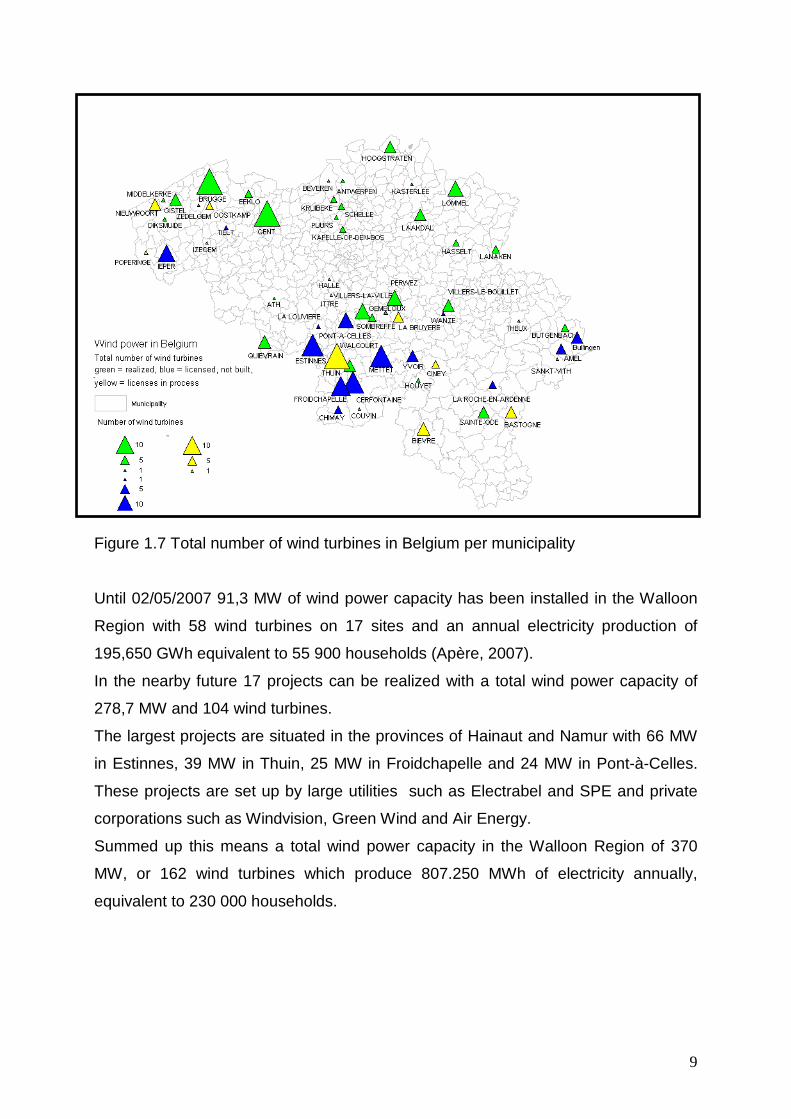
The second map represents the numbers of wind turbines that are already installed
or are going to be installed in the different Belgian municipalities (figure 1.7).
9
Figure 1.7 Total number of wind turbines in Belgium per municipality
Until 02/05/2007 91,3 MW of wind power capacity has been installed in the Walloon
Region with 58 wind turbines on 17 sites and an annual electricity production of
195,650 GWh equivalent to 55 900 households (Apère, 2007).
In the nearby future 17 projects can be realized with a total wind power capacity of
278,7 MW and 104 wind turbines.
The largest projects are situated in the provinces of Hainaut and Namur with 66 MW
in Estinnes, 39 MW in Thuin, 25 MW in Froidchapelle and 24 MW in Pont-à-Celles.
These projects are set up by large utilities such as Electrabel and SPE and private
corporations such as Windvision, Green Wind and Air Energy.
Summed up this means a total wind power capacity in the Walloon Region of 370
MW, or 162 wind turbines which produce 807.250 MWh of electricity annually,
equivalent to 230 000 households.
10
In Flanders 153 MW of wind power capacity has been installed with 117 wind
turbines on 23 sites. These produced 238 GWh of electricity or an equivalent of 120
000 households (Energiesparen, 2007).
Most of the future wind power projects in Flanders are located in the western part of
Flanders with the largest in Nieuwpoort with 15 MW, Oostkamp with 7,2 MW, Ieper
with 18 MW and Poperinge with 4 MW. The capacity of the already existing wind
turbine parks of Brugge, Gent and especially Antwerpen is planned to be enlarged
with additional wind turbines, with up to 200 MW of extra wind power capacity in
Antwerp.
In the nearby future a cumulative number of 200 MW of wind power capacity can be
installed onshore in Flanders with an annual average electricity production of 440
GWh equivalent to 110 000 households.
Summed up this means a total wind power capacity of 350 MW or a total annual
electricity production of 700 GWh equivalent to 175 000 households.
The total wind power capacity in Belgium has known a rapid growth during the last
five years. In the next section we will examine some technical and spatial scenarios
that predict the future of wind power in Belgium.
1.3 Scenarios for the evolution of wind power in Be lgium
A first prediction of the wind power technical potential for Belgium can be found in the
European-wide estimation of the onshore wind potent ial by Van Wijk and
Coelingh (EWEA, 2005).
In this study the technical wind potential of the OECD-countries of Europe is
predicted using meteorological (minimum average wind speed of 5.1 m/s on site) and
spatial criteria (maximum 4 % of the area suitable for wind power projects, with a
maximum wind power capacity per km² of 8 MW) (Table 1.1).

11
Table 1.1 Technical onshore wind power potential of European OECD-countries
Source: European WindEnergy Association (2005), Windenergy: the facts. EWEA,
Available on http://www.ewea.org/fileadmin/ewea_documents/documents/
publications/WETF/WETF.pdf [date of search: 15-04-2007]
According to this study, the technical onshore wind power potential of Belgium is 5
TWh of electricity, or approximately 1000 wind turbines of 2 MW each. This is
equivalent to 6 % of the total annual electricity consumption. The annual electricity
produced from wind power in 2002 was 0.088 TWh in Belgium, or 2 % of this
12
technical potential. Currently, this is approximately 0.4 TWh or 8 % of the technical
potential.
According to this study, Germany has been able to use most of the present technical
onshore wind power potential with 77 %.
The UK, France and Spain still have a large technical potential which hasn’t been
used yet by the first two countries (EWEA, 2004).
These technical onshore wind power potentials have already been increased for the
European countries because of further technological developments.
A second prediction of the future of wind power in Flanders is the recent study of the
VITO, Flemish Institute of Technological Development, and 3 E: Prognoses for
renewable energy till 2020 (VITO, 2005).
In this study several mid- and long-term scenarios for the development of wind power
in Flanders have been developed based on different political, economical, technical
and spatial assumptions.
Till 2010 the study describes one scenario for onshore wind power in Flanders.
For each province and each type of area (areas where wind turbines have a limited
visual impact such as harbours and areas where this impact is expected to be higher)
an overview is given based on already planned projects and projects which have
been evaluated as realistically. These precise numbers can be found in table 1.1.
In the nearby future, mainly the harbours of Gent (20 turbines of 3 MW) Antwerpen
(43 turbines of 3 MW) and Zeebrugge (7 turbines of 2 MW) will be equipped with
additional wind turbine parks with a total extra wind power capacity of 196 MW.
The other non-harbour areas in the provinces of West-Vlaanderen, Oost-Vlaanderen,
Antwerpen and Limburg have suitable locations for an extra 97 wind turbines and a
total extra wind power capacity of 237,2 MW. 39 of these turbines will need new
spatial designation plans (RUP’s) to make their locations suitable for this
development.
13
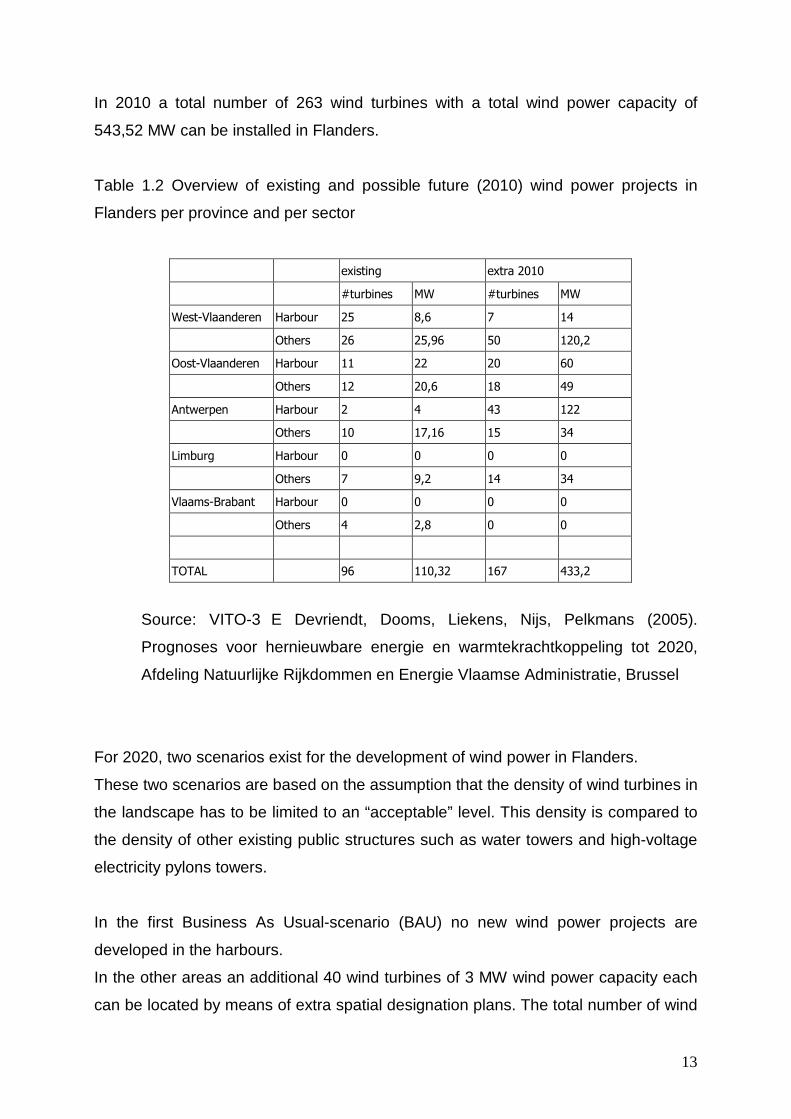
In 2010 a total number of 263 wind turbines with a total wind power capacity of
543,52 MW can be installed in Flanders.
Table 1.2 Overview of existing and possible future (2010) wind power projects in
Flanders per province and per sector
existing extra 2010
#turbines MW #turbines MW
West-Vlaanderen Harbour 25 8,6 7 14
Others 26 25,96 50 120,2
Oost-Vlaanderen Harbour 11 22 20 60
Others 12 20,6 18 49
Antwerpen Harbour 2 4 43 122
Others 10 17,16 15 34
Limburg Harbour 0 0 0 0
Others 7 9,2 14 34
Vlaams-Brabant Harbour 0 0 0 0
Others 4 2,8 0 0
TOTAL 96 110,32 167 433,2
Source: VITO-3 E Devriendt, Dooms, Liekens, Nijs, Pelkmans (2005).
Prognoses voor hernieuwbare energie en warmtekrachtkoppeling tot 2020,
Afdeling Natuurlijke Rijkdommen en Energie Vlaamse Administratie, Brussel
For 2020, two scenarios exist for the development of wind power in Flanders.
These two scenarios are based on the assumption that the density of wind turbines in
the landscape has to be limited to an “acceptable” level. This density is compared to
the density of other existing public structures such as water towers and high-voltage
electricity pylons towers.
In the first Business As Usual-scenario (BAU) no new wind power projects are
developed in the harbours.
In the other areas an additional 40 wind turbines of 3 MW wind power capacity each
can be located by means of extra spatial designation plans. The total number of wind
14
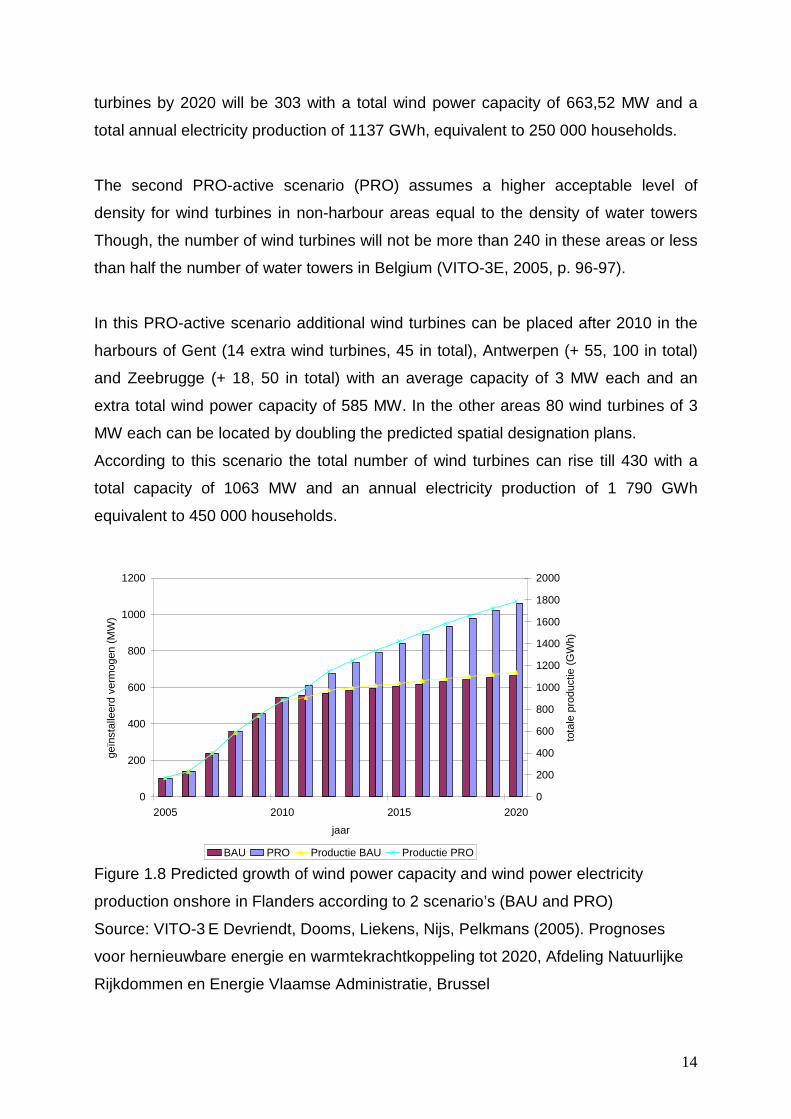
turbines by 2020 will be 303 with a total wind power capacity of 663,52 MW and a
total annual electricity production of 1137 GWh, equivalent to 250 000 households.
The second PRO-active scenario (PRO) assumes a higher acceptable level of
density for wind turbines in non-harbour areas equal to the density of water towers
Though, the number of wind turbines will not be more than 240 in these areas or less
than half the number of water towers in Belgium (VITO-3E, 2005, p. 96-97).
In this PRO-active scenario additional wind turbines can be placed after 2010 in the
harbours of Gent (14 extra wind turbines, 45 in total), Antwerpen (+ 55, 100 in total)
and Zeebrugge (+ 18, 50 in total) with an average capacity of 3 MW each and an
extra total wind power capacity of 585 MW. In the other areas 80 wind turbines of 3
MW each can be located by doubling the predicted spatial designation plans.
According to this scenario the total number of wind turbines can rise till 430 with a
total capacity of 1063 MW and an annual electricity production of 1 790 GWh
equivalent to 450 000 households.
0
200
400
600
800
1000
1200
2005 2010 2015 2020
jaar
geïn
stal
leer
d ve
rmog
en (
MW
)
0
200
400
600
800
1000
1200
1400
1600
1800
2000to
tale
pro
duct
ie (
GW
h)
BAU PRO Productie BAU Productie PRO Figure 1.8 Predicted growth of wind power capacity and wind power electricity
production onshore in Flanders according to 2 scenario’s (BAU and PRO)
Source: VITO-3 E Devriendt, Dooms, Liekens, Nijs, Pelkmans (2005). Prognoses
voor hernieuwbare energie en warmtekrachtkoppeling tot 2020, Afdeling Natuurlijke
Rijkdommen en Energie Vlaamse Administratie, Brussel
15
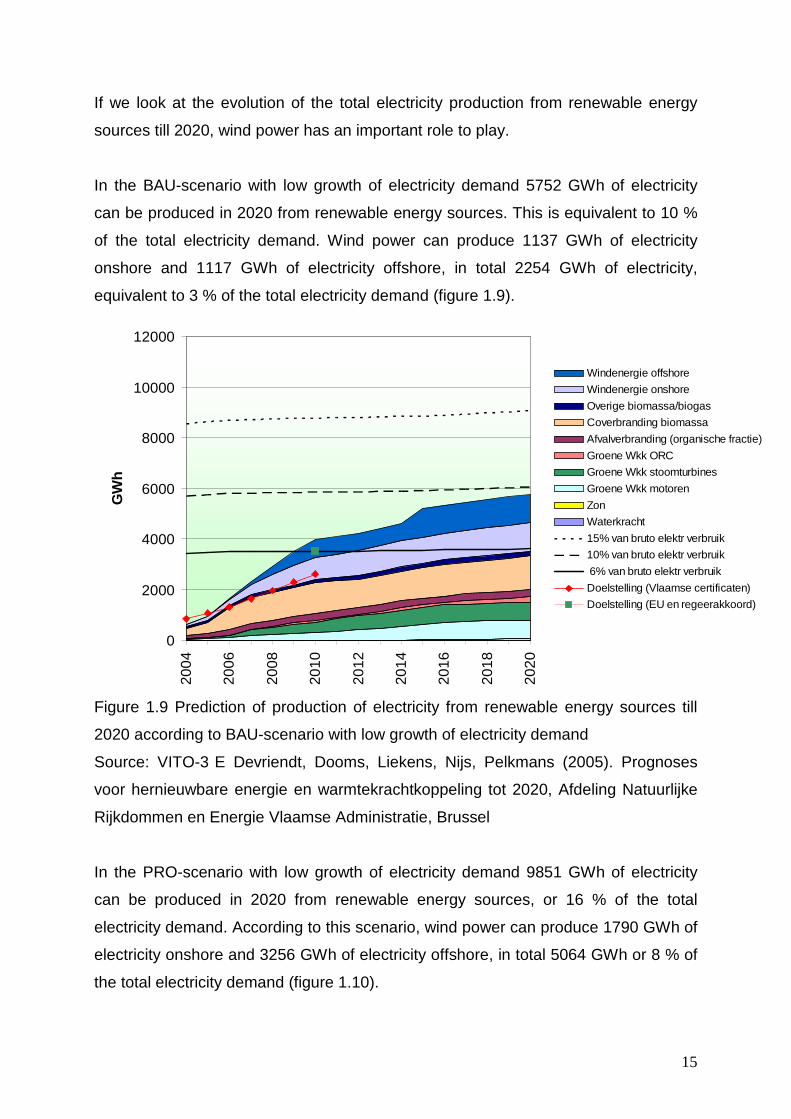
If we look at the evolution of the total electricity production from renewable energy
sources till 2020, wind power has an important role to play.
In the BAU-scenario with low growth of electricity demand 5752 GWh of electricity
can be produced in 2020 from renewable energy sources. This is equivalent to 10 %
of the total electricity demand. Wind power can produce 1137 GWh of electricity
onshore and 1117 GWh of electricity offshore, in total 2254 GWh of electricity,
equivalent to 3 % of the total electricity demand (figure 1.9).
0
2000
4000
6000
8000
10000
12000
2004
2006
2008
2010
2012
2014
2016
2018
2020
GW
h
Windenergie offshore
Windenergie onshore
Overige biomassa/biogas
Coverbranding biomassa
Afvalverbranding (organische fractie)
Groene Wkk ORC
Groene Wkk stoomturbines
Groene Wkk motoren
Zon
Waterkracht
15% van bruto elektr verbruik
10% van bruto elektr verbruik
6% van bruto elektr verbruik
Doelstelling (Vlaamse certificaten)
Doelstelling (EU en regeerakkoord)
Figure 1.9 Prediction of production of electricity from renewable energy sources till
2020 according to BAU-scenario with low growth of electricity demand
Source: VITO-3 E Devriendt, Dooms, Liekens, Nijs, Pelkmans (2005). Prognoses
voor hernieuwbare energie en warmtekrachtkoppeling tot 2020, Afdeling Natuurlijke
Rijkdommen en Energie Vlaamse Administratie, Brussel
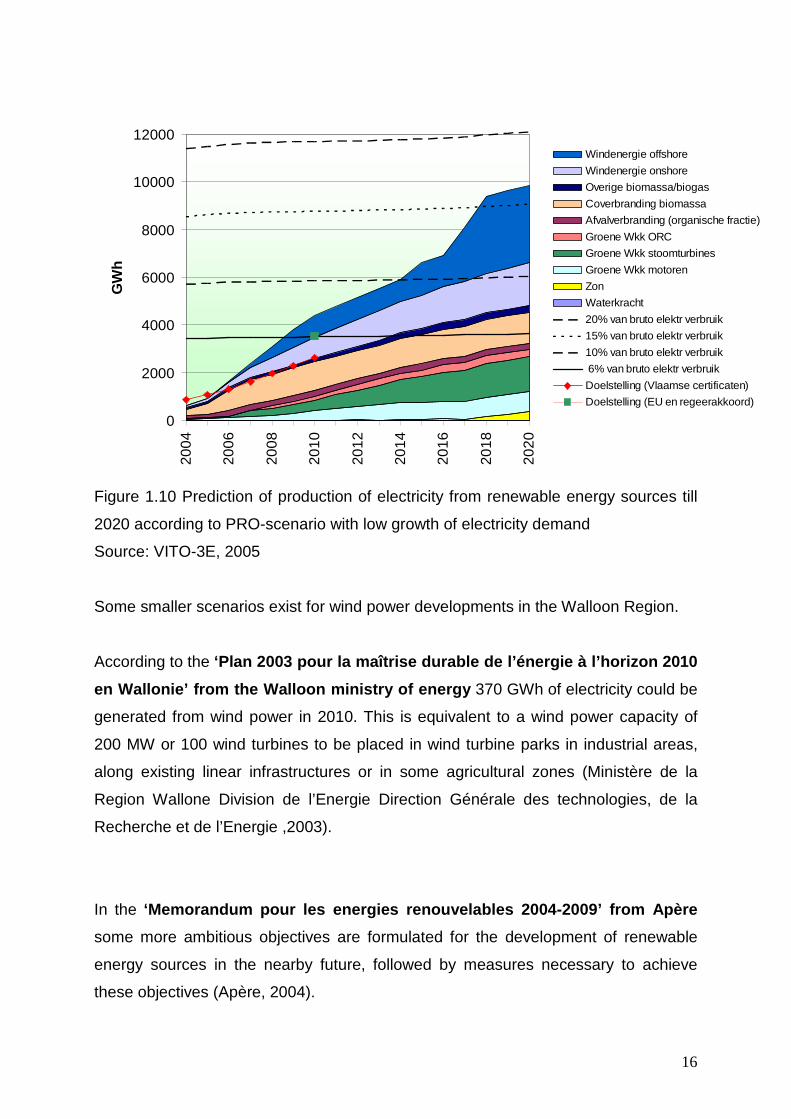
In the PRO-scenario with low growth of electricity demand 9851 GWh of electricity
can be produced in 2020 from renewable energy sources, or 16 % of the total
electricity demand. According to this scenario, wind power can produce 1790 GWh of
electricity onshore and 3256 GWh of electricity offshore, in total 5064 GWh or 8 % of
the total electricity demand (figure 1.10).
16
0
2000
4000
6000
8000
10000
12000
2004
2006
2008
2010
2012
2014
2016
2018
2020
GW
h
Windenergie offshore
Windenergie onshore
Overige biomassa/biogas
Coverbranding biomassa
Afvalverbranding (organische fractie)
Groene Wkk ORC
Groene Wkk stoomturbines
Groene Wkk motoren
Zon
Waterkracht
20% van bruto elektr verbruik
15% van bruto elektr verbruik
10% van bruto elektr verbruik
6% van bruto elektr verbruik
Doelstelling (Vlaamse certificaten)
Doelstelling (EU en regeerakkoord)
Figure 1.10 Prediction of production of electricity from renewable energy sources till
2020 according to PRO-scenario with low growth of electricity demand
Source: VITO-3E, 2005
Some smaller scenarios exist for wind power developments in the Walloon Region.
According to the ‘Plan 2003 pour la maîtrise durable de l’énergie à l’horizon 2010
en Wallonie’ from the Walloon ministry of energy 370 GWh of electricity could be
generated from wind power in 2010. This is equivalent to a wind power capacity of
200 MW or 100 wind turbines to be placed in wind turbine parks in industrial areas,
along existing linear infrastructures or in some agricultural zones (Ministère de la
Region Wallone Division de l’Energie Direction Générale des technologies, de la
Recherche et de l’Energie ,2003).
In the ‘Memorandum pour les energies renouvelables 2004-20 09’ from Apère
some more ambitious objectives are formulated for the development of renewable
energy sources in the nearby future, followed by measures necessary to achieve
these objectives (Apère, 2004).
17
For the development of wind power this means that 400 MW of wind power capacity
could be installed by 2009 by improving the planning regimes for wind turbines, by
reinforcing the power grid and by developing information campaigns to improve the
social acceptability of wind turbines.
A second objective for wind power in the Walloon Region states that by 2020 1500
MW of wind power could be installed onshore in accordance with the spatial
regulations. These could produce 3 000 GWh annually, or 12 % of the total electricity
production in 2000. This can be achieved if the power grid will be improved and the
reserved areas for air movements will be adapted (Apère, 2004).
In this chapter we have examined the actual wind power capacity in Belgium and
compared this to other European countries. Belgium is located on the 13th place in
the EU wind power capacity ranking with an actual installed capacity of 244 MW and
an annual capacity increase of 56 % over the last five years.
We also looked at the wind power projects that have already been realised in
Belgium and projects that are to be realized in the nearby future, especially in the
Walloon Region.
Finally, we discussed the prospects of wind power developments in Belgium by
means of one general scenario for the technical onshore potential for wind power in
Belgium followed by three scenarios for Flanders, one till 2010 and the BAU- and
PRO-scenario till 2020 and two scenarios for the Walloon Region.
In the next chapter, we will examine the different economical, political and social
institutional factors that determine these differences in wind power outcomes in
Belgium and the neighbouring countries. These factors were studied in several
international cross-country studies and are especially relevant when we will examine
the different attitudes and their evolution with regards to wind power projects in
Belgium in the second part of the LACSAWEP-project.

18
2 Wind power outcomes in Belgium and neighbouring c ountries:
4 key institutional explanations
In the first chapter we described the current situation of wind power in Belgium and
the neighbouring countries.
In this second chapter we will examine the key explanations for these differences in
the development of wind power projects in Belgium and other European countries by
means of literature and an analysis of the Belgian situation.
A cross-country comparative study to be published in Renewable and Sustainable
Energy Reviews of Toke, Breukers and Wolsink between Denmark, Spain, Germany,
Scotland, the Netherlands and England determined four institutional variables that
have a crucial influence on the development of wind power (Toke, Breukers, Wolsink,
2008).
These are:
1 The level and the procedures of planning systems and decision-making
2 The attitudes towards landscape and nature (protection organisations)
3 The financial support system for wind power projects
4 The ownership and involvement patterns
These will be explained and analyzed for the Belgian situation in the following points.
2.1 Level and procedures of planning systems and de cision making
Planning systems and the way decisions are made with regards to wind power
projects have a crucial impact on their outcomes. Several aspects of these planning
systems can be determined.
2.1.1 The initiative
Who is responsible for the planning of wind power projects and the designation of
suitable areas for wind turbines?
19
In Germany, municipalities are required to designate suitable areas for wind
development. Where municipalities haven’t indicated these areas, developers are
free to develop a wind power scheme anywhere outside the build-up area (Toke,
2008). This is called the Priviligierung or preferential treatment.
In Denmark, local municipalities have also been obliged to allocate zones for wind
power development. During this planning phase, regional authorities, local non-
governmental organisations and utilities have to be involved.
By contrast, in the Netherlands, wind power schemes require pro-active decisions
from local authorities because very often the zoning scheme has to be changed. All is
dependent on the personal opinion and initiative of the local councillors.
This is similar to the Belgian situation where no federal or regional wind power
schemes exist, but very much is dependent on the opinion of the political and
administrative authorities of municipalities and higher levels of governance.
2.1.2 Actors involved in planning and decision-making
Planning regimes can support collaborative practices of decision making. These
collaborative practices where a large number of partners are involved in the planning
and decision making are important since the degree of planning acceptance is largely
a function of the degree of local acceptance. The involvement of local interests from
inside the community aids to avoid opposition from qualitative local oppositional
groups by discussion and adaptation of the project characteristics and helps to
improve local trust in the projects proposed (Toke, Breukers, Wolsink, 2008).
A cross-country analysis of the wind power achievements of the Netherlands,
England and the German state of North Rhine Westphalia found that recently neither
of these cases foster collaborative approaches in their formal planning institutions
(Breukers, Wolsink, 2007). The general trend in planning is to prioritise the ‘common
good’ (fighting climate change) over and above local concerns. This results in
increasing opposition for example in the German case.
20
A successful strategy for the development of wind power is to implement wind power
as good as possible by institutionalising these collaborative approaches in the project
planning and through facilitating local ownership. Knowledge about the different
motives for support as well as motives for opposition will be revealed through this
participation of all relevant actors and should reveal the local environmental,
economic and landscape interests that are relevant at the level of implementation
(Breukers, Wolsink, 2007). These motives for the support as well as the opposition
against wind power projects in Belgium will also be studied in the second qualitative
part of the LACSAWEP-project.
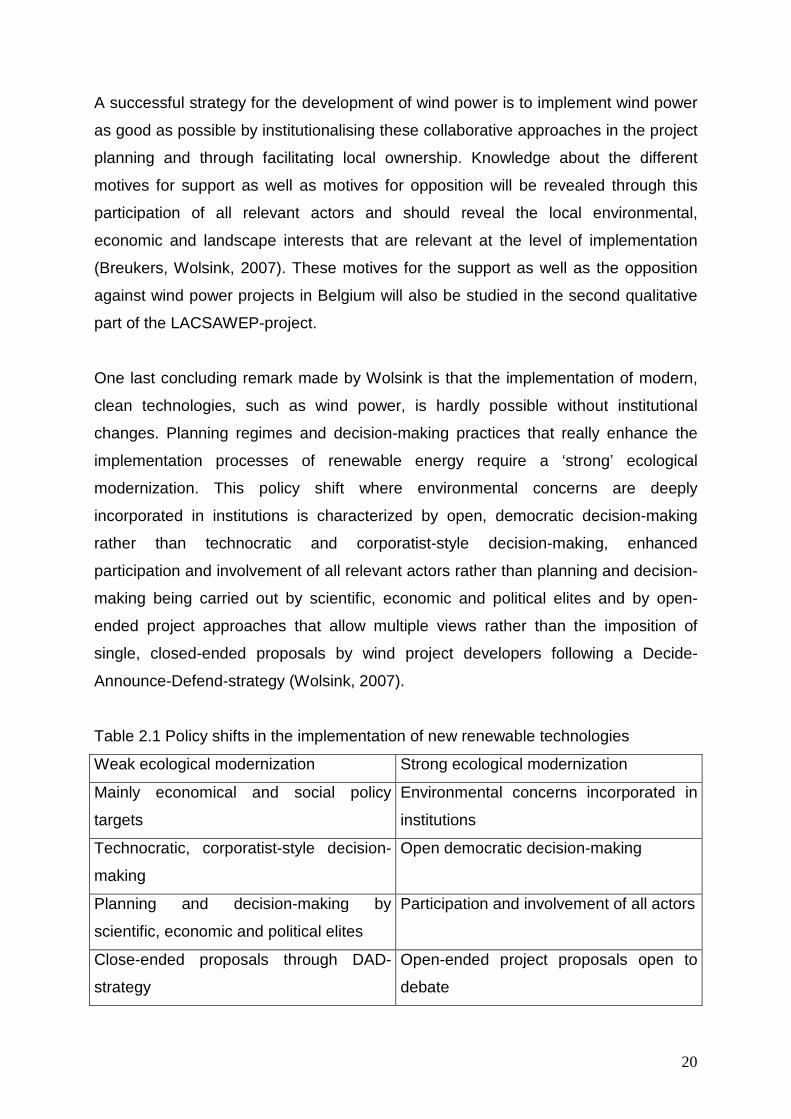
One last concluding remark made by Wolsink is that the implementation of modern,
clean technologies, such as wind power, is hardly possible without institutional
changes. Planning regimes and decision-making practices that really enhance the
implementation processes of renewable energy require a ‘strong’ ecological
modernization. This policy shift where environmental concerns are deeply
incorporated in institutions is characterized by open, democratic decision-making
rather than technocratic and corporatist-style decision-making, enhanced
participation and involvement of all relevant actors rather than planning and decision-
making being carried out by scientific, economic and political elites and by open-
ended project approaches that allow multiple views rather than the imposition of
single, closed-ended proposals by wind project developers following a Decide-
Announce-Defend-strategy (Wolsink, 2007).
Table 2.1 Policy shifts in the implementation of new renewable technologies
Weak ecological modernization Strong ecological modernization
Mainly economical and social policy
targets
Environmental concerns incorporated in
institutions
Technocratic, corporatist-style decision-
making
Open democratic decision-making
Planning and decision-making by
scientific, economic and political elites
Participation and involvement of all actors
Close-ended proposals through DAD-
strategy
Open-ended project proposals open to
debate
21
Source: Wolsink M., Planning of renewables schemes: Deliberative and fair decision-
making on landscape issues instead of reproachful accusations of non-cooperation
(2007), Energy Policy, 35, 2692-2704
Let us now examine the existing procedures in the different regions of Belgium with
regards to wind power developments (Table 2.2).
In Flanders , 2 licenses have to be obtained for wind turbine projects: an
environmental license and a spatial planning license. If the capacity of the project is
not higher than 5 MW, the municipality can decide whether an environmental license
will be granted. Aspects such as sound, safety, blade shade and light reflections of
the wind turbines will be examined, together with a public inquiry. If a project is well
prepared and communicated to the community and the political decision makers, this
license is likely to be granted without major obstacles.
The second spatial planning license is the most difficult license to obtain. Higher
administrative institutions such as the regional administration for spatial planning will
evaluate the spatial impact of the wind project as examined in the localisation or site
note prepared by the wind project developer. For this evaluation some guidelines are
developed in a recently adapted advising legal document of the Flemish government:
Omzendbrief 2006 Afwegingskader en randvoorwaarden voor de inplanting van
windturbines (Vlaamse regering, 2006).
An important guideline for this spatial evaluation is the principle of spatial
concentration or the clustering principle. This is explained as either the concentration
of wind turbines close to already existing centres of industrial activity, proportional to
the size and importance of these centres, also called site sharing, or the spatial
clustering of wind turbines with existing large, linear infrastructures such as rail roads,
motorways, canals, rivers, high voltage power lines which already have important
spatial and visual impacts on the landscape, also called visual impact sharing.
According to these guidelines, the most suitable areas for wind turbine projects are
industrial areas and harbours, areas for small businesses and areas of public utility.
Agricultural areas are only possible if there is already a significant interference of the

22
original spatial functions of these areas by other existing structures such as roads or
canals and the wind turbine project can be clustered with these structures. To make
these areas suitable for wind power projects their locations have to be defined in
special spatial plans on a municipal, provincial and sometimes even regional level, a
procedure which can take several years.
Areas with special landscape or natural features are also excluded from possible
locations.
An interdepartmental regional wind commission with representatives of the
administrative authorities can advice project developers on the feasibility of their
project before the start of their licensing procedure. It also formulates advices on the
requested licenses during this procedure and has a third duty to make a pro-active
selection of suitable sites for large scale wind turbine parks in Flanders.
The realisation of wind power projects in Flanders is subject to complex political and
administrative procedures with just a limited role for the public communities where
these projects will be realized. This has caused the realization of wind power projects
by mainly larger companies or utilities. Some smaller cooperatives, such as
Ecopower, BeauVent and Wase Wind, have nevertheless been able to develop wind
power projects with more participation by the local community resulting in higher local
support for these projects. This will be discussed further when we will examine the
involvement and the ownership of wind power projects in Belgium.
In the Walloon Region , the environmental and town-planning licenses are combined
into one construction and exploitation license, the ‘permis unique’.
The first step in this procedure is the organisation of an information and consultation
meeting for the general public of the municipality where the wind power project will be
realized. During this meeting the public is informed of the project. Important
environmental issues for the future environmental impact assessment will be
presented during this meeting as well as possible solutions to overcome these
potential environmental problems. Finally, the public can express its opinion and
suggestions with regards to this project.
23
In a second step, one document containing all the elements for the spatial planning
and environmental license, such as the environmental impact assessment, has to be
sent to the regional administrations where the project will be evaluated according to
the existing guidelines.
These guidelines are found in the Walloon legal document ‘Cadre de référence pour
l’implantation d’ éoliennes en Région Wallonne’ of 2002.
The principles are also based on the regrouping or clustering principle,as in Flanders,
but the principle of site sharing is also explicitly possible for agricultural regions and
rural housing areas if the wind turbine park has no significant negative impact on
these other rural functions. Because of these possibilities, most of the future wind
power projects in the Walloon Region are planned in large agricultural areas.
The second principle of visual impact sharing makes the clustering of wind turbines
with existing large, linear infrastructures possible as well.
This integration of wind turbine parks in the landscape has to be examined in an
environmental impact assessment where the characteristics of the landscape
involved have to be described, as well as the vulnerability of the landscape to wind
turbines and the possible effects of wind turbines in this landscape.
This impact on the landscape can be minimized according to the characteristics of
this region.
In more urbanised regions, the existing infrastructures can be underlined by the
geometrical formations of wind turbine parks.
In more natural regions, wind turbines should be placed in more ‘natural’, organical
formations, without the use of clear linear formations.
An interadministrative and pluridisciplinary regional wind cell has to serve as a
consulting authority to assure the coherence in the deliverance of the licenses.
This procedure seems to create more clarity and possibilities for wind power projects
due to the construction of the ‘permis unique’.
The involvement of the local community from the beginning of the project also forces
wind power project developers to communicate openly to the local communities.
These collaborative, consulting practices nevertheless haven’t resulted in the
24
development of more locally owned wind power projects set up by farmers and co-
operatives, except for some small initiatives such as Vents d’Houyet/Allons en vent
and Energie 2030. In the nearby future large wind turbine parks will be realized by
large to medium-large companies and utilities mainly in agricultural areas in the
Walloon Region. Apparently, some important incentives for community owned wind
power projects are still lacking.
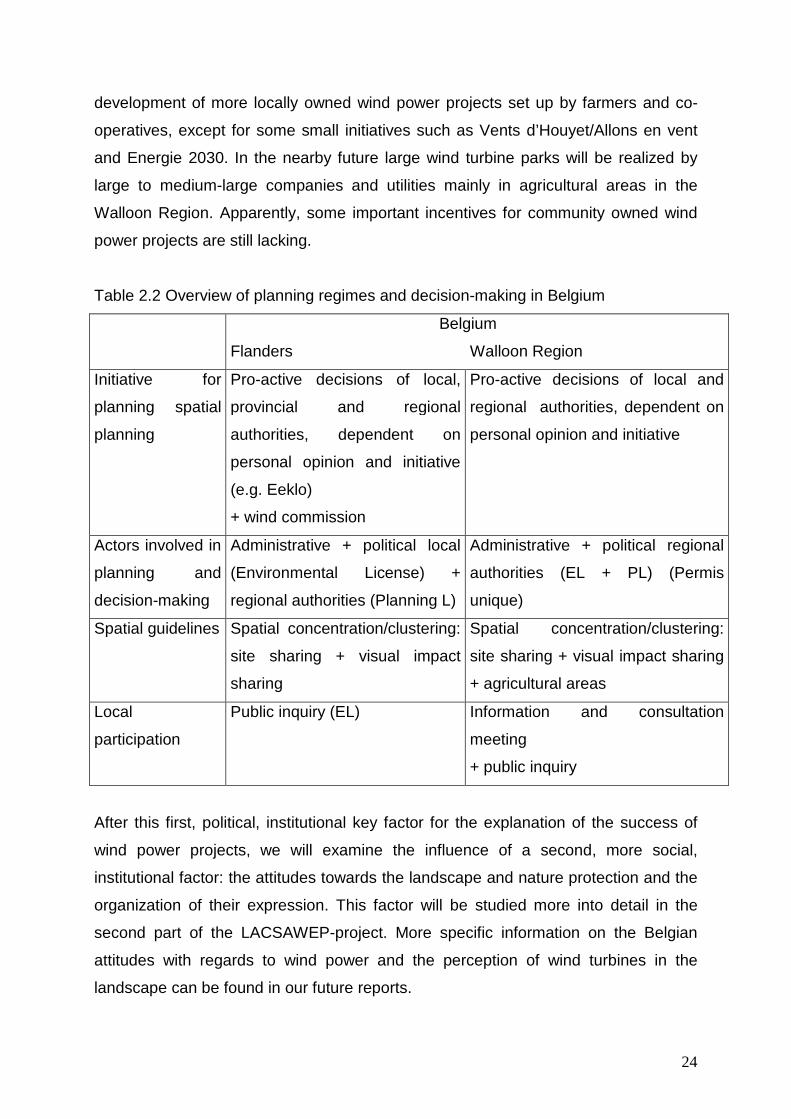
Table 2.2 Overview of planning regimes and decision-making in Belgium
Belgium
Flanders Walloon Region
Initiative for
planning spatial
planning
Pro-active decisions of local,
provincial and regional
authorities, dependent on
personal opinion and initiative
(e.g. Eeklo)
+ wind commission
Pro-active decisions of local and
regional authorities, dependent on
personal opinion and initiative
Actors involved in
planning and
decision-making
Administrative + political local
(Environmental License) +
regional authorities (Planning L)
Administrative + political regional
authorities (EL + PL) (Permis
unique)
Spatial guidelines Spatial concentration/clustering:
site sharing + visual impact
sharing
Spatial concentration/clustering:
site sharing + visual impact sharing
+ agricultural areas
Local
participation
Public inquiry (EL) Information and consultation
meeting
+ public inquiry
After this first, political, institutional key factor for the explanation of the success of
wind power projects, we will examine the influence of a second, more social,
institutional factor: the attitudes towards the landscape and nature protection and the
organization of their expression. This factor will be studied more into detail in the
second part of the LACSAWEP-project. More specific information on the Belgian
attitudes with regards to wind power and the perception of wind turbines in the
landscape can be found in our future reports.
25
2.2 Attitudes towards the protection of landscape a nd nature
The appreciation of landscape and nature is primarily rooted in the cultural values
that have been attached and the existence of grass-roots initiatives.
In England, the countryside is an important part of the national identity. Strong groups
exist that have landscape protection as a key priority and that can set up national
campaigns that are sceptical of or opposed to wind power such as the Campaign to
Protect Rural England (CPRE) and the Campaign to Protect Rural Wales (CPRW).
Also, groups exist that are specifically dedicated to campaigning against wind power
development, locally and nationally (Toke, 2008).
The opposite situation can be found in Spain where little value is placed on living in
rural areas which results in little landscape protection activity for these areas.
In Denmark, Germany, the Netherlands and Belgium organisations set up to protect
environmental resources are primarily oriented towards protection of nature rather
than landscape (Toke, 2008). These are generally supportive of wind power, also
following on from a tradition of grass-roots initiatives who campaign against coal and
nuclear industries (Toke, 2008). An example of these organisations supportive of
wind power in Belgium are the regional and local Flemish climate coalitions formed
between environmental, nature, youth and other socio-cultural associations to fight
climate change by opting for renewable energy technologies such as wind power.
Only when important local natural areas are threatened to be seriously affected by
wind power projects, opposition can be organised by these groups, as has happened
for the Wadden Sea in the Netherlands.
A study of the wind power planning outcomes in England and Wales has found
strong associations between the outcome of local authority planning decisions, the
attitudes of local planning officers, the attitudes of parish councils and the attitudes of
landscape protection groups.
The attitudes of people living in the immediate vicinity of proposed wind power
projects are found to have the most important influence on the local decision makers
and these are mainly formed by the local perception of the economic impact of the
26
wind power project. Farmers often look forward to wind power as a possible source of
income, while middle class residents are more concerned about the effects on the
landscape and their house prices.
These objections tend not to materialise if significant positive local economic value is
attached to the wind power project (Toke, 2005).
This impact of the opinion of local, provincial and regional administrative and political
authorities in the licensing procedures in Flanders and the Walloon Region is also not
to be underestimated and will be examined in more detail during the LACSAWEP-
project.
In a survey carried out in 2003 for the Flemish Administration of Natural Resources
and Energy (ANRE, 2003) on the energy attitudes of the Flemish households some
questions were asked about the attitude towards wind power projects.
49 % of the respondents would accept new wind turbine parks in their neighbourhood.
This is 13 % less than a similar survey in 2001. An explanation is the fact that wind
turbine projects are more concrete and the process of attitude formation around this
topic has also started in Flanders.
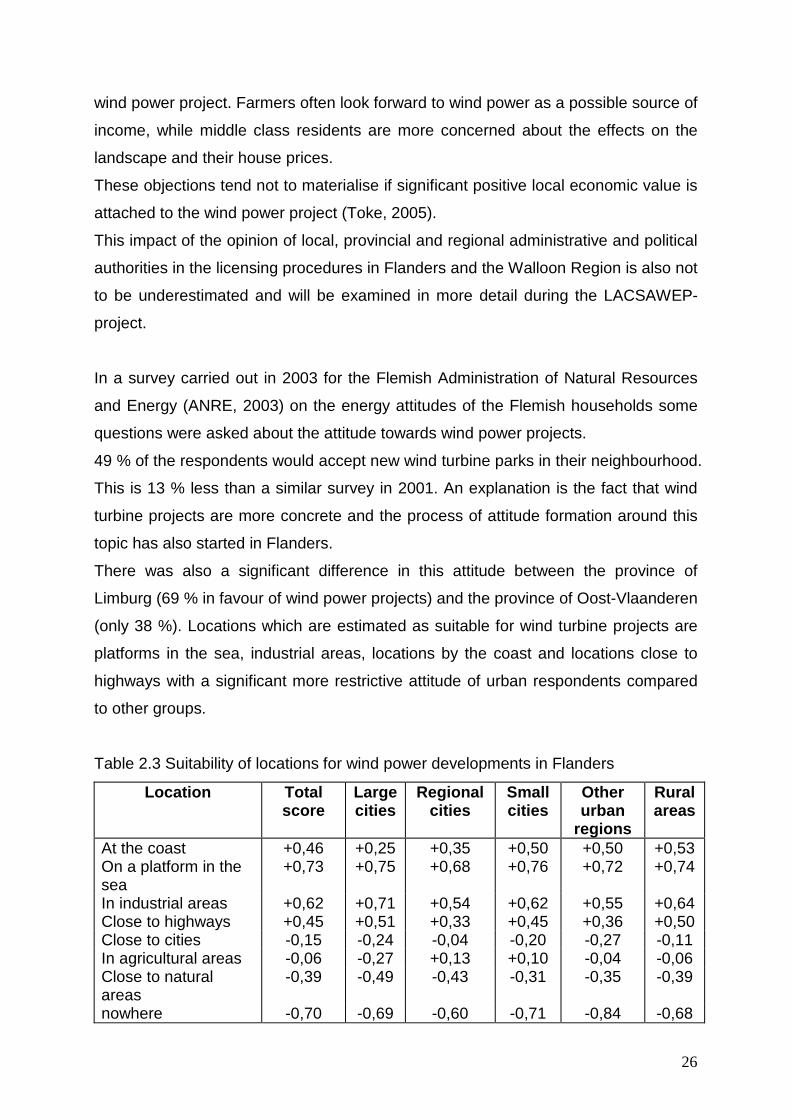
There was also a significant difference in this attitude between the province of
Limburg (69 % in favour of wind power projects) and the province of Oost-Vlaanderen
(only 38 %). Locations which are estimated as suitable for wind turbine projects are
platforms in the sea, industrial areas, locations by the coast and locations close to
highways with a significant more restrictive attitude of urban respondents compared
to other groups.
Table 2.3 Suitability of locations for wind power developments in Flanders
Location Total score
Large cities
Regional cities
Small cities
Other urban
regions
Rural areas
At the coast +0,46 +0,25 +0,35 +0,50 +0,50 +0,53 On a platform in the sea
+0,73 +0,75 +0,68 +0,76 +0,72 +0,74
In industrial areas +0,62 +0,71 +0,54 +0,62 +0,55 +0,64 Close to highways +0,45 +0,51 +0,33 +0,45 +0,36 +0,50 Close to cities -0,15 -0,24 -0,04 -0,20 -0,27 -0,11 In agricultural areas -0,06 -0,27 +0,13 +0,10 -0,04 -0,06 Close to natural areas
-0,39 -0,49 -0,43 -0,31 -0,35 -0,39
nowhere -0,70 -0,69 -0,60 -0,71 -0,84 -0,68
27
Source: A. Claes, P. Arts, I. Aerts. Enquête Energiezuinig gedrag Vlaamse
huishoudens in 2003: Synthese, Iris Consulting i.o.v. Ministerie van de Vlaamse
Gemeenschap, ANRE, september 2003
Another survey carried out by the facilitator for wind power in the Walloon Region
Apère states that 64 % of the respondents would accept a wind turbine park located
at less than 1000 metres from their house. Of the respondents already living in the
vicinity of wind turbines 72 % affirms that they don’t experience any impact of these
turbines. A last conclusion was the need of all respondents for objective and
extensive communication and information about the local implications of wind turbine
projects. The better this information is dispersed, the more wind turbines will be
accepted in the local communities (Apère, 2005).
If we look at the driving forces behind opposition against wind power projects,
logistical regression analyses of factors that influence wind power planning outcomes
in the UK suggest that the main driving force behind opposition is extremely local in
nature, associated with the parish where the wind power project is planned.
Discourse analysis in this same study demonstrated how campaigners managed their
opposition in order to dispel accusations of ‘NIMBYism’ and to universalize their
support by gaining the legitimacy of landscape protection and by upholding different
environmental values (Haggett, Toke, 2006).
With regards to the organisation of local opposition in Belgium, this opposition is
predominantly organized around negative visual/landscape evaluations of these wind
turbines (e.g. Vent de Raison, le Réseau Molignéole).
These visual evaluations and especially their relationship to the type of landscape in
which wind turbines are sited will be studied in the first part of the LACSAWEP-
project.
28
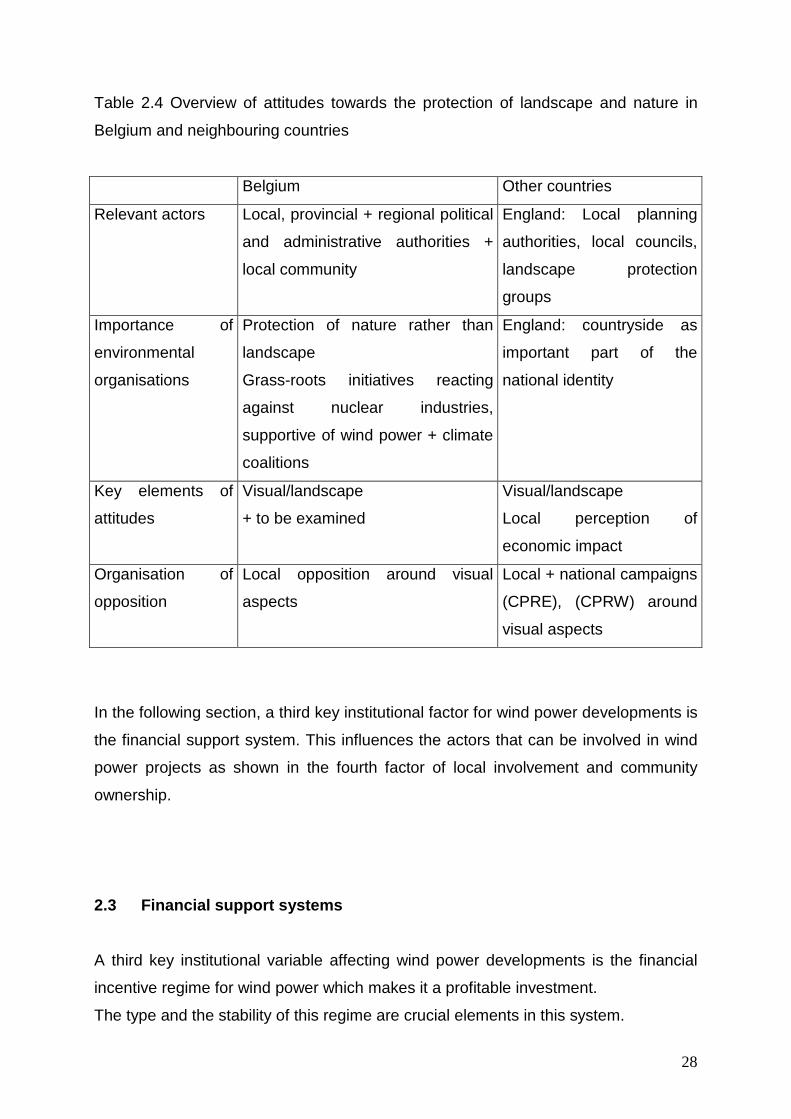
Table 2.4 Overview of attitudes towards the protection of landscape and nature in
Belgium and neighbouring countries
Belgium Other countries
Relevant actors Local, provincial + regional political
and administrative authorities +
local community
England: Local planning
authorities, local councils,
landscape protection
groups
Importance of
environmental
organisations
Protection of nature rather than
landscape
Grass-roots initiatives reacting
against nuclear industries,
supportive of wind power + climate
coalitions
England: countryside as
important part of the
national identity
Key elements of
attitudes
Visual/landscape
+ to be examined
Visual/landscape
Local perception of
economic impact
Organisation of
opposition
Local opposition around visual
aspects
Local + national campaigns
(CPRE), (CPRW) around
visual aspects
In the following section, a third key institutional factor for wind power developments is
the financial support system. This influences the actors that can be involved in wind
power projects as shown in the fourth factor of local involvement and community
ownership.
2.3 Financial support systems
A third key institutional variable affecting wind power developments is the financial
incentive regime for wind power which makes it a profitable investment.
The type and the stability of this regime are crucial elements in this system.
29
2.3.1 Type
Two basic types of financial support systems are used to promote investments in
wind power: ‘feed-in’ tariffs and more ‘market based’ schemes such as tender-
systems and tradable green electricity certificates.
The system of renewable energy ‘feed-in’ tariffs (REFIT) is used in Germany,
Spain and was used in Denmark until 2001. Fixed prices are paid for a given amount
of electricity and guaranteed for a long period. This ensures predictable stable
outcomes for wind power projects and possibilities for investments for longer time in
the wind power market.
The main criticism of this system is that it maintains fixed price levels that don’t
conform to the traditional market prices (Meyer, 2003).
In the German Renewable Energy Sources Act of March 2000 the choice for this
system was re-affirmed by referring to three reasons.
First, it referred to the polluter pays principle with regards to external costs where
most of the social and ecological follow-up costs associated with conventional
electricity are currently not borne by the operators of such installations but by the
general public. The system of feed-in tariffs merely reduces this competitive
advantage of ‘cleaner’ renewable electricity.
Second, conventional energy sources still benefit from substantial government
subsidies which keep their prices artificially low. The tariffs paid for electricity from
renewable energy sources is only a fraction of this still existing conventional
government support.
Third, this system attempts to break the vicious circle of high unit costs and low
production volumes typical of the first development phase of technologies for the
generation of electricity from renewable sources.
This system led to the formation of the wind power market in Germany, to the entry of
firms and the establishment of an advocacy coalition for the further development of
positive institutional changes for the wind power market (Jacobsson, Lauber, 2006).
By the end of 2001, the wind power capacities of Denmark, Germany and Spain
comprised around 84 % of the EU total.
30
To make this system more dynamic, tariffs should and are being adjusted at frequent
intervals to take into account the technological learning curves of renewable energy
technologies.
The second type of more ‘market based’ schemes , at least at first sight, involves
extra elements of competition between projects designed to bring down the price of
wind power.
A system of renewable portfolio standards of tradable green ele ctricity
certificates (RPS/TGC) is currently in use in England, Scotland, the Netherlands and
Belgium.
Electricity suppliers have to prove by means of certificates that a specific percentage
of the electricity supplied has been produced from renewable energy sources. These
certificates can be pursued from the producers of electricity from these renewable
energy sources for a specific market price.
The uncertainty about these prices increases the risks of investors and tends to
reduce investments in renewable technologies.
These uncertainties can be limited by defining minimum and maximum prices (fines)
for these green certificates adapted to the stage of the development of these
technologies, as in Denmark and Belgium. Since this is a fairly new system it is still
being evaluated (Meyer, 2003).
A second very important element of these financial support systems is the political
stability and the consistency of these regimes.
2.3.2 Stability and consistency of incentive regime
A major factor in investment regimes is the stability of the financial conditions,
especially for wind power projects which are highly dependent on external financial
support regimes.
In the Netherlands, frequent changes in these regimes have undermined their
reliability considerably with lower investments in wind power.
31
In Denmark, new onshore wind power developments have almost ceased after the
termination of the support due to growing uncertainty among potential investors about
future incentive regimes.
The German government has supported, also forced by a stronger wind power
market with its advocacy coalition, the existing incentive regime, with small
adaptations to the level and consistency of financial support. The results are well-
known.
In England, Wales and Scotland a first ‘market based’ tendering system for wind
power projects was not successful because of unviable, unrealistic, offers for wind
power developments. The second system of tradable green certificates was launched
in 2002, the Renewables Obligation (RO), and has resulted in a great increase in the
volume of projected wind power schemes.
In Belgium, renewable energy projects are stimulated primarily by a system of
tradable green certificates with guaranteed minimum prices for different types of
renewable energy technologies. This has stimulated investments in renewable
energy technologies, such as wind power projects. This number of green certificates
is coupled to the regional targets for electricity production from renewable energy
sources.
In Flanders, this target is 6 % by 2010. The minimum price for certificates from
onshore wind power projects is 75 euro/1 000 KWh and a fine of 125 euro for every
missing certificate has been determined.
In the Walloon Region, 7 % of the electricity has to be produced from renewable
energy in 2007, and 12 % in 2012 with a fine of 100 euro for each missing certificate.
There also exist other forms of financial support systems in Belgium such as extra
investment support systems for companies. Due to recent reforms of the Flemish
investment support system, this currently leads to increasing uncertainty and
instability with regards to investments in these future renewable energy projects.
32
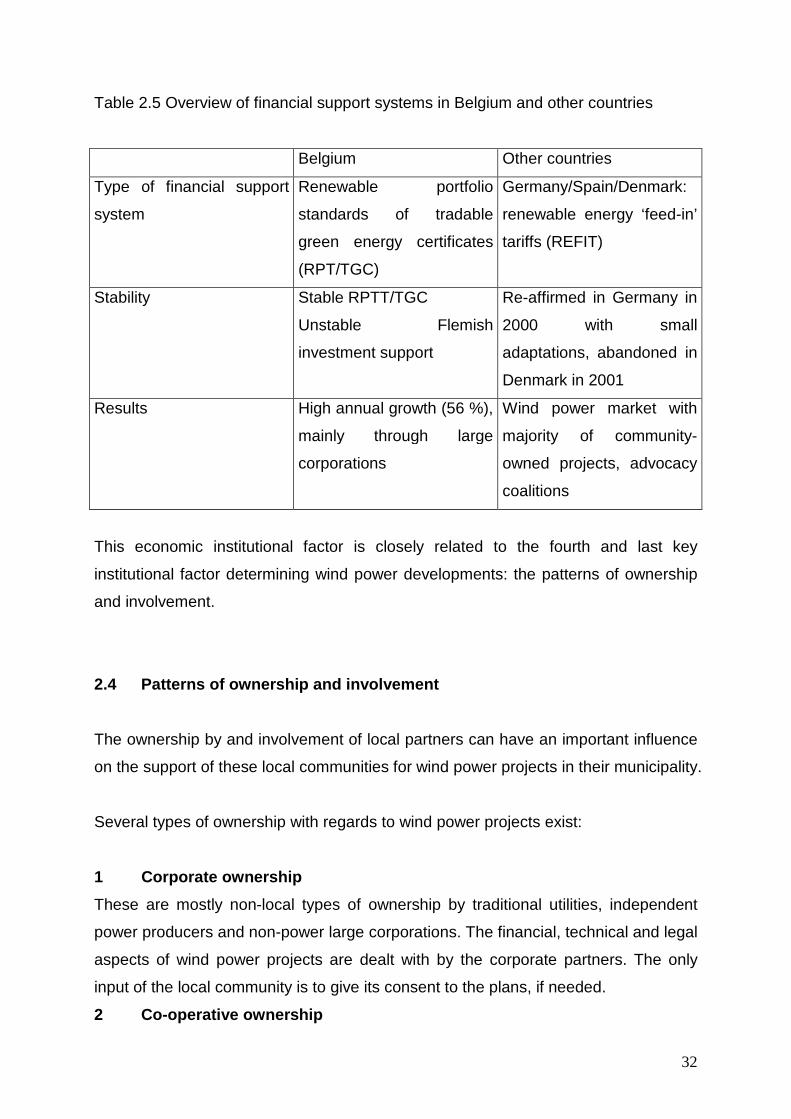
Table 2.5 Overview of financial support systems in Belgium and other countries
Belgium Other countries
Type of financial support
system
Renewable portfolio
standards of tradable
green energy certificates
(RPT/TGC)
Germany/Spain/Denmark:
renewable energy ‘feed-in’
tariffs (REFIT)
Stability Stable RPTT/TGC
Unstable Flemish
investment support
Re-affirmed in Germany in
2000 with small
adaptations, abandoned in
Denmark in 2001
Results High annual growth (56 %),
mainly through large
corporations
Wind power market with
majority of community-
owned projects, advocacy
coalitions
This economic institutional factor is closely related to the fourth and last key
institutional factor determining wind power developments: the patterns of ownership
and involvement.
2.4 Patterns of ownership and involvement
The ownership by and involvement of local partners can have an important influence
on the support of these local communities for wind power projects in their municipality.
Several types of ownership with regards to wind power projects exist:
1 Corporate ownership
These are mostly non-local types of ownership by traditional utilities, independent
power producers and non-power large corporations. The financial, technical and legal
aspects of wind power projects are dealt with by the corporate partners. The only
input of the local community is to give its consent to the plans, if needed.
2 Co-operative ownership
33
This type of ownership is more participative and locally based. The local communities
are involved through local decision-making and financial involvement can be assured
through public shares in the wind power projects.
These locally inspired and owned projects may counteract some possible objections
to wind power schemes because of the higher rate of planning acceptance. They can
help improve the prospects of schemes being given planning consent, as stated
below (Toke, 2008).
3 Individual owners/farmers
This type of ownership is less participative than co-operatives because of the
individual ownership of the projects but highly locally based since these projects are
realised on the land of farmers who use the wind turbine as an extra source of
income.
In Germany, early wind power policies supported a practice of locally based project
planning with wind projects representing concrete local political, economic and
environmental goals. The resulting public-participative style of ownership has greatly
improved the political profile of wind power because many individuals that invested in
local wind power schemes became ‘energy experts’ resulting in a strong lobby for
good conditions for wind power in the future (Toke, 2008).
In 2004 50 % of the total wind power capacity of 16 000 MW was owned by individual
farmers who were organised into informal local co-operatives.
40 % of wind power had been established by development companies offering public
shares to high-income earners, less participative than truly public co-operatives, and
10 % of the wind power capacity was owned by local people owning the shares in
public, local wind farm co-operatives or ‘Burgerwindparks’ (citizen wind farms),
onshore and offshore.
A crucial factor in this evolution was the availability of an abundant amount of
information about setting up commercial wind power schemes by local enthusiast, of
low cost consultants and of locally based agents of wind generator manufacturers
(Toke, 2007). Currently, these locally owned citizens’ projects are replaced by
34
companies and investor groups with less local involvement, leading to increasing
local opposition in Germany.
In Denmark, the same evolution has taken place. Wind power co-operatives
developed by wind enthusiasts initiated the large deployment of wind power with
currently more than 100 000 Danish families having shares in wind power co-
operatives. This type of ownership was quickly followed by farmer-owned wind power
projects which currently represent the majority of wind power projects.
This tradition of local energy activism in both Germany and Denmark grew from the
anti-nuclear movements of the 1970’s and 1980’s when environmental NGO’s and
other grass-roots movements organised mass based populist movements to react
against further nuclear developments. These movements also encouraged interest in
alternative energy projects, such as wind power (Toke, 2008).
In the Netherlands 60 % of wind power is owned by farmers, 5 % by co-operatives
and 35 % by utilities and larger companies. Much of the wind power development
that has taken place was favoured by the introduction of community ownership to
reduce planning resistance in densely populated areas.
Other EU-countries such as the UK and Spain have little experience with these local
energy actions and the resulting locally owned renewable energy projects. Wind
power development in these countries is largely a matter of large utilities or power
producing corporations that invest in economically, and not socially or ecologically,
interesting projects.
In Belgium, the wind power market is dominated by projects of large utilities, large
power producing corporations and other companies. The largest wind power project
developer is Aspiravi Plus/Electrawinds, an intermunicipal renewable energy project
developer with over 50 wind turbines and a wind power capacity of over 88 MW,
followed by the utilities and power producing corporations of Electrabel and SPE.
35
These 3 actors have developed a total wind power capacity of 150 MW or 62.5 % of
the total wind power capacity.
The other power producting corporations such as Airenergy, Greenwind and RPC
(Renewable Power Company) and other non-power producing companies such as
Colruyt and Bobbejaanland have a total wind power capacity of over 70 MW and a
share of 30 % of the total wind power capacity.
This means that 92.5 % of the wind power projects in Belgium is owned by private,
mostly non-local economic organisations. This could be a disadvantage with regards
to the future development of the political profile and the local acceptability of future
wind power developments.
Only 8 % or 18 MW of wind power capacity is owned by co-operative organisations
such as Ecopower, Wase Wind, Vents d’Houyet/Allons en Vent and Energie 2030,
with public shares open to local and non-local shareholders.
Currently, there aren’t any wind power projects in Belgium who are organized and
owned by farmers or co-operative organizations of farmers.
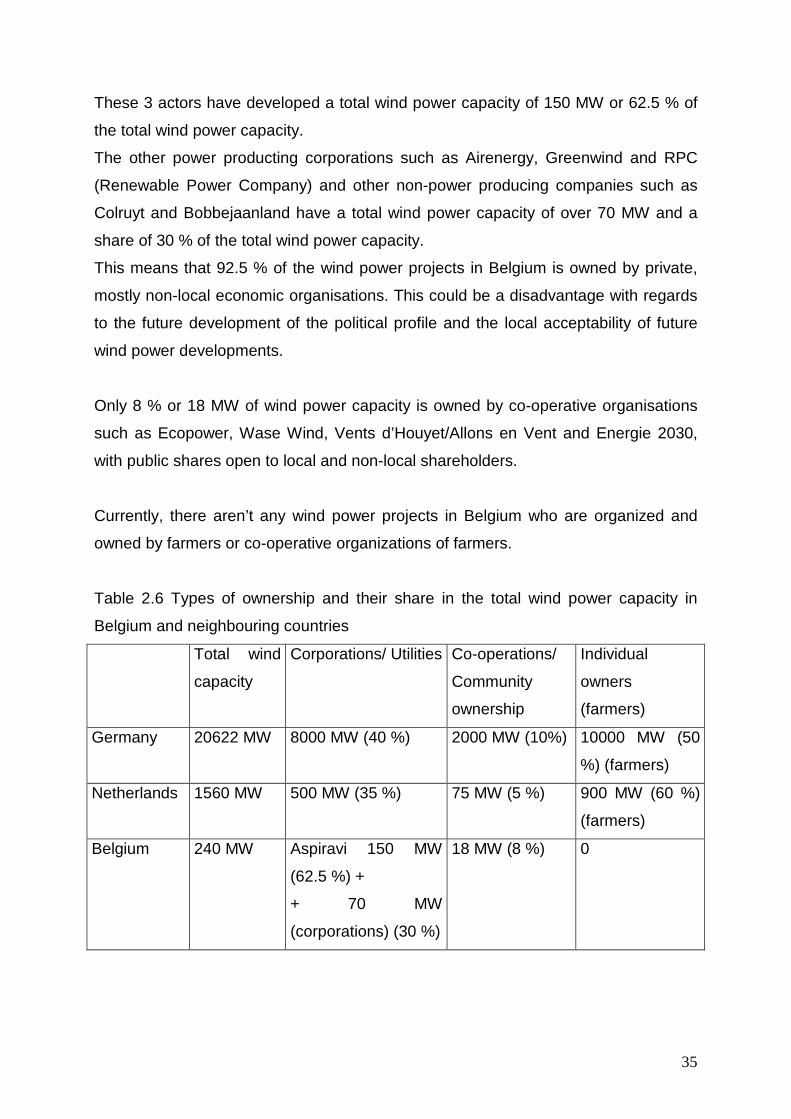
Table 2.6 Types of ownership and their share in the total wind power capacity in
Belgium and neighbouring countries
Total wind
capacity
Corporations/ Utilities Co-operations/
Community
ownership
Individual
owners
(farmers)
Germany 20622 MW 8000 MW (40 %) 2000 MW (10%) 10000 MW (50
%) (farmers)
Netherlands 1560 MW 500 MW (35 %) 75 MW (5 %) 900 MW (60 %)
(farmers)
Belgium 240 MW Aspiravi 150 MW
(62.5 %) +
+ 70 MW
(corporations) (30 %)
18 MW (8 %) 0
36
An important conclusion of the type of wind power ownership in these different
countries is that locally inspired and owned projects improve the planning
environment for wind power.
It also improves the prospects of planning consent and the political profile of wind
power.
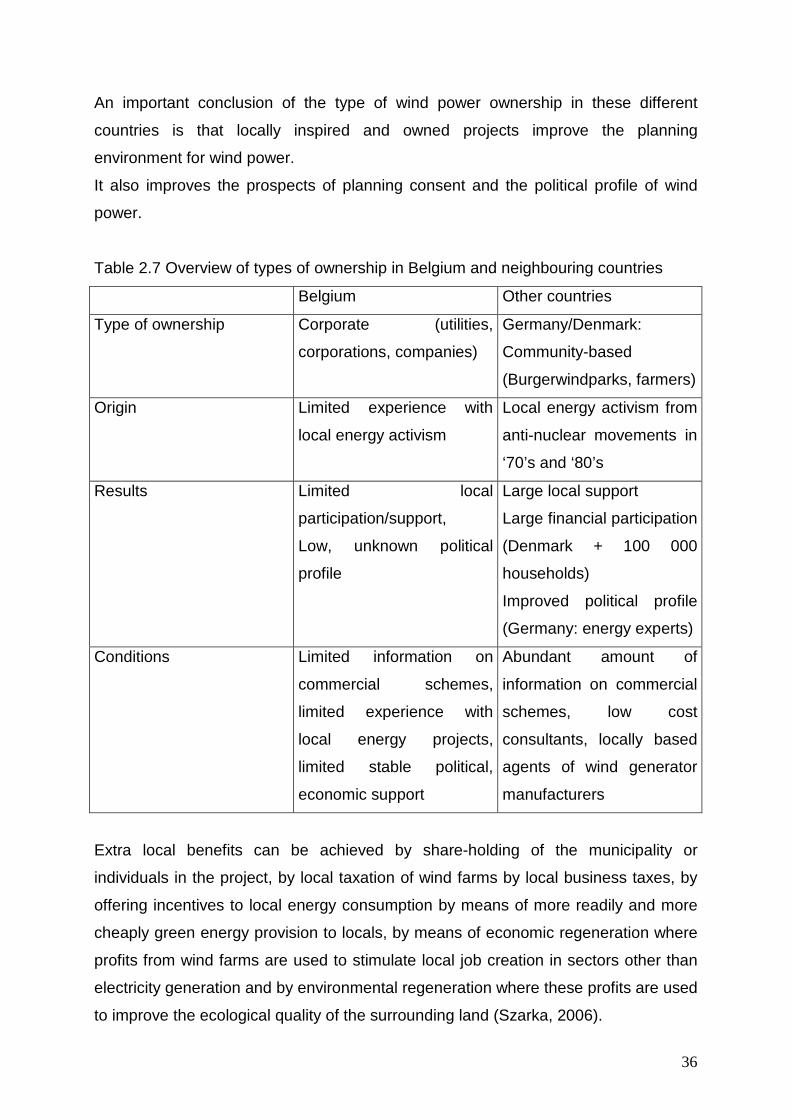
Table 2.7 Overview of types of ownership in Belgium and neighbouring countries
Belgium Other countries
Type of ownership Corporate (utilities,
corporations, companies)
Germany/Denmark:
Community-based
(Burgerwindparks, farmers)
Origin Limited experience with
local energy activism
Local energy activism from
anti-nuclear movements in
‘70’s and ‘80’s
Results Limited local
participation/support,
Low, unknown political
profile
Large local support
Large financial participation
(Denmark + 100 000
households)
Improved political profile
(Germany: energy experts)
Conditions Limited information on
commercial schemes,
limited experience with
local energy projects,
limited stable political,
economic support
Abundant amount of
information on commercial
schemes, low cost
consultants, locally based
agents of wind generator
manufacturers
Extra local benefits can be achieved by share-holding of the municipality or
individuals in the project, by local taxation of wind farms by local business taxes, by
offering incentives to local energy consumption by means of more readily and more
cheaply green energy provision to locals, by means of economic regeneration where
profits from wind farms are used to stimulate local job creation in sectors other than
electricity generation and by environmental regeneration where these profits are used
to improve the ecological quality of the surrounding land (Szarka, 2006).
37
To stimulate these co-operative wind power schemes started by local enthusiasts,
knowledge and confidence about wind power technology has to be disseminated as
widely as possible, as this has led to success in Germany and Denmark (Toke,
Community Wind Power in Europe and the UK, 2007).
What is needed in these communities to develop community-owned wind power
schemes are skills, resources, time, access to information, liaisons with other
organizations, money and funding, strategic planning, flexibility, knowledge of these
communities and a clear project identity (Hinshelwood, 2001).
In this chapter we examined four key institutional factors that determine the outcome
of wind power developments.
If we compare the Belgian situation of these factors to the situation in our
neighbouring countries, especially compared to Germany, there are still a lot of
factors that can be improved in order to stimulate future wind power developments.
Especially with regards to local collaborative practices in the planning regimes and
the decision-making local communities should be more involved in order to stimulate
the local acceptance. This involvement can be realised through financial participation
of these communities and their members by means of well-prepared co-operative
wind power projects and by improved democratic procedures.
Investment risks for these local initiatives can be reduced by stable and more
predictable incentive regimes.
The formation of attitudes with regards to wind power projects in Belgium and how
developers and authorities can respond to this will be studied more into detail in the
second part of the LACSAWEP-project.
In the first part of the LACSAWEP-project the perception of wind turbines in the
Belgian landscape will be examined through photo-surveys which will result in a
perceptual wind map of Belgium. In the next chapter, we will discuss some wind
maps which have already been developed in our country, in the Netherlands and in
England by means of spatial, environmental and visual/landscape criteria.
38
3 Wind maps in Flanders, the Walloon Region and in the
Netherlands and the UK
In this chapter we will look at different spatial maps for wind power developments that
have already have been developed in Flanders, the Walloon Region and in the
Netherlands and the UK.
These maps which are based on expert interpretations of landscapes or spatial
destinations are used to support administrators and politicians in discussions on wind
power projects and to develop a spatial and environmental policy for renewable
energy projects that is backed by scientific results.
Only maps which have been designed exclusively for the evaluation of wind turbines
will be discussed, although other maps such as bird and landscape atlases are also
being used to evaluate wind turbine locations.
It is our intention to develop a similar wind map for Belgium, not based on expert
opinions but on the individual appreciation of the Belgian landscape by all Belgians, a
unique project.
3.1 Windplan Vlaanderen
A first wind map is the ‘Windplan Vlaanderen’ which has been developed in 2000 by
the Vrije Universiteit Brussel and the Organisatie voor Duurzame Energie Vlaanderen.
This map is developed through a spatial and meteorological analysis of Flanders
(Cabooter Y., Dewilde L., Langie M., 2000).
The results are two maps: a map with an overview of the average wind speeds at
different hub heights (50 and 75 m) and a map with the Flemish territory classified
according to 4 classes of suitability for wind power development.
Class 0 zones are unsuitable for wind power development. These are housing areas
and natural areas where the impact of wind turbines is deemed to be very negative.
Class 1 zones are very suitable for wind power development and have the highest
priority. These are industrial areas or areas with communal purposes where wind
turbines can be situated without any extra impact on the environment.
39
Class 2 zones are suitable for wind power development but with some limitations with
regards to visual and environmental impacts. These zones are agricultural or
recreational areas.
Finally, class 3 zones are also still suitable for wind turbines but only if the
environmental and visual impacts of wind turbine have been thoroughly analyzed
because of the vulnerability and the importance of the landscape of mainly
agricultural areas.
This ‘Windplan Vlaanderen’ is an interesting, policy supporting tool to make a first
assessment of the suitability of a specific area for the development of a wind power
project. During the further development of these projects, extra analyses are needed
to examine the visual, environmental and other impacts of wind turbines on the
location.
An example of the spatial wind map for Leuven can be seen as Map 1 in the annex.
3.2 Inpasbaarheidskaart windturbines West-Vlaandere n
This wind map was developed by Aeolus and 3 E for the Flemish administration of
economy, department natural resources and Energy in 2002 (Aeolus, 3 E, 2002).
It is the result of a landscape study by experts for the province of West-Vlaanderen
where the interaction between these landscapes and wind turbines is examined.
The result is a map of West-Vlaanderen with potential locations for wind turbine parks.
Here, wind turbines can be tolerated or adapted in the landscape, some wind turbine
parks can even accentuate certain landscape features or renew or modernize these
landscapes.
First, landscape structure areas were determined which have typical landscape
features which favour the allocation of wind turbine parks.
These features are:
1 flat, hard infrastructures which have a large-scale, rational and technical
character, with a high intensity of use for work or living such as regional
industrial areas and harbours
40
2 linear, hard infrastructures which have a large-scale, linear and artificial
character such as motorways, railroads and canals
3 positively affirming reliefs where the spatial structure of abiotical landscape
features can be accentuated by wind turbines
4 rational, large-scale polder landscapes where the horizontal, rational pattern
can be emphasized by wind turbines
The next step in the development of the wind map for West-Vlaanderen was the
exclusion of veto-areas because of their visual and landscape protection status and
the exclusion of the class-o areas that can be found on the Windplan Vlaanderen
because of legal spatial restrictions.
The result is the wind map for West-Vlaanderen which can be found as Map 2.
In a third step, a perceptual analysis of the allocation of wind turbines on the resulting
potential locations was executed.
3.3 Carte des contraintes paysagères et environneme ntales pour
l’implantation des éoliennes en région Wallonne
This wind map with the visual and environmental restrictions on wind power
developments in the Walloon Region has been developed in 2004 by the university of
Gembloux (Laboratoires d’Aménagement du Territoire et de Géomatique) and has
been financed by the Walloon Ministère de l’Aménagement du Territoire, de
l’Urbanisme et de l’Environnement (Cuvelier M., Schaar C. Feltz C. Lejeune P., 2004).
In the first phase of this project a list of criteria and indicators was developed to
assess the environmental and visual impacts of wind power projects in the Walloon
Region.
For every non-visual, environmental criterion, restricting indicators were found
primarily in legal documents to represent the impact of wind turbines on these
features : ecological indicators, 3 aeronautics indicators, 1 acoustical indicator, 1
shade indicator, 3 security indicators, 3 spatial indicators (exclusion of nature areas,
41
park areas, green areas), 5 geological and hydrographical indicators and 1
telecommunications indicator.
For the landscape criteria 15 indicators were determined which were adapted to the
scale and the of the landscape: 2 indicators referring to the patrimonial value of
macro-landscapes, 3 indicators referring to specific uses of forests, 2 indicators to
represent the value of nature parks and large agricultural landscape units, 6
indicators assessing the visual impact on landscape units which have special urban,
(proto-)industrial, rural, structural and monumental patrimonial value and 2 indicators
determining the visual importance of local sites (Zones d’Intérêt Paysager ZIP,
Périmètres d’Intérêt Paysager PIP).
According to the importance of these indicators, 3 classes of restrictions on wind
power developments in specific areas are created:
1 locations with absolute restrictions where wind turbines should be excluded
2 locations with high sensitivity to wind turbine projects where projects
normally are not possible but additional studies can reassess the impacts
of wind turbines
3 sensitive areas where extra attention should be paid to impact assessment
analyses
In the second phase, these indicators and their restrictions are translated into maps
which reflect the sensitivity of a region to wind power developments with regards to
these indicators.
In the third phase: a synthesizing wind map is developed which represents the 3
classes of restrictions of locations to wind power developments combined for all the
indicators.
Wind map 3 a gives an overview of the sensitivity of locations in the Walloon Region
to wind turbine projects according to landscape/visual indicators.
Wind map 3 b is the actual synthesizing wind map of the Walloon Region where the
level of restrictions of locations in the Walloon Region with regards to wind power
developments is determined for all indicators (visual and environmental).

42
Although this wind map is used by authorities to assess the sensitivity of a region to
specific wind power developments, this information has to be complemented by the
Environmental Impact Assessment of each wind turbine project.
3.4 Suitable locations for wind turbines in the Net herlands in “Frisse Wind
door Nederland”
This wind map for wind turbine parks in the Netherlands was developed in 2000 from
discussions between the 12 provincial environmental federations together with
regional and local nature and environmental organisations (Stichting Natuur en Milieu,
2000).
The guidelines for the environmental and visual acceptable choice of suitable
locations for wind turbine parks were the clustering of wind turbines and the
combination with linear infrastructures and industrial areas.
For each province, wind power opportunities were determined and locations for wind
turbine parks were found with a total extra wind power capacity of 1840 MW.
Map 4 a represents the map of the province of Zuid-Holland with possible locations
for wind turbines.
Map 4 b gives an overview of suitable locations for wind turbines in the Netherlands.
3.5 Sensitivity assessment of landscape character a reas in Cornwall and
England and the vulnerability of these areas to the introduction of wind
turbines
The wind map of Cornwall was developed for the Cornwall sustainable energy project
in 2004 by Land use and CAG Consultants (Land use consultants and CAG
Consultants, 2004).
The sensitivity of landscape character areas to wind power developments was
evaluated by means of physical criteria such as the landform, shape and scale of the
landscape, the nature of the skyline, the landscape pattern and the appearance of
foci, the openness, the character of the built environment, the transport network and
43
other special landscape features. These were complemented by perceptual criteria
such as the sense of remoteness, the sense of wildness, the landscape value, the
impact on visual amenities and the intervisibility with adjacent landscapes (Land use
consultants and CAG consultants, 2004, Appendix 2).
Landscape character areas with high to moderate-high sensitivity to wind power
development were excluded from potential locations for wind turbine parks, as well as
already designated Areas of Outstanding Natural Beauty (AONB’s), Heritage Coasts
with their scenic qualities and a buffer zone of 7 km around existing wind turbine
parks.
The result was a wind map with character areas with moderate, moderate-low to low
sensitivity to wind power developments.
Another map represents the potentially suitable scales of the wind power
developments in the appropriate landscape character areas (single turbines, small to
large scale clusters of wind turbines).
The resulting wind maps for Cornwall can be found as Map 5.
Map 5 a shows the sensitivity of the different landscape character areas of Cornwall
to wind power developments.
Map 5 b shows the different landscape character areas that have a certain potential
for wind power developments.
Map 5 c shows the relationship between the landform scale and the landscape
pattern (landscape capacity) and the potentially suitable scales of wind turbine
developments.
This last map can also be viewed as the assessment of the landscape capacity of a
specific area for wind turbine developments.
In another study executed by the University of Newcastle on landscape appraisal for
onshore wind development in the North-East Region of England in 2003 (Anderson,
Benson, Scott, 2003), this capacity for wind power is calculated from the sensitivity of
a landscape to wind turbine developments combined with the visibility and the values
attached to this landscape, as shown in the following figure 3.1.
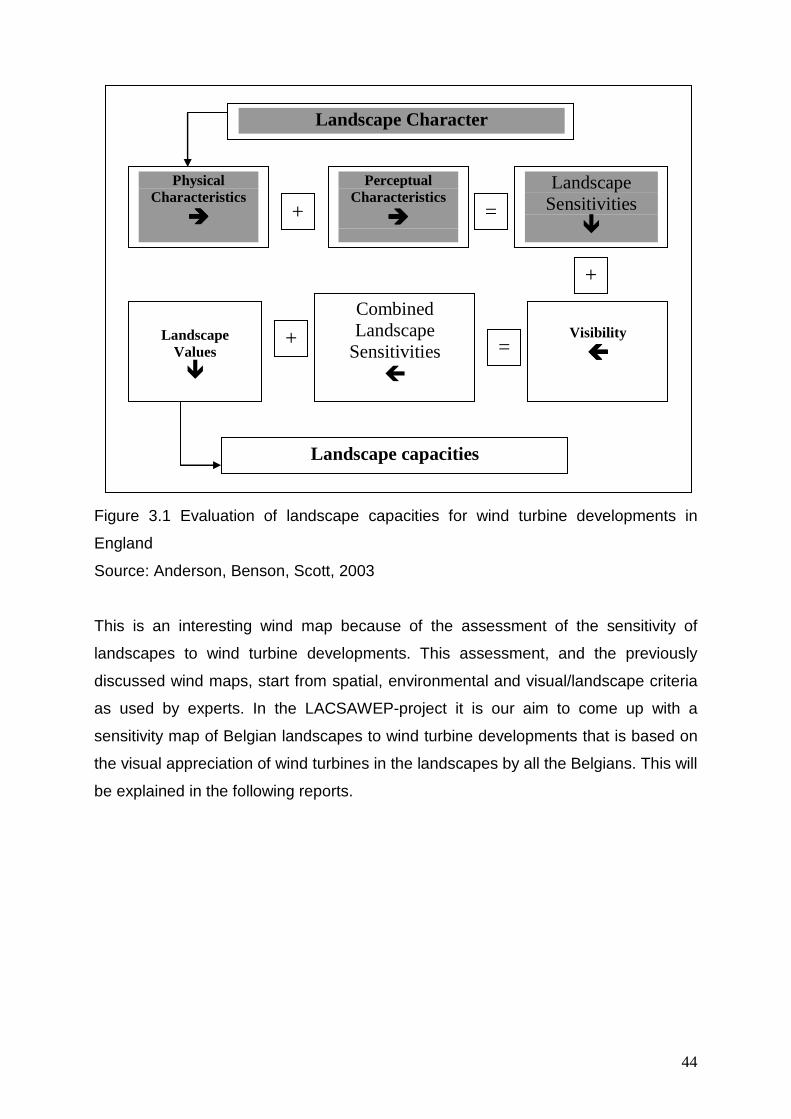
44
Figure 3.1 Evaluation of landscape capacities for wind turbine developments in
England
Source: Anderson, Benson, Scott, 2003
This is an interesting wind map because of the assessment of the sensitivity of
landscapes to wind turbine developments. This assessment, and the previously
discussed wind maps, start from spatial, environmental and visual/landscape criteria
as used by experts. In the LACSAWEP-project it is our aim to come up with a
sensitivity map of Belgian landscapes to wind turbine developments that is based on
the visual appreciation of wind turbines in the landscapes by all the Belgians. This will
be explained in the following reports.
Physical Characteristics
����
Perceptual Characteristics
����
Landscape Sensitivities
�
Visibility
Landscape Values
�
Landscape capacities
+ =
+
+
Combined Landscape
Sensitivities
=
Landscape Character
45
Conclusion
In this first report, we have studied the current situation of wind power in Belgium and
Europe.
In the first chapter we gave an overview of the evolution of wind power in Belgium
and the EU. Compared to the other EU-countries, especially the ‘old’ 15 member
states of the EU, Belgium is located at the bottom of the rankings with regards to
wind power capacity and the production of electricity from renewable energies.
Although this is also related to the specific geographical and spatial situation of
Belgium, scenario’s which take into account these important restrictions still predict
possible wind power developments from 244 MW of wind power capacity currently in
Belgium to 1000 MW of wind power capacity onshore in Flanders by 2020. 8 % of the
total electricity demand in Flanders could be produced by wind power, onshore and
offshore, by 2020.
In the second chapter, we examined the four key institutional explanations for the
different wind power outcomes in Belgium and other EU-countries.
The attitudes of people towards wind power development are highly influenced by
their level of participation in these wind power projects. The higher this participation is,
either financially or politically, the better the involvement of all local interests from
inside the community will be and the better the outcome of a wind power project will
be for all actors.
In Belgium, this local participation still has to be stimulated by developing appropriate
political, economic and social institutions, as has happened in neighbouring countries.
The formation of attitudes towards wind power in Belgium and the possible strategies
of developers and authorities will be studied more into detail in the second research
line of the LACSAWEP-project.
In the third chapter, we looked at some existing wind maps in Belgium and our
neighbouring countries which are used to evaluate the spatial, environmental and
visual/landscape impacts of wind turbines on their environment. These are all expert-
based and include data from different sources.
46
In the first research line of the LACSAWEP-project the actual perception of wind
turbines in the Belgian landscapes will be studied by means of representative photo-
questionnaires. This research will be discussed in future reports.
References
47
Aeolus 3 E (2002). Inpasbaarheidskaart landschap voor de inplanting van
windturbines voor de provincie West-Vlaanderen [on line]. Ministerie van de Vlaamse
Gemeenschap Administratie Economie Afdeling Natuurlijke Rijkdommen en
Energie,Available on:
http://www2.vlaanderen.be/ned/sites/economie/energiesparen/img/windplan_inpasba
arheid_wvl.jpg [Date of search: 01/06/2007].
Aeolus 3 E (2002). Opmaak kwetsbaarheidskaart voor de inplanting van windturbines
ten aanzien van het aspect landschap voor de provincie West-Vlaanderen [on line].
Ministerie van de Vlaamse Gemeenschap Administratie Economie Afdeling
Natuurlijke Rijkdommen en Energie, Available on:
http://www2.vlaanderen.be/ned/sites/economie/energiesparen/doc/windplan_wvl_ein
drapport.pdf [Date of search: 01/06/2007].
Anderson, Benson, Scott (2003). Landscape appraisal for onshore wind development.
University of Newcastle/Government office for the North East, s.l.
Apère (2005). Etude sur l’acceptation sociale des éoliennes en Wallonie. Renouvelle.
14: 24-26.
Apère (2004). Memorandum pour les énergies renouvelables 2004-2009 Un plan
d’action pour 8 % d’énergies renouvelables en 2009 [on line]. Apère. Available on:
http://www.apere.org/doc/mem0406.pdf [Date of search: 01/04/2007].
Breukers, Wolsink (2007). Wind power implementation in changing institutional
landscapes: An international comparison. Energy Policy, 35: 2737-2750.
Breukers S., Toke D., Wolsink M. (2008). Wind power deployment outcomes: How
can we account for the differences?. Renewable and Sustainable Energy Reviews, in
press.
Cabooter Y., Dewilde L., Langie M. (2000). Windplan Vlaanderen [on line], Vlaamse
overheid. Available on:
48
http://www2.vlaanderen.be/ned/sites/economie/energiesparen/doc/windplan.pdf
[Date of search: 15/05/2007].
Claes A., Arts P., Aerts I.. (2003). Enquête Energiezuinig gedrag Vlaamse
huishoudens in 2003: Synthese. Ministerie van de Vlaamse Gemeenschap ANRE, s.l.
Cuvelier M., Schaar C. Feltz C. Lejeune P. (2004). Cartographie du champ de
contraintes paysagères et environmentales comme base de determination des zones
d’éxclusion à la transcription au plan de secteur de la politique des éoliennes à
l’échelle de l’ensemble du territoire wallon. Ministère de l’Aménagement du Territoire,
de l’Urbanisme et de l’Environnement, s.l.
Eurobserv’ER (2006). State of renewable energy in Europe Share of renewable
energies in gross electrical consumption in European Union countries in 2005 (in %),
[on line]. EurObserv’ER. Available on: http://ec.europa.eu/energy/res/index_en.htm
[Date of search 01-03-2007].
EurObserv’ER (2007). Wind energy barometer [on line]. EurObserv’ER. Available on
http://www.energies-renouvelables.org/observer/stat_baro/observ/baro177.pdf [Date
of search: 01-03-2007].
European WindEnergy Association (2005). Windenergy: the facts. EWEA [on line].
EWEA. Available on http://www.ewea.org/fileadmin/ewea_documents/documents/
publications/WETF/WETF.pdf [Date of search: 15-04-2007].
Gouvernement wallon (2002). Cadre de référence pour l’implantation d’éoliennes en
Région wallonne 18-07-2002. Gouvernement wallon.
Haggett C., Toke D. (2006). Crossing the great divide-using multi-method analysis to
understand opposition to windfarms. Public Administration, 84: 103-120.
Hinshelwood E. (2001). Power to the People: community-led wind energyobstacles
and opportunities in a South Wales Valley. Oxford University Press and Community
Development Journal, 36: 95-110.
49
Jacobsson S., Lauber V. (2006). The politics and policy of energy system
transformation-explaining the German diffusion of renewable energy technology.
Energy Policy, 34: 256-276.
Land use consultants and CAG Consultants (2004). Cornwall sustainable energy
project: Planning guidance Final report. Cornwall County Council Cornwall
Sustainable Energy Partnership, Cornwall.
Land use consultants and CAG Consultants (2004). Appendix 2: Landscape
sensitivity to renewable energy generation in Cornwall. Cornwall County Council
Cornwall Sustainable Energy Partnership, Cornwall.
Ministère de la Region Wallone Division de l’Energie Direction Générale des
technologies, de la Recherche et de l’Energie (2003). Plan 2003 pour la maîtrise
durable de l’énergie à l’horizon 2010 en Wallonie [on line]. Ministère de la Region
Wallone Division de l’Energie Direction Générale des technologies, de la Recherche
et de l’Energie. Available on:
http://energie.wallonie.be/servlet/Repository/Plan_pour_la_ma%EEtri.PDF?IDR=424
[Date of search: 01/04/2007].
Meyer N. I. (2003). European schemes for promoting renewables in liberalised
markets. Energy Policy, 31: 665-676.
Ministère de la Région wallonne Direction générale des technologies, de la recherche
et de l’énergie/ Facilitateur éolien APERe (2006). Vade-mecum non-technologique du
candidat à l’implantation d’un parc éolien [on line]. Ministère de la Région wallonne
Direction générale des technologies, de la recherche et de l’énergie/ Facilitateur
éolien APERe, Available on:
http://energie.wallonie.be/servlet/Repository/Vade_mecum_%E9olien.PDF?IDR=464
[Date of search: 15/05/2007].
Stichting Natuur en Milieu (2000). Frisse wind door Nederland. Stichting Natuur en
Milieu, Utrecht.
50
Vlaamse regering (2006). Omzendbrief: EME/2006/01 – RO/2006/02,
Afwegingskader en randvoorwaarden voor de inplanting van windturbines. Vlaamse
overheid.
Szarka J. (2006). Wind power, policy learning and paradigm change. Energy Policy,
34: 3041-3048.
Toke (2005). Explaining wind power planning outcomes: Some findings from a study
in England and Wales. Energy Policy, 33: 1527-1539.
VITO-3 E Devriendt, Dooms, Liekens, Nijs, Pelkmans (2005). Prognoses voor
hernieuwbare energie en warmtekrachtkoppeling tot 2020. Afdeling Natuurlijke
Rijkdommen en Energie Vlaamse Administratie, Brussel.
Wolsink M. (2007). Planning of renewables schemes: Deliberative and fair decision-
making on landscape issues instead of reproachful accusations of non-cooperation.
Energy Policy, 35: 2692-2704.