Embed Size (px)
Citation preview

Proceedings of the 6th International Conference on Mechanics and Materials in Design,
Editors: J.F. Silva Gomes & S.A. Meguid, P.Delgada/Azores, 26-30 July 2015
-1975-
PAPER REF: 5748
WIND TURBINE GEAR OILS PERFORMANCE EVALUATION
Ramiro Martins1(*), Carlos M.C.G. Fernandes
1, Jorge H. O. Seabra
2
1INEGI, University of Porto, Porto, Portugal 3Faculdade de Engenharia, University of Porto, Portugal (*)
Email: [email protected]
ABSTRACT
This work evaluates the performance of different ISO VG 320 wind turbine gear oils with
base oil formulations based in PAO, Mineral, Ester and PAG having quite different viscosity
indexes. The oils evaluation was done in rolling bearing tests and gearbox tests. Their
behaviour was compared for operating conditions in the range of the observable in a wind
turbine gearbox.
The experimental results showed considerable differences between the different oils and it
was observed that depending on the contact type the relative behaviour of the lubricants
would change, i.e. the best lubricant for the rolling bearing would not imply the best result on
the gearbox tests.
The gear geometry is also a very important parameter on a gear transmission torque loss. It
was observed that a decrease of up to 25% in torque loss could be achieved with a low loss
gear geometry.
Numerical models were implemented and calibrated with the purpose of obtain the friction
coefficient promoted by the tested oils and performing a better simulation of the mechanical
system.
Keywords: Gears, Rolling bearings, Friction coefficient, Lubricants, Efficiency.
INTRODUCTION
The reduction of power consumption and the improvement of equipment’s life is a constant
target for industry. A large percentage of the wind turbine installed use planetary gearboxes
and inside those gearboxes the two main type of components that dissipate energy are the
gears and the rolling bearing. Gears and rolling bearings power loss behavior are the main
focus on this work.
The most common torque loss sources occurring within the gearbox are: friction loss between
the meshing teeth (Höhn et al., 1996, Martins et al., 2005, Martins et al., 2006, Martins et al.,
2008, Martins et al., 2009, Magalhães et al., 2010, Marques et al., 2013, Fernandes et al.,
2014), friction loss in the rolling bearings (Eschmann et al., 1985, Hohn et al., 1996, 2005,
Fernandes et al., 2013, Fernandes et al., 2013), load independent gear losses (Ariura et al.,
1975, Mauz, 1987, Maurer, 1994, Höhn et al., 1996, Changenet et al., 2007, Changenet et al.,
2011, Marques et al., 2013) and energy loss due to air-drag (Diab et al., 2004, Seetharaman et
al., 2009). The seals also contribute for the power losses
The losses inside a gearbox have several side effects besides the immediate of decreasing
power output and one of the most important is the increment of the operating temperature of
the oil. The increase of oil temperature contributes to the increase of surface failure

Symposium_21
Tribology Trends for Higher Efficiency and Reliability
-1976-
probability, since wear, scuffing, micropitting or pitting (Hohn et al., 2004), due to thinner
film thickness and possible higher friction coefficient, nevertheless, the additive package
always plays a very important role.
ISO VG 320 is the European oil viscosity specification for wind turbine gearboxes. The ISO
VG 320 base oils have different base oils, different viscosity indexes, besides the typical oil
operating temperature is between 60 to 80ºC, but nevertheless the viscosity specification is for
40ºC. Another focus of this work is the analysis of the influence of different fully formulated
ISO VG 320 oils, taking into account their different viscosity, on the power losses of rolling
bearings and gears.
Five oils were selected, having all different base products.
LUBRICANTS
Five ISO VG 320 wind turbine lubricants were selected having different base oils. The
Lubricants have the following designations: MINR (mineral base), PAOR (polyalphaolefin
base), ESTR (ester base), PAGD (poly-alkylene-glycol) and MINE (poly-alkyl-methacrylate).
The lubricants physical and chemical properties were evaluated and are displayed in Table 1.
All the lubricants are fully formulated and rated for lubrication of wind turbine gearboxes.
Table 1 - Lubricants pgysical and chemical properties.
Parameter Unit MINR ESTR PAOR MINE PAGD
Base Oil [-]
Mineral Ester PAO Mineral
+ PAMA PAG
Chemical composition
Zinc (Zn) [ppm] 0.9 6.6 3.5 < 1 1
Magnesium (Mg) [ppm] 0.9 1.3 0.5 < 1 1.4
Posphorus (P) [ppm] 354.3 226.2 415.9 460 1100
Calcium (Ca) [ppm] 2.5 14.4 0.5 2 0.8
Boron (B) [ppm] 22.3 1.7 28.4 36 1.0
Sulphur (S) [ppm] 11200 406 5020 6750 362
Physical properties
Density @ 15 °C [g/cm3] 0.902 0.915 0.859 0.893 1.059
Viscosity @ 40 °C [cSt] 319.2 302.9 313.5 328.3 290.3
Viscosity @ 80 °C [cSt] 43.9 56.1 60.4 66.5 78.9
Viscosity @ 100 °C [cSt] 22.3 34.9 33.3 37.1 51.1
ROLLING BEARINGS TESTS
Two types of bearing were tested in this work, a 51107 Thrust Ball Bearings (TBB) and an
81107 Roller Thrust Bearings (RTB). These two bearing types were selected due to
promoting different contact pattern, elliptical contact on the TBB and linear contact on the
RTB.
The rolling bearings were tested in a test rig that allow to apply different operating conditions,
including controlled temperature and measure directly the rolling bearing torque loss.
The rolling bearing test assembly is displayed in Fi and a detailed description was published
by (Cousseau et al., 2011).

Proceedings of the 6th International Conference on Mechanics and Materials in Design,
Editors: J.F. Silva Gomes & S.A. Meguid, P.Delgada/Azores, 26-30 July 2015
-1977-
Fig. 1 - Schematic view of the rolling bearing assembly for the Four-ball machine.
Test procedure
The rolling bearings tests were performed using an oil volume of 14 ml (to promote a oil level
up to the middle of the rolling elements) at a constant oil bath temperature of 80 ºC. The
operating conditions are detailed in Table 2.
Table 2 - Operating conditons in rolling bearings tests.
Speed [rpm] 75 till 1200
Oil temperature [ºC] 80
Load [N] 700 7000 700 7000
Load ratio (C/P) [/] 28.4 2.84 42 4.2
p0 [GPa] 1.15 2.48 0.32 1.0
Experimental results
Figures 2, 3, 4 and 5 represent the total torque loss measurement as function of the input
speed, for the two load levels tested and for the TBB and RTB rolling bearings tested.
For the TBB the torque loss increase with the increasing speed and the increase of load also
leaded to an increase of the torque loss, as expected. The increase of ten times on the load
only increased around three times the torque loss.

Symposium_21
Tribology Trends for Higher Efficiency and Reliability
Fig. 2 - Torque loss of TBB for a load of 700 N
The RTB total torque loss measurements for a load of 7000N and a speed of 1200rpm had a
operating temperature above 80ºC (the control of temperature does not have cooling
capability).
The torque loss measured with TRB was much higher that the measured for TBB. For the
RTB it is observed an increase of torque loss with increasing speed for low
conditions(Figure 4) while for high load conditions a decrease of torque loss is observed with
increasing speed (Figure 5).
Fig. 4 - Torque loss of RTB for a load of 700 N
Discussion
The TBB results show that the MINR and PAGD lubricants had the higher torque loss from
the group, while PAOR had the lowest torque loss for the load of 700N and MINE had the
lowest torque loss for a load of 7000N. The ESTR oil had an intermediate behaviour for all
tests.
For RTB tests there are significa
increases from 700 to 7000 N. For the load of 700N the PAGD lubricant displays the largest
toque loss while the MINR and ESTR had the lowest, result that appears to
lubricants viscosity. For the load of 7000 N the PAGD lubricant had the lowest torque loss for
the lower speeds while the mineral bases had the highest.
The relative behaviour of the lubricants is dependent on the bearing type, being the slid
speed the biggest difference between the TBB and the RTB, and also the contact pressure.
Tribology Trends for Higher Efficiency and Reliability
-1978-
Torque loss of TBB for a load of 700 N Fig. 3 - Torque loss of TBB for a load of 7000 N
The RTB total torque loss measurements for a load of 7000N and a speed of 1200rpm had a
erating temperature above 80ºC (the control of temperature does not have cooling
The torque loss measured with TRB was much higher that the measured for TBB. For the
RTB it is observed an increase of torque loss with increasing speed for low
(Figure 4) while for high load conditions a decrease of torque loss is observed with
Torque loss of RTB for a load of 700 N Fig. 5 - Torque loss of RTB for a load of 700 N
sults show that the MINR and PAGD lubricants had the higher torque loss from
the group, while PAOR had the lowest torque loss for the load of 700N and MINE had the
lowest torque loss for a load of 7000N. The ESTR oil had an intermediate behaviour for all
For RTB tests there are significant changes on the lubricants behaviour when the load
increases from 700 to 7000 N. For the load of 700N the PAGD lubricant displays the largest
toque loss while the MINR and ESTR had the lowest, result that appears to
lubricants viscosity. For the load of 7000 N the PAGD lubricant had the lowest torque loss for
the lower speeds while the mineral bases had the highest.
The relative behaviour of the lubricants is dependent on the bearing type, being the slid
speed the biggest difference between the TBB and the RTB, and also the contact pressure.
Torque loss of TBB for a load of 7000 N
The RTB total torque loss measurements for a load of 7000N and a speed of 1200rpm had a
erating temperature above 80ºC (the control of temperature does not have cooling
The torque loss measured with TRB was much higher that the measured for TBB. For the
RTB it is observed an increase of torque loss with increasing speed for low load
(Figure 4) while for high load conditions a decrease of torque loss is observed with
Torque loss of RTB for a load of 700 N
sults show that the MINR and PAGD lubricants had the higher torque loss from
the group, while PAOR had the lowest torque loss for the load of 700N and MINE had the
lowest torque loss for a load of 7000N. The ESTR oil had an intermediate behaviour for all
t changes on the lubricants behaviour when the load
increases from 700 to 7000 N. For the load of 700N the PAGD lubricant displays the largest
toque loss while the MINR and ESTR had the lowest, result that appears to be driven by
lubricants viscosity. For the load of 7000 N the PAGD lubricant had the lowest torque loss for
The relative behaviour of the lubricants is dependent on the bearing type, being the sliding
speed the biggest difference between the TBB and the RTB, and also the contact pressure.

Proceedings of the 6th International Conference on Mechanics and Materials in Design,
Editors: J.F. Silva Gomes & S.A. Meguid, P.Delgada/Azores, 26
Figure 6 and Figure 7 display the specific film thickness calculated for the tests performed for
TBB and RTB, respectively. The first fact to be noticed is that T
under boundary lubrication regime, while for the RTB half of the tests were performed in
boundary and half in mixed lubrication regime.
Fig. 6 - Specific film thickness for TBB bearing with
an applied load of 7000 N
FZG GEAR TESTS
The well-known FZG test rig used
has a torque transducer installed (
gearboxes.
Fig. 8 - Schematic representation of the FZG test rig with the input torque (Tin) and torque loss (TL) measured by
A standard spur gear geometry w
geometrical characteristics are represented in
Table 3 - Geometrical properties of the spur and helical tested gears.
al Conference on Mechanics and Materials in Design,
Editors: J.F. Silva Gomes & S.A. Meguid, P.Delgada/Azores, 26-30 July 2015
-1979-
display the specific film thickness calculated for the tests performed for
TBB and RTB, respectively. The first fact to be noticed is that TBB tests were performed
under boundary lubrication regime, while for the RTB half of the tests were performed in
boundary and half in mixed lubrication regime.
Specific film thickness for TBB bearing with Fig. 7 - Specific film thickness for RTB bearing with
an applied load of 7000 N
used in this work (Winter et al., 1985). The FZG test rig used
installed (Fig), allowing to measure the total torque loss (
Schematic representation of the FZG test rig with the input torque (Tin) and torque loss (TL) measured by
the torque meter.
A standard spur gear geometry was tested and also two helical gear geometries. The gears
geometrical characteristics are represented in Table .
Geometrical properties of the spur and helical tested gears.
display the specific film thickness calculated for the tests performed for
BB tests were performed
under boundary lubrication regime, while for the RTB half of the tests were performed in
Specific film thickness for RTB bearing with
. The FZG test rig used
allowing to measure the total torque loss (TL) on both
Schematic representation of the FZG test rig with the input torque (Tin) and torque loss (TL) measured by
as tested and also two helical gear geometries. The gears
Geometrical properties of the spur and helical tested gears.

Symposium_21
Tribology Trends for Higher Efficiency and Reliability
-1980-
Test procedure
The drive gearbox (near the electric motor) has a 40 mm width spur gear and four NJ406
cylindrical roller bearings and it was the same during all tests.
The same type C40 spur gear set was used for testing all the lubricants. The test gearbox
shafts were supported with four NJ406 cylindrical roller bearings when spur gears are tested
(the drive gearbox always use this configuration).
For the test of the helical gear a different case gearbox is used due to the axial forces
generated by the helical gears. The test gearbox has two NJ406 cylindrical rolling bearings
and two QJ308 four point contact ball bearing.
The operating condition used for the gear torque loss tests are represented in Table 4,
including the axial forces as well as an approximate value of the maximum Hertzian contact
pressure for the spur and helical gears.
Four load stages were selected, one (K1) with a very small load to study the churning losses
and the other to study the influence of load at contact pressures similar to the observed in real
wind turbine gearboxes. Three speed were selected, promoting tangential speed on the contact
similar to the observed in each of the wind turbine gearbox multiplier stages.
The gearbox was lubricated using oil injection with a flow of 3 l/min at a constant temperature
of 80 ºC.
The test procedure can be summarize as:
1. Run load stage Ki at each input speed condition (Table 4) during 3h;
- Continuous registry of the assembly working temperatures;
- Continuous torque measurement;
2. Increase the load stage and repeat procedure till the highest load stage
Table 4 - Operating conditions inn the FZG torque loss tests on spur and helical gear tests.
Wheel Speed [rpm]
200 400 1200 Spur C40 Helical H501/H951
FZG
load
stage
Wheel
torque Input power Fr Fa pH Fr Fa pH
Ki [N.m] [W] [N] [N] [MPa
] [N] [N] [MPa]
K1 4.95 104 207 622 37 0 108 37 24 171
K5 104.97 2198 4397 13191 790 0 498 777 518 787
K7 198.68 4161 8322 24967 1495 0 685 1471 980 1083
K9 323.27 6771 13541 40623 2432 0 874 2393 1594 1382

Proceedings of the 6th International Conference on Mechanics and Materials in Design,
Editors: J.F. Silva Gomes & S.A. Meguid, P.Delgada/Azores, 26-30 July 2015
-1981-
The results presented for torque loss measurements and temperature are the average of the last
30 minutes of operation, i.e. the steady state operating conditions.
Experimental results
Table 5 displays the measured torque loss for load stages K1 and K5. It is interesting to
observe that gear H501 displays the lowest torque loss at K1 and that H951gear has roughly
the same torque loss as C40 gear.
At load stage K5 the helical gears already display lower torque loss than the spur gear.
For the highest load stages (K7 and K9), the torque loss measurements are displayed in Table
6. At these load levels the helical gears display lower torque losses, especially the gear H951.
The synthetic lubricants also have highest decrease on torque loss with the helical geometry.
The MINE tests with H951 geometry couldn’t be finished due to a test rig failure.
Discussion
As the film thickness is an important parameter for the understanding of the torque loss and it
is a function of the viscosity and piezoviscosity of each lubricant. The tests were performed at
a constant temperature of 80 ºC. Table 1 displays the viscosity and piezoviscosity for each
lubricant at 80ºC. It is clear that the viscosity of the lubricants has huge differences, with the
PAGD exhibiting almost twice the viscosity of MINR.
This viscosity difference should be immediately reflected in the load stage K1torque loss, as
observed in C40 results, although those viscosity differences are not clear for helical gear
geometries.
The biggest differences observed between oil formulations are observed for the load stages
performed with highest loads (see Table 6). For those conditions, independently of the gear
geometry, the PAGD oil always had the lowest torque loss for the two lowest speeds while
the MINR displayed the highest torque loss for all the tests.
The MINE had in general torque loss results closer to the mineral base than PAGD, while
with PAOR and ESTR the torque loss results were close to the PAGD oil than the mineral
base.
The effect of speed on the torque loss is clearly observed with PAGD oil that increases the
torque loss at a faster pace than the other oils due to its higher viscosity and piezoviscosity.
The observation of the measured torque loss evolution with the increasing speed shows that
for MINR, PAOR and ESTR the minimum value is obtained for 400 rpm at load stage K7
while at load stage K9 the minimum is obtained somewhere between 400 rpm and 1200 rpm,
although for PAGD the minimum value was always obtained for input speeds lower than
400 rpm or even lower than 200 rpm. This behaviour clear indicated that the optimum
operating conditions for PAGD took place at smaller speed, i.e. it generates thicker lubricant
films for lower input speed. It is also clear that for high input speed the PAGD promotes very
high losses due to churning losses both in rolling bearings and gears.

Symposium_21
Tribology Trends for Higher Efficiency and Reliability
-1982-
Table 5 - Evolution of the measured torque loss with speed for load stages K1 and K5. K1 K5
C40
H501
H951
Power loss numerical model
To extend the comprehension of the experimental results presented and to allow the forecast
of power losses in a transmission, a numerical model has been developed and implemented to
calculate the different forms of torque loss inside a gearbox for different operating conditions,
gear geometries and different lubricants (Magalhães et al., 2010, Martins et al., 2011, Martins
et al., 2011, Magalhães et al., 2012, Fernandes et al., 2013, Fernandes et al., 2013, Fernandes
et al., 2013, Fernandes et al., 2013, Fernandes et al., 2014, Marques et al., 2014).
Fig displays an equation presented by (Höhn et al., 2009) including all the sources of power
losses in a gear transmission. There are power losses dependent on load and also no-load
dependent power losses. This division is usually made for gears and bearings. The equations
mainly states that the total power losses (PV) are the sum of: gear no-load losses (PVZ0); load
dependent losses gear losses (PVZP); bearings losses (PVL); seal losses (PVD) and some eventual
auxiliary losses.
The main focus on this work was gears and bearings losses, being those characterized for each
lubricant, gear geometry and rolling bearing used in order to do an accurate fit of the

Proceedings of the 6th International Conference on Mechanics and Materials in Design,
Editors: J.F. Silva Gomes & S.A. Meguid, P.Delgada/Azores, 26-30 July 2015
-1983-
experimental results gathered and to allow a forecasting of power losses for different
operating conditions and gear/bearing geometries.
Table 6 - Evolution of the measured torque loss with speed for load stages K7 and K9.
K7 K9
C40
H501
H951
Fig. 9 - Sources of power losses in a transmission
Fernades et al. (Fernandes et al., 2013, Fernandes et al., 2013, Fernandes et al., 2014) detailed
the numerical model and the calculation procedure, so only some remarks will be presented in
this work.

Symposium_21
Tribology Trends for Higher Efficiency and Reliability
-1984-
Bearing power losses
The bearings power losses were calculated using the SKF numerical model (2005). The
experimental results presented for the RTB and TBB rolling bearings allowed the
determination of the two coefficients of friction parameters (µbl and µEHL) to be used in the
numerical model. Those parameters are lubricant dependent and must be determined for linear
and elliptical contacts i.e. roller thrust bearing (RTB) and thrust ball bearings (TBB),
respectively. Table displays the value of each coefficient of friction for each oil tested,
obtained with the experimental results displayed. These coefficient obtained for each oil
tested, allow the determination of the bearings power losses for different bearing sizes,
different geometries at different operating conditions with much better accuracy.
Table 5 - Boundary (µbl) and EHD (µEHL) coefficient of friction for TBB and RTB bearings at 80ºC.
Gears power losses
With the numerical model of the rolling bearings calibrated, it was possible to use the
experimental results obtained with the FZG gear tests to obtain the friction coefficient
between gear teeth minimizing the difference between the numerical power loss calculation
and the experimental results.
The numerical determination of the gears power losses were performed according to Hohn et
al. (Höhn et al., 1996). On this formulation special attention must be paid to the gear loss
factor (HV) once this is the factor that distinguishes the different gear geometries. The load
dependent power losses on the gears (PVZP) are calculated according to (Equation 1). The gear
loss factor is calculated according to (Equation 2) and is also dependent on the load
distribution along the path of contact, especially for the helical gears. The average friction
coefficient between teeth contact is determined according to (Equation 3) that is dependent on
the lubricant parameter (XL).
The lubricant parameter (XL) is the parameter that translates the influence of the lubricant on
the gear friction. The (XL) was obtained through the experimental tests presented.
Proceedings of the 6th International Conference on Mechanics and Materials in Design,
Editors: J.F. Silva Gomes & S.A. Meguid, P.Delgada/Azores, 26
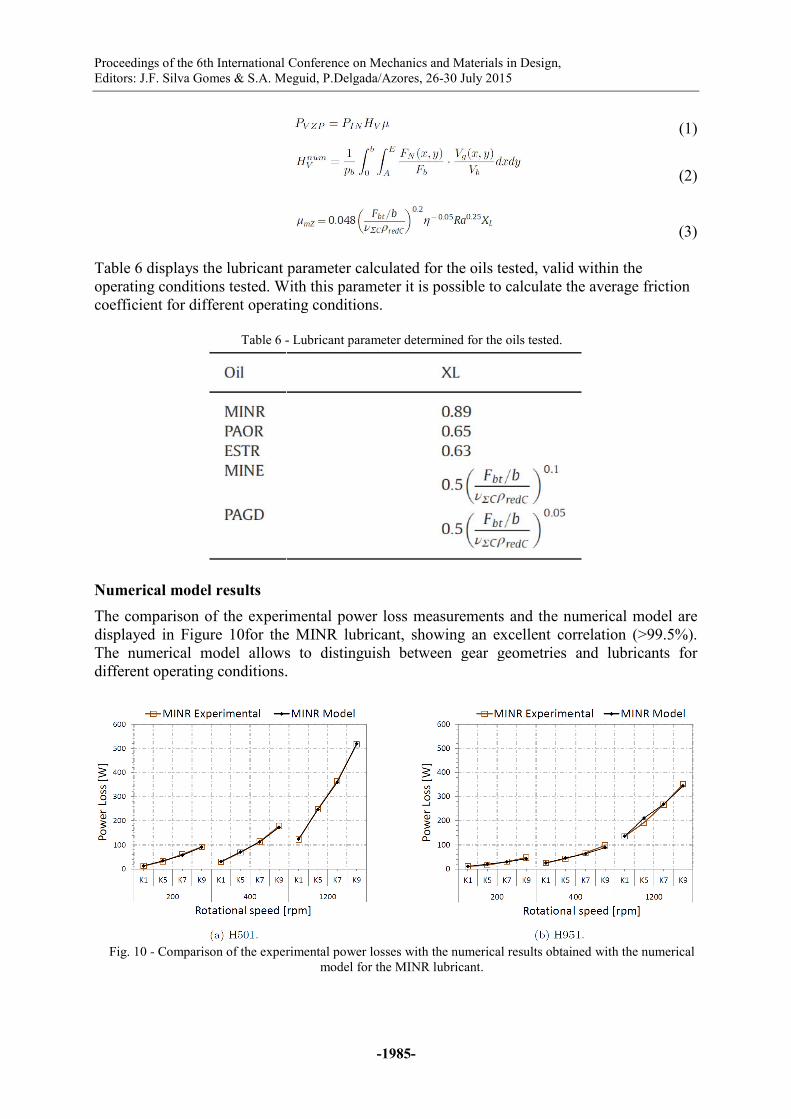
Table 6 displays the lubricant parameter cal
operating conditions tested. With this parameter it is possible to calculate the average friction
coefficient for different operating conditions.
Table 6 -
Numerical model results
The comparison of the experimental power loss measurements and the numerical model are
displayed in Figure 10for the MINR lubricant, showing an excellent correlation (>99.5%).
The numerical model allows to distinguish between gear
different operating conditions.
Fig. 10 - Comparison of the experimental power losses with the numerical results obtained with the numerical
al Conference on Mechanics and Materials in Design,
Editors: J.F. Silva Gomes & S.A. Meguid, P.Delgada/Azores, 26-30 July 2015
-1985-
displays the lubricant parameter calculated for the oils tested, valid within the
operating conditions tested. With this parameter it is possible to calculate the average friction
coefficient for different operating conditions.
- Lubricant parameter determined for the oils tested.
The comparison of the experimental power loss measurements and the numerical model are
for the MINR lubricant, showing an excellent correlation (>99.5%).
The numerical model allows to distinguish between gear geometries and lubricants for
different operating conditions.
Comparison of the experimental power losses with the numerical results obtained with the numerical
model for the MINR lubricant.
(1)
(2)
(3)
culated for the oils tested, valid within the
operating conditions tested. With this parameter it is possible to calculate the average friction
The comparison of the experimental power loss measurements and the numerical model are
for the MINR lubricant, showing an excellent correlation (>99.5%).
geometries and lubricants for
Comparison of the experimental power losses with the numerical results obtained with the numerical

Symposium_21
Tribology Trends for Higher Efficiency and Reliability
-1986-
CONCLUSION
The experimental results allowed to observe the influence of different oil formulations on
rolling bearings and gears power losses, it also allowed to infer the influence of an optimized
gear geometry on the power losses.
The combination of the best gear geometry with the best oil formulation the global efficiency
of the gearbox was improved over 1%.
The power loss model, using the inputs determined using the RTB and TBB torque loss tests
and the FZG power loss tests, proved to accurately predict the experimental results. The use
of the two rolling bearings friction coefficients (µbl and µEHL) and the XL lubricant parameter
are fundamental for a correct prediction of the numerical model.
ACKNOWLEDGMENTS
The authors gratefully acknowledge the funding by - Fundação para a Ciência e a Tecnologia
within the project EXCL/EMS-PRO/0103/2012. This work was co-funded by: COMPETE,
QREN, EU.
REFERENCES
[1]-(2005). SKF General Catalogue 6000 EN, SKF.
[2]- (2005). SKF General Catalogue 6000 EN.
[3]-Ariura, Y. and T. Ueno (1975). "The lubricant churning loss and its behavior in gearbox in
cylindical gear systems." Journal of Japan Society of Lubrication Engineers 20, Nº 3: -.
[4]-Changenet, C., G. Leprince, F. Ville and P. Velex (2011). "A Note on Flow Regimes and
Churning Loss Modeling." Journal of Mechanical Design 133(12): 121009.
[5]-Changenet, C. and P. Velex (2007). "A Model for the Prediction of Churning Losses in
Geared Transmissions---Preliminary Results." Journal of Mechanical Design 129(1): 128-133.
[6]-Cousseau, T., B. Graça, A. Campos and J. Seabra (2011). "Friction torque in grease
lubricated thrust ball bearings." Tribology International 44(5): 523-531.
[7]-Diab, Y., F. Ville, P. Velex and C. Changenet (2004). "Windage losses in high speed
gears - Preliminary experimental and theoretical results." Journal of Mechanical Design
126(5): 903-908.
[8]-Eschmann, P., L. Hasbargen and K. Weigand (1985). Ball and Roller Bearings - Theory,
Design, and Application, John Wiley and Sons.
[9]-Fernandes, C. M. C. G., P. M. P. Amaro, R. C. Martins and J. H. O. Seabra (2013).
"Torque loss in cylindrical roller thrust bearings lubricated with wind turbine gear oils at
constant temperature." Tribology International 67(0): 72-80.
[10]-Fernandes, C. M. C. G., P. M. P. Amaro, R. C. Martins and J. H. O. Seabra (2013).
"Torque loss in thrust ball bearings lubricated with wind turbine gear oils at constant
temperature." Tribology International 66(0): 194-202.
[11]-Fernandes, C. M. C. G., P. M. T. Marques, R. C. Martins and J. H. O. Seabra (2014).
"Gearbox power loss. Part I: Losses in rolling bearings." Tribology International.

Proceedings of the 6th International Conference on Mechanics and Materials in Design,
Editors: J.F. Silva Gomes & S.A. Meguid, P.Delgada/Azores, 26-30 July 2015
-1987-
[12]-Fernandes, C. M. C. G., R. C. Martins and J. H. O. Seabra (2013). "Friction torque of
cylindrical roller thrust bearings lubricated with wind turbine gear oils." Tribology
International 59(0): 121-128.
[13]-Fernandes, C. M. C. G., R. C. Martins and J. H. O. Seabra (2013). "Friction torque of
thrust ball bearings lubricated with wind turbine gear oils." Tribology International 58(0): 47-
54.
[14]-Fernandes, C. M. C. G., R. C. Martins and J. H. O. Seabra (2014). "Torque loss of type
C40 FZG gears lubricated with wind turbine gear oils." Tribology International 70(0): 83-93.
[15]-Höhn, B.-R., K. Michaelis and M. Hinterstoißer (2009). "Optimization of gearbox
efficiency." Goriva i maziva 48(4): 441-480.
[16]-Höhn, B.-R., K. Michaelis and T. Vollmer (1996). "Thermal Rating of Gear Drives:
Balance Between Power Loss and Heat Dissipation." AGMA Technical Paper.
[17]-Hohn, B. R. and K. Michaelis (2004). "Influence of oil temperature on gear failures."
Tribology International 37(2): 103-109.
[18]-Hohn, B. R., K. Michaelis and T. Vollmer (1996). "Thermal Rating of Gear Drives:
Balance Between Power Loss and Heat Dissipation." AGMA Technical Paper: %&.
[19]-Magalhães, L., R. Martins, C. Locateli and J. Seabra (2010). "Influence of tooth profile
and oil formulation on gear power loss." Tribology International 43(10): 1861-1871.
[20]-Magalhães, L., R. Martins, I. Oliveira and J. Seabra (2012). "Comparison of tooth
profiles and oil formulation focusing lower power losses." Proceedings of the Institution of
Mechanical Engineers, Part J: Journal of Engineering Tribology 226(6): 529-540.
[21]-Marques, P. M. T., C. M. C. G. Fernandes, R. C. Martins and J. H. O. Seabra (2013).
"Power losses at low speed in a gearbox lubricated with wind turbine gear oils with special
focus on churning losses." Tribology International 62(0): 186-197.
[22]-Marques, P. M. T., C. M. C. G. Fernandes, R. C. Martins and J. H. O. Seabra (2014).
"Efficiency of a gearbox lubricated with wind turbine gear oils." Tribology International
71(0): 7-16.
[23]-Martins, R., N. Cardoso and J. Seabra (2008). "Gear power loss performance of
biodegradable low-toxicity ester-based oils." Proceedings of the Institution of Mechanical
Engineers Part J-Journal of Engineering Tribology 222(J3): 431-440.
[24]-Martins, R., J. Seabra, A. Brito, C. Seyfert, R. Luther and A. Igartua (2006). "Friction
coefficient in FZG gears lubricated with industrial gear oils: Biodegradable ester vs. mineral
oil." Tribology International 39(6): 512-521.
[25]-Martins, R. C., N. F. R. Cardoso, H. Bock, A. Igartua and J. H. O. Seabra (2009). "Power
loss performance of high pressure nitrided steel gears." Tribology International 42(11-12):
1807-1815.
[26]-Martins, R. C., P. S. Moura and J. O. Seabra (2005). "Power loss in FZG gears: Mineral
oil vs. biodegradable ester and carburized steel vs. austempered ductile iron vs. MoS2-Ti
coated steel." VDI Berichte Vol. II(Nr. 1904): 1467-1486.
[27]-Martins, R. C., J. H. O. Seabra and L. F. Moron (2011). "Influence of PAO plus ester oil
formulations on gear micropitting and efficiency." International Journal of Surface Science
and Engineering 5(4): 312-329.

Symposium_21
Tribology Trends for Higher Efficiency and Reliability
-1988-
[28]-Martins, R. C., J. H. O. Seabra and L. F. Ruis-Moron (2011). "Influence of oil
formulation on gear micropitting and power loss performance." Proceedings of the Institution
of Mechanical Engineers, Part J: Journal of Engineering Tribology 225(6): 429-439.
[29]-Maurer, J. (1994). "Ventilationsverluste." FVA Forschungsvorhaben Nr. 44/VI Heft 432.
[30]-Mauz, W. (1987). Hydraulische Verlute von Stirnradgetrieben bei
Umfangsgeschwindigkeiten bis 60 m/s, Dissertation Uni Stuttgart.
[31]-Seetharaman, S. and A. Kahraman (2009). "Load-Independent Spin Power Losses of a
Spur Gear Pair: Model Formulation." Journal of Tribology 131(2): 022201.
[32]-Winter, H. and K. Michaelis (1985). FZG gear test rig - Desciption and possibilities.
Coordinate European Council: Second International Symposium on The performance
Evaluation of Automotive Fuels and Lubricants. West Germany.