Embed Size (px)
Citation preview
U.S. International Trade CommissionPublication 4372 February 2013
Washington, DC 20436
Utility Scale Wind Towers from China and Vietnam
Investigation Nos. 701-TA-486 and 731-TA-1195-1196 (Final)
U.S. International Trade Commission
COMMISSIONERS
Irving A. Williamson, Chairman Daniel R. Pearson Shara L. Aranoff Dean A. Pinkert
David S. Johanson Meredith M. Broadbent
Robert B. Koopman
Staff assigned
Address all communications to Secretary to the Commission
United States International Trade Commission Washington, DC 20436
Director, Office of Operations
Nathanael Comly, Investigator Andrew David, Industry Analyst
Craig Thomsen, Economist David Boyland, Accountant
Michael Haldenstein, Attorney Mara Alexander, Statistician
Douglas Corkran, Supervisory Investigator
Special assistance fromDavid Goldfine, Attorney
U.S. International Trade CommissionWashington, DC 20436
www.usitc.gov
Publication 4372 February 2013
Utility Scale Wind Towers from China and Vietnam
Investigation Nos. 701-TA-486 and 731-TA-1195-1196 (Final)

CONTENTS
i
Determinations .............................................................................................................................................. 1 Views of the Commission ............................................................................................................................. 3 Views of Commissioner Dean A. Pinkert ................................................................................................... 31 Dissenting views of Commissioners Daniel R. Pearson, David S. Johanson, and
Meredith M. Broadbent .......................................................................................................................... 37
Part I: Introduction ............................................................................................................................. I-1 Background ............................................................................................................................................ I-1 Statutory criteria and organization of the report .................................................................................... I-1
Statutory criteria ................................................................................................................................. I-1 Organization of report ........................................................................................................................ I-2 Market summary ................................................................................................................................ I-3
Summary data and data souces .............................................................................................................. I-3 Previous and related investigations ........................................................................................................ I-3 Nature and extent of subsidies and sales at LTFV ................................................................................. I-4
Subsidies ............................................................................................................................................ I-4 Sales at LTFV .................................................................................................................................... I-5
The subject merchandise ....................................................................................................................... I-6 Commerce’s scope ............................................................................................................................. I-6 Tariff treatment .................................................................................................................................. I-7
The product ........................................................................................................................................... I-7 Description and applications .............................................................................................................. I-7 Manufacturing processes ................................................................................................................. I-12
Domestic like product issues ............................................................................................................... I-17 Physical characteristics and uses ...................................................................................................... I-17 Manufacturing facilities and production employees ........................................................................ I-17 Interchangeability ............................................................................................................................ I-18 Customer and producer perceptions ................................................................................................. I-18 Channels of distribution ................................................................................................................... I-18 Price ................................................................................................................................................. I-18
Part II: Supply and demand information ........................................................................................... II-1 U.S. market characteristics ................................................................................................................... II-1 Channels of distribution ....................................................................................................................... II-1 Geographic distribution ........................................................................................................................ II-1 Supply and demand considerations ...................................................................................................... II-2
U.S. supply ........................................................................................................................................ II-2 Foreign supply .................................................................................................................................. II-3 U.S. demand ...................................................................................................................................... II-5
Substitutability issues ......................................................................................................................... II-12 Purchaser characteristics ................................................................................................................. II-12 Knowledge of country sources and suppliers ................................................................................. II-13 Long-term supply agreements ......................................................................................................... II-14 Factors affecting purchasing decisions ........................................................................................... II-14 Lead times ....................................................................................................................................... II-19 Comparisons of domestic products, subject imports, and nonsubject imports ............................... II-19
Elasticity estimates .............................................................................................................................. II-21 U.S. supply elasticity ...................................................................................................................... II-22 U.S. demand elasticity .................................................................................................................... II-22 Substitution elasticity ...................................................................................................................... II-22
CONTENTS
ii
Part III: U.S. producers’ production, shipments, and employment ................................................ III-1 U.S. producers ...................................................................................................................................... III-5 U.S. production, capacity, and capacity utilization .............................................................................. III-6
Aggregate wind tower operations .................................................................................................... III-6 Supply agreements ........................................................................................................................... III-7 Facility level wind tower operations ................................................................................................ III-8 Monthly wind tower operations ..................................................................................................... III-10 2012/13 wind tower operations ...................................................................................................... III-10
U.S. producers’ shipments ................................................................................................................. III-11 U.S. producers’ inventories ................................................................................................................ III-12 U.S. producers’ imports and purchases .............................................................................................. III-12 U.S. employment, wages, and productivity ....................................................................................... III-13
Part IV: U.S. imports, apparent U.S. consumption, and market shares ......................................... IV-1 U.S. importers ..................................................................................................................................... IV-1 U.S. imports ........................................................................................................................................ IV-3 Negligibility ........................................................................................................................................ IV-7 Cumulation considerations .................................................................................................................. IV-7
Geography ....................................................................................................................................... IV-8 Presence in the market .................................................................................................................... IV-8
Apparent U.S. consumption .............................................................................................................. IV-10 U.S. market shares ............................................................................................................................ IV-11 Ratio of imports to U.S. production .................................................................................................. IV-12
Part V: Pricing and related information ............................................................................................ V-1 Factor affecting prices ........................................................................................................................... V-1
Raw material costs ............................................................................................................................ V-1 Transportation costs .......................................................................................................................... V-1
Pricing practices .................................................................................................................................... V-2 Pricing methods ................................................................................................................................ V-2 Sales terms and discounts ................................................................................................................. V-2
Price data ............................................................................................................................................... V-3 GE’s projects ..................................................................................................................................... V-3 GE’s estimated delivered costs ......................................................................................................... V-5 Siemens’s projects ............................................................................................................................ V-5 Other purchasers’ projects ................................................................................................................ V-8
Lost sales and lost revenues .................................................................................................................. V-8
Part VI: Financial experience of the U.S. producers ........................................................................ VI-1 Background ......................................................................................................................................... VI-1 Operations on wind towers ................................................................................................................. VI-1
Revenue .......................................................................................................................................... VI-2 Cost of goods sold and gross profit (loss) ....................................................................................... VI-5 SG&A expenses and operating income or (loss) ............................................................................ VI-9 Non-recurring items ...................................................................................................................... VI-11
Capital expenditures and research and development expenses ......................................................... VI-11 Capital and investment ...................................................................................................................... VI-12
Actual negative effects .................................................................................................................. VI-12 Anticipated negative effects .......................................................................................................... VI-12
CONTENTS
iii
Part VII: Threat considerations and information on nonsubject countries ................................... VII-1 The industry in China ......................................................................................................................... VII-2
Overview ........................................................................................................................................ VII-2 Wind tower operations ................................................................................................................... VII-5
The industry in Vietnam .................................................................................................................... VII-8 Overview ........................................................................................................................................ VII-8 Wind tower operations ................................................................................................................... VII-8
Combined data for the industries in China and Vietnam ................................................................... VII-9 U.S. importers’ inventories .............................................................................................................. VII-10 U.S. importers’ current orders.......................................................................................................... VII-10 Antidumping or countervailing duty orders in third-country markets ............................................. VII-10 Information on nonsubject countries ................................................................................................ VII-11
Global installations ...................................................................................................................... VII-11 Global shipments ......................................................................................................................... VII-12 Leading nonsubject suppliers to U.S. market............................................................................... VII-13
Appendixes A. Federal Register notices ................................................................................................................. A-1 B. Hearing witnesses ........................................................................................................................... B-1 C. Summary data ................................................................................................................................. C-1 D. Wind tower projects in the United States ....................................................................................... D-1 E. Selected monthly U.S. producers’ data .......................................................................................... E-1 F. GE’s preliminary phase price data ................................................................................................ F-1
Note.—Information that would reveal confidential operations of individual concerns may not be published and therefore has been deleted from this report. Such deletions are indicated by asterisks.

1
UNITED STATES INTERNATIONAL TRADE COMMISSION
Investigation Nos. 701-TA-486 and 731-TA-1195-1196 (Final)
UTILITY SCALE WIND TOWERS FROM CHINA AND VIETNAM
DETERMINATIONS
On the basis of the record1 developed in the subject investigations, the United States International Trade Commission (Commission) determines, pursuant to sections 705(b) and 735(b) of the Tariff Act of 1930 (19 U.S.C. ' 1671d(b)) and (19 U.S.C. ' 1673d(b)) (the Act), that an industry in the United States is materially injured or threatened with material injury by reason of imports of utility scale wind towers from China and Vietnam, provided for in subheading 7308.20.00 of the Harmonized Tariff Schedule of the United States, that the U.S. Department of Commerce has determined are subsidized by the Government of China and sold in the United States at less than fair value (ALTFV@).2 3
BACKGROUND
The Commission instituted these investigations effective December 29, 2011, following receipt of a petition filed with the Commission and Commerce by Broadwind Towers, Inc., Manitowoc, WI; DMI Industries, Fargo, ND; Katana Summit LLC, Columbus, NE; and Trinity Structural Towers, Inc., Dallas, TX. The final phase of the investigations was scheduled by the Commission following notification of preliminary determinations by Commerce that imports of utility scale wind towers from China were subsidized within the meaning of section 703(b) of the Act (19 U.S.C. ' 1671b(b)) and that such imports from China and Vietnam were dumped within the meaning of 733(b) of the Act (19 U.S.C. ' 1673b(b)). Notice of the scheduling of the final phase of the Commission=s investigations and of a public hearing to be held in connection therewith was given by posting copies of the notice in the Office of the Secretary, U.S. International Trade Commission, Washington, DC, and by publishing the notice in the Federal Register on August 22, 2012 (77 FR 50715). The hearing was held in Washington, DC, on December 13, 2012, and all persons who requested the opportunity were permitted to appear in person or by counsel.
1 The record is defined in sec. 207.2(f) of the Commission=s Rules of Practice and Procedure (19 CFR ' 207.2(f)).
2 Chairman Irving A. Williamson and Commissioner Shara L. Aranoff determine that an industry in the United States is materially injured by reason of imports of utility scale wind towers from China and Vietnam. Commissioner Dean A. Pinkert determines that an industry in the United States is threatened with material injury by reason of imports from China and Vietnam of utility scale wind towers. He further determines that he would not have found material injury but for the suspension of liquidation. 3 Commissioners Daniel R. Pearson, David S. Johanson, and Meredith M. Broadbent determine that an industry in the United States is not materially injured or threatened with material injury by reason of imports from China and Vietnam of utility scale wind towers.

VIEWS OF THE COMMISSION
Based on the record in these investigations, we find that an industry in the United States ismaterially injured by reason of imports of utility scale wind towers (“wind towers”) from China found bythe U.S. Department of Commerce (“Commerce”) to be subsidized and sold in the United States at lessthan fair value and imports of wind towers from Vietnam found by Commerce to be sold in the UnitedStates at less than fair value.1 2
I. BACKGROUND
The petitions in these investigations were filed by the Wind Tower Trade Coalition(“Petitioners”).3 Petitioners appeared at the hearing and filed prehearing and posthearing briefs.4 A groupof respondents consisting of CS Wind Tech Co., Ltd. (“CS Wind (China)”), CS Wind Vietnam Co., Ltd.(“CS Wind (Vietnam)”), Chengxi Shipyard Co., Ltd. (“Chengxi”), Titan Wind Energy Suzhou Co., Ltd(“Suzhou”), and Shanghai Taisheng Wind Power Equipment Co., Ltd., each of which produces andexports subject merchandise, and the China Chamber of Commerce for Import & Export of Machinery &Electronic Products, an association of Chinese producers of the subject merchandise (collectively,“Foreign Respondents”), filed prehearing and posthearing briefs. Siemens Energy, Inc. and SiemensPower Generation (“Siemens”), an importer of subject merchandise and purchaser of the domestic likeproduct, filed prehearing and posthearing briefs. GE Generators (Pensacola), LLC (“GE”), which is alsoan importer and purchaser, filed a posthearing brief.
U.S. industry data are based on questionnaire responses of six firms that accounted for more than*** percent of U.S. shipments of wind towers during 2011.5 U.S. import data are based on questionnaireresponses that cover over 95 percent of subject imports from China and Vietnam during the period fromJanuary 2009 to June 2012.6
Five Chinese producers responded to the Commission’s questionnaire in the final phase of theinvestigations; two of those firms, Chengxi and CS Wind (China), estimated that they accounted for ***percent of total exports to the United States of wind towers from China in 2011.7 Data provided by twoVietnamese producers of wind towers that responded to the Commission’s questionnaire, CS Wind
1 Commissioner Dean A. Pinkert determines that a domestic industry is threatened with material injury by reasonof subject imports of wind towers from China and Vietnam. See Views of Commissioner Dean A. Pinkert. Exceptto the extent otherwise noted, he joins sections I-VI of these views.
2 Commissioners Daniel R. Pearson, David S. Johanson, and Meredith M. Broadbent determine that a domesticindustry is neither materially injured nor threatened with material injury by reason of subject imports of wind towersfrom China and Vietnam. See Dissenting Views of Commissioners Daniel R. Pearson, David S. Johanson, andMeredith M. Broadbent. Except to the extent otherwise noted, they join sections I-VI of these views.
3 The Wind Tower Trade Coalition consists of the following domestic producers of wind towers: BroadwindTowers, Inc. of Manitowoc, Wisconsin; DMI Industries of Fargo, North Dakota; Katana Summit LLC of Columbus,Nebraska; and Trinity Structural Towers, Inc. of Dallas, Texas.
4 Confidential Staff Report, INV-LL-002 (January 7, 2013) (revised by INV-LL-006, Jan. 11, 2013) (“CR”) at I-1; Public Report, Utility Scale Wind Towers from China and Vietnam, Inv. Nos. 701-TA-486 and731-TA-1195-1196 (Final), USITC Pub 4372 (January 2013) (“PR”) at I-1.
5 CR/PR at III-1 n.1.
6 CR/PR at IV-1.
7 CR/PR at VII-5.
3
(Vietnam) and UBI, reportedly accounted for the vast majority of production of subject wind towers inVietnam and *** exports of wind towers to the United States from Vietnam in 2011.8
II. DOMESTIC LIKE PRODUCT
A. In General
In determining whether an industry in the United States is materially injured or threatened withmaterial injury by reason of imports of subject merchandise, the Commission first defines the “domesticlike product” and the “industry.”9 Section 771(4)(A) of the Tariff Act of 1930, as amended (“the TariffAct”), defines the relevant domestic industry as the “producers as a whole of a domestic like product, orthose producers whose collective output of a domestic like product constitutes a major proportion of thetotal domestic production of the product.”10 In turn, the Tariff Act defines “domestic like product” as “aproduct which is like, or in the absence of like, most similar in characteristics and uses with, the articlesubject to an investigation.”11
The decision regarding the appropriate domestic like product in an investigation is a factualdetermination, and the Commission has applied the statutory standard of “like” or “most similar incharacteristics and uses” on a case-by-case basis.12 No single factor is dispositive, and the Commissionmay consider other factors it deems relevant based on the facts of a particular investigation.13 TheCommission looks for clear dividing lines among possible like products and disregards minor variations.14 Although the Commission must accept Commerce’s determination as to the scope of the importedmerchandise that is subsidized or sold at less than fair value,15 the Commission determines what domesticproduct is like the imported articles Commerce has identified.16
8 CR at VII-11, PR at VII-8.
9 19 U.S.C. § 1677(4)(A).
10 19 U.S.C. § 1677(4)(A).
11 19 U.S.C. § 1677(10).
12 See, e.g., Cleo Inc. v. United States, 501 F.3d 1291, 1299 (Fed. Cir. 2007); NEC Corp. v. Department ofCommerce, 36 F. Supp. 2d 380, 383 (Ct. Int’l Trade 1998); Nippon Steel Corp. v. United States, 19 CIT 450, 455(1995); Torrington Co. v. United States, 747 F. Supp. 744, 749 n.3 (Ct. Int’l Trade 1990), aff’d, 938 F.2d 1278 (Fed.Cir. 1991) (“every like product determination ‘must be made on the particular record at issue’ and the ‘unique factsof each case’”). The Commission generally considers a number of factors, including the following: (1) physicalcharacteristics and uses; (2) interchangeability; (3) channels of distribution; (4) customer and producer perceptionsof the products; (5) common manufacturing facilities, production processes, and production employees; and, whereappropriate, (6) price. See Nippon, 19 CIT at 455 n.4; Timken Co. v. United States, 913 F. Supp. 580, 584 (Ct. Int’lTrade 1996).
13 See, e.g., S. Rep. No. 96-249 at 90-91 (1979).
14 Nippon, 19 CIT at 455; Torrington, 747 F. Supp. at 748-49; see also S. Rep. No. 96-249 at 90-91 (1979)(Congress has indicated that the like product standard should not be interpreted in “such a narrow fashion as topermit minor differences in physical characteristics or uses to lead to the conclusion that the product and article arenot ‘like’ each other, nor should the definition of ‘like product’ be interpreted in such a fashion as to preventconsideration of an industry adversely affected by the imports under consideration.”).
15 See, e.g., USEC, Inc. v. United States, 34 Fed. Appx. 725, 730 (Fed. Cir. 2002) (“The ITC may not modify theclass or kind of imported merchandise examined by Commerce.”); Algoma Steel Corp. v. United States, 688 F.Supp. 639, 644 (Ct. Int’l Trade 1988), aff’d, 865 F.3d 240 (Fed. Cir.), cert. denied, 492 U.S. 919 (1989).
16 Hosiden Corp. v. Advanced Display Mfrs., 85 F.3d 1561, 1568 (Fed. Cir. 1996) (the Commission may find asingle like product corresponding to several different classes or kinds defined by Commerce); Cleo, 501 F.3d at 1298
(continued...)
4
B. Scope of These Investigations
Commerce defined the scope of the imported merchandise under investigation as follows:
certain wind towers, whether or not tapered, and sections thereof. Certain wind towers aredesigned to support the nacelle and rotor blades in a wind turbine with a minimum rated electricalpower generation capacity in excess of 100 kilowatts (‘‘kW’’) and with a minimum height of 50meters measured from the base of the tower to the bottom of the nacelle (i.e., where the top of thetower and nacelle are joined) when fully assembled.
A wind tower section consists of, at a minimum, multiple steel plates rolled intocylindrical or conical shapes and welded together (or otherwise attached) to form a steelshell, regardless of coating, end-finish, painting, treatment, or method of manufacture,and with or without flanges, doors, or internal or external components (e.g., flooring/decking, ladders, lifts, electrical buss boxes, electrical cabling, conduit, cable harness fornacelle generator, interior lighting, tool and storage lockers) attached to the wind towersection. Several wind tower sections are normally required to form a completed windtower.
Wind towers and sections thereof are included within the scope whether or not they arejoined with nonsubject merchandise, such as nacelles or rotor blades, and whether or notthey have internal or external components attached to the subject merchandise.
Specifically excluded from the scope are nacelles and rotor blades, regardless of whetherthey are attached to the wind tower. Also excluded are any internal or externalcomponents which are not attached to the wind towers or sections thereof.17
Wind towers are large tubular steel towers that are part of wind turbines. Wind turbines convertthe mechanical energy of wind to electrical energy and are comprised of three main components – thenacelle, rotor, and tower.18 The nacelle houses the wind turbine’s main power generation components(the gearbox, generator, and other components), while the rotor typically consists of three blades and thehub. The nacelle sits on top of the wind tower.19 As the above language makes clear, wind towers withinthe scope of these investigations are 50 meters or more in height and designed to support the nacelle androtor blades in a wind turbine with a minimum rated electrical power generation capacity in excess of 100kilowatts.20 These towers are known in the industry as “utility scale” wind towers.21
16 (...continued)n.1 (“Commerce’s {scope} finding does not control the Commission’s {like product} determination.”); Torrington,747 F. Supp. at 748-52 (affirming the Commission’s determination defining six like products in investigations inwhich Commerce found five classes or kinds).
17 Utility Scale Wind Towers From the People’s Republic of China: Final Affirmative Countervailing DutyDetermination, 77 Fed. Reg. 75978 (Dec. 26, 2012). See also 77 Fed. Reg. 75985 (Dec. 26, 2012); 77 Fed. Reg.75993-94 (Dec. 26, 2012).
18 CR at I-9, PR at I-7.
19 CR at I-9, PR at I-7.
20 CR at I-8, PR at I-6.
21 CR at I-9 to I-10, PR at I-8.
5
C. Analysis
In its preliminary determinations, the Commission rejected Siemens’s argument that wind towersproduced for Siemens’s turbines should be defined as a separate like product.22 The Commission foundthat all wind towers, regardless of original equipment manufacturer (“OEM”)23 design, shared commonphysical characteristics and uses, channels of distribution, manufacturing facilities, production processesand employees, and producer and customer perceptions. It noted that wind towers are made to orderbased on a purchaser’s specification for a particular wind project and that multiple domestic producersmay produce wind towers to a particular design. Wind tower designs vary in terms of their size, steelstandards, welding standards, and the components included in the wind towers by the manufacturer. TheCommission determined that such variations constituted only minor differences that were not anappropriate basis for defining a separate domestic like product. The Commission found that, althoughthere is a lack of interchangeability among wind towers produced to different OEMs’ designspecifications, such limited interchangeability among wind tower designs was not unexpected for made-to-order products, and it did not change the Commission’s analysis of the other like product factors.24
In these final phase investigations, Siemens again argues that wind towers produced for itsturbines are unique and should be a separate domestic like product.25 It asserts that there is “new information on the record” distinguishing the wind towers made for its turbines from towers made for GE,namely that GE is moving toward using a standardized set of towers while Siemens is not.26
The record in this final phase is not materially different from that in the preliminary phase and supports defining a single domestic like product that is coextensive with the scope of the investigations. Siemens does not identify any new information in the record that undermines our conclusion that thedifferences between wind towers produced for different OEMs (such as size, steel standards, weldingstandards, and components) are minor and do not constitute clear dividing lines. In our view, there are nosignificant differences between the physical characteristics, uses, and methods of production of the windtowers that Siemens purchases and those of the wind towers that other OEMs purchase. Consequently,we find that the information in the record of these final phase investigations continues to indicate thatSiemens’s argument for dividing wind towers into separate like products based upon OEM design lacksmerit. We therefore find that all wind towers within the scope of the investigations constitute a singledomestic like product.
III. DOMESTIC INDUSTRY
The domestic industry is defined as the domestic “producers as a whole of a domestic likeproduct, or those producers whose collective output of a domestic like product constitutes a majorproportion of the total domestic production of the product.”27 In defining the domestic industry, theCommission’s general practice has been to include in the industry producers of all domestic production ofthe like product, whether toll-produced, captively consumed, or sold in the domestic merchant market.
22 Utility Scale Wind Towers from China and Vietnam, Inv. Nos. 701-TA-486 and 731-TA-1195-1196(Preliminary), USITC Pub. 4304 (Feb. 2012) (“USITC Pub. 4304") at 8.
23 As used in the wind industry, an OEM is an original equipment manufacturer that purchases wind towers foruse in the production and installation of finished wind turbines.
24 USITC Pub. 4304 at 8.
25 Siemens’s Prehearing Brief at 53-58.
26 Siemens’s Prehearing Brief at 57.
27 19 U.S.C. § 1677(4)(A).
6
The statute defines the relevant industry as the “producers as a [w]hole of a domestic like product, orthose producers whose collective output of a domestic like product constitutes a major proportion of theproduct.”28
In these final phase investigations, we have considered whether appropriate circumstances existto exclude domestic producer *** from the domestic industry pursuant to the statutory related partiesprovision.29 ***. *** affiliated subsidiary imported subject merchandise from *** during the period ofinvestigation,30 thus making *** a related party under the statute.31
Petitioners argue that exclusion of *** is appropriate.32 Petitioners contend that *** imports asignificant quantity of subject product and that its interests do not principally lie in U.S. production.33 The Foreign Respondents and Siemens oppose excluding ***, arguing that *** imported because its U.S.production could not meet its own demand for wind towers.34
We find that *** principal interest lies in domestic production. It was the *** largest domesticproducer during 2011, accounting for *** percent of total domestic production.35 It ***, and its U.S.production increased *** during the period.36 Its imports of subject merchandise in 2010 and 2011 were
28 19 U.S.C. § 1677(4)(A).
29 19 U.S.C. § 1677(4)(B). The primary factors the Commission has examined in deciding whether appropriatecircumstances exist to exclude a related party include:
(1) the percentage of domestic production attributable to the importing producer;
(2) the reason the U.S. producer has decided to import the product subject to investigation,i.e., whether the firm benefits from the LTFV sales or subsidies or whether the firm mustimport in order to enable it to continue production and compete in the U.S. market, and
(3) the position of the related producer vis-a-vis the rest of the industry, i.e., whetherinclusion or exclusion of the related party will skew the data for the rest of the industry.
See, e.g., Torrington Co. v. United States, 790 F. Supp. 1161 (Ct. Int’l Trade 1992), aff’d without opinion, 991 F.2d809 (Fed. Cir. 1993). The Commission has also considered the ratio of import shipments to U.S. production forrelated producers and whether the primary interest of the related producer lies in domestic production or importation. See, e.g., Open-End Spun Rayon Singles Yarn from Austria, Inv. No. 731-TA-751 (Preliminary), USITC Pub. 2999at 7 n.39 (October 1996). These latter two considerations were cited as appropriate factors as well in Allied MineralProducts, Inc. v. United States, —Fed. Supp. 2d.—, Slip Op. 04-139 (Ct. Int’l Trade November 12, 2004) at 6.
30 The period for which data were collected in the final phase of these investigations includes 2009-2011 and thefirst six months of 2012 (“interim 2012.”).
31 CR/PR at Table III-12. In the preliminary investigations, the Commission found that *** was increasing itsdomestic production of wind towers and that there was no indication that its imports shielded it from subject importsor otherwise skewed its performance given that it performed worse than the rest of the domestic industry. USITCPub. 4304 at 9-10. The Commission also noted that *** the petition and that no party argued for its exclusion fromthe domestic industry. It therefore found that appropriate circumstances did not exist to exclude *** and defined thedomestic industry to include all U.S. producers of wind towers. USITC Pub. 4304 at 10.
32 Petitioners’ Prehearing Brief at 11-23.
33 Petitioners’ Prehearing Brief at 13.
34 Foreign Producers’ Posthearing Brief at 47-49; Siemens’s Posthearing Brief, Answers to Commissioners’Hearing Questions at 19.
35 CR/PR at Table III-2.
36 CR/PR at Tables III-4 & III-5.
7
lower than in 2009, and both its U.S. production and imports increased in interim 2012.37 Its ratio of totalsubject imports to domestic production fluctuated; it was *** percent in 2010 (when it ***), *** percentin 2011, *** percent in interim 2011, and *** percent in interim 2012.38 We also note that it does notoppose the petition.39 Moreover, there is no indication that its imports shielded *** from competitionwith the subject imports.40 41 42
Given its growing interest in domestic production of wind towers, we find that appropriatecircumstances do not exist to exclude *** from the domestic industry on the basis of the related partyprovision Accordingly, in light of our definition of the domestic like product, we define the domesticindustry to include all U.S. producers of wind towers.43
IV. CUMULATION44
A. Legal Framework
For purposes of evaluating the volume and price effects for a determination of material injury byreason of the subject imports, section 771(7)(G)(i) of the Tariff Act requires the Commission to cumulatesubject imports from all countries as to which petitions were filed and/or investigations self-initiated byCommerce on the same day, if such imports compete with each other and the domestic like product in the
37 See CR/PR at Table III-12. Its imports of subject merchandise from *** were *** wind towers in 2009, ***wind towers in 2010, *** wind towers in 2011 and *** wind towers in interim 2012. CR/PR at Table III-12. Itsimports from *** were *** wind towers in 2009, *** wind towers in 2010, *** wind towers imports in 2011 and*** wind towers in interim 2012. Id.
38 CR/PR at Table III-12.
39 CR/PR at Table III-2.
40 See CR/PR at Table VI-3. *** ratio of operating income to net sales was *** percent in 2010, *** percent in2011 and *** percent in interim 2012. Although it performed *** than the industry average during 2010, itsperformance in 2011 and interim 2012 was *** than average. See CR/PR at Table VI-3.
41 Consistent with her practice in past investigations and reviews, Commissioner Aranoff does not rely onindividual-company operating income margins, which reflect a domestic producer's financial operations related toproduction of the domestic like product, in assessing whether a related party has benefitted from importation ofsubject merchandise. Rather, she determines whether to exclude a related party based principally on its ratio ofsubject imports to domestic production and whether its primary interests lie in domestic production or importation.
42 Commissioner Pinkert does not rely upon the related party’s financial performance as a factor in determiningwhether there are appropriate circumstances to exclude it from the domestic industry. The present record is notsufficient to link the related party’s profitability on U.S. operations to any specific benefit it derives from importingor from its relationship with an importer. See Allied Mineral Products v. United States, 28 CIT 1861, 1865-67(2004).
43 Without addressing the statutory criteria in 19 U.S.C. § 1677(4)(C), Siemens argues that the wind towerinstallation patterns in the United States should lead the Commission to view the domestic industry as a regionalindustry. Siemens’s Posthearing Brief at 8. No party to these investigations has argued that the regional industryprovision applies or has asked the Commission to collect the information necessary to determine whether it applies. Because the record consequently contains neither data nor arguments confirming that a regional industry analysis isappropriate, we have not considered the application of the regional industry provision to these investigations.
44 Negligibility under 19 U.S.C. § 1677(24) is not an issue in these investigations. Only 11 months of import dataprior to the filing of the petitions are available based on official import statistics that accurately reflect subjectimports on a monthly basis. During that period, subject imports from China and Vietnam accounted for 49.9 percentand 16.1 percent of total imports of wind towers, respectively. CR at IV-9, PR at IV-7. These figures far exceed thestatutory threshold of three percent for negligibility.
8
U.S. market.45 In assessing whether subject imports compete with each other and with the domestic likeproduct, the Commission has generally considered four factors:
(1) the degree of fungibility between the subject imports from different countries andbetween imports and the domestic like product, including consideration of specificcustomer requirements and other quality related questions;
(2) the presence of sales or offers to sell in the same geographic markets of subjectimports from different countries and the domestic like product;
(3) the existence of common or similar channels of distribution for subject importsfrom different countries and the domestic like product; and
(4) whether the subject imports are simultaneously present in the market.46
Although no single factor is necessarily determinative, and the list of factors is not exclusive, these factorsare intended to provide the Commission with a framework for determining whether the subject importscompete with each other and with the domestic like product.47 Only a “reasonable overlap” ofcompetition is required.48
B. Discussion
In these investigations, the threshold criterion for cumulation is satisfied because petitioners filedthe antidumping duty petitions with respect to China and Vietnam and the countervailing duty petitionwith respect to China on the same day. None of the exceptions to cumulation applies.49 Subject importsfrom China and Vietnam are therefore eligible for cumulation. We consequently examine whether there isa reasonable overlap of competition between subject imports from China and Vietnam, as well as betweensubject imports and the domestic like product.50
1. Fungibility
We find a reasonable degree of fungibility among the subject imports from each country and thedomestic like product. The questionnaire responses indicate that market participants perceivedomestically produced wind towers and the subject imports to have some degree of interchangeability.51
45 19 U.S.C. § 1677(7)(G)(i).
46 See Certain Cast-Iron Pipe Fittings from Brazil, the Republic of Korea, and Taiwan, Invs. Nos. 731-TA-278 to280 (Final), USITC Pub. 1845 (May 1986), aff’d, Fundicao Tupy, S.A. v. United States, 678 F. Supp. 898 (Ct. Int’lTrade), aff’d, 859 F.2d 915 (Fed. Cir. 1988).
47 See, e.g., Wieland Werke, AG v. United States, 718 F. Supp. 50 (Ct. Int’l Trade 1989).
48 The Statement of Administrative Action (“SAA”) states that “the new section will not affect currentCommission practice under which the statutory requirement is satisfied if there is a reasonable overlap ofcompetition.” SAA on Uruguay Round Agreements Act (“URAA”), H.R. Rep. 103-316, Vol. I at 848 (1994) (citingFundicao Tupy, S.A. v. United States, 678 F. Supp. 898, 902 (Ct. Int’l Trade 1988)), aff’d, 859 F.2d 915 (Fed. Cir.1988). See also, e.g., Goss Graphic Sys., Inc. v. United States, 33 F. Supp. 2d 1082, 1087 (Ct. Int’l Trade 1998)(“cumulation does not require two products to be highly fungible”); Wieland Werke, AG, 718 F. Supp. at 52(“Completely overlapping markets are not required.”).
49 See 19 U.S.C. § 1677(7)(G)(ii).
50 Petitioners argue that the prerequisites for cumulation for purposes of present material injury are satisfied inthese investigations, Petitioners’ Prehearing Brief at 6-8. No respondents have addressed the issue.
51 All five responding producers indicated that subject imports from both subject countries are “always”interchangeable with domestically produced wind towers. CR/PR at Table II-6. Three of five responding importers
(continued...)
9
Additionally, one of the larger importers, ***, reported that towers built for its turbines are built to itsspecifications and are interchangeable with other towers built to the same specifications, regardless of themanufacturer or the country of origin.52 Siemens has used a combination of imported and domesticallyproduced wind towers for some of its projects as well.53
2. Geographic Overlap
The record indicates a geographic overlap in sales between the subject imports and domesticallyproduced wind towers. The record indicates that wind towers from both domestic and subject sources aremarketed and shipped nationwide.54 Three responding U.S. producers reported that approximately *** oftheir sales were destined for the Midwest and almost *** were destined for the Pacific Coast.55 Importersreported shipping imported Chinese wind towers to all U.S. geographic regions in 2011, and subjectimports from Vietnam were shipped to all regions in the contiguous United States except the Southeast.56 Subject producers bid on projects across most regions of the United States,57 and U.S. imports of windtowers from China and Vietnam entered multiple U.S. ports of entry, although they were concentrated inthe West Coast and Gulf.58
3. Channels of Distribution
The majority of shipments of both domestically produced merchandise and the subject importswere delivered directly to unrelated producers of wind turbines (OEMs) by both domestic producers andforeign producers.59 ***, however, internally consumes its production.60
51 (...continued)consider the subject imports from China to be at least “sometimes” interchangeable with domestically produced windtowers. Id. Two of three responding importers consider the subject imports from Vietnam to be “always” or“frequently” interchangeable with domestically produced wind towers. Two of three responding importers considerthe subject imports from China to be “always” or “frequently” interchangeable with subject imports from Vietnam. Id. Three of five responding purchasers consider the subject imports from China to be at least “sometimes”interchangeable with domestically produced wind towers, and one of two responding purchasers considers thesubject imports from Vietnam to be “always” interchangeable with domestically produced wind towers. One of tworesponding purchasers considers the subject imports from Vietnam to be “always” interchangeable with subjectimports from China. Id.
52 CR at II-31 to II-32, PR at II-19.
53 CR/PR at Table V-5.
54 See CR/PR at V-2 (eighteen facilities nationwide produced wind towers as of June 2012). Domestic producers’current production facilities are concentrated in the Midwest and in Oklahoma and Texas, but during the period ofinvestigation were also located in the Pacific Coast area. CR/PR at Fig. III-1.
55 See CR/PR II-1.
56 CR at II-2, PR at II-1.
57 See CR/PR at Tables V-1 and V-3.
58 CR/PR at IV-7.
59 CR/PR at II-1.
60 CR/PR at II-1.
10
4. Simultaneous Presence
Bid data indicate that domestically produced wind towers were present in the U.S. market duringeach year of the 2009-2012 period.61 Importers’ questionnaires show that shipments of subject importsfrom China and Vietnam were also present throughout this period.62
C. Conclusion
Based on the record, we find a reasonable overlap of competition among the subject imports fromChina and Vietnam and the domestic like product. We therefore cumulatively assess the volume andprice effects of subject imports from China and Vietnam for purposes of determining whether there ismaterial injury to the domestic industry by reason of the subject imports.
V. LEGAL STANDARDS
A. In General
In the final phase of antidumping and countervailing duty investigations, the Commissiondetermines whether an industry in the United States is materially injured or threatened with material injury by reason of the imports under investigation.63 In making this determination, the Commissionmust consider the volume of subject imports, their effect on prices for the domestic like product, and theirimpact on domestic producers of the domestic like product, but only in the context of U.S. productionoperations.64 The statute defines “material injury” as “harm which is not inconsequential, immaterial, orunimportant.”65 In assessing whether the domestic industry is materially injured by reason of subjectimports, we consider all relevant economic factors that bear on the state of the industry in the UnitedStates.66 No single factor is dispositive, and all relevant factors are considered “within the context of thebusiness cycle and conditions of competition that are distinctive to the affected industry.”67
Although the statute requires the Commission to determine whether the domestic industry is“materially injured or threatened with material injury by reason of” unfairly traded imports,68 it does notdefine the phrase “by reason of,” indicating that this aspect of the injury analysis is left to theCommission’s reasonable exercise of its discretion.69 In identifying a causal link, if any, between subjectimports and material injury to the domestic industry, the Commission examines the facts of record that
61 See CR/PR at Tables V-1 and V-5 (indicating GE’s and Siemens’s purchases of domestically produced towers).
62 See CR/PR at IV-1. See also CR/PR at Table IV-4 (U.S. imports of wind towers from China entered in each ofthe 22 months between January 2011 and October 2012, while U.S. imports of wind towers from Vietnam onlyentered in 13 of the 22 months).
63 19 U.S.C. §§ 1671d(b), 1673d(b).
64 19 U.S.C. § 1677(7)(B)( i). The Commission “may consider such other economic factors as are relevant to thedetermination” but shall “identify each {such} factor ... and explain in full its relevance to the determination.” 19 U.S.C. § 1677(7)(B).
65 19 U.S.C. § 1677(7)(A).
66 19 U.S.C. § 1677(7)(C)(iii).
67 19 U.S.C. § 1677(7)(C)(iii).
68 19 U.S.C. §§ 1671d(a), 1673d(a).
69 Angus Chemical Co. v. United States, 140 F.3d 1478, 1484-85 (Fed. Cir. 1998) (“{T}he statute does not‘compel the commissioners’ to employ {a particular methodology}.”), aff’d, 944 F. Supp. 943, 951 (Ct. Int’l Trade1996).
11
relate to the significance of the volume and price effects of the subject imports and any impact of thoseimports on the condition of the domestic industry. This evaluation under the “by reason of” standardmust ensure that subject imports are more than a minimal or tangential cause of injury and that there is asufficient causal, not merely a temporal, nexus between subject imports and material injury.70
In many investigations, there are other economic factors at work, some or all of which may alsobe having adverse effects on the domestic industry. Such economic factors might include nonsubjectimports; changes in technology, demand, or consumer tastes; competition among domestic producers; ormanagement decisions by domestic producers. The legislative history explains that the Commission mustexamine factors other than subject imports to ensure that it is not attributing injury from other factors tothe subject imports, thereby inflating an otherwise tangential cause of injury into one that satisfies thestatutory material injury threshold.71 In performing its examination, however, the Commission need notisolate the injury caused by other factors from injury caused by unfairly traded imports.72 Nor does the“by reason of” standard require that unfairly traded imports be the “principal” cause of injury orcontemplate that injury from unfairly traded imports be weighed against other factors, such as nonsubject
70 The Federal Circuit, in addressing the causation standard of the statute, observed that “{a}s long as its effectsare not merely incidental, tangential, or trivial, the foreign product sold at less than fair value meets the causationrequirement.” Nippon Steel Corp. v. USITC, 345 F.3d 1379, 1384 (Fed. Cir. 2003). This was further ratified inMittal Steel Point Lisas Ltd. v. United States, 542 F.3d 867, 873 (Fed. Cir. 2008), where the Federal Circuit, quotingGerald Metals, Inc. v. United States, 132 F.3d 716, 722 (Fed. Cir. 1997), stated that “this court requires evidence inthe record ‘to show that the harm occurred “by reason of” the LTFV imports, not by reason of a minimal ortangential contribution to material harm caused by LTFV goods.’” See also Nippon Steel Corp. v. United States,458 F.3d 1345, 1357 (Fed. Cir. 2006); Taiwan Semiconductor Industry Ass’n v. USITC, 266 F.3d 1339, 1345 (Fed.Cir. 2001).
71 SAA at 851-52 (“{T}he Commission must examine other factors to ensure that it is not attributing injury fromother sources to the subject imports.”); S. Rep. 96-249 at 75 (1979) (the Commission “will consider informationwhich indicates that harm is caused by factors other than less-than-fair-value imports.”); H.R. Rep. 96-317 at 47(1979) (“in examining the overall injury being experienced by a domestic industry, the ITC will take into accountevidence presented to it which demonstrates that the harm attributed by the petitioner to the subsidized or dumpedimports is attributable to such other factors;” those factors include “the volume and prices of nonsubsidized importsor imports sold at fair value, contraction in demand or changes in patterns of consumption, trade restrictive practicesof and competition between the foreign and domestic producers, developments in technology and the exportperformance and productivity of the domestic industry”); accord Mittal Steel, 542 F.3d at 877.
72 SAA at 851-52 (“{T}he Commission need not isolate the injury caused by other factors from injury caused byunfair imports.”); Taiwan Semiconductor Industry Ass’n v. USITC, 266 F.3d 1339, 1345 (Fed. Cir. 2001) (“{T}heCommission need not isolate the injury caused by other factors from injury caused by unfair imports. . . . Rather,the Commission must examine other factors to ensure that it is not attributing injury from other sources to the subjectimports.” (emphasis in original)); Asociacion de Productores de Salmon y Trucha de Chile AG v. United States, 180F. Supp. 2d 1360, 1375 (Ct. Int’l Trade 2002) (“{t}he Commission is not required to isolate the effects of subjectimports from other factors contributing to injury” or make “bright-line distinctions” between the effects of subjectimports and other causes.); see also Softwood Lumber from Canada, Invs. Nos. 701-TA-414 and 731-TA-928(Remand), USITC Pub. 3658 at 100-01 (Dec. 2003) (Commission recognized that “{i}f an alleged other factor isfound not to have or threaten to have injurious effects to the domestic industry, i.e., it is not an ‘other causal factor,’then there is nothing to further examine regarding attribution to injury”), citing Gerald Metals, Inc. v. United States,132 F.3d 716, 722 (Fed. Cir. 1997) (the statute “does not suggest that an importer of LTFV goods can escapecountervailing duties by finding some tangential or minor cause unrelated to the LTFV goods that contributed to theharmful effects on domestic market prices.”).
12
imports, which may be contributing to overall injury to an industry.73 It is clear that the existence ofinjury caused by other factors does not compel a negative determination.74
Assessment of whether material injury to the domestic industry is “by reason of” subject imports“does not require the Commission to address the causation issue in any particular way” as long as “theinjury to the domestic industry can reasonably be attributed to the subject imports” and the Commission“ensure{s} that it is not attributing injury from other sources to the subject imports.”75 76 Indeed, theFederal Circuit has examined and affirmed various Commission methodologies and has disavowed “rigidadherence to a specific formula.”77
The Federal Circuit’s decisions in Gerald Metals, Bratsk, and Mittal Steel all involved caseswhere the relevant “other factor” was the presence in the market of significant volumes of price-competitive nonsubject imports. The Commission interpreted the Federal Circuit’s guidance in Bratsk asrequiring it to apply a particular additional methodology following its finding of material injury in casesinvolving commodity products and a significant market presence of price-competitive nonsubjectimports.78 The additional “replacement/benefit” test looked at whether nonsubject imports might havereplaced subject imports without any benefit to the U.S. industry. The Commission applied that specificadditional test in subsequent cases, including the Carbon and Certain Alloy Steel Wire Rod from Trinidadand Tobago determination that underlies the Mittal Steel litigation.
Mittal Steel clarifies that the Commission’s interpretation of Bratsk was too rigid and makes clearthat the Federal Circuit does not require the Commission to apply an additional test nor any one specificmethodology; instead, the court requires the Commission to have “evidence in the record” to “show thatthe harm occurred ‘by reason of’ the LTFV imports,” and requires that the Commission not attribute
73 S. Rep. 96-249 at 74-75; H.R. Rep. 96-317 at 47.
74 See Nippon Steel Corp., 345 F.3d at 1381 (“an affirmative material-injury determination under the statuterequires no more than a substantial-factor showing. That is, the ‘dumping’ need not be the sole or principal cause ofinjury.”).
75 Mittal Steel, 542 F.3d at 877-78; see also id. at 873 (“While the Commission may not enter an affirmativedetermination unless it finds that a domestic industry is materially injured ‘by reason of’ subject imports, theCommission is not required to follow a single methodology for making that determination ... {and has} broaddiscretion with respect to its choice of methodology.”) citing United States Steel Group v. United States, 96 F.3d1352, 1362 (Fed. Cir. 1996) and S. Rep. 96-249 at 75.
76 Commissioner Pinkert does not join this paragraph or the following three paragraphs. He points out that theFederal Circuit, in Bratsk, 444 F.3d 1369, and Mittal Steel, held that the Commission is required, in certaincircumstances when considering present material injury, to undertake a particular kind of analysis of nonsubjectimports, albeit without reliance upon presumptions or rigid fomulas. Mittal Steel explains as follows:
What Bratsk held is that “where commodity products are at issue and fairly traded, price-competitive,nonsubject imports are in the market,” the Commission would not fulfill its obligation to consider animportant aspect of the problem if it failed to consider whether nonsubject or non-LTFV imports wouldhave replaced LTFV subject imports during the period of investigation without a continuing benefit to thedomestic industry. 444 F.3d at 1369. Under those circumstances, Bratsk requires the Commission toconsider whether replacement of the LTFV subject imports might have occurred during the period ofinvestigation, and it requires the Commission to provide an explanation of its conclusion with respect tothat factor.
542 F.3d at 878.
77 Nucor Corp. v. United States, 414 F.3d 1331, 1336, 1341 (Fed. Cir. 2005); see also Mittal Steel, 542 F.3d at879 (“Bratsk did not read into the antidumping statute a Procrustean formula for determining whether a domesticinjury was ‘by reason’ of subject imports.”).
78 Mittal Steel, 542 F.3d at 875-79.
13
injury from nonsubject imports or other factors to subject imports.79 Accordingly, we do not considerourselves required to apply the replacement/benefit test that was included in Commission opinionssubsequent to Bratsk.
The progression of Gerald Metals, Bratsk, and Mittal Steel clarifies that, in cases involvingcommodity products where price-competitive nonsubject imports are a significant factor in the U.S.market, the Court will require the Commission to give full consideration, with adequate explanation, tonon-attribution issues when it performs its causation analysis.80
The question of whether the material injury threshold for subject imports is satisfiednotwithstanding any injury from other factors is factual, subject to review under the substantial evidencestandard.81 Congress has delegated this factual finding to the Commission because of the agency’sinstitutional expertise in resolving injury issues.82
VI. CONDITIONS OF COMPETITION AND THE BUSINESS CYCLE
The following conditions of competition inform our analysis of whether there is material injuryby reason of subject imports. We note that, although there is captive consumption by one domesticproducer, the requirements of the statutory captive production provision are not satisfied.83
79 Mittal Steel, 542 F.3d at 873 (quoting from Gerald Metals, 132 F.3d at 722), 875-79 & n.2 (recognizing theCommission’s alternative interpretation of Bratsk as a reminder to conduct a non-attribution analysis).
80 To that end, after the Federal Circuit issued its decision in Bratsk, the Commission began to present publishedinformation or send out information requests in final phase investigations to producers in nonsubject countries thataccounted for substantial shares of U.S. imports of subject merchandise (if, in fact, there were large nonsubjectimport suppliers). In order to provide a more complete record for the Commission’s causation analysis, theserequests typically seek information on capacity, production, and shipments of the product under investigation in themajor source countries that export to the United States. The Commission plans to continue utilizing published orrequested information in final phase investigations in which there are substantial levels of nonsubject imports.
81 We provide in our respective discussions of volume, price effects, and impact a full analysis of other factorsalleged to have caused any material injury experienced by the domestic industry in these investigations.
82 Mittal Steel, 542 F.3d at 873; Nippon Steel Corp., 458 F.3d at 1350, citing U.S. Steel Group, 96 F.3d at 1357;S. Rep. 96-249 at 75 (“The determination of the ITC with respect to causation is ... complex and difficult, and is amatter for the judgment of the ITC.”).
83 Because of captive consumption by a domestic producer, ***, we have considered whether the captiveproduction provision of the statute requires our primary focus to be on the merchant market when we assess marketshare and factors affecting the financial performance of the domestic industry. In the preliminary phase of theinvestigations, the Commission found that the third statutory criterion was not satisfied. Utility Scale Wind Towersfrom China and Vietnam, Inv. Nos. 701-TA-486 and 731-TA-1195-1196 (Preliminary), USITC Pub. 4304 (Feb.2012) at 17 n.99. The third criterion requires the Commission to examine whether the merchant market purchasersare generally using the domestic like product in the production of the same downstream article or articles as theintegrated domestic producer. 19 U.S.C. § 1677(7)(C)(iv)(iii). If the merchant market purchasers are using thedomestic like product in the production of the same downstream article or articles as the integrated domesticproducer, then the statutory criterion is not satisfied. See Polyvinyl Alcohol from Taiwan, Inv. No. 731-TA-1088(Preliminary), USITC Pub. 3732 (October 2004) at 16-17.
Petitioners argue that the Commission should find that the statutory provision is applicable to theseinvestigations. Petitioners’ Prehearing Brief at 23-26. However, the record indicates that wind towers sold in themerchant market are used in the production of the same downstream product (wind turbines) for which wind towersare captively consumed. *** is integrated and internally consumes wind towers in the production of wind turbines. CR at III-24 n.46, PR at III-11 n. 46. Accordingly, we find that the third criterion of the captive productionprovision is not satisfied.
14
A. Demand Considerations
Wind towers provide the support for wind turbines used in electrical power generation projects.Demand for wind towers is derived from demand for wind turbines and is driven by the installation ofwind turbines in large wind projects. OEMs are generally the purchasers of wind towers.84 After aproject developer or purchaser awards a project or wind farm to an OEM, the OEM secures a supply ofwind towers for the project.85 The number of towers needed for a project can vary widely; record datashow projects with as few as one tower and as many as 338 towers.86 A limited number of OEMspurchase wind towers. Leading OEMs in 2011 included GE, Siemens, Vestas, Suzlon, Mitsubishi Power,Nordex, and Clipper; GE, Siemens, and Vestas accounted for over three-quarters of the wind turbineinstallations in the United States in 2011.87
Government incentives historically have had a powerful influence on demand for wind towers.88
When a major government incentive, the production tax credit (“PTC”), was allowed to lapse,installations of wind turbines slowed dramatically.89 The PTC, which originated in the Energy Policy Actof 1992, is a credit of 2.2 cents per kilowatt-hour for the first ten years a wind turbine is in operation.90 The PTC and other government incentives were scheduled to expire at the end of 2012, and for projects toqualify for the PTC in particular, they had to be in operation by the end of 2012.91 This resulted inextraordinary demand for wind towers toward the end of the period, particularly the first six months of2012.92 The PTC was renewed at the beginning of 2013,93 but it now applies to projects for whichconstruction is commenced by the end of 2013.94
The American Recovery and Reinvestment Act of 2009 (“ARRA”) also made wind projectseligible for the 30 percent investment tax credit if completed by the end of 2012.95 Under ARRA, firmscould also seek to qualify for a newly created cash grant equal to the amount of the credit. In order toqualify, however, projects must have started construction before the end of 2011 and needed to be incommercial operation by the end of 2012.96 The investment tax credit has also been renewed for 2013.97
In addition to the Federal tax credits, a number of states have implemented renewable portfoliostandards (“RPS”) mandating that a certain percentage of electricity come from renewable sources by aparticular date. RPS mandates have also contributed to the growth of wind installations and the demandfor wind towers. As of January 2012, 29 states, the District of Columbia, and Puerto Rico had mandatory
84 CR/PR at I-3.
85 CR at V-5; PR at V-3; CR at V-41; PR at V-5; Tr. at 149 (Revak).
86 For example, *** required only a single wind tower, while Shepherds Flat required the installation of 338 windtowers. CR/PR at Table V-1; CR at V-67; PR at V-7.
87 CR at I-4 n.4; PR at I-3, n.4.
88 CR/PR at Fig. II-1.
89 See CR/PR at Fig. II-1.
90 CR at II-10 to II-11, PR at II-6.
91 CR at II-11, PR at II-6.
92 CR at II-10, PR at II-6, CR/PR at Fig. II-1.
93 American Taxpayer Relief Act of 2012, Pub.L.112-240 (Jan. 2, 2013).
94 CR at II-10, PR at II-6.
95 CR at II-2, PR at II-1.
96 CR at II-11, PR at II-6.
97 CR at II-11, PR at II-6. See also EDIS Docs. 500775, 500751, 500526. No information has been received as towhether cash grants were among the programs renewed.
15
standards with respect to the percentage of electricity provided from renewable sources, while eight stateshad voluntary goals.98
Wind projects are generally concentrated where wind speeds are higher, predominantly in theMidwest corridor from Texas north to Canada and between the Mississippi River and the Rockies, inCalifornia, and in the Pacific Northwest.99 The states of Texas, California, Kansas, Oregon, Oklahoma,and Illinois saw the largest number of installations during the period of investigation.100
Apart from the government initiatives, several other factors influenced demand for wind towersduring the period of investigation. The financial crisis, beginning in 2008, led to tightened credit and adecline in demand for wind towers during 2009 and 2010, because financing for wind projects becamedifficult to obtain.101 Low prices for natural gas, an alternative source of energy for the generation ofelectricity, may also have dampened demand for wind projects to some extent.102 Despite falling naturalgas prices during the period, however, wind energy has achieved, or nearly achieved, grid parity in areasof the United States that are high-wind locations.103 As a result, and along with the push to benefit fromthe expiring tax credits, wind turbine installations increased during the latter portion of the period eventhough natural gas prices remained low.104
Apparent U.S. consumption of wind towers declined and then increased sharply during the periodof investigation. It decreased from 3,842 towers in 2009 to 2,887 towers in 2010, before increasing to*** towers in 2011. Apparent U.S. consumption was *** towers in interim 2011 and *** towers ininterim 2012.105
B. Supply Considerations
Six domestic producers, accounting for the substantial majority of U.S. production during 2011,provided information to the Commission.106 Four domestic producers have multiple productionfacilities.107 Production facilities are predominantly located in the Midwest, Oklahoma, and Texas,although two are on the West Coast. Four domestic producers reported shutdowns or curtailments of theirdomestic production during the period examined, while five firms opened, expanded or upgradedproduction facilities.108 While the reported plant openings and expansions took place earlier in the period,DMI, Katana and Trinity all reported plant closings or sales of assets in 2012.109 Vestas, which beganU.S. wind tower production in 2010, is the only U.S. producer whose overall operations are vertically
98 CR at II-12, PR at II-7.
99 Tr. at 118-119 (Cole); CR/PR at Table D-2 (listing states in order of total installations).
100 CR/PR at Table D-2.
101 CR at II-9, II-10, PR at II-5-6, Tr. at 74-75.
102 CR at II-10, PR at II-5.
103 Petitioners’ Posthearing Brief at 53; Tr. at 102 (Mr. Rubin). “Grid parity” for the wind energy industry isdefined as occurring when the cost of producing electricity with wind is competitive with alternative fuels. Siemens’s Prehearing Brief, at 12.
104 Petitioners’ Posthearing Brief at 54; CR/PR at Fig. II-5.
105 CR/PR at Table IV-6.
106 CR/PR at Table III-2.
107 CR/PR at III-1, Table III-2
108 CR/PR at Table III-4.
109 See CR at III-2, PR at III-1 and Table III-1.
16
integrated, as it is *** for the production of wind turbines.110 Domestic production capacity increasedfrom 3,343 wind towers in 2009 to 3,898 wind towers in 2010 and *** wind towers in 2011.111 It was*** towers in interim 2011 and *** towers in interim 2012.112
Two domestic producers (***) reported having supply agreements with OEMs (***) during theperiod of investigation.113 Typically, under these agreements the domestic producer reserves productioncapacity for towers to be supplied to an OEM, and the OEM agrees to purchase a certain number oftowers each year. These agreements may be subject to renegotiation by the parties, allowing the OEMs toreduce the number of towers ordered in a given year below the contract commitment, extend the timing ofdeliveries, or change the types of towers ordered.114
The domestic industry was the largest source of wind towers in the U.S. market until interim2012, when subject imports captured the largest share of the market.115 Korea, Canada, Mexico, andIndonesia were the leading nonsubject sources of imports.116 Nonsubject imports lost market sharethroughout the period of investigation, and by 2011, subject imports were a larger source of supply thannonsubject imports.117 118
C. Substitutability and Other Conditions
Most OEMs require qualification or certification of wind tower producers.119 Qualificationrequirements can include technical capability to run at the rate required, compliance with internationalstandards, experience, facility inspections (for safety, cleanliness, and technical system and productcapability), financial stability, ISO certification, on time delivery, quality assurance, quality of endproduct, quality specification, and technical reviews.120 Seven of the eight purchasers reportedqualification times of between three and six months.121 Each production location is separately qualified,even for producers who operate multiple facilities.122 Typically, an OEM will only order wind towersfrom a supplier it has qualified. At the beginning of the period, the two largest OEMs, GE and Siemens,
110 CR/PR at II-1.
111 CR/PR at Table III-3.
112 CR/PR at Table III-3.
113 CR at III-11 to III-13, PR at III-7-8.
114 CR at III-11 to III-13, PR at III-7-8.
115 See CR/PR at Table IV-6.
116 CR at VII-21, PR at VII-13. Respondents argue that most wind towers installed along the Eastern seaboard,where there is no domestic production, are produced in Canada. Foreign Respondents’ Posthearing Brief at 9. Therecord indicates, however, that some subject imports originating in Asia were shipped through the Panama Canal andinstalled in Eastern states. CR/PR at Table V-5 (***); *** Importer Questionnaire, response to Question V-1, EDISDocs. 499922, 499924, and 799925.
117 See CR/PR at Table IV-6; Tr at 226 (Revak).
118 Nonsubject imports totaled 1,175 towers in 2009, 783 towers in 2010, 475 towers in 2011, 246 towers ininterim 2011, and 382 towers in interim 2012. Subject imports totaled 646 towers in 2009, 366 towers in 2010, 916towers in 2011, 456 towers in interim 2011, and 1,257 towers in interim 2012. CR/PR at Table IV-2.
119 CR at II-28, PR at II-17.
120 CR at II-29, PR at II-17.
121 CR at II-29, PR at II-17.
122 Tr. at 176 (Hazel).
17
had each qualified only a small number of domestic facilities.123 Later in the period, however, as demandrose under uncertainty of the renewal of the PTC and other federal incentives, OEMs qualified moredomestic suppliers and were sometimes willing to perform qualification after production had begun ontower orders.124 125
Subject imports and domestically produced wind towers are at least moderately substitutable onceproduction facilities are qualified for a wind project.126 127 Respondents argue that geography (due tosubstantial transportation costs) as well as long lead times limit the substitutability of otherwisecomparable wind towers.128 Nonetheless, subject imports compete in all regions, and wind towerssourced from both domestic producers and subject producers are often used in the same wind project.129
OEMs (***) explained that they do not necessarily solicit multiple bids when selecting their windtower suppliers.130 Each purchaser has its own method of wind tower procurement. ***131 ***.132 Siemens, however, uses custom tower designs that are unique to each wind farm project and orders towerson a spot basis only after securing individual projects. Siemens states that it tries to buy as many towersas possible for a project from the qualified facility closest to the project and bases its purchasing decisionon the lowest delivered cost.133 ***.134 ***.135
Steel plate is the principal raw material used to produce wind towers, and raw materials accountfor the major share of the cost of goods sold (“COGS”) for wind towers.136 Raw materials accounted forbetween *** and *** percent of COGS during 2009-2011, *** percent of COGS in interim 2011, and ***percent in interim 2012.137 The cost of steel is in some cases passed on to purchasers through the use of
123 CR at III-13, n.27, PR at II-8, n.27.
124 Tr. at 40 (Smith) and 142-32 (Hazel).
125 Commissioners Pearson, Johanson, and Broadbent do not join this sentence. See Dissenting Views ofCommissioners Daniel R. Pearson, David A. Johanson, and Meredith M. Broadbent.
126 Three of five responding purchasers consider the subject imports from China to be always, frequently orsometimes interchangeable with domestically produced wind towers, and one of two responding purchasersconsiders the subject imports from Vietnam to be always interchangeable with domestically produced wind towers. One of two responding purchasers considers the subject imports from Vietnam to be always interchangeable withsubject imports from China. CR/PR at Table II-6.
127 Commissioners Pearson, Johanson, and Broadbent do not join the remainder of this paragraph. See DissentingViews of Commissioners Daniel R. Pearson, David A. Johanson, and Meredith M. Broadbent.
128 Respondents characterize the competition between the subject imports and domestic like product as attenuatedby geography due to high transportation costs. Foreign Respondents’ Prehearing Brief at 21-23. They contend thatthe ex-factory (f.o.b.) cost of a wind tower is less significant to the OEM than the costs that could be incurred ifdeliveries are late or the towers do not conform to stringent quality requirements. See CR at II-33, PR at II-20; Tr. at206 (Feldman).
129 See, e.g. CR at V-49, PR at V-6 (showing use of wind towers from different sources for one project). See alsoCR at II-31 to II-32, PR at II-19 (the ***).
130 CR at V-4; PR at V-3.
131 CR at V-7; PR at V-3, and CR/PR, Appendix F-4 - F-6.
132 CR at V-5, PR at V-3.
133 CR at V-41, PR at V-5.
134 CR at III-27-28, PR at III-12.
135 CR at V-61, PR at V-6.
136 CR at I-15, PR at I-12.
137 CR/PR at V-1.
18
escalation clauses in purchase contracts.138 In other instances, the purchaser/OEM provides the steel tothe tower manufacturer and pays only a conversion fee.139
Wind towers are made to order, albeit not necessarily custom-made, and there are significant leadtimes between the time of the contract award and the delivery of towers to a wind project site. Responding producers indicated that lead times averaged 84 to 140 days.140
Because wind towers are large, heavy, and require specialized equipment to lift and move,purchasers reported considering both sales price and transportation costs when making purchasedecisions.141 Wind towers are typically sold on an ex-works basis in the case of domestic producers andf.o.b. port of export in the case of subject and nonsubject imports.142 Shipping to the project site isarranged by the OEM.143 Given wind towers’ large size, transportation of wind towers can be bothlogistically challenging and expensive.144 Towers are usually shipped from U.S. producers’ plants byeither truck or rail to the wind project site.145 Rail is preferred due to the challenge of arranging forhighway transportation permits and police escorts associated with oversize loads.146 Imports must beshipped by rail or truck from the U.S. port of entry to the project site.
U.S. inland transportation costs for shipments average approximately *** percent of totaldelivered cost for subject imports and domestically produced wind towers.147 Ocean freight to the UnitedStates is typically more expensive than U.S. inland freight, with the ocean freight share of total deliveredcosts averaging *** percent for *** imports from Asia.148
VII. MATERIAL INJURY BY REASON OF SUBJECT IMPORTS 149 150
A. Volume of Subject Imports
In evaluating the volume of subject imports, section 771(7)(C)(i) of the Tariff Act provides thatthe “Commission shall consider whether the volume of imports of the merchandise, or any increase in thatvolume, either in absolute terms or relative to production or consumption in the United States, issignificant.”151
We find the volume of subject imports and the increase in volume to be significant, both inabsolute terms and relative to consumption and production in the United States. The volume of subject
138 Tr. at 54. (Cole); CR at VI-14 n.17, PR at VI-7, n.17.
139 See, e.g., Petitioners’ Posthearing Brief, exh 2.
140 CR at II-31, PR at II-19.
141 CR at II-24, PR at II-14-15.
142 CR at V-3, PR at V-3.
143 CR at V-2, PR at V-1-2.
144 CR at II-2, PR at II-1; Tr. at 141 (Hazel).
145 CR at V-2 to V-3, PR at V-2.
146 CR at V-2, PR at V-1-2.
147 CR at V-2, PR at V-1-2.
148 CR at V-2, PR at V-1-2.
149 Commissioners Pearson, Johanson, and Broadbent have made negative determinations and do not join theremainder of this opinion. See their Dissenting Views.
150 Commissioner Pinkert does not join the remainder of this opinion. See his Separate Views.
151 19 U.S.C. § 1677(7)(C)(i).
19
imports measured by quantity increased overall by 41.8 percent from 2009 to 2011.152 Subject importsdecreased from 646 towers in 2009 to 366 towers in 2010, before increasing to 916 towers in 2011.153 The growth in subject imports in interim 2012 relative to interim 2011 was dramatic. Subject importstotaled 1,257 towers in interim 2012, but just 456 towers in interim 2011.154
Subject imports’ share of the U.S. market by quantity declined from 15.9 percent in 2009 to 12.7percent in 2010, before increasing to *** percent in 2011.155 Subject imports’ share by quantity was ***percent in interim 2011, and *** percent in interim 2012.156
The ratio of subject imports to U.S. production was also significant and increased substantiallyduring the period, despite increased U.S. production. It increased from 31.2 percent in 2009 to ***percent in 2011; it was *** percent in interim 2011 and *** percent in interim 2012.157
Demand for wind towers was particularly strong in interim 2012 as a result of the anticipatednon-renewal of the PTC. While apparent U.S. consumption was *** percent higher in interim 2012 thanin interim 2011,158 subject import shipments increased even more sharply and were 192.8 percent greaterin interim 2012 than in interim 2011.159 By contrast, the domestic industry’s market share dropped from*** percent in interim 2011 to *** percent in interim 2012.160 Although the domestic industry’s marketshare increased somewhat from 2009 to 2011, it was far lower in interim 2012 than at any prior pointduring the period of investigation.161 At the same time that subject imports were generally increasing, nonsubject imports’ share of themarket was declining; their share of apparent U.S. consumption decreased from 30.6 percent in 2009 to27.1 percent in 2010 and to *** percent in 2011.162 When demand was peaking in interim 2012 andsubject imports were increasing dramatically, nonsubject imports lost a small amount of market share,with their share falling from *** percent in interim 2011 to *** percent in interim 2012.163 The increasein subject imports’ share of the U.S. market therefore came primarily at the direct expense of the domesticindustry rather than nonsubject imports.
We disagree with Respondents that the high levels of subject imports in interim 2012, and theaccompanying increase in market share, reflect the domestic industry’s inability to supply the market
152 See CR/PR at Table IV-2.
153 CR/PR at Table IV-2. We have relied upon U.S. importer questionnaire data to determine import volumebecause the official import statistics may include some nonsubject merchandise. CR/PR at IV-1. Subject importsmeasured by value decreased from $192.9 million in 2009 to $129.6 million in 2010, and then increased to $284.0million in 2011. CR/PR at Table IV-2. By value, subject imports were $144.9 million in interim 2011 and $357.3million in interim 2012.
154 CR/PR at Table IV-2.
155 CR/PR at Table IV-6.
156 CR/PR at Table IV-6. By value, subject imports decreased from 14.8 percent in 2009 to 14.1 percent in 2010and then increased to *** percent in 2011. Id. Subject imports captured *** percent of the U.S. market in interim2011 and *** percent in interim 2012, based on value. Id.
157 CR/PR at Table IV-7.
158 See CR/PR at Table IV-6.
159 CR/PR at Table C-1.
160 By quantity, the U.S. industry’s market share increased from 53.6 percent in 2009 to 60.2 percent in 2010, and*** percent in 2011. CR/PR at Table IV-6.
161 See CR/PR at Table IV-6.
162 CR/PR at Table IV-6.
163 CR/PR at Table IV-6.
20
during a period of peak demand. Even though the domestic industry may not have been in a position toserve the entire U.S. market during interim 2012,164 throughout the period of investigation, includingduring interim 2012, the domestic industry had excess capacity that would have allowed it to increaseshipments and fill a greater share of the increased demand. 165 166 Indeed, domestic production reported byqualified suppliers *** was lower during interim 2012 than interim 2011.167 Nor does the record supportRespondents’ argument that any nominally available domestic capacity was located too far from relevantwind farm sites to be cost effective. During interim 2012, *** relied heavily on subject imports for windprojects in Colorado, Kansas and Oklahoma even though Trinity, ***, had production facilities in Iowaand Texas that had excess capacity of ***.168 As a result of *** decision to rely on subject imports forwind projects in the Midwest, the installation of imported wind towers into the Midwest increaseddramatically during interim 2012.169 Similarly GE opted to supply the 338-tower Shepherd’s Flat projectin Oregon entirely with subject towers even though a U.S. producer had a facility nearby in WashingtonState and Broadwind offered to build a new facility in Oregon.170 While factors such as operationalinefficiencies171 and the expected non-renewal of the PTC and other federal incentives 172 may haveplayed some role in the domestic industry’s modest growth in production and shipments during interim
164 See CR/PR at Tables III-3 and IV-2.
165 The parties agree that the surge of subject imports during 2012 coupled with the non-renewal of the PTC makethis portion of the period of investigation most pertinent for assessing material injury. Foreign Respondents’Prehearing Brief at 47; Petitioners’ Prehearing Brief at 57-58. Whether on an annual, semiannual or monthly basis,the record indicates that the industry had excess capacity during interim 2012. See CR/PR at Tables III-5 and III-6. Foreign Respondents argue that because the industry is seasonal, the industry’s capacity and capacity utilizationinformation should not be given any weight. Foreign Respondents’ Posthearing Brief at 36. The semiannual andmonthly information, however, does not support their argument, and instead indicates that the domestic industry’sproduction was not concentrated in any particular portion of the year. See CR/PR at Tables III-5 and III-6.
166 See CR/PR at Tables III-5, III-6 and Figs. E-1 to E-4.
167 CR at III-18, PR at III-9. As noted above, moreover, OEMs at times have placed orders with wind towerproducers prior to completing the qualification process. Tr at p. 40 (Smith).
168 See CR/PR at Tables V-2, III-5.
169 See Table V-1 and V-5. Although the importance of non-price factors such as available capacity andreliability was disputed by the parties, the record indicates that qualified facilities owned by *** were all operating atmodest rates of capacity utilization during interim 2012. See CR/PR at Table III-5.
170 While we acknowledge ***, CR at II-4, n.6, PR at II-2, n.6; and V-67, PR at V-7, given the two-year deliveryhorizon and large number of towers involved, as well as OEMs’ occasional decisions to qualify new facilities afterthose facilities are already producing towers for the OEM, we do not find *** protestations of domestic producers’lack of readiness to produce even part of the project to be persuasive.
171 The record indicates that operational inefficiencies resulted from Broadwind’s production of four differenttower types. CR at III-18, PR at III-9. Trinity shifted to production of 100 meter wind towers in response tocompetition from subject imports in the 80 meter segment, leading to reduced production and temporaryinefficiencies. Nevertheless, these inefficiencies cannot account for the extent of the domestic industry’s excesscapacity during the period of investigation. CR at III-18 n.33, PR at III-9, n.33; CR at VI-11, PR at VI-5.
172 In anticipation of reduced demand in 2013 due to the expected non-renewal of federal incentives including thePTC, Trinity reported beginning to convert excess wind tower capacity to capacity for the production of rail cars. CRat III-19, PR at III-9. Ameron reported that *** CR at III-18, PR at III-9.
21
2012, the record indicates that the subject imports also played a role in precluding the domestic industryfrom increasing production to take advantage of the increase in apparent consumption.173
For the foregoing reasons, we find that the volume and the increase in volume of subject importsare significant, both in absolute terms and relative to consumption and production in the United States.
B. Price Effects of the Subject Imports
In evaluating the price effects of the subject imports, section 771(7)(C)(ii) of the Tariff Actprovides that the Commission shall consider whether –
(I) there has been significant price underselling by the imported merchandise ascompared with the price of domestic like products of the United States, and
(II) the effect of imports of such merchandise otherwise depresses prices to a significantdegree or prevents price increases, which otherwise would have occurred, to a significantdegree.174
The record in these final phase investigations indicates that subject imports and domesticallyproduced wind towers are generally substitutable once made to the same specifications, although otherfactors such as availability, lead times and transportation costs can limit substitutability with respect to aparticular project.175 Only a few OEMs purchase wind towers, and subject imports and the domestic likeproduct compete for sales to supply wind projects.176 Price or total cost was ranked the single mostimportant factor in purchasing decisions by five of nine purchasers.177 Despite steel and transportationcosts being substantial, f.o.b. prices are the single largest component of total cost for purchasers.178
The Commission typically collects quarterly pricing data on a number of pricing products inorder to assess underselling and price trends in the U.S. market. However, this approach was not used inthese investigations given the made-to-order nature of wind towers and the varying processes used byOEMs in purchasing wind towers.179 Instead Commission staff obtained pricing data from purchasers,including GE and Siemens, which accounted for both *** of subject imports and purchases ofdomestically produced wind towers since January 2009.180
The OEMs indicated that they do not use a closed bidding process and typically do not solicitmultiple bids for a project from wind tower producers. Siemens indicates that it always looks to the
173 For instance, the record indicates that Trinity had a supply agreement with GE, but GE reduced its towerorders, and instead sourced wind towers from China and Vietnam, reportedly due to lower prices. Tr. at 81, 122-123(Cole).
174 19 U.S.C. § 1677(7)(C)(ii).
175 See CR at II-19, PR at II-12; CR at II-31 to II-32, PR at II-19-20.
176 CR at I-4 n.4, PR at I-3 n.4.
177 CR at II-24, PR at II-14-15.
178 CR/PR at Tables V-1 and V-5.
179 CR at V-4 to V-5, PR at V-3; CR at V-41 to V-42, PR at V-5-6.
180 CR at V-4, PR at V-3, CR/PR at Tables III-3, V-1 and V-5. ***. CR at V-5, PR at V-3, CR/PR at Table IV-4. Siemens provided bid data for subject imports from Vietnam, but it accounted for only approximately *** of subjectimports from Vietnam. Id. Three additional domestic purchasers supplied information on their purchases ofdomestically produced wind towers, but they did ***. See CR/PR at Table V-8.
22
closest production facility to source its wind towers for wind projects regardless of f.o.b. prices, becausethe savings on transportation will always result in the best total delivered cost. Siemens claims it onlyturns to more distant suppliers based on availability, never price.181 GE generally reaches agreement with producers concerning the amount of capacity the producer can commit to GE.182 While the majority ofwind tower projects are sourced entirely with either domestic or subject towers, both ***.183
Purchase price data supplied by OEMs for individual wind projects with both subject anddomestic suppliers indicate that the subject imports generally had lower prices than domestic wind towerson an f.o.b. basis.184 Both Siemens and GE indicate, however, that total delivered price, i.e. the price ofthe wind tower plus delivery, is what is most important to purchasers.185
We find that, in most instances, subject imports were priced higher than domestic product whenthe subject imports and domestic wind towers are compared on the basis of total delivered cost to thepurchaser for the same project.186 For GE’s projects when both subject imports and domestic wind towerswere used for a wind project, subject imports were priced higher on a total delivered cost basis in ***instances.187 For Siemens, the delivered cost for the subject imports was higher in *** instances wherecomparisons are available for wind tower projects supplied by both domestic producers and subjectimports.188 However, the GE and Siemens’ projects which were supplied by both subject imports anddomestically produced wind towers were a relatively small fraction of the total wind projects. Themajority of wind tower projects were entirely supplied by either imports or domestic product.189 Becausethe record does not indicate that, at least on a delivered basis, subject imports were underselling domesticwind towers, we do not find evidence of significant underselling.190
The available data also do not provide evidence of significant price depressing effects by thesubject imports. Price trends are difficult to discern in these investigations. Domestic producers’ salesvalues increased over the period, but the size of wind towers have also increased, thus making unit values
181 Tr. at 141 (Hazel) (“We do not take bids for towers. Because of the logistical problems in moving towers andthe expense, we always, let me repeat always, try to buy as many towers as we need for a domestic project from aqualified facility closest to the project.”).
182 CR at V-5, PR at V-4.
183 See CR/PR at Tables V-1 and V-5.
184 CR at V-1, PR at V-1. Prices from the U.S. producers are on an f.o.b. ex works basis, and prices of imports areon an f.o.b port of export basis. CR at V-4 n.4, PR at V-3 n.4. We typically compare the U.S. f.o.b. price from itspoint of shipment in the United States with the f.o.b. price of imports for the first arm’s length transaction after theimports have entered the United States. In these investigations, there is no arms length transaction in the UnitedStates because the importers are also end users.
185 See, e.g., Tr. at 156-157 (Dougan).
186 See CR at V-6, Table V-2 (indicating that when both subject imports and domestic wind towers were used fora wind project by GE ***). Notably, the incremental differentials declined significantly in 2012.
187 CR at V-6, PR at V-4.
188 CR at V-42, PR at V-5-6.
189 For GE, of the 130 total projects, the domestic industry supplied 63 projects exclusively and subject importssupplied 17 projects exclusively. CR at V-5 to V-6, PR at V-4. For Siemens, the domestic industry supplied 21projects exclusively and subject imports supplied 10 projects exclusively. CR at V-42; PR at V-5-6. Consequently,while the pricing data do not indicate the existence of significant underselling because they do not reflect acompetitive bidding process, these data also do not prove the absence of adverse price effects.
190 Petitioners did not provide sufficiently detailed information for staff to investigate specific lost sales or lostrevenue allegations, presumably due to the non-transparent nature of the bidding process. Consequently, there wereno confirmed lost sales or revenue allegations. CR at V-67, PR at V-7.
23
unreliable as an indicator of relative price levels.191 The record does, however, indicate that theincremental cost for the purchase of subject imports for projects supplied by both domestic and subjecttowers ***.192 For GE’s projects when both subject imports and domestic wind towers were supplied,subject imports had an average incremental cost 28.0 percent higher than domestic towers from 2009-2011, but that margin decreased to 11.2 percent in 2012.193
We find that although OEMs ultimately are concerned with total delivered cost, they do not agreeto purchase wind towers from the closest available source without regard to f.o.b. pricing. Rather, theynegotiate with the domestic producers regarding f.o.b. prices, the largest component of delivered cost.194 There have also been instances where the OEMs have pressured the domestic producers to renegotiatetheir supply agreements to set lower prices or alter volumes in light of the availability of low-pricedsubject imports.195 The small number of OEMs in the market, the importance to them of price inpurchasing decisions, their pattern of negotiating prices with domestic producers, and the availability ofalternative sources of supply in the market (the most prominent of which during the latter portion of theperiod of investigation was subject imports), placed pressure on domestic producers to discipline theirprices in order to receive bid solicitations or orders.
With respect to price suppression, we find that the domestic industry’s unit cost of goods sold(COGS) increased overall between 2009 and 2011, particularly in the merchant market for wind towerswhere there is competition with subject imports.196 The domestic industry’s ratio of COGS to netmerchant market sales increased during the period, from *** percent in 2009 to *** percent in 2010, andthen to *** percent in 2011.197 This ratio was *** percent in interim 2011 and *** percent in interim2012.198 199 Notwithstanding production and related issues which also increased the U.S. industry’s coststo some extent, the elevated ratios during 2011 and interim 2012 coincided with increasing volumes ofsubject imports, suggesting that the industry was unable to increase its prices sufficiently to cover its costsdue to the increasing presence of the subject imports.
191 See CR at I-12 to I-13, PR at I-10, CR/PR at Fig. I-4.
192 See CR/PR at Table V-2.
193 CR/PR at Table V-2; CR at V-6, PR at V-4.
194 See Petitioners’ Posthearing Brief, Exhibit 2 (Siemens asking DMI to review conversion costs); Tr. at 31-32(Cole) (OEMs do not reveal bids but do leverage quotes from other producers to drive f.o.b. prices down); Tr. at 37(Smith) (OEMs provide target pricing).
195 CR at II-23, III-11, III-12, PR at II-11-14 and III-7-8. As noted, the record indicates that ***. The shift to ***meter towers reportedly resulted in ***. CR at VI-17 n.28, PR at VI-8 n.28.
196 Unit COGS for commercial operations were $*** in 2009, $*** in 2010, $*** in 2011, $*** in interim 2011and $*** in interim 2012. CR/PR at Table VI-1. The domestic industry’s net sales values for commercial transferswere $*** in 2009, $*** in 2010, $*** in 2011, $*** in interim 2011 and $*** in interim 2012.
197 See CR/PR at Table VI-1.
198 See CR/PR at Table VI-1. With *** transfer values included, the COGS to net sales rose between 2009 and2011 and remained elevated in interim 2012. The ratio was *** percent in 2009, *** percent in 2010, 89.6 percentin 2011, 97.9 percent in interim 2011 and 94.2 percent in interim 2012. CR/PR at Table VI-2.
199 We have primarily focused on the merchant market for wind towers because this is where competition withsubject imports is most intense. Furthermore, *** which do not necessarily reflect market values. CR at VI-4 n.5,PR at VI-2 n.5. We have, however, also considered the data with ***, but do not find them as probative of theeffects of the subject imports as the information reflecting only commercial operations particularly in light ofVestas’s decision not to allow Commission staff to verify its transfer pricing data.
24
Given the highly inelastic nature of wind tower demand and the strong demand for wind towersduring the period, we would have expected the industry to have been able to increase its pricessufficiently to recover its costs. Instead, we find that the price-suppressing effects of the subject importslimited the domestic industry’s ability to recover its costs. The record contains documented evidence ofOEMs efforts to negotiate downward producers’ f.o.b. pricing.200 We therefore find that subject imports,despite the lack of evidence of significant underselling, prevented price increases, which otherwise wouldhave occurred, to a significant degree.201
For the foregoing reasons, we find that the increasing volumes of subject imports have hadsignificant adverse price effects on the domestic industry.
C. Impact of the Subject Imports202
In examining the impact of subject imports, section 771(7)(C)(iii) of the Tariff Act provides thatthe Commission “shall evaluate all relevant economic factors which have a bearing on the state of theindustry.”203 These factors include output, sales, inventories, ability to raise capital, research anddevelopment, and factors affecting domestic prices. No single factor is dispositive and all relevant factorsare considered “within the context of the business cycle and conditions of competition that are distinctiveto the affected industry.”204
We have carefully examined the performance of the domestic industry producing wind towers. We find that the domestic industry’s performance was adversely affected by the subject imports over theperiod examined and in interim 2012 in particular. As a result of the significant volumes of subjectimports during interim 2012, the domestic industry was unable to benefit from the sharp increase inapparent U.S. consumption before the PTC was expected to expire, and it experienced a decline in marketshare and only a modest increase in production and U.S. shipments. Furthermore, due to the increasedpresence of subject imports and evidence that OEMs pressure domestic producers to keep f.o.b. priceslow or lose sales to subject imports, especially in the Midwest, the industry was unable to increase its
200 As noted, the incremental cost for the purchase of subject imports ***. See CR/PR at Table V-2.
201 There is no requirement that subject imports be underselling domestically produced wind towers in order tosuppress price increases. See e.g., Cemex S.A. v. United States, 790 F. Supp. 290, 299 (Ct. Int’l Trade 1992) (“Torequire findings of underselling would be inconsistent with the proposition that price suppression or depression issufficient.”), aff’d, 989 F. 2d 1202 (Fed. Cir. 1993); Maine Potato Council v. United States, 613 F. Supp. 1237, 1245(Ct. Int’l Trade 1985) (higher quality imports may have price suppressing effects notwithstanding their higherprice.).
202 The statute instructs the Commission to consider the “magnitude of the dumping margin” in an antidumpingproceeding as part of its consideration of the impact of imports. 19 U.S.C. § 1677(7)(C)(iii)(V). In its finaldetermination of sales at less than fair value for China, Commerce found weighted-average dumping margins of44.99 percent to 47.59 percent for six specific producer and exporter combinations, and 70.63 percent for all others.CR/PR at Table I-2; 77 Fed. Reg. 75996 (Dec. 26, 2012). With respect to subject imports from Vietnam, Commercefound a weighted average margin of dumping of 51.50 percent for the CS Wind Group producer/exporter group and58.49 percent for all others. CR/PR at Table I-3; 77 Fed. Reg. 75988 (Dec. 26, 2012).
203 19 U.S.C. § 1677(7)(C)(iii); see also SAA at 851 and 885 (“In material injury determinations, the Commissionconsiders, in addition to imports, other factors that may be contributing to overall injury. While these factors, insome cases, may account for the injury to the domestic industry, they also may demonstrate that an industry is facingdifficulties from a variety of sources and is vulnerable to dumped or subsidized imports.”).
204 19 U.S.C. § 1677(7)(C)(iii); see also SAA at 851, 885; Live Cattle from Canada and Mexico, Inv. Nos. 701-TA-386, 731-TA-812-813 (Preliminary), USITC Publication 3155 at 25 n.148 (Feb. 1999).
25
prices sufficiently to cover its increased costs, resulting in steep declines in operating income, and capitalexpenditures even with the increase in apparent U.S. consumption.
The domestic industry’s trade data reflect very modest increases over the period. The industry’sproduction decreased from 2,069 towers in 2009 to 1,751 towers in 2010 and then increased to ***towers in 2011.205 Production was *** percent higher in interim 2012, at *** towers, than in interim2011, at *** towers.206 The domestic industry’s U.S. shipments decreased from 2,057 towers in 2009 to1,738 towers in 2010, before increasing to *** towers in 2011, and they were higher in interim 2012, at*** towers, than in interim 2011, at *** towers.207
Domestic production capacity increased from 3,343 towers in 2009 to 3,898 towers in 2010 andthen to *** towers in 2011.208 Capacity was *** towers in interim 2011 and *** towers in interim2012.209 The industry’s rate of capacity utilization declined overall, before increasing in interim 2012relative to interim 2011.210 It fell from 61.9 percent in 2009 to 44.9 percent in 2010 and then increased to*** percent in 2011. It was *** percent in interim 2011 and *** percent in interim 2012.211
The domestic industry’s production and related workers increased from 1,616 workers in 2009 to1,695 workers in 2010 and *** workers in 2011.212 There were *** production and related workers ininterim 2011 and *** production and related workers in interim 2012.213 Wages paid increased from$85.3 million in 2009 to $94.3 million in 2010 and $*** in 2011.214 Wages paid were $*** in interim2011 and $*** in interim 2012.215 Productivity fell from 0.7 towers produced per 1,000 hours in 2009 to0.5 towers in 2010 produced per 1,000 hours and then held steady through the remainder of the period.216
The domestic industry’s share of apparent U.S. consumption increased modestly until interim2012 when subject imports surged into the market. The domestic industry’s market share increased from53.6 percent in 2009 to 60.2 percent in 2010 and then to *** percent in 2011.217 The industry’s marketshare, which was *** percent in interim 2011, was much lower, at only *** percent in interim 2012.218
The quantity of U.S. producers’ commercial net sales decreased from 2009 to 2011 and in interim2012 relative to interim 2011.219 Although the value of U.S. producers’ net sales increased, this increasewas attributable to increased unit values, which, as noted above, reflected in part the higher raw material
205 CR/PR at Table III-3.
206 CR/PR at Table III-3.
207 CR/PR at Table III-9. Domestic producers’ inventories remained minimal during the period, reflecting themade-to-order nature of the product. CR/PR at Table III-11.
208 CR/PR at Table III-3.
209 CR/PR at Table III-3.
210 CR/PR at Table III-3.
211 CR/PR at Table III-3.
212 CR/PR at Table III-13.
213 CR/PR at Table III-13.
214 CR/PR at Table III-13.
215 CR/PR at Table III-13.
216 CR/PR at Table III-13.
217 CR/PR at Table IV-6.
218 CR/PR at Table IV-6.
219 See CR/PR at Table VI-1 (commercial sales only). When internal transfers by *** are included in addition tocommercial sales, the industry increased its sales quantity. See CR/PR at Table VI-2.
26
costs associated with the shift in product mix toward larger wind towers.220 The industry’s commercialnet sales decreased from $*** in 2009 to $*** in 2010 and then increased to $*** in 2011, and they were$*** in interim 2011, in comparison to $*** in interim 2012.221
The domestic industry’s operating income and operating margin declined throughout theperiod.222 In the commercial segment of the market, which faced the most direct competition from subjectimports, the industry’s operating income fell from $*** in 2009 to $*** in 2010. The industry thenreported losses of $*** in 2011, $*** in interim 2011 and $*** in interim 2012.223 The industry’soperating income margin on commercial sales also declined from *** percent in 2009 to *** percent in2010, and *** percent in 2011.224 The industry’s operating income margins continued their downwardtrend in the interim periods, falling from *** percent of sales in interim 2011 to an even worse ***percent in interim 2012.225
The domestic industry’s capital expenditures also declined sharply from $*** in 2009 to $*** in2010, and $*** in 2009. Capital expenditures were higher in interim 2011, at $***, than in interim 2012,at $***.226
Although the domestic industry’s net sales values increased, as discussed previously, the unitCOGS and the COGS to net sales ratio increased during the period. The increase in the COGS to netsales ratio occurred because there was a cost/price squeeze where the domestic industry was unable toraise prices sufficiently to cover costs. Notwithstanding DMI’s impairment charge in interim 2012, thedecrease in the industry’s operating income largely reflects a progressive contraction of the industry’sgross profit margin as increases in net sales values were insufficient to offset increasing costs during the
220 CR/PR at Table VI-1; CR at VI-14; PR at VI-5, VI-7.
221 CR/PR at Table VI-1.
222 CR/PR at Table C-1. The industry’s operating income on commercial sales and transfers fell from $*** in2009 to a loss of $*** in 2010. The industry reported operating income of $*** in 2011, and operating losses of$*** in interim 2011 and $*** in interim 2012. The industry’s operating income margin on commercial sales andtransfers also declined from *** percent in 2009 to *** percent in 2010, and *** percent in 2011. The industry’soperating income margins on all sales continued their downward trend in the interim periods, falling from ***percent of sales in interim 2011 to *** percent in interim 2012. CR/PR at Table C-1.
223 CR/PR at Table C-2.
224 CR/PR at Table C-2.
225 CR/PR at Table C-2. Respondents argue that the anticipated non-renewal of the PTC led to non-recurringcharges during interim 2012 that were unrelated to subject imports. Siemens’s Posthearing Brief at 13-14; ForeignRespondents’ Prehearing Brief at 2, 48, 51. The Commission’s practice is to include acquisition or dispositionrelated charges that are properly accounted for in the financial results of the domestic industry in order to obtain acomplete picture of the industry. Pursuant to standard Commission practice, the nature and magnitude of this andother material non-recurring items were identified so that their impact on the industry’s financial results could beevaluated. DMI cited adverse market conditions such as the anticipated non-renewal of the PTC. CR at VI-20 n.35;PR at VI-10 n.35. At the time of DMI’s impairment in mid-2012, these adverse conditions included the pendingnon-renewal of the PTC, which presaged reduced demand in 2013, and the elevated levels of subject imports, amongother factors. We acknowledge that there was a notable increase in the industry’s SG&A expenses in interim 2012,and corresponding operating loss increase that reflected the impairment of DMI’s U.S. wind tower manufacturingfacilities at the end of the period. However, even with this $*** charge excluded, the industry would ***. SeeCR/PR at Table C-2. We also note that the adverse trends in the domestic industry operating results began in 2011,before this charge was recognized in interim 2012. Furthermore, while Katana reported that it ***. CR at VI-20n.35; PR at VI-10 n.35.
226 CR/PR at Table VI-6. Research and development expenses were $*** in 2009, $*** in 2010 and $*** in2011. They were higher in interim 2011, at $***, than in interim 2012, at $***. CR/PR at Table VI-6.
27
period examined.227 Although Respondents argue that the domestic industry was able to pass through itsincreasing raw material costs to purchasers through the use of escalation clauses, we find that thedomestic industry’s inability to increase its prices to reflect overall higher costs led to operating losses.228
We have considered whether there are other factors that may have adversely affected thedomestic industry during the period examined. We have already noted that nonsubject imports had adeclining presence during the period 2009 to 2011, and a steady presence when comparing the interimperiods.229 Thus, the *** percentage point increase in subject imports in interim 2012 relative to interim2011 came almost entirely at the expense of the domestic industry, while nonsubject imports remained aminor factor in the growing U.S. market.230
Respondents argue that the domestic industry was unable to supply more wind towers to the U.S.market, particularly during 2012, so the loss in market share should not be attributed to the subjectimports.231 Contrary to Respondents’ argument, whether calculated on an annual, semiannual or monthlybasis, the record indicates that the domestic industry had excess capacity during the period, includinginterim 2012 that would have allowed it to increase shipments and fill a greater share of the increaseddemand.232 Nor does the record support Respondent’s argument that available domestic capacity waslimited to locations too remote from project sites to be economical. Domestic producer Broadwind built aproduction facility in Brandon, SD that was never qualified for production by the OEMs despiteBroadwind’s proven track record qualifying other facilities.233 Broadwind also offered to build aproduction facility near Shepherds Flat, a large wind farm in Oregon installed in 2011 and 2012, but its
227 CR/PR at Table VI-1.
228 Foreign Producers’ Prehearing Brief at 44. We note that the raw materials component of COGS as apercentage of net sales increased from *** percent in 2009 to *** percent in 2010 and *** percent in 2011. CR/PRat Table VI-1. The ratio remained high during the interim periods as well. See CR/PR at Table VI-1. See CR at VI-18; PR at VI-18 (“The overall increase in the ratio of raw material costs to net sales value is an important factorexplaining the overall decline in the industry’s overall gross profit during the period.”)
229 See CR/PR at Table IV-5; Fig. IV-2.
230 See CR/PR at Table C-2. Foreign Respondents argue that the seasonal nature of this industry means thatresults for the industry will necessarily be better in the second half of the year. Thus, in their view, interim 2012 datashould be discounted. Foreign Respondents’ Prehearing Brief at 19-20. We note that at least on commercialoperations, the domestic industry performed better in the first half of 2011 than it did in the second half. CR/PR atTable C-2. Given the strong growth in demand in the first half of 2012, and the industry’s production data whichshow production fluctuating throughout the year, we do not find any basis for concluding that the industry’s interim2012 results should be accorded less weight. See CR/PR at Table III-5.
231 In particular, Respondents argue that domestic producers turned away orders during interim 2012. ForeignRespondents’ Prehearing Brief at 29-31; Siemens’s Prehearing Brief at 25-36.
232 See CR/PR at Tables III-5 and III-6. As noted above, we do not agree with Foreign Respondents’ argumentthat the seasonal nature of the industry should cause us to give no weight to the domestic industry’s annual capacityand capacity utilization information. Foreign Respondents’ Posthearing Brief at 36. The semiannual and monthlyinformation does not support their argument concerning seasonality and instead indicates that the industry’sproduction was not concentrated in any particular portion of the year, nor does it indicate that excess capacity wasmore prevalent in the “off season.” See CR/PR at Tables III-5 and III-6.
233 Broadwind completed construction of the Brandon, SD facility in 2010, and it reported in its 2010 10-K thatimports of wind towers from Asia were responsible for its decision not to commence production at the plant. CR atVI-22 n.41; PR at VI-11 n. 41. Broadwind operated qualified facilities in Texas and Wisconsin during the period ofinvestigation. CR/PR at Table III-5.
28
offer was rejected and the OEM relied on subject imports.234 Another large producer, Trinity, operated at*** utilization rates during the period at three facilities dedicated to supplying *** in Illinois, Iowa, andTexas and, as noted, *** relied on subject imports for wind projects in the Midwest.235 ***.236 ***,resulting in start-up related costs and operating inefficiencies for the company in 2011 ***.237 Finally, wefind that the record does not support Respondents’ claim that the exit of multiple domestic productionfacilities from the industry during 2012 was primarily done in anticipation of the non-renewal of the PTCand other federal incentives and prevented OEMs from sourcing domestic towers for certain projects in2012 where domestic towers would have been the preferred source. While the looming non-renewal of thefederal incentives played a role in these closures, the domestic producers’ loss of sales opportunitiesduring the 2012 demand boom accelerated the time lines for streamlining domestic capacity. Wetherefore find that record contains ample evidence that the presence of the subject imports led to reducedproduction levels, shipments, capacity utilization and price increases for the domestic industry as theOEMs turned to subject imports rather than rely upon the domestic producers who had nearby unusedcapacity.238 239
We therefore find that subject import levels have increased significantly, both absolutely andrelative to domestic production and consumption, gained significant market share at the expense of thedomestic industry, and adversely affected the performance of the domestic industry. The increasingvolumes of subject imports resulted in reduced growth in sales volumes and U.S. shipments andsuppressed domestic price increases despite a robust growth in demand at the end of the period. Their
234 Broadwind’s offer to build a production facility near the Shepherds Flat wind farm presumably would havereduced the OEM’s transportation costs for shipping wind towers to the wind project site. Broadwind’s offer wasrejected by GE. CR at II-4 n.6, PR at II-3 n.6. Katana also was considered as a potential supplier or the Shepherd’sFlat project but was rejected. Id.
235 See CR/PR at Tables III-5 and III-6. Trinity indicated that *** did not provide notice that it would not behonoring the supply agreement and it later learned that the towers were sourced from China and Vietnam because ofpricing. Tr. at 81, 122-123 (Cole).
236 Petitioners’ Posthearing Brief, Exhibit 1, at 12-13.
237 CR at III-18, VI-19; PR at VI-9. See also Siemens’s Posthearing Brief at 2-4 (indicating that GE may havebreached its contract with Trinity so that GE could purchase subject imports). With long lead times to make otherarrangements for unused capacity, a domestic producer cannot easily find other purchasers to use that capacity. CRat II-5, PR at II-2.
238 Further, as the Commission previously has noted, “there is no short supply provision in the statute” and “thefact that the domestic industry may not be able to supply all of demand does not mean the industry may not bematerially injured or threatened with material injury by reason of subject imports.” Softwood Lumber from Canada,Inv. Nos. 701-TA-414 and 731-TA-928 (Article 1904 NAFTA Remand) at 108, n. 310 (December 2003). See also,Certain Activated Carbon from China, Inv. No. 731-TA-1103 (Preliminary), USITC Pub. 3852 (May 2006) at 19, n.134; Certain Orange Juice from Brazil, Inv. No. 731-TA-1089 (Final), USITC Pub. 3838 (March 2006) at 20 n. 143;Certain Lined Paper School Supplies, Inv. Nos. 701-TA-442-443 (Preliminary) and 731-TA-1095-1097(Preliminary), USITC Pub. 3811 (October 2005) at 23, n. 155; Metal Calendar Slides from Japan, Inv. No.731-TA-1094 (Preliminary), USITC Pub. 3792 (August 2005) at 9, n. 45 (“To the extent that Respondents claim thatthe Commission is legally unable to make an affirmative finding of material injury by reason of subject importsbecause the domestic industry is incapable of supplying domestic demand, they are incorrect.”).
239 Respondents contend that in many instances, the domestic industry could not meet delivery deadlines or wereotherwise unreliable. Foreign Respondents’ Posthearing Brief at 36-38. We note that the domestic industry onlypaid ***. CR at VI-21 n.40; PR at VI-11 n.40. Further, the OEMs indicated that they typically chose suppliers basedon proximity to the wind project, and in many instances domestic producers were the only suppliers to wind projectssuggesting that they were considered reliable sources of supply.
29
effects have also included lower rates of capacity utilization, as well as declining market share andfinancial losses.
For the reasons discussed above, we conclude that there is a causal nexus between the subjectimports and the poor performance of the domestic industry. Consequently, we find that the domesticindustry is materially injured by reason of subject imports.
VII. CONCLUSION
For the reasons stated above, we determine that an industry in the United States is materially injured by reason of subject imports of wind towers from China that are sold in the United States at lessthan fair value and subsidized by the Government of China and subject imports of wind towers fromVietnam that are sold in the United States at less than fair value.
30
31
VIEWS OF COMMISSIONER DEAN A. PINKERT
Based on the record in these investigations, I determine that an industry in the United States is threatened with material injury by reason of imports of utility scale wind towers from China that the U.S. Department of Commerce (“Commerce”) has determined to be subsidized by the Government of China and sold at less than fair value (“LTFV”) and imports from Vietnam that Commerce has determined to be sold at LTFV.1
In making these determinations, I join sections I-VI of the Views of the Commission. In regard to section VII.A., however, although I agree that the volume and the increase in volume of subject imports from China and Vietnam were significant in absolute terms during the period examined, I would, as explained below, qualify the finding that those increases were significant relative to consumption and production in the United States. In regard to sections VII.B and C, although I agree with much of the reasoning, including that on underselling and price depression, I do not join the finding of price suppression by reason of the subject imports.2 Inasmuch as I find neither significant underselling nor significant adverse price effects during the period examined, I am unable to determine that the subject imports are a cause of material injury to the domestic industry. Nevertheless, as I will presently demonstrate, a determination that such imports pose an imminent threat of material injury to the industry is amply warranted on the record of these investigations.
I. CUMULATION FOR PURPOSES OF THREAT DETERMINATION
As indicated above, I join section IV of the Views of the Commission in finding that the statutory
prerequisites to cumulation are satisfied and that there is a reasonable overlap of competition between imports from China and imports from Vietnam and thus that such imports should be cumulated for purposes of the Commission’s determination of material injury. In analyzing threat of material injury, the statute provides that I may exercise discretion in determining whether to cumulate the subject imports.3 For the reasons discussed below and based on the available evidence, I find similar trends in the imports from the two countries, such that the overlap in competition between imports from China and imports from Vietnam will likely continue into the imminent future. I find that these trends justify cumulation for purposes of my threat determination.
The trends in import volumes from China and Vietnam were similar over the period examined, although their absolute volumes and market shares were different. The volume of imports from both countries decreased from 2009 to 2010, then increased substantially from 2010 to 2011 and was greater in interim 2012 than in interim 2011.4
1 Pursuant to 19 U.S.C. § 1673d(b)(4)(B), I further find that I would not have found material injury but for the
suspension of liquidation of entries of the subject merchandise. 2 I am unable to conclude on the basis of the record in these investigations that the subject imports prevented the
domestic industry from raising its prices to cover cost increases because (1) underselling was not significant and (2) there is no indication that the subject imports placed a ceiling on domestic prices, whether by means of a price cap or otherwise. Cf. Bottom Mount Combination Refrigerator-Freezers from Korea and Mexico, Inv. Nos. 701-TA-477 and 732-TA-1180-1181 (Final), Pub. 4318 (May 2012), at 36. In regard to the latter, I find it notable that, as explained below, the relationship between subject import pricing and domestic pricing changed significantly over the course of the period examined.
3 19 U.S.C. § 1677(7((H). 4 In finding a similarity in the trends in imports from China and Vietnam, I acknowledge that both the absolute
and percentage increases in imports from China in interim 2012 over interim 2011 were much greater than the increases with respect to imports from Vietnam. Nevertheless, imports from both sources trended upward. CR/PR at Tables IV-2 and C-1.
32
There is only limited information permitting a comparison of the price trends of imports from China with those of imports from Vietnam.5 This information does not demonstrate any significant dissimilarity in the trends in prices of imports from the two countries, certainly not enough to analyze imports from the two countries separately given their overlap during the period and the similarity in their volume trends.
I further note that, as found with respect to cumulation for purposes of the material injury determination, a major producer in China and a major producer in Vietnam -- CS Wind (China) and CS Wind (Vietnam) -- are related entities, and CS Wind (Vietnam) accounted for *** during the period.6 These companies have the ability to coordinate their activities with respect to the U.S. market,7 providing further reason to cumulate imports from China and Vietnam for purposes of my determination regarding threat of material injury.
II. FACTORS SUPPORTING A DETERMINATION OF THREAT OF MATERIAL
INJURY8
As discussed above, I find that the volume and the increase in volume of the subject imports from China and Vietnam are significant. For purposes of my determination of threat of material injury, the trend in imports from the two countries toward the end of the period is particularly important.
For most of the period, subject import market share either declined (between 2009 and 2010) or increased with offsetting declines in the market share of imports from nonsubject countries (between 2010 and 2011).9 Combined reported production capacity in China and Vietnam was increasing, but so too was production, which was primarily destined for the respective home markets and the United States.10 This situation began to change toward the end of the period, however, as leading importers Siemens and GE worked to ***.11
As U.S. demand for wind towers peaked in interim 2012 in anticipation that the Production Tax Credit (“PTC”) and the Investment Tax Credit (“ITC”) would expire at the end of the year and not be renewed,12 imports from China and Vietnam grew significantly in terms of both volume and market share. Cumulated U.S. shipments of subject imports were 192.8 percent higher in interim 2012 than in interim 2011. As a share of the U.S. market, cumulated subject imports were *** percentage points higher in interim 2012 than in interim 2011 (***).13 Most of this surge in market share late in the period came at the expense of the domestic industry, whose market share was ***.
Significantly, purchases and installations of subject imports also increased significantly at the end of the period in the regions of the U.S. market where respondents argue they do not substantially compete.14 Subject imports sold to the Midwest states grew to *** units in 2011, which was substantially higher than in any prior year, and then surged to *** units in the first six months of 2012. Similarly, in
5 All the pricing data comparing imports from China and Vietnam are from Siemens, and those data are quite
limited. GE did not source wind towers from Vietnam. ***, which accounted for “a substantial majority of imports from Vietnam,” as well as ***, CR at IV-4, PR at IV-3, provided no pricing data. Siemens reported prices for purchases from both Chinese and Vietnamese sources ***. See Foreign Respondents’ Post-Hearing Brief at 34.
6 CR at VII-11, VII-14, PR at VII-8 and VII-9. 7 See, e.g., CR at VII-8 n.13, PR at VII-7 n.13 (***). 8 The statutory threat factors are set forth at 19 U.S.C. § 1677(7)(H). 9 CR/PR at Table C-1. 10 CR/PR at Table VII-6. 11 CR at VII-4 n.7, PR at VII-3 n.7. 12 See CR at II-11, PR at II-6; Memorandum to the File (Investment Tax Credit). 13 CR/PR at Table C-1. 14 See, e.g., Siemens’s Post-Hearing Brief at 1, 8-10; Foreign Respondents’ Final Comments, at 11-12 & n.43.
33
the Texas/Oklahoma/New Mexico/Arizona area, subject imports grew from their prior peak of *** units in 2010 to *** units in the first six months of 2012.15
The trends in subject imports toward the end of the period, both overall and in the inland regions of the U.S. market, speak volumes with respect to the interests and capabilities of subject producers in the imminent future. Not only can subject imports compete in all major regions of U.S. demand, but they are able to increase significantly over a short period, as occurred toward the end of the period in response to the then-expected termination of the PTC and ITC. There is no reason to believe that the subject exporters, having expanded their presence in the U.S. market so significantly, beginning in 2011 and accelerating in 2012, including in the central region of the country where they might be expected not to be fully competitive due to transportation costs and logistical difficulties, would, in the absence of trade relief, relinquish it by not competing in the imminent future to their fullest abilities in all regions of the U.S. market.
Moreover, subject producers increased their capacity significantly between 2009 and 2012. The projected full-year 2012 capacity reported by the responding Chinese and Vietnamese producers was ***,16 and they have not projected any significant reduction in cumulated capacity in 2013.17
Total reported capacity in China and Vietnam in 2011 was *** units, and total reported production was *** units, for a capacity utilization rate of only *** percent.18 Even in interim 2012, responding producers reported capacity of *** units and production of *** units, for a capacity utilization rate of *** percent.19 Subject producers projected exporting *** units to the United States in 2013, even without the renewal of the PTC and ITC. Moreover, absent growth in other markets equivalent to the growth in exports to the United States in 2011 and 2012, subject producers projected a *** lower rate of capacity utilization in 2013 than in 2011 or interim 2012.20 Thus, the Chinese and Vietnamese industries have significant unused capacity for the production of wind towers that they can use to export to the United States in the imminent future.21 22
In considering subject producers’ ability to export to the United States in the imminent future, I have also taken into account their end-of-period inventories. Such inventories were significant, particularly in China.23
15 CR/PR at Tables V-1 and V-5. 16 CR/PR at Table VII-6. The growth in production levels during this period was less than *** that of capacity –
*** towers. 17 CR/PR at Table VII-6. 18 CR/PR at Table VII-6. 19 Id. 20 Id. 21 Indeed, in commenting on Chinese producers’ concerns about these investigations, an official of the Chinese
Wind Energy Equipment Association noted that Chinese producers “need to open new markets, because there is overcapacity in the {Chinese} domestic market.” Petitioners’ Post-Conference Brief at Ex. 2.
22 In making this finding regarding subject producers’ capacity, I have taken into consideration that not all producers in the subject countries are qualified to sell wind towers in the U.S. market, CR at VII-3, PR at VII-3, and that some subject producers’ production facilities may not be located sufficiently close to a port to feasibly export to the United States. I note, however, that many of those companies are not included in the Commission’s foreign producer capacity data because they did not respond to the Commission’s questionnaires. Moreover, the companies that did report capacity and capacity utilization data accounted for the great majority of exports to the United States over the period examined, and the capacity available just to those producers, particularly during a period of moderate demand such as that likely to prevail in the imminent future, provides them with the ability to materially harm the domestic industry.
23 Wind towers are generally made to order, although they are not necessarily custom made, and U.S. importers’ end-of-period inventories of subject imports in interim 2012 were not significant. Id. at Table VII-8. Nevertheless, Chinese producers had inventories of 543 wind towers in June 2012 (the end of the data collection period), corresponding to 18.4 percent of their production and 17.5 percent of their shipments in that period, while
(…continued)
34
Furthermore, subject producers are increasingly export-oriented, making *** percent of their total shipments in 2011 and *** percent of their total shipments in interim 2012 to export markets,24 and have become more dependent on the United States as an export market. As a share of their total shipments, exports to the United States grew from *** percent in 2009 to *** percent in 2011 and *** percent in interim 2012.25 Given these facts, it is unlikely that demand in the imminent future in the Chinese and Vietnamese home markets and in third-country markets can absorb the subject producers’ excess capacity.
In considering subject producers’ ability and likelihood in the absence of trade relief to export significant volumes to the United States in the imminent future, it is especially important to note that demand in the U.S. market in the current year is likely to reflect both the termination of the PTC and ITC at the end of 2012 and their one-year renewal at the beginning of 2013. Because demand should be moderate (albeit increasing) in the near future,26 it should take a much smaller volume of subject imports to constitute a significant share of the market than it took during the period of heightened demand in 2011 and 2012 leading up to the then-expected end of the PTC and ITC. Given moderate demand, subject producers are likely to compete intensely for U.S. sales in order to better utilize their available capacity. Consequently, for the above reasons, I find that, in the absence of trade relief, imports of the subject merchandise in the imminent future are likely to be significant and to increase significantly, both in absolute terms and relative to consumption, over the low-to-nonexistent levels to which they fell as a result of expectations that the PTC and ITC would not be renewed.27
Subject imports are also likely in the absence of trade relief to have an adverse impact on domestic prices in the imminent future. Price is a very important factor in purchasers’ sourcing decisions.28
The record in these investigations shows that, when delivered prices of the subject imports and domestic wind towers sold for use in the same projects are considered, the prices of the subject imports were generally higher than those of the domestic product.29 This picture changed toward the end of the period, however. Although the purchaser’s average additional cost for the subject imports over the cost of
(…continued)
Vietnamese producers held *** wind towers in inventory, which equaled *** percent of their production and *** percent of their shipments. CR/PR at Tables VII-2 and VII-4.
24 Id. See also Foreign Respondents’ Pre-Hearing Brief at 54 (conceding that Chinese wind tower producers are ***.
25 Id. 26 CR at II-10, PR at II-7. 27 See CR/PR at Table VII-9 (showing that no importers had orders for the importation of subject wind towers
after July-September 2012). Contrary to respondents’ arguments, the absence of future import orders shown in Table VII-9 does not indicate that there can be no imminent increase in subject imports or imminent threat of material injury by reason of such imports. That table reflects the situation at the time that importers responded to the Commission’s questionnaire, when the PTC and ITC were expected to terminate at the end of 2012. Obviously, purchasers who depended on the PTC and ITC in ordering wind towers would have been reluctant to place orders until the situation with respect to the PTC and ITC was clarified. Now, with the PTC and ITC renewed only for projects that begin construction by the end of 2013, purchasers are necessarily compelled to act quickly to place orders, likely resulting in intense competition for the reduced volume of sales and likely negatively impacting domestic producers in the imminent time frame. Although testimony at the Commission’s hearing indicated that it would likely take six to nine months for purchasers to respond to the renewal of the PTC with new orders (which would in any event be within the imminent future), Hearing Tr. at 80, the relatively short time frame in which purchasers must begin construction of a project to qualify for the PTC and ITC means that orders are likely to be placed on an even more expedited basis.
28 CR at II-24 to II-26, PR at II-15 to II-16. 29 CR/PR at Table V-2 (comparing *** delivered costs for subject imports from China and domestic wind
towers).
35
the domestic product was 28.0 percent for projects with installation dates between 2009 and 2011, the gap in prices shrank to only 11.2 percent for projects in 2012.30
This trend toward converging prices toward the end of the period has significant implications looking forward, given the outlook for moderate demand in 2013. As subject producers seek to maintain a significant volume of imports and share of the U.S. market, they will need to sell at increasingly competitive prices, leading domestic producers to constrain their own pricing. Thus, I find that, in the absence of trade relief, imports of the subject merchandise are likely to continue their downward pricing trend in the imminent future and cause adverse effects on domestic prices.
Having found that, in the absence of trade relief, the volume and increase in volume of subject imports will likely be significant in the imminent future and that such imports will likely result in adverse effects on domestic prices, I further find that the continued and likely intensifying level of competition from subject importers will likely materially injure the domestic industry, which is already struggling and vulnerable to the impact of unfairly traded imports.31 Particularly in 2012, several domestic producers ceased production, closed plants, or switched to the production of other products.32 Although the industry increased its production and sales as demand escalated with the pending termination of the PTC and ITC, it lost significant market share and was unable to maintain profitability. Its operating income margin, which was *** percent in 2009, declined to only *** percent in 2011 and *** in interim 2012, even as U.S. consumption of wind towers reached its peak.33
The new competitive situation that will prevail with the renewal of the PTC and ITC will place additional pressures upon the domestic industry. Demand in the imminent future is likely to be uncertain and moderate relative to demand in previous years, making it difficult for the domestic industry to regain its footing. The volume of subject imports that would likely enter the U.S. market will contribute significantly to the industry’s problems, competing intensely for sales and causing adverse price effects. Limited sales opportunities in a less than robust market will intensify price competition between subject imports and domestic producers, and even a modest volume of subject imports would be likely to result in negative effects on the domestic industry. As a consequence, in the absence of trade relief, the industry is likely in the imminent future to suffer a significant loss of revenues that will cause a further deterioration in its financial condition, as well as declining employment, output, and productivity.
III. CONCLUSION
Accordingly, for the reasons discussed above, I determine that an industry in the United States is
threatened with material injury by reason of imports of utility scale wind towers from China that are subsidized and sold at LTFV and imports from Vietnam that are sold at LTFV.
30 Id. See also CR/PR at Table V-6. 31 I have not overlooked the fact that the domestic industry’s travails over the period examined may have resulted
in part from its own actions and business decisions, as well as the leverage maintained over it by major purchasers. In making a determination of threat of material injury, however, I am looking ahead to the imminent future, in which the industry’s vulnerable condition – whatever its causes – is a factor in assessing the likelihood of material injury.
32 CR at III-1 - III-2, PR at III-1. 33 CR/PR at Table C-1. This trend was even more pronounced for firms competing in the merchant market.
CR/PR at Table C-2.

DISSENTING VIEWS OF COMMISSIONERS DANIEL R. PEARSON, DAVID S. JOHANSON, AND MEREDITH M. BROADBENT
Based on the record in these investigations, we find that a domestic industry in the United Statesis neither materially injured nor threatened with material injury by reason of subject imports of utilityscale wind towers from China that are subsidized by the Government of China and sold in the UnitedStates at less than fair value and subject imports of utility scale wind towers from Vietnam that are sold inthe United States at less than fair value.1
I. NO MATERIAL INJURY BY REASON OF CUMULATED SUBJECT IMPORTS
A. Volume Effects of Subject Imports
Section 771(7)(C)(I) of the Act provides that the “Commission shall consider whether the volumeof imports of the merchandise, or any increase in that volume, either in absolute terms or relative toproduction or consumption in the United States, is significant.”2 We do not find the volume of subjectimports to be significant.
Our finding on volume flows directly from our understanding of the conditions of competitionwithin this industry. First, as discussed in the majority views, the demand for wind towers depends on thedemand for utility scale wind power installations.3 The demand for such installations is distributedunevenly throughout the United States.4 Demand tends to be concentrated in the central states, with someadditional demand on the West Coast and on islands.5
Second, wind towers themselves are large, heavy products and may be as much as 100 meterstall.6 Moving such products involves considerable planning, logistical support, and high costs.7 Geography can present significant difficulties. Wind tower purchasers have a stated and apparentpreference for sourcing towers from producer locations with the fewest transport difficulties and lowestcosts, which generally means sourcing from a producer near the installation.8 As a result, the domesticindustry has concentrated its production facilities in the central states.9
1 We join and adopt as our own sections I-VI of the majority Views.
2 19 U.S.C. § 1677(7)(C)(i).
3 CR at II-9, PR at II-5.
4 CR/PR at Figure III-1 and Table D-2.
5 CR/PR at Figure III-1 and Table D-2.
6 CR at I-11-I-12, PR at I-9.
7 CR at II-2, PR at II-1.
8 Tr. at 141 (Hazel); CS Wind prehearing brief at 23; Siemens prehearing brief at 4; GE posthearing brief at 4.Domestic producers’ offers to build new production facilities close to proposed wind installations suggest thatproximity is generally understood to be a strong purchaser preference. Petitioners’ posthearing brief at Exh. 1,pp. 21-22.
9 CR/PR at III-1 and Figure III-1.
37
Third, wind tower purchasers are typically OEM producers of wind turbines10 who provide thetower designs11 and sometimes the raw material for the towers.12 Buying practices of the OEMs vary, butthe assumption of responsibility for transport and transport cost by OEM purchasers is standardthroughout the industry.13 Producer qualification, by both tower type and facility, is common within theindustry and may require three to nine months to complete.14 Purchases of wind towers from facilitieslacking the appropriate qualifications appear rare.15
Timely delivery is always valued in this industry, with as many purchasers rating it as “veryimportant” as those who cite product consistency or quality.16 Purchasers also frequently cite availability,available capacity, and reliability of supply as “very important” factors.17 Purchase contracts frequentlycontain liquidated damage clauses to address possible delivery delays, because OEM purchasersthemselves may face penalties for late installation or operation.18 The concern for timeliness and thedifficulties of transporting these large items both contribute to purchasers’ apparent preference forsourcing towers from a facility close to the project.
These conditions held throughout the period of investigation (POI). However, the period ofinvestigation also included significant swings in apparent consumption. Wind power installations usingthese utility scale wind towers are generally significant undertakings and sensitive to financingavailability.19 The recent financial crisis had a significant impact on demand for wind towers because poorgeneral financial conditions made financing harder to find for such projects in the first half of the POI.20
Demand for wind towers is, however, also sensitive to the availability of both federal and stateincentive programs, such as the production tax credit (PTC) and the investment tax credit (ITC).21 Whilewind power may have reached grid parity with other energy sources at some times and in some markets,22
the withdrawal of incentives, or just the expectation of withdrawal, can have significant effects ondemand.23 During the POI, the PTC was set to expire at the end of 2012.24 In the wind power industryother incentives are available and support demand, but the PTC seems to be the most influential.25 Thepending expiration of the PTC created a firm deadline for new projects to qualify for benefits,26 whichgenerated unusual demand in the latter part of the POI, particularly in 2012. The PTC had an expiration
10 CR at I-3, PR at I-3.
11 Siemens prehearing brief at 4; Tr. at 177 (Hazel).
12 Petitioners’ posthearing brief at Exh. 1, p.4.
13 CR at V-2, PR at V-2. ***. CR at V-2 n.5, PR at V-2 n.5.
14 CR at II-28-II-29 and nn.49-50, PR at II-17-18 and nn.49-50.
15 The record contains ***. CR/PR at Table V-5.
16 CR/PR at Table II-3.
17 CR/PR at Table II-3.
18 Tr. at 154, 163 (Dougan), 177-178 (Hazel); GE posthearing brief at 5-6.
19 CR at II-9, PR at II-5.
20 CR at II-9-II-10, PR at II-5.
21 CR at II-10-II-12, PR at II-6-II-7.
22 CR at II-13, PR at II-8.
23 CR/PR at Figure II-1.
24 CR at II-10-II-11, PR at II-6.
25 Petitioners’ prehearing brief at 37-38.
26 CR at II-11, PR at II-6.
38
date of December 31, 2012, and applied to projects achieving commercial operation by that date.27 Whilethe PTC had expired and been renewed in the past, the market was less optimistic late in the POI about afurther renewal in the current economic and budget climate.28
The expected expiration of the PTC at the end of 2012 affected both demand and typicalpurchasing patterns. The anticipated expiration of the PTC caused a substantial increase in demand, withapparent consumption up *** percent in 2011 over 2010 and apparent consumption in interim 2012 ***percent higher than in interim 2011.29 The expected expiration of the PTC also heightened the market’salready strong focus on timeliness because late deliveries could imperil not only production schedules orpotential profit, but the viability of the projects themselves. As OEMs were concerned with meetinginstallation deadlines imposed by the PTC expiration, available capacity and the ability to meet tight,specific delivery deadlines became increasingly important relative to more traditional concerns, such asproducer proximity.
Also under way during the latter part of the POI was a shift towards taller towers.30 Not allproducers ***31 and shifting production to taller towers reduces producers’ effective capacity.32
We have noted the domestic industry’s general concentration in the central states. The domesticindustry is clustered in the “wind corridor” close to a significant portion of the United States’ mostpromising potential wind utility sites.33 However, this concentration also means that transportation forwind towers produced in this region to other portions of the United States may pose significant logisticalchallenges and high costs as well. Transport of towers to the West Coast may be impractical or evenlogistically impossible, and imports, subject and nonsubject, tend to fill demand on the East and WestCoasts and on islands.34
Over the period of investigation, the domestic industry’s production and shipments followedpaths similar to, but less extreme than, the trends exhibited by overall apparent U.S. consumption. Asfinancing became more difficult to obtain in 2010, domestic production and shipments dropped. Greaterfinancing availability and the expected eventual expiration of the PTC led to a significant recovery inboth production and shipments in 2011, and production and U.S. shipments were both higher in interim2012 than in interim 2011.35
Subject import volume followed a similar pattern over the POI. There was a significant downturnin subject import volume and market share in 2010 and sharper increases in 2011 and 2012. The increasesin volume and market share made by subject imports in 2011 came at the expense of nonsubject importsrather than the domestic industry.36 In fact, despite changes in subject import volume and market shareduring the three full years of the POI, the domestic industry was able to increase its market share between2009 and 2011. It was only in interim 2012 that the domestic industry lost a significant share of the U.S.market.37
27 CR at II-10-11, PR at II-6.
28 Siemens prehearing brief at 13-14.
29 CR/PR at Table C-1.
30 CR/PR at Table III-10
31 CR at III-19, PR at III-9.
32 Petitioners’ posthearing brief at Exh.1, pp. 77-78.
33 CR/PR at Figure III-1.
34 CR/PR at Table V-5 (***); Tr. at 55 (Cole); Broadwind site visit notes at 6.
35 CR/PR at Table C-1.
36 CR/PR at Table C-1.
37 CR/PR at Table C-1.
39
The domestic industry has argued that the record indicates that OEM purchasers have shifted their“baseload” demand to subject import sources.38 We believe the record indicates just the opposite. As wehave noted, the changes in domestic industry production and U.S. shipments tracked the sharp changes inapparent consumption over the POI, both in terms of declines and in increases, but did so in a moremoderate fashion.39 Although the financial meltdown began in late 2008, 2009 was generally a good yearfor the industry overall, as projects that secured financing before the meltdown were built out. Thedomestic industry produced 2,069 towers and shipped 2,057 to the domestic market that year. Though2010 was a difficult one for wind tower demand overall, reductions in domestic industry production andshipments were more modest than in the market overall, and the industry produced 1,751 towers andshipped 1,738 towers to the U.S. market. With greater financing available and the expiration and non-renewal of the PTC and other federal incentives looming, the domestic industry was able to increase itsproduction to *** towers in 2011 and its domestic shipments to the U.S. market to *** towers. In interim2012, as apparent consumption peaked in advance of the expected non-renewal of federal incentives, thedomestic industry produced *** towers and shipped *** to the U.S. market.40
In reviewing the domestic industry’s actual performance in production and shipments, we arestruck by the fact that the domestic industry was generally able to produce and ship a relatively steadyvolume of towers. Throughout a period that included significant shifts in apparent consumption, widevariances in the financing atmosphere, and uneven pressures caused by the availability of importantincentives, the domestic industry’s output and shipments remained fairly stable, particularly as comparedto the market overall. This meant that the domestic industry’s upturn was more muted than that of theoverall market, but so was its downturn. This steadiness suggests to us two conclusions. The domesticindustry provides the baseload capacity for wind tower consumption and imports absorb the variance.Moreover, the basic stability of their production levels suggests to us that the domestic industry’seffective capacity over the POI was approximately *** towers per year under the market conditionsprevailing.41
The domestic industry has reported production capacity well in excess of that *** tower figure, aswell as reporting capacity utilization rates of *** percent in 2011 and *** percent in interim 2012, when,by our conclusions, the industry was apparently operating close to its capacity.42 We still find that therecord suggests that the industry was operating close to its true, effective capacity at the end of the POI.
The expiration and likely non-renewal of the PTC and other incentives at the end of 2012prompted significant increases in apparent consumption late in the POI. This time period also brought asignificant increase in subject imports. But we do not find that the record indicates that these additionalvolumes of subject imports displaced domestic production and shipments.
We believe that the steadiness of the industry’s production and shipments trends reflects the factthat the industry has consistently supplied the baseload capacity and production for the U.S. wind towermarket. As we have noted, OEM purchasers have an apparent preference for sourcing towers fromproducers close to the project to minimize transportation costs and other logistical risks. Given thedomestic industry’s location in the central states, close to many large wind projects, this preference forlocal sourcing typically has caused OEM purchasers typically to source a significant portion of theirdemand from domestic producers.43 OEM producers continued to source a significant portion of demand
38 Petitioners’ posthearing brief at Exh. 1, pp.1-2.
39 CR/PR at Table C-1.
40 CR/PR at Table C-1.
41 CR/PR at Figure IV-2.
42 CR/PR at Table C-1.
43 During the POI, the percentage of domestic production capacity qualified to produce for *** increased from*** percent of total reported domestic capacity in 2009 to *** percent by the end of the POI. CS Wind final
(continued...)
40
from domestic producers in 2011 and interim 2012, explaining the relative steadiness in shipments by thedomestic industry. But a significant share of that additional, time-sensitive demand was satisfied bysubject imports.
The record suggests that OEM purchasers turned to subject imports because the domestic industrysupplied as many new towers as it could under the unique conditions that held late in the POI. Thedomestic industry’s actual shipments at that time were in line with or above its recent performance. Therecord contains considerable evidence that OEM purchasers encountered many difficulties obtainingneeded towers from the domestic industry for deliveries in 2012. OEM purchasers seeking deliveries for2012 were regularly told that ***. The allegations involve ***.44 Moreover, the allegations ***.45
Petitioners have admitted that, during the latter stages of the POI, they were often not able toprovide the requisite number of towers sought by OEM purchasers within the purchasers’ requested timeframes. They assert that they offered alternative production schedules, facilities, or other plans toaccommodate OEM requests.46 These admissions suggest that some supply difficulties existed in thedomestic industry during this time period and that OEMs had to look elsewhere to secure adequate supplyduring this unusual period of demand that was both high and very time-sensitive. Available capacity, orlack thereof, acted as a limit on substitutability during this time period. Capacity that was not qualified orwas not available at a time that would allow completion before the deadline was effectively notsubstitutable for capacity that was available and qualified.47 It also suggests that the industry did not havesignificant amounts of effectively available capacity in 2011 and 2012, as they reported in theirquestionnaires.
We have noted a general preference on the part of OEMs to source close to projects. During peakdemand late in the POI, OEM purchasers took delivery of a significant volume of subject imports forprojects in the central states, the region in which the domestic industry has the greatest natural advantagesand has typically dominated.48 Many of these projects used both domestic and subject imports, however,suggesting that OEMs were using every available source to fill demand.49 Moreover, subject importsfrequently came with higher total delivered costs, borne by the purchasers.50 The willingness on the partof the OEMs to pay higher total delivered costs for subject imports while still purchasing significant
43(...continued)comments at 4. The qualification process can be long and is not costless for OEM purchasers. CR at II-28-II-29nn.49-50, PR at II-17 nn.49-50. Investing in increased qualified domestic capacity over the POI suggests that OEMpurchasers wished to maximize their domestic purchasing opportunities even though subject imports were available.
44 CS Wind prehearing brief at 30-31, citing purchaser questionnaire responses; GE posthearing brief at 3-5.Purchasers also reported quality problems. CR at II-27, PR at II-17.
45 CS Wind prehearing brief at 30-31, citing purchaser questionnaire responses.
46 Petitioners’ posthearing brief at Exh. 1, pp. 26-27.
47 Petitioners have argued that OEM purchasers have been willing to allow production and qualification to runconcurrently. Petitioners’ posthearing brief at Exh. 1, pp.23-24. However, the record includes only ***. CR/PR atTable V-5 (***).
Petitioners have also noted offers by domestic producers to build new facilities to satisfy specific OEMlocation demands. Petitioners’ posthearing brief at Exh. 1, pp.21-22. However, we have already noted the unusualtime constraints affecting the market during the period of strongest demand late in the POI. Petitioners haveindicated that one facility was ***, but elsewhere admit that ***. Petitioners’ posthearing brief at Exh. 1, pp.22-23,***. Given the need to meet the PTC deadline, and OEM purchasers’ apparent wariness about taking delivery fromfacilities that had not been qualified, construction of new facilities was unlikely to be satisfactory to OEMpurchasers.
48 CR/PR at Tables V-2 and V-5.
49 See, e.g., CR/PR at Table V-1, particularly ***).
50 CR/PR at Tables V-1, V-2, V-5, and V-6. We discuss our pricing comparisons more fully in the followingsection.
41
quantities of domestic towers (sometimes for the same projects) suggests that OEM purchasers chosesubject imports because domestic producers were simply not able to supply purchasers with the requisitenumber of towers within the required timeframe.
We are mindful that ***.51 ***.52 ***.53 Indeed, ***.54 The total volume of purchases ofdomestically produced towers, combined with the apparent difficulties experienced by *** OEMpurchasers in getting domestic supply in 2012, suggest that the domestic industry was in fact operatingclose to its effective capacity under the conditions existing late in the POI.
As a final matter, we note that petitioners devoted considerable attention to Shepherds Flat, alarge project in Oregon, with turbines supplied by GE. All wind towers used at this project, installed in2011 and 2012, came from a single subject producer in China, although a domestic producer had a facilityin Washington and another producer offered to build a new facility nearby.55 The project was significant,both in terms of electrical output and in the number of towers.56 We do not agree, however, withpetitioners that the Shepherds Flat project represented a significant lost sales opportunity for the domesticindustry. We note that there was little effective operating domestic capacity within a reasonabledistance,57 and the logistics of transporting from the central region to Oregon were admittedly difficult.58
No domestic producer was qualified at that time to build towers to suit the turbine used, which had notbeen used in the United States prior to Shepherds Flat and has not been used since.59 The record does notindicate that the domestic industry could have supplied the project within the time and logisticalconstraints.
We acknowledge that the volume of subject imports, particularly in the last months of the POI,may appear significant, both absolutely and relative to the domestic industry’s production and capacity.Under the conditions of competition specific to the industry and this timeframe, however, the recordsuggests that the domestic industry was operating close to its effective capacity. During the latter half ofthe POI, subject imports filled demand that was itself inflated and accelerated by the likely expiration ofthe PTC and other federal incentives, but subject imports did not displace significant amounts of domesticproduction or sales. We thus do not find subject import volume to be significant.
B. Price Effects of Subject Imports
Section 771(C)(ii) of the Act provides that, in evaluating the price effects of subject imports, the Commission shall consider whether – (I) there has been significant price undersellingby the imported merchandise as compared with the price of domestic like products of theUnited States, and (II) the effect of imports of such merchandise otherwise depresses
51 CR at III-11-III-13, PR at III-7-III-8.
52 CS Wind prehearing brief at 30-31, citing purchaser questionnaire responses.
53 Purchaser questionnaire responses of ***; Siemens prehearing brief at 26-35.
54 Purchaser questionnaire response of ***.
55 Petitioners’ posthearing brief at Exh. 1, pp.22-23.
56 CR at V-65, PR at V-7.
57 CR/PR at III-1 and Figure III-1.
58 Tr. at 55 (Cole). The proximity of the producer’s location to the site was of recognized importance since onedomestic producer offered to build a plant near the site to reduce transportation concerns. CR at II-4 n.6, PR at II-2n.6.
59 GE posthearing brief at 1-2.
42
prices to a significant degree or prevents price increases, which otherwise would haveoccurred, to a significant degree.60
We do not find that significant price underselling has occurred, nor do we find that subjectimports significantly depressed domestic prices or suppressed price increases which would haveotherwise occurred. As we noted above, subject imports typically filled OEM purchasers’ variabledemand and often oversold the domestic like product.
At the outset, we must choose what pricing data to consider. At petitioners’ own request, theCommission sought project-level bid data from major OEM purchasers.61 Petitioners now argue forsomething more closely approaching the Commission’s usual underselling analysis, wherein theCommission evaluates average unit values gathered on a quarterly basis for specific products within thecategory.62 Petitioners have provided such comparisons, albeit on an annual basis rather than a quarterlyone, using F.O.B. prices.63 These comparisons shows significant underselling.64
We do not find the comparison suggested by petitioners to be the appropriate method forconsidering whether underselling occurred. The F.O.B. price is indeed the price agreed upon betweenproducers and purchasers, but in this industry OEM purchasers are responsible for transportation costs.65 And transportation costs are, as noted above, quite significant. Inland transportation costs fordomestically produced towers ranged from 3.0 percent to 42.9 percent of total delivered cost, with anaverage of *** percent.66 For towers imported from Asia, U.S. inland transportation costs rangedbetween 4.2 and 25.6 percent of total delivered cost, with an average of *** percent. Ocean freight rangedfrom 15.3 to 35.3 percent of total delivered cost.67 “Price/total cost” was cited as the most important factorin purchasing decisions by a majority of responding purchasers.68 “U.S. transportation costs” were citedas “very important factor” in purchasing decisions by all responding purchasers, while a majority cited“transportation costs to the U.S.” as a very important factor.69 In light of these costs, the difficultiesinherent in moving such large items, and OEM purchasers’ consistent responsibility for these costs,70 wedo not find a price comparison that ignores such costs to be a reliable indication of price competitionbetween subject and domestic wind towers. If the F.O.B. price alone were the relevant comparison andthe true basis for purchasers’ decisions, it is difficult to see how the domestic industry could have madeany sales during the POI, much less increase its sales.
Given these considerations, we have relied primarily on the bid data supplied by *** for ourpricing analysis.71 *** purchased towers from both domestic producers and subject producers for use in
60 19 U.S.C. § 1677(7)(C)(ii).
61 Petition at 38.
62 Petitioners’ posthearing brief at 11.
63 Petitioners’ posthearing brief at Exh. 1, pp. 35-41 and Exh. 5.
64 Petitioners’ posthearing brief at Exh. 5.
65 CR at V-2, PR at V-2. The exception is ***. Id. at n.5.
66 CR at V-2, PR at V-1-V-2.
67 CR at V-2, PR at V-2.
68 CR/PR at Table II-2.
69 CR/PR at Table II-3.
70 Petitioners have suggested that OEM purchasers can pass increases in transportation costs onto the OEMpurchasers’ customers. The record contains no evidence of OEMs passing through increased or unexpectedtransportation costs. CS Wind posthearing brief at 9, GE posthearing brief at 5.
71 We note that petitioners have argued that the bid data *** do not comply with the Commission’s request.Petitioners’ posthearing brief at Exh. 1, pp. 32-34. We find that the bid-type data supplied by *** do comply with
(continued...)
43
the same installations, and the bid data for those purchases provide a direct comparison of the total pricespaid OEMs for both domestic and imported towers. We find these comparisons to be particularlyprobative, as the towers are similar not only in physical dimensions but in time and location as well. ***.In ***.72 Total incremental costs incurred by *** over the POI related to purchasing subject importsrather than domestically produced towers ***. Total incremental costs for ***.73 ***.74 ***.75 In ourview, the most direct price comparisons available to the Commission show no evidence of significantunderselling by subject imports.
We turn then to a consideration of price depression. The record does not support a finding thatdomestic prices were depressed during the POI. Specifically, average unit values for domesticallyproduced towers rose significantly over the POI, rising by *** percent between 2009 and 2011. Averageunit values for domestic shipments in interim 2012 were *** percent higher than those in interim 2011.76
Net sales AUVs also rose over the POI.77 The domestic industry did experience an apparent cost-prize squeeze over the POI. However,
changes in the ratio industry’s cost of goods sold to sales (COGS/sales) did not correlate either with lowpricing by subject imports or with increasing volumes or market shares of subject imports. As notedabove, we do not find underselling by subject imports. The domestic industry’s COGS/sales ratioincreased between 2009 and 2010, which is when subject import volume and market share declined.Moreover, when the volumes and market share of subject imports increased in 2011, the industry’sCOGS/net sales ratio actually improved. Finally, the ratio in interim 2012 was lower than in interim 2011,although in interim 2012 subject imports gained their largest amount of market share during the period.78
In our view, all of this indicates that there was not a correlation between subject import volumes and anycost-price squeeze experienced by the domestic industry.
We believe that the lack of apparent price effects reflects a critical condition of competition in themarket. In our view, the market for wind towers is not structured in such a way that subject import priceshave the ability directly to influence prices for domestically produced wind towers. *** together accountfor *** of apparent domestic consumption of wind towers.79 Each, however, approaches toweracquisition in a different manner. ***.80 ***.81 ***82 ***.83 The record suggests that *** acquired
71(...continued)our request.
72 The ***. CR/PR at Table V-2.
73 CR/PR at Table V-2.
74 CR/PR at Table V-6. ***. Id.
75 CR/PR at Table V-6.We note that a comparison of f.o.b. prices for domestically produced towers and c.i.f.costs for subject imports (removing U.S. transportation costs for both) still shows significant rates of overselling bysubject imports across the entire period. CR/PR at Tables V-3 and V-7.
76 CR/PR at Table C-1. AUVs may have increased over the POI in part because of the shift to larger towers, butdomestic producers still shipped a large number of smaller towers. CR/PR at Table III-10.
77 CR/PR at Table C-1. While we do not rely on the F.O.B. price comparisons compiled by petitioners, we donote that this pricing data ***. Petitioners’ posthearing brief at Exh. 5.
78 CR/PR at Table C-1. We note that the COGs/sales ratio for interim 2011 was significantly higher than the ratiofor the full year 2011, suggesting that there might be some seasonality at work.
79 CR at I-4 n.4, PR at I-3 n.4.
80 CR at V-5, PR at V-3.
81 CR at V-41, PR at V-5. Petitioners have argued that *** does engage in competitive bidding and that it usesinformation gained through this process to place price pressure on domestic producers. Petitioners’ posthearing briefat Exh. 1, pp. 31-32 and Exhs. 2 and 8. The e-mails soliciting bids ***. Petitioners’ posthearing brief at Exh. 8 andCR/PR at Table V-5. Petitioners have also offered another e-mail *** to show evidence of price pressure. ***. ***.
(continued...)
44
towers using the methods described, although most OEM purchasers appeared to be scrambling to obtainsufficient towers in 2012, but that none of the OEM purchasers used subject pricing as a way of gainingprice concessions from domestic producers.
Given the structure of the market and OEM purchasing practices, we do not find evidence thatprices for subject imports suppressed prices for the domestic like product, and we also find that subjectimports did not undersell the domestic like product to a significant degree, nor did subject import pricesdepress the prices for the domestic like product.
C. Impact of Subject Imports84
Section 771(7)(C)(iii) of the Act provides that the Commission, in examining the impact of thesubject imports on the domestic industry, “shall evaluate all relevant economic factors which have abearing on the state of the industry.”85 These factors include output, sales, inventories, capacityutilization, market share, employment, wages, productivity, profits, cash flow, return on investment,ability to raise capital, research and development, and factors affecting domestic prices. No single factoris dispositive and all relevant factors are considered “within the context of the business cycle andconditions of competition that are distinctive to the affected industry.”86
The condition of the domestic industry improved in most significant respects over the course ofthe POI.87 For example, the industry’s capacity increased between 2009 and 2011. Its production levelswere higher in 2011 than in 2009 and were higher in interim 2012 than in interim 2011. The industry’sdomestic shipment quantity increased between 2009 and 2011 and was higher in interim 2012 thaninterim 2011. The value of the industry’s shipments increased by *** percent between 2009 and 2011,and the value of the industry’s shipments was *** percent higher in interim 2012 than in interim 2011.The number of production and related workers was up *** percent between 2009 and 2011, and industry
81(...continued)Petitioners’ posthearing brief at Exh. 2. We do not find that either of these exhibits support a finding of pricesuppression by way of subject imports.
82 CR at III-11, PR at III-8.
83 CR at III-24, PR at III-11, CR/PR at Table III-5.
84 The statute instructs the Commission to consider the “magnitude of the dumping margin” in an antidumpingproceeding as part of its consideration of the impact of imports. 19 U.S.C. § 1677(7)(C)(iii)(V). In its finaldetermination of sales at less than fair value for China, Commerce found weighted-average dumping margins of44.99 percent to 47.59 percent for six specific producer and exporter combinations, and 70.63 percent for all others. CR at I-2, PR at I-2; 77 Fed. Reg. 75996 (Dec. 26, 2012). With respect to subject imports from Vietnam, Commercefound a weighted average margin of dumping of 51.50 percent for the CS Wind Group producer/exporter group and58.49 percent for all others. CR/PR at Table I-3; 77 Fed. Reg. 75988 (Dec. 26, 2012).
85 19 U.S.C. § 1677(7)(C)(iii); see also SAA at 851 and 885 (“In material injury determinations, the Commissionconsiders, in addition to imports, other factors that may be contributing to overall injury. While these factors, insome cases, may account for the injury to the domestic industry, they also may demonstrate that an industry is facingdifficulties from a variety of sources and is vulnerable to dumped or subsidized imports.”)
86 19 U.S.C. § 1677(7)(C)(iii); see also SAA at 851, 885; Live Cattle from Canada and Mexico, Invs. Nos. 701-TA-386, 731-TA-812-813 (Prelim.), USITC Pub. 3155 at 25 n.148 (Feb. 1999).
87 Petitioners argued both for excluding *** from the domestic industry and also for excluding ***. Petitioners’prehearing brief at 14-15. We do not exclude *** from the domestic industry as a related party, and we rely ondomestic industry data which includes data from ***. CR/PR at Table C-1. We note that ***. CR/PR at Table VI-2.***. CR/PR at VI-1 n.1. We have declined to exclude *** from the domestic industry or to focus exclusively on thecommercial market for wind towers, or to take an adverse inference against ***. ***. We therefore rely on and citeto Table C-1 of the staff report and other tables reflecting data for ***.
45
employment was *** percent higher in interim 2012 than in interim 2011.88 Average unit values of U.S.shipments increased significantly over the POI.89
Other industry indicators turned downward over the POI. Capacity utilization was lower in 2011than in 2009, though utilization in interim 2012 was higher than in interim 2011. Productivity declined by*** percent between 2009 and 2011, and it was *** percent lower in interim 2012 than in interim 2011.90
The cost of goods sold rose significantly over the POI and expenses for SG&A rose even moresignificantly, up *** percent between 2009 and 2011 alone. The domestic industry had a healthy profitmargin in 2009, had a small operating loss in 2010, and a very modest positive operating margin in 2011.The industry showed an operating loss in interim 2012, however, and its operating margin in interim 2012was worse than in interim 2011.91
These downturns do not, however, correlate with changes in subject import volumes or pricingthat indicate that material injury was caused by reason of subject imports. For example, the industry’scapacity utilization fell in 2010 when subject import volumes and market share were declining and thenimproved in 2011 when subject import volumes and market share were increasing. The industry’scapacity utilization rate was higher in interim 2012 than in interim 2011 even though subject importvolume and market share increased considerably. The industry’s capacity utilization rates did not declineas subject import volumes rose. The domestic industry’s COGS/sales ratio rose in 2010 when subjectimports’ presence in the U.S. market was declining, and the ratio improved in 2011 when subject importvolume rose. Moreover, the COGS/sales ratio in interim 2012 was down from interim 2011, even thoughsubject import volume in interim 2012 was well above interim 2011 levels.92 The changes in theindustry’s operating income levels showed a similar lack of correlation with changes in subject importvolumes.
The lack of correlation between trends for these indicators and for subject import volume andpricing is not surprising, given our earlier findings. The record suggests that the domestic industry met thebaseload demand for OEM purchasers’ wind tower needs during the POI, and the industry’s productionand sales followed general market trends. Subject imports served specific geographic markets that thebulk of the domestic industry could not meet without significant logistical difficulties and also served theexcess demand generated by the expected non-renewal of the PTC and other federal incentives at the endof 2012. The record also does not suggest a strong relationship between prices for subject imports and thedomestic like product or significant underselling by subject imports. Consequently, we find that subjectimports did not have a significant adverse impact on the domestic industry.
For all the foregoing reasons, we conclude that an industry in the United States is not materiallyinjured by reason of imports of utility scale wind towers from China found to have been subsidized by theGovernment of China and sold in the United States at LTFV and imports of utility scale wind towers fromVietnam found to have been sold in the United States at LTFV.
II. NO THREAT OF MATERIAL INJURY BY REASON OF SUBJECT IMPORTS
Section 771(7)(F) of the Tariff Act directs the Commission to determine whether the U.S.industry is threatened with material injury by reason of the subject imports by analyzing whether “furtherdumped or subsidized imports are imminent and whether material injury by reason of imports would
88 CR/PR at Table C-1.
89 CR/PR at Table C-1.
90 We find the decline in productivity, while not well correlated with subject import trends, particularly probative,given the widespread reports of limited available domestic capacity during the latter part of the POI.
91 CR/PR at Table C-1.
92 CR/PR at Table C-1.
46
occur unless an order is issued or a suspension agreement is accepted.”93 The Commission may not makesuch a determination “on the basis of mere conjecture or supposition,” and considers the threat factors “asa whole” in making its determination whether dumped or subsidized imports are imminent and whethermaterial injury by reason of subject imports would occur unless an order is issued.94 In making ourdetermination, we consider all statutory threat factors that are relevant to these investigations.
Under section 771(7)(H) of the Tariff Act, the Commission may “to the extent practicable”cumulatively assess the volume and price effects of subject imports from all countries as to whichpetitions were filed on the same day if the requirements for cumulation in the material injury context aresatisfied.95 As detailed above, the requirements for cumulation in the material injury context are satisfied.No party has argued against cumulation for our threat analysis or suggested that the conditions ofcompetition likely to confront subject imports from China and subject imports from Vietnam will likelydifferent to a significant degree in the imminent future. We therefore exercise our discretion to considersubject imports from China and Vietnam on a cumulated basis for purposes of our threat analysis.
We note that the industry in China in particular is large, with a total capacity that exceeds totalU.S. demand.96 Moreover, the industries in both China and Vietnam rely on exports to a significantdegree.97 Furthermore, producers in both China and Vietnam have framework supply agreements withOEM purchasers or parent firms that operate in the United States.98 Finally, the volume of subject importsincreased significantly very late in the POI.99 100
However, we find no evidence on the record suggesting that the existing patterns of trade willcontinue.101 The domestic industry is likely to continue to supply the baseload demand for the domesticindustry, while subject imports will absorb most of the variance in demand as well as supplying marketsnot easily reached by the domestic industry for logistical reasons. Given the very late extension of thePTC and other federal incentives and the time lag inherent in planning and erecting a large windinstallation, demand for wind towers in the imminent future is likely to be somewhat depressed from high2012 levels. This suggests that, as in 2010, subject import volume will decline more relative to totaldemand than domestic shipments. The record does not indicate that the conditions that limited the priceeffects of subject imports on domestic like product prices are likely to change.
Inventories on hand in the U.S. are modest,102 and there were no orders reported for subjectimports for delivery after the third quarter of 2012.103 While there is significant capacity in China, muchof it is not yet qualified to produce for the U.S. market or is otherwise inconveniently located to serve the
93 19 U.S.C. § 1677(7)(F)(ii).
94 19 U.S.C. § 1677(7)(F)(ii).
95 19 U.S.C. § 1677(7)(H).
96 CR/PR at Table VII-1.
97 CR/PR at Tables VII-2 and VII-4.
98 CR at VII-8 n.13 and VII-13 n.24, PR at VII-7 n.13 and VII-9 n.24.
99 CR/PR at Table IV-2.
100 We note that the Department of Commerce has found countervailable subsidies provided by the Governmentof China to wind tower producers in that country. CR/PR at Table I-1. We have taken these subsidies intoconsideration in making our determination and do not find that the presence of these subsidies alters ourdetermination.
101 We note that the recent extension of the PTC requires only that construction start as of December 31, 2013,which is a significant change from the prior PTC that required commercial operation by the expiration date. CR at II-10 n.19, PR at II-6 n.19; CS Wind final comments at 1 n.1. The ITC was also renewed. CR at II-11, PR at II-6.
102 CR/PR at Table VII-8
103 CR/PR at Table VII-9.
47
U.S. market.104 Producers have framework supply agreements with OEM purchasers or their parentcompanies, but the framework agreements do not require specific purchase levels or shipments to theUnited States.105 Some of these framework agreements were in place during the POI but did not changethe basic relationship of subject imports to the U.S. market. The industries in both China and Vietnamdepend to varying degrees on exports, and global demand may not be expanding greatly in the imminentfuture, but no barriers to imports from either country exist in any market.106 Framework agreements withmultinational OEM purchasers may give those producers greater access to other export markets.
We conclude that the domestic industry is not threatened with material injury by reason of subjectimports.
CONCLUSION
For the foregoing reasons, we conclude that there is no reasonable indication that the domesticindustry producing utility scale wind towers is materially injured or threatened with material injury byreason of imports of towers from China that are subsidized by the Government of China and sold at lessthan fair value or towers from Vietnam that are sold in the United States at less than fair value.
104 CR at VII-3-VII-4 and Table VII-1; PR at VII-3 and Table VII-1.
105 CR at VII-8 n.13 and VII-13 n.24; PR at VII-7 n.13 and VII-9 n.24.
106 CR at VII-18, PR at VII-10.
48
I-1
PART I: INTRODUCTION
BACKGROUND
These investigations result from a petition filed with the U.S. Department of Commerce (“Commerce”) and the U.S. International Trade Commission (“USITC” or “Commission”) by Broadwind Towers, Inc., Manitowoc, WI; DMI Industries, Fargo, ND; Katana Summit LLC, Columbus, NE; and Trinity Structural Towers, Inc., Dallas, TX, on December 29, 2011, alleging that an industry in the United States is materially injured and threatened with material injury by reason of subsidized and less-than-fair-value (“LTFV”) imports of utility scale wind towers (“wind towers”) 1 from China and LTFV imports of wind towers from Vietnam. Information relating to the background of the investigations is provided below.2
Effective date Action December 29, 2011 Petition filed with Commerce and the Commission; institution
of the Commission's investigation (77 FR 805, January 6, 2012)
January 24, 2012 Commerce’s notices of initiation (78 FR 3440 and 3447) February 13, 2012 Commission’s preliminary determination (77 FR 9700,
February 17, 2012) June 6, 2012 Commerce’s preliminary countervailing duty determination
(77 FR 33422) August 2, 2012 Commerce’s preliminary LTFV determinations, China (77 FR
46034) and Vietnam (77 FR 46058) August 2, 2012 Scheduling of final phase of Commission investigations (77
FR 50715, August 22, 2012) December 13, 2012 Commission’s hearing1 December 24, 2012 Commerce’s final determinations (77 FR 75978, 75984, and
75992, December 26, 2012) January 18, 2013 Commission’s vote February 8, 2013 Commission’s determinations transmitted to Commerce
1 A list of witnesses appearing at the hearing is presented in app. B.
STATUTORY CRITERIA AND ORGANIZATION OF THE REPORT
Statutory Criteria
Section 771(7)(B) of the Tariff Act of 1930 (the “Act”) (19 U.S.C. § 1677(7)(B)) provides that in making its determinations of injury to an industry in the United States, the Commission--
1 See the section entitled “The Subject Merchandise” in Part I of this report for a complete description of the merchandise subject to these investigations.
2 Pertinent Federal Register notices are referenced in app. A and may be found at the Commission’s website (www.usitc.gov).
I-2
shall consider (I) the volume of imports of the subject merchandise, (II) the effect of imports of that merchandise on prices in the United States for domestic like products, and (III) the impact of imports of such merchandise on domestic producers of domestic like products, but only in the context of production operations within the United States; and. . . may consider such other economic factors as are relevant to the determination regarding whether there is material injury by reason of imports.
Section 771(7)(C) of the Act (19 U.S.C. § 1677(7)(C)) further provides that--
In evaluating the volume of imports of merchandise, the Commission shall consider whether the volume of imports of the merchandise, or any increase in that volume, either in absolute terms or relative to production or consumption in the United States is significant. . . . In evaluating the effect of imports of such merchandise on prices, the Commission shall consider whether. . .(I) there has been significant price underselling by the imported merchandise as compared with the price of domestic like products of the United States, and (II) the effect of imports of such merchandise otherwise depresses prices to a significant degree or prevents price increases, which otherwise would have occurred, to a significant degree. . . . In examining the impact required to be considered under subparagraph (B)(i)(III), the Commission shall evaluate (within the context of the business cycle and conditions of competition that are distinctive to the affected industry) all relevant economic factors which have a bearing on the state of the industry in the United States, including, but not limited to . . . (I) actual and potential decline in output, sales, market share, profits, productivity, return on investments, and utilization of capacity, (II) factors affecting domestic prices, (III) actual and potential negative effects on cash flow, inventories, employment, wages, growth, ability to raise capital, and investment, (IV) actual and potential negative effects on the existing development and production efforts of the domestic industry, including efforts to develop a derivative or more advanced version of the domestic like product, and (V) in {an antidumping investigation}, the magnitude of the margin of dumping.
Organization of Report
Part I of this report presents information on the subject merchandise, subsidy/dumping margins, and domestic like product. Part II of this report presents information on conditions of competition and other relevant economic factors. Part III presents information on the condition of the U.S. industry, including data on capacity, production, shipments, inventories, and employment. Parts IV and V present the volume of subject imports and pricing of domestic and imported products, respectively. Part VI presents information on the financial experience of U.S. producers. Part VII presents the statutory requirements and information obtained for use in the Commission’s consideration of the question of threat of material injury as well as information regarding nonsubject countries.
I-3
MARKET SUMMARY
Wind towers are vertical support components of utility scale wind turbines used in electrical power generation projects. As of June 2012, 13 firms are reported to have steel wind tower manufacturing capabilities in the United States. The leading U.S. producers of wind towers are DMI Industries (“DMI”), Trinity Structural Towers (“Trinity”), and Vestas Towers America (“Vestas Towers”), while leading producers of wind towers outside the United States include Chengxi Shipyard Co. (“Chengxi”), CS Wind Tech Co. (“CS Wind (China)”), and Harbin Hongguang Boiler General Factory Co. (“Harbin Hongguang”) of China, as well as CS Wind Vietnam Co. (“CS Wind (Vietnam)”) of Vietnam. The leading U.S. importers of wind towers from China are ***, while the leading importers of wind towers from Vietnam are ***. Leading importers of wind towers from nonsubject countries (primarily Canada, Indonesia, Korea, and Mexico) include ***. U.S. purchasers of wind towers are typically wind turbine original equipment manufacturers (“OEMs”). OEMs generally design the wind turbines, sell them under their own name, and, at a minimum, produce the nacelles in-house. OEMs may produce the towers in-house or source them from outside suppliers.3 The leading OEMs in the U.S. market in 2011 include GE, Vestas Wind, Siemens, Suzlon, Mitsubishi Power, Nordex, and Clipper.4
Apparent U.S. consumption of wind towers totaled *** wind towers ($***) in 2011. U.S. producers’ U.S. shipments of wind towers totaled *** wind towers ($***) in 2011, and accounted for *** percent of apparent U.S. consumption by quantity and *** percent by value. U.S. imports from subject sources totaled 861 wind towers ($265.9 million) in 2011 and accounted for *** percent of apparent U.S. consumption by quantity and *** percent by value. U.S. imports from nonsubject sources totaled 475 wind towers ($155.9 million) in 2011 and accounted for *** percent of apparent U.S. consumption by quantity and *** percent by value.
SUMMARY DATA AND DATA SOUCES
A summary of data collected in these investigations is presented in appendix C. Except as noted, U.S. industry data are based on questionnaire responses of six firms that accounted for the substantial majority of U.S. production of wind towers during 2011. U.S. imports are based on importer questionnaire responses that accounted for virtually all imports from China and Vietnam and a large majority of U.S. imports from nonsubject sources. Data regarding the industries in China and Vietnam are based on foreign producer questionnaire responses and published sources.
PREVIOUS AND RELATED INVESTIGATIONS
Wind towers have not been the subject of any prior countervailing or antidumping duty investigations in the United States. Wind towers have been the subject of Commission staff research.5
3 Petition, exh. I-4, p. 3. 4 GE represented 29.5 percent of U.S. wind turbine installations in 2011, Vestas Wind 28.9 percent, Siemens
18.1 percent, Suzlon 4.9 percent, Mitsubishi Power 4.7 percent, Nordex 4.2 percent, Clipper 3.8 percent, REpower 2.5 percent, and Gamesa 2.2 percent. American Wind Energy Association (“AWEA”), U.S. Wind Industry Fourth Quarter 2011 Market Report, January 2012, http://www.awea.org/learnabout/publications/reports/AWEA-US-Wind-Industry-Market-Reports.cfm.
5 The following publications are on the Commission’s website: Andrew David, “Shifts in U.S. Wind Turbine Equipment Trade in 2010,” USITC Executive Briefings on Trade, May 2011; Andrew David, “Impact of Wind Energy Installations on Domestic Manufacturing and Trade,” No. ID-02, July 2010; Andrew David, Wind Turbines: Industry and Trade Summary, Office of Industries Publication ITS-02, June 2009; Andrew David, “Growth in Wind
(…continued)
I-4
On June 9, 2010, the United Steelworkers filed a petition under Section 301 of the Trade Act of 1974 alleging that the Chinese government employed a wide range of World Trade Organization (“WTO”)-inconsistent practices that unfairly benefited Chinese producers in the renewable energy sector, including producers of wind energy products.6 In response to the petition, the United States Trade Representative (“USTR”) initiated an investigation on October 15, 2010. On December 22, 2010, the United States requested WTO Dispute Settlement Consultations concerning a program known as the Special Fund for Wind Power Manufacturing.7 Following WTO consultation on February 16, 2011, USTR announced on June 7, 2011, that China had ended certain wind power equipment subsidies.8 On June 17, 2012, China filed a complaint with the WTO on countervailing and antidumping measures applied to a wide range of products, including wind towers, exported by China to the United States.9 10
NATURE AND EXTENT OF SUBSIDIES AND SALES AT LTFV
Subsidies
On December 26, 2012, Commerce published a notice in the Federal Register of its final determination of countervailable subsidies for producers and exporters of wind towers from China.11 12 Table I-1 presents Commerce’s findings of subsidization of wind towers in China.
(…continued) Turbine Manufacturing and Trade,” USITC Executive Briefings on Trade, March 2009. David, Andrew and Dennis Fravel, “U.S. Wind Turbine Export Opportunities in Canada and Latin America,” No. ID‐032, July 2012.
6 USW Files Trade Case to Preserve Clean, Green Manufacturing Jobs in America, “ USW press release, June 9, 2010, found at http://www.usw.org/media_center/releases_advisories?id=0327, and “United States Launches Section 301 Investigation into China’s Policies Affecting Trade and Investment in Green Technologies,” USTR, October 15, 2010, found at http://www.ustr.gov/about-us/press-office/press-releases/2010/october/united-states-launches-section-301-investigation-c, retrieved on January 9, 2012.
7 USTR determined that “under this program, China appears to provide subsidies that are prohibited under WTO rules because the grants awarded under the program seem to be contingent on Chinese wind power equipment manufacturers using parts and components made in China rather than foreign-made parts and components.” “United States Requests WTO Dispute Settlement Consultations on China’s Subsidies for Wind Power Equipment Manufacturers,” USTR, December 22, 2010, found at http://www.ustr.gov/about-us/press-office/press-releases/2010/december/united-states-requests-wto-dispute-settlement-con, and WTO, dispute settlement, “China — Measures concerning wind power equipment,” found at http://www.wto.org/english/tratop_e/dispu_e/cases_e/ds419_e.htm, retrieved on January 9, 2012.
8 “China Ends Wind Power Equipment Subsidies Challenged by the United States in WTO Dispute,” USTR, June 7, 2011, found at http://www.ustr.gov/about-us/press-office/press-releases/2011/june/china-ends-wind-power-equipment-subsidies-challenged, retrieved on January 9, 2012.
9 China files dispute against US countervailing and anti-dumping measures, WTO, June 17, 2012, found at http://www.wto.org/english/news_e/news12_e/ds449rfc_17sep12_e.htm.
10 The measures at issue in the request include Public Law 112-99 “An act to apply the countervailing duty provisions of the Tariff Act of 1930 to nonmarket economy countries, and for other purposes” signed by President Obama on March 13, 2012. This law provides for the application of countervailing duty provisions of the Tariff Act to imports from countries that the United States designates as non-market economies (such as China), and applies to, among others, all countervailing duty proceedings initiated on or after November 20, 2006.
11 Utility Scale Wind Towers From the People’s Republic of China: Final Affirmative Countervailing Duty Determination, 77 FR 33422, December 26, 2012.
12 Commerce determined the following programs to be counteravailable: (1) Policy Lending to the Renewable Energy Industry (2) Two Free, Three Half Program for FIEs (3) Income Tax Benefits for FIEs Based on Geographic Location (4) Enterprise Income Tax Law, Research and Development Program
(…continued)
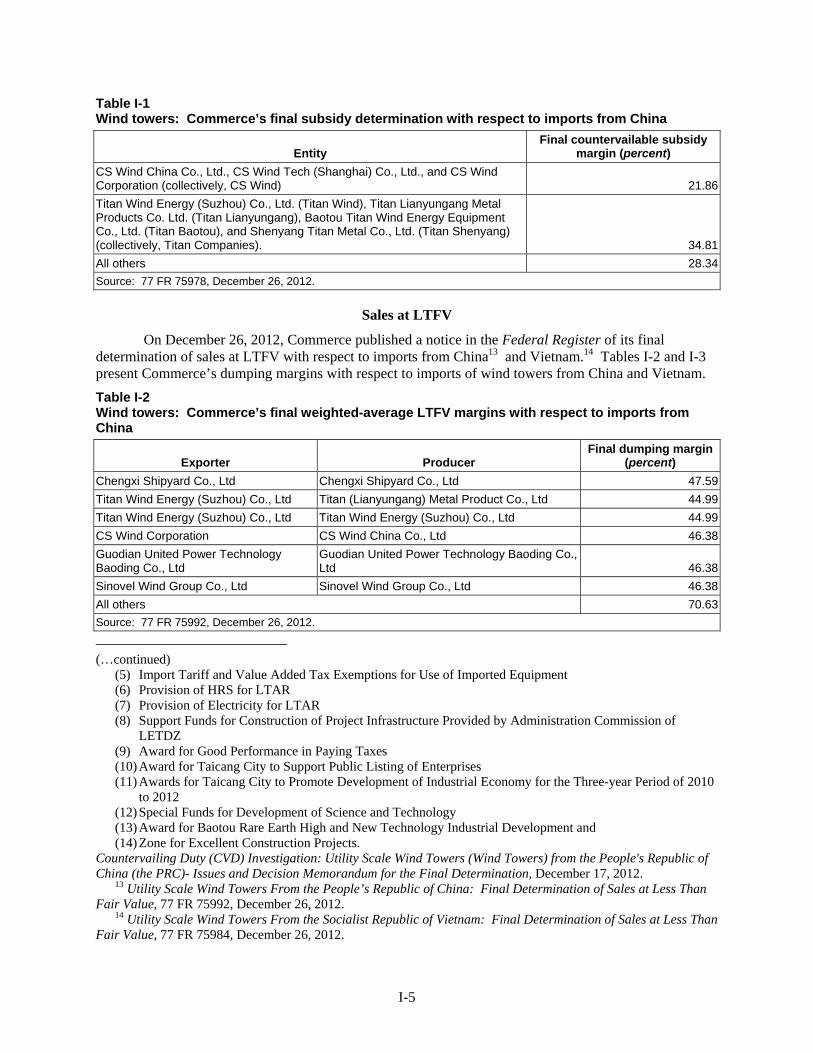
I-5
Table I-1 Wind towers: Commerce’s final subsidy determination with respect to imports from China
Entity Final countervailable subsidy
margin (percent) CS Wind China Co., Ltd., CS Wind Tech (Shanghai) Co., Ltd., and CS Wind Corporation (collectively, CS Wind) 21.86Titan Wind Energy (Suzhou) Co., Ltd. (Titan Wind), Titan Lianyungang Metal Products Co. Ltd. (Titan Lianyungang), Baotou Titan Wind Energy Equipment Co., Ltd. (Titan Baotou), and Shenyang Titan Metal Co., Ltd. (Titan Shenyang) (collectively, Titan Companies). 34.81All others 28.34Source: 77 FR 75978, December 26, 2012.
Sales at LTFV
On December 26, 2012, Commerce published a notice in the Federal Register of its final determination of sales at LTFV with respect to imports from China13 and Vietnam.14 Tables I-2 and I-3 present Commerce’s dumping margins with respect to imports of wind towers from China and Vietnam.
Table I-2 Wind towers: Commerce’s final weighted-average LTFV margins with respect to imports from China
Exporter Producer Final dumping margin
(percent) Chengxi Shipyard Co., Ltd Chengxi Shipyard Co., Ltd 47.59Titan Wind Energy (Suzhou) Co., Ltd Titan (Lianyungang) Metal Product Co., Ltd 44.99Titan Wind Energy (Suzhou) Co., Ltd Titan Wind Energy (Suzhou) Co., Ltd 44.99CS Wind Corporation CS Wind China Co., Ltd 46.38Guodian United Power Technology Baoding Co., Ltd
Guodian United Power Technology Baoding Co., Ltd 46.38
Sinovel Wind Group Co., Ltd Sinovel Wind Group Co., Ltd 46.38All others 70.63Source: 77 FR 75992, December 26, 2012.
(…continued)
(5) Import Tariff and Value Added Tax Exemptions for Use of Imported Equipment (6) Provision of HRS for LTAR (7) Provision of Electricity for LTAR (8) Support Funds for Construction of Project Infrastructure Provided by Administration Commission of
LETDZ (9) Award for Good Performance in Paying Taxes (10) Award for Taicang City to Support Public Listing of Enterprises (11) Awards for Taicang City to Promote Development of Industrial Economy for the Three-year Period of 2010
to 2012 (12) Special Funds for Development of Science and Technology (13) Award for Baotou Rare Earth High and New Technology Industrial Development and (14) Zone for Excellent Construction Projects.
Countervailing Duty (CVD) Investigation: Utility Scale Wind Towers (Wind Towers) from the People's Republic of China (the PRC)- Issues and Decision Memorandum for the Final Determination, December 17, 2012.
13 Utility Scale Wind Towers From the People’s Republic of China: Final Determination of Sales at Less Than Fair Value, 77 FR 75992, December 26, 2012.
14 Utility Scale Wind Towers From the Socialist Republic of Vietnam: Final Determination of Sales at Less Than Fair Value, 77 FR 75984, December 26, 2012.
I-6
Table I-3 Wind towers: Commerce’s final weighted-average LTFV margins with respect to imports from Vietnam
Exporter Producer Final dumping
margin (percent) The CS Wind Group (CS Wind Vietnam Co., Ltd. and CS Wind Corporation The CS Wind Group 51.50
All others 58.49Source: 77 FR 75984, December 26, 2012.
THE SUBJECT MERCHANDISE
Commerce’s Scope
Commerce has defined the scope in this proceeding as follows:15
{C}ertain wind towers, whether or not tapered, and sections thereof. Certain wind towers are designed to support the nacelle and rotor blades in a wind turbine with a minimum rated electrical power generation capacity in excess of 100 kilowatts (‘‘kW’’) and with a minimum height of 50 meters measured from the base of the tower to the bottom of the nacelle (i.e., where the top of the tower and nacelle are joined) when fully assembled. A wind tower section consists of, at a minimum, multiple steel plates rolled into cylindrical or conical shapes and welded together (or otherwise attached) to form a steel shell, regardless of coating, end-finish, painting, treatment, or method of manufacture, and with or without flanges, doors, or internal or external components (e.g., flooring/ decking, ladders, lifts, electrical buss boxes, electrical cabling, conduit, cable harness for nacelle generator, interior lighting, tool and storage lockers) attached to the wind tower section. Several wind tower sections are normally required to form a completed wind tower. Wind towers and sections thereof are included within the scope whether or not they are joined with nonsubject merchandise, such as nacelles or rotor blades, and whether or not they have internal or external components attached to the subject merchandise. Specifically excluded from the scope are nacelles and rotor blades, regardless of whether they are attached to the wind tower. Also excluded are any internal or external components which are not attached to the wind towers or sections thereof.
15 Utility Scale Wind Towers From the People’s Republic of China: Final Affirmative Countervailing Duty Determination, 77 FR 75978, December 26, 2012.
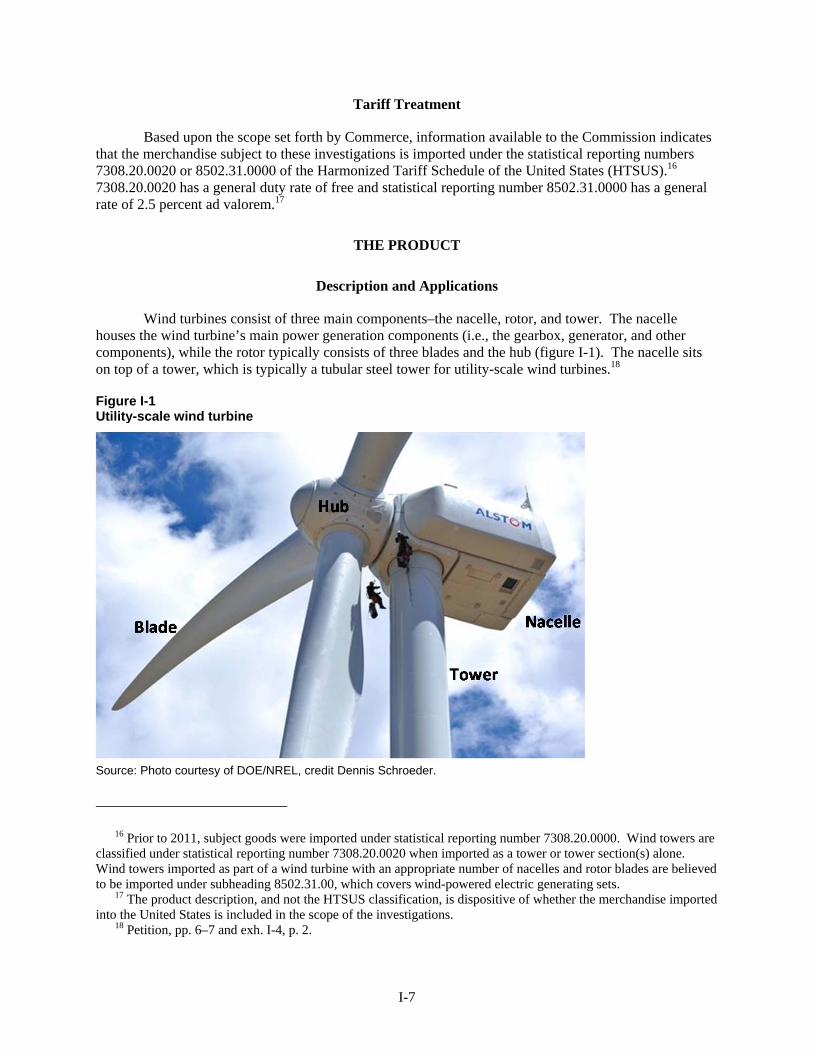
I-7
Tariff Treatment
Based upon the scope set forth by Commerce, information available to the Commission indicates that the merchandise subject to these investigations is imported under the statistical reporting numbers 7308.20.0020 or 8502.31.0000 of the Harmonized Tariff Schedule of the United States (HTSUS).16 7308.20.0020 has a general duty rate of free and statistical reporting number 8502.31.0000 has a general rate of 2.5 percent ad valorem.17
THE PRODUCT
Description and Applications
Wind turbines consist of three main components–the nacelle, rotor, and tower. The nacelle houses the wind turbine’s main power generation components (i.e., the gearbox, generator, and other components), while the rotor typically consists of three blades and the hub (figure I-1). The nacelle sits on top of a tower, which is typically a tubular steel tower for utility-scale wind turbines.18
Figure I-1 Utility-scale wind turbine
Source: Photo courtesy of DOE/NREL, credit Dennis Schroeder.
16 Prior to 2011, subject goods were imported under statistical reporting number 7308.20.0000. Wind towers are classified under statistical reporting number 7308.20.0020 when imported as a tower or tower section(s) alone. Wind towers imported as part of a wind turbine with an appropriate number of nacelles and rotor blades are believed to be imported under subheading 8502.31.00, which covers wind-powered electric generating sets.
17 The product description, and not the HTSUS classification, is dispositive of whether the merchandise imported into the United States is included in the scope of the investigations.
18 Petition, pp. 6–7 and exh. I-4, p. 2.
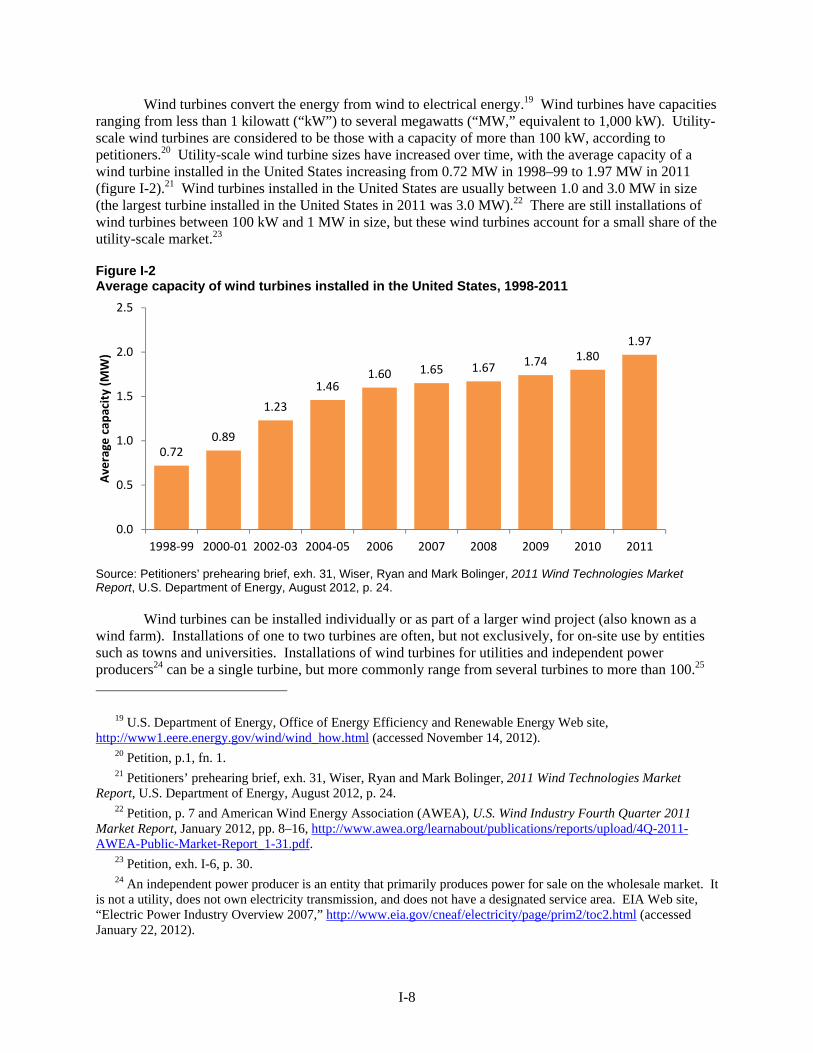
I-8
Wind turbines convert the energy from wind to electrical energy.19 Wind turbines have capacities ranging from less than 1 kilowatt (“kW”) to several megawatts (“MW,” equivalent to 1,000 kW). Utility-scale wind turbines are considered to be those with a capacity of more than 100 kW, according to petitioners.20 Utility-scale wind turbine sizes have increased over time, with the average capacity of a wind turbine installed in the United States increasing from 0.72 MW in 1998–99 to 1.97 MW in 2011 (figure I-2).21 Wind turbines installed in the United States are usually between 1.0 and 3.0 MW in size (the largest turbine installed in the United States in 2011 was 3.0 MW).22 There are still installations of wind turbines between 100 kW and 1 MW in size, but these wind turbines account for a small share of the utility-scale market.23
Figure I-2 Average capacity of wind turbines installed in the United States, 1998-2011
Source: Petitioners’ prehearing brief, exh. 31, Wiser, Ryan and Mark Bolinger, 2011 Wind Technologies Market Report, U.S. Department of Energy, August 2012, p. 24.
Wind turbines can be installed individually or as part of a larger wind project (also known as a wind farm). Installations of one to two turbines are often, but not exclusively, for on-site use by entities such as towns and universities. Installations of wind turbines for utilities and independent power producers24 can be a single turbine, but more commonly range from several turbines to more than 100.25
19 U.S. Department of Energy, Office of Energy Efficiency and Renewable Energy Web site, http://www1.eere.energy.gov/wind/wind_how.html (accessed November 14, 2012).
20 Petition, p.1, fn. 1. 21 Petitioners’ prehearing brief, exh. 31, Wiser, Ryan and Mark Bolinger, 2011 Wind Technologies Market
Report, U.S. Department of Energy, August 2012, p. 24. 22 Petition, p. 7 and American Wind Energy Association (AWEA), U.S. Wind Industry Fourth Quarter 2011
Market Report, January 2012, pp. 8–16, http://www.awea.org/learnabout/publications/reports/upload/4Q-2011-AWEA-Public-Market-Report_1-31.pdf.
23 Petition, exh. I-6, p. 30. 24 An independent power producer is an entity that primarily produces power for sale on the wholesale market. It
is not a utility, does not own electricity transmission, and does not have a designated service area. EIA Web site, “Electric Power Industry Overview 2007,” http://www.eia.gov/cneaf/electricity/page/prim2/toc2.html (accessed January 22, 2012).
0.720.89
1.23
1.461.60 1.65 1.67 1.74 1.80
1.97
0.0
0.5
1.0
1.5
2.0
2.5
1998‐99 2000‐01 2002‐03 2004‐05 2006 2007 2008 2009 2010 2011
Average cap
acity (M
W)
I-9
The largest wind project in the United States is the 845 MW Shepherds Flat wind project, which uses 338 turbines.26 Wind projects and wind turbines, including towers, have a life expectancy of at least 20 years.27
Wind turbines can also be installed offshore. There is a substantial offshore market in Europe, but the United States does not yet have any off-shore wind turbine installations.28 The first pilot project in the United States is currently projected to be installed in 2013 or 2014.29
Physical Characteristics of Towers
Wind turbine towers for utility-scale wind turbines are generally tubular steel towers (figure I-3).30 They consist of multiple sections that are placed on a foundation and assembled at the project site, with the complete tower height generally ranging from 60 to more than 100 meters (197 to more than 328 feet), as measured from the base of the tower to the hub.31 The base of the tower can be up to 4.5 meters (15 feet) in diameter, but varies with tower size. Smaller towers tend to have a smaller diameter base.32 The tower typically is tapered so that the diameter at the top is smaller than the diameter at the base.33 The tower comprises about two-thirds of the 200 to 400 short ton weight of the complete turbine, with steel comprising 98 percent of the tower weight (including the foundation).34 At the base of the tower is a door that allows entry to the tower, inside of which are tower internals such as platforms, ladders, lighting, lifts, and cabling.35
(…continued)
25 Petition, exh. I-6, p. 34 and exh. I-28; AWEA, U.S. Wind Industry Year-End 2010 Market Report, January 2011, http://www.awea.org/learnabout/publications/reports/AWEA-US-Wind-Industry-Market-Reports.cfm.
26 Petition, exh. I-23, I-24, I-25, I-26, and I-31. 27 Petition, exh. I-4, p. 14, 24, and 27; conference transcript, p. 80 (Cole) and 97 (Feldman). 28 European Wind Energy Association (“EWEA”), Wind in Power: 2010 European Statistics, February 2011, p.
9; petition, exh. I-6, p. iv. 29 Davidson, Ros, “US Inches Forward but Still Lacks Momentum,” Windpower Monthly Magazine, June 1,
2012, http://www.windpowermonthly.com/news/indepth/1134083/US-inches-forward-lacks-momentum/. 30 Petition, exh. I-4, p. 2. 31 Petition, pp. 7, 15–16, and fn. 25. 32 Conference transcript, pp. 66–67 (Janda). 33 Petition, exh. I-4, p. 5. 34 AWEA, BlueGreen Alliance, and United Steelworkers, Winds of Change, June 2010, p. 20,
http://www.awea.org/learnabout/publications/upload/BGA_Report_062510_FINAL.pdf; U.S. Department of Energy, Office of Energy Efficiency and Renewable Energy, 20% Wind Energy by 2030, p. 63, http://www.nrel.gov/docs/fy08osti/41869.pdf.
35 Petition, p. 11 and exh. I-4, p. 5; conference transcript, p. 27 (Janda).
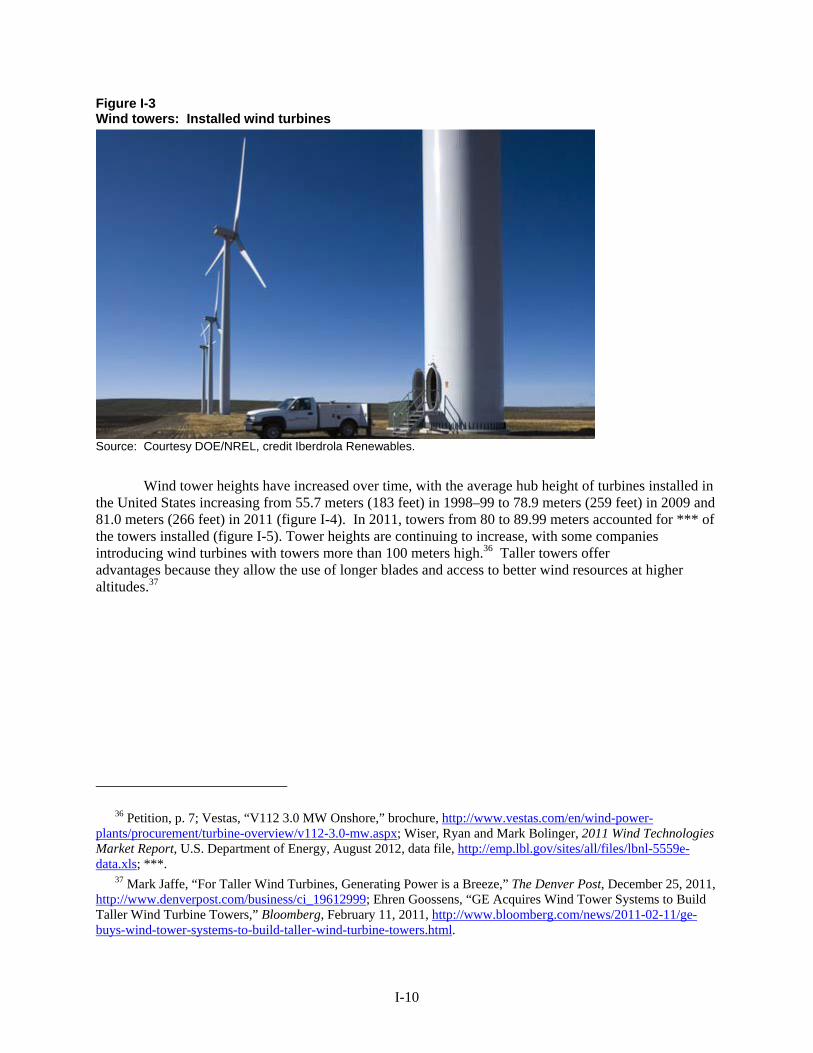
I-10
Figure I-3 Wind towers: Installed wind turbines
Source: Courtesy DOE/NREL, credit Iberdrola Renewables.
Wind tower heights have increased over time, with the average hub height of turbines installed in the United States increasing from 55.7 meters (183 feet) in 1998–99 to 78.9 meters (259 feet) in 2009 and 81.0 meters (266 feet) in 2011 (figure I-4). In 2011, towers from 80 to 89.99 meters accounted for *** of the towers installed (figure I-5). Tower heights are continuing to increase, with some companies introducing wind turbines with towers more than 100 meters high.36 Taller towers offer advantages because they allow the use of longer blades and access to better wind resources at higher altitudes.37
36 Petition, p. 7; Vestas, “V112 3.0 MW Onshore,” brochure, http://www.vestas.com/en/wind-power-plants/procurement/turbine-overview/v112-3.0-mw.aspx; Wiser, Ryan and Mark Bolinger, 2011 Wind Technologies Market Report, U.S. Department of Energy, August 2012, data file, http://emp.lbl.gov/sites/all/files/lbnl-5559e-data.xls; ***.
37 Mark Jaffe, “For Taller Wind Turbines, Generating Power is a Breeze,” The Denver Post, December 25, 2011, http://www.denverpost.com/business/ci_19612999; Ehren Goossens, “GE Acquires Wind Tower Systems to Build Taller Wind Turbine Towers,” Bloomberg, February 11, 2011, http://www.bloomberg.com/news/2011-02-11/ge-buys-wind-tower-systems-to-build-taller-wind-turbine-towers.html.
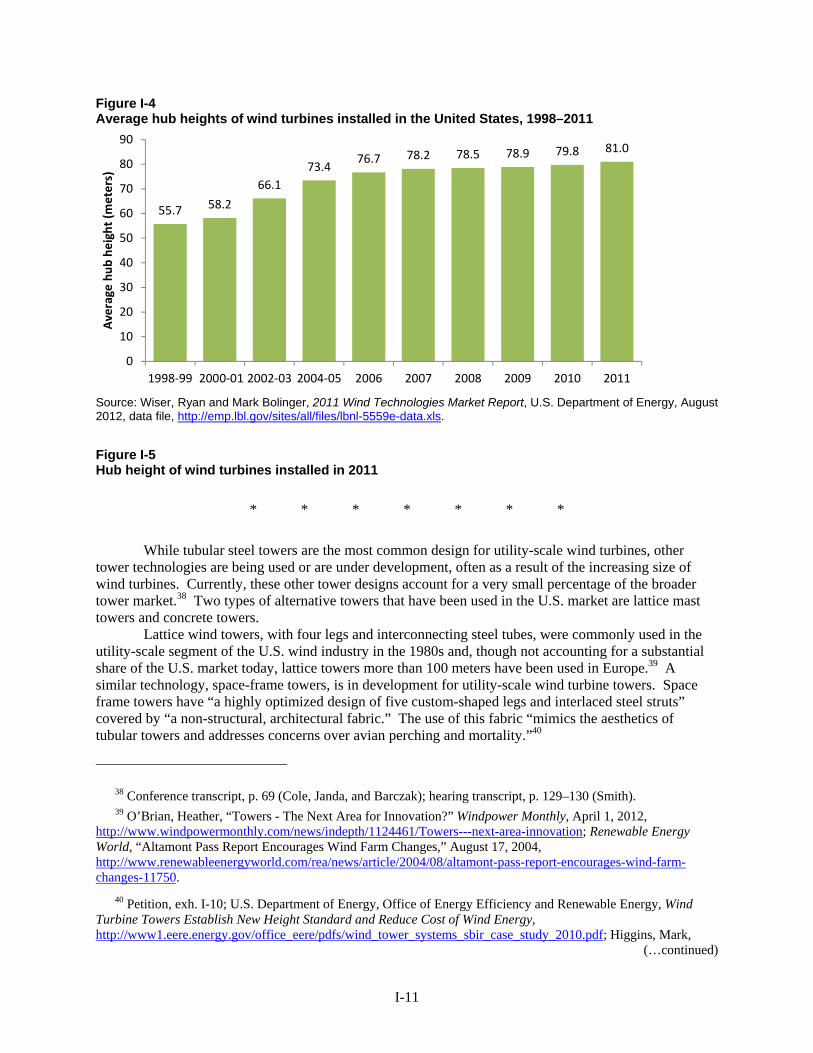
I-11
Figure I-4 Average hub heights of wind turbines installed in the United States, 1998–2011
Source: Wiser, Ryan and Mark Bolinger, 2011 Wind Technologies Market Report, U.S. Department of Energy, August 2012, data file, http://emp.lbl.gov/sites/all/files/lbnl-5559e-data.xls.
Figure I-5 Hub height of wind turbines installed in 2011
* * * * * * *
While tubular steel towers are the most common design for utility-scale wind turbines, other tower technologies are being used or are under development, often as a result of the increasing size of wind turbines. Currently, these other tower designs account for a very small percentage of the broader tower market.38 Two types of alternative towers that have been used in the U.S. market are lattice mast towers and concrete towers.
Lattice wind towers, with four legs and interconnecting steel tubes, were commonly used in the utility-scale segment of the U.S. wind industry in the 1980s and, though not accounting for a substantial share of the U.S. market today, lattice towers more than 100 meters have been used in Europe.39 A similar technology, space-frame towers, is in development for utility-scale wind turbine towers. Space frame towers have “a highly optimized design of five custom-shaped legs and interlaced steel struts” covered by “a non-structural, architectural fabric.” The use of this fabric “mimics the aesthetics of tubular towers and addresses concerns over avian perching and mortality.”40
38 Conference transcript, p. 69 (Cole, Janda, and Barczak); hearing transcript, p. 129–130 (Smith). 39 O’Brian, Heather, “Towers - The Next Area for Innovation?” Windpower Monthly, April 1, 2012,
http://www.windpowermonthly.com/news/indepth/1124461/Towers---next-area-innovation; Renewable Energy World, “Altamont Pass Report Encourages Wind Farm Changes,” August 17, 2004, http://www.renewableenergyworld.com/rea/news/article/2004/08/altamont-pass-report-encourages-wind-farm-changes-11750.
40 Petition, exh. I-10; U.S. Department of Energy, Office of Energy Efficiency and Renewable Energy, Wind Turbine Towers Establish New Height Standard and Reduce Cost of Wind Energy, http://www1.eere.energy.gov/office_eere/pdfs/wind_tower_systems_sbir_case_study_2010.pdf; Higgins, Mark,
(…continued)
55.7 58.2
66.1
73.476.7 78.2 78.5 78.9 79.8 81.0
0
10
20
30
40
50
60
70
80
90
1998‐99 2000‐01 2002‐03 2004‐05 2006 2007 2008 2009 2010 2011
Average
hub height (m
eters)
I-12
Tubular concrete wind turbine towers are used outside the United States, including in Canada, where Enercon—which commonly uses concrete towers—has a presence. The first concrete tower was not installed in the United States until 2012 and currently they are not widely used in the United States. Some companies, including one in the United States, also produce concrete tower base sections on top of which a steel tower can be added. These towers are known as concrete-steel hybrid towers. Hybrid towers are used in Europe, but there are no known installations of these towers in the United States.41
Siemens has reportedly installed a prototype of a steel shell wind turbine tower in Europe and, as of April 2012, was reportedly building a project with this type of tower. Steel shell towers are polygonal rather than tubular in shape, with individual pieces of plate that are bolted together, and have “a thinner material thickness and larger diameter than the prevalent towers on the market.”42
Manufacturing Processes43
Wind towers are produced to the specifications of each individual OEM, and each OEM typically has multiple tower designs. The wind turbine model and characteristics of the project site dictate which tower design will be used in a particular wind project.44
Wind towers are made from discrete steel plate, which is purchased by the tower manufacturer and is typically 3 meters (10 feet) wide, 12 meters (40 feet) long, and 0.5 to 2 or more inches thick. Plate thickness is related to the rotor diameter, weight, and design approach, with some OEMs using lighter towers. The plate at the base of the tower is the thickest and it decreases from the base to the top. ***.45
(…continued) “Small Business Innovation Research Grant Helps Propel Innovative Wind Energy Small Business,” March 11, 2011, http://energy.gov/articles/small-business-innovation-research-grant-helps-propel-innovative-wind-energy-small-business.
41 The U.S. company that makes these concrete tower bases has not yet started commercial production. Hearing transcript, pp. 129–130 (Smith) and pp. 219–220 (Revak); The Gazette, “Acciona to Introduce Concrete Towers for Wind Turbines,” August 18, 2011, http://thegazette.com/2011/08/18/acciona-to-introduce-concrete-towers-for-wind-turbines; Tindall, “Raising Wind Turbines to a Whole New Level,” Atlas CTB brochure, http://www.atlasctb.com/pdfs/atlasctbbrochure.pdf; North American Windpower, “Construction Begins On Iowa Project Featuring 100-Meter Concrete Tower,” July 24, 2012, http://www.nawindpower.com/print.php?plugin:content.10168; Kessler, Richard A., “Enercon to Build Second Canadian Concrete Tower Plant,” Recharge, October 16, 2012, http://www.rechargenews.com/regions/north_america/article325330.ece; Enercon Web site, http://www.enercon.de/en-en/755.htm (accessed November 7, 2012); O’Brian, Heather, “Towers - The Next Area for Innovation?” Windpower Monthly, April 1, 2012, http://www.windpowermonthly.com/news/indepth/1124461/Towers---next-area-innovation.
42 Hearing transcript, p. 220 (Revak); de Vries, Eize, “Close up – Siemens’s Prototype Steel Shell Tower,” Windpower Monthly, April 26, 2012, http://www.windpowermonthly.com/news/1129016/Close---Siemens-prot; Andresen Towers, “Next Generation Wind Turbine Towers,” brochure, http://www.windpower.org/download/1563/Andresen_towers_brochure.pdf (accessed November 7, 2012).
43 This discussion will focus on the production process for tubular steel towers. 44 Conference transcript, pp. 8 (Price), 68 (Janda), and 104–106 (Hauer); hearing transcript, pp. 111 (Cole) and
190–191 (Revak). 45 Field notes, November 30, 2012.
I-13
***.46 The plate is typically made either to a U.S. specification (such as A36, A572-50, or A709 Grades 36 and 50) or a European specification (such as 10025 Grades S235, S275, and S355) and is commonly produced in steel mills globally.47 ***.48
In the first step49 in the production process, steel plate is received, checked for quality, and cleaned (figure I-6). A plasma and/or oxygen acetylene cutter is used to shape each plate, and then the edges of the plate are beveled.
The plate is next moved to a roller, a machine that rolls it into a cylindrical or conical shape. The longitudinal seam of the rolled plate is then welded, creating what is known as a can. ***.50 The quality of the weld is checked through ultrasonic testing. ***.51 A flange (through which bolts can be inserted during tower assembly) is then welded on to the cans that will be at the top and bottom of each tower section.
The individual cans are then welded together, creating a tower section.52 The welds are again checked, and brackets, clips, and lugs to which internals can be attached are welded to the interior of the tower. A door is added to the base section by cutting an opening for the door, welding a frame to the tower, and attaching a door. ***.53
The tower sections are next blasted with grit to eliminate debris and create a rough surface that improves the paint adherence. Portions of the tower surface may next be metalized54 to reduce rust and corrosion. Towers are then painted with one or more layers on the interior and two or more layers on the exterior. It takes about 12 hours to paint and cure a tower section. The internals are then added and the tower undergoes a quality control process.
46 Field notes, November 30, 2012. 47 Conference transcript, pp. 58–59, 68, and 74 (Janda); petition, p. 11; ArcelorMittal USA, “Plate: Wind Tower
Applications,” http://www.arcelormittal.com/NA/plateinformation/documents/en/Inlandflats/ProductBrochure/ARCELORMITTAL%20WIND%20TOWER%20BROCHURE%20FOR%20POSTING%20ON%20INTERNET.pdf, accessed January 31, 2012.
48 Field notes, November 30, 2012. 49 Discussion of the production process is based on sources cited below and petition, pp. 8–11; conference
transcript, pp. 22–27 (Janda); Dongkuk S&C brochure, www.dongkuksnc.co.kr/movie/DONGKUKS&C_ENGLISH.PDF; Gamesa Web site, http://www.gamesacorp.com (accessed January 4, 2012); Kousa International Web site, http://www.kousainternational.com/tower.html (accessed January 4, 2012); Win&P Web site, http://www.winnp.co.kr (accessed January 9, 2012).
50 Field notes, November 30, 2012. 51 Field notes, November 30, 2012. 52 A typical tower consists of 30 to 40 cans. The tower sections vary in length and depend on the height of the
tower and number of sections. A taller tower does not necessarily require longer sections as the section lengths for an 80 meter tower that uses three sections can be longer than a 100 meter tower that uses five sections. Petition, p. 9; conference transcript, p. 67 (Janda). However, a 100 meter tower will be substantially heavier overall. Petitioners’ posthearing brief, exh. 2, p. 4.
53 Field notes, November 30, 2012. 54 Metalizing is “a thermal spray process that involves vaporizing zinc and aluminum alloy wire to impinge it
upon the blasted profile steel surface.” Conference transcript, p. 26 (Janda).
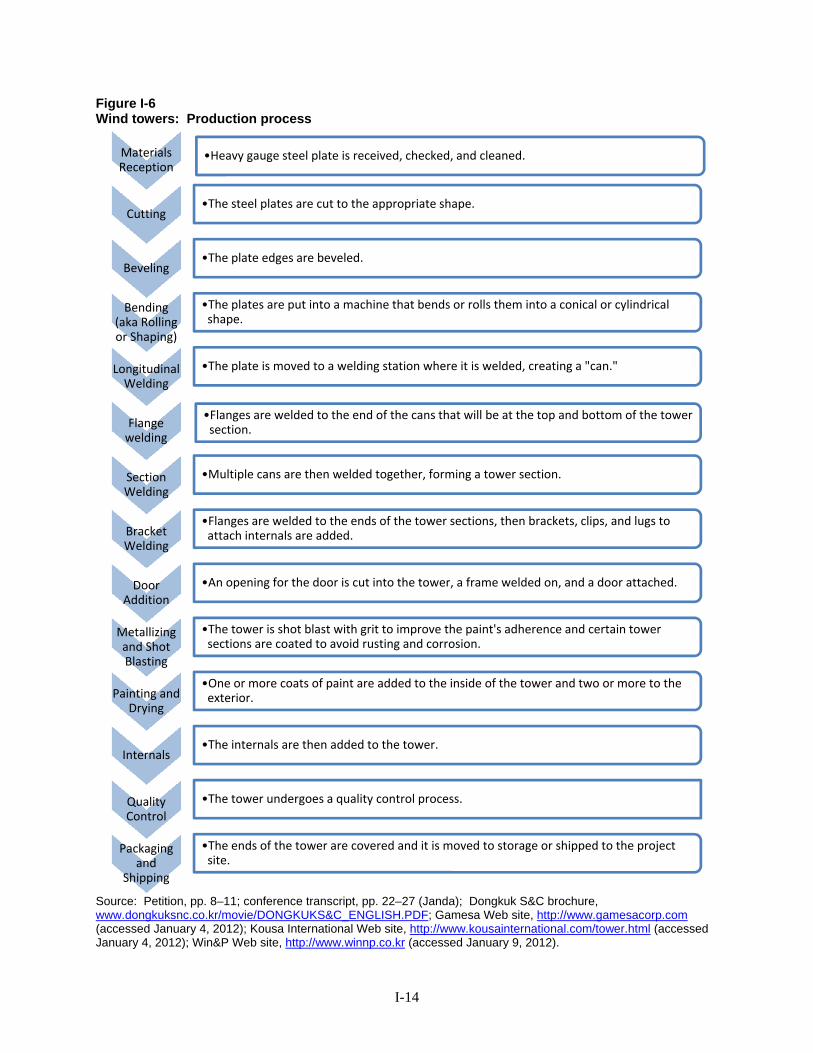
I-14
Figure I-6 Wind towers: Production process
Source: Petition, pp. 8–11; conference transcript, pp. 22–27 (Janda); Dongkuk S&C brochure, www.dongkuksnc.co.kr/movie/DONGKUKS&C_ENGLISH.PDF; Gamesa Web site, http://www.gamesacorp.com (accessed January 4, 2012); Kousa International Web site, http://www.kousainternational.com/tower.html (accessed January 4, 2012); Win&P Web site, http://www.winnp.co.kr (accessed January 9, 2012).
Materials Reception
•Heavy gauge steel plate is received, checked, and cleaned.
Cutting•The steel plates are cut to the appropriate shape.
Beveling•The plate edges are beveled.
Bending (aka Rolling or Shaping)
•The plates are put into a machine that bends or rolls them into a conical or cylindrical shape.
Longitudinal Welding
•The plate is moved to a welding station where it is welded, creating a "can."
Flange welding
•Flanges are welded to the end of the cans that will be at the top and bottom of the tower section.
Section Welding
•Multiple cans are then welded together, forming a tower section.
Bracket Welding
•Flanges are welded to the ends of the tower sections, then brackets, clips, and lugs to attach internals are added.
Door Addition
•An opening for the door is cut into the tower, a frame welded on, and a door attached.
Metallizing and Shot Blasting
•The tower is shot blast with grit to improve the paint's adherence and certain tower sections are coated to avoid rusting and corrosion.
Painting and Drying
•One or more coats of paint are added to the inside of the tower and two or more to the exterior.
Internals•The internals are then added to the tower.
Quality Control
•The tower undergoes a quality control process.
Packaging and
Shipping
•The ends of the tower are covered and it is moved to storage or shipped to the project site.
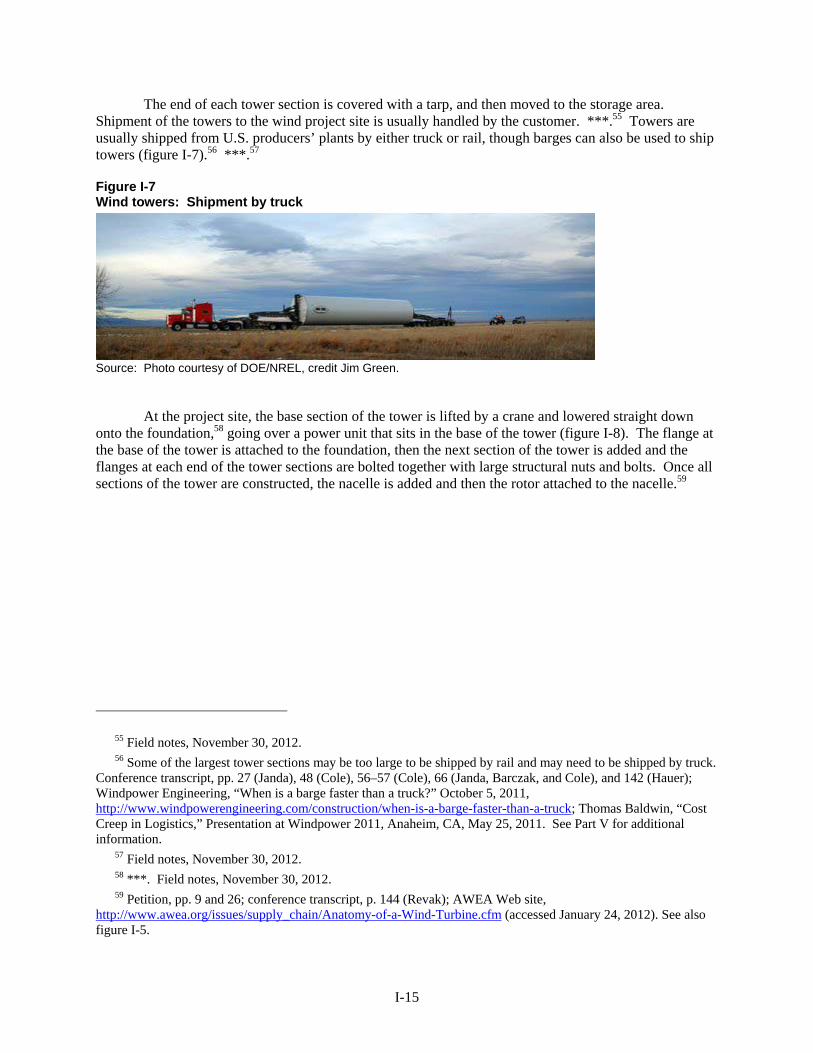
I-15
The end of each tower section is covered with a tarp, and then moved to the storage area. Shipment of the towers to the wind project site is usually handled by the customer. ***.55 Towers are usually shipped from U.S. producers’ plants by either truck or rail, though barges can also be used to ship towers (figure I-7).56 ***.57
Figure I-7 Wind towers: Shipment by truck
Source: Photo courtesy of DOE/NREL, credit Jim Green.
At the project site, the base section of the tower is lifted by a crane and lowered straight down onto the foundation,58 going over a power unit that sits in the base of the tower (figure I-8). The flange at the base of the tower is attached to the foundation, then the next section of the tower is added and the flanges at each end of the tower sections are bolted together with large structural nuts and bolts. Once all sections of the tower are constructed, the nacelle is added and then the rotor attached to the nacelle.59
55 Field notes, November 30, 2012. 56 Some of the largest tower sections may be too large to be shipped by rail and may need to be shipped by truck.
Conference transcript, pp. 27 (Janda), 48 (Cole), 56–57 (Cole), 66 (Janda, Barczak, and Cole), and 142 (Hauer); Windpower Engineering, “When is a barge faster than a truck?” October 5, 2011, http://www.windpowerengineering.com/construction/when-is-a-barge-faster-than-a-truck; Thomas Baldwin, “Cost Creep in Logistics,” Presentation at Windpower 2011, Anaheim, CA, May 25, 2011. See Part V for additional information.
57 Field notes, November 30, 2012. 58 ***. Field notes, November 30, 2012. 59 Petition, pp. 9 and 26; conference transcript, p. 144 (Revak); AWEA Web site,
http://www.awea.org/issues/supply_chain/Anatomy-of-a-Wind-Turbine.cfm (accessed January 24, 2012). See also figure I-5.
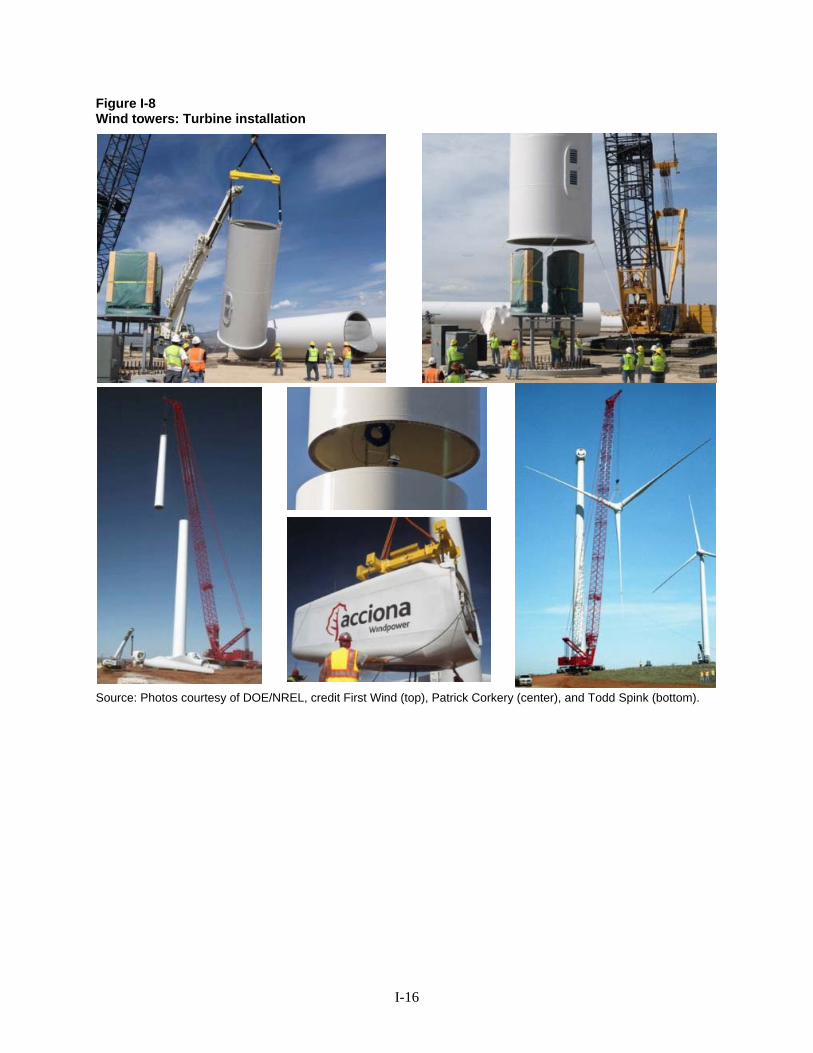
I-16
Figure I-8 Wind towers: Turbine installation
Source: Photos courtesy of DOE/NREL, credit First Wind (top), Patrick Corkery (center), and Todd Spink (bottom).
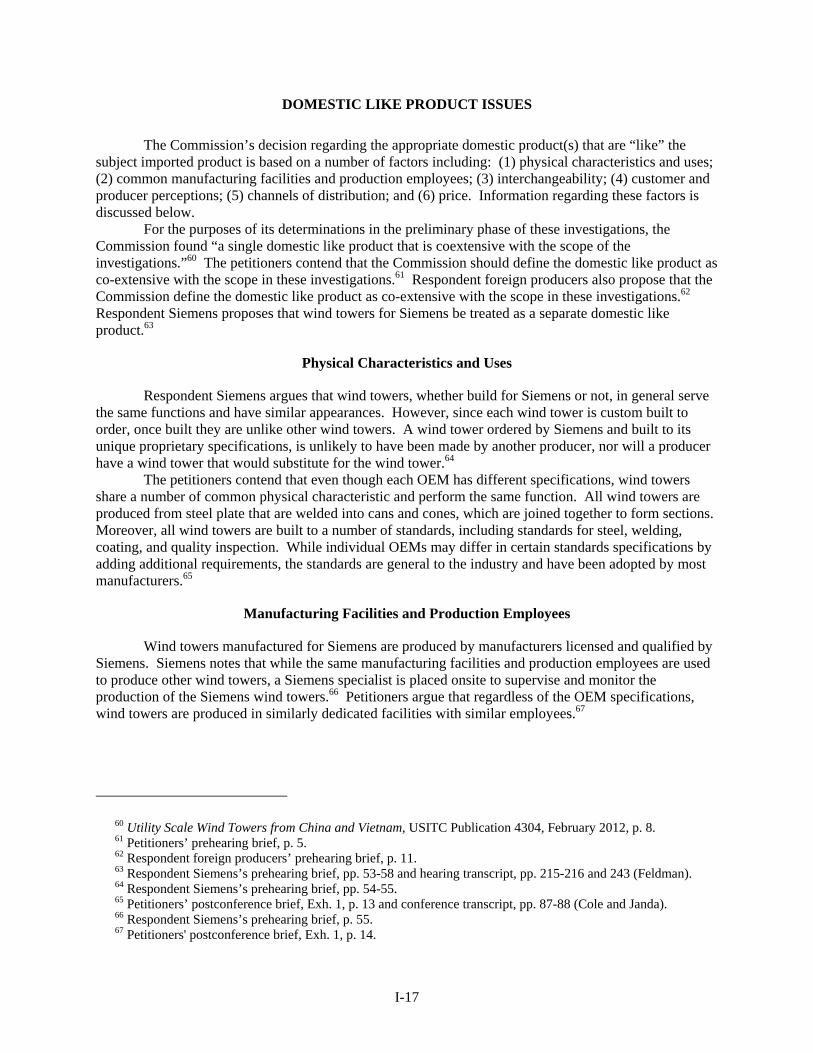
I-17
DOMESTIC LIKE PRODUCT ISSUES
The Commission’s decision regarding the appropriate domestic product(s) that are “like” the subject imported product is based on a number of factors including: (1) physical characteristics and uses; (2) common manufacturing facilities and production employees; (3) interchangeability; (4) customer and producer perceptions; (5) channels of distribution; and (6) price. Information regarding these factors is discussed below.
For the purposes of its determinations in the preliminary phase of these investigations, the Commission found “a single domestic like product that is coextensive with the scope of the investigations.”60 The petitioners contend that the Commission should define the domestic like product as co-extensive with the scope in these investigations.61 Respondent foreign producers also propose that the Commission define the domestic like product as co-extensive with the scope in these investigations.62 Respondent Siemens proposes that wind towers for Siemens be treated as a separate domestic like product.63
Physical Characteristics and Uses
Respondent Siemens argues that wind towers, whether build for Siemens or not, in general serve the same functions and have similar appearances. However, since each wind tower is custom built to order, once built they are unlike other wind towers. A wind tower ordered by Siemens and built to its unique proprietary specifications, is unlikely to have been made by another producer, nor will a producer have a wind tower that would substitute for the wind tower.64
The petitioners contend that even though each OEM has different specifications, wind towers share a number of common physical characteristic and perform the same function. All wind towers are produced from steel plate that are welded into cans and cones, which are joined together to form sections. Moreover, all wind towers are built to a number of standards, including standards for steel, welding, coating, and quality inspection. While individual OEMs may differ in certain standards specifications by adding additional requirements, the standards are general to the industry and have been adopted by most manufacturers.65
Manufacturing Facilities and Production Employees
Wind towers manufactured for Siemens are produced by manufacturers licensed and qualified by Siemens. Siemens notes that while the same manufacturing facilities and production employees are used to produce other wind towers, a Siemens specialist is placed onsite to supervise and monitor the production of the Siemens wind towers.66 Petitioners argue that regardless of the OEM specifications, wind towers are produced in similarly dedicated facilities with similar employees.67
60 Utility Scale Wind Towers from China and Vietnam, USITC Publication 4304, February 2012, p. 8. 61 Petitioners’ prehearing brief, p. 5. 62 Respondent foreign producers’ prehearing brief, p. 11. 63 Respondent Siemens’s prehearing brief, pp. 53-58 and hearing transcript, pp. 215-216 and 243 (Feldman). 64 Respondent Siemens’s prehearing brief, pp. 54-55. 65 Petitioners’ postconference brief, Exh. 1, p. 13 and conference transcript, pp. 87-88 (Cole and Janda). 66 Respondent Siemens’s prehearing brief, p. 55. 67 Petitioners' postconference brief, Exh. 1, p. 14.
I-18
Interchangeability
Respondent Siemens contends that wind towers manufactured for Siemens are not interchangeable or substitutable with wind towers manufactured for anyone else.68 Petitioners note that wind towers are custom-designed for OEM turbine manufacturers’ specific requirements, and are not interchangeable with other products, but are fungible between manufacturers within a particular OEM specification.69
Customer and Producer Perceptions
Siemens argues that both the customer and the producers perceive that a wind tower produced for Siemens is unique and unlike towers built for anyone else.70 Petitioners do not directly address the perceptions of Siemens towers and other wind towers, but note that wind towers are perceived as a distinct product category for use in wind turbine power generations units.71
Channels of Distribution
Siemens argues that while the channels of distribution may be parallel with the channels of distribution for other OEMs, the wind towers sold to Siemens are unique and are delivered directly and only to Siemens ex works.72 Petitioners note that wind turbines, whether produced for Siemens or for another firm, are primarily sold to OEM turbine manufacturers.73
Price
Siemens contends that the price that it pays for wind towers is related only to business with Siemens and is based on location, timing, and specifications for a particular project. Moreover, there is no price competition between wind towers produced for Siemens and other wind towers, because the basis for Siemens’ purchase of wind towers has no relationship whatsoever to what another OEM may be paying for towers. Furthermore, while wind tower manufacturers provide guidance on anticipated general prices at the beginning of each year, each project will lead to a difference price and each OEM will have different terms and conditions.74 Petitioners did not specifically address the factor of price.
68 Respondent Siemens’s prehearing brief, p. 54. 69 Petitioners' postconference brief, Exh. 1, p. 14 and hearing transcript, pp. 17 and 134 (DeFrancesco). 70 Respondent Siemens’s postconference brief, p. 38. 71 Petitioners' postconference brief, Exh. 1, p. 14. 72 Respondent Siemens’s postconference brief, pp. 37-38, and prehearing brief, p. 55. 73 Petitioners' postconference brief, Exh. 1, p. 14 and conference transcript, p. 31 (Barczak). 74 Respondent Siemens’s postconference brief, pp. 38-39.
PART II: CONDITIONS OF COMPETITION IN THE U.S. MARKET
U.S. MARKET CHARACTERISTICS
Utility scale wind towers are a component of utility scale wind turbine electrical powergenerating units. They are normally tubular steel structures upon which the other major wind turbinecomponents such as rotor blades and nacelles are mounted.1 As discussed in more detail in Parts I, III,and IV, wind towers have become taller and heavier in recent years, supporting larger nacelles and rotorblades which generate a greater amount of electricity per wind turbine. Demand for wind towers isderived from the demand for wind turbines which is in turn derived from the demand for wind-generatedelectric power. Demand is affected by a number of factors including energy prices, governmentincentives, and financing availability. Most U.S.-produced wind towers are sold commercially, whilemost subject and nonsubject imports are internally consumed. The capacity of domestic wind towerproducers has increased since 2009, but recently the majority of producers have decreased production,laid off workers, and plan to alter their product mix or shut down completely.
CHANNELS OF DISTRIBUTION
A substantial majority of U.S.-produced wind towers sold in the United States are shipped tounrelated end users. ***, however, utilizes its wind tower production internally to produce wind turbines. The vast majority of imported wind towers are internally consumed.
GEOGRAPHIC DISTRIBUTION
U.S. producers and importers were asked to report the geographic areas in the United Statesserved by their shipments of wind towers. The three responding producers that sell wind towers reportedthat approximately half of their towers were sold to the Midwest (*** towers *** in January 2009-June2012), *** were sold to the Pacific Coast, *** to the Mountain region, *** to the Central Southwest, ***to the Northeast, and *** were sold to the non-contiguous United States.2 Part III presents the locationsof U.S. wind tower production facilities.
Importers reported shipping imported Chinese wind towers to all U.S. geographic regions in2011, whereas imports from Vietnam were shipped to all regions in the contiguous United States exceptfor the Southeast. Importers of nonsubject wind towers reported shipping in every region, though theyshipped only a minimal percentage to the Southeast and the non-contiguous United States.
Because of the logistic complexity of overland shipping, U.S. producers with facilities in theinterior of the country and their customers often face very high transportation costs relative to importedproduct for those sites located near the Atlantic and Pacific Coasts, and to areas outside of the continentalUnited States. Similarly, importers often face very high transportation costs when shipping inland (seePart V).
Respondent Siemens contends that the majority of subject imports were shipped to the PacificCoast, whereas most projects in the Midwest were supplied by domestic producers.3 Petitioners contendthat there is not a strict delineation, as subject wind towers are shipped to Texas and the Midwest, while***.4
1 Petitioners’ postconference brief, p. 6.
2 These data are approximations based on percentages of shipments sold to each region, and only include data forthree responding producers. Three producers did not list percentages for the destination regions of their towers.
3 Respondent Siemens’s posthearing brief, exhs. 1 and 2.
4 Petitioners’ posthearing brief, p. 9.
II-1
SUPPLY AND DEMAND CONSIDERATIONS
U.S. Supply
Domestic Production
Based on available information, U.S. producers have the ability to respond to changes in demandwith large changes in the quantity of shipments of wind towers to the U.S. market, provided thatscheduling and commitments allow that capacity to be utilized. The main contributing factor to thisdegree of responsiveness of supply is substantial excess capacity. However, given the state of uncertaintysurrounding the future of government incentive programs and the shuttering of domestic facilities, thatexcess capacity may be declining currently.
Industry capacity
Responding U.S. producers’ production capacity increased throughout 2009-11, rising from 3,343units in 2009 to *** units in 2011, but was *** units in January-June 2012 compared with *** units inJanuary-June 2011. During 2009-11, capacity utilization rates ranged from a high of 61.9 percent in 2009to a low of 44.9 percent in 2010. During January-June 2012, the capacity utilization rate was *** percent,compared with *** percent in January-June 2011. Though production was higher in the first half of 2012than in the first half of 2011, U.S. producers have scaled back production and most have begun to shutterfacilities or change production to alternative products such as railcars in the second half of 2012.5
One U.S. producer, ***, reported that it has declined to bid or has been unable to supply windtowers only in situations when short-term requirements have exceeded the sustainable capacity that ***has had in place at the time. *** reported that it had temporary production challenges which reducedavailable capacity in late 2010 and early 2011. In addition, U.S. producer *** noted that it has decidednot to compete for sales in certain instances where it cannot meet Chinese or Vietnamese prices.
Despite production capacity utilization rates of no more than 61.9 percent since 2009, purchasersreported being unable to secure capacity for the production of wind towers from domestic producers. Amajority of purchasers (***) reported that they were unable to purchase wind towers from producersbecause of lack of capacity.6 Purchasers reported capacity constraints for wind towers produced byBroadwind, DMI, Martifer-Hirschfeld, Katana, and Trinity (both in the United States and Mexico). Arepresentative for Broadwind testified that it has “ never turned away a reasonable request for an order,and that goes for price and/or delivery,” with an “unreasonable” request being one “if the target price isunreasonable and also if we had already committed that capacity or if the timeline was just too tight tomeet, if the schedule was too tight.”7
***. ***. In addition, some purchasers have reportedly experienced delivery delays. Seven purchasers
reported delivery issues for wind towers that resulted in additional expenses or lost revenue for thepurchasers. ***. ***. ***. ***. ***.
Domestic producers have noted that OEMs which do not purchase the entirety of the previouslycommitted volume has reduced producers’ capacity utilization. Without sufficient lead time to make
5 Information on plant closures, expansions, and/or openings is presented in Part III.
6 In addition, ***. Among the other purchasers, *** did not provide an answer, and *** reported “N/A” or “Notapplicable.”
7 Hearing transcript, pp. 53 and 119 (Smith).
II-2
other arrangements for that capacity, other purchasers are not able to use that capacity to fulfill theircommitments, having already secured alternate sourcing.8
Alternative markets
During 2009-11, exports as a share of total shipments were low, increasing from *** percent in2009 to *** percent in 2011. The share also was higher in interim 2012 (*** percent) compared withinterim 2011 (*** percent). Only two producers, ***, reported exports.
Inventory levels
Inventories are typically low in this industry since wind towers are typically either produced toorder for specific end users or are assigned a project before manufacturing is complete. The ratio ofinventories to total shipments decreased irregularly from *** percent in 2009 to *** percent in 2011. Since wind towers are typically not installed in the winter months in northern states, inventories werehigher in the middle of the year than at the end of the year. At the end of January-June 2012, the ratiowas *** percent, compared with *** percent in January-June 2011.
Production alternatives
One of the responding U.S. producers (***) reported that it produces other products on themanufacturing equipment used to make wind towers while engaged in the manufacture of wind towers. Also, Trinity will be shifting some production to produce railcars.9
Foreign Supply
Subject Imports from China
Based on available information, the responding Chinese producers have the ability to respond tochanges in demand with moderate to large changes in the wind towers shipped to the U.S. market. Themain contributing factor to this degree of responsiveness of supply is substantial excess capacity.
Industry capacity
Chinese producers reported increasing production capacity from 2,475 units in 2009 to 3,455units in 2011. During 2009-11, their annual capacity utilization rates ranged from a low of 66.2 percentin 2010 to a high of 76.3 percent in 2009. The capacity utilization rate was 83.2 percent in January-June2012, compared with 71.4 percent in January-June 2011. Chinese producers projected a capacityutilization rate of 66.6 percent for full-year 2012 and 57.9 percent in 2013.
8 Petitioners’ posthearing brief, exh. 1, p. 25.
9 “Katana Summit adds to US tower woe,” Wind Power Monthly, September 14, 2012, found athttp://www.windpowermonthly.com/news/1149967/Katana-Summit-adds-US-tower-woe/, retrieved November 15,2012.
II-3
Alternative markets
During 2009-11, Chinese producers’ home market shipments increased from *** percent of totalshipments in 2009 to *** percent in 2010 before decreasing to *** percent in 2011. Shipments to thehome market were substantially lower in interim 2012 than in interim 2011 (*** percent compared with*** percent). Home market shipments are projected to account for *** percent of total shipments in2012, and *** percent in 2013. The lower level of home market shipments in 2012 was offset by anincreased number of shipments to the United States. In the first half of 2011, Chinese producers shipped*** units to the United States; in the second half of 2011, *** units, and in the first half of 2012, ***units. For the second half of 2012, Chinese producers project selling only *** towers to the U.S. market. Exports to markets other than the United States were relatively modest during 2009-11, ranging from alow of *** percent of total shipments in 2010 to a high of *** percent in 2009. In interim 2011, theyaccounted for *** percent, whereas in interim 2012, they accounted for *** percent. They are projectedto increase to *** percent during 2012, and *** percent in 2013.
Inventory levels
During 2009-11, the Chinese producers’ ratio of inventories to total shipments increasedfrom a low of *** percent in 2009 to a high of 26.1 percent in 2011.10 During interim 2012, the ratio was17.5 percent, which was lower than the 21.3 percent in interim 2011. The ratio is projected to decline to15.5 percent for full-year 2012 and to 9.7 percent for 2013.
Production alternatives
No Chinese producers produce or plan to produce other products using the same manufacturingline or the same manufacturing equipment used to make utility wind towers.
Subject Imports from Vietnam
Based on available information from two producers, CS Wind (Vietnam)11 and UBI Tower SoleMember Limited Liability Company (“UBI”), the Vietnamese industry has the ability to respond tochanges in demand with moderate changes in the wind towers shipped to the U.S. market. The maincontributing factors to this degree of responsiveness of supply are ***.
Industry capacity
The producers in Vietnam reported an annual production capacity increase, from *** units in2009 to *** units in 2010 with the opening of UBI, but decreasing to *** units in 2011. Capacityremained unchanged from the first half of 2011 to the first half of 2012 (*** units). During 2009-11,capacity utilization rates decreased from *** percent in 200912 to *** percent in 2010 before increasing to*** percent in 2011. The Vietnamese producers’ capacity utilization rate was *** percent in January-June 2012, compared with *** percent in January-June 2011. The producers in Vietnam projected acapacity utilization rate of *** percent for full-year 2012, and *** percent in 2013.
10 These inventories are items that have already been sold that are awaiting shipment by customers. Email from***.
11 ***.
12 At this point, CS Wind (Vietnam) was the sole Vietnamese firm that reported production.
II-4
Alternative markets
CS Wind (Vietnam) ***, but ***. Since that year, however, ***. During 2009-11, the producersin Vietnam reported that their exports to non-U.S. markets increased from *** percent of total shipmentsin 2009 to *** percent in 2010, but decreased slightly to *** percent in 2011. During interim 2012, suchexports accounted for *** percent, compared with *** percent in interim 2011. They are projected to be*** percent in 2012 and *** percent in 2013.
Inventory levels
During 2009-11, the Vietnamese producers’ ratio of inventories to total shipments increasedfrom *** percent in 2009 to a period-high of *** percent in 2010 before decreasing to *** percent in2011. During the first half of 2012, it was lower (*** percent) than in the first half of 2011 (*** percent). The ratio is projected to be *** percent for full-year 2012 and *** percent for 2013.
Production alternatives
CS Wind reported that *** on the same manufacturing equipment used to produce wind towers. The firm attributed this ***. UBI reported that *** using the same manufacturing equipment used toproduce wind towers.
U.S. Demand
The demand for wind towers is derived from the demand for wind turbines. During 2009-11,U.S. shipments of wind turbines declined from ***13 MW in 2009 to ***14 MW in 2010, but increased to*** MW in 2011.15 Total wind turbine shipments are not available for 2012, but, as discussed in the nextsection, installations are projected to exceed 2009 levels. In general, the U.S. wind market is driven by anumber of factors, including electricity demand, natural gas prices, electricity prices (related in part tonatural gas prices and electricity demand), availability of project financing, availability of electricitytransmission, and state and federal government policies.16 Since 2009, a decline in the price of naturalgas, lower electricity prices due to factors such as decreased economic activity and increased natural gasproduction, more restricted financing, transmission constraints, and the implementation of new federalgovernment policies and the anticipated expiration at the end of 2012 have contributed to fluctuations inthe wind market.17 Despite the increase in wind turbine shipments in 2011 over 2010, the installed
13 World Market Update 2009, March 2010, p. 113.
14 World Market Update 2010, March 2011, p. 129.
15 World Market Update 2011, March 2012, p. 159.
16 When asked specifically whether certain items affect the wind tower market, all responding producers,importers, and purchasers answered “yes” with respect to federal or state governmental policies. Four of 5responding U.S. producers, all responding importers and purchasers answered “yes” with respect to the natural gasmarket. Two of 5 U.S. producers, 8 importers, and 9 purchasers answered “yes” with respect to changes in theavailability of financing.
17 Petition, pp. 27–30, exh. I-4, pp. 25–30, exhibits I-6, I-39, and I-40; conference transcript, pp. 156–157(Revak); petitioners’ postconference brief, exh. 2; respondents’ postconference brief, pp. 11–12, exh. 2; AndrewDavid, “Shifts in U.S. Wind Turbine Equipment Trade in 2010,” USITC Executive Briefings on Trade, June 2011,http://www.usitc.gov/publications/332/executive_briefings/wind_EBOT_commission_review_final2.pdf. Four offive responding U.S. producers and five of eight responding importers reported that the market is subject to businesscycles or conditions of competition distinct to wind towers, most of whom noted these conditions affecting theindustry. In addition, weather conditions were noted to frequently affect the transportation and construction of wind
(continued...)
II-5
capacity was substantially lower than installed capacity during 2009. The overall decline in the markethas been attributed to the effects of the recession, a lack of project financing, lower energy demand, andlower natural gas prices, a competing energy product.18
The overall U.S. demand for wind towers is likely relatively insensitive to changes in price, dueto the lack of close substitutes, and the relatively low cost of wind towers as a share of the final cost ofwind turbines.
Government Incentives
At the federal level, the then-scheduled expiration of certain programs at the end of 2012 drove ahigh level of wind project construction in 2012 and has reduced expected demand after 2012. Therecently-passed legislation that averted the “fiscal cliff” restored the production tax credit (“PTC”) foranother year,19 though its effect may be muted in 2013 and may not even be felt until 2014. Severalavailable tax credits have contributed to the growth of the wind market in the United States. The PTC is acredit of 2.2 cents per kilowatt-hour for the first ten year of operation of a wind turbine. The PTC wasfirst passed in the Energy Policy Act of 1992. The PTC has been allowed to lapse several times since itfirst went into effect, although it has been periodically renewed. In the years in which it was allowed tolapse, there were substantial declines in wind tower installations (figure II-1). It is scheduled to expireagain at the end of 2013, with eligibility based on construction.
Similarly, under the American Recovery and Reinvestment Act of 2009, wind projects areeligible for the 30 percent investment tax credit (“ITC”) if completed by the end of 2012. Firms couldalso opt for a cash grant equal to the amount of the ITC. To be eligible for the grant (for which thedeadlines were extended in 2010), projects must have started construction before the end of 2011, andmust be in commercial operation by the end of 2012. Like the PTC, the ITC was renewed for 2013. While the PTC, ITC, and cash grants have encouraged substantial wind installations in the United Statesand the high level of activity in 2012 (with 4,728 MW installed in the first three quarters of 2012 andanother 8,430 MW under construction), the expected expiration of these tax credits could lead to asubstantial decline in installations.20
Wind projects have also benefitted from various levels of accelerated depreciation, with windprojects completed in 2012 eligible for 50 percent bonus depreciation.21
17 (...continued)towers, as little development takes place in northern states during the colder months. Conference transcript, p. 40(Barczak).
18 USITC Executive Briefings on Trade, June 2011. The wellhead price for natural gas decreased by more than 50percent between January 2008 and October 2010. Energy Information Administration, www.eia.doe.gov,information retrieved January 25, 2012.
19 The legislation contains language that extends the PTC to projects that have started construction, not projectsthat are completed, which will allow for the effects to last beyond one year. “U.S. Tax-Credit Extension May BoostStalled Wind Industry,” Bloomberg.com, found at http://www.bloomberg.com/news/2013-01-03/u-s-tax-credit-extension-may-boost-stalled-wind-industry.html, retrieved January 4, 2013.
20 Petition, pp. 31-32, 48, exh. 1-6, pp. 61-62, exh. 1.4, p. 27, and exh. I-39; American Wind Energy Association(“AWEA”), U.S. Wind Industry Third Quarter 2012 Market Report, October 17, 2012, p. 1,http://www.awea.org/learnabout/publications/reports/upload/3Q2012-Market-Report_Public-Version.pdf;Conference transcript, pp. 9 (Price) and 94 (Cole), respondents' postconference brief, pp. 11-12. See also Sec. 407of the American Taxpayer Relief Act of 2012, EDIS doc. 500751.
21 Petition, exh. 1-6, p. 61.
II-6
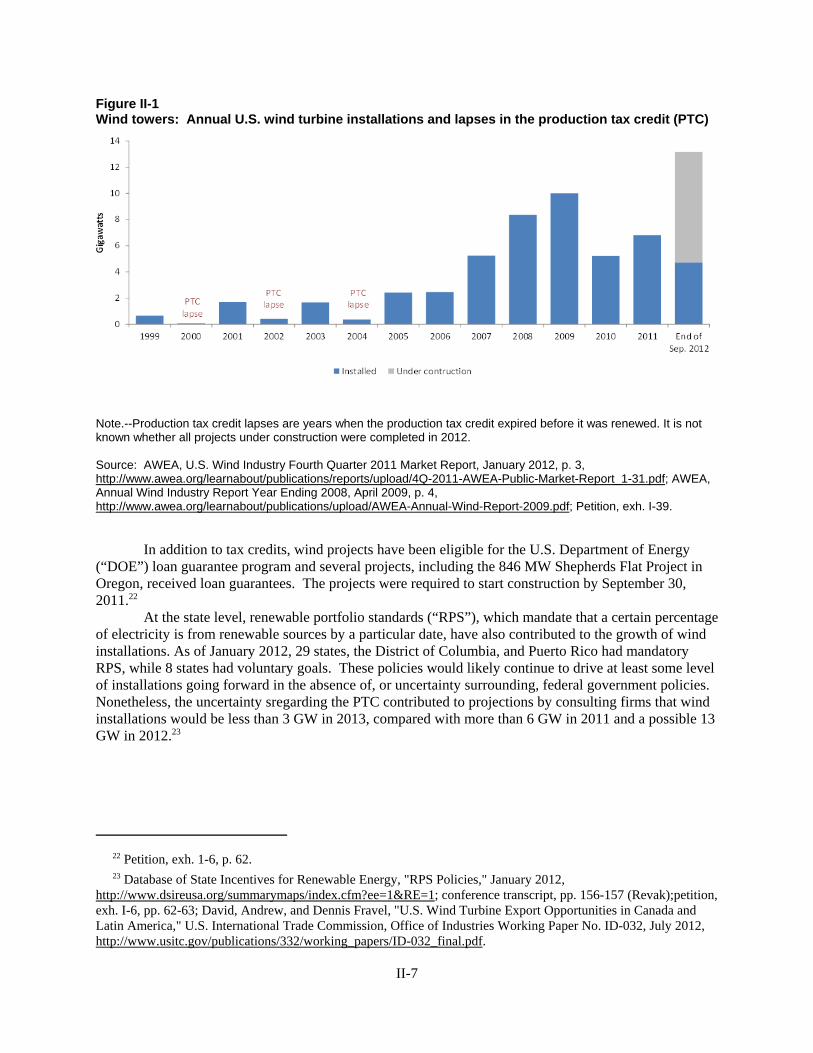
Figure II-1Wind towers: Annual U.S. wind turbine installations and lapses in the production tax credit (PTC)
Note.--Production tax credit lapses are years when the production tax credit expired before it was renewed. It is notknown whether all projects under construction were completed in 2012.
Source: AWEA, U.S. Wind Industry Fourth Quarter 2011 Market Report, January 2012, p. 3,http://www.awea.org/learnabout/publications/reports/upload/4Q-2011-AWEA-Public-Market-Report_1-31.pdf; AWEA,Annual Wind Industry Report Year Ending 2008, April 2009, p. 4,http://www.awea.org/learnabout/publications/upload/AWEA-Annual-Wind-Report-2009.pdf; Petition, exh. I-39.
In addition to tax credits, wind projects have been eligible for the U.S. Department of Energy(“DOE”) loan guarantee program and several projects, including the 846 MW Shepherds Flat Project inOregon, received loan guarantees. The projects were required to start construction by September 30,2011.22
At the state level, renewable portfolio standards (“RPS”), which mandate that a certain percentageof electricity is from renewable sources by a particular date, have also contributed to the growth of windinstallations. As of January 2012, 29 states, the District of Columbia, and Puerto Rico had mandatoryRPS, while 8 states had voluntary goals. These policies would likely continue to drive at least some levelof installations going forward in the absence of, or uncertainty surrounding, federal government policies. Nonetheless, the uncertainty sregarding the PTC contributed to projections by consulting firms that windinstallations would be less than 3 GW in 2013, compared with more than 6 GW in 2011 and a possible 13GW in 2012.23
22 Petition, exh. 1-6, p. 62.
23 Database of State Incentives for Renewable Energy, "RPS Policies," January 2012,http://www.dsireusa.org/summarymaps/index.cfm?ee=1&RE=1; conference transcript, pp. 156-157 (Revak);petition,exh. I-6, pp. 62-63; David, Andrew, and Dennis Fravel, "U.S. Wind Turbine Export Opportunities in Canada andLatin America," U.S. International Trade Commission, Office of Industries Working Paper No. ID-032, July 2012,http://www.usitc.gov/publications/332/working_papers/ID-032_final.pdf.
II-7
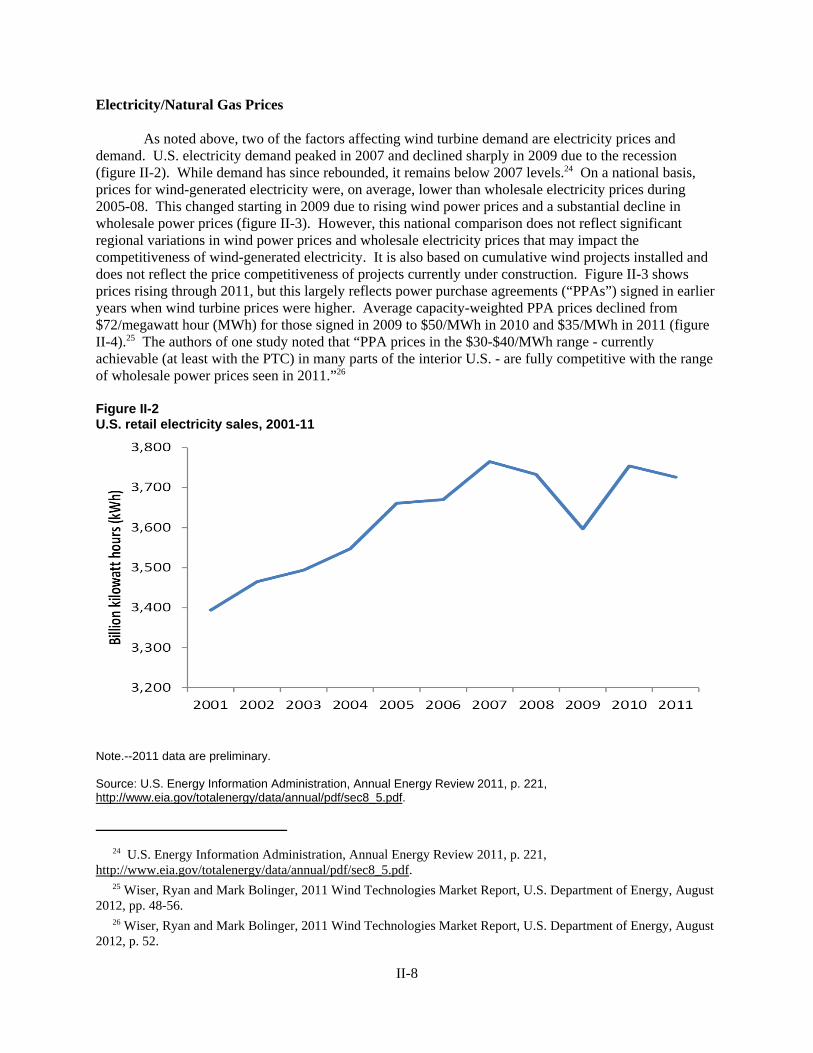
Electricity/Natural Gas Prices
As noted above, two of the factors affecting wind turbine demand are electricity prices anddemand. U.S. electricity demand peaked in 2007 and declined sharply in 2009 due to the recession(figure II-2). While demand has since rebounded, it remains below 2007 levels.24 On a national basis,prices for wind-generated electricity were, on average, lower than wholesale electricity prices during2005-08. This changed starting in 2009 due to rising wind power prices and a substantial decline inwholesale power prices (figure II-3). However, this national comparison does not reflect significantregional variations in wind power prices and wholesale electricity prices that may impact thecompetitiveness of wind-generated electricity. It is also based on cumulative wind projects installed anddoes not reflect the price competitiveness of projects currently under construction. Figure II-3 showsprices rising through 2011, but this largely reflects power purchase agreements (“PPAs”) signed in earlieryears when wind turbine prices were higher. Average capacity-weighted PPA prices declined from$72/megawatt hour (MWh) for those signed in 2009 to $50/MWh in 2010 and $35/MWh in 2011 (figureII-4).25 The authors of one study noted that “PPA prices in the $30-$40/MWh range - currentlyachievable (at least with the PTC) in many parts of the interior U.S. - are fully competitive with the rangeof wholesale power prices seen in 2011.”26
Figure II-2U.S. retail electricity sales, 2001-11
Note.--2011 data are preliminary.
Source: U.S. Energy Information Administration, Annual Energy Review 2011, p. 221,http://www.eia.gov/totalenergy/data/annual/pdf/sec8_5.pdf.
24 U.S. Energy Information Administration, Annual Energy Review 2011, p. 221,http://www.eia.gov/totalenergy/data/annual/pdf/sec8_5.pdf.
25 Wiser, Ryan and Mark Bolinger, 2011 Wind Technologies Market Report, U.S. Department of Energy, August2012, pp. 48-56.
26 Wiser, Ryan and Mark Bolinger, 2011 Wind Technologies Market Report, U.S. Department of Energy, August2012, p. 52.
II-8
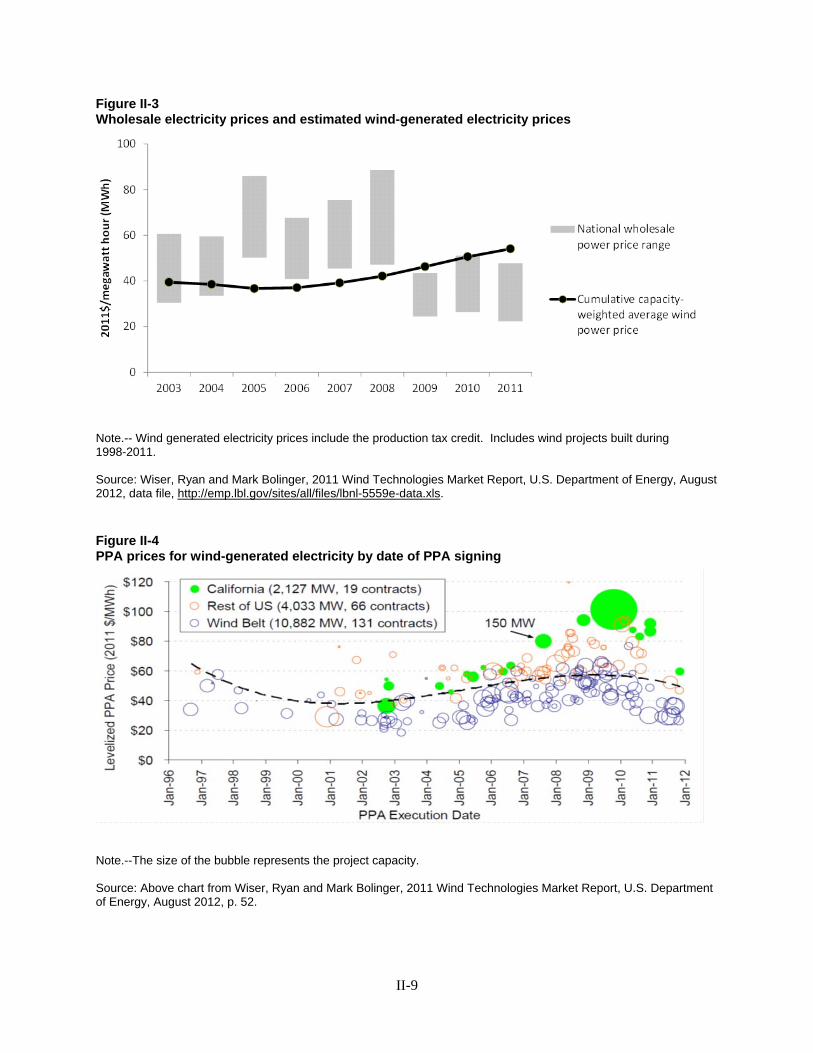
Figure II-3Wholesale electricity prices and estimated wind-generated electricity prices
Note.-- Wind generated electricity prices include the production tax credit. Includes wind projects built during1998-2011.
Source: Wiser, Ryan and Mark Bolinger, 2011 Wind Technologies Market Report, U.S. Department of Energy, August2012, data file, http://emp.lbl.gov/sites/all/files/lbnl-5559e-data.xls.
Figure II-4PPA prices for wind-generated electricity by date of PPA signing
Note.--The size of the bubble represents the project capacity.
Source: Above chart from Wiser, Ryan and Mark Bolinger, 2011 Wind Technologies Market Report, U.S. Departmentof Energy, August 2012, p. 52.
II-9
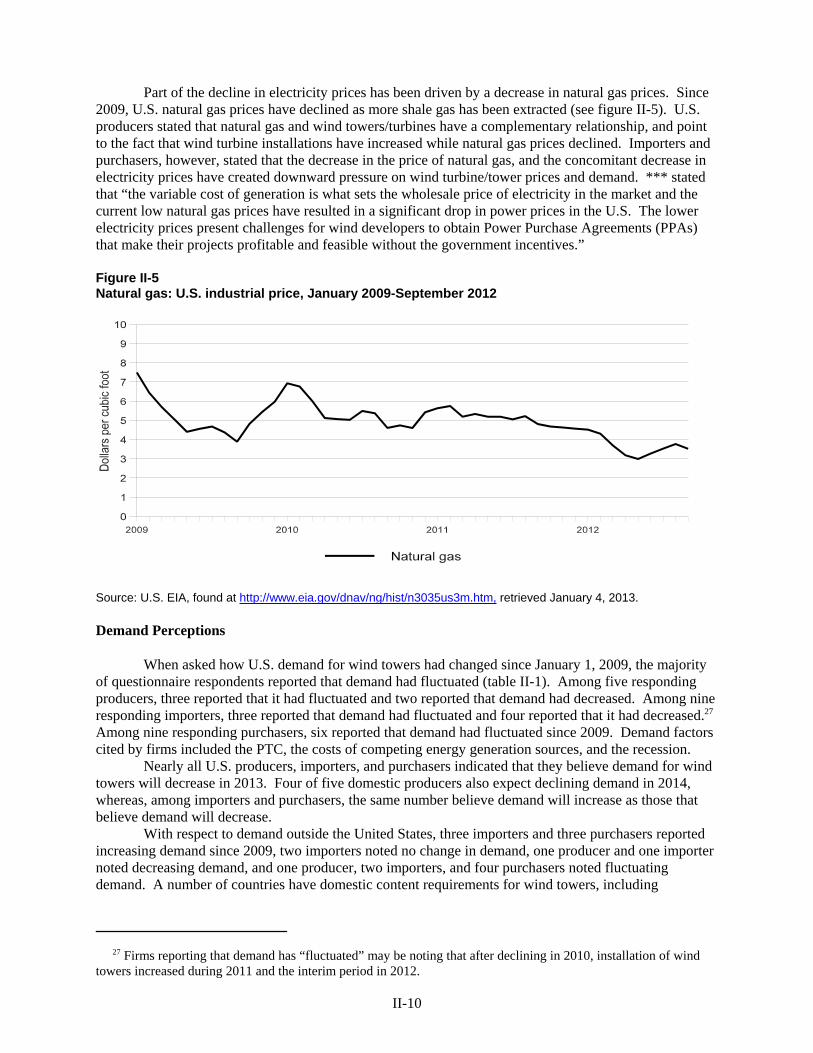
Part of the decline in electricity prices has been driven by a decrease in natural gas prices. Since2009, U.S. natural gas prices have declined as more shale gas has been extracted (see figure II-5). U.S.producers stated that natural gas and wind towers/turbines have a complementary relationship, and pointto the fact that wind turbine installations have increased while natural gas prices declined. Importers andpurchasers, however, stated that the decrease in the price of natural gas, and the concomitant decrease inelectricity prices have created downward pressure on wind turbine/tower prices and demand. *** statedthat “the variable cost of generation is what sets the wholesale price of electricity in the market and thecurrent low natural gas prices have resulted in a significant drop in power prices in the U.S. The lowerelectricity prices present challenges for wind developers to obtain Power Purchase Agreements (PPAs)that make their projects profitable and feasible without the government incentives.”
Figure II-5Natural gas: U.S. industrial price, January 2009-September 2012
Source: U.S. EIA, found at http://www.eia.gov/dnav/ng/hist/n3035us3m.htm, retrieved January 4, 2013.
Demand Perceptions
When asked how U.S. demand for wind towers had changed since January 1, 2009, the majorityof questionnaire respondents reported that demand had fluctuated (table II-1). Among five respondingproducers, three reported that it had fluctuated and two reported that demand had decreased. Among nineresponding importers, three reported that demand had fluctuated and four reported that it had decreased.27 Among nine responding purchasers, six reported that demand had fluctuated since 2009. Demand factorscited by firms included the PTC, the costs of competing energy generation sources, and the recession.
Nearly all U.S. producers, importers, and purchasers indicated that they believe demand for windtowers will decrease in 2013. Four of five domestic producers also expect declining demand in 2014,whereas, among importers and purchasers, the same number believe demand will increase as those thatbelieve demand will decrease.
With respect to demand outside the United States, three importers and three purchasers reportedincreasing demand since 2009, two importers noted no change in demand, one producer and one importernoted decreasing demand, and one producer, two importers, and four purchasers noted fluctuatingdemand. A number of countries have domestic content requirements for wind towers, including
27 Firms reporting that demand has “fluctuated” may be noting that after declining in 2010, installation of windtowers increased during 2011 and the interim period in 2012.
II-10
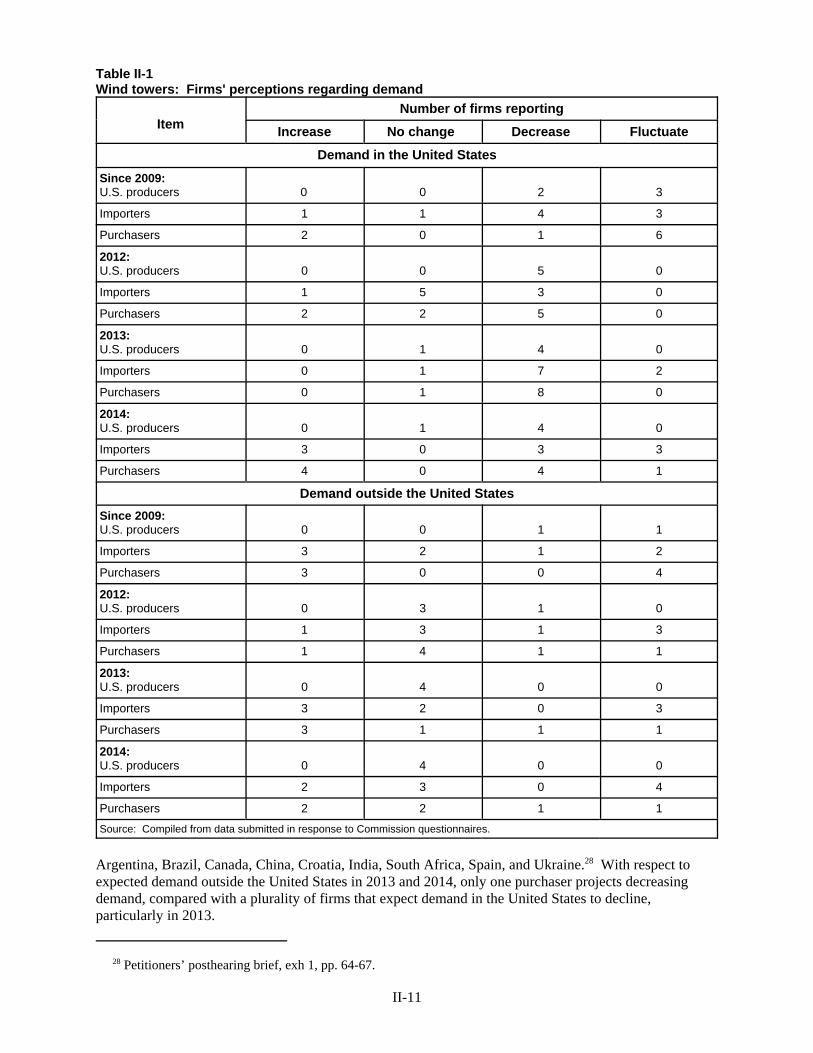
Table II-1Wind towers: Firms' perceptions regarding demand
ItemNumber of firms reporting
Increase No change Decrease Fluctuate
Demand in the United States
Since 2009:U.S. producers 0 0 2 3
Importers 1 1 4 3
Purchasers 2 0 1 6
2012:U.S. producers 0 0 5 0
Importers 1 5 3 0
Purchasers 2 2 5 0
2013:U.S. producers 0 1 4 0
Importers 0 1 7 2
Purchasers 0 1 8 0
2014:U.S. producers 0 1 4 0
Importers 3 0 3 3
Purchasers 4 0 4 1
Demand outside the United StatesSince 2009:U.S. producers 0 0 1 1
Importers 3 2 1 2
Purchasers 3 0 0 4
2012:U.S. producers 0 3 1 0
Importers 1 3 1 3
Purchasers 1 4 1 1
2013:U.S. producers 0 4 0 0
Importers 3 2 0 3
Purchasers 3 1 1 1
2014:U.S. producers 0 4 0 0
Importers 2 3 0 4
Purchasers 2 2 1 1
Source: Compiled from data submitted in response to Commission questionnaires.
Argentina, Brazil, Canada, China, Croatia, India, South Africa, Spain, and Ukraine.28 With respect toexpected demand outside the United States in 2013 and 2014, only one purchaser projects decreasingdemand, compared with a plurality of firms that expect demand in the United States to decline,particularly in 2013.
28 Petitioners’ posthearing brief, exh 1, pp. 64-67.
II-11
Apparent Consumption
Following the trend in wind turbine shipments and installations, apparent U.S. consumption ofwind towers decreased irregularly, from 3,843 units in 2009 to 2,887 units in 2010 and *** units in 2011. During January-June 2012, apparent U.S. consumption was *** units, compared with *** units inJanuary-June 2011, possibly reflecting increased demand due to the then-pending expiration ofgovernment incentives at the end of 2012.
Seasonality
Respondents alleged that demand for wind tower installations is seasonal, with the majority (***)of installations occurring in the five months (inclusive) of June through October.29 Petitioners responded,however, that installations may be seasonal but production is not.30
Substitute Products
The majority of U.S. producers (3 of 4), importers (6 of 9), and purchasers (6 of 9) reported thatthere are no substitutes for wind towers. A few firms cited lattice (truss or framework) towers, concretetowers, hybrid towers, space frame towers, and segmented steel towers as possible substitutes.
Cost Share
Most responding purchasers (6 of 8) estimated that the cost of wind towers as a share of the totalcost of wind turbines ranged between 15 and 30 percent.31
SUBSTITUTABILITY ISSUES
The degree of substitution between domestic and imported wind towers depends upon suchfactors as relative prices, quality (e.g., grade standards, reliability of supply, etc.), and conditions of sale(e.g., price discounts/rebates, lead times between order and delivery dates, payment terms, productservices, etc.). Based on available data, staff believes that there is some substitutability between U.S.-produced wind towers and imports from China and Vietnam.32 However, the towers requested by endusers can have unique specifications.
Purchaser Characteristics
Purchaser questionnaires were sent to those firms receiving producer and importer questionnaires. Questionnaire responses were received from 14 firms, with 9 reporting that they had purchased windtowers since January 1, 2009.33 Seven of these nine also reported being importers of wind towers.34
29 Respondent Siemens’s prehearing brief, pp. 21 and 24, and respondent foreign producers’ prehearing brief, pp.19-21 and exhibit 2.
30 Hearing transcript, p. 112 (DeFrancesco).
31 In contrast, ***.
32 Depending on the OEM, competition could be limited to qualified suppliers.
33 In addition, five firms reported they had not purchased wind towers since January 1, 2009. Not all purchasersresponded to all questions. Responses are compiled and presented only for those that provided an answer to a givenquestion. Firms responding that they had not purchased wind towers were ***. Those that indicated they had
(continued...)
II-12
Seven reported that they are OEM end users, two reported they were a different type of end user, and one(***) reported that it is a “seller of wind turbine generators including towers” to “developers of windenergy projects.”35 36 These nine purchasers account for the large majority of wind towers purchasedand/or transferred in the United States.
On average, purchasers noted contacting an average of three to six suppliers before making apurchase, and do so only when pursuing projects. All nine purchasers reported changes in their purchasesof U.S.-produced wind towers since 2009. Specifically, three purchasers decreased their purchases, twoincreased their purchases, and four noted fluctuating purchases. Among those noting a decline indomestic purchases, *** cited a business decline and U.S. capacity being fully consumed in 2012, ***cited ***, and *** cited a decline in the market for wind turbines. The firms reporting fluctuatingpurchases attributed changes to changing overall economic activity and a loosening in the credit market. Purchasers buying more U.S. wind towers since 2009 cited sales growth, logistics advantages, customerpreference, a change in U.S. sourcing, and an increased number of projects.
Three of nine purchasers bought wind towers imported from China, one purchased wind towersimported from Vietnam, and six purchased from nonsubject countries. Of the firms that reportedpurchasing imported wind towers, one noted decreasing its purchases of Chinese-made wind towers andtwo (***) reported fluctuating purchases from China. The sole purchaser of wind towers imported fromVietnam (***) noted *** purchase pattern. Among those purchasers that bought wind towers importedfrom nonsubject countries, two (***) reported increasing purchases since 2009, three (***) reported afluctuating pattern of purchases, and one (***) reported a constant level of purchases.
Knowledge of Country Sources and Suppliers
All nine responding purchasers noted familiarity with wind towers from the United States,whereas five noted familiarity with wind towers imported from China and three noted familiarity withwind towers imported from Vietnam. In addition, 8 purchasers were familiar with wind towers from avariety of nonsubject countries: 6 were familiar with wind towers from Canada; 5 from Korea andMexico; 3 from Spain; 2 from Brazil, Germany, and Indonesia; and 1 each from Austria, Denmark, India,“multiple European countries,” Portugal, and Turkey.
All purchasers except *** noted that they became aware of new suppliers (or supplier locations)of wind towers that had entered the market since January 2009.37 The most frequently listed newsupplier/locations were firms in the United States, Canada, and Mexico, although some Chinese firmswere also listed.
All seven responding purchasers reported that they maintained more than one qualified supplierof wind towers at any time, with *** identifying 12 locations/suppliers of wind towers and ***identifying 11.
Most purchasers source wind towers from more than one country. *** buying only from onecountry is generally due to lower transportation costs to the project site. The only other respondingpurchaser that only bought from one country, ***, stated that *** “has meant that price differences
33 (...continued)purchased wind towers include ***.
34 *** were the only two purchasers which did not report importing wind towers. As a result, there is overlap intabulations of responses of importers and purchasers.
35 ***.
36 No purchaser reported competition with manufacturers or importers of wind towers, as most are wind turbinemanufacturers.
37 *** did note, however, that it did not become aware of new suppliers but did have some newsuppliers/locations ship to it.
II-13
between purchasing foreign and domestic wind towers have been marginal, so we prefer to source locally.Also, our firm values supporting the local economy by purchasing domestic wind towers.”
Long-Term Supply Agreements
Some purchasers maintain agreements with suppliers that grant them dedicated productioncapacity at the wind tower production facility.38 Framework agreements “generally establish the towervolume to be produced/purchased within a specified timeframe, establish specific production and deliveryschedules, detail fixed and variable costs for the towers, contain general warranties, and provide forpenalties for late delivery. Pursuant to such agreements, OEMs commit to purchase a set volume oftowers from the producers over a specified period of time, generally anywhere between one to five years,at a pre-determined price, and in turn, tower producers commit to reserve the necessary capacity in orderto deliver the towers within the specified timeframe.”39
Five purchasers reported that they currently had some sort of long-term arrangement for supply ofwind towers. ***.40 A representative of Trinity testified at the hearing that it “made an effort toaccommodate our customer because we believe the demand that was less than the contracted volume wasbased on some kind of an economic issue or an industry or a market issue, so we did work with ourcustomers and accommodated them several times on several amendments to move that volume out. Andbasically we did that at no financial penalty to try to help our customer out and maintain the relationshipthat we had with that customer.”41
***. Three other purchasersreported that they were currently under long-term contracts, supplyagreements, or other similaragreements in which there are minimum purchase quantities or dedicatedcapacity: ***.
Some foreign producers maintain global supply agreements with OEMs that are producing windturbines in the United States. ***.42 ***.43 Petitioners noted five other purchasing agreements withsubject foreign producers in its posthearing brief.44 Respondent foreign producers noted that ***.45
Factors Affecting Purchasing Decisions
Purchasers were asked a variety of questions to determine what factors influence their decisionswhen buying wind towers. Information obtained from their responses indicates that several factors areconsidered important by purchasers, particularly price, quality, available capacity, and on-time delivery.
38 Additional details on these agreements as reported by U.S. and foreign producers appear in Parts III and VII.
39 Petitioners’ posthearing brief, exh. 1, p. 3.
40 Petitioners’ posthearing brief, exh 1, pp. 12-13.
41 Hearing transcript, p. 128 (Cole).
42 Respondent Siemens’s posthearing brief, answers to Commissioners’ questions, pp. 6-7.
43 Ibid.
44 Petitioners’ posthearing brief, exh 1, p. 14 .
45 Respondent foreign producers’ posthearing brief, p. 26.
II-14
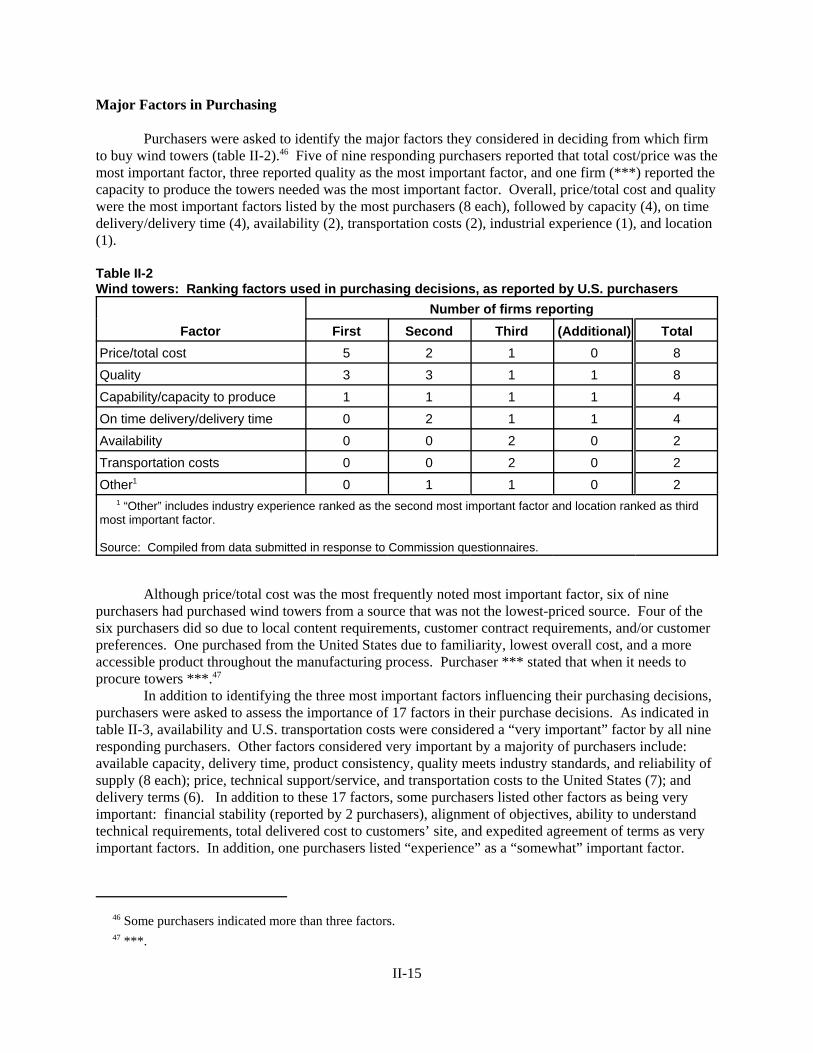
Major Factors in Purchasing
Purchasers were asked to identify the major factors they considered in deciding from which firmto buy wind towers (table II-2).46 Five of nine responding purchasers reported that total cost/price was themost important factor, three reported quality as the most important factor, and one firm (***) reported thecapacity to produce the towers needed was the most important factor. Overall, price/total cost and qualitywere the most important factors listed by the most purchasers (8 each), followed by capacity (4), on timedelivery/delivery time (4), availability (2), transportation costs (2), industrial experience (1), and location(1).
Table II-2Wind towers: Ranking factors used in purchasing decisions, as reported by U.S. purchasers
FactorNumber of firms reporting
First Second Third (Additional) TotalPrice/total cost 5 2 1 0 8Quality 3 3 1 1 8Capability/capacity to produce 1 1 1 1 4On time delivery/delivery time 0 2 1 1 4Availability 0 0 2 0 2Transportation costs 0 0 2 0 2Other1 0 1 1 0 2 1 “Other” includes industry experience ranked as the second most important factor and location ranked as thirdmost important factor.
Source: Compiled from data submitted in response to Commission questionnaires.
Although price/total cost was the most frequently noted most important factor, six of ninepurchasers had purchased wind towers from a source that was not the lowest-priced source. Four of thesix purchasers did so due to local content requirements, customer contract requirements, and/or customerpreferences. One purchased from the United States due to familiarity, lowest overall cost, and a moreaccessible product throughout the manufacturing process. Purchaser *** stated that when it needs toprocure towers ***.47
In addition to identifying the three most important factors influencing their purchasing decisions,purchasers were asked to assess the importance of 17 factors in their purchase decisions. As indicated intable II-3, availability and U.S. transportation costs were considered a “very important” factor by all nineresponding purchasers. Other factors considered very important by a majority of purchasers include: available capacity, delivery time, product consistency, quality meets industry standards, and reliability ofsupply (8 each); price, technical support/service, and transportation costs to the United States (7); anddelivery terms (6). In addition to these 17 factors, some purchasers listed other factors as being veryimportant: financial stability (reported by 2 purchasers), alignment of objectives, ability to understandtechnical requirements, total delivered cost to customers’ site, and expedited agreement of terms as veryimportant factors. In addition, one purchasers listed “experience” as a “somewhat” important factor.
46 Some purchasers indicated more than three factors.
47 ***.
II-15
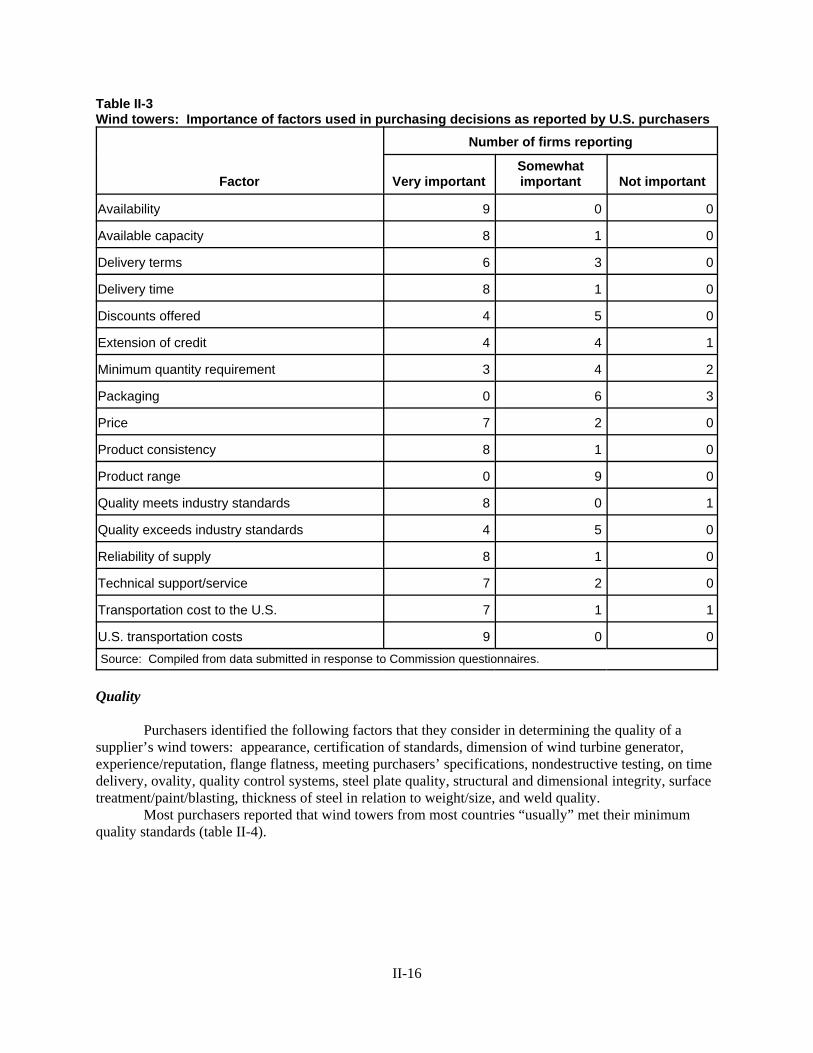
Table II-3Wind towers: Importance of factors used in purchasing decisions as reported by U.S. purchasers
Factor
Number of firms reporting
Very importantSomewhatimportant Not important
Availability 9 0 0
Available capacity 8 1 0
Delivery terms 6 3 0
Delivery time 8 1 0
Discounts offered 4 5 0
Extension of credit 4 4 1
Minimum quantity requirement 3 4 2
Packaging 0 6 3
Price 7 2 0
Product consistency 8 1 0
Product range 0 9 0
Quality meets industry standards 8 0 1
Quality exceeds industry standards 4 5 0
Reliability of supply 8 1 0
Technical support/service 7 2 0
Transportation cost to the U.S. 7 1 1
U.S. transportation costs 9 0 0Source: Compiled from data submitted in response to Commission questionnaires.
Quality
Purchasers identified the following factors that they consider in determining the quality of asupplier’s wind towers: appearance, certification of standards, dimension of wind turbine generator,experience/reputation, flange flatness, meeting purchasers’ specifications, nondestructive testing, on timedelivery, ovality, quality control systems, steel plate quality, structural and dimensional integrity, surfacetreatment/paint/blasting, thickness of steel in relation to weight/size, and weld quality.
Most purchasers reported that wind towers from most countries “usually” met their minimumquality standards (table II-4).
II-16
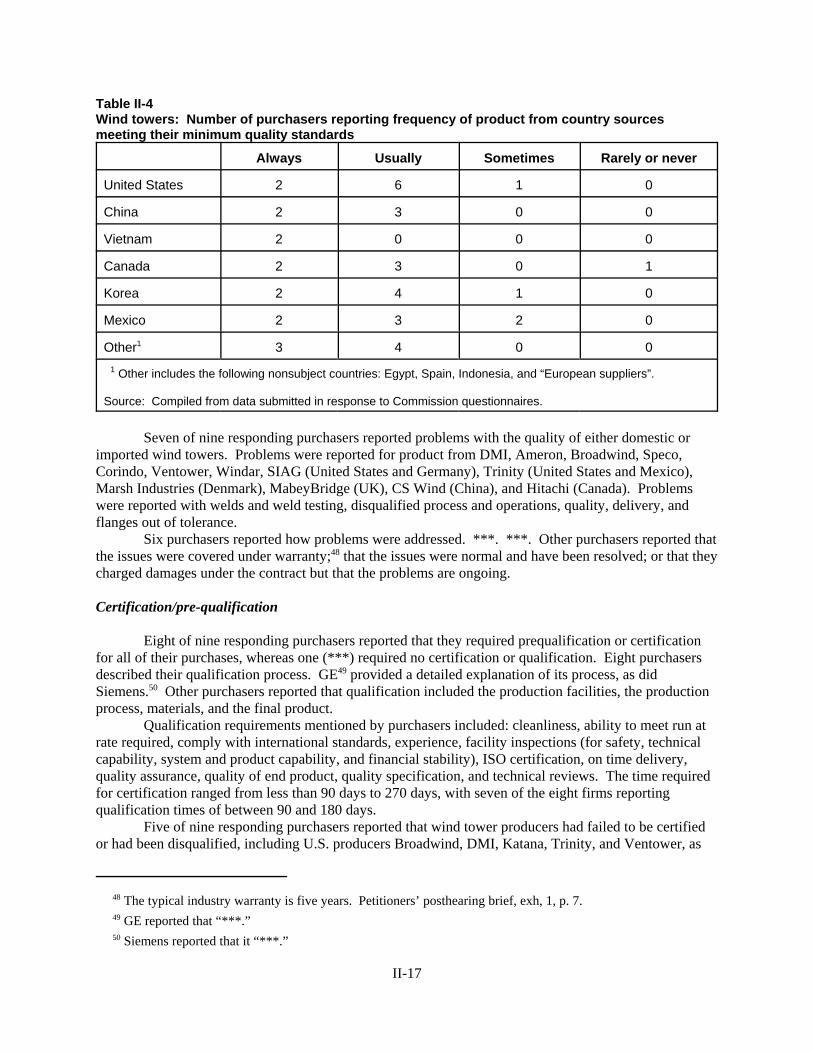
Table II-4Wind towers: Number of purchasers reporting frequency of product from country sourcesmeeting their minimum quality standards
Always Usually Sometimes Rarely or never
United States 2 6 1 0
China 2 3 0 0
Vietnam 2 0 0 0
Canada 2 3 0 1
Korea 2 4 1 0
Mexico 2 3 2 0
Other1 3 4 0 0 1 Other includes the following nonsubject countries: Egypt, Spain, Indonesia, and “European suppliers”.
Source: Compiled from data submitted in response to Commission questionnaires.
Seven of nine responding purchasers reported problems with the quality of either domestic orimported wind towers. Problems were reported for product from DMI, Ameron, Broadwind, Speco,Corindo, Ventower, Windar, SIAG (United States and Germany), Trinity (United States and Mexico),Marsh Industries (Denmark), MabeyBridge (UK), CS Wind (China), and Hitachi (Canada). Problemswere reported with welds and weld testing, disqualified process and operations, quality, delivery, andflanges out of tolerance.
Six purchasers reported how problems were addressed. ***. ***. Other purchasers reported thatthe issues were covered under warranty;48 that the issues were normal and have been resolved; or that theycharged damages under the contract but that the problems are ongoing.
Certification/pre-qualification
Eight of nine responding purchasers reported that they required prequalification or certificationfor all of their purchases, whereas one (***) required no certification or qualification. Eight purchasersdescribed their qualification process. GE49 provided a detailed explanation of its process, as didSiemens.50 Other purchasers reported that qualification included the production facilities, the productionprocess, materials, and the final product.
Qualification requirements mentioned by purchasers included: cleanliness, ability to meet run atrate required, comply with international standards, experience, facility inspections (for safety, technicalcapability, system and product capability, and financial stability), ISO certification, on time delivery,quality assurance, quality of end product, quality specification, and technical reviews. The time requiredfor certification ranged from less than 90 days to 270 days, with seven of the eight firms reportingqualification times of between 90 and 180 days.
Five of nine responding purchasers reported that wind tower producers had failed to be certifiedor had been disqualified, including U.S. producers Broadwind, DMI, Katana, Trinity, and Ventower, as
48 The typical industry warranty is five years. Petitioners’ posthearing brief, exh, 1, p. 7.
49 GE reported that “***.”
50 Siemens reported that it “***.”
II-17
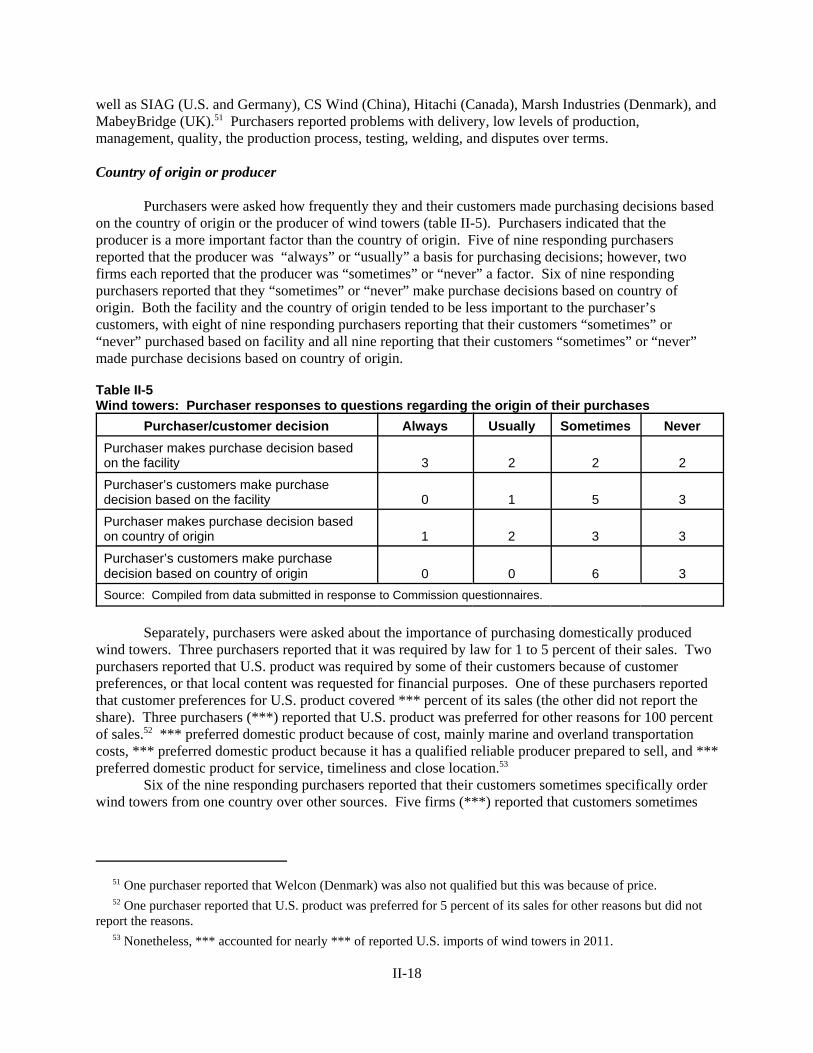
well as SIAG (U.S. and Germany), CS Wind (China), Hitachi (Canada), Marsh Industries (Denmark), andMabeyBridge (UK).51 Purchasers reported problems with delivery, low levels of production,management, quality, the production process, testing, welding, and disputes over terms.
Country of origin or producer
Purchasers were asked how frequently they and their customers made purchasing decisions basedon the country of origin or the producer of wind towers (table II-5). Purchasers indicated that theproducer is a more important factor than the country of origin. Five of nine responding purchasersreported that the producer was “always” or “usually” a basis for purchasing decisions; however, twofirms each reported that the producer was “sometimes” or “never” a factor. Six of nine respondingpurchasers reported that they “sometimes” or “never” make purchase decisions based on country oforigin. Both the facility and the country of origin tended to be less important to the purchaser’scustomers, with eight of nine responding purchasers reporting that their customers “sometimes” or“never” purchased based on facility and all nine reporting that their customers “sometimes” or “never”made purchase decisions based on country of origin.
Table II-5Wind towers: Purchaser responses to questions regarding the origin of their purchases
Purchaser/customer decision Always Usually Sometimes NeverPurchaser makes purchase decision basedon the facility 3 2 2 2
Purchaser’s customers make purchasedecision based on the facility 0 1 5 3
Purchaser makes purchase decision basedon country of origin 1 2 3 3
Purchaser’s customers make purchasedecision based on country of origin 0 0 6 3Source: Compiled from data submitted in response to Commission questionnaires.
Separately, purchasers were asked about the importance of purchasing domestically producedwind towers. Three purchasers reported that it was required by law for 1 to 5 percent of their sales. Twopurchasers reported that U.S. product was required by some of their customers because of customerpreferences, or that local content was requested for financial purposes. One of these purchasers reportedthat customer preferences for U.S. product covered *** percent of its sales (the other did not report theshare). Three purchasers (***) reported that U.S. product was preferred for other reasons for 100 percentof sales.52 *** preferred domestic product because of cost, mainly marine and overland transportationcosts, *** preferred domestic product because it has a qualified reliable producer prepared to sell, and ***preferred domestic product for service, timeliness and close location.53
Six of the nine responding purchasers reported that their customers sometimes specifically orderwind towers from one country over other sources. Five firms (***) reported that customers sometimes
51 One purchaser reported that Welcon (Denmark) was also not qualified but this was because of price.
52 One purchaser reported that U.S. product was preferred for 5 percent of its sales for other reasons but did notreport the reasons.
53 Nonetheless, *** accounted for nearly *** of reported U.S. imports of wind towers in 2011.
II-18
preferred U.S.-produced wind towers54 and one (***) reported that ***. Similarly, six of nine respondingpurchasers reported that certain grades, types, or sizes of wind towers were available only from a singlesource and gave similar answers to those given when asked about country preferences.
Lead Times
All sales of wind towers by producers are produced to order. Among responding producers, leadtimes between a customer’s order and the dates of delivery ranged from 84 to 140 days. Importers do nottypically sell wind towers from China or Vietnam, but rather internally consume them in the productionof wind turbines.
Comparisons of Domestic Products, Subject Imports, and Nonsubject Imports
All U.S. producers consider imports from the two subject countries to be “always”interchangeable with U.S.-produced wind towers, but responding importers and purchasers were morevaried in their assessments (table II-6). Five importers compared domestic and Chinese wind towers, tworeported they were “never” interchangeable, and one each reported “always,” “frequently,” and“sometimes.” Of the three importers that compared the U.S. product with imports from Vietnam, onereported that the products are “always” interchangeable, one reported that they are “frequently”interchangeable, and one reported that they are “never” interchangeable. One importer, ***, reported thattowers for *** turbines are built to *** specifications, and are interchangeable with other towers built tothe same *** specification, regardless of the manufacturer or the country of origin. Another importer,***, reported that the wind towers that it purchases are never interchangeable with any other wind towermanufactured or delivered for any other purchaser.55
A majority of producers reported that differences in factors other than price between U.S.-produced wind towers and imported products from China and Vietnam are “never” significant intheir sales of wind towers (table II-7). In contrast, a majority of importers reported that such factors are“frequently” significant. Among purchasers, with respect to China, an equal number of purchasers notedthat differences are “always,” “frequently,” or “sometimes” significant, while with respect to Vietnam,two reported “always” and one reported “frequently.” ***. *** reported that the ex-works price of atower is of very little importance compared to the cost of poor quality and late delivery, and that windtower suppliers are therefore selected based on their quality and delivery performance rather than simplythe ex-works price. Another importer, ***, reported that it subjects all of its suppliers, foreign anddomestic, to rigorous qualification and ongoing audit procedures. It reported that all components of awind turbine must meet quality standards in order to assure safe and reliable operation.
54 One of these firms reported that product could be from the United States or Canada.
55 *** was the other purchaser that noted that U.S., Chinese, and other imported wind towers are “never”interchangeable.
II-19
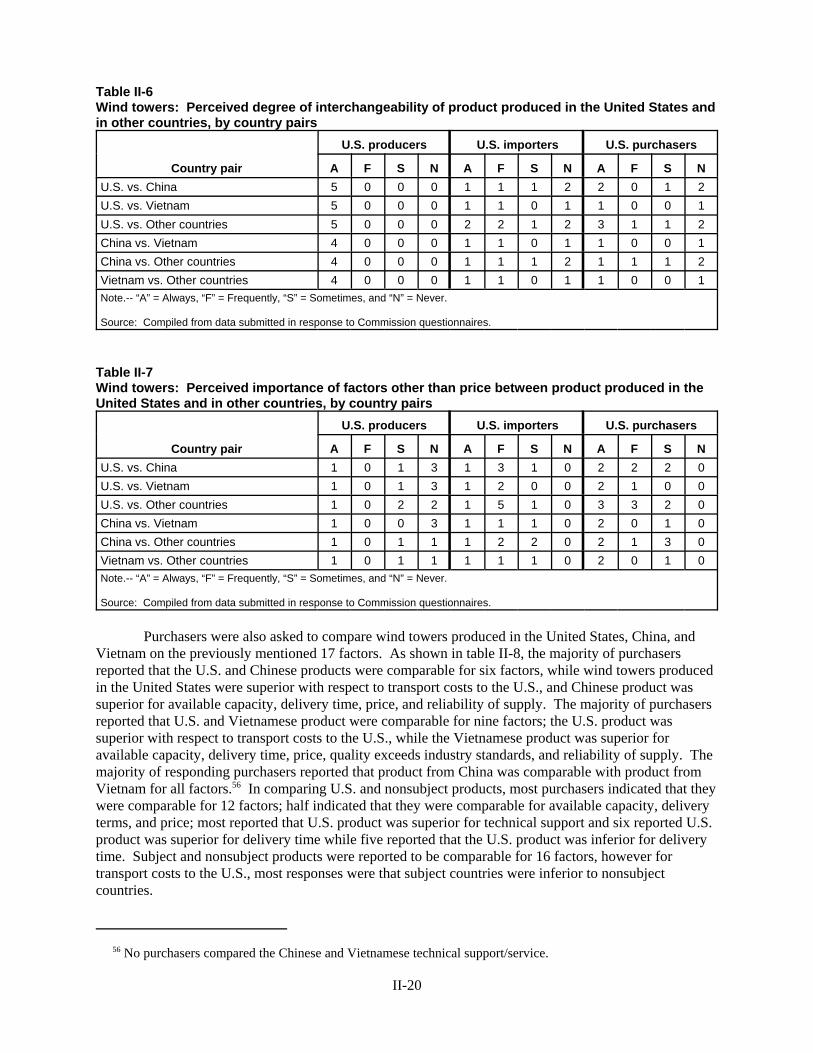
Table II-6Wind towers: Perceived degree of interchangeability of product produced in the United States andin other countries, by country pairs
Country pair
U.S. producers U.S. importers U.S. purchasers
A F S N A F S N A F S NU.S. vs. China 5 0 0 0 1 1 1 2 2 0 1 2U.S. vs. Vietnam 5 0 0 0 1 1 0 1 1 0 0 1U.S. vs. Other countries 5 0 0 0 2 2 1 2 3 1 1 2China vs. Vietnam 4 0 0 0 1 1 0 1 1 0 0 1China vs. Other countries 4 0 0 0 1 1 1 2 1 1 1 2Vietnam vs. Other countries 4 0 0 0 1 1 0 1 1 0 0 1Note.-- “A” = Always, “F” = Frequently, “S” = Sometimes, and “N” = Never.
Source: Compiled from data submitted in response to Commission questionnaires.
Table II-7Wind towers: Perceived importance of factors other than price between product produced in theUnited States and in other countries, by country pairs
Country pair
U.S. producers U.S. importers U.S. purchasers
A F S N A F S N A F S NU.S. vs. China 1 0 1 3 1 3 1 0 2 2 2 0U.S. vs. Vietnam 1 0 1 3 1 2 0 0 2 1 0 0U.S. vs. Other countries 1 0 2 2 1 5 1 0 3 3 2 0China vs. Vietnam 1 0 0 3 1 1 1 0 2 0 1 0China vs. Other countries 1 0 1 1 1 2 2 0 2 1 3 0Vietnam vs. Other countries 1 0 1 1 1 1 1 0 2 0 1 0Note.-- “A” = Always, “F” = Frequently, “S” = Sometimes, and “N” = Never.
Source: Compiled from data submitted in response to Commission questionnaires.
Purchasers were also asked to compare wind towers produced in the United States, China, andVietnam on the previously mentioned 17 factors. As shown in table II-8, the majority of purchasersreported that the U.S. and Chinese products were comparable for six factors, while wind towers producedin the United States were superior with respect to transport costs to the U.S., and Chinese product wassuperior for available capacity, delivery time, price, and reliability of supply. The majority of purchasersreported that U.S. and Vietnamese product were comparable for nine factors; the U.S. product wassuperior with respect to transport costs to the U.S., while the Vietnamese product was superior foravailable capacity, delivery time, price, quality exceeds industry standards, and reliability of supply. Themajority of responding purchasers reported that product from China was comparable with product fromVietnam for all factors.56 In comparing U.S. and nonsubject products, most purchasers indicated that theywere comparable for 12 factors; half indicated that they were comparable for available capacity, deliveryterms, and price; most reported that U.S. product was superior for technical support and six reported U.S.product was superior for delivery time while five reported that the U.S. product was inferior for deliverytime. Subject and nonsubject products were reported to be comparable for 16 factors, however fortransport costs to the U.S., most responses were that subject countries were inferior to nonsubjectcountries.
56 No purchasers compared the Chinese and Vietnamese technical support/service.
II-20
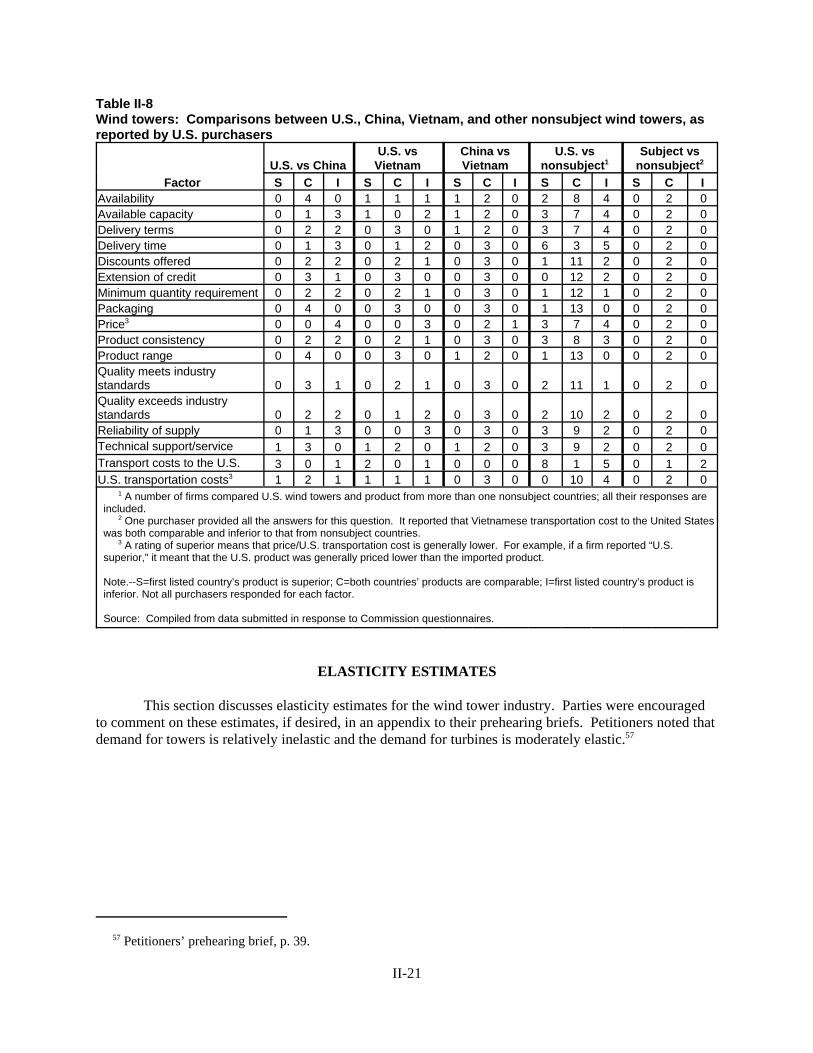
Table II-8Wind towers: Comparisons between U.S., China, Vietnam, and other nonsubject wind towers, asreported by U.S. purchasers
FactorU.S. vs China
U.S. vsVietnam
China vsVietnam
U.S. vsnonsubject1
Subject vsnonsubject2
S C I S C I S C I S C I S C IAvailability 0 4 0 1 1 1 1 2 0 2 8 4 0 2 0Available capacity 0 1 3 1 0 2 1 2 0 3 7 4 0 2 0Delivery terms 0 2 2 0 3 0 1 2 0 3 7 4 0 2 0Delivery time 0 1 3 0 1 2 0 3 0 6 3 5 0 2 0Discounts offered 0 2 2 0 2 1 0 3 0 1 11 2 0 2 0Extension of credit 0 3 1 0 3 0 0 3 0 0 12 2 0 2 0Minimum quantity requirement 0 2 2 0 2 1 0 3 0 1 12 1 0 2 0Packaging 0 4 0 0 3 0 0 3 0 1 13 0 0 2 0Price3 0 0 4 0 0 3 0 2 1 3 7 4 0 2 0Product consistency 0 2 2 0 2 1 0 3 0 3 8 3 0 2 0Product range 0 4 0 0 3 0 1 2 0 1 13 0 0 2 0Quality meets industrystandards 0 3 1 0 2 1 0 3 0 2 11 1 0 2 0Quality exceeds industrystandards 0 2 2 0 1 2 0 3 0 2 10 2 0 2 0Reliability of supply 0 1 3 0 0 3 0 3 0 3 9 2 0 2 0Technical support/service 1 3 0 1 2 0 1 2 0 3 9 2 0 2 0Transport costs to the U.S. 3 0 1 2 0 1 0 0 0 8 1 5 0 1 2U.S. transportation costs3 1 2 1 1 1 1 0 3 0 0 10 4 0 2 0 1 A number of firms compared U.S. wind towers and product from more than one nonsubject countries; all their responses areincluded. 2 One purchaser provided all the answers for this question. It reported that Vietnamese transportation cost to the United Stateswas both comparable and inferior to that from nonsubject countries. 3 A rating of superior means that price/U.S. transportation cost is generally lower. For example, if a firm reported “U.S.superior,” it meant that the U.S. product was generally priced lower than the imported product.
Note.--S=first listed country’s product is superior; C=both countries’ products are comparable; I=first listed country’s product isinferior. Not all purchasers responded for each factor.
Source: Compiled from data submitted in response to Commission questionnaires.
ELASTICITY ESTIMATES
This section discusses elasticity estimates for the wind tower industry. Parties were encouragedto comment on these estimates, if desired, in an appendix to their prehearing briefs. Petitioners noted thatdemand for towers is relatively inelastic and the demand for turbines is moderately elastic.57
57 Petitioners’ prehearing brief, p. 39.
II-21

U.S. Supply Elasticity
The domestic supply elasticity for wind towers measures the sensitivity of the quantity suppliedby U.S. producers to changes in the U.S. market price of wind towers. The elasticity of domestic supplydepends on several factors including the level of excess capacity, the ease with which producers can altercapacity, producers’ ability to shift to production of other products, the absence of inventories, and thepossibility of alternate markets for U.S.-produced wind towers. Based on the low production capacityutilization levels, but mitigated by the lack of inventories, a low level of exports, and the relative lack ofproduction alternatives, the U.S. industry presently has a moderate ability to increase shipments to theU.S. market; an estimate in the range of 2 to 4 is suggested.
U.S. Demand Elasticity
The U.S. demand elasticity for wind towers measures the sensitivity of the overall quantitydemanded to a change in the U.S. market price of wind towers. This estimate depends on factorsdiscussed earlier such as the existence, availability, and commercial viability of substitute products andthe existence of government incentives, as well as the component share of wind towers in the productionof wind turbines. With respect to wind towers, the price elasticity of demand is likely highly inelastic, inthe range of -0.1 to -0.4. Demand for wind towers is derived from the demand for electricity and therelative prices of types of electricity generation, which is influenced by a number of factors, including theexistence of government policies. The price elasticity of demand for wind turbines is likely to be higherthan the price elasticity of demand for wind towers.
Substitution Elasticity
The elasticity of substitution depends upon the extent of product differentiation between domesticand imported products.58 Product differentiation, in turn, depends upon such factors as quality, conditionsof sale, and factory capability. Different manufacturing locations, whether located domestically oroverseas, have different engineering and manufacturing capabilities. Facilities that are unable to build awind tower that meets the requirements of the purchaser will not be able to win the bidding event and willtherefore be uncompetitive. Most U.S. firms reportedly can supply wind towers up to 100 meters, thoughthese facilities are centered in the middle of the United States. Few purchasers indicated a preference fordomestic wind towers based on factors such as governmental provisions or customer preferences. Basedon available information, the elasticity of substitution between domestic and subject wind towers is likelyto be in the range of 2 to 4.
58 The substitution elasticity measures the responsiveness of the relative U.S. consumption levels of the subjectimports and the domestic like products to changes in their relative prices. This reflects how easily purchasers switchfrom the U.S. product to the subject products (or vice versa) when prices change.
II-22
III-1
PART III: U.S. PRODUCERS’ PRODUCTION, SHIPMENTS, AND EMPLOYMENT
The Commission analyzes a number of factors in making injury determinations (see 19 U.S.C. §§ 1677(7)(B) and 1677(7)(C)). Information on the subsidies and dumping margins was presented in Part I of this report and information on the volume and pricing of imports of the subject merchandise is presented in Part IV and Part V. Information on the other factors specified is presented in this section and/or Part VI and (except as noted) is based on the questionnaire responses of six firms that accounted for the substantial majority of U.S. production of wind towers during the period for which data were collected.1
As of June 2012, thirteen companies reported wind tower manufacturing capabilities at eighteen plants in the United States, though some firms that reported production capabilities may not have been actively engaged in wind tower production (figure III-1).2 In addition, at least one company, Tindall, also reported pilot production of concrete tower base sections. The largest concentration of plants is in the Midwest and Oklahoma/Texas. There also are two plants on the West Coast, two in Colorado, and one in Tennessee.3 Tindall’s pilot production of concrete tower base sections is in Georgia. At least four wind tower plants (Broadwind in Texas, Martifer-Hirschfeld in Texas, Ventower in Michigan, and Vestas in Colorado) opened during January 2009-June 2012. In addition, Broadwind completed construction—but did not open—a plant in South Dakota and Dragon Wind reportedly completed a plant in Colorado, though information is not available on whether Dragon Wind began wind tower production. Based on publicly available information, at least two plants (Trinity in Denton, TX and Tulsa, OK) closed. SIAG Aerisyn filed for reorganization under chapter 11 of the bankruptcy code in April 2012 (following a similar filing by their German parent company), but information is not available on whether it stopped tower production (table III-1). Since July 2012, the number of U.S. producers has declined. Otter Tail sold its DMI plants to Trinity, Katana announced that it is seeking a buyer for its plants and completed the sale of its plant in Nebraska, Trinity announced that it was switching some of its tower plants to railcar production, and Hirschfeld Industries bought Martifer’s half of their joint venture and appears to be transitioning to products for the oil and gas industries.
1 These six firms are estimated to account for more than *** percent of U.S. shipments, based on AWEA’s total of *** wind turbines shipped in 2011 and data from table C-1 on the quantity of U.S. imports and U.S. producers’ domestic shipments. As noted later in Part III, of the remaining firms that did not provide a response, only three are known to have large scale commercial production—Johnson Plate and Tower, SIAG Aerisyn, and Ventower.
2 Number of firms and production locations does not include Valmont, which can produce towers for turbines up to 660 kW, since the production location(s) for this firm are not available. Conference transcript, pp. 28, 66 (Janda), 38 (Reinhardt), and 40 (Cole); table III-1; Broadwind Energy, “Broadwind Energy Subsidiary Tower Tech Holds Ribbon-Cutting Ceremony at Texas Facility,” News release, June 9, 2009, http://www.bwen.com/pdf/44.pdf; DMI Web site, http://www.dmiindustries.com/about/profile.php (accessed January 24, 2012); Katana Summit Web site, http://www.katana-summit.com/contact.htm (accessed January 24, 2012); SMI & Hydraulics Web site, http://smihyd.com/wind-tower-manufacturing/ (accessed January 18, 2012); Valmont Web site, http://www.valmont.com/page.aspx?id=95&pid=107 (accessed January 18, 2012).
3 Respondent Siemens argues that the wind towers sold to the merchant market, as manifested by installation patterns, are a regional industry where imports do not compete with the domestic product (and consequently cannot injure it). Respondent Siemens’s posthearing brief, pp. 1, 8, and 17. However, no regional market has been proposed or defined in these investigations. See Part II of this report for the geographic areas served by U.S. producers and importers, Part III for the locations of U.S. producers, Part IV for the primary ports of entry for U.S. imports, and appendix D for the location of wind tower projects across the United States.
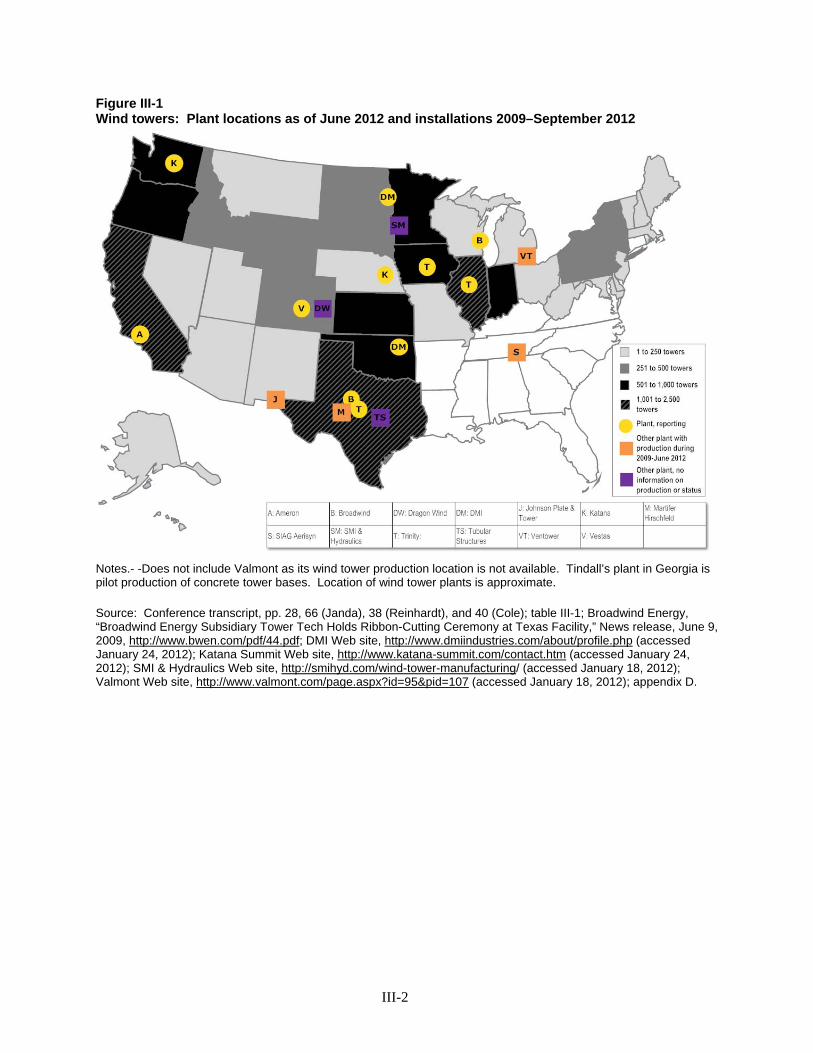
III-2
Figure III-1 Wind towers: Plant locations as of June 2012 and installations 2009–September 2012
Notes.- -Does not include Valmont as its wind tower production location is not available. Tindall’s plant in Georgia is pilot production of concrete tower bases. Location of wind tower plants is approximate. Source: Conference transcript, pp. 28, 66 (Janda), 38 (Reinhardt), and 40 (Cole); table III-1; Broadwind Energy, “Broadwind Energy Subsidiary Tower Tech Holds Ribbon-Cutting Ceremony at Texas Facility,” News release, June 9, 2009, http://www.bwen.com/pdf/44.pdf; DMI Web site, http://www.dmiindustries.com/about/profile.php (accessed January 24, 2012); Katana Summit Web site, http://www.katana-summit.com/contact.htm (accessed January 24, 2012); SMI & Hydraulics Web site, http://smihyd.com/wind-tower-manufacturing/ (accessed January 18, 2012); Valmont Web site, http://www.valmont.com/page.aspx?id=95&pid=107 (accessed January 18, 2012); appendix D.
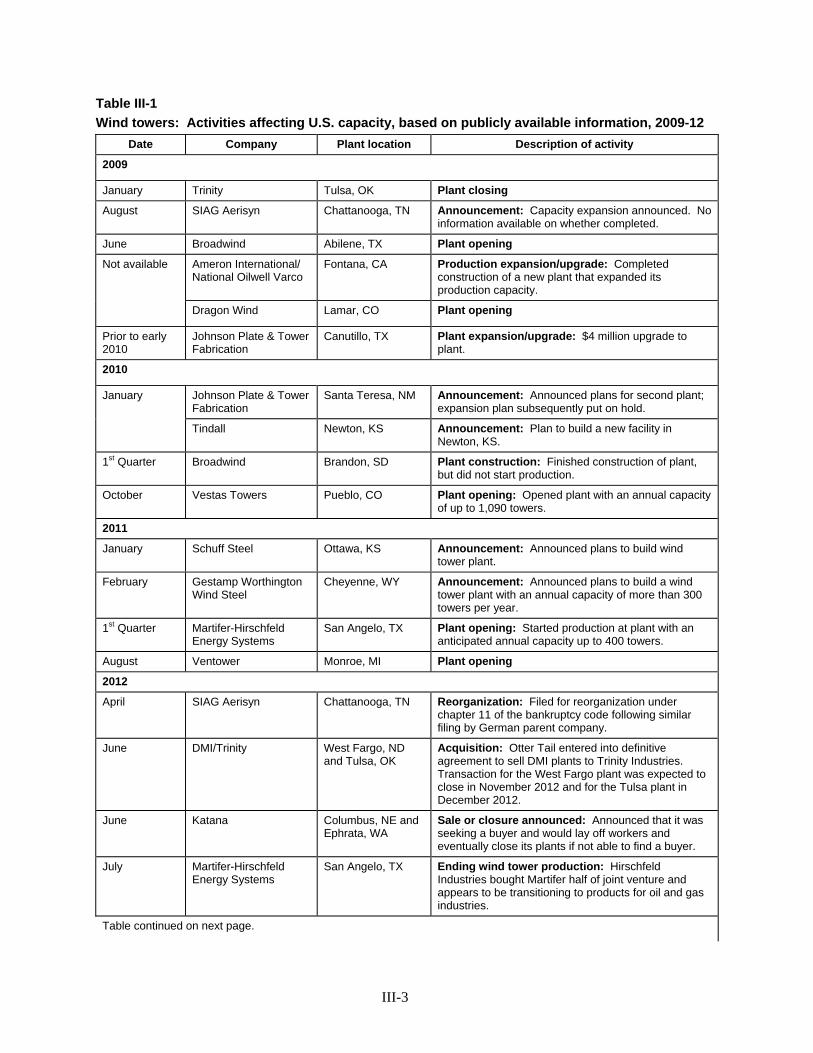
III-3
Table III-1 Wind towers: Activities affecting U.S. capacity, based on publicly available information, 2009-12
Date Company Plant location Description of activity
2009
January Trinity Tulsa, OK Plant closing
August SIAG Aerisyn Chattanooga, TN Announcement: Capacity expansion announced. No information available on whether completed.
June Broadwind Abilene, TX Plant opening
Not available Ameron International/ National Oilwell Varco
Fontana, CA Production expansion/upgrade: Completed construction of a new plant that expanded its production capacity.
Dragon Wind Lamar, CO Plant opening
Prior to early 2010
Johnson Plate & Tower Fabrication
Canutillo, TX Plant expansion/upgrade: $4 million upgrade to plant.
2010
January Johnson Plate & Tower Fabrication
Santa Teresa, NM Announcement: Announced plans for second plant; expansion plan subsequently put on hold.
Tindall Newton, KS Announcement: Plan to build a new facility in Newton, KS.
1st Quarter Broadwind Brandon, SD Plant construction: Finished construction of plant, but did not start production.
October Vestas Towers Pueblo, CO Plant opening: Opened plant with an annual capacity of up to 1,090 towers.
2011
January Schuff Steel Ottawa, KS Announcement: Announced plans to build wind tower plant.
February Gestamp Worthington Wind Steel
Cheyenne, WY Announcement: Announced plans to build a wind tower plant with an annual capacity of more than 300 towers per year.
1st Quarter Martifer-Hirschfeld Energy Systems
San Angelo, TX Plant opening: Started production at plant with an anticipated annual capacity up to 400 towers.
August Ventower Monroe, MI Plant opening
2012
April SIAG Aerisyn Chattanooga, TN Reorganization: Filed for reorganization under chapter 11 of the bankruptcy code following similar filing by German parent company.
June DMI/Trinity West Fargo, ND and Tulsa, OK
Acquisition: Otter Tail entered into definitive agreement to sell DMI plants to Trinity Industries. Transaction for the West Fargo plant was expected to close in November 2012 and for the Tulsa plant in December 2012.
June Katana Columbus, NE and Ephrata, WA
Sale or closure announced: Announced that it was seeking a buyer and would lay off workers and eventually close its plants if not able to find a buyer.
July Martifer-Hirschfeld Energy Systems
San Angelo, TX Ending wind tower production: Hirschfeld Industries bought Martifer half of joint venture and appears to be transitioning to products for oil and gas industries.
Table continued on next page.
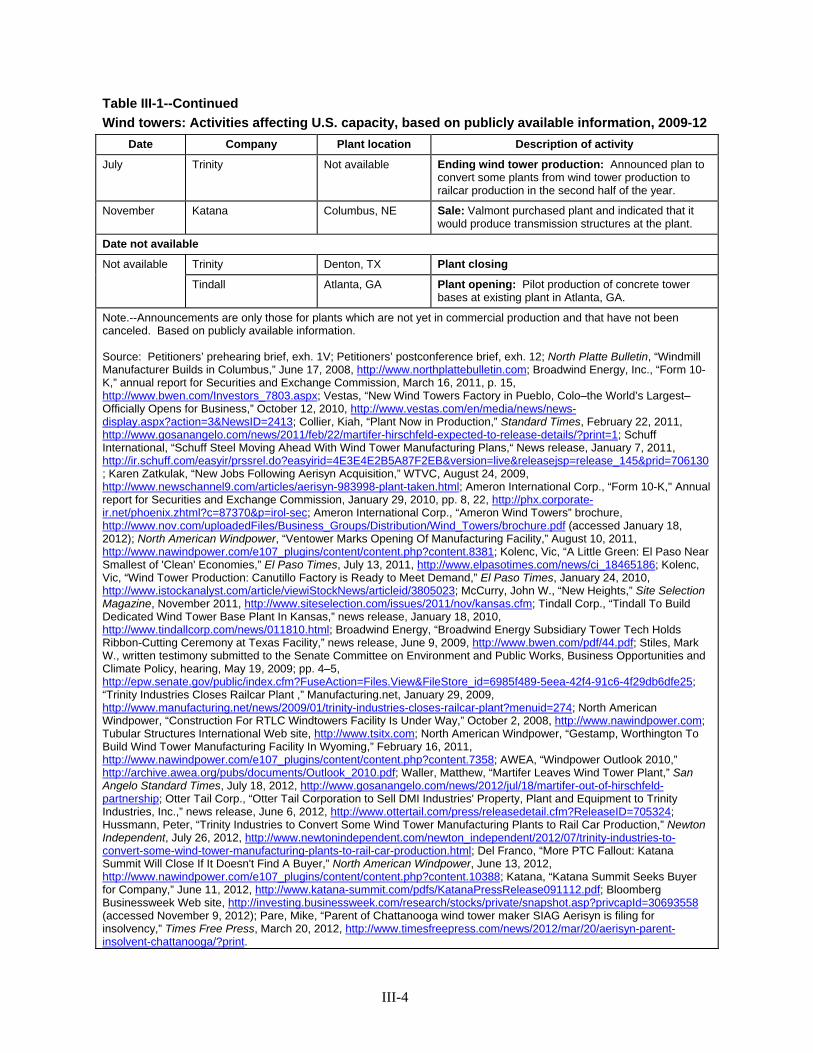
III-4
Table III-1--Continued Wind towers: Activities affecting U.S. capacity, based on publicly available information, 2009-12
Date Company Plant location Description of activity
July Trinity Not available Ending wind tower production: Announced plan to convert some plants from wind tower production to railcar production in the second half of the year.
November Katana Columbus, NE Sale: Valmont purchased plant and indicated that it would produce transmission structures at the plant.
Date not available
Not available Trinity Denton, TX Plant closing
Tindall Atlanta, GA Plant opening: Pilot production of concrete tower bases at existing plant in Atlanta, GA.
Note.--Announcements are only those for plants which are not yet in commercial production and that have not been canceled. Based on publicly available information. Source: Petitioners’ prehearing brief, exh. 1V; Petitioners’ postconference brief, exh. 12; North Platte Bulletin, “Windmill Manufacturer Builds in Columbus,” June 17, 2008, http://www.northplattebulletin.com; Broadwind Energy, Inc., “Form 10-K,” annual report for Securities and Exchange Commission, March 16, 2011, p. 15, http://www.bwen.com/Investors_7803.aspx; Vestas, “New Wind Towers Factory in Pueblo, Colo–the World’s Largest–Officially Opens for Business,” October 12, 2010, http://www.vestas.com/en/media/news/news-display.aspx?action=3&NewsID=2413; Collier, Kiah, “Plant Now in Production,” Standard Times, February 22, 2011, http://www.gosanangelo.com/news/2011/feb/22/martifer-hirschfeld-expected-to-release-details/?print=1; Schuff International, “Schuff Steel Moving Ahead With Wind Tower Manufacturing Plans,“ News release, January 7, 2011, http://ir.schuff.com/easyir/prssrel.do?easyirid=4E3E4E2B5A87F2EB&version=live&releasejsp=release_145&prid=706130; Karen Zatkulak, “New Jobs Following Aerisyn Acquisition,” WTVC, August 24, 2009, http://www.newschannel9.com/articles/aerisyn-983998-plant-taken.html; Ameron International Corp., “Form 10-K," Annual report for Securities and Exchange Commission, January 29, 2010, pp. 8, 22, http://phx.corporate-ir.net/phoenix.zhtml?c=87370&p=irol-sec; Ameron International Corp., “Ameron Wind Towers” brochure, http://www.nov.com/uploadedFiles/Business_Groups/Distribution/Wind_Towers/brochure.pdf (accessed January 18, 2012); North American Windpower, “Ventower Marks Opening Of Manufacturing Facility,” August 10, 2011, http://www.nawindpower.com/e107_plugins/content/content.php?content.8381; Kolenc, Vic, “A Little Green: El Paso Near Smallest of 'Clean' Economies,” El Paso Times, July 13, 2011, http://www.elpasotimes.com/news/ci_18465186; Kolenc, Vic, “Wind Tower Production: Canutillo Factory is Ready to Meet Demand,” El Paso Times, January 24, 2010, http://www.istockanalyst.com/article/viewiStockNews/articleid/3805023; McCurry, John W., “New Heights,” Site Selection Magazine, November 2011, http://www.siteselection.com/issues/2011/nov/kansas.cfm; Tindall Corp., “Tindall To Build Dedicated Wind Tower Base Plant In Kansas,” news release, January 18, 2010, http://www.tindallcorp.com/news/011810.html; Broadwind Energy, “Broadwind Energy Subsidiary Tower Tech Holds Ribbon-Cutting Ceremony at Texas Facility,” news release, June 9, 2009, http://www.bwen.com/pdf/44.pdf; Stiles, Mark W., written testimony submitted to the Senate Committee on Environment and Public Works, Business Opportunities and Climate Policy, hearing, May 19, 2009; pp. 4–5, http://epw.senate.gov/public/index.cfm?FuseAction=Files.View&FileStore_id=6985f489-5eea-42f4-91c6-4f29db6dfe25; “Trinity Industries Closes Railcar Plant ,” Manufacturing.net, January 29, 2009, http://www.manufacturing.net/news/2009/01/trinity-industries-closes-railcar-plant?menuid=274; North American Windpower, “Construction For RTLC Windtowers Facility Is Under Way,” October 2, 2008, http://www.nawindpower.com; Tubular Structures International Web site, http://www.tsitx.com; North American Windpower, “Gestamp, Worthington To Build Wind Tower Manufacturing Facility In Wyoming,” February 16, 2011, http://www.nawindpower.com/e107_plugins/content/content.php?content.7358; AWEA, “Windpower Outlook 2010,” http://archive.awea.org/pubs/documents/Outlook_2010.pdf; Waller, Matthew, “Martifer Leaves Wind Tower Plant,” San Angelo Standard Times, July 18, 2012, http://www.gosanangelo.com/news/2012/jul/18/martifer-out-of-hirschfeld-partnership; Otter Tail Corp., “Otter Tail Corporation to Sell DMI Industries' Property, Plant and Equipment to Trinity Industries, Inc.,” news release, June 6, 2012, http://www.ottertail.com/press/releasedetail.cfm?ReleaseID=705324; Hussmann, Peter, “Trinity Industries to Convert Some Wind Tower Manufacturing Plants to Rail Car Production,” Newton Independent, July 26, 2012, http://www.newtonindependent.com/newton_independent/2012/07/trinity-industries-to-convert-some-wind-tower-manufacturing-plants-to-rail-car-production.html; Del Franco, “More PTC Fallout: Katana Summit Will Close If It Doesn't Find A Buyer,” North American Windpower, June 13, 2012, http://www.nawindpower.com/e107_plugins/content/content.php?content.10388; Katana, “Katana Summit Seeks Buyer for Company,” June 11, 2012, http://www.katana-summit.com/pdfs/KatanaPressRelease091112.pdf; Bloomberg Businessweek Web site, http://investing.businessweek.com/research/stocks/private/snapshot.asp?privcapId=30693558 (accessed November 9, 2012); Pare, Mike, “Parent of Chattanooga wind tower maker SIAG Aerisyn is filing for insolvency,” Times Free Press, March 20, 2012, http://www.timesfreepress.com/news/2012/mar/20/aerisyn-parent-insolvent-chattanooga/?print.
III-5
U.S. PRODUCERS
The Commission sent U.S. producer questionnaires to 17 firms based on information contained in the petition and through independent staff research as to possible U.S. producers of wind towers. Six firms provided useable data on their productive operations, one firm certified that it produced only a limited number of wind towers,4 none provided incomplete data,5 two certified that they had not produced wind towers since January 1, 2009,6 and the remaining nine provided no response. Staff believes that these responses represent a substantial majority of U.S. production of wind towers. 7 8
Table III-2 lists reporting U.S. producers of wind towers, positions on the petition, their production location(s), related and/or affiliated firms, and share of reported production of wind towers in 2011. No U.S. producers are related to foreign producers of the subject merchandise and one (***) is related to a U.S. importer of the subject merchandise. In addition, one U.S. producer imports the subject merchandise.
4 Hirschfeld Energy Systems, LLC began production of wind towers at its San Angelo, TX facility in early 2011 and ramped up production with the goal of producing up to *** towers annually (with a maximum size of *** meters). This production goal was well below the previously announced goal of 400 wind towers at the time of the projects development in 2008. Hirschfeld Energy System reported ***. Hirschfeld Energy Systems response to Importers’ questionnaire and “Martifer makes a milestone,” San Angelo Standard Times, June 11, 2011, found at http://www.gosanangelo.com/news/2011/jun/11/martifermakes-amileston/, retrieved on September 11, 2012.
5 ***. 6 *** reported in the preliminary-phase investigations that while it had not produced wind towers, the firm was
trying to enter the U.S. wind tower market. The firm reported that one of the reasons it had not been able to sell any wind towers was that it was unable to compete with lower-priced wind towers imported from China and Vietnam.
7 In the preliminary phase of these investigations the Petitioners asserted that the questionnaire responses received in the preliminary phase (for which responses were also received in the final phase) represented the vast majority of U.S. production that currently exists, but that there are a number of producers which shut down and have not provided questionnaire responses. Petitioners’ postconference brief, Exh. 1, p. 10. Respondents concur that the majority of U.S. production is covered by the questionnaires received. Conference transcript, p. 130 (Feldman) and Respondent foreign producers’ postconference brief, p. 4. For additional details, see Petition, Exhibit I-3a.
8 Of the firms which did not provide questionnaire responses, only three are known to have large scale commercial production, Johnson Plate and Tower, SIAG Aerisyn, and Ventower. Based on the most recent public information available, Johnson Plate and Tower (in July 2011) forecast full year 2011 production of about 100 towers, SIAG Aerisyn produced an estimated 60 towers in 2010 (year in which it became a Vestas qualified supplier), and Ventower expected its cumulative production of wind towers to total 15 by the fall of 2012 (although in 2010 it produced an estimated 60 towers). Sources: Petition, exh. I-3a, Yung, Katherine, “Wind energy in Michigan is ‘on the edge of a cliff,’” Detroit Free Press, August 12, 2012, http://www.freep.com/article/20120812/BUSINESS06/308120133/Wind-energy-in-Michigan-is-on-the-edge-of-a-cliff-; Kolenc, Vic, “A Little Green: El Paso Near Smallest of 'Clean' Economies,” El Paso Times, July 13, 2011, http://www.elpasotimes.com/news/ci_18465186, and e-mail from ***, January 7, 2012.
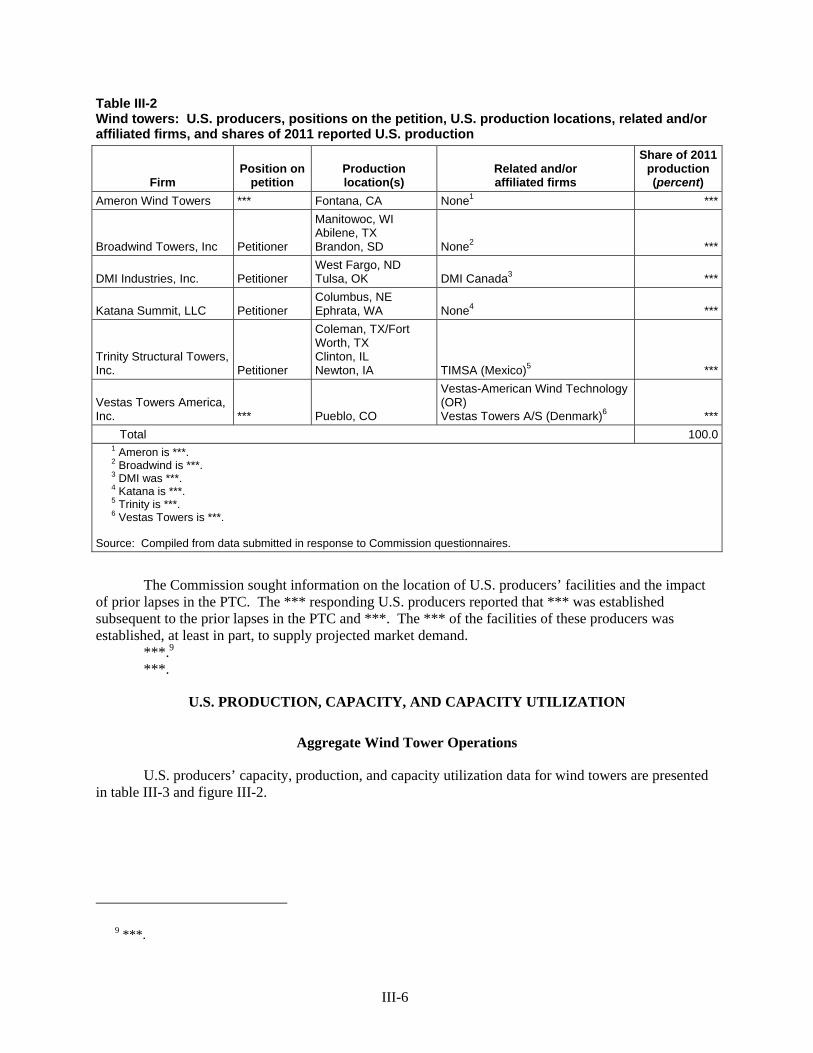
III-6
Table III-2 Wind towers: U.S. producers, positions on the petition, U.S. production locations, related and/or affiliated firms, and shares of 2011 reported U.S. production
Firm Position on
petition Production location(s)
Related and/or affiliated firms
Share of 2011 production (percent)
Ameron Wind Towers *** Fontana, CA None1 ***
Broadwind Towers, Inc Petitioner
Manitowoc, WI Abilene, TX Brandon, SD None2 ***
DMI Industries, Inc. Petitioner West Fargo, ND Tulsa, OK DMI Canada3 ***
Katana Summit, LLC Petitioner Columbus, NE Ephrata, WA None4 ***
Trinity Structural Towers, Inc. Petitioner
Coleman, TX/Fort Worth, TX Clinton, IL Newton, IA TIMSA (Mexico)5 ***
Vestas Towers America, Inc. *** Pueblo, CO
Vestas-American Wind Technology (OR) Vestas Towers A/S (Denmark)6 ***
Total 100.0 1 Ameron is ***. 2 Broadwind is ***. 3 DMI was ***. 4 Katana is ***. 5 Trinity is ***. 6 Vestas Towers is ***. Source: Compiled from data submitted in response to Commission questionnaires.
The Commission sought information on the location of U.S. producers’ facilities and the impact of prior lapses in the PTC. The *** responding U.S. producers reported that *** was established subsequent to the prior lapses in the PTC and ***. The *** of the facilities of these producers was established, at least in part, to supply projected market demand.
***.9 ***.
U.S. PRODUCTION, CAPACITY, AND CAPACITY UTILIZATION
Aggregate Wind Tower Operations
U.S. producers’ capacity, production, and capacity utilization data for wind towers are presented in table III-3 and figure III-2.
9 ***.
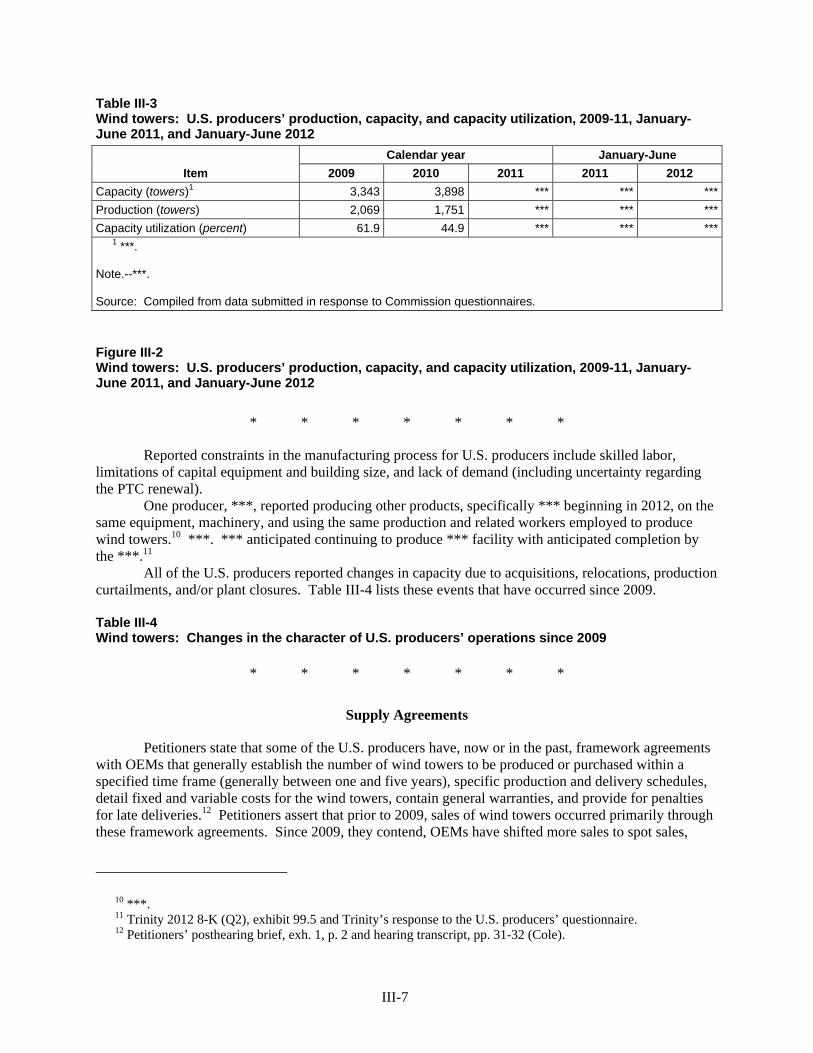
III-7
Table III-3 Wind towers: U.S. producers’ production, capacity, and capacity utilization, 2009-11, January-June 2011, and January-June 2012
Item Calendar year January-June
2009 2010 2011 2011 2012Capacity (towers)1 3,343 3,898 *** *** ***Production (towers) 2,069 1,751 *** *** ***Capacity utilization (percent) 61.9 44.9 *** *** *** 1 ***. Note.--***. Source: Compiled from data submitted in response to Commission questionnaires. Figure III-2 Wind towers: U.S. producers’ production, capacity, and capacity utilization, 2009-11, January-June 2011, and January-June 2012
* * * * * * *
Reported constraints in the manufacturing process for U.S. producers include skilled labor, limitations of capital equipment and building size, and lack of demand (including uncertainty regarding the PTC renewal).
One producer, ***, reported producing other products, specifically *** beginning in 2012, on the same equipment, machinery, and using the same production and related workers employed to produce wind towers.10 ***. *** anticipated continuing to produce *** facility with anticipated completion by the ***.11
All of the U.S. producers reported changes in capacity due to acquisitions, relocations, production curtailments, and/or plant closures. Table III-4 lists these events that have occurred since 2009.
Table III-4 Wind towers: Changes in the character of U.S. producers’ operations since 2009
* * * * * * *
Supply Agreements
Petitioners state that some of the U.S. producers have, now or in the past, framework agreements with OEMs that generally establish the number of wind towers to be produced or purchased within a specified time frame (generally between one and five years), specific production and delivery schedules, detail fixed and variable costs for the wind towers, contain general warranties, and provide for penalties for late deliveries.12 Petitioners assert that prior to 2009, sales of wind towers occurred primarily through these framework agreements. Since 2009, they contend, OEMs have shifted more sales to spot sales,
10 ***. 11 Trinity 2012 8-K (Q2), exhibit 99.5 and Trinity’s response to the U.S. producers’ questionnaire. 12 Petitioners’ posthearing brief, exh. 1, p. 2 and hearing transcript, pp. 31-32 (Cole).
III-8
although framework agreements remain in place between major OEMs and domestic producers.13 Moreover, Petitioners assert that the agreements have been subject to renegotiation.14
As noted above, the framework agreements detail the specific type and number of wind towers to be produced at specific production facilities over a specified time period. Petitioners note that in doing so, “the producer commits to reserve sufficient capacity to produce the relevant number of towers at the relevant facilities.”15 Three U.S. producers provided information on framework agreements including volume commitments.
***
*** ***.16 ***,17 ***,18 ***.19 ***.20 21
***
***,22 ***.23 *** ***. This agreement has been renegotiated in ***,24 ***,25 and ***.
***
***.26
Facility Level Wind Tower Operations
Table III-5 presents U.S. capacity, production, and capacity utilization for each of the U.S. producers’ facilities.27 28 29
13 Petitioners’ posthearing brief, exh. 1, p. 1 and hearing transcript, p. 37 (Smith). 14 Hearing transcript, p. 32 (Cole). 15 Petitioners’ posthearing brief, exh. 1, p. 3. 16 Petitioners’ posthearing brief, exh. 1, pp. 8-10. 17 ***. 18 ***. 19 ***. 20 ***. 21 Petitioners’ posthearing brief, exh. 1, pp. 11-12. 22 ***. 23 ***. 24 ***. 25 ***. 26 E-mail from ***, December 20, 2012. 27 Also noted in the table are the facilities qualified to produce wind towers in the United States for OEMs, GE
Siemens, and Vestas Towers. GE reported that ***. Siemens stated that prior to 2008 the only qualified U.S. producer was Ameron. Since then ***. Vestas Towers reported that ***. E--mail from ***, January 24, 2012, conference transcript, p. 110 (Hauer), Respondent Siemens’s postconference brief, Exh. B, e-mail from ***, January 7, 2013, and data submitted in response to Commission questionnaires,
28 Ameron did not provide useful half-yearly production data for 2009-10, so staff used the ratio of semi-annual production to annual production reported by the responding producers for these periods to estimate Ameron’s semi-annual data for 2009-10.
29 Both Broadwind and Trinity provided capacity, specifically for 2011 and January-June 2012, based on a product mix of different wind towers produced during that period (namely the addition ***). ***.
III-9
Table III-5 Wind towers: U.S. capacity, production, and capacity utilization, semi-annually, by facility, January 2009-June 2012
* * * * * * *
U.S. production capacity increased between 2009 and 2011, but was lower in January-June 2012 compared with January-June 2011. Production capacity increased in 2010 as a result of ***. The higher capacity in 2011 was largely due to ***. This increase was *** at *** and at Broadwind’s facility in Brandon, SD. After not commencing production since the completion of construction in first quarter of 2010, Broadwind initiated the process to sell this facility in the third quarter of 2011.30 These *** in January-June 2012 compared with January-June 2011.
U.S. production increased between 2009 and 2011, albeit with a decline in 2010, and was higher in January-June 2012 compared with January-June 2011. Each U.S. producer, with the exception of ***, reported increased overall production between 2009 and 2011, although production in each of the firms’ facilities generally fluctuated throughout the period. Every firm, with the exception of ***, reported declines in production in 2010 compared with 2009. Petitioners observed that demand for wind towers declined substantially in 2009 and continued to decrease into 2010 as a result of the financial crisis, which in turn affected domestic wind tower production.31 U.S. producer Trinity stated that “orders and deliveries for structural wind towers have been slow since mid-2008 when green energy companies encountered tightened credit markets coupled with lower prices for electricity and natural gas sales.”32 *** in 2011, while *** production. The company reported greater than expected operational inefficiencies with the transition in some of its facilities from 80-meter towers to 100-meter towers.33
*** in January-June 2012 compared with January-June 2011. *** reported that ***.34 Broadwind reported manufacturing inefficiencies resulting from building four different tower types.35 Trinity stated that the expiration of the federal wind energy production incentives at the end of 2012 was creating uncertainty resulting in low levels of additional orders for wind towers. Trinity noted that while long-term contracts continue to provide a foundation of work, the firm remains flexible to accommodate customer production volumes and production mix.36 In addition, Trinity stated that in the second quarter of 2012, it had begun to transition excess wind tower capacity to rail car capacity. 37
***, particularly ***. The higher overall level of production in January-June 2012 compared with January-June 2011 was at least partially attributed to the increased demand ahead of the pending expiration of the PTC.38
Most U.S. producers are able to produce wind towers up to 100 meters, limited by the capabilities of cranes, rolling, or the paint and blast booths. ***.
30 Broadwind’s response to the U.S. producer’s questionnaire and Broadwind 2011 10-Q (Q3), p. 16. 31 Conference transcript, pp. 32-33 (Barczak), petition, pp. 27-28, and Petitioners’ postconference brief, pp. 11-
12. This trend was also noted by respondents. Respondent foreign producers’ postconference brief, p. 11. 32 Trinity 2010 10-K, p. 9 and Trinity 2011 10-K, p. 10. 33 Trinity 2011 8-K (Q2), Exhibit 99.5, and Trinity 8-K (Q4), Exhibit 99.5. ***. 34 E-mail from ***, October 16, 2012. 35 “Broadwind Energy, Inc. Announces Second Quarter 2012 Results,” Broadwind press release, p. 2. 36 Trinity 2012 8-K (Q1), Exhibit 99.5. 37 Trinity 2012 8-K (Q2), Exhibit 99.5. 38 “More PTC Fallout: Katana Summit Will Close If It Doesn't Find A Buyer,” North American Wind Power,
June 13, 2012, found at http://www.nawindpower.com/e107_plugins/content/content.php?content.10388.
III-10
Monthly Wind Tower Operations
As shown in table III-6 and figure III-3, production reported by the U.S. producers fluctuated during January 2011-June 2012, with all five responding producers increasing production after February 2012.
Table III-6 Wind towers: U.S. producers’ capacity and production, monthly, January 2011 – June 2012
* * * * * * * Figure III-3 Wind towers: U.S. producers’ production, monthly, January 2011 – June 2012
* * * * * * *
2012/13 Wind Tower Operations
Five U.S. producers’ expected production based on the firms’ order book is presented in table III-7.39 Of the four U.S. producers that reported order book data, all expected production to decrease between the third quarter 2012 and the fourth quarter 2013, with substantial decline after June-December 2012.40
Table III-7 Wind towers: U.S. producers’ expected production based on order books, quarterly, July 2012 – December 2013
* * * * * * *
Table III-8 presents projected capacity, production, and U.S. shipments of three responding U.S. producers (***) under two scenarios: first, if the PTC and other federal and/or state policies that were set to expire at the end of 2012 were renewed, and second, if these policies were not renewed.41 42 U.S. producers report that demand in 2013 will be lower primarily as a result of uncertainty regarding the continuation of the PTC.43 44 ***.45 ***.
39 ***. 40 ***. 41 DMI has signed an asset purchase agreement with Trinity which will close in the fourth quarter of 2012.
“Otter Tail Corporation to Sell DMI Industries' Property, Plant and Equipment to Trinity Industries, Inc.,” Ottertail Corporation, press release, June 6, 2012. Trinity has stated that it anticipates using one of the three facilities for railcar production and a second for manufacturing storage containers (other facility being in Canada). Trinity 2012 8-K (Q3), Exhibit 99.3.
42 Katana is seeking a buyer for its facilities and will cease production in by the end of October. Moreover, Katana reported that ***. Response to staff questions, November 7, 2012, and “More PTC Fallout: Katana Summit Will Close If It Doesn't Find A Buyer,” North American Windpower, June 13, 2012, found at http://www.nawindpower.com/print.php?plugin:content.10388.
43 “Although 2012 wind energy demand is strong, the outlook is expected to weaken considerably in 2013 as the market reacts to the scheduled expiration of the Production Tax Credit that supports the U.S. wind industry.” Broadwind 2012 10-Q (Q3), p. 20; “…reduced demand for wind towers due to adverse market conditions affecting the industry, including uncertainty regarding renewal or extension of the Federal Production Tax Credit for
(…continued)
III-11
Table III-8 Wind towers: U.S. producers’ anticipated capacity, production, and U.S. shipments under two scenarios, 2002-13
* * * * * * *
U.S. PRODUCERS’ SHIPMENTS
Data on U.S. producers’ shipments of wind towers are presented in table III-9. One U.S. producer, Vestas Towers, reported internal consumption/transfers to related firms.46 U.S. producers’ U.S. shipments increased by *** percent by quantity from 2009 to 2011, and were *** percent higher in January-June 2012 compared to January-June 2011. U.S. producers’ U.S. shipments, by value, increased by *** percent from 2009 to 2011, and were *** percent higher in January-June 2012 compared to January-June 2011. Average unit values increased during 2009-11 and were higher in January-June 2012 compared with January-June 2011; factors identified by the U.S. producers include underlying input costs, product mix, and the relative level of tolling and non-tolling sales. See Part VI for more detail.47
Two U.S. producers, ***, reported exporting wind towers. ***.
Table III-9 Wind towers: U.S. producers’ shipments, by type, 2009-11, January-June 2011, and January-June 2012
* * * * * * * (…continued) investments in renewable energy resources, which is set to expire at the end of 2012.”, “Otter Tail Corporation Announces Second Quarter Earnings,” Otter Tail press release, August 6, 2012, found at http://www.ottertail.com/press/releasedetail.cfm?ReleaseID=698471; “…pending tax credit expiration has caused the wind industry to halt the majority of development for 2013 until government policy is more certain. ”, “Katana Summit Seeks Buyer for Company,” Katana Press Release, June 11, 2012, found at http://www.katana-summit.com/pdfs/KatanaPressRelease091112.pdf; “…we see a significant decline in wind tower production in 2013 as the Production Tax Credit seems likely to expire without renewal.” Trinity 2012 10-Q (Q2), exhibit 99.4; “But because of the potential lapse of the regulatory framework in the U.S., this market will probably go down 80 percent next year {2103}.”, “Vestas CEO sees US market down 80 pct in 2013,” Reuters, June 11, 2012, found at http://in.reuters.com/article/2012/06/10/vestas-us-market-idINL5E8HA2SO20120610.
44 The PTC was renewed in January 2013. In addition, the tax credit to the wind farm projects was extended to wind farms under construction by the end of 2013. “Wind Gets Production Tax Credit for Another Year With Crucial Language Change,” Greentech Media, January 2, 2013, found at http://www.greentechmedia.com/articles/read/Wind-Gets-Production-Tax-Credit-for-Another-Year-With-Crucial-Language-Chan.
45 Response to staff questions, November 8, 2012. 46 For the purposes of its determinations in the preliminary phase of these investigations, the Commission found
that the captive production provision does not apply. Utility Scale Wind Towers from China and Vietnam, USITC Publication 4304, February 2012, p. 17, fn. 99. The information collected in these final phase investigations indicate that *** . The firm reported that *** the wind towers were used only for wind turbines and that the firm *** wind towers to the merchant market. While the firm was unable to estimate the cost share accounted for by the wind towers in wind turbines, parties have estimated that wind towers typically account for *** percent of the total cost. E-mail from *** December 19, 2012, and Petitioners’ prehearing brief, p. 13 and Respondent Siemens’s prehearing brief, p. 48. In addition, as noted in Part II, most purchasers estimated the wind tower share of total cost of a wind turbine between 15 and 30 percent. As noted in Part I, the tower comprises about two-thirds of the weight of a complete turbine.
47 ***.
III-12
Table III-10 presents U.S. producers’ shipments by size in January-June 2011, July-December 2011, and January-June 2012.48 The largest share (*** percent) of wind tower shipments during this period was in the 80-89.9 meter range, with wind towers of 100 or more meters representing the second largest proportion (*** percent). All but two firms (***) reported U.S. shipments of 100 or more meter wind towers, and three firms (***) reported U.S. shipments of 50 to 79.9 meter wind towers. Three of the four firms that had U.S. shipments of wind towers of 100 meters of more (***) reported that these represented a larger share of U.S. shipments in January-June 2012 than in January-June 2011.
Table III-10 Wind towers: U.S. producers’ U.S. shipments by size, January-June 2011, July-December 2011, and January-June 2012
* * * * * * *
U.S. PRODUCERS’ INVENTORIES
Wind towers are generally produced to each OEM turbine manufacturer’s unique specifications after the specific utility scale power generation wind farm project receives financing and the turbine manufacturer awards the bid to suppliers. As a result, U.S. producers do not typically produce wind towers for inventory.49 50 Two U.S. producers, ***, reported end-of-period inventories (table III-11). ***.51
Table III-11 Wind towers: U.S. producers’ inventories, 2009-11, January-June 2011, and January- June 2012
* * * * * * *
U.S. PRODUCERS’ IMPORTS AND PURCHASES
U.S. producers’ imports and purchases of wind towers are presented in table III-12.52 Only one U.S. producer, ***, reported purchases and reported imports by a related firm. *** stated that “***.”
Table III-12 Wind towers: U.S. producers’ U.S. production, imports, and import ratios to U.S. production, 2009-11, January-June 2011, and January-June 2012
* * * * * * *
48 ***. 49 Petition, pp. 23-24. 50 U.S. producers noted that wind towers might be held in storage yards awaiting delivery arrangements, but that
the title would have already passed to the OEM. Conference transcript, pp. 48-49 (Cole, Barczak, and Janda). 51 ***. 52 The Petitioners contend that Vestas should be excluded from the domestic industry as a related party. Hearing
transcript, p. 16 (DeFrancesco) and Petitioners’ posthearing brief, pp. 6-7. Respondents argue that Vestas should not be excluded as a related party. Respondent Siemens’s posthearing brief, Commissioner’s hearing questions, p. 19, Respondent subject foreign producers’ posthearing brief, pp. 47-49, hearing transcript, p. 259 (Marshak).
III-13
U.S. EMPLOYMENT, WAGES, AND PRODUCTIVITY
The U.S. producers’ aggregate employment data for wind towers are presented in table III-13. The number of production and related workers (“PRWs”) employed by domestic wind tower producers increased between 2009-11, ending in 2011 with *** more PRWs (*** percent higher) than in 2009, and was higher in January-June 2012 compared with January-June 2011. During 2009-11, one U.S. producer (***) reported a decline in PRWs in each year, three U.S. producers (***) reported increases, and two U.S. producers (***) reported a fluctuating number of PRWs in each year, although ***. All but two U.S. producers (***) reported a higher number of PRWs in January-June 2012 than in January-June 2011.
During the period for which data were collected, two of the three U.S. producers reporting increases in PRWs opened facilities, although ***. ***, one of the two U.S. producer to report fluctuating number of PRWs, ***.53 *** reported the highest unit labor costs in each period.
Table III-13 Wind towers: U.S. producers’ employment-related data, 2009-11, January-June 2011, and January-June 2012
* * * * * * *
53 ***.

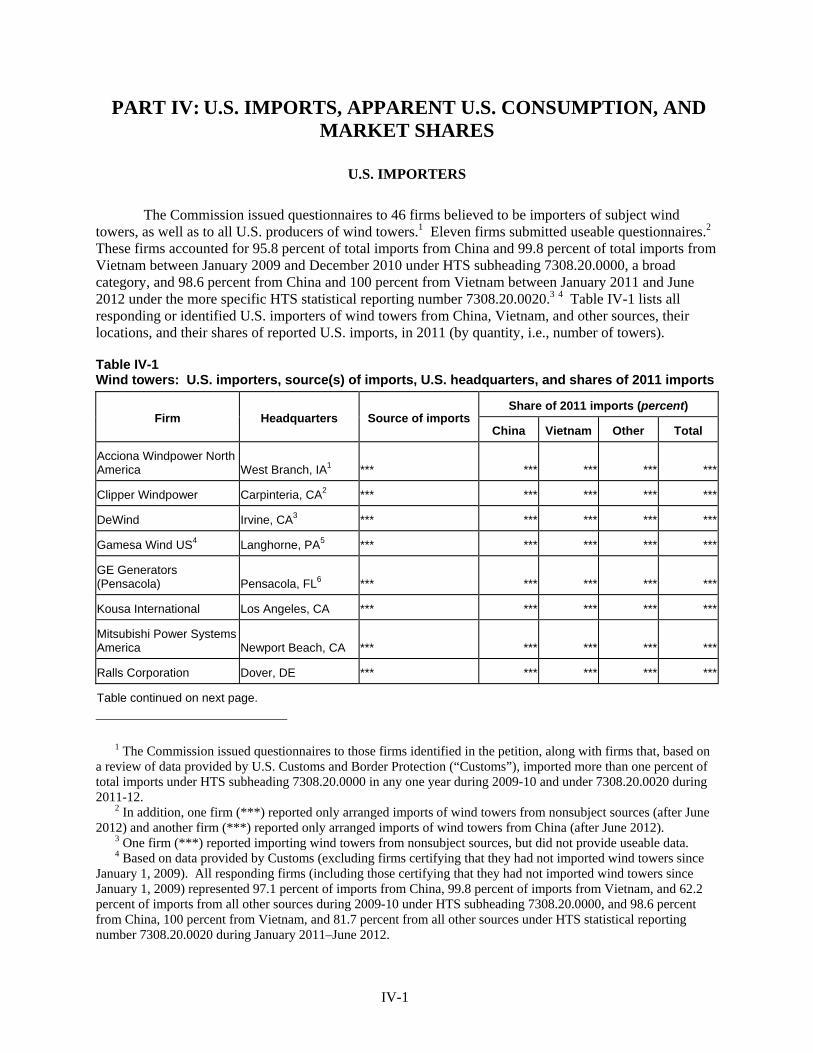
IV-1
PART IV: U.S. IMPORTS, APPARENT U.S. CONSUMPTION, AND MARKET SHARES
U.S. IMPORTERS
The Commission issued questionnaires to 46 firms believed to be importers of subject wind towers, as well as to all U.S. producers of wind towers.1 Eleven firms submitted useable questionnaires.2 These firms accounted for 95.8 percent of total imports from China and 99.8 percent of total imports from Vietnam between January 2009 and December 2010 under HTS subheading 7308.20.0000, a broad category, and 98.6 percent from China and 100 percent from Vietnam between January 2011 and June 2012 under the more specific HTS statistical reporting number 7308.20.0020.3 4 Table IV-1 lists all responding or identified U.S. importers of wind towers from China, Vietnam, and other sources, their locations, and their shares of reported U.S. imports, in 2011 (by quantity, i.e., number of towers).
Table IV-1 Wind towers: U.S. importers, source(s) of imports, U.S. headquarters, and shares of 2011 imports
Firm Headquarters Source of imports Share of 2011 imports (percent)
China Vietnam Other Total
Acciona Windpower North America West Branch, IA1 *** *** *** *** ***
Clipper Windpower Carpinteria, CA2 *** *** *** *** ***
DeWind Irvine, CA3 *** *** *** *** ***
Gamesa Wind US4 Langhorne, PA5 *** *** *** *** ***
GE Generators (Pensacola) Pensacola, FL6 *** *** *** *** ***
Kousa International Los Angeles, CA *** *** *** *** ***
Mitsubishi Power Systems America Newport Beach, CA *** *** *** *** ***
Ralls Corporation Dover, DE *** *** *** *** ***
Table continued on next page.
1 The Commission issued questionnaires to those firms identified in the petition, along with firms that, based on a review of data provided by U.S. Customs and Border Protection (“Customs”), imported more than one percent of total imports under HTS subheading 7308.20.0000 in any one year during 2009-10 and under 7308.20.0020 during 2011-12.
2 In addition, one firm (***) reported only arranged imports of wind towers from nonsubject sources (after June 2012) and another firm (***) reported only arranged imports of wind towers from China (after June 2012).
3 One firm (***) reported importing wind towers from nonsubject sources, but did not provide useable data. 4 Based on data provided by Customs (excluding firms certifying that they had not imported wind towers since
January 1, 2009). All responding firms (including those certifying that they had not imported wind towers since January 1, 2009) represented 97.1 percent of imports from China, 99.8 percent of imports from Vietnam, and 62.2 percent of imports from all other sources during 2009-10 under HTS subheading 7308.20.0000, and 98.6 percent from China, 100 percent from Vietnam, and 81.7 percent from all other sources under HTS statistical reporting number 7308.20.0020 during January 2011–June 2012.
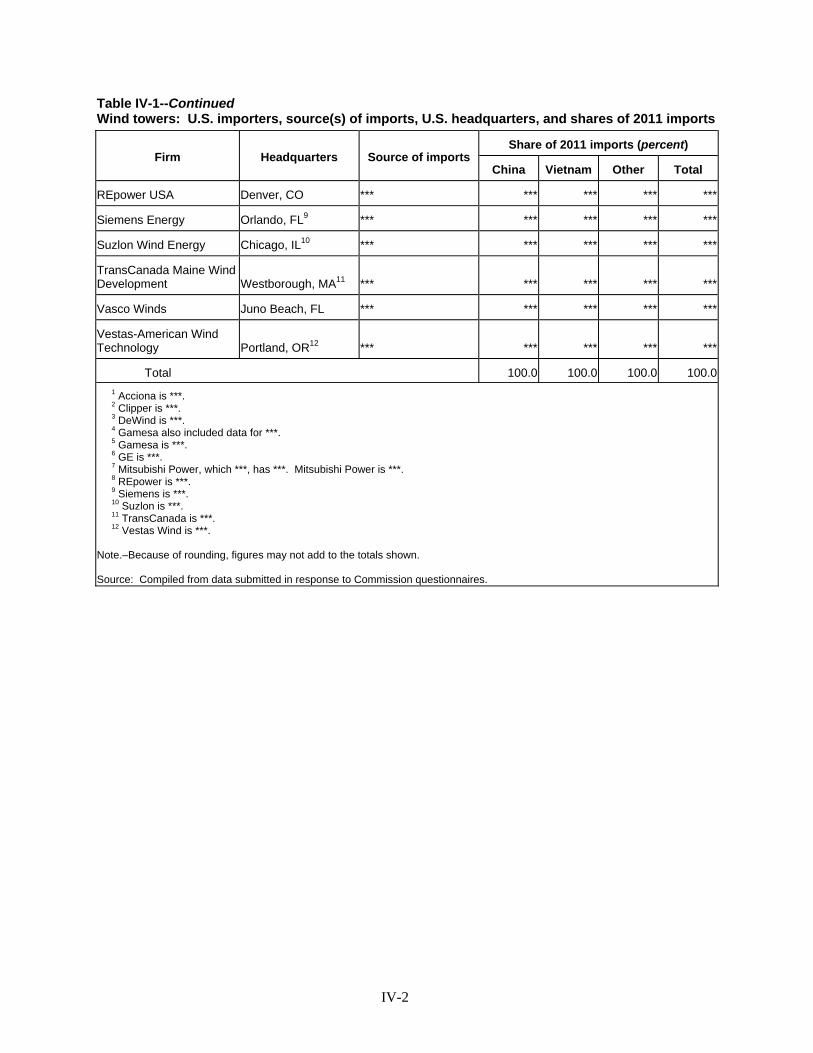
IV-2
Table IV-1--Continued Wind towers: U.S. importers, source(s) of imports, U.S. headquarters, and shares of 2011 imports
Firm Headquarters Source of imports Share of 2011 imports (percent)
China Vietnam Other Total
REpower USA Denver, CO *** *** *** *** ***
Siemens Energy Orlando, FL9 *** *** *** *** ***
Suzlon Wind Energy Chicago, IL10 *** *** *** *** ***
TransCanada Maine Wind Development Westborough, MA11 *** *** *** *** ***
Vasco Winds Juno Beach, FL *** *** *** *** ***
Vestas-American Wind Technology Portland, OR12 *** *** *** *** ***
Total 100.0 100.0 100.0 100.0
1 Acciona is ***. 2 Clipper is ***. 3 DeWind is ***. 4 Gamesa also included data for ***. 5 Gamesa is ***. 6 GE is ***. 7 Mitsubishi Power, which ***, has ***. Mitsubishi Power is ***. 8 REpower is ***. 9 Siemens is ***. 10 Suzlon is ***. 11 TransCanada is ***. 12 Vestas Wind is ***. Note.–Because of rounding, figures may not add to the totals shown. Source: Compiled from data submitted in response to Commission questionnaires.
IV-3
U.S. IMPORTS
Table IV-2 and figure IV-1 present data for U.S. imports of wind towers from China, Vietnam, and all other sources. Imports from China and Vietnam fluctuated during 2009-11. Overall, imports from China increased by *** wind towers, or *** percent, while imports from Vietnam increased by *** wind towers, or *** percent. Imports from China in January-June 2012 were *** wind towers, or *** percent, higher than in January-June 2011, while imports from Vietnam were *** wind towers, or *** percent, higher in January-June 2012 than in January-June 2011.5 6 Imports from all other sources declined each year during 2009-11, ending 59.6 percent lower, while imports from all other sources were higher in January-June 2012 compared with January-June 2011.7 The share of U.S. imports of wind towers, by quantity for which imports from China accounted increased by *** percentage points between 2009 and 2011, while the share for which imports from Vietnam accounted increased by *** percentage points and the share for which imports from nonsubject sources accounted decreased by 30.4 percentage points. The share of imports from China was higher in January-June 2012 compared with January-June 2011, while the share of imports from Vietnam and nonsubject sources was lower.
The average unit value of U.S. imports from China increased between 2009 and 2011, while the average unit value of U.S. imports from Vietnam and from nonsubject sources declined. The average unit value of U.S imports from China was lower in January-June 2012 than in January-June 2011, while the average unit value of U.S. imports from Vietnam and from nonsubject sources was higher. The average unit value of imports from Vietnam and from nonsubject sources was higher than the average unit value of imports from China in 2009, 2010, 2011, and January-June 2012.
Two importers (***) accounted for the vast majority of imports from China during the period for which data were collected, one importer (***) for a substantial majority of imports from Vietnam, and four importers (***) accounted for the vast majority of imports from all other sources.
5 Three importers (***) accounted for the higher level of imports from China in January-June 2012 compared with January-June 2011 and *** accounted for the higher level of imports from Vietnam in January-June 2012 compared with January-June 2011.
6 The three largest importers, ***, attributed higher levels of imports in 2012 at least partially to the anticipated expiration of the PTC.
7 The decline in 2010 is largely due to a substantial decrease in imports by ***. The majority of the decline in imports from nonsubject sources in 2011 was accounted for by ***, although this decrease was partially offset by increased imports by ***. *** reported greater imports in January-June 2012 compared with January-June 2011, offsetting the lower imports from *** of the *** other importers of nonsubject imports in those periods.
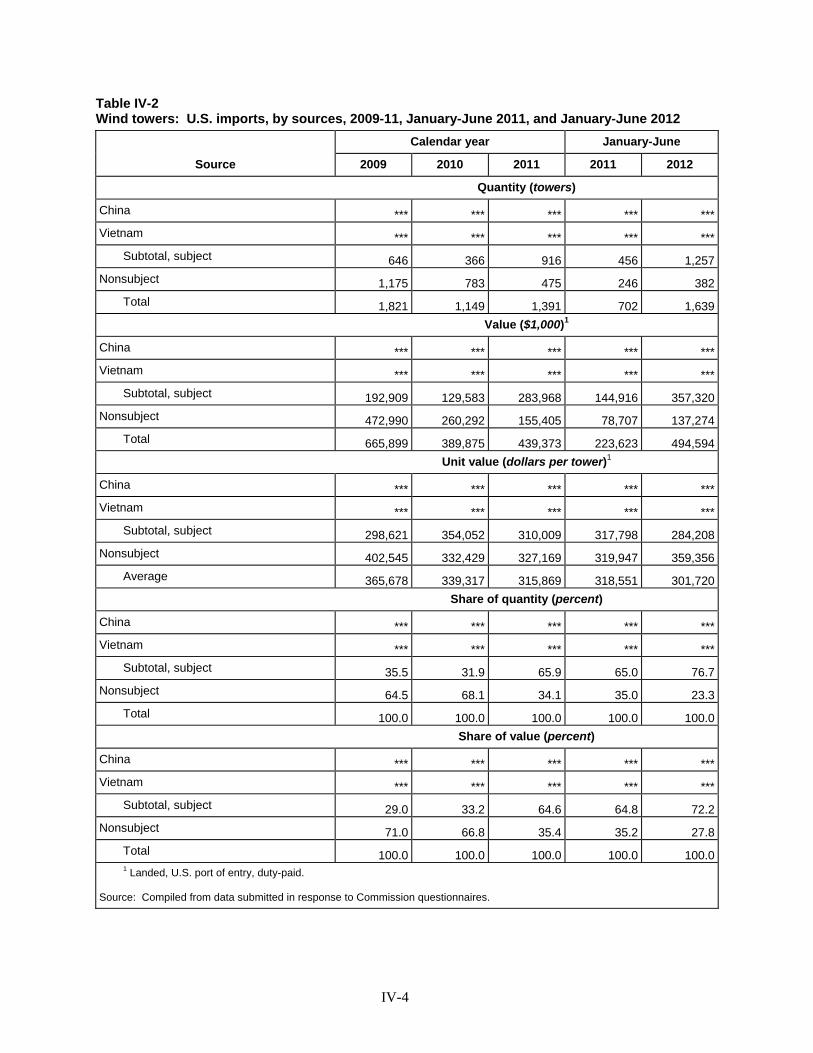
IV-4
Table IV-2 Wind towers: U.S. imports, by sources, 2009-11, January-June 2011, and January-June 2012
Source
Calendar year January-June
2009 2010 2011 2011 2012
Quantity (towers)
China *** *** *** *** ***Vietnam *** *** *** *** *** Subtotal, subject 646 366 916 456 1,257Nonsubject 1,175 783 475 246 382 Total 1,821 1,149 1,391 702 1,639 Value ($1,000)1
China *** *** *** *** ***Vietnam *** *** *** *** *** Subtotal, subject 192,909 129,583 283,968 144,916 357,320Nonsubject 472,990 260,292 155,405 78,707 137,274 Total 665,899 389,875 439,373 223,623 494,594
Unit value (dollars per tower)1
China *** *** *** *** ***Vietnam *** *** *** *** *** Subtotal, subject 298,621 354,052 310,009 317,798 284,208Nonsubject 402,545 332,429 327,169 319,947 359,356 Average 365,678 339,317 315,869 318,551 301,720 Share of quantity (percent)
China *** *** *** *** ***Vietnam *** *** *** *** *** Subtotal, subject 35.5 31.9 65.9 65.0 76.7Nonsubject 64.5 68.1 34.1 35.0 23.3 Total 100.0 100.0 100.0 100.0 100.0 Share of value (percent)
China *** *** *** *** ***Vietnam *** *** *** *** *** Subtotal, subject 29.0 33.2 64.6 64.8 72.2Nonsubject 71.0 66.8 35.4 35.2 27.8 Total 100.0 100.0 100.0 100.0 100.0 1 Landed, U.S. port of entry, duty-paid. Source: Compiled from data submitted in response to Commission questionnaires.
IV-5
Figure IV-1 Wind towers: U.S. imports, by sources, 2009-11, January-June 2011, and January-June 2012
* * * * * * *
One of the top importers of wind towers from ***, Siemens, reported that it imports as an alternative source to domestic producers. Siemens reported that prior to late 2009, it had only one qualified domestic producer, Ameron. Other U.S. producers were qualified in ***, in ***, and in ***. Siemens also stated that it imports as the domestic producers have not always been reliable suppliers (citing quality issues, failure to deliver, or inability to produce due to insufficient capacity) or did not have adequate geographic coverage (citing inadequate or non-existent qualified domestic production facilities in required geographic locations or inability to deliver to location).8
Another top importer of wind towers from ***, GE, reported that while it had *** qualified domestic producers – *** - several other factors are taken into consideration when sourcing wind towers. These include ***,9 ***,10 and ***.11
***, the leading importer of subject merchandise from ***, reported that it imports, ***, to ***. *** further noted that ***.12
Of the other top importers of imports from ***, ***.13 Table IV-3 presents data for U.S. shipments by size of wind towers imported from China,
Vietnam, and all other sources.
8 Respondent Siemens’s postconference brief, p. 9; conference transcript, p. 17 (Feldman) and pp. 110-112 (Hauer), Respondent Siemens’s prehearing brief, pp. 25-35, and response to U.S. importers’ questionnaire.
9 GE characterized the difference between the delivered price of domestic wind towers and imported wind towers as ***.
10 GE reported that *** had manufacturing process issues in 2010-11, which resulted in an inability to meet contractual, scheduled shipment commitments.
11 GE response to the importers’ questionnaire. 12 Vestas Wind response to the importers’ questionnaire. 13 “Frequently Asked Questions,” Korindo Wind, found at http://www.korindowind.com/faq, retrieved on
January 30, 2012.
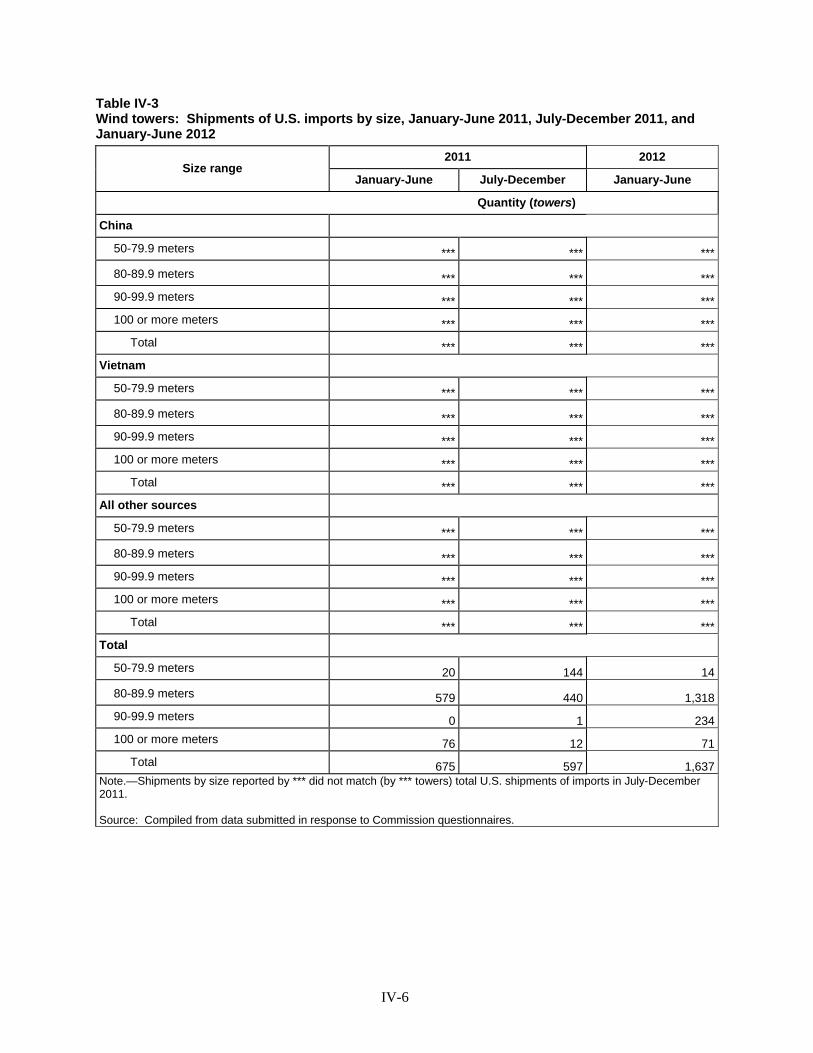
IV-6
Table IV-3 Wind towers: Shipments of U.S. imports by size, January-June 2011, July-December 2011, and January-June 2012
Size range 2011 2012
January-June July-December January-June
Quantity (towers)
China
50-79.9 meters *** *** ***
80-89.9 meters *** *** ***90-99.9 meters *** *** ***100 or more meters *** *** *** Total *** *** ***
Vietnam 50-79.9 meters *** *** ***
80-89.9 meters *** *** ***90-99.9 meters *** *** ***100 or more meters *** *** *** Total *** *** ***
All other sources 50-79.9 meters *** *** ***
80-89.9 meters *** *** ***90-99.9 meters *** *** ***100 or more meters *** *** *** Total *** *** ***
Total 50-79.9 meters 20 144 14
80-89.9 meters 579 440 1,31890-99.9 meters 0 1 234100 or more meters 76 12 71 Total 675 597 1,637
Note.—Shipments by size reported by *** did not match (by *** towers) total U.S. shipments of imports in July-December 2011. Source: Compiled from data submitted in response to Commission questionnaires.
IV-7
NEGLIGIBILITY
The statute requires that an investigation be terminated without an injury determination if imports of the subject merchandise are found to be negligible.14 Negligible imports are generally defined in the Tariff Act of 1930, as amended, as imports from a country of merchandise corresponding to a domestic like product where such imports account for less than 3 percent of the volume of all such merchandise imported into the United States in the most recent 12-month period for which data are available that precedes the filing of the petition or the initiation of the investigation. However, if there are imports of such merchandise from a number of countries subject to investigations initiated on the same day that individually account for less than 3 percent of the total volume of the subject merchandise, and if the imports from those countries collectively account for more than 7 percent of the volume of all such merchandise imported into the United States during the applicable 12-month period, then imports from such countries are deemed not to be negligible.15 Imports from China accounted for 49.9 percent of total imports of wind towers by quantity during January 2011-November 2011.16 During the same period, imports from Vietnam accounted for 16.1 percent, by quantity, of total U.S. imports of wind towers compiled from official Commerce statistics.17
CUMULATION CONSIDERATIONS
In assessing whether subject imports are likely to compete with each other and with the domestic like product with respect to cumulation, the Commission generally has considered the following four factors: (1) the degree of fungibility, including specific customer requirements and other quality-related questions; (2) presence of sales or offers to sell in the same geographic markets; (3) common channels of distribution; and (4) simultaneous presence in the market. Channels of distribution and fungibility (interchangeability) are discussed in Part II of this report. Additional information concerning geographical markets and simultaneous presence in the market is presented below.18
14 Sections 703(a)(1), 705(b)(1), 733(a)(1), and 735(b)(1) of the Act (19 U.S.C. §§ 1671b(a)(1), 1671d(b)(1), 1673b(a)(1), and 1673d(b)(1)).
15 Section 771(24) of the Act (19 U.S.C. § 1677(24)). 16 Based on HTS statistical reporting number 7308.20.0020 during January-November 2011 (the period for
which data from this relatively narrow category are available). 17 Based on questionnaire data in the preliminary phase of these investigations for the 12-month period October
2010-September 2011, imports from China accounted for *** percent of total imports of wind towers, by quantity, and imports from Vietnam accounted for *** percent.
18 Petitioners argued that subject imports from China and Vietnam should be cumulated for purposes of present material injury and threat of material injury. Petitioner’s posthearing brief, exh. 1, pp. 42-52. The respondent Siemens did not directly address cumulation, but stated that Siemens does not view the Chinese and Vietnamese imports as competing with one another, but rather as complementing the domestic market. Respondent Siemens’s postconference brief, Staff questions and answers, p. 1 and conference transcript, p. 137 (Feldman). Respondent foreign producers accept the Petitioner’s position on cumulation. Respondent foreign producers' prehearing brief, p. 12.
IV-8
Geography
With regard to geographical market overlap, the majority of U.S. importers, particularly the larger importers, reported shipping (or utilizing) wind towers for wind turbine installation in multiple regions throughout the United States. U.S. imports of wind towers from China and Vietnam entered through multiple U.S. ports of entry primarily on the West Coast and Gulf Coast. In 2011 (the last full year for which data is available), the three U.S. ports of entry with the largest volume of imports from China were: (1) Columbia-Snake, OR; (2) Houston-Galveston, TX; and (3) San Diego, CA, and in January-June 2012 those with the largest volume were (1) Houston-Galveston, TX; (2) New Orleans, LA; and (3) Columbia-Snake, OR. The three U.S. ports of entry with the majority of the volume of imports from Vietnam in 2011 were: (1) Port Arthur, TX; (2) Columbia-Snake, OR; and (3) Portland, ME, and in January-June 2012 were (1) Houston-Galveston, TX; (2) Honolulu, HI; and (3) Columbia-Snake, OR.19 The three U.S. ports of entry with the majority of the volume of imports from all other sources in 2011were: (1) Columbia-Snake, OR; (2) Laredo, TX; and (3) Los Angeles, CA, and in January-June 2012 were (1) Houston-Galveston, TX; (2) Los Angeles, CA; and (3) New Orleans, LA.20 Petitioners argue that the imported product, like domestically produced wind towers, is available nationwide. (See Part III of this report for a more detailed accounting of U.S. production locations, production history, and reported capacity).
Presence in the Market
With regard to simultaneous presence in the market, Petitioners state that imported wind towers from both China and Vietnam have been simultaneously present in the U.S. market along with domestic product during the period examined.21 Commerce statistics as well as import and bid data submitted to the Commission show that imports from China and Vietnam entered the United States in every year for which data were collected. Table IV-4 presents monthly import data for January 2011-October 2012.22 U.S. imports of wind towers from China entered in each of these months, while U.S. imports of wind towers from Vietnam entered in 13 of the 22 months through October 2012.
19 Official Commerce statistics. In 2011, 62.9 percent of imports, by quantity (metric tons) from China entered through Columbia-Snake, OR, 22.5 percent through Houston-Galveston, TX, 13.9 percent through San Diego, CA, and 0.7 percent through all other ports of entry. During January-June 2012, 13.4 percent of imports from China entered through Columbia-Snake, OR, 29.5 percent through Houston-Galveston, TX, 21.8 percent through New Orleans, LA, and 35.3 percent through all other ports.
In 2011, 63.7 percent of imports, by quantity (metric tons) from Vietnam entered through Port Arthur, TX, 16.6 percent entered through Columbia-Snake, OR, 10.5 percent through Portland, ME, and 19.7 percent through all other ports of entry. During January-June 2012, 18.3 percent of imports from Vietnam entered through Columbia-Snake, OR, 33.2 percent through Houston-Galveston, TX, 28.6 percent through Honolulu, HI, 18.3 percent through Columbia-Snake, OR, and 20.0 percent through all other ports of entry.
20 In 2011, 22.6 percent of imports, by quantity (metric tons) from all other sources entered through Columbia-Snake, OR, 22.0 percent entered through Laredo, TX, 15.7 percent through Los Angeles, CA, and 39.7 percent through all other ports of entry. During January-June 2012, 31.9 percent of imports from all other sources entered through Houston-Galveston, TX, 18.2 percent through Los Angeles, CA, 13.6 percent through New Orleans, LA, and 36.3 percent through all other ports of entry.
21 Petition, pp. 22-23. 22 Data are presented for January 2011-October 2012 as prior to 2011 imports entered under HTS subheading
7308.20.0000, a broad category that included nonsubject merchandise.
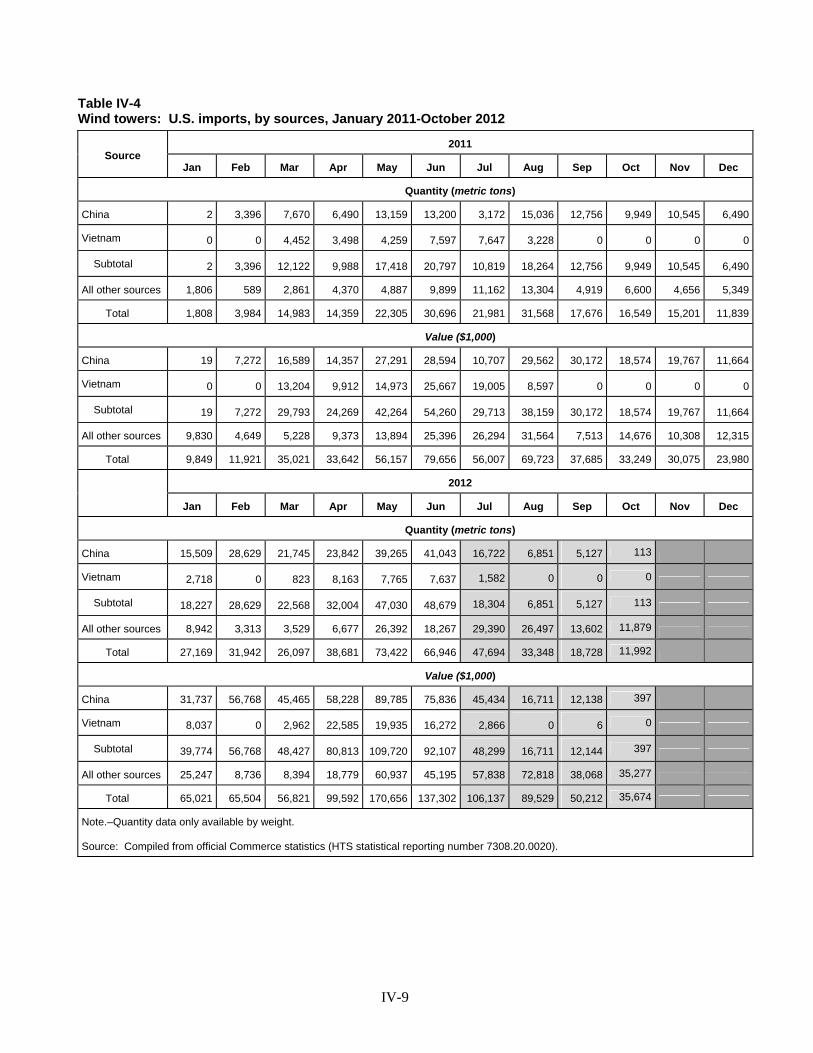
IV-9
Table IV-4 Wind towers: U.S. imports, by sources, January 2011-October 2012
Source 2011
Jan Feb Mar Apr May Jun Jul Aug Sep Oct Nov Dec
Quantity (metric tons)
China 2 3,396 7,670 6,490 13,159 13,200 3,172 15,036 12,756 9,949 10,545 6,490
Vietnam 0 0 4,452 3,498 4,259 7,597 7,647 3,228 0 0 0 0
Subtotal 2 3,396 12,122 9,988 17,418 20,797 10,819 18,264 12,756 9,949 10,545 6,490
All other sources 1,806 589 2,861 4,370 4,887 9,899 11,162 13,304 4,919 6,600 4,656 5,349
Total 1,808 3,984 14,983 14,359 22,305 30,696 21,981 31,568 17,676 16,549 15,201 11,839
Value ($1,000)
China 19 7,272 16,589 14,357 27,291 28,594 10,707 29,562 30,172 18,574 19,767 11,664
Vietnam 0 0 13,204 9,912 14,973 25,667 19,005 8,597 0 0 0 0
Subtotal 19 7,272 29,793 24,269 42,264 54,260 29,713 38,159 30,172 18,574 19,767 11,664
All other sources 9,830 4,649 5,228 9,373 13,894 25,396 26,294 31,564 7,513 14,676 10,308 12,315
Total 9,849 11,921 35,021 33,642 56,157 79,656 56,007 69,723 37,685 33,249 30,075 23,980
2012
Jan Feb Mar Apr May Jun Jul Aug Sep Oct Nov Dec
Quantity (metric tons)
China 15,509 28,629 21,745 23,842 39,265 41,043 16,722 6,851 5,127 113
Vietnam 2,718 0 823 8,163 7,765 7,637 1,582 0 0 0
Subtotal 18,227 28,629 22,568 32,004 47,030 48,679 18,304 6,851 5,127 113
All other sources 8,942 3,313 3,529 6,677 26,392 18,267 29,390 26,497 13,602 11,879
Total 27,169 31,942 26,097 38,681 73,422 66,946 47,694 33,348 18,728 11,992
Value ($1,000)
China 31,737 56,768 45,465 58,228 89,785 75,836 45,434 16,711 12,138 397
Vietnam 8,037 0 2,962 22,585 19,935 16,272 2,866 0 6 0
Subtotal 39,774 56,768 48,427 80,813 109,720 92,107 48,299 16,711 12,144 397
All other sources 25,247 8,736 8,394 18,779 60,937 45,195 57,838 72,818 38,068 35,277
Total 65,021 65,504 56,821 99,592 170,656 137,302 106,137 89,529 50,212 35,674
Note.–Quantity data only available by weight. Source: Compiled from official Commerce statistics (HTS statistical reporting number 7308.20.0020).
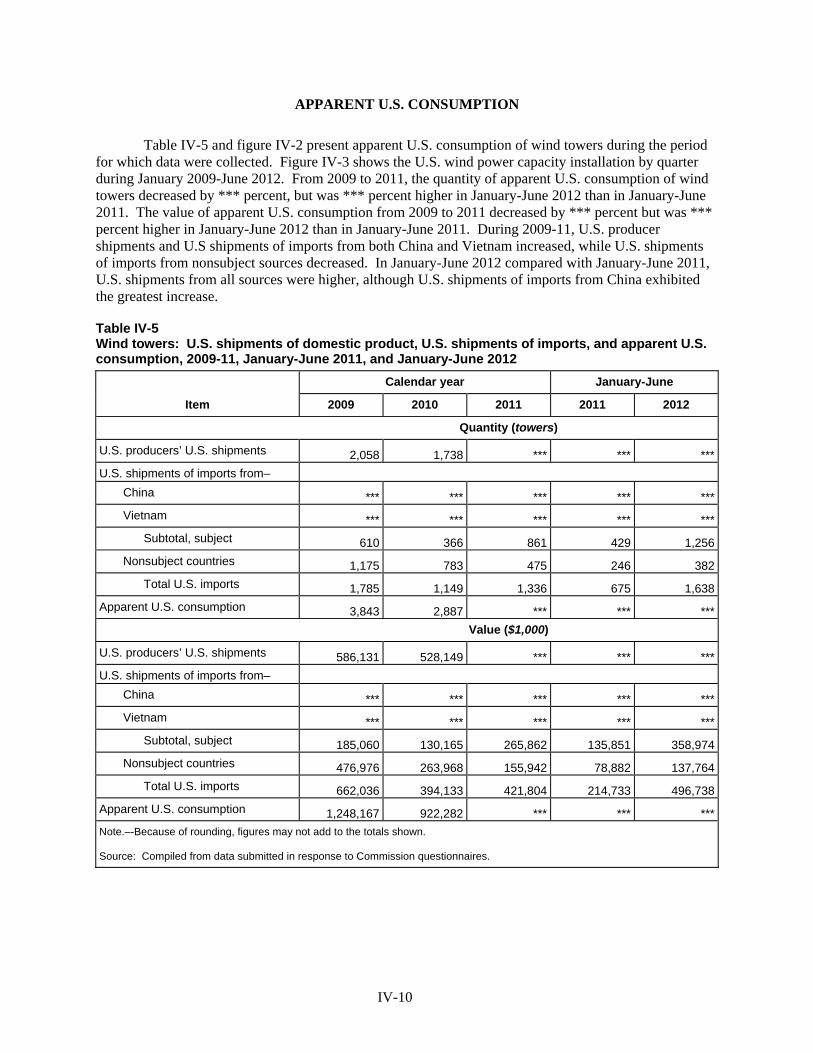
IV-10
APPARENT U.S. CONSUMPTION
Table IV-5 and figure IV-2 present apparent U.S. consumption of wind towers during the period for which data were collected. Figure IV-3 shows the U.S. wind power capacity installation by quarter during January 2009-June 2012. From 2009 to 2011, the quantity of apparent U.S. consumption of wind towers decreased by *** percent, but was *** percent higher in January-June 2012 than in January-June 2011. The value of apparent U.S. consumption from 2009 to 2011 decreased by *** percent but was *** percent higher in January-June 2012 than in January-June 2011. During 2009-11, U.S. producer shipments and U.S shipments of imports from both China and Vietnam increased, while U.S. shipments of imports from nonsubject sources decreased. In January-June 2012 compared with January-June 2011, U.S. shipments from all sources were higher, although U.S. shipments of imports from China exhibited the greatest increase.
Table IV-5 Wind towers: U.S. shipments of domestic product, U.S. shipments of imports, and apparent U.S. consumption, 2009-11, January-June 2011, and January-June 2012
Item
Calendar year January-June
2009 2010 2011 2011 2012
Quantity (towers)
U.S. producers’ U.S. shipments 2,058 1,738 *** *** ***U.S. shipments of imports from– China *** *** *** *** *** Vietnam *** *** *** *** *** Subtotal, subject 610 366 861 429 1,256 Nonsubject countries 1,175 783 475 246 382 Total U.S. imports 1,785 1,149 1,336 675 1,638Apparent U.S. consumption 3,843 2,887 *** *** *** Value ($1,000)
U.S. producers’ U.S. shipments 586,131 528,149 *** *** ***U.S. shipments of imports from– China *** *** *** *** *** Vietnam *** *** *** *** *** Subtotal, subject 185,060 130,165 265,862 135,851 358,974 Nonsubject countries 476,976 263,968 155,942 78,882 137,764 Total U.S. imports 662,036 394,133 421,804 214,733 496,738Apparent U.S. consumption 1,248,167 922,282 *** *** ***Note.–-Because of rounding, figures may not add to the totals shown. Source: Compiled from data submitted in response to Commission questionnaires.
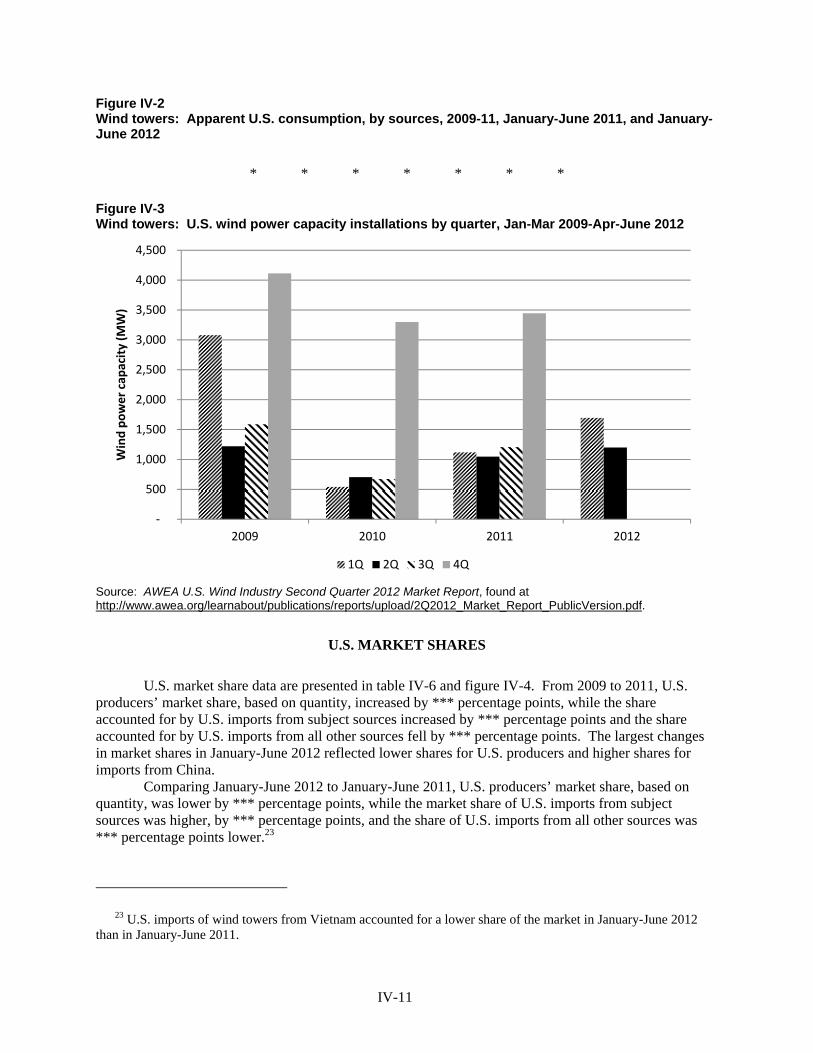
IV-11
Figure IV-2 Wind towers: Apparent U.S. consumption, by sources, 2009-11, January-June 2011, and January-June 2012
* * * * * * * Figure IV-3 Wind towers: U.S. wind power capacity installations by quarter, Jan-Mar 2009-Apr-June 2012
Source: AWEA U.S. Wind Industry Second Quarter 2012 Market Report, found at http://www.awea.org/learnabout/publications/reports/upload/2Q2012_Market_Report_PublicVersion.pdf.
U.S. MARKET SHARES
U.S. market share data are presented in table IV-6 and figure IV-4. From 2009 to 2011, U.S. producers’ market share, based on quantity, increased by *** percentage points, while the share accounted for by U.S. imports from subject sources increased by *** percentage points and the share accounted for by U.S. imports from all other sources fell by *** percentage points. The largest changes in market shares in January-June 2012 reflected lower shares for U.S. producers and higher shares for imports from China.
Comparing January-June 2012 to January-June 2011, U.S. producers’ market share, based on quantity, was lower by *** percentage points, while the market share of U.S. imports from subject sources was higher, by *** percentage points, and the share of U.S. imports from all other sources was *** percentage points lower.23
23 U.S. imports of wind towers from Vietnam accounted for a lower share of the market in January-June 2012 than in January-June 2011.
‐
500
1,000
1,500
2,000
2,500
3,000
3,500
4,000
4,500
2009 2010 2011 2012
Wind power capacity (M
W)
1Q 2Q 3Q 4Q
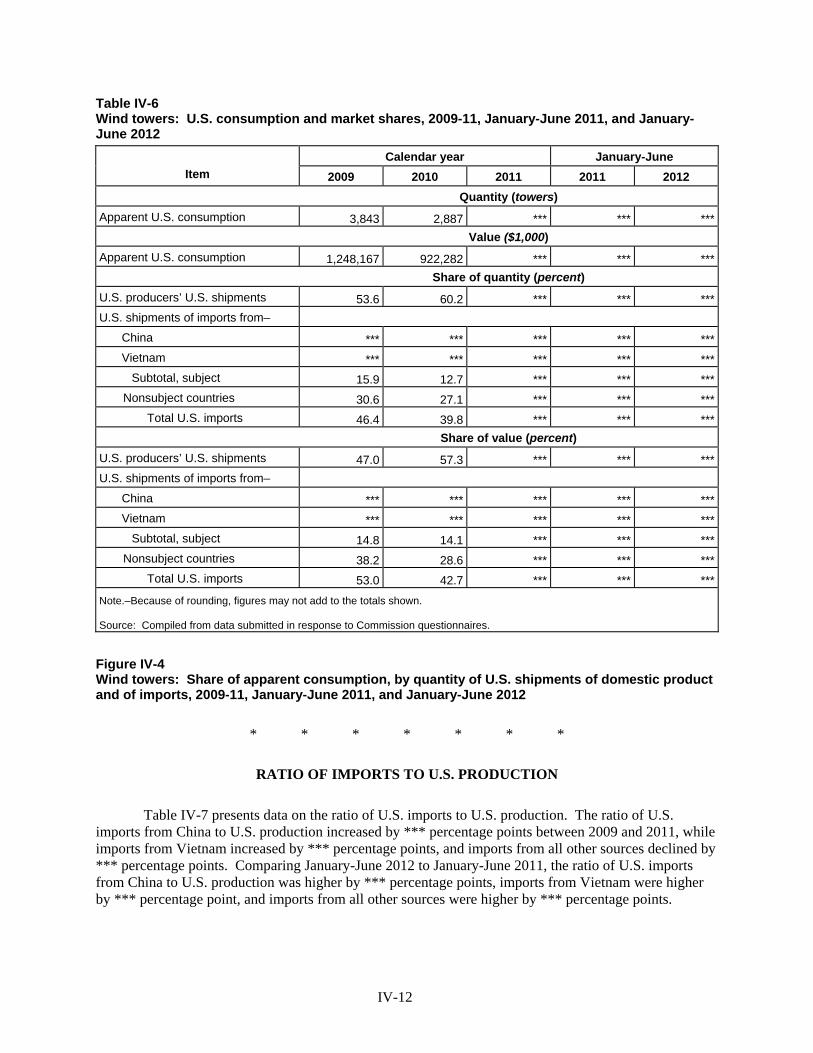
IV-12
Table IV-6 Wind towers: U.S. consumption and market shares, 2009-11, January-June 2011, and January-June 2012
Item Calendar year January-June
2009 2010 2011 2011 2012
Quantity (towers) Apparent U.S. consumption 3,843 2,887 *** *** *** Value ($1,000) Apparent U.S. consumption 1,248,167 922,282 *** *** *** Share of quantity (percent) U.S. producers’ U.S. shipments 53.6 60.2 *** *** ***U.S. shipments of imports from– China *** *** *** *** *** Vietnam *** *** *** *** *** Subtotal, subject 15.9 12.7 *** *** *** Nonsubject countries 30.6 27.1 *** *** *** Total U.S. imports 46.4 39.8 *** *** *** Share of value (percent) U.S. producers’ U.S. shipments 47.0 57.3 *** *** ***U.S. shipments of imports from– China *** *** *** *** *** Vietnam *** *** *** *** *** Subtotal, subject 14.8 14.1 *** *** *** Nonsubject countries 38.2 28.6 *** *** *** Total U.S. imports 53.0 42.7 *** *** ***Note.–Because of rounding, figures may not add to the totals shown. Source: Compiled from data submitted in response to Commission questionnaires.
Figure IV-4 Wind towers: Share of apparent consumption, by quantity of U.S. shipments of domestic product and of imports, 2009-11, January-June 2011, and January-June 2012
* * * * * * *
RATIO OF IMPORTS TO U.S. PRODUCTION
Table IV-7 presents data on the ratio of U.S. imports to U.S. production. The ratio of U.S. imports from China to U.S. production increased by *** percentage points between 2009 and 2011, while imports from Vietnam increased by *** percentage points, and imports from all other sources declined by *** percentage points. Comparing January-June 2012 to January-June 2011, the ratio of U.S. imports from China to U.S. production was higher by *** percentage points, imports from Vietnam were higher by *** percentage point, and imports from all other sources were higher by *** percentage points.
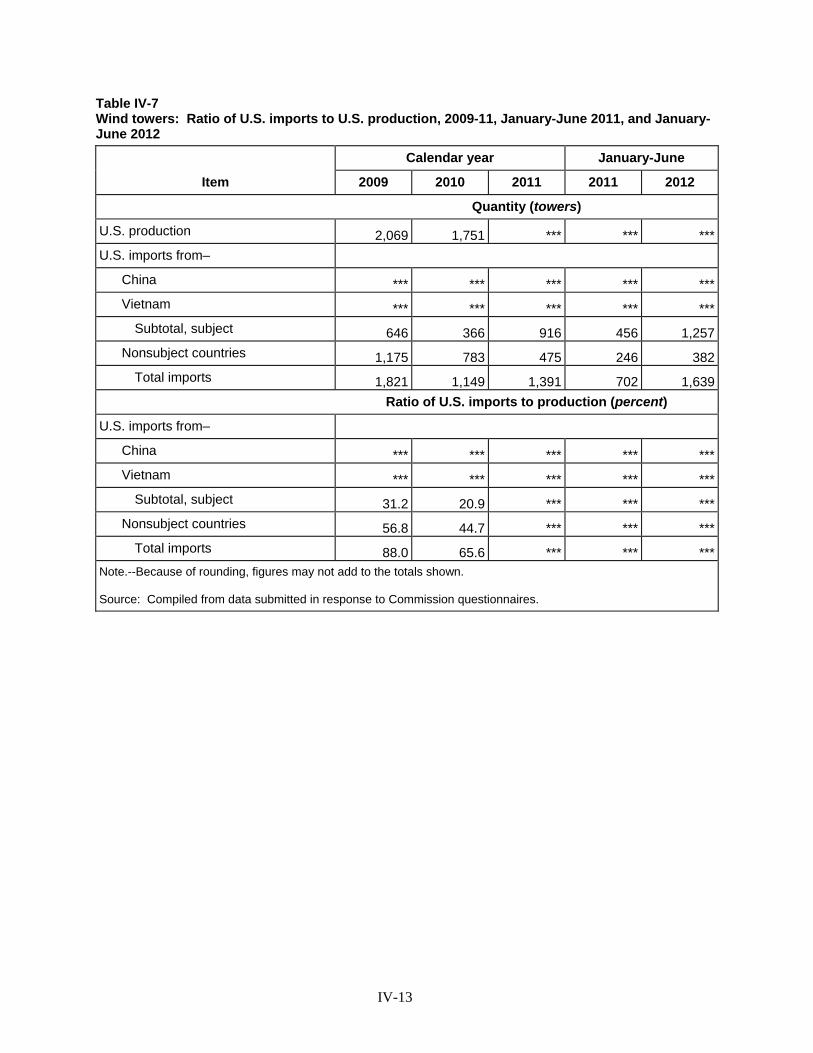
IV-13
Table IV-7 Wind towers: Ratio of U.S. imports to U.S. production, 2009-11, January-June 2011, and January-June 2012
Item
Calendar year January-June
2009 2010 2011 2011 2012
Quantity (towers)
U.S. production 2,069 1,751 *** *** ***U.S. imports from– China *** *** *** *** *** Vietnam *** *** *** *** *** Subtotal, subject 646 366 916 456 1,257 Nonsubject countries 1,175 783 475 246 382 Total imports 1,821 1,149 1,391 702 1,639 Ratio of U.S. imports to production (percent)
U.S. imports from–
China *** *** *** *** *** Vietnam *** *** *** *** *** Subtotal, subject 31.2 20.9 *** *** *** Nonsubject countries 56.8 44.7 *** *** *** Total imports 88.0 65.6 *** *** ***Note.--Because of rounding, figures may not add to the totals shown. Source: Compiled from data submitted in response to Commission questionnaires.

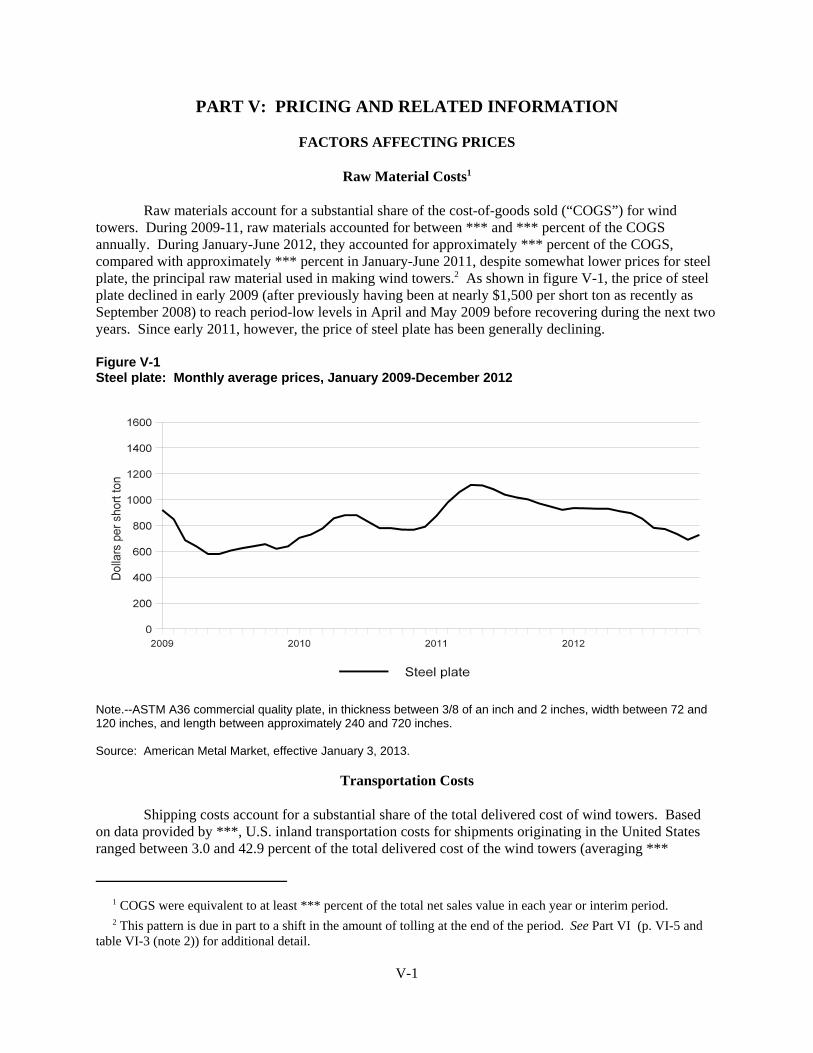
PART V: PRICING AND RELATED INFORMATION
FACTORS AFFECTING PRICES
Raw Material Costs1
Raw materials account for a substantial share of the cost-of-goods sold (“COGS”) for windtowers. During 2009-11, raw materials accounted for between *** and *** percent of the COGSannually. During January-June 2012, they accounted for approximately *** percent of the COGS,compared with approximately *** percent in January-June 2011, despite somewhat lower prices for steelplate, the principal raw material used in making wind towers.2 As shown in figure V-1, the price of steelplate declined in early 2009 (after previously having been at nearly $1,500 per short ton as recently asSeptember 2008) to reach period-low levels in April and May 2009 before recovering during the next twoyears. Since early 2011, however, the price of steel plate has been generally declining.
Figure V-1Steel plate: Monthly average prices, January 2009-December 2012
Note.--ASTM A36 commercial quality plate, in thickness between 3/8 of an inch and 2 inches, width between 72 and120 inches, and length between approximately 240 and 720 inches.
Source: American Metal Market, effective January 3, 2013.
Transportation Costs
Shipping costs account for a substantial share of the total delivered cost of wind towers. Basedon data provided by ***, U.S. inland transportation costs for shipments originating in the United Statesranged between 3.0 and 42.9 percent of the total delivered cost of the wind towers (averaging ***
1 COGS were equivalent to at least *** percent of the total net sales value in each year or interim period.
2 This pattern is due in part to a shift in the amount of tolling at the end of the period. See Part VI (p. VI-5 andtable VI-3 (note 2)) for additional detail.
V-1
percent), and U.S. inland transportation costs for wind towers imported from Asia ranged between 4.2 and25.6 percent (averaging *** percent).3 Ocean freight to the United States is typically more expensivethan U.S. inland freight, with the share of total delivered costs ranging from 15.3 to 35.3 percent, andaveraging *** percent for *** imports from Asia ***. Inland transportation costs for orders shipped fromCanada ranged between 13.1 and 41.7 percent, with an average of *** percent.
Three U.S. producers provided information on shipping distances for wind towers from theirproduction facilities. All three responding producers and three of four responding importers reported thatall or a majority of their wind towers were shipped distances of less than 1,000 miles from their facilitiesin 2011.4 ***, in contrast, reported that *** percent of its imported wind towers were shipped more than1,000 miles. In most cases, purchasers arrange and pay for shipping.5 In general, wind towers areshipped over land via truck and rail. Siemens reported that “***.”
PRICING PRACTICES
Pricing Methods
Final prices of wind towers are most commonly determined through transaction-by-transactionnegotiations and contracts resulting from competition. Prices are decided upon at the time of contractingthe project or at some prior time. Among four responding U.S. producers, three reported that they use acombination of transaction-by-transaction negotiations and contracts and one relies entirely ontransaction-by-transaction negotiations. Importers *** reported that they use transaction-by-transactionnegotiations.6 Three of four responding U.S. producers reported that they sell wind towers on an f.o.b.basis (typically on an ex-works basis).7
U.S. producers sell wind towers on both a spot and a contract basis. The producers’ short termcontracts range from three to six months with fixed prices and quantities. Most producers’ short-termcontracts do not allow price renegotiation during the contract period, except those with ***. No producernoted using meet-or-release provisions. U.S. producers’ Long-term contracts are typically for periods oftwo years or more. Both prices and quantities are fixed, though prices may be renegotiated at certaintimes during the contract period. Again, no producer noted using meet-or-release provisions.
Sales Terms and Discounts
Among four responding producers, one reported that it provides quantity discounts on sales ofwind towers, one reported that it provides discounts on a case-by-case basis, and the other two reportedthat they do not provide such discounts. Among importers, five noted not having a discount policy,whereas *** gives discounts on a transaction-by-transaction basis based on history, volume, geography,and commercial terms.8
3 ***.
4 *** stated that ***.
5 ***, arranges transportation for the wind towers it produces.
6 *** is the only importer which reported commercial sales of wind towers and did not submit a purchaser’squestionnaire. ***.
7 None of the responding importers reported stand alone sales of wind towers from China or Vietnam.
8 Despite *** importers not selling wind towers commercially as an item separate from a wind turbine, siximporters responded to this question.
V-2
PRICE DATA
Since sales agreements for wind towers are largely determined for specific wind turbine projects,purchasers were asked to submit information on all projects initiated, delivered, or ordered since January1, 2009.9 Five purchasers provided data. Since these data can be project-specific, the Commissionrequested data separately for each event, as if they were put out for bidding. ***, however, reported thatthey do not use bid competition to determine their suppliers. Each maintains its own manner of windtower procurement.
GE and Siemens, the ***, which together have accounted for *** of all imports from China andVietnam since January 2009, presented bid-type information in alternative forms. In addition, *** alsosupplied the Commission with some data regarding their purchases of wind towers. The results arediscussed separately for GE and Siemens and presented as a whole for the three smaller purchasers. GEand Siemens accounted for *** imports from China. Siemens accounted for *** of imports from Vietnam(***), but Vestas (which ***) accounted for *** of such imports during January 2009-June 2012.
GE’s Projects
GE reported that its method of procuring wind towers is based more on a logistical model than ona project-specific model. It stated that “***.” ***. As a result, GE did not report reasons why the chosensuppliers were awarded the supply contracts. GE further noted that “***.”10 GE typically purchases via***.11
Table V-1 includes selected data for each of GE’s projects. The data span 130 domestic windtower projects. Since transportation costs account for a large portion of the total cost of the finished windtower, GE relies on the delivered cost rather than the f.o.b. cost.
Table V-1Wind towers: Selected data regarding GE’s purchases since 2009
* * * * * * *
The domestic industry (either via one producer or multiple producers) supplied *** of the 130domestic wind tower projects completely. Imported Chinese wind towers supplied *** projectscompletely and nonsubject sources (***) supplied *** projects in their entirety. ***. Twenty projectswere supplied by a combination of domestic wind towers and those imported from China, *** weresupplied by a combination of domestic wind towers and wind towers from nonsubject sources, and ***projects were supplied by a combination of domestic wind towers and those imported from China andnonsubject countries. In all, ***.
9 The requested data included the project name, project location, order/RFQ month and year, delivery month andyear, the number of towers, megawatts per tower, height of tower (meters), bidder name, bidder location (country orstate), initial f.o.b. quote per tower (dollars), final f.o.b. quote per tower (dollars), final f.o.b. quote per tower (dollarsper short ton), ocean freight and duties (dollars), inland transport costs (dollars), final delivered cost (dollars),number of towers awarded, services included in bid, and reason(s) for winning/losing bid, including non-pricefactors.
10 E-mails from ***. ***.
11 ***.
V-3
Among the 130 projects, GE submitted usable, comparable pricing data for 24 projects that forwhich it used both domestically sourced wind towers and those imported from China.12 13 These 24projects accounted for *** units, and account for $*** of purchases.14 Comparative delivered costs ofthese 24 projects are summarized in table V-2. In 23 of 24 comparisons, the delivered cost of the towerswas higher for those supplied from China than those supplied by U.S. producers, with an incremental costto GE for procuring towers from China of $***.15 In *** of the *** comparisons located near the PacificCoast, the delivered Chinese price was lower than the domestic price; *** in which the Chinese deliveredprice was lower. The incremental cost of using imported wind towers on those 24 projects instead ofdomestic wind towers ranged between negative 2.0 percent (i.e., the Chinese price below the U.S. price)and positive 54.5 percent. The average incremental cost per imported Chinese tower for projects withinstallation beginning in 2009 through 2011 was 28.0 percent (***), but decreased to 11.2 percent in 2012(***).
Table V-2Wind towers: Comparisons of GE’s delivered costs for domestic and subject product
* * * * * * *
Similarly, table V-3 compares the f.o.b. prices for these 24 projects (f.o.b. ex-works price fordomestic wind towers and c.i.f. price for imported wind towers). For these 24 projects, the c.i.f. price ofwind towers imported from China was higher in 16 of 24 comparisons, with the incremental cost rangingfrom negative 12.5 to positive 44.3 percent across all 24 projects. In total, the incremental cost to GE forprocuring towers from China was $*** for the projects, ***. The average incremental cost per importedChinese tower for projects with installation beginning in 2009 through 2011 was 28.3 percent, but wasnegative 2.1 percent in 2012. Respondent foreign producers included a regional incremental analysis,breaking the projects in to Central and Pacific zones.16
Table V-3Wind towers: Comparisons of GE’s domestic producer f.o.b. costs and subject product fromChina c.i.f. costs
* * * * * * *
In the preliminary phase of these investigations, GE presented bid-type data in a different manner. It presented bid data on an f.o.b. basis by different types of towers for various, not specified deliverypoints. These data are presented on a product-specific basis in Appendix F. GE procures manufacturingcapacity for a select number of wind tower models. GE’s data cover 18 separate part numbers and up to14 types of wind towers.17 Petitioners argued that the f.o.b. product-specific data are the most relevantdata to be used for pricing comparisons because f.o.b. prices are the only prices that are negotiated and
12 For one additional project, ***, GE did not provide complete pricing data; it provided data for only one of thecountries.
13 Data presented in bold in table V-1 are projects that were supplied by both domestic and subject sources.
14 This total does not include nonsubject units and total value is on a delivered basis.
15 The incremental cost is equal to the number of towers imported from China multiplied by the differencebetween the cost of those imported towers and the cost of the towers on the same project that were sourced fromU.S. producers.
16 Respondent foreign producers’ posthearing brief, pp. 22-35.
17 Some of the description of the types, however, were extremely similar, ***.
V-4
account for the majority of the delivered price.18 Respondent Siemens and the respondent foreignproducers stated that the correct price to analyze is the delivered price due to the magnitude and thelogistical difficulties in arranging delivery.19 Respondent foreign producers further argued that ifdelivered prices are not important, domestic producers would not have agreed to build new facilitiesadjacent to installation sites.20
GE’s Estimated Delivered Costs
GE provided estimates of the delivered costs by suppliers of wind towers shipped to Kansas,Oklahoma, Colorado, California, and Oregon for certain suppliers for the projects are presented in tableV-4. These data show that because of high transportation costs, the delivered costs of domesticallyproduced wind towers at locations in the interior of the United States are sometimes lower than those ofimported wind towers, even in cases where the Chinese f.o.b. import prices are lower than U.S.producers’ ex-works prices.
Table V-4Wind towers: GE’s estimated landed costs by supplier in specified locations
* * * * * * *
Siemens’s Projects
Siemens does not use bidding competition to procure wind towers. A representative testified that“We do not take bids for towers. Because of the logistical problems in moving towers and the expense,we always, let me repeat always, try to buy as many towers as we need for a domestic project from aqualified facility closest to the project.”21 Siemens employs a business model of accepting customdesigns and orders, ordering for specific projects, and ordering wind towers only upon completion of apurchase order by a wind farm or utility.22 Siemens reported purchase data for 42 wind tower projectswith delivery dates starting in 2009. Table V-5 contains selected data regarding these transactions.
Siemens noted in its purchaser questionnaire response that its “***.” ***. A representative forSiemens testified at the hearing that it does not quote competitors’ prices during its closed bid process.23 Petitioners disagreed with this assessment and submitted an e-mail that from Siemens ***.24
The domestic industry (either via one producer or multiple producers) supplied *** of the 42domestic wind tower projects completely. Imported Chinese wind towers supplied *** projectscompletely, and imported Vietnamese and nonsubject country wind towers each supplied *** projects
18 Hearing transcript, p. 62 (Pickard), and Petitioners’ posthearing brief, exh. 1, pp. 32-41.
19 Respondent foreign producers’ posthearing brief, pp. 7 and 22-31, and hearing transcript, pp. 197 and 227(Hazel).
20 Respondent foreign producers’ posthearing brief, p. 7.
21 Hearing transcript, p. 141 (Hazel).
22 E-mail from ***. Petitioners disagreed with this assessment, contending that these towers are not custom,made-to-order items, but rather consistent model numbers and change with the evolution of technology. Hearingtranscript, pp. 58-59 (DeFrancesco) and 61 (Pickard). In their posthearing brief, however, Petitioners noted thatwind towers are large, made-to-order items (pp. 32-34).
23 Hearing transcript, pp. 182-83 (Hazel).
24 Petitioners’ posthearing brief, exh. 2. ***. OEMs may pay for the material (steel plates and flanges)themselves and also pay a conversion cost to the wind tower manufacturer. Petitioners’ posthearing brief, exh. 1, p.4 and respondent Siemens’s posthearing brief, p. 20.
V-5
completely. Among the remaining *** projects, the following source combinations supplied thepurchased wind towers: United States and China (2); United States and a nonsubject country (2); UnitedStates, Vietnam, and a nonsubject country (1); United States, China, Vietnam, and a nonsubject country(1); China and Vietnam (1); and China and a nonsubject country(1). Among these 42 projects, therewere *** instances where Siemens received pricing quotations that did not end up with the potentialsupplier receiving any wind tower orders.25
In the 17 cases where quotes were received from subject producers and one or more U.S.producers, the Chinese and Vietnamese f.o.b. quotes per unit (at the foreign port) were consistently lowerthan the U.S. producers’ f.o.b. quotes.26 However, the Chinese delivered prices were higher in 7 of 10instances and the Vietnamese delivered prices were higher in 5 of 7 instances. Comparisons of prices forprojects where both domestic and subject product were purchased are detailed in tables V-6 (deliveredprices) and V-7 (domestic f.o.b. ex works prices and import c.i.f. prices). The reasons for awarding bidsshown in table V-5 are discussed separately below, by project, for each of the years 2009 through 2012.
Table V-5Wind towers: Selected data regarding Siemens’ purchases since 2009
* * * * * * *
Table V-6Wind towers: Comparisons of Siemens’s delivered costs for domestic and subject product
* * * * * * *
Table V-7Wind towers: Comparisons of Siemens’s f.o.b. ex works costs for domestic and c.i.f. costs forsubject product
* * * * * * *
Projects with 2009 delivery dates
***. Details of these *** projects are incorporated into table V-5.
Projects with 2010 Delivery Dates
Siemens provided data regarding *** projects, which are incorporated into table V-5. For ***.
25 Details of these situations are presented in table V-5. However, these quotations may be different from what afinal price would have been, based on fluctuations in the price of steel, internals, and flanges. Accordingly, initialquotes for a tower may differ from the final purchase price. E-mail from ***. Where possible, final purchase pricesare presented in table V-5.
26 Quotes may not have been received contemporaneously. Specifically Siemens noted ***. ***. Data presentedin bold in table V-5 are projects that were supplied by both domestic and subject sources.
V-6
Projects with 2011 Delivery Dates
Siemens provided data regarding *** projects with deliveries beginning in 2011. These data arepresented in table V-5. For ***.
* * * * * * *
Projects with 2012 Delivery Dates
Siemens provided data regarding *** projects with deliveries beginning in 2012. These data areincorporated into table V-5. ***.
* * * * * * *
Other Purchasers’ Projects
Data for three other smaller purchasers (***) are presented in table V-8. One other purchaser,***, noted that it did purchase *** U.S.-produced wind towers since 2009, however, ***.27
Presented in table V-8 are selected data for the projects of the three smaller purchasers.
Table V-8Wind towers: Selected data regarding smaller purchasers’ purchases since 2009
* * * * * * *
LOST SALES AND LOST REVENUES
The petitioning firms did not provide sufficient detailed information for staff to investigatespecific lost sales or lost revenue allegations. They asserted, however, that they lost to imports fromChina and Vietnam.28 ***.
At the conference and in their postconference brief, Petitioners alleged losing a major sale knownas the Shepherds Flat project, a wind farm by GE which required 338 wind towers. Petitioners arguedthat U.S. producers were substantially underbid by Chinese producers.
GE ***.29 According to GE, ***.
27 ***.
28 Petition, p. 44.
29 Brief written statement by *** dated January 24, 2012.
V-7

PART VI: FINANCIAL EXPERIENCE OF THE U.S. PRODUCERS
BACKGROUND
Five U.S. producers reported usable financial results on their operations on wind towers.1 U.S.producers reflect a range of organizational structures with wind tower activity generally representing oneamong several business segments.2 As outlined previously in Part III of this report, the operations of theU.S. wind tower industry during the period examined reflect a number of changes: the entry of a newU.S. producer, the addition of new plants and/or capacity to existing operations, related start-up activity,acquisition/merger, the introduction of new/larger tower designs, reduced plant operations/idling, anddecisions to redeploy capacity and/or exit the wind tower market entirely. The extent to which thesechanges are reflected in the U.S. industry’s financial results is discussed below.
OPERATIONS ON WIND TOWERS
The income-and-loss data for operations on wind towers are divided into two categories:commercial sales only (table VI-1) and commercial sales and transfers/internal consumption (table VI-2)(see footnote 1). Table VI-3 presents selected company-specific financial information. Variance analysesof the financial results of wind tower operations (commercial sales only and commercial sales andtransfers/internal consumption) are presented in table VI-4 and table VI-5, respectively.3
1 All U.S. producers reported on the basis of generally accepted accounting principles (“GAAP”) with annualfinancial results reported for calendar-year periods. ***. USITC auditor notes (final). Vestas Towers, which began U.S. wind tower production in 2010, is the only U.S. producer whose overalloperations are vertically integrated. As noted in Part III of this report, ***. January 24, 2012 e-mail withattachments from counsel for Vestas Towers to USITC auditor. Trinity and Vestas Towers were selected for verification and notified on November 1, 2012. Trinity’sverification was conducted on December 10-11, 2012, with changes pursuant to verification reflected in this andother affected sections of the final staff report. Staff verification report, Trinity, pp. 2-3. In response to staff’s e-mail regarding its selection for verification, counsel for Vestas Towers informed staff that the company declined tobe verified. November 6, 2012 e-mail from counsel for Vestas Towers to USITC auditor. Because Vestas Towers’financial results for its captive production cannot be verified, staff has presented the industry’s financial results usingthe following formats: commercial sales only, which includes all U.S. producers except Vestas Towers, andcommercial sales and transfers/internal consumption, which also includes the captive production of Vestas Towers. This format is also presented in table C-2.
2 Based on public financial information, Broadwind’s overall operations consist of three reportable segments: Towers, Gearing, and Services. Broadwind 2011 10-Q (Q3), p. 14. The parent company of DMI (Otter Tail Corp.)is made up of six reportable segments: Electric, Wind Energy, Manufacturing, Construction, Plastics, and HealthServices. Otter Tail 2011 10-Q (Q3), p. 11. Trinity’s overall operations consist of five reportable segments: theRail Group, the Construction Products Group, the Inland Barge Group, the Energy Equipment Group, and theRailcar Leasing and Management Services Group. Trinity 2011 10-Q (Q3), p. 8.
3 The Commission’s variance analysis is calculated in three parts: sales variance, COGS variance, and sales,general and administrative (“SG&A”) expenses variance. Each part consists of a price variance (in the case of thesales variance) or a cost variance (in the case of the COGS and SG&A variances) and a corresponding volume(quantity) variance. The sales or cost variance is calculated as the change in unit price/cost times the new volume,while the volume variance is calculated as the change in volume times the old unit price/cost. Summarized at thebottom of the variance analysis table, the price variance is from sales, the net cost/expense variance is the sum ofthose items from COGS and SG&A, respectively, and the net volume variance is the sum of the sales, COGS, andSG&A volume variances. Since a stable overall product mix enhances the utility of the Commission’s varianceanalysis, it should be noted that wind tower product mix, as indicated in the Revenue section of this part of the
(continued...)
VI-1
Table VI-1Wind towers (commercial sales only): Results of operations, 2009-11, January-June 2011, andJanuary-June 2012
* * * * * * *
Revenue
As shown in table VI-1, commercial sales only revenue declined between 2009 and 2010followed by an increase in 2011.4 The *** increase in commercial sales and transfers/internalconsumption (table VI-2) in 2011 reflects Vestas Towers’ transition from start-up operations in 2010 tomore full-scale operations.5 With the exception of Trinity, which reported ***,6 the company-specificpattern of sales volume generally followed the same directional trend during the full-year period, but wasmixed during the interim period.7 Notwithstanding similarities in directional trend, the magnitude ofperiod-to-period changes in company-specific sales volume varied; e.g., the *** increase in sales volume
3(...continued)report, was not static during the period. Also and while indicating that average values (i.e., a primary factor in theCommission’s variance analysis) have probative value, Petitioners noted in their postconference brief that averagevalues should be interpreted with caution and that “{d}ue to the limited number of units sold, significant differencesin per-unit values for sales, costs, and expenses can emerge due to product mix (e.g., tower height, power rating),shipment timing (when contracted, when shipped), and differences in circumstances of sale.” Petitioners’postconference brief, Exh. 1, pp. 26-27. With respect to the variance analysis of commercial sales andtransfers/internal consumption (table VI-5), variances for 2009-11 and 2009-10 are not presented due to the entry ofVestas Towers in 2010 and its impact on the continuity of period-to-period volume and average values/costs.
4 Wind tower revenue is recognized primarily when wind tower production is completed and title has transferredto the customer. January 24, 2012 e-mail with attachments from counsel for Vestas Towers to USITC auditor. Petitioners’ postconference brief, Exh. 1, p. 26. ***. Ibid. While the majority of reported wind tower sales, regardless of revenue recognition method, reflects the value ofthe entire wind tower, a portion of ***. January 24, 2012 e-mail with attachments from counsel for Petitioners toUSITC auditor. ***. Trinity response to U.S. producer questionnaire, question II-5. ***.
5 Unlike the other U.S. producers, whose revenue primarily reflects sales to unrelated turbine manufacturers, ***. January 24, 2012 e-mail with attachments from counsel for Vestas to USITC auditor. In response to a transfer-valuation question raised by staff during the final phase of these investigations, Vestas Towers stated that ***. October 29, 2012 e-mail with attachments from Vestas Towers to USITC auditor.
6 Consistent with its pattern of sales volume reported in table VI-3, Trinity’s second quarter 2012 10-Q statedthat “{o}rders for structural wind towers have been slow since mid-2008 when energy development companiesencountered tightened credit markets, lower demand for electricity, and heightened competition arising fromdeclining natural gas prices and imports from foreign manufacturers.” Trinity 2012 10-Q (Q2), p. 24.
7 In addition to other factors affecting the pattern of overall wind tower revenue, the relevant segment revenue ofBroadwind, DMI (parent company Otter Tail Corp.), and Trinity were all reportedly impacted to varying degrees bylower wind tower sales/production levels in 2010. Broadwind 2010 10-K, p. 31. Otter Tail 2010 10-K, p. 47. Trinity 2010 10-K, p. 27. Similarly, higher reported wind tower sales/production volume in 2011 is consistent withrelevant segment results and other public information. Otter Tail 2011 10-K, p. 45. Broadwind 2011 10-K, p. 32. The mixed pattern of sales volume in interim 2012 compared to interim 2011 is also generally consistent withsegment information: (increasing sales volume) Otter Tail 2012 10-Q (Q2), p. 39; (decreasing sales volume)Broadwind 2012 10-Q (Q2), p. 24 and Trinity 2012 10-Q (Q2), p. 28.
VI-2
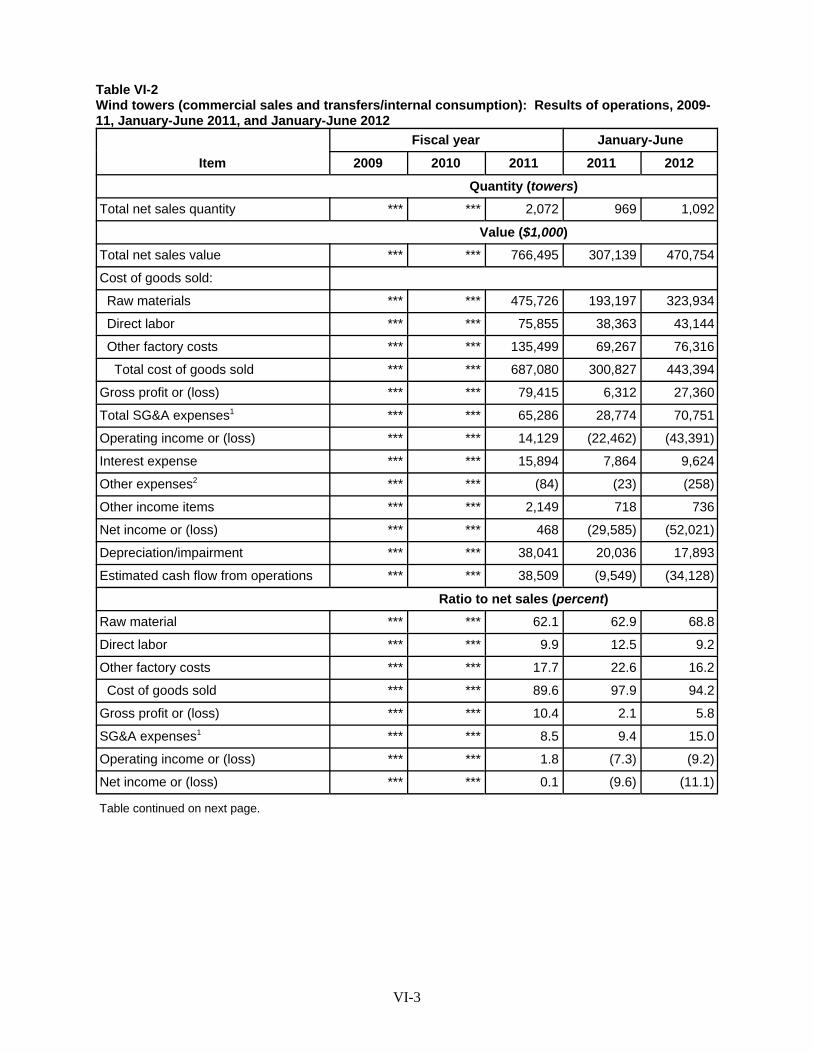
Table VI-2Wind towers (commercial sales and transfers/internal consumption): Results of operations, 2009-11, January-June 2011, and January-June 2012
Item
Fiscal year January-June
2009 2010 2011 2011 2012
Quantity (towers)Total net sales quantity *** *** 2,072 969 1,092
Value ($1,000)Total net sales value *** *** 766,495 307,139 470,754
Cost of goods sold:
Raw materials *** *** 475,726 193,197 323,934
Direct labor *** *** 75,855 38,363 43,144
Other factory costs *** *** 135,499 69,267 76,316
Total cost of goods sold *** *** 687,080 300,827 443,394
Gross profit or (loss) *** *** 79,415 6,312 27,360
Total SG&A expenses1 *** *** 65,286 28,774 70,751
Operating income or (loss) *** *** 14,129 (22,462) (43,391)
Interest expense *** *** 15,894 7,864 9,624
Other expenses2 *** *** (84) (23) (258)
Other income items *** *** 2,149 718 736
Net income or (loss) *** *** 468 (29,585) (52,021)
Depreciation/impairment *** *** 38,041 20,036 17,893
Estimated cash flow from operations *** *** 38,509 (9,549) (34,128)
Ratio to net sales (percent)Raw material *** *** 62.1 62.9 68.8
Direct labor *** *** 9.9 12.5 9.2
Other factory costs *** *** 17.7 22.6 16.2
Cost of goods sold *** *** 89.6 97.9 94.2
Gross profit or (loss) *** *** 10.4 2.1 5.8
SG&A expenses1 *** *** 8.5 9.4 15.0
Operating income or (loss) *** *** 1.8 (7.3) (9.2)
Net income or (loss) *** *** 0.1 (9.6) (11.1)
Table continued on next page.
VI-3
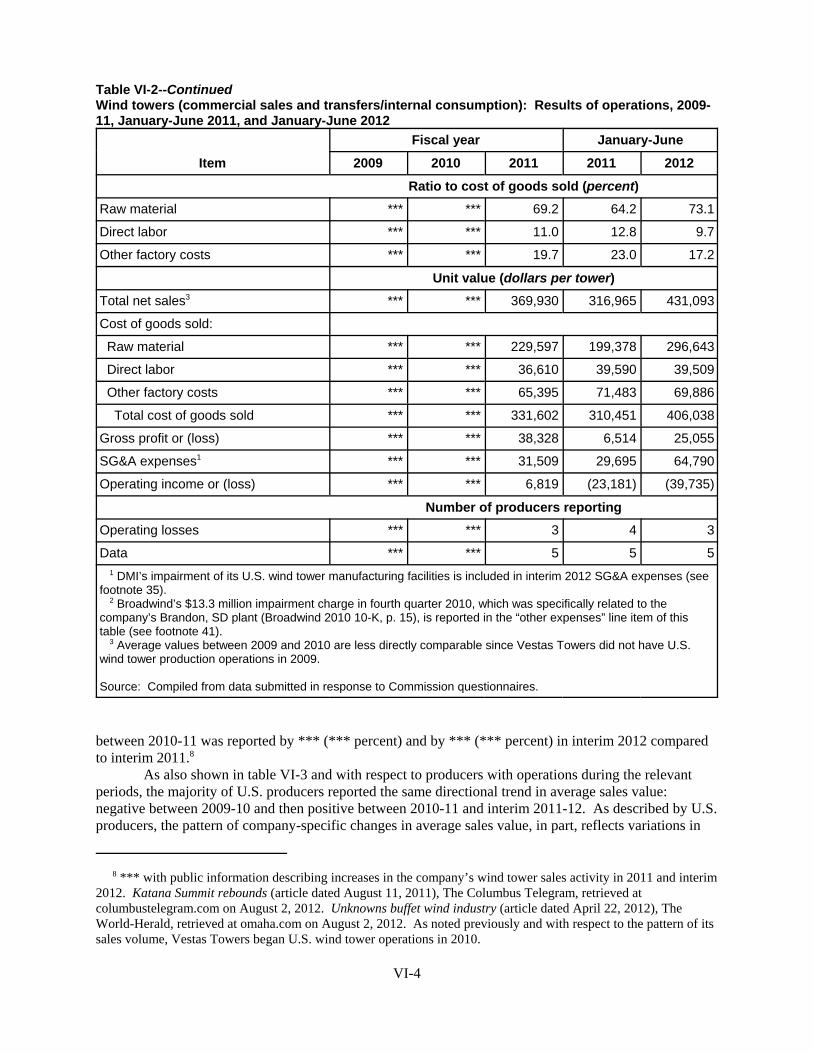
Table VI-2--ContinuedWind towers (commercial sales and transfers/internal consumption): Results of operations, 2009-11, January-June 2011, and January-June 2012
Item
Fiscal year January-June
2009 2010 2011 2011 2012
Ratio to cost of goods sold (percent)Raw material *** *** 69.2 64.2 73.1
Direct labor *** *** 11.0 12.8 9.7
Other factory costs *** *** 19.7 23.0 17.2
Unit value (dollars per tower)Total net sales3 *** *** 369,930 316,965 431,093
Cost of goods sold:
Raw material *** *** 229,597 199,378 296,643
Direct labor *** *** 36,610 39,590 39,509
Other factory costs *** *** 65,395 71,483 69,886
Total cost of goods sold *** *** 331,602 310,451 406,038
Gross profit or (loss) *** *** 38,328 6,514 25,055
SG&A expenses1 *** *** 31,509 29,695 64,790
Operating income or (loss) *** *** 6,819 (23,181) (39,735)
Number of producers reportingOperating losses *** *** 3 4 3
Data *** *** 5 5 5 1 DMI’s impairment of its U.S. wind tower manufacturing facilities is included in interim 2012 SG&A expenses (seefootnote 35). 2 Broadwind’s $13.3 million impairment charge in fourth quarter 2010, which was specifically related to thecompany’s Brandon, SD plant (Broadwind 2010 10-K, p. 15), is reported in the “other expenses” line item of thistable (see footnote 41). 3 Average values between 2009 and 2010 are less directly comparable since Vestas Towers did not have U.S.wind tower production operations in 2009.
Source: Compiled from data submitted in response to Commission questionnaires.
between 2010-11 was reported by *** (*** percent) and by *** (*** percent) in interim 2012 comparedto interim 2011.8
As also shown in table VI-3 and with respect to producers with operations during the relevantperiods, the majority of U.S. producers reported the same directional trend in average sales value:negative between 2009-10 and then positive between 2010-11 and interim 2011-12. As described by U.S.producers, the pattern of company-specific changes in average sales value, in part, reflects variations in
8 *** with public information describing increases in the company’s wind tower sales activity in 2011 and interim2012. Katana Summit rebounds (article dated August 11, 2011), The Columbus Telegram, retrieved atcolumbustelegram.com on August 2, 2012. Unknowns buffet wind industry (article dated April 22, 2012), TheWorld-Herald, retrieved at omaha.com on August 2, 2012. As noted previously and with respect to the pattern of itssales volume, Vestas Towers began U.S. wind tower operations in 2010.
VI-4
Table VI-3Wind towers (commercial sales and transfers/internal consumption): Results of operations, by firm, 2009-11,January-June 2011, and January-June 2012
* * * * * * *
Table VI-4Wind towers (commercial sales only): Variance analysis of financial results, 2009-11, January-June 2011, and January-June 2012
* * * * * * *
product mix, as well as changes in primary input costs.9 ***, which reported a *** in its interim 2012average sales value compared to interim 2011, largely attributed this pattern to an increase in ***, as wellas a shift in product mix to taller towers.10 Similarly, ***, which also reported *** in its average salesvalue, indicated that this pattern, at least in part, reflects a shift in product mix as the companyproduced/sold taller *** meter towers after reportedly being priced out of the *** meter tower market bysubject imports.11 *** also attributed changes in its average sales value to product mix, as well aschanges in underlying prices in order to pass through higher raw material costs.12 In addition to notingthat its prices were impacted by subject imports, *** stated that its averages sales value was impacted byboth OEM designs and changes in the cost of important inputs such as steel. By way of example, ***.13
Cost of Goods Sold and Gross Profit or (Loss)
As described previously in this report, while discrete steel plate represents the single mostimportant wind tower raw material cost, raw materials also include other items such as forgings, electricaland mechanical components, and paint.14 During the period examined and with respect to commercialsales only (see table VI-1), the cost of raw materials ranged from a low of *** percent of total COGS in2010 to a high of *** percent in both 2009 and interim 2012.15 As shown in both table VI-1 and table VI-2, average raw material cost and sales value shared the same directional trend which, at least in part,
9 See, e.g., Broadwind’s 2010 10-K which states that “{t}he decrease in revenues was primarily attributable to an18% decline in our Towers’ segment revenue due mainly to a reduction in the price of the steel component includedin the overall tower section price compared to the prior year.” Broadwind 2010 10-K, p. 29.
10 ***.
11 October 24, 2012 *** response to USITC auditor follow-up questions.
12 October 31, 2012 *** response to USITC auditor follow-up questions.
13 October 24, 2012 *** response to USITC auditor follow-up questions.
14 Conference transcript, p. 24, pp. 25-26, p. 27 (Janda).
15 Inclusive of Vestas Towers (see table VI-2), raw material costs ranged from *** percent of total COGS ininterim 2011 to *** percent of total COGS in interim 2012. For the period it had operations, Vestas Towers reportedthe ***. Vestas Towers U.S. producer questionnaire, responses to III-7 and III-8. ***. Staff verification report,Trinity, pp. 7-8.
VI-5
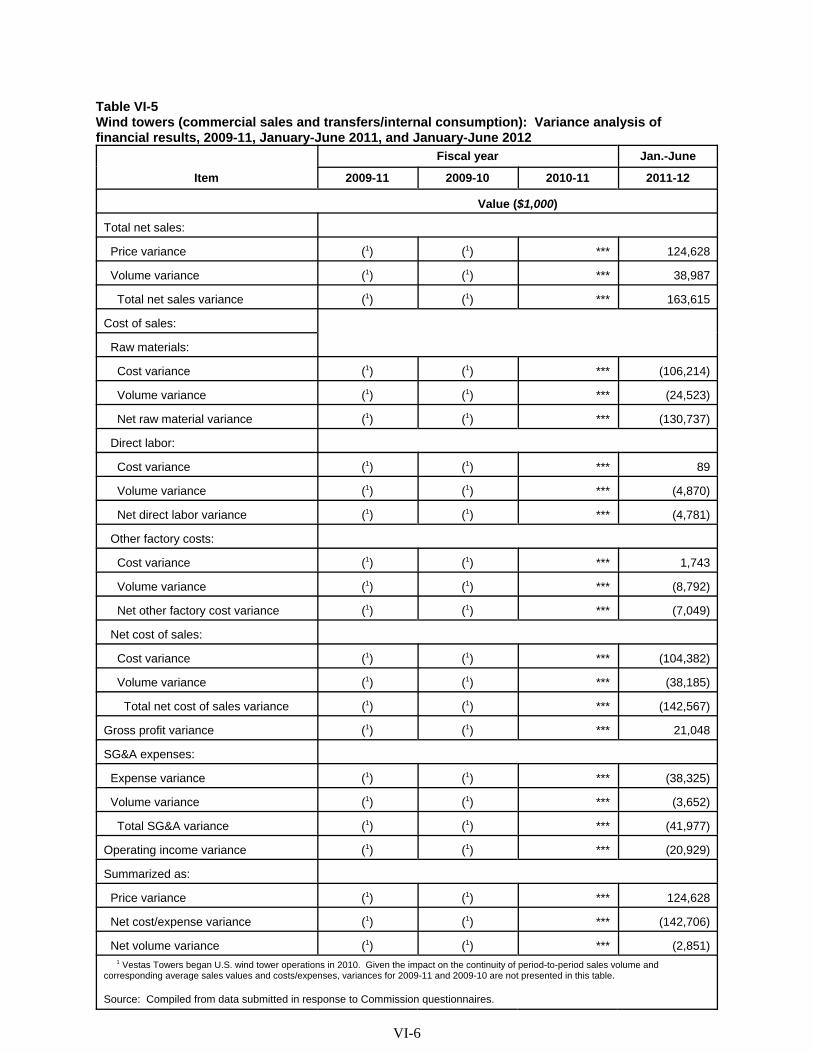
Table VI-5Wind towers (commercial sales and transfers/internal consumption): Variance analysis offinancial results, 2009-11, January-June 2011, and January-June 2012
Item
Fiscal year Jan.-June
2009-11 2009-10 2010-11 2011-12
Value ($1,000)
Total net sales:
Price variance (1) (1) *** 124,628
Volume variance (1) (1) *** 38,987
Total net sales variance (1) (1) *** 163,615
Cost of sales:
Raw materials:
Cost variance (1) (1) *** (106,214)
Volume variance (1) (1) *** (24,523)
Net raw material variance (1) (1) *** (130,737)
Direct labor:
Cost variance (1) (1) *** 89
Volume variance (1) (1) *** (4,870)
Net direct labor variance (1) (1) *** (4,781)
Other factory costs:
Cost variance (1) (1) *** 1,743
Volume variance (1) (1) *** (8,792)
Net other factory cost variance (1) (1) *** (7,049)
Net cost of sales:
Cost variance (1) (1) *** (104,382)
Volume variance (1) (1) *** (38,185)
Total net cost of sales variance (1) (1) *** (142,567)
Gross profit variance (1) (1) *** 21,048
SG&A expenses:
Expense variance (1) (1) *** (38,325)
Volume variance (1) (1) *** (3,652)
Total SG&A variance (1) (1) *** (41,977)
Operating income variance (1) (1) *** (20,929)
Summarized as:
Price variance (1) (1) *** 124,628
Net cost/expense variance (1) (1) *** (142,706)
Net volume variance (1) (1) *** (2,851) 1 Vestas Towers began U.S. wind tower operations in 2010. Given the impact on the continuity of period-to-period sales volume andcorresponding average sales values and costs/expenses, variances for 2009-11 and 2009-10 are not presented in this table.
Source: Compiled from data submitted in response to Commission questionnaires.
VI-6
reflects provisions for the pass-through of raw material costs.16 17 However, changes in product and salesmix, such as ***, as noted above, also impacted average sales value and corresponding raw materialcosts. As described in footnote 24, the increase in ***’s 2011 raw material cost also includes ***.
Other factory costs and direct labor are the second and third largest components of COGS, respectively. During the period examined and with respect to commercial sales only (table VI-1), otherfactory costs ranged from a low of *** percent of total COGS in 2009 to a high of *** percent in 2010,while direct labor ranged from a low of *** percent in 2009 to a high of *** percent in interim 2011.18 With regard to company-specific average direct labor costs, ***. As shown in table VI-3, however,Vestas Towers reported a *** in interim 2011 which the company, in part, attributed to the timing/flow ofoperations in the first and second-half of that year.19
Notwithstanding differences in product and sales mix, as well as changes in underlying costs, thedirectional trend of company-specific average other factory costs (positive and negative) was generallyconsistent with corresponding increases and decreases in sales/production volume; e.g., ***.20
Period-to-period changes in the level of average other factory costs also reflect events/activitythat occurred both prior to and during the period examined: DMI, Katana, and Trinity, which added newfacilities during 2008 (DMI (Tulsa, OK), Katana (Columbus, NE), Trinity (Newton, IA)), reported *** in2009 (see table VI-3).21 22 In contrast, Broadwind began start-up operations at a new plant in Abilene, TX
16 Conference transcript, p. 64 (Cole). With regard to volatility in steel input costs in general during the period,Trinity stated in its 2011 10-K that “{w}e often use contract-specific purchasing practices, existing suppliercommitments, contractual price escalation provisions, and other arrangements with our customers, to mitigate theeffect of this volatility on our operating profits for the year.” Trinity 2011 10-K, p. 7. DMI’s parent company statedin its 2010 10-K that it “ . . . attempts to mitigate the risk of increases in steel costs by pricing contracts to recoverthe cost of steel purchased to meet contract requirements at initiation of the contract.” Otter Tail 2010 10-K, p. 23.
17 With regard to the purchase of raw materials, petitioners’ postconference brief provided the followingdescription for the petitioning companies: ***. Petitioners’ postconference brief, Exh. 1, pp. 27-28.
18 Inclusive of Vestas Towers (see table VI-2), the trend is somewhat different which, to a large extent, appears toreflect Vestas Towers’ increasing production and sales volume as the company transitioned from start-up operationsin 2010 to more full-scale operations in 2011 and interim 2012. As shown in table VI-2, other factory costs rangedfrom *** percent of total COGS in interim 2012 to *** percent of total COGS in 2010, while direct labor rangedfrom *** percent of total COGS in interim 2012 to *** percent in interim 2011.
19 As described by Vestas Towers, ***. October 29, 2012 e-mail with attachments from counsel for VestasTowers to USITC auditor.
20 Staff notes that “other factory costs” represent a combination of fixed, variable, and mixed (semi-fixed/semi-variable) costs which differ by company based on factors such as manufacturing operations, product mix, andcompany-specific accounting choices regarding cost assignment. At the staff conference, wind tower productionoperations were described as highly capital intensive (conference transcript, p. 31 (Barczak)) which generallyindicates that, all things being equal, it is reasonable to expect that changes in capacity utilization and correspondingfixed cost absorption will have a discernible impact on the overall level of average other factory costs. As indicatedin footnote 28, ***.
21 See Part III for more detail regarding the specific plants operated by each U.S. producer and their dispositionduring the period examined. In late 2009, Katana reportedly expanded the Columbus, NE plant. Operations atKatana’s other plant, located in Ephrata, WA, reportedly fluctuated and the plant itself appears to have beeneffectively idled during parts of the period examined. Petitioners’ postconference brief, Exh. 4 (Katana affidavit), p.2. Public information indicates that during interim 2012 activity at the Ephrata, WA plant increased somewhat. Katana Hiring Workers in Ephrata, Columbia Basin Herald (article dated January 29, 2012), retrieved atcolumbiabasinherald.com on August 2, 2012.
22 ***. Staff verification report, Trinity, p. 4. ***. Staff verification report, Trinity, p. 3.
VI-7
in 2009 and, as shown in table VI-3, the company’s average other factory costs in that year was *** of theperiod.23 Vestas Towers, which began operations in 2010, reported its *** average other factory costs inthat year which is generally consistent with start-up operations. ***.24 25 The subsequent ***, in largepart, explains the *** in the company’s gross profitability in interim 2012.26 In addition to the presumedimpact of *** in sales volume, the *** of Trinity’s average other factory costs in 2011 and interim 2012also reflects transition issues related to the production of larger wind towers.27 28 Similarly, and inaddition to *** in Broadwind’s average other factory costs in interim 2012 in part reflects inefficiencies
23 In its 2009 10-K and with respect to its 2009 Tower segment operating results, Broadwind specifically notesproduction inefficiencies, as well as increased travel and administrative expenses of approximately $3.4 millionassociated with the start-up of its Abilene, TX facility. Broadwind 2009 10-K, p. 32. While construction ofBroadwind’s Brandon, SD plant began in 2008 and was completed in early 2010, other factory costs specific to thisplant (or COGS in general) are not reflected in the company’s financial results because Broadwind did notcommission this plant (see footnote 41 regarding Broadwind’s impairment related to this facility).
24 ***. January 24, 2012 e-mail with attachments from counsel for Petitioners to USITC auditor. ***. Ibid. According to an article which described the latter issue, “{i}n December {2010}, the two companies {DMI andEvraz (the steel plate supplier)} allegedly entered into an agreement for Evraz to supply more than 14,300 tons ofsteel plate to DMI by early January {2011} . . . DMI needed the steel by mid-February to fill an order for 85 windtowers for the unnamed customer . . . DMI alleges that Evraz failed to fulfill the order, forcing it to buy steel fromother sources for $1.4 million more than it would have paid Evraz.” Evraz NA sued by wind tower manufacturer,Metal Bulletin Daily, March 4, 2011, issue 252.
25 The ***, as indicated in table VI-3, is generally consistent with the description of the Wind Energy segmentfinancial results in that year. As described by DMI’s parent company, “. . . our manufacturer of wind towers,recorded increased costs in the first half of 2011 related to productivity losses due to rework and underutilization ofplant capacity and outsourced quality control costs and a $3.1 million pre-tax asset impairment charge related to theidling of its Fort Erie, Ontario plant in the fourth quarter of 2011. DMI’s operating loss for the second half of 2011, including the $3.1 million asset impairment charge, was $8.3 million less than in the second half of 2010. Thereduction in operating losses for the comparable six-month periods was the result of improved productivity,stabilized production, more efficient resource allocation and elimination of the need for outsourced quality assurancestaffing.” Otter Tail 2011 10-K, p. 42 (emphasis added). ***. October 31, 2012 DMI response to USITC auditorfollow-up questions.
26 As described by its parent company and with respect to first half 2012, “{r}evenues at DMI’s U.S. plantsincreased $33.1 million due to a 13.9% increase in towers produced at those facilities, while cost of goods soldincreased by only $19.7 million at those locations as a result of productivity improvements, cost controls and theimplementation of quality control measures that eliminated the need for outsourced quality assurance staffing.” Otter Tail 2012 10-Q (Q2), p. 39.
27 Describing its Energy Equipment Group segment, Trinity’s 2011 10-K states “{o}perating profit for the yearended December 31, 2011 decreased compared to the same period in 2010 primarily due to transition issues arisingfrom changes in product mix in the structural wind towers business as well as competitive pricing on structural windtowers, partially offset by increased operating profit in other product lines. Trinity 2011 10-K, p. 28. Similarly,Trinity’s 2012 first half 10-Q also refers to these factors when describing lower operating profit for first half 2012compared to first half 2011. Trinity 2012 10-Q (Q2), p. 28.
28 As described by Trinity, ***. October 24, 2012 Trinity response to USITC auditor follow-up questions. ***. Staff verification report, Trinity, p. 8. Petitioners’ posthearing brief, Exhibit 1, p. 80. ***. Staff verification report,Trinity, p. 5, p. 8. ***. Ibid.
VI-8
related to new tower designs.29 As described by Broadwind, ***.30 Katana, which reported *** inaverage other factory costs in interim 2012 compared to interim 2011, explained that ***.31
Table VI-3 shows that, while company-specific directional trends of average sales value and rawmaterial costs generally followed the same pattern, the magnitude of company-specific change variedsuch that the ratio of average raw material costs to net sales value increased during the period for mostproducers. At the gross margin level and when considering both commercial sales only (table VI-1) andcommercial sales and transfers (table VI-2), the overall increase in the ratio of raw material costs to netsales value is an important factor explaining the overall decline in the industry’s overall gross profitduring the period.32
On a company-specific basis, the pattern of other factory costs (positive and negative) notedabove also impacted gross profitability. For example, and unlike other producers with commercial salesonly, the *** gross profit margin in interim 2012 appears to be linked to the decline in the company’saverage other factory costs. In contrast, while *** gross profit margin at the end of the period in partreflects a reduced level of higher margin fabrication-only sales.33 Although Trinity’s gross profit margin***.34
SG&A Expenses and Operating Income or (Loss)
When considering commercial sales only (see table VI-1), the industry’s overall SG&A expenseratio (i.e., total SG&A expenses divided by net sales) remained within a relatively narrow rangethroughout the period until interim 2012 when it reached its highest level. This peak *** DMI’s
29 Broadwind 2012 10-Q (Q2), p. 24. Similarly, Broadwind’s 2011 10-K indicated that start-up inefficienciesrelated to the production of new tower designs in 2011 negatively impacted costs and corresponding profitability inthat year. Broadwind 2011 10-K, p. 32.
30 October 25, 2012 Broadwind response to USITC auditor follow-up questions. With regard to other operationalchanges at the end of the period, Broadwind’s first half 2012 10-Q states that “{d}uring 2012 a portion of theCompany's tower capacity has been shifted to support the growing demand for specialty weldments.” Broadwind2012 10-Q (Q2), p. 14. With regard to how this redeployment of capacity impacted Broadwind’s reported financialresults, the company stated that ***. October 25, 2012 Broadwind response to USITC auditor follow-up questions.
31 October 24, 2012 Katana response to USITC auditor follow-up questions.
32 As indicated in the note to table VI-3, changes in the relative share of tolling activity also impacted the ratio ofraw material costs to total sales value.
33 As described in Broadwind’s first half 2012 10-Q “{t}he decrease in {overall consolidated} gross profit wasprimarily attributable to a decline in Towers and Weldments gross profit due to the lack of higher marginfabrication-only towers in the current quarter. . .” Broadwind 2012 10-Q (Q2), p. 21. While Broadwind reported ***. With regard to why fabrication-only sales are more profitable in general,Broadwind explained that ***. October 25, 2012 Broadwind response to USITC auditor follow-up questions.
34 Staff verification report, Trinity, p. 8. VI-9
impairment of its U.S. manufacturing operations.35 In contrast, and when considering commercial salesand transfers (see table VI-2), the pattern of SG&A expenses was more variable.36
Table VI-3 shows that company-specific SG&A expense ratios fluctuated during the period and,in some cases, directly reflect events/actions described above. For example, the ***.37 In contrast,Broadwind’s *** SG&A expense ratio in interim 2012 largely reflects ***.38 With regard to its 2010SG&A expense ratio, Katana stated that ***.39
With the exception of interim 2012 (see footnote 35), overall SG&A expense ratios associatedwith operations on commercial sales only (table VI-1) remained within a relatively narrow range. Thislimited variability for most of the period indicates that SG&A expenses, in general, played a secondaryrole in terms of explaining changes in wind tower operating income or (loss).
35 See Part III of this report regarding the planned disposition of DMI’s U.S. manufacturing assets. With regardto the interim 2012 impairment, the first half 2012 10-Q of DMI’s parent company states that “{t}he market valuefor DMI’s assets has been significantly impacted by reduced demand for wind towers due to adverse marketconditions affecting the industry, including uncertainty regarding renewal or extension of the Federal Production TaxCredit (PTC) for investments in renewable energy resources, which is set to expire at the end of 2012. Based on theCompany’s second quarter 2012 decision to divest DMI’s assets and the price for the fixed assets agreed to in thenonbinding letter of interest {with Trinity}, DMI recorded a noncash asset impairment charge of $45.6 million($27.5 million net-of-tax) . . .” Otter Tail 2012 10-Q (Q2), p. 10. DMI provided the following information regarding the decision to sell its U.S. wind tower operations and howits reported financial results were impacted: ***. October 31, 2012 DMI response to USITC auditor follow-upquestions. Similarly, Katana was asked to indicate the extent to which its decision to sell its operations is reflected in itswind tower financial results. In response, Katana stated ***. October 24, 2012 Katana response to USITC auditorfollow-up questions.
36 ***.
37 With regard to other company-specific events/actions which may have impacted the level of reported SG&Aexpenses, Trinity’s first half 2012 10-Q states “ . . {a}s of June 30, 2012, the backlog for structural wind towers wasapproximately $817.4 million compared to approximately $916.5 million as of June 30, 2011. Approximately$412.5 million of this backlog is subject to litigation with a structural wind tower consumer for the customer's breachof a long-term supply contract for the manufacture of towers.” Trinity 2012 10-Q (Q2), p. 28. In response to aquestion regarding the extent to which the above-referenced contract dispute is reflected in its wind tower financialresults, Trinity stated that ***. October 24, 2012 Trinity response to USITC auditor follow-up questions.
38 As described by Broadwind, ***. October 25, 2012 Broadwind response to USITC auditor follow-upquestions.
39 January 24, 2012 e-mail with attachments from counsel for Petitioners. See also footnote 40.
VI-10
Non-Recurring Items
As described above, U.S. producers reported non-recurring items which impacted the industry’sfinancial results at both the gross and operating level.40 Below operating income or (loss), however, theonly substantial non-recurring item was Broadwind’s $13.3 million impairment charge related to itsBrandon, SD plant.41 As presented in table VI-1 and table VI-2, this non-recurring charge accounts for*** of the industry total “other expenses” in 2010.
CAPITAL EXPENDITURES AND RESEARCH AND DEVELOPMENT EXPENSES
Data on capital expenditures and research and development (“R&D”) expenses related tooperations on wind towers are presented in table VI-6.42
Consistent with expansion activity previously noted, most U.S. producers reported larger capitalexpenditures prior to the period examined. In contrast, the *** level of Vestas Towers’ capitalexpenditures in 2009 reflects the construction of the company’s wind tower plant in Pueblo, CO.
As shown in table VI-6, while several U.S. producers reported R&D expenses, *** accounted forthe majority. As described by ***, R&D expenses were focused primarily on manufacturing-relatedimprovements.43 Similar to ***.
40 In response to Commissioner Pearson’s hearing question regarding the extent to which liquidated damageswere included in the industry’s financial results, ***. Petitioners’ posthearing brief, Exhibit 1, pp. 68-69. At the hearing, Commissioner Pinkert asked Petitioners to indicate the extent to which non-recurring chargesunrelated to subject imports impacted the industry’s financial results. In response and with respect to itemsspecifically impacting operating results, Petitioners stated that ***. Petitioners’ posthearing brief, Exhibit 1, pp. 62-63. (See also footnote 24). On a pro forma basis, which only impacts 2010 and 2011 (full-year and interim period),the U.S. industry’s operating income margins would be as follows if the above-referenced items were eliminated:
Item
Calendar year Jan.-June Jan.-June
2009 2010 2011 2011 2012
Operating income or (loss): Ratio to net sales (percent)
Commercial sales only *** *** *** *** ***
Commercial sales and transfers/internal cons. *** *** *** *** ***
41 With regard to this impairment, Broadwind stated in its 2010 10-K that “{i}n the first quarter of 2010, wecompleted construction of a third wind tower manufacturing facility in Brandon, South Dakota, but as of the datehereof, we have not commenced production at this facility. Following the Company's strategic planning meetingsthat took place in the fourth quarter of 2010, we determined that due to the oversupply of capacity in the U.S. towermarket and the significant level of towers imported from Asia, it would be difficult or impossible to operate thisfacility in a profitable or cost-effective manner. We are currently exploring alternative uses for the building andequipment comprising this facility. In connection with this determination, during the fourth quarter of 2010, werecorded an impairment charge of $13.3 million.” Broadwind 2010 10-K, p. 15. ***. Petitioners’ postconference brief, Exh. 4 (Broadwind affidavit) pp. 1-2.
42 As reported by U.S. producers with commercial sales only, wind tower assets increased marginally from *** in2009 to *** in 2011. For commercial sales and transfers/internal consumption, wind tower assets increased from*** in 2009 to *** in 2011.
43 ***. January 24, 2012 e-mail with attachments from counsel for Petitioners to USITC auditor. ***. Ibid. ***.
VI-11
Table VI-6Wind towers: Capital expenditures and R&D expenses, 2009-11, January-June 2011, January-June 2012
* * * * * * ****.44
In the final-phase U.S. producer questionnaire, U.S. producers were asked to describe thedevelopment of new wind tower production facilities in terms of total time and cost required to build awind tower plant, the impact of plant location, and factors considered when selecting plant location. Their responses are presented below.
Broadwind ***.DMI ***.Katana ***.Trinity ***.Vestas Towers ***.
In response to hearing questions regarding capacity from Commissioner Aranoff, CommissionerJohanson, and Commissioner Pinkert, Petitioners provided additional information regarding time andinvestment requirements to establish/restart wind tower operations.45 ***.46 ***. CAPITAL AND INVESTMENT
The Commission requested that U.S. producers describe any actual or anticipated negative effectsof imports of wind towers from China or Vietnam on their firms’ growth, investment, ability to raisecapital, existing development and production efforts (including efforts to develop a derivative or moreadvanced version of the product), or the scale of capital investments. The U.S. producers’ responses arepresented below.
Actual Negative Effects
Ameron ***.47 Broadwind ***. DMI ***.Katana ***. Trinity ***.Vestas Towers ***.
Anticipated Negative Effects
Ameron ***.48
Broadwind ***.DMI ***. Katana ***.Trinity ***.Vestas Towers ***.
44 October 25, 2012 Broadwind response to USITC auditor follow-up questions.
45 Petitioners posthearing brief, Exhibit 1, pp. 20-23.
46 Staff verification report, Trinity, p. 4.
47 ***.
48 ***.VI-12
VII-1
PART VII: THREAT CONSIDERATIONS AND INFORMATION ON NONSUBJECT COUNTRIES
Section 771(7)(F)(i) of the Act (19 U.S.C. § 1677(7)(F)(i)) provides that—
In determining whether an industry in the United States is threatened with material injury by reason of imports (or sales for importation) of the subject merchandise, the Commission shall consider, among other relevant economic factors1-- (I) if a countervailable subsidy is involved, such information as may be
presented to it by the administering authority as to the nature of the subsidy (particularly as to whether the countervailable subsidy is a subsidy described in Article 3 or 6.1 of the Subsidies Agreement), and whether imports of the subject merchandise are likely to increase,
(II) any existing unused production capacity or imminent, substantial increase in production capacity in the exporting country indicating the likelihood of substantially increased imports of the subject merchandise into the United States, taking into account the availability of other export markets to absorb any additional exports,
(III) a significant rate of increase of the volume or market penetration of imports of the subject merchandise indicating the likelihood of substantially increased imports,
(IV) whether imports of the subject merchandise are entering at prices that are likely to have a significant depressing or suppressing effect on domestic prices, and are likely to increase demand for further imports,
(V) inventories of the subject merchandise,
(VI) the potential for product-shifting if production facilities in the foreign country, which can be used to produce the subject merchandise, are currently being used to produce other products,
(VII) in any investigation under this title which involves imports of both a raw agricultural product (within the meaning of paragraph (4)(E)(iv)) and any product processed from such raw agricultural product, the likelihood that there will be increased imports, by reason of product shifting, if there is an affirmative determination by the Commission under section 705(b)(1) or 735(b)(1) with respect to either the raw
1 Section 771(7)(F)(ii) of the Act (19 U.S.C. § 1677(7)(F)(ii)) provides that “The Commission shall consider {these factors} . . . as a whole in making a determination of whether further dumped or subsidized imports are imminent and whether material injury by reason of imports would occur unless an order is issued or a suspension agreement is accepted under this title. The presence or absence of any factor which the Commission is required to consider . . . shall not necessarily give decisive guidance with respect to the determination. Such a determination may not be made on the basis of mere conjecture or supposition.”
VII-2
agricultural product or the processed agricultural product (but not both),
(VIII) the actual and potential negative effects on the existing development and production efforts of the domestic industry, including efforts to develop a derivative or more advanced version of the domestic like product, and
(IX) any other demonstrable adverse trends that indicate the probability that there is likely to be material injury by reason of imports (or sale for importation) of the subject merchandise (whether or not it is actually being imported at the time).2
Information in relation to subsidies in China is presented in Part I; information on the volume and pricing of imports of the subject merchandise is presented in Part IV and Part V; and information on the effects of imports of the subject merchandise on U.S. producers’ existing development and production efforts is presented in Part VI. Information on inventories of the subject merchandise; foreign producers’ operations, including the potential for “product-shifting;” any other threat indicators, if applicable; and any dumping in third-country markets, follows. Also presented in this section of the report is information obtained for consideration by the Commission on nonsubject countries and the global market.
THE INDUSTRY IN CHINA
Overview
China was the largest global wind market in 2011, with 17.6 gigawatts (“GW,” equivalent to 1,000 MW) in annual wind turbine installations (figure VII-1), though this is down from 18.9 GW in installations in 2010. MAKE Consulting projects that installations in China will further decline to 16 GW in 2012, before rebounding to 19 GW in 2013.3 In 2011, there were *** wind turbines installed in China.4
2 Section 771(7)(F)(iii) of the Act (19 U.S.C. § 1677(7)(F)(iii)) further provides that, in antidumping investigations, “. . . the Commission shall consider whether dumping in the markets of foreign countries (as evidenced by dumping findings or antidumping remedies in other WTO member markets against the same class or kind of merchandise manufactured or exported by the same party as under investigation) suggests a threat of material injury to the domestic industry.”
3 In comparison, U.S. installations are projected to total around 13 GW in 2012, but are likely to decline significantly in 2013. Prior to the PTC renewal, analysts were projecting that installations might total 2 GW or less. Revised estimates based on the PTC renewal are not available, but the extension may not have an immediate impact on installations given the long project development time-frame.” Pankratz, Howard, “Wind-energy Tax Credit Extended for One Year,” The Denver Post, January 2, 2013, http://www.denverpost.com/breakingnews/ci_22296411/wind-energy-tax-credit-extended-one-year; Heltzell, Dallas, “Wind Industry Hails Tax-credit Extension,” Boulder County Business Report, January 2, 2013, http://www.bcbr.com/article/20130102/NEWS/130109995.
4 This was a *** from the *** towers installed in 2010. BTM Consult reports the net increase in towers, which is the number installed minus the number of turbines decommissioned in that year. There were *** Chinese turbines decommissioned in 2011, but ***. BTM Consult, World Market Update 2011, March 2012, pp. 33–34.
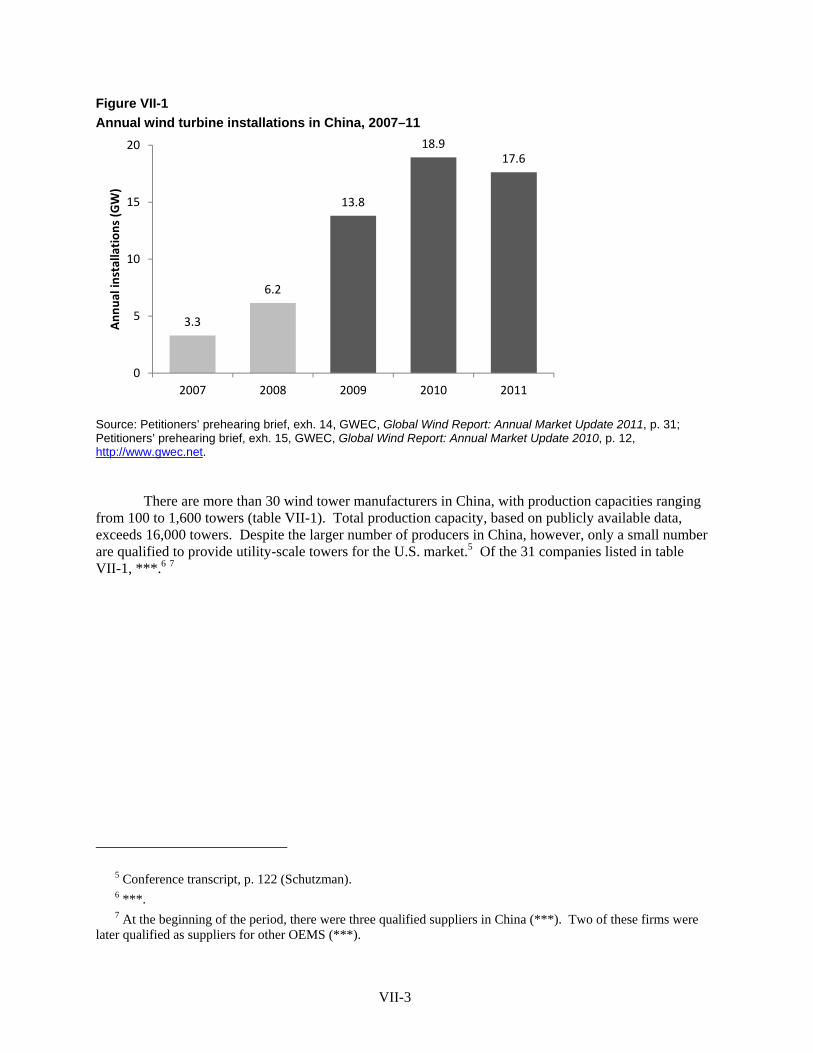
VII-3
Figure VII-1 Annual wind turbine installations in China, 2007–11
Source: Petitioners’ prehearing brief, exh. 14, GWEC, Global Wind Report: Annual Market Update 2011, p. 31; Petitioners’ prehearing brief, exh. 15, GWEC, Global Wind Report: Annual Market Update 2010, p. 12, http://www.gwec.net.
There are more than 30 wind tower manufacturers in China, with production capacities ranging from 100 to 1,600 towers (table VII-1). Total production capacity, based on publicly available data, exceeds 16,000 towers. Despite the larger number of producers in China, however, only a small number are qualified to provide utility-scale towers for the U.S. market.5 Of the 31 companies listed in table VII-1, ***.6 7
5 Conference transcript, p. 122 (Schutzman). 6 ***. 7 At the beginning of the period, there were three qualified suppliers in China (***). Two of these firms were
later qualified as suppliers for other OEMS (***).
3.3
6.2
13.8
18.917.6
0
5
10
15
20
2007 2008 2009 2010 2011
Annual in
stallations (GW)
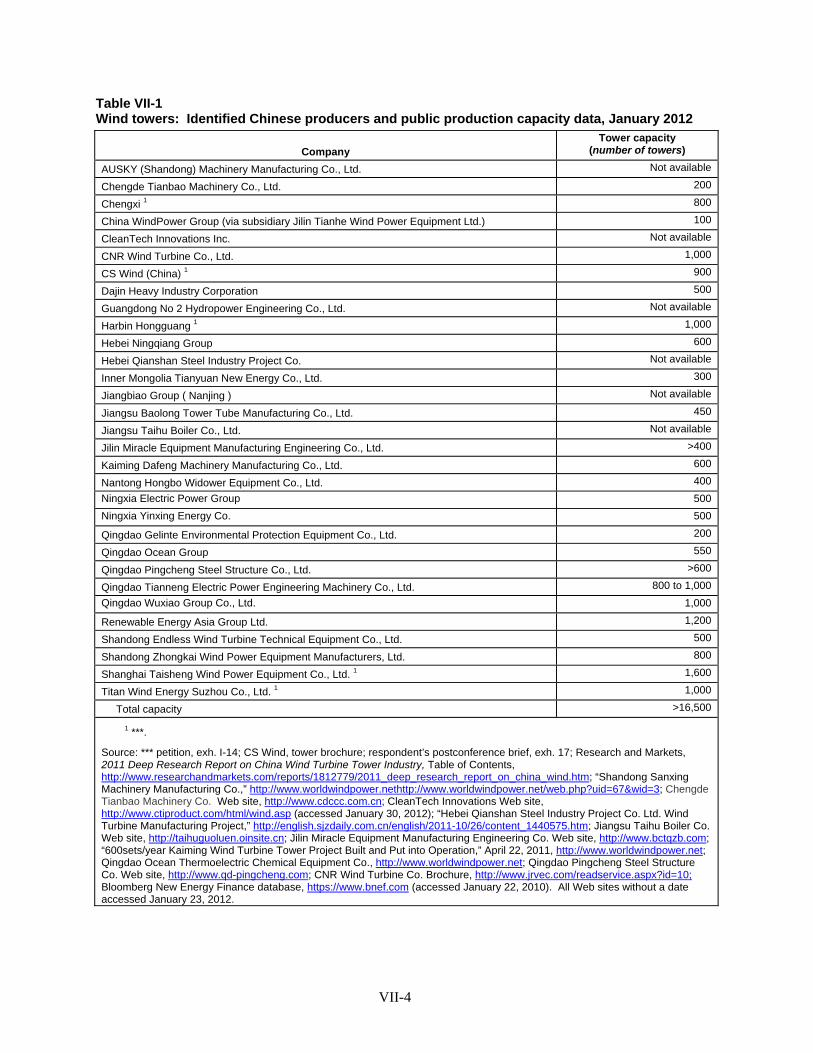
VII-4
Table VII-1 Wind towers: Identified Chinese producers and public production capacity data, January 2012
Company Tower capacity
(number of towers)
AUSKY (Shandong) Machinery Manufacturing Co., Ltd. Not available
Chengde Tianbao Machinery Co., Ltd. 200
Chengxi 1 800
China WindPower Group (via subsidiary Jilin Tianhe Wind Power Equipment Ltd.) 100
CleanTech Innovations Inc. Not available
CNR Wind Turbine Co., Ltd. 1,000
CS Wind (China) 1 900
Dajin Heavy Industry Corporation 500
Guangdong No 2 Hydropower Engineering Co., Ltd. Not available
Harbin Hongguang 1 1,000
Hebei Ningqiang Group 600
Hebei Qianshan Steel Industry Project Co. Not available
Inner Mongolia Tianyuan New Energy Co., Ltd. 300
Jiangbiao Group ( Nanjing ) Not available
Jiangsu Baolong Tower Tube Manufacturing Co., Ltd. 450
Jiangsu Taihu Boiler Co., Ltd. Not available
Jilin Miracle Equipment Manufacturing Engineering Co., Ltd. >400
Kaiming Dafeng Machinery Manufacturing Co., Ltd. 600
Nantong Hongbo Widower Equipment Co., Ltd. 400
Ningxia Electric Power Group 500
Ningxia Yinxing Energy Co. 500
Qingdao Gelinte Environmental Protection Equipment Co., Ltd. 200
Qingdao Ocean Group 550
Qingdao Pingcheng Steel Structure Co., Ltd. >600
Qingdao Tianneng Electric Power Engineering Machinery Co., Ltd. 800 to 1,000
Qingdao Wuxiao Group Co., Ltd. 1,000
Renewable Energy Asia Group Ltd. 1,200
Shandong Endless Wind Turbine Technical Equipment Co., Ltd. 500
Shandong Zhongkai Wind Power Equipment Manufacturers, Ltd. 800
Shanghai Taisheng Wind Power Equipment Co., Ltd. 1 1,600
Titan Wind Energy Suzhou Co., Ltd. 1 1,000
Total capacity >16,500
1 ***.
Source: *** petition, exh. I-14; CS Wind, tower brochure; respondent’s postconference brief, exh. 17; Research and Markets, 2011 Deep Research Report on China Wind Turbine Tower Industry, Table of Contents, http://www.researchandmarkets.com/reports/1812779/2011_deep_research_report_on_china_wind.htm; “Shandong Sanxing Machinery Manufacturing Co.,” http://www.worldwindpower.nethttp://www.worldwindpower.net/web.php?uid=67&wid=3; Chengde Tianbao Machinery Co. Web site, http://www.cdccc.com.cn; CleanTech Innovations Web site, http://www.ctiproduct.com/html/wind.asp (accessed January 30, 2012); “Hebei Qianshan Steel Industry Project Co. Ltd. Wind Turbine Manufacturing Project,” http://english.sjzdaily.com.cn/english/2011-10/26/content_1440575.htm; Jiangsu Taihu Boiler Co. Web site, http://taihuguoluen.oinsite.cn; Jilin Miracle Equipment Manufacturing Engineering Co. Web site, http://www.bctqzb.com; “600sets/year Kaiming Wind Turbine Tower Project Built and Put into Operation,” April 22, 2011, http://www.worldwindpower.net; Qingdao Ocean Thermoelectric Chemical Equipment Co., http://www.worldwindpower.net; Qingdao Pingcheng Steel Structure Co. Web site, http://www.qd-pingcheng.com; CNR Wind Turbine Co. Brochure, http://www.jrvec.com/readservice.aspx?id=10; Bloomberg New Energy Finance database, https://www.bnef.com (accessed January 22, 2010). All Web sites without a date accessed January 23, 2012.
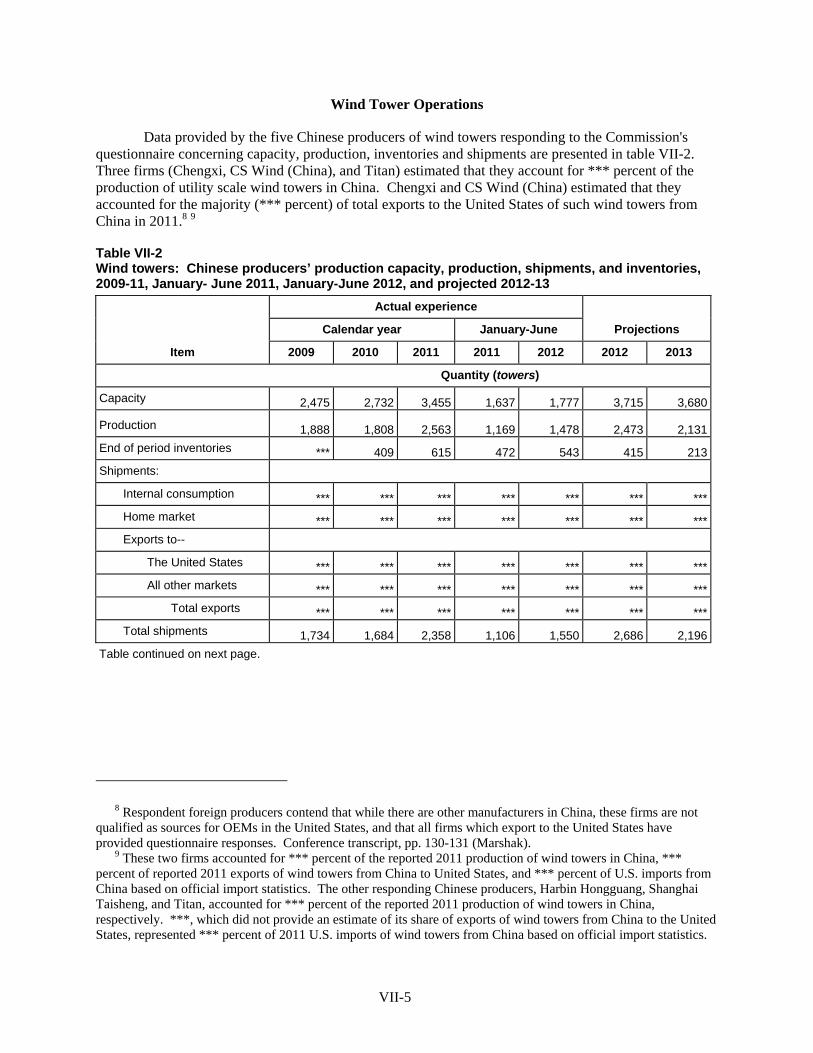
VII-5
Wind Tower Operations
Data provided by the five Chinese producers of wind towers responding to the Commission's questionnaire concerning capacity, production, inventories and shipments are presented in table VII-2. Three firms (Chengxi, CS Wind (China), and Titan) estimated that they account for *** percent of the production of utility scale wind towers in China. Chengxi and CS Wind (China) estimated that they accounted for the majority (*** percent) of total exports to the United States of such wind towers from China in 2011.8 9
Table VII-2 Wind towers: Chinese producers’ production capacity, production, shipments, and inventories, 2009-11, January- June 2011, January-June 2012, and projected 2012-13
Item
Actual experience
Projections Calendar year January-June
2009 2010 2011 2011 2012 2012 2013
Quantity (towers)
Capacity 2,475 2,732 3,455 1,637 1,777 3,715 3,680
Production 1,888 1,808 2,563 1,169 1,478 2,473 2,131End of period inventories *** 409 615 472 543 415 213Shipments: Internal consumption *** *** *** *** *** *** *** Home market *** *** *** *** *** *** *** Exports to-- The United States *** *** *** *** *** *** *** All other markets *** *** *** *** *** *** *** Total exports *** *** *** *** *** *** *** Total shipments 1,734 1,684 2,358 1,106 1,550 2,686 2,196Table continued on next page.
8 Respondent foreign producers contend that while there are other manufacturers in China, these firms are not qualified as sources for OEMs in the United States, and that all firms which export to the United States have provided questionnaire responses. Conference transcript, pp. 130-131 (Marshak).
9 These two firms accounted for *** percent of the reported 2011 production of wind towers in China, *** percent of reported 2011 exports of wind towers from China to United States, and *** percent of U.S. imports from China based on official import statistics. The other responding Chinese producers, Harbin Hongguang, Shanghai Taisheng, and Titan, accounted for *** percent of the reported 2011 production of wind towers in China, respectively. ***, which did not provide an estimate of its share of exports of wind towers from China to the United States, represented *** percent of 2011 U.S. imports of wind towers from China based on official import statistics.
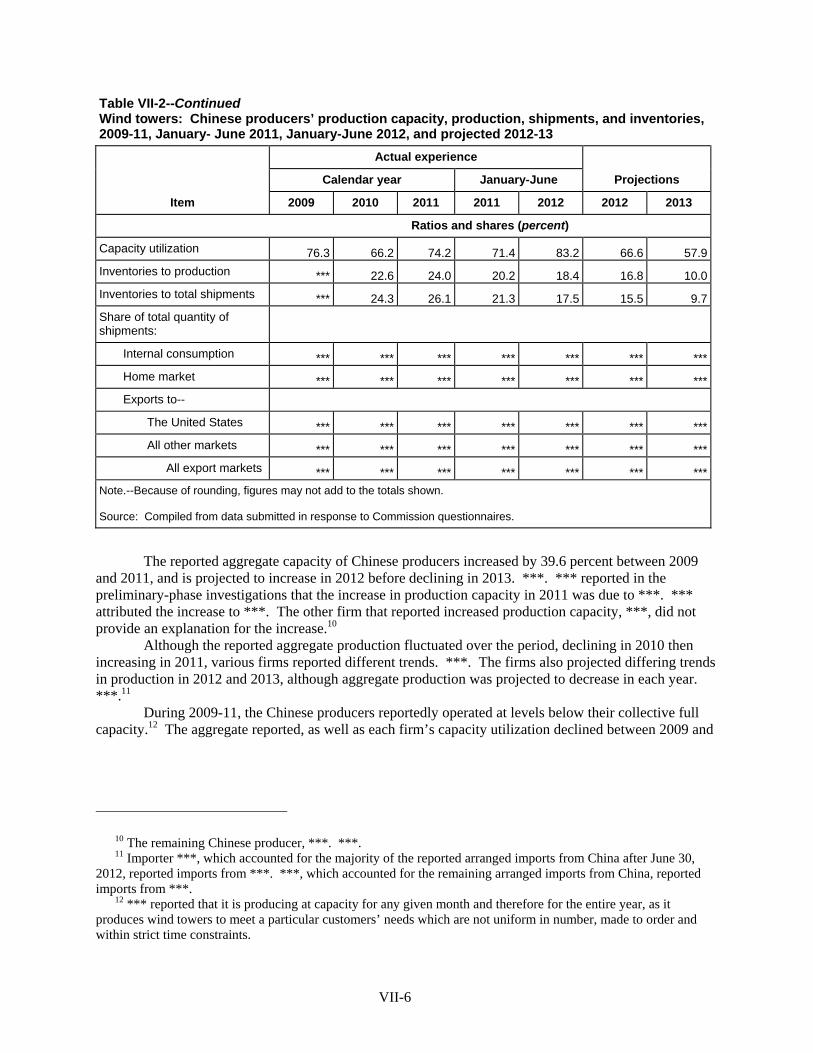
VII-6
Table VII-2--Continued Wind towers: Chinese producers’ production capacity, production, shipments, and inventories, 2009-11, January- June 2011, January-June 2012, and projected 2012-13
Item
Actual experience
Projections Calendar year January-June
2009 2010 2011 2011 2012 2012 2013
Ratios and shares (percent)
Capacity utilization 76.3 66.2 74.2 71.4 83.2 66.6 57.9Inventories to production *** 22.6 24.0 20.2 18.4 16.8 10.0Inventories to total shipments *** 24.3 26.1 21.3 17.5 15.5 9.7Share of total quantity of shipments: Internal consumption *** *** *** *** *** *** *** Home market *** *** *** *** *** *** *** Exports to-- The United States *** *** *** *** *** *** *** All other markets *** *** *** *** *** *** *** All export markets *** *** *** *** *** *** ***Note.--Because of rounding, figures may not add to the totals shown. Source: Compiled from data submitted in response to Commission questionnaires.
The reported aggregate capacity of Chinese producers increased by 39.6 percent between 2009 and 2011, and is projected to increase in 2012 before declining in 2013. ***. *** reported in the preliminary-phase investigations that the increase in production capacity in 2011 was due to ***. *** attributed the increase to ***. The other firm that reported increased production capacity, ***, did not provide an explanation for the increase.10
Although the reported aggregate production fluctuated over the period, declining in 2010 then increasing in 2011, various firms reported different trends. ***. The firms also projected differing trends in production in 2012 and 2013, although aggregate production was projected to decrease in each year. ***.11
During 2009-11, the Chinese producers reportedly operated at levels below their collective full capacity.12 The aggregate reported, as well as each firm’s capacity utilization declined between 2009 and
10 The remaining Chinese producer, ***. ***. 11 Importer ***, which accounted for the majority of the reported arranged imports from China after June 30,
2012, reported imports from ***. ***, which accounted for the remaining arranged imports from China, reported imports from ***.
12 *** reported that it is producing at capacity for any given month and therefore for the entire year, as it produces wind towers to meet a particular customers’ needs which are not uniform in number, made to order and within strict time constraints.
VII-7
2010, then increased in 2011 to approximately the same level as in 2009. Capacity utilization peaked at 83.2 percent in January-June 2012 but is projected to be lower in calendar years 2012 and 2013.13
Each reporting firm reported exports to the United States, although three firms (***) represented the vast majority of these exports.14 For these three firms, exports to the United States represented the largest share (ranging from *** percent to *** percent of total shipments during 2009-11, ***).15 These three firms reported increases in total exports and exports to the United States between 2009 and 2011, ending approximately *** percent higher than in 2009. *** project an increase in total exports and exports to the United States in 2012 followed by a decline in 2013. *** projects a *** percent increase in total exports but a *** decrease in exports to the United States in 2012, followed in 2013 by a decrease in exports to the United States but an increase to other export markets. All responding firms reported holding inventories.16
Only one firm, ***, reported producing other products (***) on the same equipment, machinery, and workers used in the production of wind towers, and ***, reported plans to produce other products, namely rotor houses, in 2013. Two firms, *** reported constraints on production capacity. Both reported being constrained by the capacity of the existing facility or inability to expand the existing facility, one reported being constrained by the number of skilled workers, and one noted the bottleneck at the painting process.
Table VII-3 presents total shipments produced in China by tower size reported by ***. The majority of the wind towers were 50-79.9 meters or 80-89.9 meters. Two firms reported shipments of 90-99.9 meter wind towers, and none reported shipments of 100 or more meter wind towers between January 2011 and June 2012.
Table VII-3 Wind towers: Chinese producers’ shipments by size, January- June 2011, July-December 2011, and January-June 2012
* * * * * * *
13 Three Chinese producers (***) reported having agreements relating to the production and sale of wind towers. ***.
14 The other two firms reported ***. 15 *** reported that ***. 16 *** reported in the preliminary-phase investigations that ***. E--mail from ***, January 30, 2012. None of
the firms reported holding inventories in the United States.
VII-8
THE INDUSTRY IN VIETNAM
Overview
Vietnam has a relatively small wind market, with 29 MW installed in 2011, though there is substantial project development activity taking place.17 There are at least three firms producing wind towers in Vietnam—CS Wind (Vietnam), Vina Halla Heavy Industries Ltd., and UBI Tower Sole Member Company Ltd (“UBI”). These three companies have a combined production capacity of 1,600 towers, and currently export wind towers to Asia, Europe, and the United States.18 19
Wind Tower Operations
Data provided by two producers of wind towers in Vietnam, CS Wind (Vietnam) and UBI responding to the Commission’s questionnaire concerning capacity, production, inventories and shipments are presented in table VII-4. These firms reportedly accounted for the vast majority of subject wind towers production in Vietnam and *** exports to the United States of wind towers from Vietnam in 2011.20
Table VII-4 Wind towers: Vietnamese producers’ production capacity, production, shipments, and inventories, 2009-11, January- June 2011, January-June 2012, and projected 2012-13
* * * * * * *
Capacity increased between 2009 and 2011, while production declined over the same period.21 UBI began production in 2010 with a capacity of 300 wind towers,22 but only produced *** wind towers in 2010 and *** wind towers in 2011. *** reported a *** percent decline in capacity and *** percent decline in production between 2009 and 2011. Both firms project stable capacity in 2012 and 2013. Both firms project increased production in 2012 compared with 2011. In the following year, however, *** projects a *** percent decline in production, to the ***, while *** projects a *** of production between
17 Petitioners’ preconference brief, exh. 14, GWEC, Global Wind Report: Annual Market Update 2011, p. 11; Petitioners’ preconference brief, ex. 18, GIZ Wind Energy Project, Status of Wind Power Development and Financing of These Projects in Vietnam, March 2012, pp. 18–22.
18 CS Wind (Vietnam) has an annual production capacity of 900 towers, Vina Halla of 400 towers, and UBI Tower of 300 towers. In addition to these companies, Renewable Energy of Vietnam (REVN) was listed as a producer of wind towers in a 2011 report, but was not listed in a 2012 report by the same group. Respondent’s postconference brief, exh. 9; Petitioners’ prehearing brief, p. 48, GIZ Wind Energy Project, Status of Wind Power Development and Financing of These Projects in Vietnam, March 2012, p. 9; CS Wind, towers brochure; Vina Halla Web site, http://www.vinahalla.com/english/sub02_introduction/page_01.asp?tm=2&ts=1 (accessed November 9, 2012).
19 GE reported ***. Siemens reported that *** was a qualified supplier. 20 Petitioners argue that there are a large number of subject producers that have failed to provide questionnaire
responses; these include ***. Petitioners’ postconference brief, exh. 1, p. 8. 21 *** calculated its production capacity based on the smaller of the bending machine capacity or capacity of
workers. While *** calculated its production capacity based on design capacity of the equipment and labor skills. 22 “About us, company capacity,” UBI, Found at http://ubitower.vn/en/About-us/Company-Capacity.aspx
(accessed on June 10, 2012).
VII-9
2012 and 2013.23 *** stated that its production capacity is constrained by the number of skilled workers and the capacity and efficiency of its facility, while *** reported that the lack of orders constrained its production capacity.24
*** of CS Wind (Vietnam)’s shipments of wind towers were exported, with exports to other markets in Europe and Asia growing over the period for which data were collected. Exports to the United States declined from *** percent of total shipments in 2009 to *** percent in 2011, and are projected to decrease to *** percent in 2012 and to *** percent in 2013. UBI, which started producing in 2010 has *** towers, *** of which were exported to the United States. UBI projects ***.
CS Wind (Vietnam) reported that *** on the same equipment, machinery, and workers used in the production of wind towers. The firm attributed this ***. UBI reported that it is able to switch production to other products, such as *** and ***.
Table VII-5 presents total shipments produced in Vietnam by tower size reported by ***. The majority of the wind towers were 50.0-79.9 meters or 90-99.9 meters.
Table VII-5 Wind towers: Vietnamese producers’ shipments by size, January-June 2011, July-December 2011, and January-June 2012
* * * * * * *
COMBINED DATA FOR THE INDUSTRIES IN CHINA AND VIETNAM
Table VII-6 presents aggregate data for the reporting producers of wind towers from China and Vietnam. Table VII-7 presents total shipments produced in China and Vietnam by tower size.
Table VII-6 Wind towers: Chinese and Vietnamese producers’ combined reported production capacity, production, shipments, and inventories, 2009-11, January-June 2011, January-June 2012, and projected 2012-13
* * * * * * * Table VII-7 Wind towers: Chinese and Vietnamese producers’ combined shipments by size, January-June 2011, July-December 2011, and January-June 2012
* * * * * * *
23 *** based its projects on the ***. ***, on the other hand, based its projections on ***. 24 One Vietnamese producer (***) reported having an agreement relating to the production and sale of wind
towers. ***.
VII-10
U.S. IMPORTERS’ INVENTORIES
Data collected in these investigations on U.S. importers’ end-of-period inventories of wind towers are presented in table VII-8.25 26 U.S. importers’ reported inventories of wind towers from China were present in only January-June 2011 and January-June 2012. As a ratio of imports, inventories of imports from China fluctuated over a period when imports also fluctuated. Table VII-8 Wind towers: U.S. importers' end-of-period inventories of imports, by source, 2009-11, January-June 2011, and January-June 2012
* * * * * * *
U.S. IMPORTERS’ CURRENT ORDERS
The Commission requested importers to indicate whether they imported or arranged for the importation of wind towers from China and Vietnam after June 30, 2012. Table VII-9 presents the quantity and value of orders by five U.S. importers which indicated that they had imported or arranged for the importation of wind towers from China, Vietnam, and other sources.27 28 Table VII-9 Wind towers: U.S. importers' orders for delivery subsequent to June 30, 2012, by period
* * * * * * *
ANTIDUMPING OR COUNTERVAILING DUTY ORDERS IN THIRD-COUNTRY MARKETS
No producer, importer, or foreign producer reported any countervailing or antidumping duty orders on wind towers from China or Vietnam in third-country markets.29
25 As noted in Part II, most U.S. importers are the end users of the imported wind towers. 26 One importer, ***, reported inventories of imports from China in January-June 2011 and January-June 2012,
representing approximately *** percent of total reported quantity of imports from China during January 2009-June 2012. No importers reported inventories of imports from Vietnam or from all other sources.
27 Five importers reported imports from China (majority reported by ***), two importers (***) reported imports from Vietnam, and 11 from all other sources (majority reported by ***). No importers reported orders for the importation of wind towers after June 2012.
28 *** E-mail from ***, December 28, 2012. 29 Respondents concurred that they were unaware of any third country trade barriers. Conference transcript, p.
151 (Feldman/Schutzman).
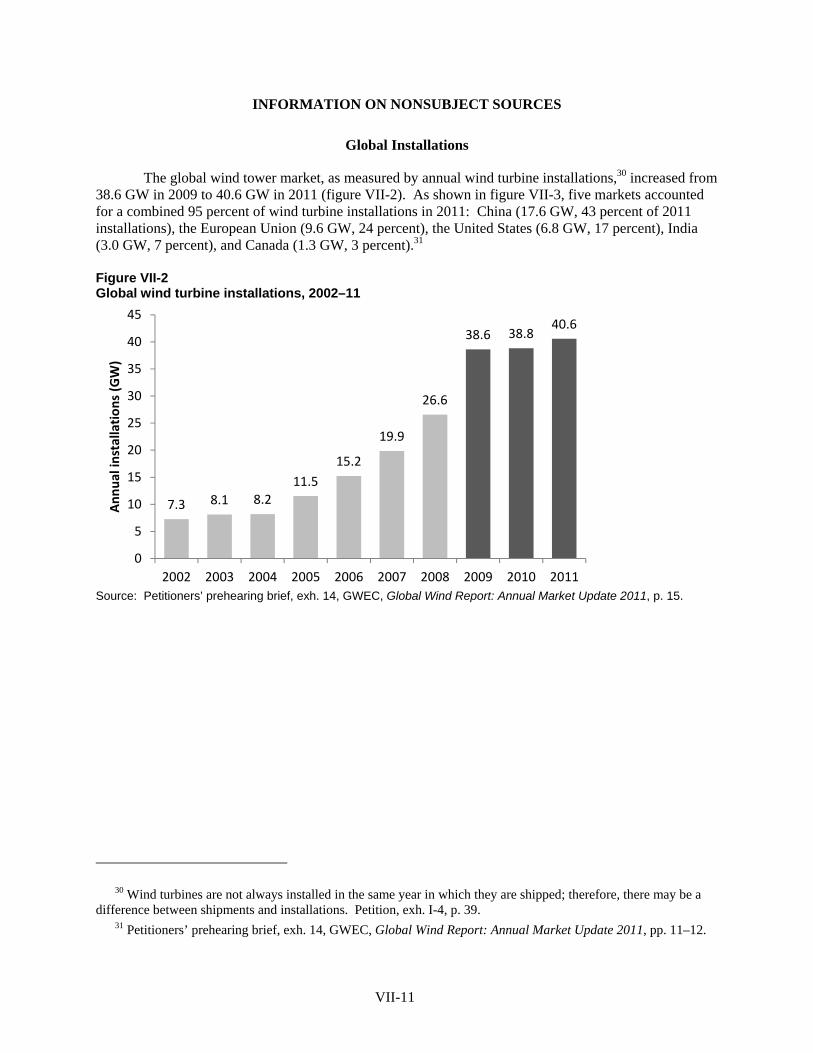
VII-11
INFORMATION ON NONSUBJECT SOURCES
Global Installations
The global wind tower market, as measured by annual wind turbine installations,30 increased from 38.6 GW in 2009 to 40.6 GW in 2011 (figure VII-2). As shown in figure VII-3, five markets accounted for a combined 95 percent of wind turbine installations in 2011: China (17.6 GW, 43 percent of 2011 installations), the European Union (9.6 GW, 24 percent), the United States (6.8 GW, 17 percent), India (3.0 GW, 7 percent), and Canada (1.3 GW, 3 percent).31
Figure VII-2 Global wind turbine installations, 2002–11
Source: Petitioners’ prehearing brief, exh. 14, GWEC, Global Wind Report: Annual Market Update 2011, p. 15.
30 Wind turbines are not always installed in the same year in which they are shipped; therefore, there may be a difference between shipments and installations. Petition, exh. I-4, p. 39.
31 Petitioners’ prehearing brief, exh. 14, GWEC, Global Wind Report: Annual Market Update 2011, pp. 11–12.
7.3 8.1 8.2
11.5
15.2
19.9
26.6
38.6 38.840.6
0
5
10
15
20
25
30
35
40
45
2002 2003 2004 2005 2006 2007 2008 2009 2010 2011
Annual installations (GW)
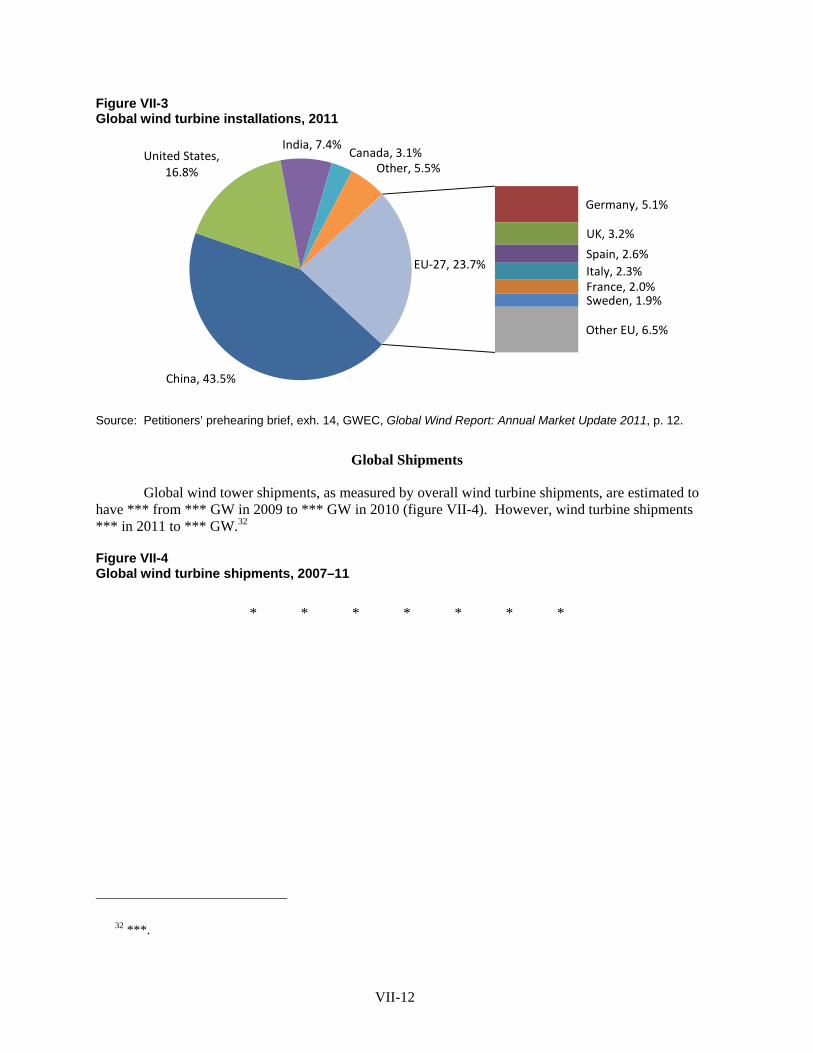
VII-12
Figure VII-3 Global wind turbine installations, 2011
Source: Petitioners’ prehearing brief, exh. 14, GWEC, Global Wind Report: Annual Market Update 2011, p. 12.
Global Shipments
Global wind tower shipments, as measured by overall wind turbine shipments, are estimated to have *** from *** GW in 2009 to *** GW in 2010 (figure VII-4). However, wind turbine shipments *** in 2011 to *** GW.32
Figure VII-4 Global wind turbine shipments, 2007–11
* * * * * * *
32 ***.
China, 43.5%
Germany, 5.1%
UK, 3.2%
Spain, 2.6%
Italy, 2.3%France, 2.0%Sweden, 1.9%
Other EU, 6.5%
United States, 16.8%
India, 7.4%Canada, 3.1%
Other, 5.5%
EU‐27, 23.7%
VII-13
Leading Nonsubject Suppliers to U.S. Market
The leading nonsubject sources of U.S. imports of wind towers in 2011 were Korea, Canada, Mexico, and Indonesia.33 More information on the industry in each of these countries is included below and aggregated in table VII-10.34
Canada
There are currently five firms (CS Wind, DSTN, Enercon, Hitachi, and Marmen) producing wind towers in Canada. DMI closed its Canadian tower plant in 2012, while TSP Towers Canada is opening its first Canadian plant and Enercon is planning to open a second plant. The Canadian wind turbine market is expanding, with installations increasing from 1.0 GW in 2009 to 1.3 GW in 2011, so Canadian tower production is directed toward both meeting domestic demand and exports to the U.S. market.35
Indonesia
The principal producer of wind turbine towers in Indonesia is Korindo Wind, which has an annual production capacity of more than 800 towers.
Korea
There are at least five producers of wind towers in Korea (Dongkuk S&C, Hyosung, Sangwon ENS Co., Speco, and Win & P.), two of which are known to have supplied the U.S. market. Production capacity at the two companies for which data are available totals 1,880 towers.
Mexico
There are at least three wind tower producers in Mexico—Grupo Industrial Monclova (GIMSA), Speco, and Trinity Structural Towers—but information on production capacity for these companies is not available.
33 Based on trade in HTS statistical reporting number 7308.20.0020, tubular iron or steel towers and sectional components thereof. This provision may include some nonsubject products. USITC Dataweb/USDOC (accessed November 7, 2012).
34 Country profiles below based on the information and sources from table VII-10, unless otherwise noted. 35 Petitioners’ prehearing brief, exh. 14, GWEC, Global Wind Report: Annual Market Update 2011, pp. 11, 27.
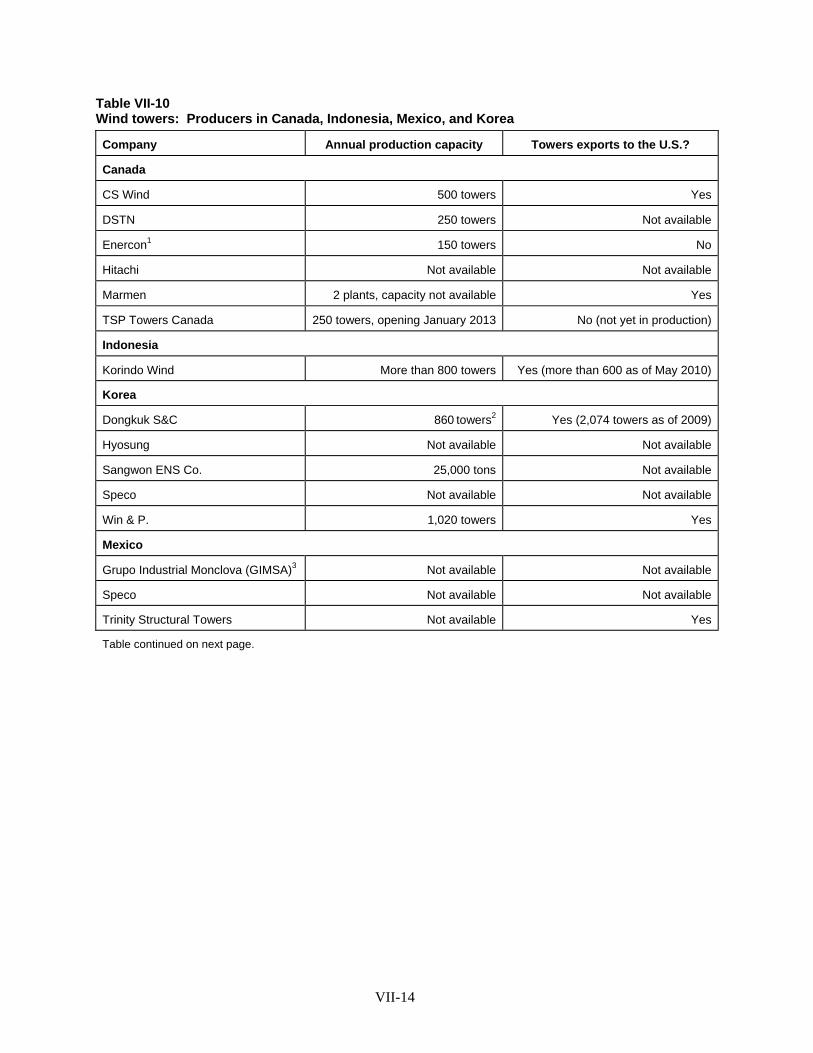
VII-14
Table VII-10 Wind towers: Producers in Canada, Indonesia, Mexico, and Korea
Company Annual production capacity Towers exports to the U.S.?
Canada
CS Wind 500 towers Yes
DSTN 250 towers Not available
Enercon1 150 towers No
Hitachi Not available Not available
Marmen 2 plants, capacity not available Yes
TSP Towers Canada 250 towers, opening January 2013 No (not yet in production)
Indonesia
Korindo Wind More than 800 towers Yes (more than 600 as of May 2010)
Korea
Dongkuk S&C 860 towers2 Yes (2,074 towers as of 2009)
Hyosung Not available Not available
Sangwon ENS Co. 25,000 tons Not available
Speco Not available Not available
Win & P. 1,020 towers Yes
Mexico
Grupo Industrial Monclova (GIMSA)3 Not available Not available
Speco Not available Not available
Trinity Structural Towers Not available Yes
Table continued on next page.
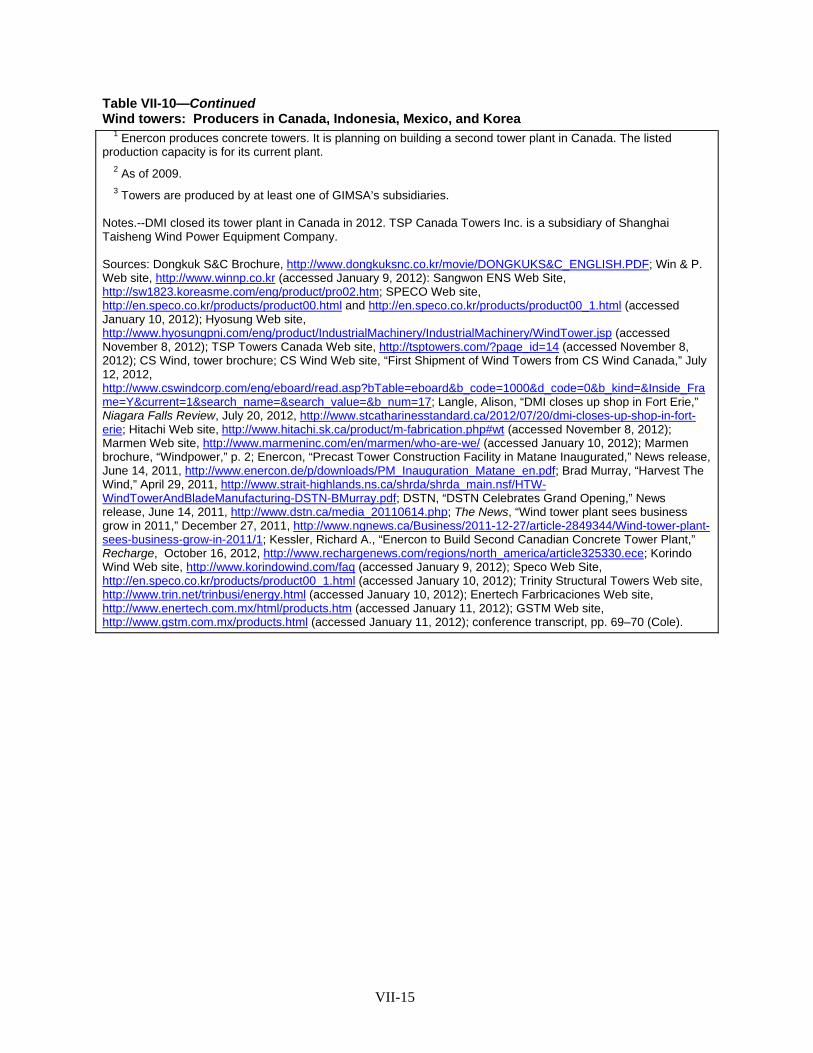
VII-15
Table VII-10—Continued Wind towers: Producers in Canada, Indonesia, Mexico, and Korea 1 Enercon produces concrete towers. It is planning on building a second tower plant in Canada. The listed production capacity is for its current plant. 2 As of 2009. 3 Towers are produced by at least one of GIMSA’s subsidiaries. Notes.--DMI closed its tower plant in Canada in 2012. TSP Canada Towers Inc. is a subsidiary of Shanghai Taisheng Wind Power Equipment Company. Sources: Dongkuk S&C Brochure, http://www.dongkuksnc.co.kr/movie/DONGKUKS&C_ENGLISH.PDF; Win & P. Web site, http://www.winnp.co.kr (accessed January 9, 2012): Sangwon ENS Web Site, http://sw1823.koreasme.com/eng/product/pro02.htm; SPECO Web site, http://en.speco.co.kr/products/product00.html and http://en.speco.co.kr/products/product00_1.html (accessed January 10, 2012); Hyosung Web site, http://www.hyosungpni.com/eng/product/IndustrialMachinery/IndustrialMachinery/WindTower.jsp (accessed November 8, 2012); TSP Towers Canada Web site, http://tsptowers.com/?page_id=14 (accessed November 8, 2012); CS Wind, tower brochure; CS Wind Web site, “First Shipment of Wind Towers from CS Wind Canada,” July 12, 2012, http://www.cswindcorp.com/eng/eboard/read.asp?bTable=eboard&b_code=1000&d_code=0&b_kind=&Inside_Frame=Y¤t=1&search_name=&search_value=&b_num=17; Langle, Alison, “DMI closes up shop in Fort Erie,” Niagara Falls Review, July 20, 2012, http://www.stcatharinesstandard.ca/2012/07/20/dmi-closes-up-shop-in-fort-erie; Hitachi Web site, http://www.hitachi.sk.ca/product/m-fabrication.php#wt (accessed November 8, 2012); Marmen Web site, http://www.marmeninc.com/en/marmen/who-are-we/ (accessed January 10, 2012); Marmen brochure, “Windpower,” p. 2; Enercon, “Precast Tower Construction Facility in Matane Inaugurated,” News release, June 14, 2011, http://www.enercon.de/p/downloads/PM_Inauguration_Matane_en.pdf; Brad Murray, “Harvest The Wind,” April 29, 2011, http://www.strait-highlands.ns.ca/shrda/shrda_main.nsf/HTW-WindTowerAndBladeManufacturing-DSTN-BMurray.pdf; DSTN, “DSTN Celebrates Grand Opening,” News release, June 14, 2011, http://www.dstn.ca/media_20110614.php; The News, “Wind tower plant sees business grow in 2011,” December 27, 2011, http://www.ngnews.ca/Business/2011-12-27/article-2849344/Wind-tower-plant-sees-business-grow-in-2011/1; Kessler, Richard A., “Enercon to Build Second Canadian Concrete Tower Plant,” Recharge, October 16, 2012, http://www.rechargenews.com/regions/north_america/article325330.ece; Korindo Wind Web site, http://www.korindowind.com/faq (accessed January 9, 2012); Speco Web Site, http://en.speco.co.kr/products/product00_1.html (accessed January 10, 2012); Trinity Structural Towers Web site, http://www.trin.net/trinbusi/energy.html (accessed January 10, 2012); Enertech Farbricaciones Web site, http://www.enertech.com.mx/html/products.htm (accessed January 11, 2012); GSTM Web site, http://www.gstm.com.mx/products.html (accessed January 11, 2012); conference transcript, pp. 69–70 (Cole).


APPENDIX A
FEDERAL REGISTER NOTICES

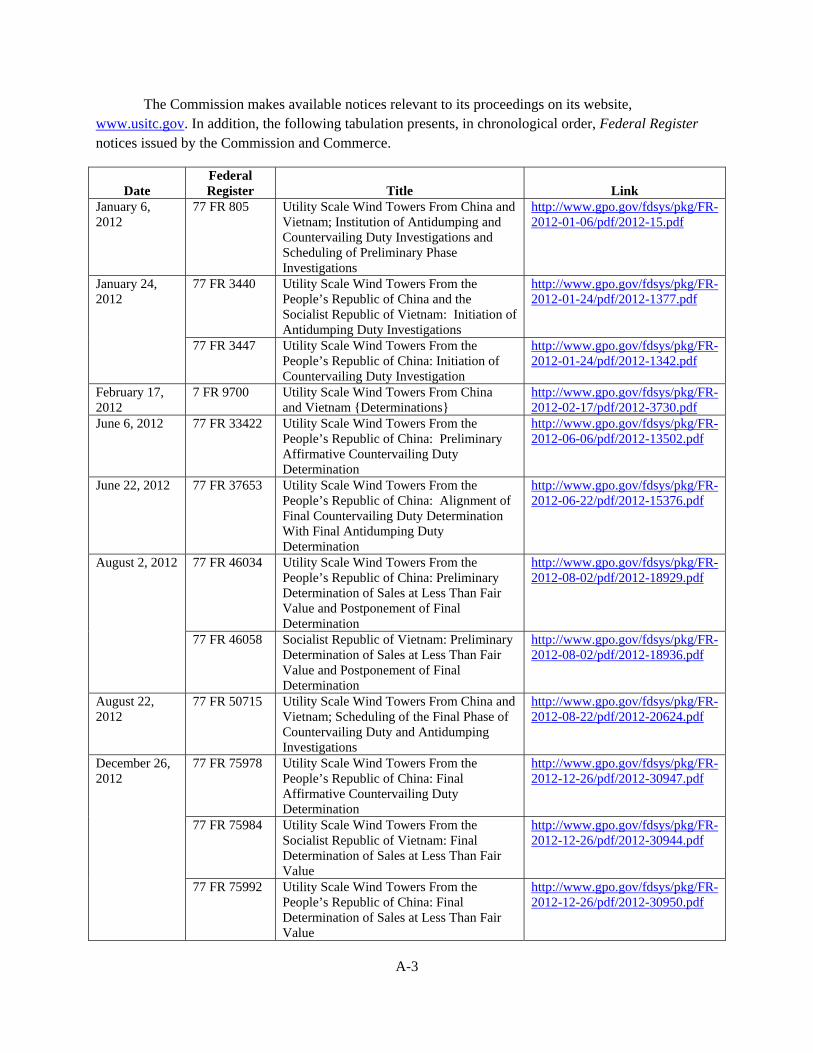
The Commission makes available notices relevant to its proceedings on its website, www.usitc.gov. In addition, the following tabulation presents, in chronological order, Federal Register notices issued by the Commission and Commerce.
Date Federal Register Title Link
January 6, 2012
77 FR 805 Utility Scale Wind Towers From China and Vietnam; Institution of Antidumping and Countervailing Duty Investigations and Scheduling of Preliminary Phase Investigations
http://www.gpo.gov/fdsys/pkg/FR-2012-01-06/pdf/2012-15.pdf
January 24, 2012
77 FR 3440 Utility Scale Wind Towers From the People’s Republic of China and the Socialist Republic of Vietnam: Initiation of Antidumping Duty Investigations
http://www.gpo.gov/fdsys/pkg/FR-2012-01-24/pdf/2012-1377.pdf
77 FR 3447 Utility Scale Wind Towers From the People’s Republic of China: Initiation of Countervailing Duty Investigation
http://www.gpo.gov/fdsys/pkg/FR-2012-01-24/pdf/2012-1342.pdf
February 17, 2012
7 FR 9700 Utility Scale Wind Towers From China and Vietnam {Determinations}
http://www.gpo.gov/fdsys/pkg/FR-2012-02-17/pdf/2012-3730.pdf
June 6, 2012 77 FR 33422 Utility Scale Wind Towers From the People’s Republic of China: Preliminary Affirmative Countervailing Duty Determination
http://www.gpo.gov/fdsys/pkg/FR-2012-06-06/pdf/2012-13502.pdf
June 22, 2012 77 FR 37653 Utility Scale Wind Towers From the People’s Republic of China: Alignment of Final Countervailing Duty Determination With Final Antidumping Duty Determination
http://www.gpo.gov/fdsys/pkg/FR-2012-06-22/pdf/2012-15376.pdf
August 2, 2012 77 FR 46034 Utility Scale Wind Towers From the People’s Republic of China: Preliminary Determination of Sales at Less Than Fair Value and Postponement of Final Determination
http://www.gpo.gov/fdsys/pkg/FR-2012-08-02/pdf/2012-18929.pdf
77 FR 46058 Socialist Republic of Vietnam: Preliminary Determination of Sales at Less Than Fair Value and Postponement of Final Determination
http://www.gpo.gov/fdsys/pkg/FR-2012-08-02/pdf/2012-18936.pdf
August 22, 2012
77 FR 50715 Utility Scale Wind Towers From China and Vietnam; Scheduling of the Final Phase of Countervailing Duty and Antidumping Investigations
http://www.gpo.gov/fdsys/pkg/FR-2012-08-22/pdf/2012-20624.pdf
December 26, 2012
77 FR 75978 Utility Scale Wind Towers From the People’s Republic of China: Final Affirmative Countervailing Duty Determination
http://www.gpo.gov/fdsys/pkg/FR-2012-12-26/pdf/2012-30947.pdf
77 FR 75984 Utility Scale Wind Towers From the Socialist Republic of Vietnam: Final Determination of Sales at Less Than Fair Value
http://www.gpo.gov/fdsys/pkg/FR-2012-12-26/pdf/2012-30944.pdf
77 FR 75992 Utility Scale Wind Towers From the People’s Republic of China: Final Determination of Sales at Less Than Fair Value
http://www.gpo.gov/fdsys/pkg/FR-2012-12-26/pdf/2012-30950.pdf
A-3


B-1
APPENDIX B
HEARING WITNESSES

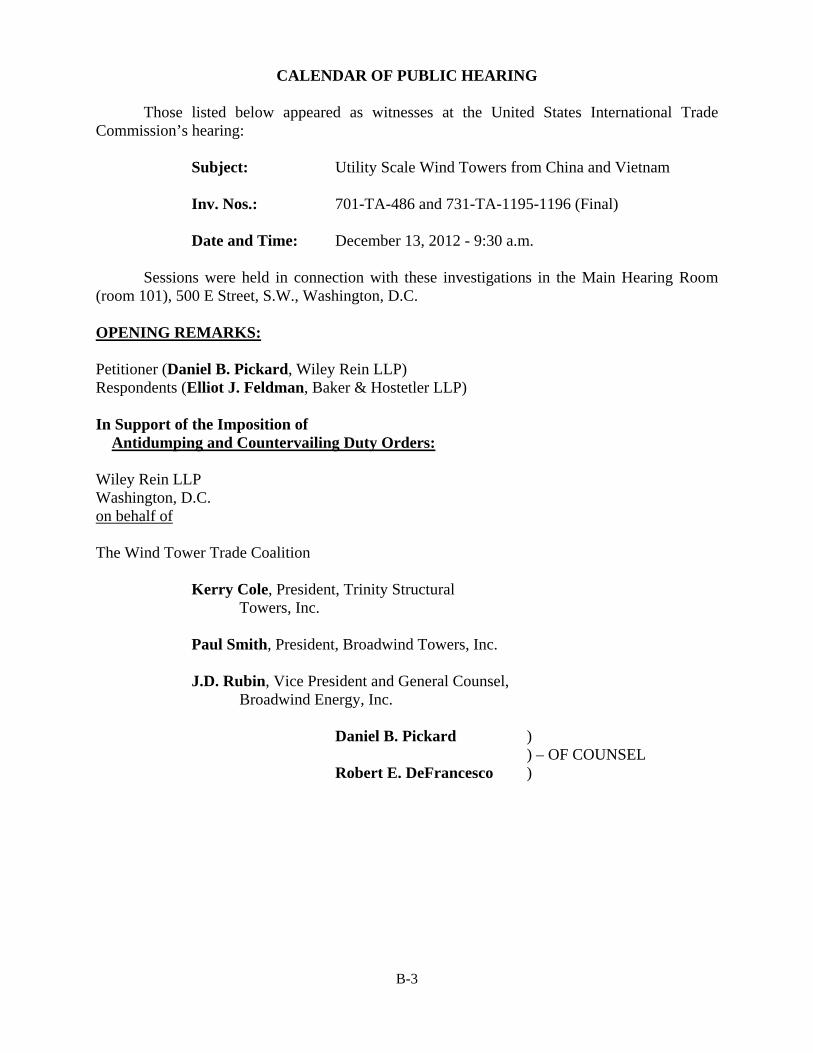
B-3
CALENDAR OF PUBLIC HEARING Those listed below appeared as witnesses at the United States International Trade Commission’s hearing: Subject: Utility Scale Wind Towers from China and Vietnam Inv. Nos.: 701-TA-486 and 731-TA-1195-1196 (Final) Date and Time: December 13, 2012 - 9:30 a.m. Sessions were held in connection with these investigations in the Main Hearing Room (room 101), 500 E Street, S.W., Washington, D.C. OPENING REMARKS: Petitioner (Daniel B. Pickard, Wiley Rein LLP) Respondents (Elliot J. Feldman, Baker & Hostetler LLP) In Support of the Imposition of Antidumping and Countervailing Duty Orders: Wiley Rein LLP Washington, D.C. on behalf of The Wind Tower Trade Coalition Kerry Cole, President, Trinity Structural
Towers, Inc.
Paul Smith, President, Broadwind Towers, Inc. J.D. Rubin, Vice President and General Counsel, Broadwind Energy, Inc. Daniel B. Pickard ) ) – OF COUNSEL Robert E. DeFrancesco )
B-4
In Opposition to the Imposition of Antidumping and Countervailing Duty Orders: Grunfeld Desiderio Lebowitz Silverman Klestadt LLP Washington, D.C. on behalf of CS Wind Tech Co., Ltd. CS Wind Vietnam Co., Ltd. Chengxi Shipyard Co., Ltd. Titan Wind Energy (Suzhou) Co., Ltd. Shanghi Taisheng Wind Power Equipment Co., Ltd. China Chamber of Commerce for Import & Export
of Machinery & Electronics Products
James P. Dougan, Senior Economist, Economic Consulting Services, LLC Lauren Visek, Economist, Economic Consulting
Services, LLC Max F. Schutzman ) ) – OF COUNSEL Ned H. Marshak )
Baker & Hostetler LLP Washington, D.C. on behalf of Siemens Energy, Inc. Siemens Power Generation Michael Revak, Vice President of Sales and
Proposals, Siemens
Kevin Hazel, Vice President of Supply Chain, Siemens Elliot J. Feldman ) ) – OF COUNSEL Michael Snarr ) REBUTTAL/CLOSING REMARKS: Petitioners (Daniel B. Pickard, Wiley Rein LLP) Respondents (Max F. Schutzman, Grunfeld Desiderio Lebowitz
Silverman & Klestadt, LLP; and Elliot J. Feldman, Baker & Hostetler LLP)

APPENDIX C
SUMMARY DATA

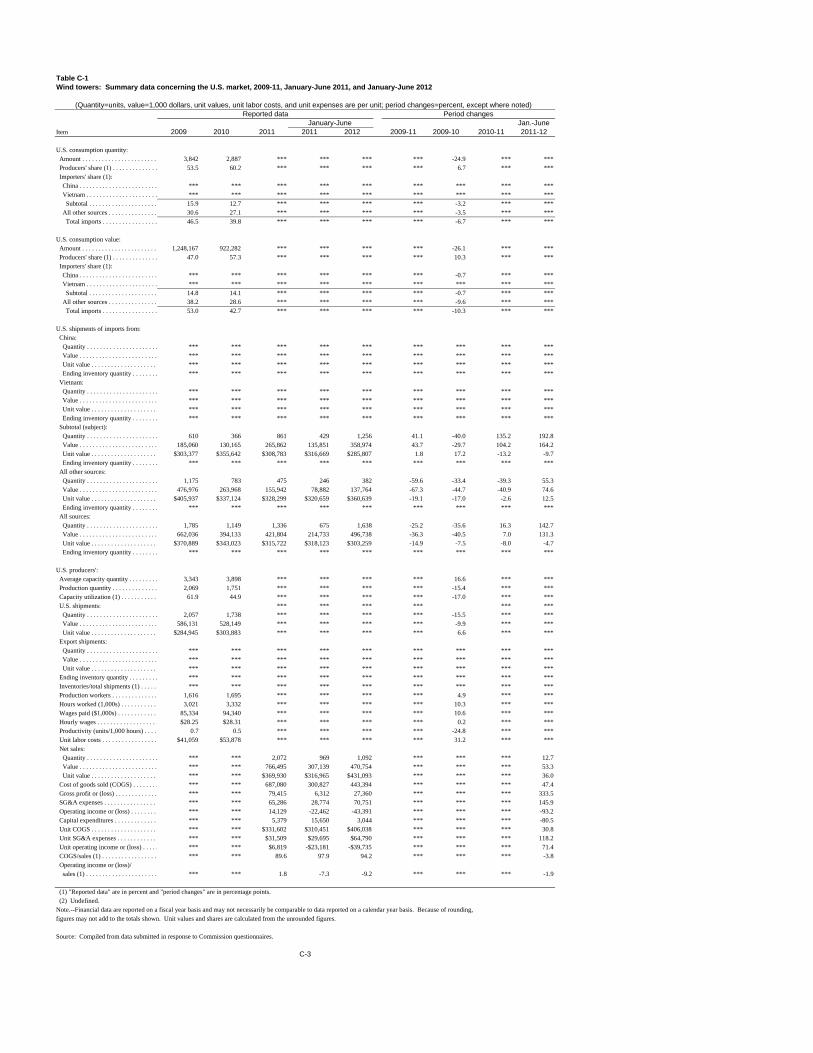
Table C-1Wind towers: Summary data concerning the U.S. market, 2009-11, January-June 2011, and January-June 2012
(Quantity=units, value=1,000 dollars, unit values, unit labor costs, and unit expenses are per unit; period changes=percent, except where noted)Reported data Period changes
January-June Jan.-JuneItem 2009 2010 2011 2011 2012 2009-11 2009-10 2010-11 2011-12
U.S. consumption quantity: Amount . . . . . . . . . . . . . . . . . . . . . . . 3,842 2,887 *** *** *** *** -24.9 *** *** Producers' share (1) . . . . . . . . . . . . . . 53.5 60.2 *** *** *** *** 6.7 *** *** Importers' share (1): China . . . . . . . . . . . . . . . . . . . . . . . . *** *** *** *** *** *** *** *** *** Vietnam . . . . . . . . . . . . . . . . . . . . . . *** *** *** *** *** *** *** *** *** Subtotal . . . . . . . . . . . . . . . . . . . . . 15.9 12.7 *** *** *** *** -3.2 *** *** All other sources . . . . . . . . . . . . . . . 30.6 27.1 *** *** *** *** -3.5 *** *** Total imports . . . . . . . . . . . . . . . . . 46.5 39.8 *** *** *** *** -6.7 *** ***
U.S. consumption value: Amount . . . . . . . . . . . . . . . . . . . . . . . 1,248,167 922,282 *** *** *** *** -26.1 *** *** Producers' share (1) . . . . . . . . . . . . . . 47.0 57.3 *** *** *** *** 10.3 *** *** Importers' share (1): China . . . . . . . . . . . . . . . . . . . . . . . . *** *** *** *** *** *** -0.7 *** *** Vietnam . . . . . . . . . . . . . . . . . . . . . . *** *** *** *** *** *** *** *** *** Subtotal . . . . . . . . . . . . . . . . . . . . . 14.8 14.1 *** *** *** *** -0.7 *** *** All other sources . . . . . . . . . . . . . . . 38.2 28.6 *** *** *** *** -9.6 *** *** Total imports . . . . . . . . . . . . . . . . . 53.0 42.7 *** *** *** *** -10.3 *** ***
U.S. shipments of imports from: China: Quantity . . . . . . . . . . . . . . . . . . . . . . *** *** *** *** *** *** *** *** *** Value . . . . . . . . . . . . . . . . . . . . . . . . *** *** *** *** *** *** *** *** *** Unit value . . . . . . . . . . . . . . . . . . . . *** *** *** *** *** *** *** *** *** Ending inventory quantity . . . . . . . . *** *** *** *** *** *** *** *** *** Vietnam: Quantity . . . . . . . . . . . . . . . . . . . . . . *** *** *** *** *** *** *** *** *** Value . . . . . . . . . . . . . . . . . . . . . . . . *** *** *** *** *** *** *** *** *** Unit value . . . . . . . . . . . . . . . . . . . . *** *** *** *** *** *** *** *** *** Ending inventory quantity . . . . . . . . *** *** *** *** *** *** *** *** *** Subtotal (subject): Quantity . . . . . . . . . . . . . . . . . . . . . . 610 366 861 429 1,256 41.1 -40.0 135.2 192.8 Value . . . . . . . . . . . . . . . . . . . . . . . . 185,060 130,165 265,862 135,851 358,974 43.7 -29.7 104.2 164.2 Unit value . . . . . . . . . . . . . . . . . . . . $303,377 $355,642 $308,783 $316,669 $285,807 1.8 17.2 -13.2 -9.7 Ending inventory quantity . . . . . . . . *** *** *** *** *** *** *** *** *** All other sources: Quantity . . . . . . . . . . . . . . . . . . . . . . 1,175 783 475 246 382 -59.6 -33.4 -39.3 55.3 Value . . . . . . . . . . . . . . . . . . . . . . . . 476,976 263,968 155,942 78,882 137,764 -67.3 -44.7 -40.9 74.6 Unit value . . . . . . . . . . . . . . . . . . . . $405,937 $337,124 $328,299 $320,659 $360,639 -19.1 -17.0 -2.6 12.5 Ending inventory quantity . . . . . . . . *** *** *** *** *** *** *** *** *** All sources: Quantity . . . . . . . . . . . . . . . . . . . . . . 1,785 1,149 1,336 675 1,638 -25.2 -35.6 16.3 142.7 Value . . . . . . . . . . . . . . . . . . . . . . . . 662,036 394,133 421,804 214,733 496,738 -36.3 -40.5 7.0 131.3 Unit value . . . . . . . . . . . . . . . . . . . . $370,889 $343,023 $315,722 $318,123 $303,259 -14.9 -7.5 -8.0 -4.7 Ending inventory quantity . . . . . . . . *** *** *** *** *** *** *** *** ***
U.S. producers': Average capacity quantity . . . . . . . . . 3,343 3,898 *** *** *** *** 16.6 *** *** Production quantity . . . . . . . . . . . . . . 2,069 1,751 *** *** *** *** -15.4 *** *** Capacity utilization (1) . . . . . . . . . . . 61.9 44.9 *** *** *** *** -17.0 *** *** U.S. shipments: *** *** *** *** *** *** Quantity . . . . . . . . . . . . . . . . . . . . . . 2,057 1,738 *** *** *** *** -15.5 *** *** Value . . . . . . . . . . . . . . . . . . . . . . . . 586,131 528,149 *** *** *** *** -9.9 *** *** Unit value . . . . . . . . . . . . . . . . . . . . $284,945 $303,883 *** *** *** *** 6.6 *** *** Export shipments: Quantity . . . . . . . . . . . . . . . . . . . . . . *** *** *** *** *** *** *** *** *** Value . . . . . . . . . . . . . . . . . . . . . . . . *** *** *** *** *** *** *** *** *** Unit value . . . . . . . . . . . . . . . . . . . . *** *** *** *** *** *** *** *** *** Ending inventory quantity . . . . . . . . . *** *** *** *** *** *** *** *** *** Inventories/total shipments (1) . . . . . *** *** *** *** *** *** *** *** *** Production workers . . . . . . . . . . . . . . 1,616 1,695 *** *** *** *** 4.9 *** *** Hours worked (1,000s) . . . . . . . . . . . 3,021 3,332 *** *** *** *** 10.3 *** *** Wages paid ($1,000s) . . . . . . . . . . . . 85,334 94,340 *** *** *** *** 10.6 *** *** Hourly wages . . . . . . . . . . . . . . . . . . . $28.25 $28.31 *** *** *** *** 0.2 *** *** Productivity (units/1,000 hours) . . . . 0.7 0.5 *** *** *** *** -24.8 *** *** Unit labor costs . . . . . . . . . . . . . . . . . $41,059 $53,878 *** *** *** *** 31.2 *** *** Net sales: Quantity . . . . . . . . . . . . . . . . . . . . . . *** *** 2,072 969 1,092 *** *** *** 12.7 Value . . . . . . . . . . . . . . . . . . . . . . . . *** *** 766,495 307,139 470,754 *** *** *** 53.3 Unit value . . . . . . . . . . . . . . . . . . . . *** *** $369,930 $316,965 $431,093 *** *** *** 36.0 Cost of goods sold (COGS) . . . . . . . . *** *** 687,080 300,827 443,394 *** *** *** 47.4 Gross profit or (loss) . . . . . . . . . . . . . *** *** 79,415 6,312 27,360 *** *** *** 333.5 SG&A expenses . . . . . . . . . . . . . . . . *** *** 65,286 28,774 70,751 *** *** *** 145.9 Operating income or (loss) . . . . . . . . *** *** 14,129 -22,462 -43,391 *** *** *** -93.2 Capital expenditures . . . . . . . . . . . . . *** *** 5,379 15,650 3,044 *** *** *** -80.5 Unit COGS . . . . . . . . . . . . . . . . . . . . *** *** $331,602 $310,451 $406,038 *** *** *** 30.8 Unit SG&A expenses . . . . . . . . . . . . *** *** $31,509 $29,695 $64,790 *** *** *** 118.2 Unit operating income or (loss) . . . . . *** *** $6,819 -$23,181 -$39,735 *** *** *** 71.4 COGS/sales (1) . . . . . . . . . . . . . . . . . *** *** 89.6 97.9 94.2 *** *** *** -3.8 Operating income or (loss)/ sales (1) . . . . . . . . . . . . . . . . . . . . . . *** *** 1.8 -7.3 -9.2 *** *** *** -1.9
(1) "Reported data" are in percent and "period changes" are in percentage points. (2) Undefined.Note.--Financial data are reported on a fiscal year basis and may not necessarily be comparable to data reported on a calendar year basis. Because of rounding,figures may not add to the totals shown. Unit values and shares are calculated from the unrounded figures.
Source: Compiled from data submitted in response to Commission questionnaires.
C-3
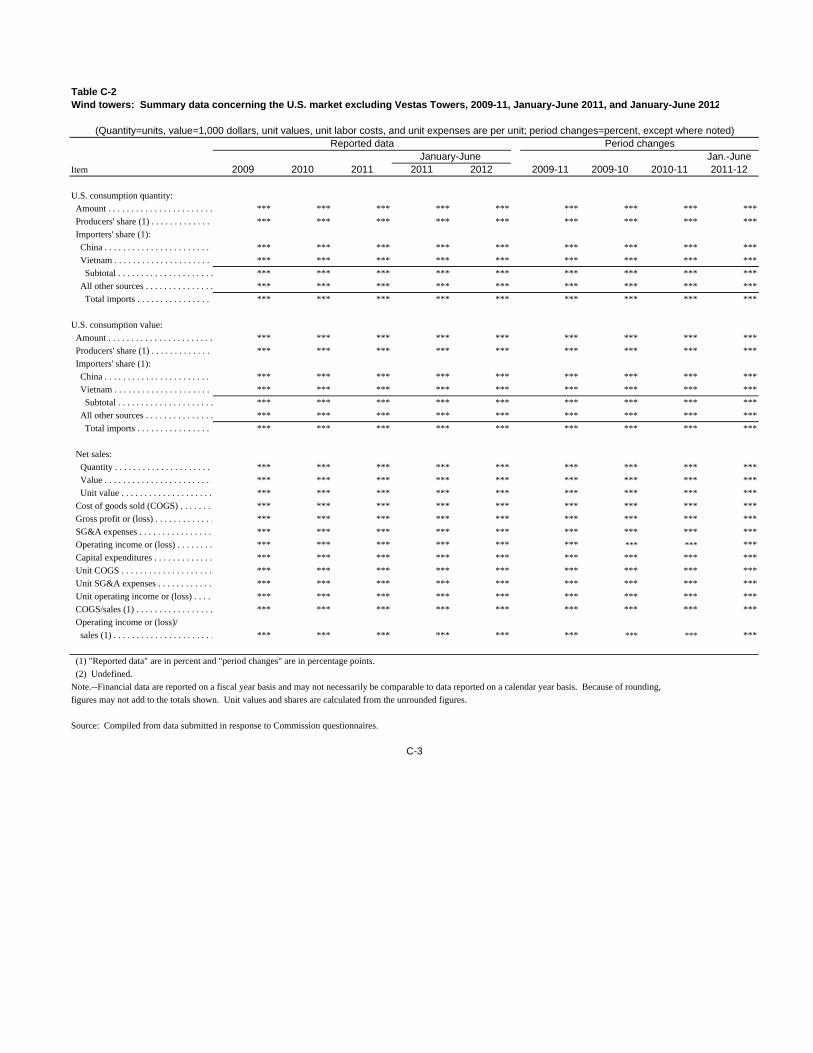
Table C-2Wind towers: Summary data concerning the U.S. market excluding Vestas Towers, 2009-11, January-June 2011, and January-June 2012
(Quantity=units, value=1,000 dollars, unit values, unit labor costs, and unit expenses are per unit; period changes=percent, except where noted)Reported data Period changes
January-June Jan.-JuneItem 2009 2010 2011 2011 2012 2009-11 2009-10 2010-11 2011-12
U.S. consumption quantity:
Amount . . . . . . . . . . . . . . . . . . . . . . . *** *** *** *** *** *** *** *** ***
Producers' share (1) . . . . . . . . . . . . . *** *** *** *** *** *** *** *** ***
Importers' share (1):
China . . . . . . . . . . . . . . . . . . . . . . . . *** *** *** *** *** *** *** *** ***
Vietnam . . . . . . . . . . . . . . . . . . . . . . *** *** *** *** *** *** *** *** ***
Subtotal . . . . . . . . . . . . . . . . . . . . . *** *** *** *** *** *** *** *** ***
All other sources . . . . . . . . . . . . . . . *** *** *** *** *** *** *** *** ***
Total imports . . . . . . . . . . . . . . . . . *** *** *** *** *** *** *** *** ***
U.S. consumption value:
Amount . . . . . . . . . . . . . . . . . . . . . . . *** *** *** *** *** *** *** *** ***
Producers' share (1) . . . . . . . . . . . . . *** *** *** *** *** *** *** *** ***
Importers' share (1):
China . . . . . . . . . . . . . . . . . . . . . . . . *** *** *** *** *** *** *** *** ***
Vietnam . . . . . . . . . . . . . . . . . . . . . . *** *** *** *** *** *** *** *** ***
Subtotal . . . . . . . . . . . . . . . . . . . . . *** *** *** *** *** *** *** *** ***
All other sources . . . . . . . . . . . . . . . *** *** *** *** *** *** *** *** ***
Total imports . . . . . . . . . . . . . . . . . *** *** *** *** *** *** *** *** ***
Net sales:
Quantity . . . . . . . . . . . . . . . . . . . . . *** *** *** *** *** *** *** *** ***
Value . . . . . . . . . . . . . . . . . . . . . . . . *** *** *** *** *** *** *** *** ***
Unit value . . . . . . . . . . . . . . . . . . . . *** *** *** *** *** *** *** *** ***
Cost of goods sold (COGS) . . . . . . . *** *** *** *** *** *** *** *** ***
Gross profit or (loss) . . . . . . . . . . . . . *** *** *** *** *** *** *** *** ***
SG&A expenses . . . . . . . . . . . . . . . . *** *** *** *** *** *** *** *** ***
Operating income or (loss) . . . . . . . . *** *** *** *** *** *** *** *** ***
Capital expenditures . . . . . . . . . . . . . *** *** *** *** *** *** *** *** ***
Unit COGS . . . . . . . . . . . . . . . . . . . . *** *** *** *** *** *** *** *** ***
Unit SG&A expenses . . . . . . . . . . . . *** *** *** *** *** *** *** *** ***
Unit operating income or (loss) . . . . *** *** *** *** *** *** *** *** ***
COGS/sales (1) . . . . . . . . . . . . . . . . . *** *** *** *** *** *** *** *** ***
Operating income or (loss)/
sales (1) . . . . . . . . . . . . . . . . . . . . . . *** *** *** *** *** *** *** *** ***
(1) "Reported data" are in percent and "period changes" are in percentage points.
(2) Undefined.
Note.--Financial data are reported on a fiscal year basis and may not necessarily be comparable to data reported on a calendar year basis. Because of rounding,
figures may not add to the totals shown. Unit values and shares are calculated from the unrounded figures.
Source: Compiled from data submitted in response to Commission questionnaires.
C-3
D-1
APPENDIX D
WIND TOWER PROJECTS IN THE UNITED STATES

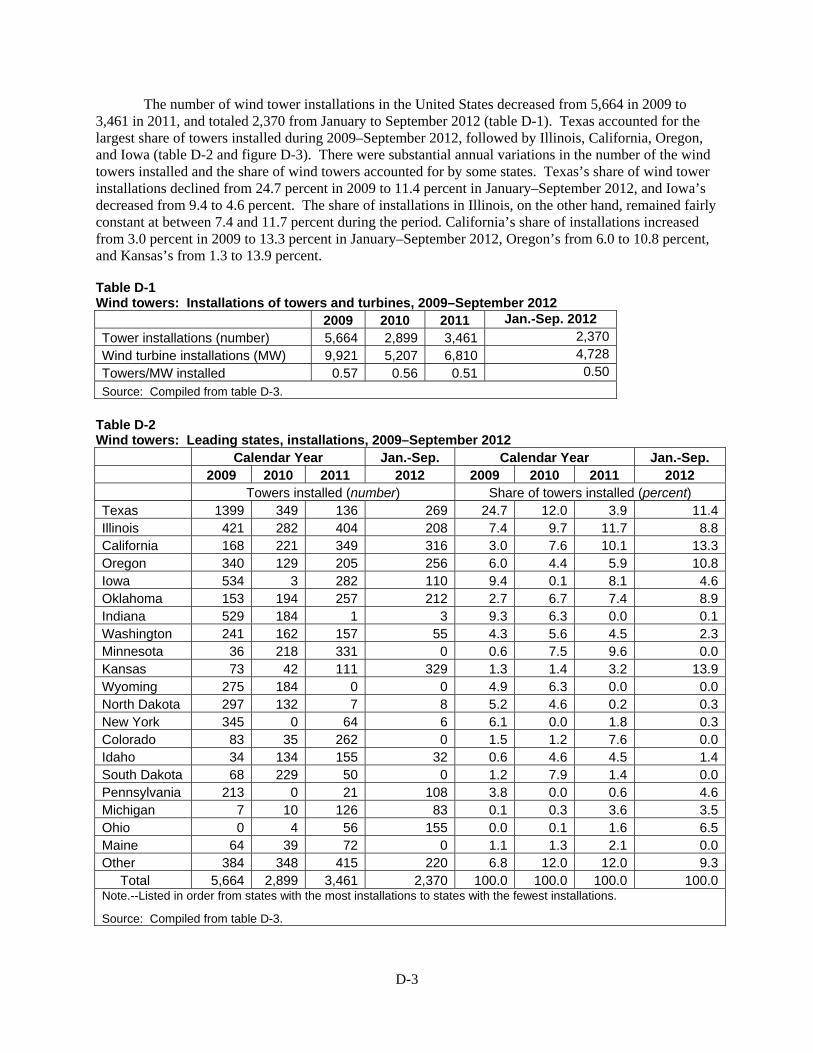
D-3
The number of wind tower installations in the United States decreased from 5,664 in 2009 to 3,461 in 2011, and totaled 2,370 from January to September 2012 (table D-1). Texas accounted for the largest share of towers installed during 2009–September 2012, followed by Illinois, California, Oregon, and Iowa (table D-2 and figure D-3). There were substantial annual variations in the number of the wind towers installed and the share of wind towers accounted for by some states. Texas’s share of wind tower installations declined from 24.7 percent in 2009 to 11.4 percent in January–September 2012, and Iowa’s decreased from 9.4 to 4.6 percent. The share of installations in Illinois, on the other hand, remained fairly constant at between 7.4 and 11.7 percent during the period. California’s share of installations increased from 3.0 percent in 2009 to 13.3 percent in January–September 2012, Oregon’s from 6.0 to 10.8 percent, and Kansas’s from 1.3 to 13.9 percent.
Table D-1 Wind towers: Installations of towers and turbines, 2009–September 2012
2009 2010 2011 Jan.-Sep. 2012 Tower installations (number) 5,664 2,899 3,461 2,370 Wind turbine installations (MW) 9,921 5,207 6,810 4,728 Towers/MW installed 0.57 0.56 0.51 0.50 Source: Compiled from table D-3. Table D-2 Wind towers: Leading states, installations, 2009–September 2012 Calendar Year Jan.-Sep. Calendar Year Jan.-Sep. 2009 2010 2011 2012 2009 2010 2011 2012 Towers installed (number) Share of towers installed (percent) Texas 1399 349 136 269 24.7 12.0 3.9 11.4Illinois 421 282 404 208 7.4 9.7 11.7 8.8California 168 221 349 316 3.0 7.6 10.1 13.3Oregon 340 129 205 256 6.0 4.4 5.9 10.8Iowa 534 3 282 110 9.4 0.1 8.1 4.6Oklahoma 153 194 257 212 2.7 6.7 7.4 8.9Indiana 529 184 1 3 9.3 6.3 0.0 0.1Washington 241 162 157 55 4.3 5.6 4.5 2.3Minnesota 36 218 331 0 0.6 7.5 9.6 0.0Kansas 73 42 111 329 1.3 1.4 3.2 13.9Wyoming 275 184 0 0 4.9 6.3 0.0 0.0North Dakota 297 132 7 8 5.2 4.6 0.2 0.3New York 345 0 64 6 6.1 0.0 1.8 0.3Colorado 83 35 262 0 1.5 1.2 7.6 0.0Idaho 34 134 155 32 0.6 4.6 4.5 1.4South Dakota 68 229 50 0 1.2 7.9 1.4 0.0Pennsylvania 213 0 21 108 3.8 0.0 0.6 4.6Michigan 7 10 126 83 0.1 0.3 3.6 3.5Ohio 0 4 56 155 0.0 0.1 1.6 6.5Maine 64 39 72 0 1.1 1.3 2.1 0.0Other 384 348 415 220 6.8 12.0 12.0 9.3 Total 5,664 2,899 3,461 2,370 100.0 100.0 100.0 100.0Note.--Listed in order from states with the most installations to states with the fewest installations. Source: Compiled from table D-3.
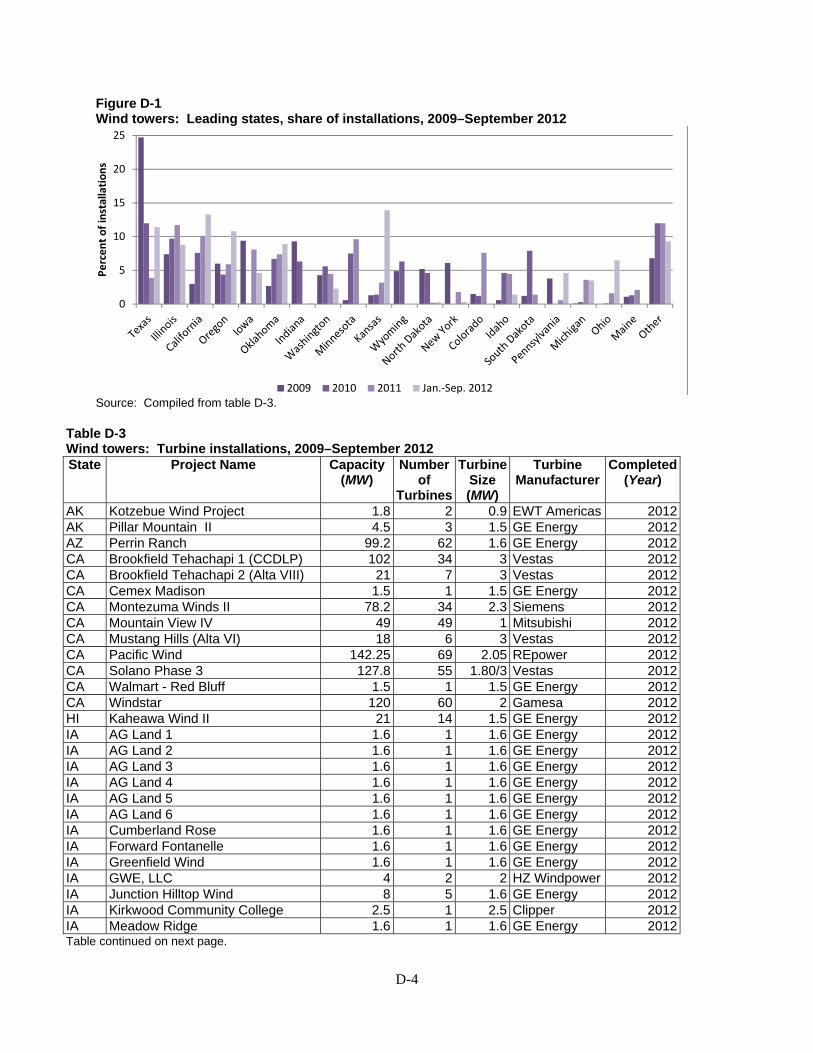
D-4
Figure D-1 Wind towers: Leading states, share of installations, 2009–September 2012
Source: Compiled from table D-3.
Table D-3 Wind towers: Turbine installations, 2009–September 2012 State Project Name Capacity
(MW) Number
of Turbines
Turbine Size (MW)
Turbine Manufacturer
Completed (Year)
AK Kotzebue Wind Project 1.8 2 0.9 EWT Americas 2012AK Pillar Mountain II 4.5 3 1.5 GE Energy 2012AZ Perrin Ranch 99.2 62 1.6 GE Energy 2012CA Brookfield Tehachapi 1 (CCDLP) 102 34 3 Vestas 2012CA Brookfield Tehachapi 2 (Alta VIII) 21 7 3 Vestas 2012CA Cemex Madison 1.5 1 1.5 GE Energy 2012CA Montezuma Winds II 78.2 34 2.3 Siemens 2012CA Mountain View IV 49 49 1 Mitsubishi 2012CA Mustang Hills (Alta VI) 18 6 3 Vestas 2012CA Pacific Wind 142.25 69 2.05 REpower 2012CA Solano Phase 3 127.8 55 1.80/3 Vestas 2012CA Walmart - Red Bluff 1.5 1 1.5 GE Energy 2012CA Windstar 120 60 2 Gamesa 2012HI Kaheawa Wind II 21 14 1.5 GE Energy 2012IA AG Land 1 1.6 1 1.6 GE Energy 2012IA AG Land 2 1.6 1 1.6 GE Energy 2012IA AG Land 3 1.6 1 1.6 GE Energy 2012IA AG Land 4 1.6 1 1.6 GE Energy 2012IA AG Land 5 1.6 1 1.6 GE Energy 2012IA AG Land 6 1.6 1 1.6 GE Energy 2012IA Cumberland Rose 1.6 1 1.6 GE Energy 2012IA Forward Fontanelle 1.6 1 1.6 GE Energy 2012IA Greenfield Wind 1.6 1 1.6 GE Energy 2012IA GWE, LLC 4 2 2 HZ Windpower 2012IA Junction Hilltop Wind 8 5 1.6 GE Energy 2012IA Kirkwood Community College 2.5 1 2.5 Clipper 2012IA Meadow Ridge 1.6 1 1.6 GE Energy 2012Table continued on next page.
0
5
10
15
20
25
Percent of installations
2009 2010 2011 Jan.‐Sep. 2012
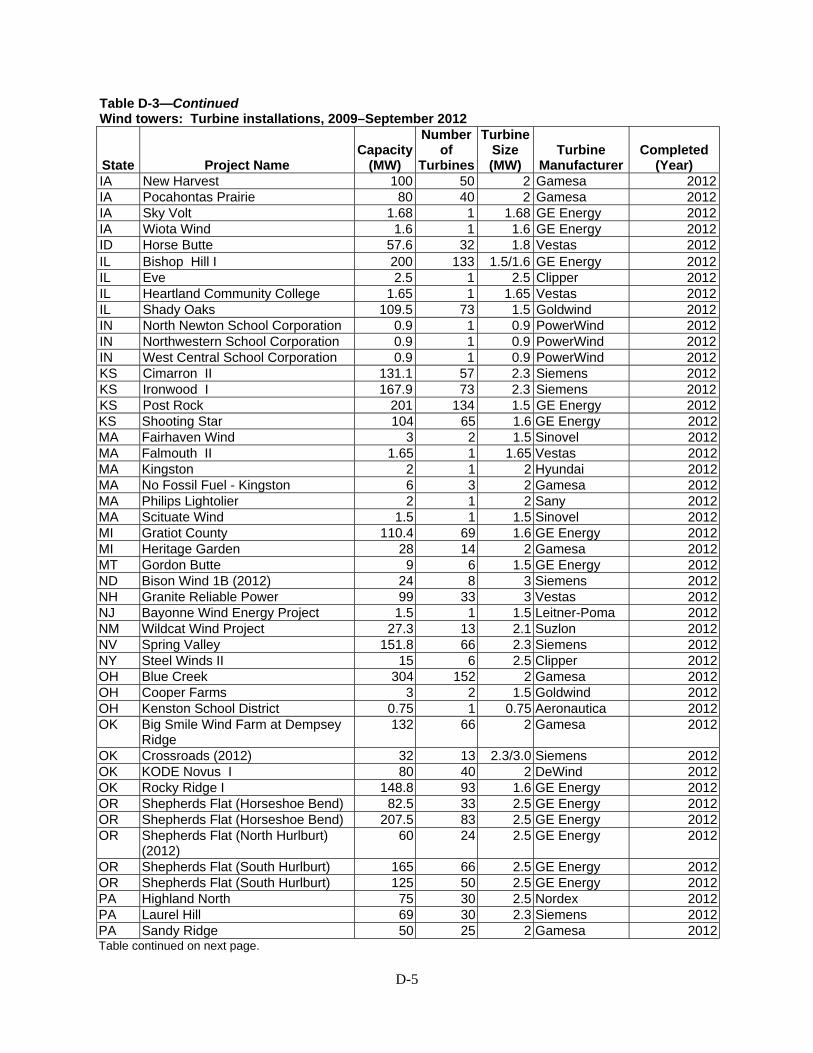
D-5
Table D-3—Continued Wind towers: Turbine installations, 2009–September 2012
State Project Name Capacity
(MW)
Number of
Turbines
Turbine Size (MW)
Turbine Manufacturer
Completed (Year)
IA New Harvest 100 50 2 Gamesa 2012IA Pocahontas Prairie 80 40 2 Gamesa 2012IA Sky Volt 1.68 1 1.68 GE Energy 2012IA Wiota Wind 1.6 1 1.6 GE Energy 2012ID Horse Butte 57.6 32 1.8 Vestas 2012IL Bishop Hill I 200 133 1.5/1.6 GE Energy 2012IL Eve 2.5 1 2.5 Clipper 2012IL Heartland Community College 1.65 1 1.65 Vestas 2012IL Shady Oaks 109.5 73 1.5 Goldwind 2012IN North Newton School Corporation 0.9 1 0.9 PowerWind 2012IN Northwestern School Corporation 0.9 1 0.9 PowerWind 2012IN West Central School Corporation 0.9 1 0.9 PowerWind 2012KS Cimarron II 131.1 57 2.3 Siemens 2012KS Ironwood I 167.9 73 2.3 Siemens 2012KS Post Rock 201 134 1.5 GE Energy 2012KS Shooting Star 104 65 1.6 GE Energy 2012MA Fairhaven Wind 3 2 1.5 Sinovel 2012MA Falmouth II 1.65 1 1.65 Vestas 2012MA Kingston 2 1 2 Hyundai 2012MA No Fossil Fuel - Kingston 6 3 2 Gamesa 2012MA Philips Lightolier 2 1 2 Sany 2012MA Scituate Wind 1.5 1 1.5 Sinovel 2012MI Gratiot County 110.4 69 1.6 GE Energy 2012MI Heritage Garden 28 14 2 Gamesa 2012MT Gordon Butte 9 6 1.5 GE Energy 2012ND Bison Wind 1B (2012) 24 8 3 Siemens 2012NH Granite Reliable Power 99 33 3 Vestas 2012NJ Bayonne Wind Energy Project 1.5 1 1.5 Leitner-Poma 2012NM Wildcat Wind Project 27.3 13 2.1 Suzlon 2012NV Spring Valley 151.8 66 2.3 Siemens 2012NY Steel Winds II 15 6 2.5 Clipper 2012OH Blue Creek 304 152 2 Gamesa 2012OH Cooper Farms 3 2 1.5 Goldwind 2012OH Kenston School District 0.75 1 0.75 Aeronautica 2012OK Big Smile Wind Farm at Dempsey
Ridge 132 66 2 Gamesa 2012
OK Crossroads (2012) 32 13 2.3/3.0 Siemens 2012OK KODE Novus I 80 40 2 DeWind 2012OK Rocky Ridge I 148.8 93 1.6 GE Energy 2012OR Shepherds Flat (Horseshoe Bend) 82.5 33 2.5 GE Energy 2012OR Shepherds Flat (Horseshoe Bend) 207.5 83 2.5 GE Energy 2012OR Shepherds Flat (North Hurlburt)
(2012) 60 24 2.5 GE Energy 2012
OR Shepherds Flat (South Hurlburt) 165 66 2.5 GE Energy 2012OR Shepherds Flat (South Hurlburt) 125 50 2.5 GE Energy 2012PA Highland North 75 30 2.5 Nordex 2012PA Laurel Hill 69 30 2.3 Siemens 2012PA Sandy Ridge 50 25 2 Gamesa 2012Table continued on next page.
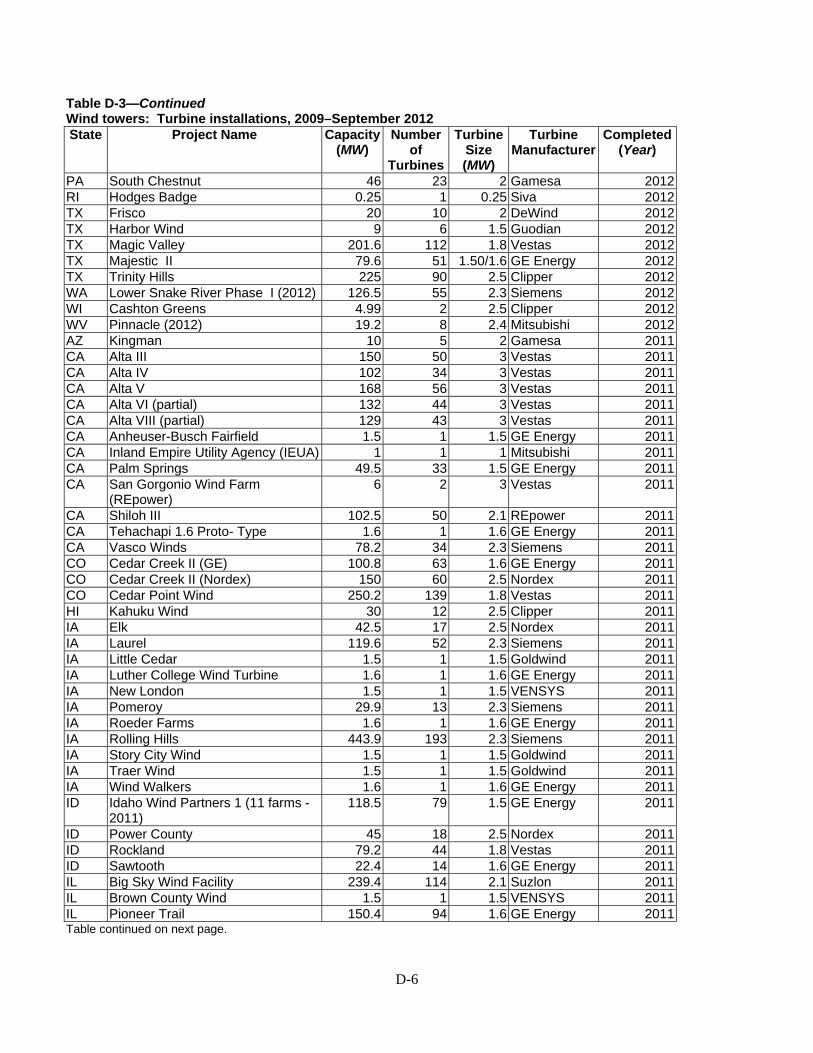
D-6
Table D-3—Continued Wind towers: Turbine installations, 2009–September 2012 State Project Name Capacity
(MW) Number
of Turbines
Turbine Size (MW)
Turbine Manufacturer
Completed (Year)
PA South Chestnut 46 23 2 Gamesa 2012RI Hodges Badge 0.25 1 0.25 Siva 2012TX Frisco 20 10 2 DeWind 2012TX Harbor Wind 9 6 1.5 Guodian 2012TX Magic Valley 201.6 112 1.8 Vestas 2012TX Majestic II 79.6 51 1.50/1.6 GE Energy 2012TX Trinity Hills 225 90 2.5 Clipper 2012WA Lower Snake River Phase I (2012) 126.5 55 2.3 Siemens 2012WI Cashton Greens 4.99 2 2.5 Clipper 2012WV Pinnacle (2012) 19.2 8 2.4 Mitsubishi 2012AZ Kingman 10 5 2 Gamesa 2011CA Alta III 150 50 3 Vestas 2011CA Alta IV 102 34 3 Vestas 2011CA Alta V 168 56 3 Vestas 2011CA Alta VI (partial) 132 44 3 Vestas 2011CA Alta VIII (partial) 129 43 3 Vestas 2011CA Anheuser-Busch Fairfield 1.5 1 1.5 GE Energy 2011CA Inland Empire Utility Agency (IEUA) 1 1 1 Mitsubishi 2011CA Palm Springs 49.5 33 1.5 GE Energy 2011CA San Gorgonio Wind Farm
(REpower) 6 2 3 Vestas 2011
CA Shiloh III 102.5 50 2.1 REpower 2011CA Tehachapi 1.6 Proto- Type 1.6 1 1.6 GE Energy 2011CA Vasco Winds 78.2 34 2.3 Siemens 2011CO Cedar Creek II (GE) 100.8 63 1.6 GE Energy 2011CO Cedar Creek II (Nordex) 150 60 2.5 Nordex 2011CO Cedar Point Wind 250.2 139 1.8 Vestas 2011HI Kahuku Wind 30 12 2.5 Clipper 2011IA Elk 42.5 17 2.5 Nordex 2011IA Laurel 119.6 52 2.3 Siemens 2011IA Little Cedar 1.5 1 1.5 Goldwind 2011IA Luther College Wind Turbine 1.6 1 1.6 GE Energy 2011IA New London 1.5 1 1.5 VENSYS 2011IA Pomeroy 29.9 13 2.3 Siemens 2011IA Roeder Farms 1.6 1 1.6 GE Energy 2011IA Rolling Hills 443.9 193 2.3 Siemens 2011IA Story City Wind 1.5 1 1.5 Goldwind 2011IA Traer Wind 1.5 1 1.5 Goldwind 2011IA Wind Walkers 1.6 1 1.6 GE Energy 2011ID Idaho Wind Partners 1 (11 farms -
2011) 118.5 79 1.5 GE Energy 2011
ID Power County 45 18 2.5 Nordex 2011ID Rockland 79.2 44 1.8 Vestas 2011ID Sawtooth 22.4 14 1.6 GE Energy 2011IL Big Sky Wind Facility 239.4 114 2.1 Suzlon 2011IL Brown County Wind 1.5 1 1.5 VENSYS 2011IL Pioneer Trail 150.4 94 1.6 GE Energy 2011Table continued on next page.
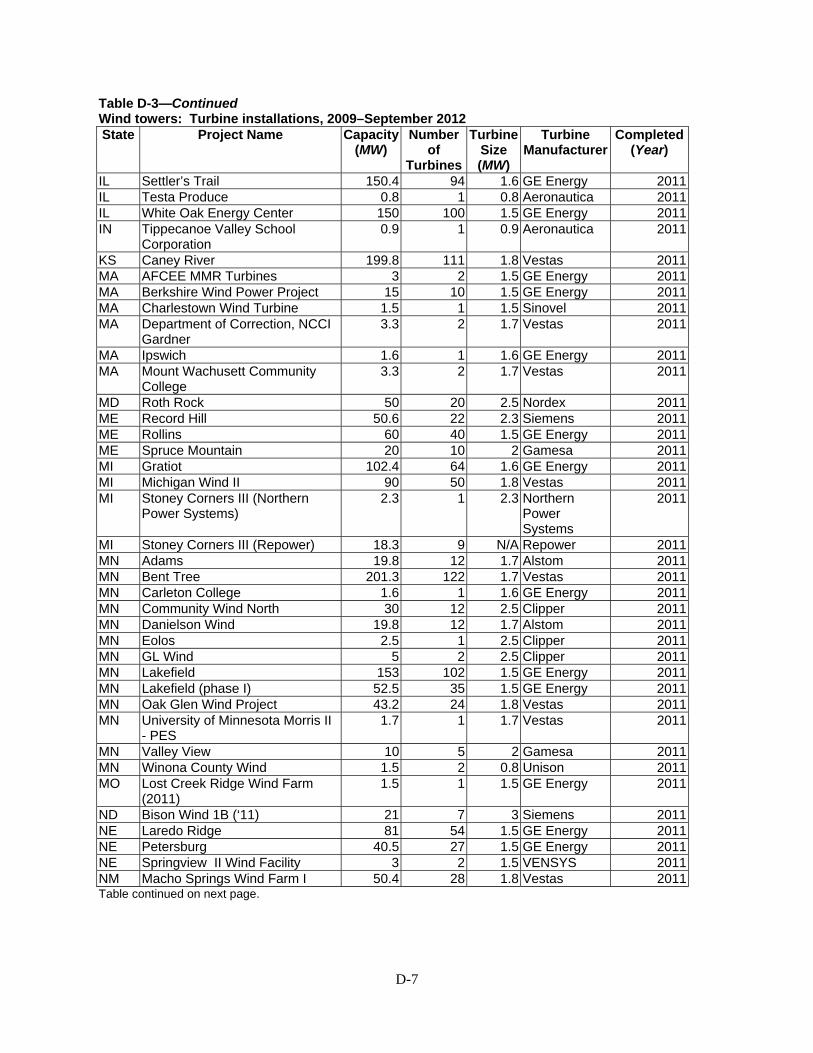
D-7
Table D-3—Continued Wind towers: Turbine installations, 2009–September 2012State Project Name Capacity
(MW) Number
of Turbines
Turbine Size (MW)
Turbine Manufacturer
Completed (Year)
IL Settler’s Trail 150.4 94 1.6 GE Energy 2011IL Testa Produce 0.8 1 0.8 Aeronautica 2011IL White Oak Energy Center 150 100 1.5 GE Energy 2011IN Tippecanoe Valley School
Corporation 0.9 1 0.9 Aeronautica 2011
KS Caney River 199.8 111 1.8 Vestas 2011MA AFCEE MMR Turbines 3 2 1.5 GE Energy 2011MA Berkshire Wind Power Project 15 10 1.5 GE Energy 2011MA Charlestown Wind Turbine 1.5 1 1.5 Sinovel 2011MA Department of Correction, NCCI
Gardner 3.3 2 1.7 Vestas 2011
MA Ipswich 1.6 1 1.6 GE Energy 2011MA Mount Wachusett Community
College 3.3 2 1.7 Vestas 2011
MD Roth Rock 50 20 2.5 Nordex 2011ME Record Hill 50.6 22 2.3 Siemens 2011ME Rollins 60 40 1.5 GE Energy 2011ME Spruce Mountain 20 10 2 Gamesa 2011MI Gratiot 102.4 64 1.6 GE Energy 2011MI Michigan Wind II 90 50 1.8 Vestas 2011MI Stoney Corners III (Northern
Power Systems) 2.3 1 2.3 Northern
Power Systems
2011
MI Stoney Corners III (Repower) 18.3 9 N/A Repower 2011MN Adams 19.8 12 1.7 Alstom 2011MN Bent Tree 201.3 122 1.7 Vestas 2011MN Carleton College 1.6 1 1.6 GE Energy 2011MN Community Wind North 30 12 2.5 Clipper 2011MN Danielson Wind 19.8 12 1.7 Alstom 2011MN Eolos 2.5 1 2.5 Clipper 2011MN GL Wind 5 2 2.5 Clipper 2011MN Lakefield 153 102 1.5 GE Energy 2011MN Lakefield (phase I) 52.5 35 1.5 GE Energy 2011MN Oak Glen Wind Project 43.2 24 1.8 Vestas 2011MN University of Minnesota Morris II
- PES 1.7 1 1.7 Vestas 2011
MN Valley View 10 5 2 Gamesa 2011MN Winona County Wind 1.5 2 0.8 Unison 2011MO Lost Creek Ridge Wind Farm
(2011) 1.5 1 1.5 GE Energy 2011
ND Bison Wind 1B (‘11) 21 7 3 Siemens 2011NE Laredo Ridge 81 54 1.5 GE Energy 2011NE Petersburg 40.5 27 1.5 GE Energy 2011NE Springview II Wind Facility 3 2 1.5 VENSYS 2011NM Macho Springs Wind Farm I 50.4 28 1.8 Vestas 2011Table continued on next page.
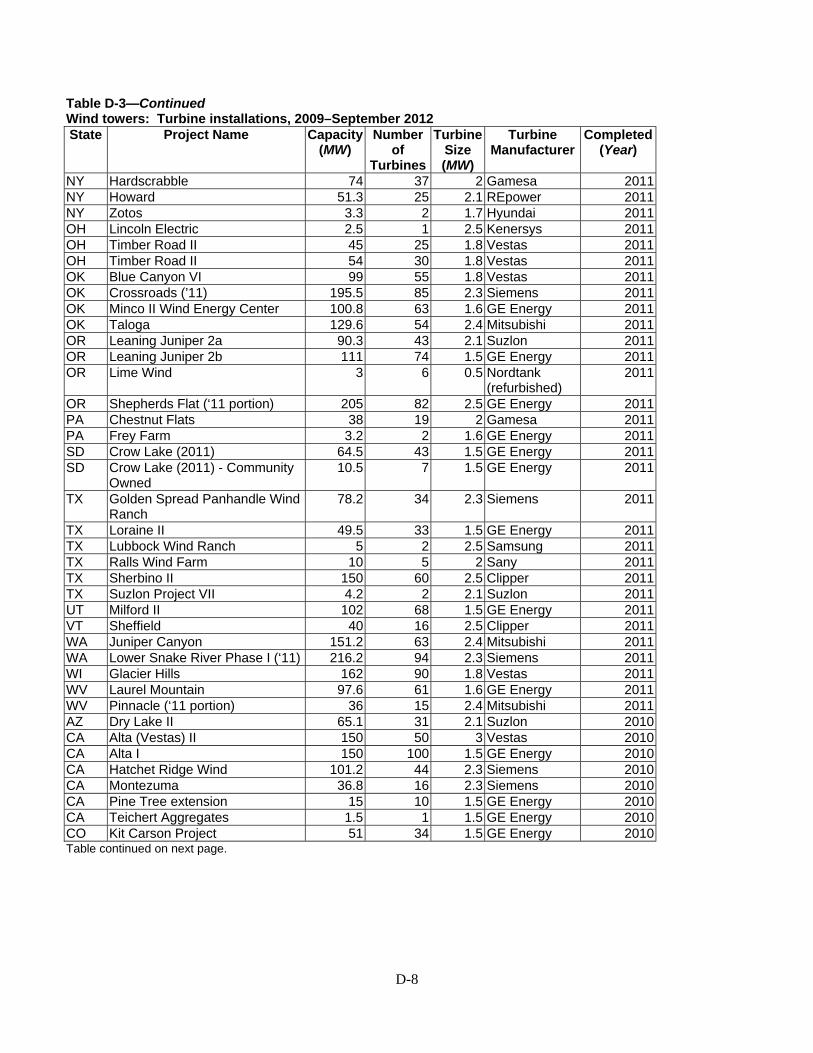
D-8
Table D-3—Continued Wind towers: Turbine installations, 2009–September 2012State Project Name Capacity
(MW) Number
of Turbines
Turbine Size (MW)
Turbine Manufacturer
Completed (Year)
NY Hardscrabble 74 37 2 Gamesa 2011NY Howard 51.3 25 2.1 REpower 2011NY Zotos 3.3 2 1.7 Hyundai 2011OH Lincoln Electric 2.5 1 2.5 Kenersys 2011OH Timber Road II 45 25 1.8 Vestas 2011OH Timber Road II 54 30 1.8 Vestas 2011OK Blue Canyon VI 99 55 1.8 Vestas 2011OK Crossroads (’11) 195.5 85 2.3 Siemens 2011OK Minco II Wind Energy Center 100.8 63 1.6 GE Energy 2011OK Taloga 129.6 54 2.4 Mitsubishi 2011OR Leaning Juniper 2a 90.3 43 2.1 Suzlon 2011OR Leaning Juniper 2b 111 74 1.5 GE Energy 2011OR Lime Wind 3 6 0.5 Nordtank
(refurbished) 2011
OR Shepherds Flat (‘11 portion) 205 82 2.5 GE Energy 2011PA Chestnut Flats 38 19 2 Gamesa 2011PA Frey Farm 3.2 2 1.6 GE Energy 2011SD Crow Lake (2011) 64.5 43 1.5 GE Energy 2011SD Crow Lake (2011) - Community
Owned 10.5 7 1.5 GE Energy 2011
TX Golden Spread Panhandle Wind Ranch
78.2 34 2.3 Siemens 2011
TX Loraine II 49.5 33 1.5 GE Energy 2011TX Lubbock Wind Ranch 5 2 2.5 Samsung 2011TX Ralls Wind Farm 10 5 2 Sany 2011TX Sherbino II 150 60 2.5 Clipper 2011TX Suzlon Project VII 4.2 2 2.1 Suzlon 2011UT Milford II 102 68 1.5 GE Energy 2011VT Sheffield 40 16 2.5 Clipper 2011WA Juniper Canyon 151.2 63 2.4 Mitsubishi 2011WA Lower Snake River Phase I (‘11) 216.2 94 2.3 Siemens 2011WI Glacier Hills 162 90 1.8 Vestas 2011WV Laurel Mountain 97.6 61 1.6 GE Energy 2011WV Pinnacle (‘11 portion) 36 15 2.4 Mitsubishi 2011AZ Dry Lake II 65.1 31 2.1 Suzlon 2010CA Alta (Vestas) II 150 50 3 Vestas 2010CA Alta I 150 100 1.5 GE Energy 2010CA Hatchet Ridge Wind 101.2 44 2.3 Siemens 2010CA Montezuma 36.8 16 2.3 Siemens 2010CA Pine Tree extension 15 10 1.5 GE Energy 2010CA Teichert Aggregates 1.5 1 1.5 GE Energy 2010CO Kit Carson Project 51 34 1.5 GE Energy 2010Table continued on next page.
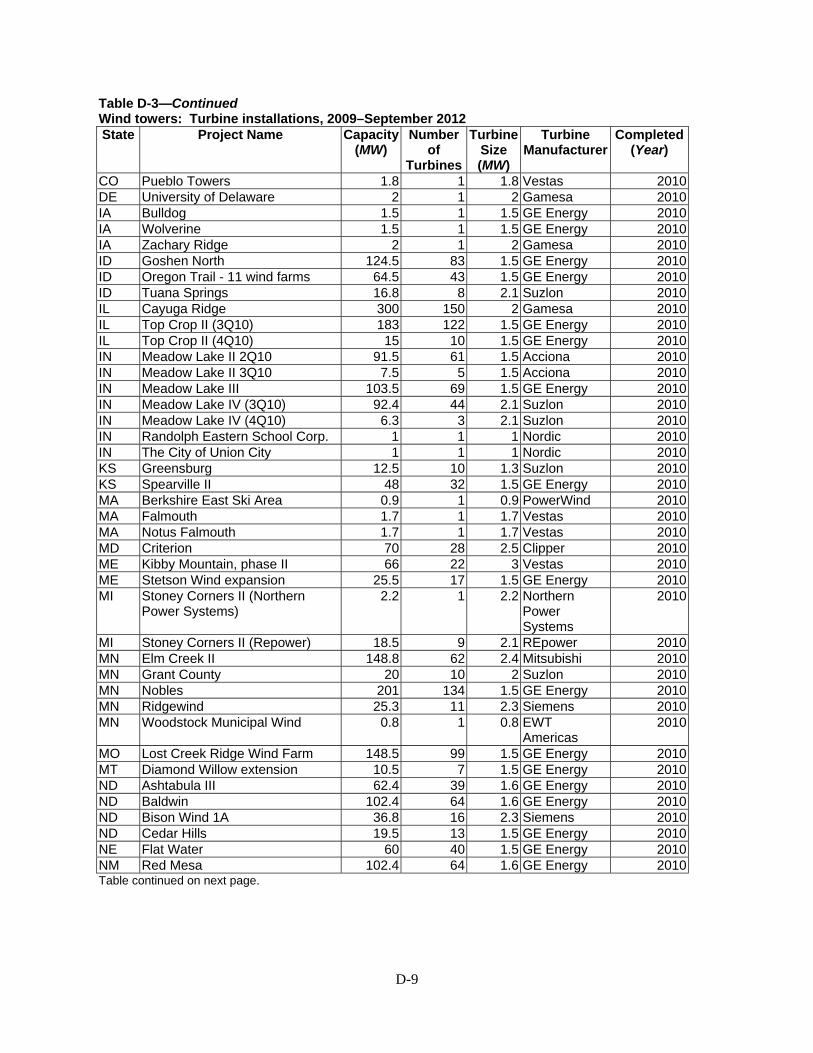
D-9
Table D-3—Continued Wind towers: Turbine installations, 2009–September 2012State Project Name Capacity
(MW) Number
of Turbines
Turbine Size (MW)
Turbine Manufacturer
Completed (Year)
CO Pueblo Towers 1.8 1 1.8 Vestas 2010DE University of Delaware 2 1 2 Gamesa 2010IA Bulldog 1.5 1 1.5 GE Energy 2010IA Wolverine 1.5 1 1.5 GE Energy 2010IA Zachary Ridge 2 1 2 Gamesa 2010ID Goshen North 124.5 83 1.5 GE Energy 2010ID Oregon Trail - 11 wind farms 64.5 43 1.5 GE Energy 2010ID Tuana Springs 16.8 8 2.1 Suzlon 2010IL Cayuga Ridge 300 150 2 Gamesa 2010IL Top Crop II (3Q10) 183 122 1.5 GE Energy 2010IL Top Crop II (4Q10) 15 10 1.5 GE Energy 2010IN Meadow Lake II 2Q10 91.5 61 1.5 Acciona 2010IN Meadow Lake II 3Q10 7.5 5 1.5 Acciona 2010IN Meadow Lake III 103.5 69 1.5 GE Energy 2010IN Meadow Lake IV (3Q10) 92.4 44 2.1 Suzlon 2010IN Meadow Lake IV (4Q10) 6.3 3 2.1 Suzlon 2010IN Randolph Eastern School Corp. 1 1 1 Nordic 2010IN The City of Union City 1 1 1 Nordic 2010KS Greensburg 12.5 10 1.3 Suzlon 2010KS Spearville II 48 32 1.5 GE Energy 2010MA Berkshire East Ski Area 0.9 1 0.9 PowerWind 2010MA Falmouth 1.7 1 1.7 Vestas 2010MA Notus Falmouth 1.7 1 1.7 Vestas 2010MD Criterion 70 28 2.5 Clipper 2010ME Kibby Mountain, phase II 66 22 3 Vestas 2010ME Stetson Wind expansion 25.5 17 1.5 GE Energy 2010MI Stoney Corners II (Northern
Power Systems) 2.2 1 2.2 Northern
Power Systems
2010
MI Stoney Corners II (Repower) 18.5 9 2.1 REpower 2010MN Elm Creek II 148.8 62 2.4 Mitsubishi 2010MN Grant County 20 10 2 Suzlon 2010MN Nobles 201 134 1.5 GE Energy 2010MN Ridgewind 25.3 11 2.3 Siemens 2010MN Woodstock Municipal Wind 0.8 1 0.8 EWT
Americas 2010
MO Lost Creek Ridge Wind Farm 148.5 99 1.5 GE Energy 2010MT Diamond Willow extension 10.5 7 1.5 GE Energy 2010ND Ashtabula III 62.4 39 1.6 GE Energy 2010ND Baldwin 102.4 64 1.6 GE Energy 2010ND Bison Wind 1A 36.8 16 2.3 Siemens 2010ND Cedar Hills 19.5 13 1.5 GE Energy 2010NE Flat Water 60 40 1.5 GE Energy 2010NM Red Mesa 102.4 64 1.6 GE Energy 2010Table continued on next page.
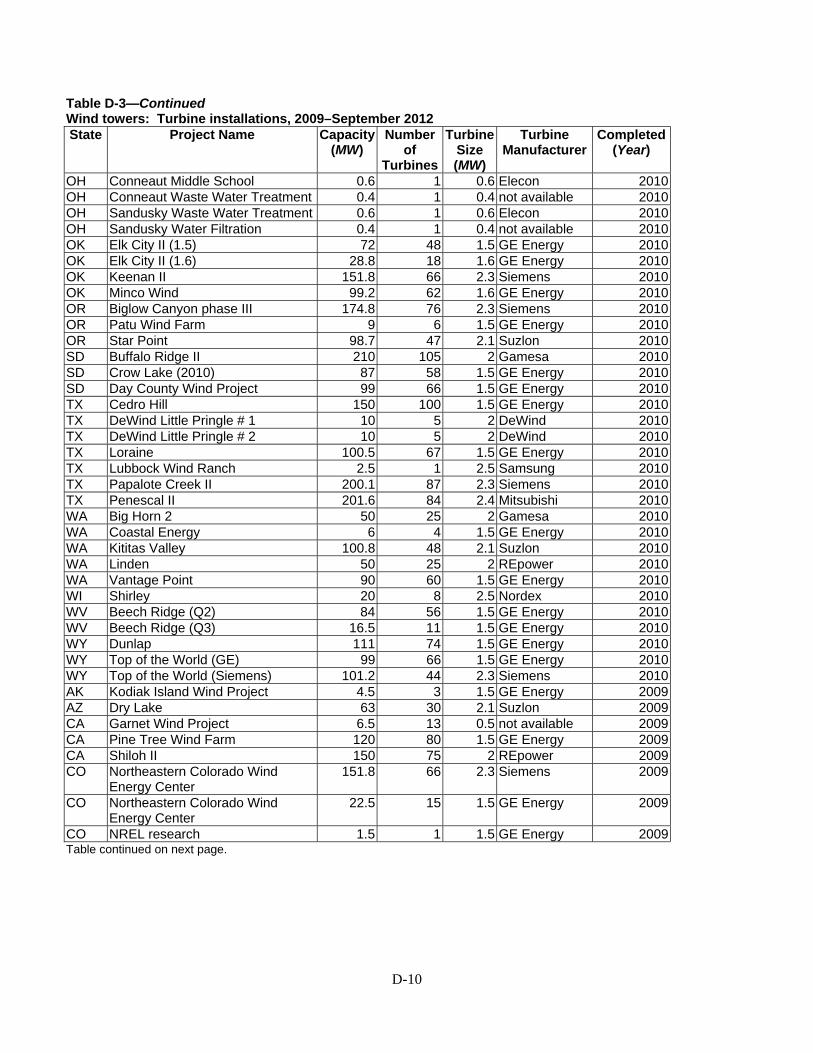
D-10
Table D-3—Continued Wind towers: Turbine installations, 2009–September 2012State Project Name Capacity
(MW) Number
of Turbines
Turbine Size (MW)
Turbine Manufacturer
Completed (Year)
OH Conneaut Middle School 0.6 1 0.6 Elecon 2010OH Conneaut Waste Water Treatment 0.4 1 0.4 not available 2010OH Sandusky Waste Water Treatment 0.6 1 0.6 Elecon 2010OH Sandusky Water Filtration 0.4 1 0.4 not available 2010OK Elk City II (1.5) 72 48 1.5 GE Energy 2010OK Elk City II (1.6) 28.8 18 1.6 GE Energy 2010OK Keenan II 151.8 66 2.3 Siemens 2010OK Minco Wind 99.2 62 1.6 GE Energy 2010OR Biglow Canyon phase III 174.8 76 2.3 Siemens 2010OR Patu Wind Farm 9 6 1.5 GE Energy 2010OR Star Point 98.7 47 2.1 Suzlon 2010SD Buffalo Ridge II 210 105 2 Gamesa 2010SD Crow Lake (2010) 87 58 1.5 GE Energy 2010SD Day County Wind Project 99 66 1.5 GE Energy 2010TX Cedro Hill 150 100 1.5 GE Energy 2010TX DeWind Little Pringle # 1 10 5 2 DeWind 2010TX DeWind Little Pringle # 2 10 5 2 DeWind 2010TX Loraine 100.5 67 1.5 GE Energy 2010TX Lubbock Wind Ranch 2.5 1 2.5 Samsung 2010TX Papalote Creek II 200.1 87 2.3 Siemens 2010TX Penescal II 201.6 84 2.4 Mitsubishi 2010WA Big Horn 2 50 25 2 Gamesa 2010WA Coastal Energy 6 4 1.5 GE Energy 2010WA Kititas Valley 100.8 48 2.1 Suzlon 2010WA Linden 50 25 2 REpower 2010WA Vantage Point 90 60 1.5 GE Energy 2010WI Shirley 20 8 2.5 Nordex 2010WV Beech Ridge (Q2) 84 56 1.5 GE Energy 2010WV Beech Ridge (Q3) 16.5 11 1.5 GE Energy 2010WY Dunlap 111 74 1.5 GE Energy 2010WY Top of the World (GE) 99 66 1.5 GE Energy 2010WY Top of the World (Siemens) 101.2 44 2.3 Siemens 2010AK Kodiak Island Wind Project 4.5 3 1.5 GE Energy 2009AZ Dry Lake 63 30 2.1 Suzlon 2009CA Garnet Wind Project 6.5 13 0.5 not available 2009CA Pine Tree Wind Farm 120 80 1.5 GE Energy 2009CA Shiloh II 150 75 2 REpower 2009CO Northeastern Colorado Wind
Energy Center 151.8 66 2.3 Siemens 2009
CO Northeastern Colorado Wind Energy Center
22.5 15 1.5 GE Energy 2009
CO NREL research 1.5 1 1.5 GE Energy 2009Table continued on next page.
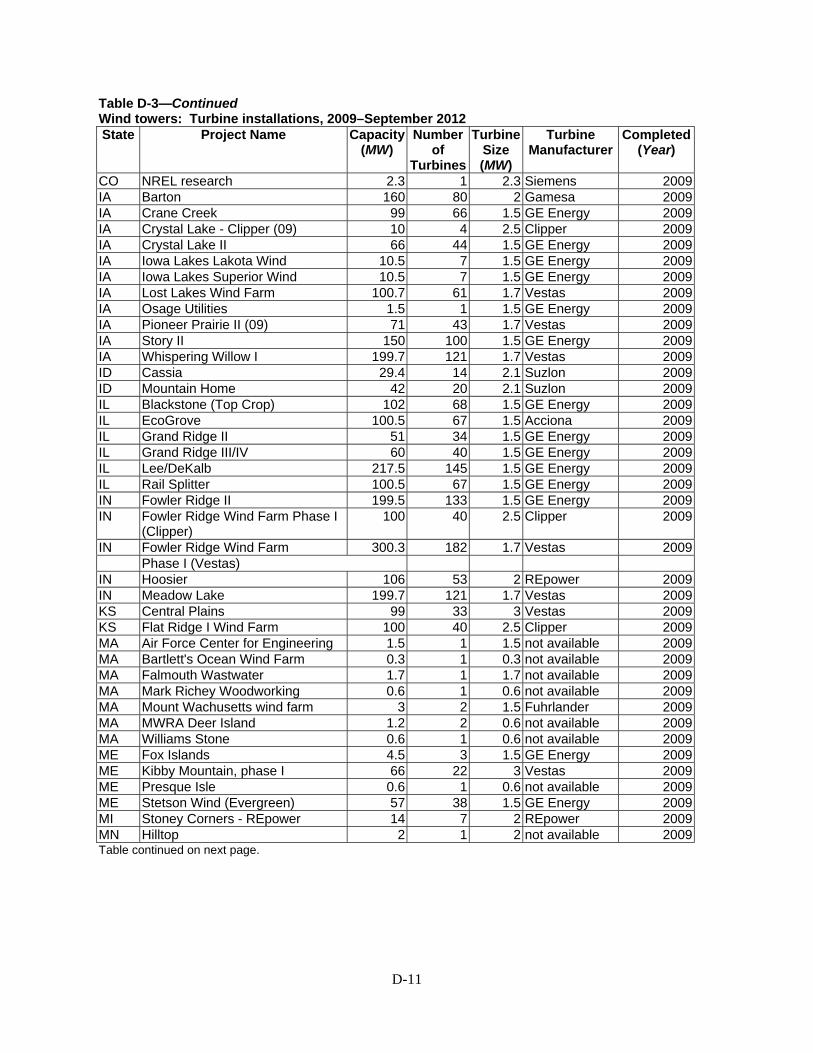
D-11
Table D-3—Continued Wind towers: Turbine installations, 2009–September 2012State Project Name Capacity
(MW) Number
of Turbines
Turbine Size (MW)
Turbine Manufacturer
Completed (Year)
CO NREL research 2.3 1 2.3 Siemens 2009IA Barton 160 80 2 Gamesa 2009IA Crane Creek 99 66 1.5 GE Energy 2009IA Crystal Lake - Clipper (09) 10 4 2.5 Clipper 2009IA Crystal Lake II 66 44 1.5 GE Energy 2009IA Iowa Lakes Lakota Wind 10.5 7 1.5 GE Energy 2009IA Iowa Lakes Superior Wind 10.5 7 1.5 GE Energy 2009IA Lost Lakes Wind Farm 100.7 61 1.7 Vestas 2009IA Osage Utilities 1.5 1 1.5 GE Energy 2009IA Pioneer Prairie II (09) 71 43 1.7 Vestas 2009IA Story II 150 100 1.5 GE Energy 2009IA Whispering Willow I 199.7 121 1.7 Vestas 2009ID Cassia 29.4 14 2.1 Suzlon 2009ID Mountain Home 42 20 2.1 Suzlon 2009IL Blackstone (Top Crop) 102 68 1.5 GE Energy 2009IL EcoGrove 100.5 67 1.5 Acciona 2009IL Grand Ridge II 51 34 1.5 GE Energy 2009IL Grand Ridge III/IV 60 40 1.5 GE Energy 2009IL Lee/DeKalb 217.5 145 1.5 GE Energy 2009IL Rail Splitter 100.5 67 1.5 GE Energy 2009IN Fowler Ridge II 199.5 133 1.5 GE Energy 2009IN Fowler Ridge Wind Farm Phase I
(Clipper) 100 40 2.5 Clipper 2009
IN Fowler Ridge Wind Farm 300.3 182 1.7 Vestas 2009 Phase I (Vestas) IN Hoosier 106 53 2 REpower 2009IN Meadow Lake 199.7 121 1.7 Vestas 2009KS Central Plains 99 33 3 Vestas 2009KS Flat Ridge I Wind Farm 100 40 2.5 Clipper 2009MA Air Force Center for Engineering 1.5 1 1.5 not available 2009MA Bartlett's Ocean Wind Farm 0.3 1 0.3 not available 2009MA Falmouth Wastwater 1.7 1 1.7 not available 2009MA Mark Richey Woodworking 0.6 1 0.6 not available 2009MA Mount Wachusetts wind farm 3 2 1.5 Fuhrlander 2009MA MWRA Deer Island 1.2 2 0.6 not available 2009MA Williams Stone 0.6 1 0.6 not available 2009ME Fox Islands 4.5 3 1.5 GE Energy 2009ME Kibby Mountain, phase I 66 22 3 Vestas 2009ME Presque Isle 0.6 1 0.6 not available 2009ME Stetson Wind (Evergreen) 57 38 1.5 GE Energy 2009MI Stoney Corners - REpower 14 7 2 REpower 2009MN Hilltop 2 1 2 not available 2009Table continued on next page.
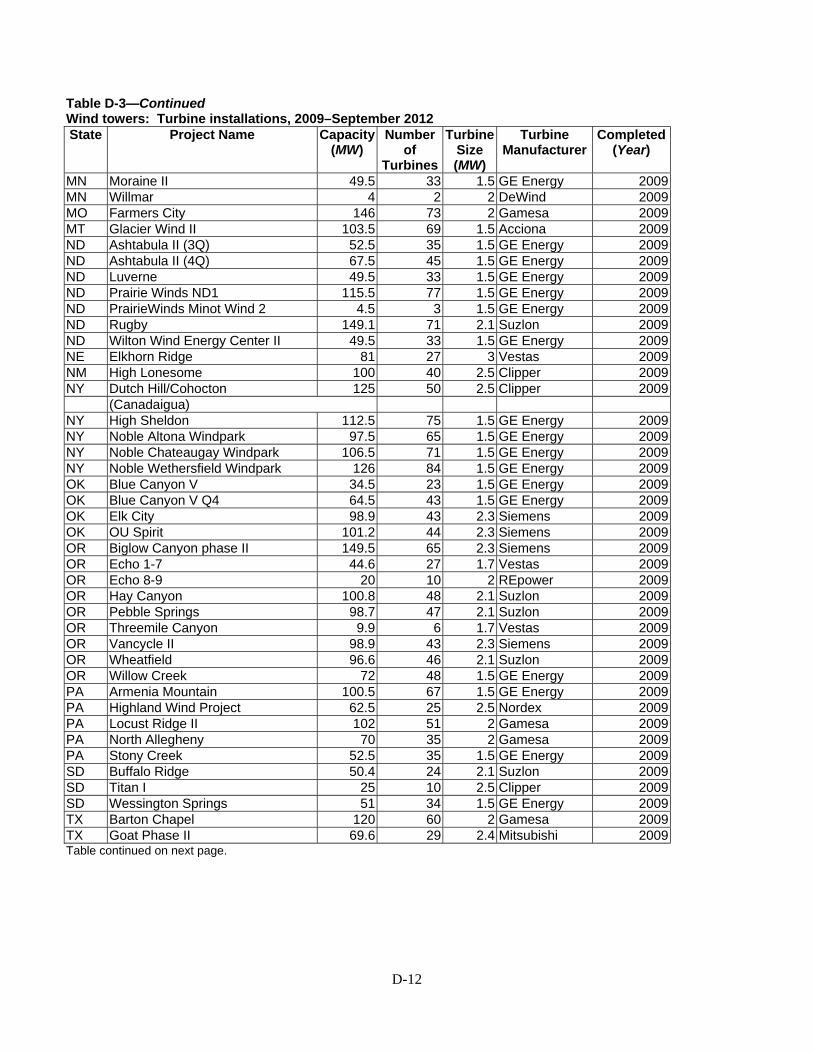
D-12
Table D-3—Continued Wind towers: Turbine installations, 2009–September 2012State Project Name Capacity
(MW) Number
of Turbines
Turbine Size (MW)
Turbine Manufacturer
Completed (Year)
MN Moraine II 49.5 33 1.5 GE Energy 2009MN Willmar 4 2 2 DeWind 2009MO Farmers City 146 73 2 Gamesa 2009MT Glacier Wind II 103.5 69 1.5 Acciona 2009ND Ashtabula II (3Q) 52.5 35 1.5 GE Energy 2009ND Ashtabula II (4Q) 67.5 45 1.5 GE Energy 2009ND Luverne 49.5 33 1.5 GE Energy 2009ND Prairie Winds ND1 115.5 77 1.5 GE Energy 2009ND PrairieWinds Minot Wind 2 4.5 3 1.5 GE Energy 2009ND Rugby 149.1 71 2.1 Suzlon 2009ND Wilton Wind Energy Center II 49.5 33 1.5 GE Energy 2009NE Elkhorn Ridge 81 27 3 Vestas 2009NM High Lonesome 100 40 2.5 Clipper 2009NY Dutch Hill/Cohocton 125 50 2.5 Clipper 2009 (Canadaigua) NY High Sheldon 112.5 75 1.5 GE Energy 2009NY Noble Altona Windpark 97.5 65 1.5 GE Energy 2009NY Noble Chateaugay Windpark 106.5 71 1.5 GE Energy 2009NY Noble Wethersfield Windpark 126 84 1.5 GE Energy 2009OK Blue Canyon V 34.5 23 1.5 GE Energy 2009OK Blue Canyon V Q4 64.5 43 1.5 GE Energy 2009OK Elk City 98.9 43 2.3 Siemens 2009OK OU Spirit 101.2 44 2.3 Siemens 2009OR Biglow Canyon phase II 149.5 65 2.3 Siemens 2009OR Echo 1-7 44.6 27 1.7 Vestas 2009OR Echo 8-9 20 10 2 REpower 2009OR Hay Canyon 100.8 48 2.1 Suzlon 2009OR Pebble Springs 98.7 47 2.1 Suzlon 2009OR Threemile Canyon 9.9 6 1.7 Vestas 2009OR Vancycle II 98.9 43 2.3 Siemens 2009OR Wheatfield 96.6 46 2.1 Suzlon 2009OR Willow Creek 72 48 1.5 GE Energy 2009PA Armenia Mountain 100.5 67 1.5 GE Energy 2009PA Highland Wind Project 62.5 25 2.5 Nordex 2009PA Locust Ridge II 102 51 2 Gamesa 2009PA North Allegheny 70 35 2 Gamesa 2009PA Stony Creek 52.5 35 1.5 GE Energy 2009SD Buffalo Ridge 50.4 24 2.1 Suzlon 2009SD Titan I 25 10 2.5 Clipper 2009SD Wessington Springs 51 34 1.5 GE Energy 2009TX Barton Chapel 120 60 2 Gamesa 2009TX Goat Phase II 69.6 29 2.4 Mitsubishi 2009Table continued on next page.
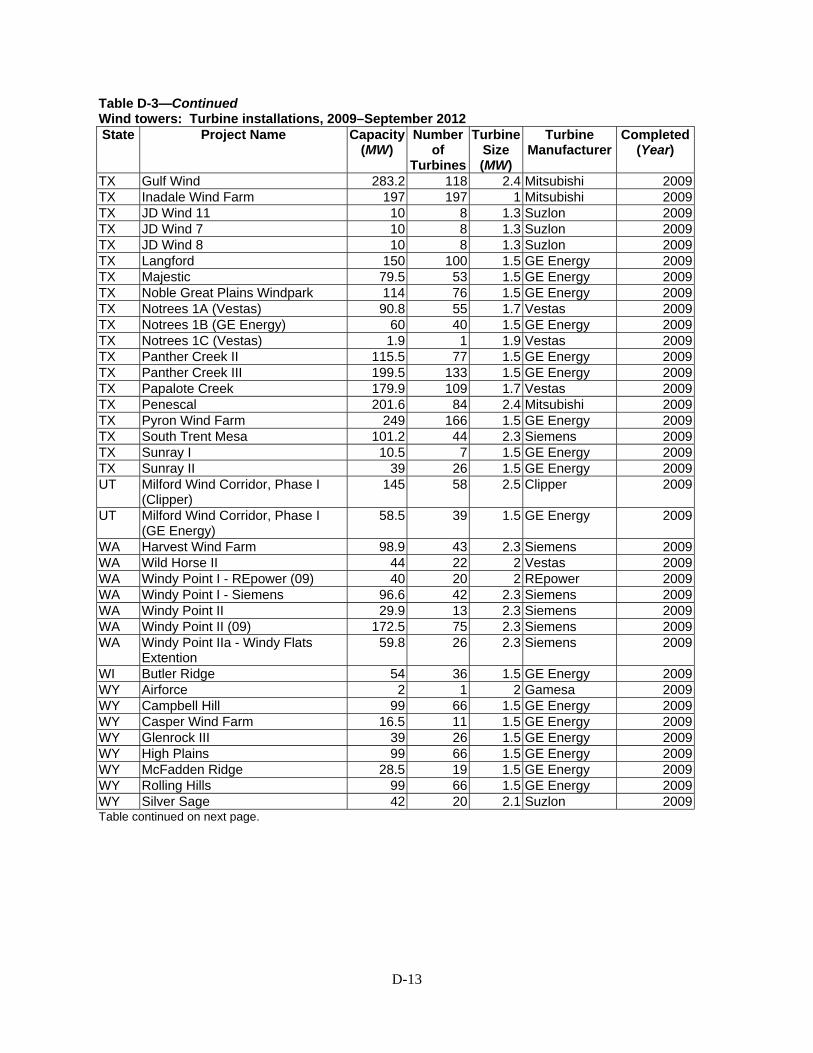
D-13
Table D-3—Continued Wind towers: Turbine installations, 2009–September 2012State Project Name Capacity
(MW) Number
of Turbines
Turbine Size (MW)
Turbine Manufacturer
Completed (Year)
TX Gulf Wind 283.2 118 2.4 Mitsubishi 2009TX Inadale Wind Farm 197 197 1 Mitsubishi 2009TX JD Wind 11 10 8 1.3 Suzlon 2009TX JD Wind 7 10 8 1.3 Suzlon 2009TX JD Wind 8 10 8 1.3 Suzlon 2009TX Langford 150 100 1.5 GE Energy 2009TX Majestic 79.5 53 1.5 GE Energy 2009TX Noble Great Plains Windpark 114 76 1.5 GE Energy 2009TX Notrees 1A (Vestas) 90.8 55 1.7 Vestas 2009TX Notrees 1B (GE Energy) 60 40 1.5 GE Energy 2009TX Notrees 1C (Vestas) 1.9 1 1.9 Vestas 2009TX Panther Creek II 115.5 77 1.5 GE Energy 2009TX Panther Creek III 199.5 133 1.5 GE Energy 2009TX Papalote Creek 179.9 109 1.7 Vestas 2009TX Penescal 201.6 84 2.4 Mitsubishi 2009TX Pyron Wind Farm 249 166 1.5 GE Energy 2009TX South Trent Mesa 101.2 44 2.3 Siemens 2009TX Sunray I 10.5 7 1.5 GE Energy 2009TX Sunray II 39 26 1.5 GE Energy 2009UT Milford Wind Corridor, Phase I
(Clipper) 145 58 2.5 Clipper 2009
UT Milford Wind Corridor, Phase I (GE Energy)
58.5 39 1.5 GE Energy 2009
WA Harvest Wind Farm 98.9 43 2.3 Siemens 2009WA Wild Horse II 44 22 2 Vestas 2009WA Windy Point I - REpower (09) 40 20 2 REpower 2009WA Windy Point I - Siemens 96.6 42 2.3 Siemens 2009WA Windy Point II 29.9 13 2.3 Siemens 2009WA Windy Point II (09) 172.5 75 2.3 Siemens 2009WA Windy Point IIa - Windy Flats
Extention 59.8 26 2.3 Siemens 2009
WI Butler Ridge 54 36 1.5 GE Energy 2009WY Airforce 2 1 2 Gamesa 2009WY Campbell Hill 99 66 1.5 GE Energy 2009WY Casper Wind Farm 16.5 11 1.5 GE Energy 2009WY Glenrock III 39 26 1.5 GE Energy 2009WY High Plains 99 66 1.5 GE Energy 2009WY McFadden Ridge 28.5 19 1.5 GE Energy 2009WY Rolling Hills 99 66 1.5 GE Energy 2009WY Silver Sage 42 20 2.1 Suzlon 2009Table continued on next page.
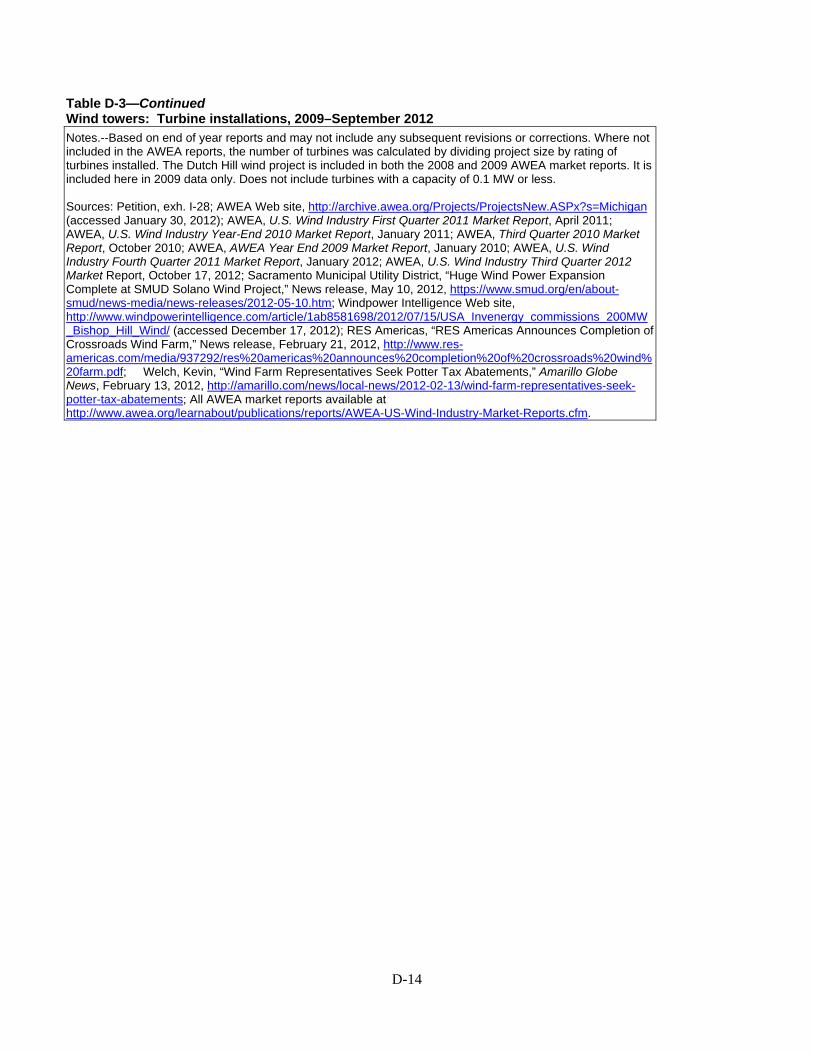
D-14
Table D-3—Continued Wind towers: Turbine installations, 2009–September 2012 Notes.--Based on end of year reports and may not include any subsequent revisions or corrections. Where not included in the AWEA reports, the number of turbines was calculated by dividing project size by rating of turbines installed. The Dutch Hill wind project is included in both the 2008 and 2009 AWEA market reports. It is included here in 2009 data only. Does not include turbines with a capacity of 0.1 MW or less. Sources: Petition, exh. I-28; AWEA Web site, http://archive.awea.org/Projects/ProjectsNew.ASPx?s=Michigan (accessed January 30, 2012); AWEA, U.S. Wind Industry First Quarter 2011 Market Report, April 2011; AWEA, U.S. Wind Industry Year-End 2010 Market Report, January 2011; AWEA, Third Quarter 2010 Market Report, October 2010; AWEA, AWEA Year End 2009 Market Report, January 2010; AWEA, U.S. Wind Industry Fourth Quarter 2011 Market Report, January 2012; AWEA, U.S. Wind Industry Third Quarter 2012 Market Report, October 17, 2012; Sacramento Municipal Utility District, “Huge Wind Power Expansion Complete at SMUD Solano Wind Project,” News release, May 10, 2012, https://www.smud.org/en/about-smud/news-media/news-releases/2012-05-10.htm; Windpower Intelligence Web site, http://www.windpowerintelligence.com/article/1ab8581698/2012/07/15/USA_Invenergy_commissions_200MW_Bishop_Hill_Wind/ (accessed December 17, 2012); RES Americas, “RES Americas Announces Completion of Crossroads Wind Farm,” News release, February 21, 2012, http://www.res-americas.com/media/937292/res%20americas%20announces%20completion%20of%20crossroads%20wind%20farm.pdf; Welch, Kevin, “Wind Farm Representatives Seek Potter Tax Abatements,” Amarillo Globe News, February 13, 2012, http://amarillo.com/news/local-news/2012-02-13/wind-farm-representatives-seek-potter-tax-abatements; All AWEA market reports available at http://www.awea.org/learnabout/publications/reports/AWEA-US-Wind-Industry-Market-Reports.cfm.

E-1
APPENDIX E
SELECTED MONTHLY U.S. PRODUCERS’ DATA


E-3
All pages are confidential (figures E-1-E-5)


APPENDIX F
GE’S PRELIMINARY PHASE PRICE DATA
F-1

Table F-1 contains data prepared by GE during the preliminary phase of the investigations. Rather than presenting data on a project basis, this data is presented on a tower type basis. Since thesedata are not for a specific project, they are on an f.o.b. basis and do not contain any delivery costs.1 Therefore, the data represent the cost of a certain type of wind tower within the United States (fordomestic producers) and the cost of that type of wind tower in China, Vietnam, Canada, and Korea. Ineach instance, the f.o.b. price in China from Chinese producers is lower than the f.o.b. price in the UnitedStates for domestic producers. The *** is lower than all but one domestic f.o.b. price quote. Alsoincluded in the table are the expected volume of towers from that bidder and the reason for selecting ornot selecting a particular bidder.
Table F-1Wind towers: GE’s bid data by tower type during 2010 and 2011
* * * * * * *
1 ***.
F-3