Embed Size (px)
Citation preview

Sedimentary Geology, 56 (1988) 261-282 261 Elsevier Science Publishers B.V., Amsterdam - Printed in The Netherlands
Wind directions predicted from global circulation models and wind directions determined from eolian sandstones
of the western United States A comparison
JUDITH TOTMAN PARRISH * and FRED PETERSON
U.S. Geological Survey, MA 971, Denoer, CO 80225-0046 (U.S.A.) U.S. Geological Survey, MS 916, Denoer, CO 80225-0046 (U.S.A.)
(Received September 1, 1986; revised and accepted February 3, 1987)
Abstract
Panfish, J.T. and Peterson, F., 1988. Wind directions predicted from global circulation models and wind directions determined from eolian sandstones of the western United States--A comparison. In: G. Kocurek (Editor), Late Paleozoic and Mesozoic Eolian Deposits of the Western Interior of the United States. Sediment. Geol., 56: 261-282.
Wind directions for Middle Pennsylvanian through Jurassic time are predicted from global circulation models for the western United States. These predictions are compared with paleowind directions interpreted from eofian sandstones of Middle Permsylvanian through Jurassic age. Predicted regional wind directions correspond with at least three-quarters of the paleowind data from the sandstones; the rest of the data may indicate problems with correlation, local effects of paleogeography on winds, and lack of resolution of the circulation models. The data and predictions suggest the following paleoclimatic developments through the time interval studied: predominance of winter subtropi- cal high-pressure circulation in the Late Pennsylvanian; predominance of summer subtropical high-pressure circulation in the Permian; predominance of summer monsoonal circulation in the Triassic and earliest Jurassic; and, during the remainder of the Jurassic, influence of both summer subtropical and summer monsoonal circulation, with the boundary between the two systems over the western United States. This sequence of climatic changes is largely owing to paleogeographic changes, which influenced the buildup and breakdown of the monsoonal circulation, and possibly owing partly to a decrease in the global temperature gradient, which might have lessened the influence of the subtropical high-pressure circulation. The atypical humidity of Triassic time probably resulted from the monsoonal circulation created by the geography of Pangaea. This circulation is predicted to have been at a maximum in the Triassic and was likely to have been powerful enough to draw moisture along the equator from the ocean to the west.
Introduction
Eolian sandstones that postdate the mid-
Paleozoic generally are regarded as indicat ive of
arid climate, based on analogy with the dis tr ibu-
t ion of modern eolian sands (e.g., McKee, 1979;
* Present address: Department of Geosciences, Gould-Simp- son Building. University of Arizona, Tucson, AZ 85721, U.S.A.
see Marzolf, this volume, for an al ternative view).
In addi t ion, eol ian sandstones provide data on
pa leowind directions. N u m e r o u s studies have
demons t ra ted that, in general, regional paleowind
direct ions can be de te rmined from eolian sand-
stones (e.g., Opdyke and Runcorn , 1960; Poole,
1964; Bigarella, 1973). Where paleowind direc-
t ions have been predicted based on general
paleogeographic considerat ions, directions inter-
preted from the sandstones have corresponded
reasonably well to the predict ions (e.g., Poole,
262
1964). For this paper, we have predicted paleo- wind directions over the western United States for several time periods, based on maps of atmo- spheric circulation constructed by Parrish (1982) and Parrish and Curtis (1982). These predictions were made independently of the data from eolian sandstones. The correspondence between predict- ed paleowind directions and those determined from the sandstones has numerous implications for both the interpretation of eolian sand deposi- tion and the construction of climate models.
We note for the following discussion that this paper brings together two independent bodies of work, the climate models and the geology of the eolian sandstones, in which the European and North American time scales, respectively, were used. It would be confusing and improper to change one or the other, so we have retained the original terminology and cross-reference the time scales using the chart by Van Eysinga (1975). This paper is a companion to the paper by Peterson (this volume). That paper contains sources of data on wind directions; descriptions of the eolian sandstone units, their paleogeographic and geo- logic settings, and correlation; and methods of extracting paleowind directions from eolian sand- stones. This information is not repeated here.
Predicted wind directions
Predictions of summer and winter atmospheric circulation over Pangaea were published by Par- rish (1982) and Parrish and Curtis (1982) for the Late Carboniferous (Westphalian C-D Age, ap- proximately equivalent to the Desmoinesian), Late Permian (Kazanian Age, approximately equivalent to the Guadalupian), earliest Triassic (Induan Age, approximately equivalent to the late Scythian of Europe), and Early and latest Jurassic (Pliens- bachian and Volgian Ages, respectively). The choice of time intervals was determined by the availability of detailed global paleogeographic maps that included continental positions and loca- tions of shorelines and highlands. These maps were produced by the Paleogeographic Atlas Proj- ect at the University of Chicago (1984; Scotese et al., 1979; Ziegler et al., 1983) and were essential for modeling global circulation because of the
geographic controls on circulation patterns. Global circulation models are, in turn, essential for under- standing regional climatic patterns on the scale of the western United States. Wind directions in this paper are extrapolated from the global atmo- spheric circulation patterns predicted by Parrish (1982) and Parrish and Curtis (1982). The follow- ing brief description of their approach is presented for background.
General atmospheric circulation
The primary concern in the papers of Parrish (1982) and Parrish and Curtis (1982) was to model the major components of atmospheric circulation in order to provide a basis for predicting the locations of persistent, wind-driven upwelling cur- rents in the ancient oceans. The most persistent winds are those associated with the major compo- nents of atmospheric circulation.
Zonal circulation Atmospheric circulation is a response to the
uneven distribution of heat on the Earth's surface. The greatest thermal contrast today is between the equator and the poles. On the Earth with a featureless surface, atmospheric circulation would be zonal, that is, the climatic parameters would be distributed parallel to latitude. Zonal circulation is controlled partly by the meridional temperature gradient, which drives the circulation, and partly by the rotation of the Earth, the speed of which determines the number of zones. These zones are high pressure at the poles and low mid-latitudes (centered about 30 ° north and south) and low pressure at high mid-latitudes (centered about 60 o north and south) and at the equator. The climate tends to be dry in high-pressure zones and wet in low-pressure zones. Zonal surface winds comprise the easterlies around the poles and at the equator and westerlies in mid-latitudes (the so-called horse latitudes).
Large-scale circulation cells The zonal circulation is modified by the tem-
perature contrast between land and sea. In mid- latitudes, this contrast and the consequent disrup- tion of the zonal pattern are greatest. At low
mid-latitudes, land tends to be warmer than adjac- ent ocean, especially in the summer, and the high-pressure belt is broken into subtropical high-pressure cells over the oceans and low-pres- sure cells or troughs over the continents. At high mid-latitudes, land is generally colder than adjac- ent ocean, especially in the winter, and the low- pressure belt is broken into low-pressure cells over the oceans interspersed with high-pressure cells or ridges over the continents. Geographic features that affect the land-sea contrast, for example, epeiric seaways, also will affect the circulation patterns.
Regional influences on circulation Except very near the equator, where the Corio-
lis effect is zero, winds aloft flow parallel to the isobars. At the surface, however, friction causes a deflection of the winds across the isobars from high pressure to low. Over water and land with low topography, the effect of friction may be relatively small but over rough terrain, the deflec- tion may be considerable (for an excellent discus- sion, see Petterssen, 1969). Thus, regional surface wind directions may be modified over and in the areas immediately around mountains. Although mountains have a dramatic effect on precipitation in that they may create broad rain shadows, their effect on regional wind directions is not so geo- graphically extensive (e.g., Kolm, 1982). Surface winds also may be affected at shorelines, where the diurnal land-sea temperature contrast creates offshore- and onshore-flowing winds. Small-scale regional effects of features such as shorelines and mountains are difficult to predict for the past because paleogeographic reconstructions usually can resolve only large variations in coastline shape and altitude, but minor variations in wind direc- tion in the vicinity of such paleographic features would be expected.
Monsoonal circulation and the influence of Pangaea
The time interval from the Late Carboniferous through the Jurassic spanned the existence of the supercontinent Pangaea (e.g., Scotese et al., 1979; Ziegler et al., 1983). This continent would have influenced atmospheric circulation greatly because
263
of its size and longitudinal orientation. Robinson (1973) and then Parrish, in a series of papers (see following discussion), hypothesized that the circu- lation over Pangaea would have been strongly monsoonal.
Monsoonal circulation Monsoonal circulation consists of high- and
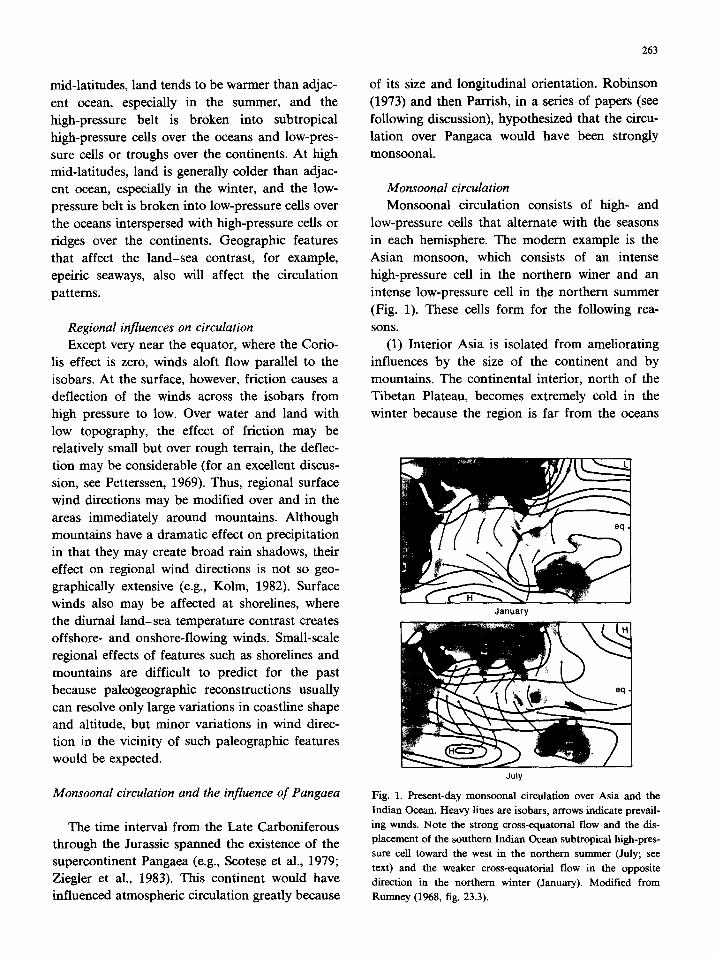
low-pressure cells that alternate with the seasons in each hemisphere. The modern example is the Asian monsoon, which consists of an intense high-pressure cell in the northern winer and an intense low-pressure cell in the northern summer (Fig. 1). These cells form for the following rea- sons.
(1) Interior Asia is isolated from ameliorating influences by the size of the continent and by mountains. The continental interior, north of the Tibetan Plateau, becomes extremely cold in the winter because the region is far from the oceans
January
July
Fig. 1. Present-day monsoonal circulation over Asia and the Indian Ocean. Heavy lines are isobars, arrows indicate prevail- ing winds. Note the strong cross-equatorial flow and the dis- placement of the southern Indian Ocean subtropical high-pres- sure cell toward the west in the northern summer (July; see text) and the weaker cross-equatorial flow in the opposite direction in the northern winter (January). Modified from Rumney (1968, fig. 23.3).
264
and is particularly isolated from the warm Indian Ocean by the plateau. In Pakistan and northern India, the continent becomes extremely hot in the summer, partly because the Tibetan Plateau shields the area from cool air to the north. These extremes maximize the thermal contrast between the conti- nent and the adjacent oceans and thus the strength of the circulation cells, high pressure in the winter and low pressure in the summer.
(2) The source of moisture for the summer low-pressure cell over northern India and Pakistan is the Indian Ocean, which is warm. The summer low-pressure cell is intensified by the release of latent heat during condensation of water vapor to rain as air flows into the low-pressure cell from the Indian Ocean.
(3) The summer low pressure is intensified fur- ther by the Tibetan Plateau, which functions as a high-altitude heat source (Parrish, in Parrish and Barron, 1986, fig. 8). That is, ground temperatures on the Tibetan Plateau are higher than tempera- tures at the same elevation over the adjacent low- lands. This contrast creates a pressure differential at high altitudes, with relative low pressure over the plateau.
A key consequence of the Asian monsoon with regard to the monsoonal circulation over Pangaea is the cross-equatorial contrast that occurs now during the northern summer. The contrast is be- tween the low pressure that develops over Asia and the southern Indian Ocean subtropical high- pressure cell. This contrast has a number of ef- fects. First, the equatorial easterlies are completely disrupted in the Indian Ocean, and air flows south to north (Fig. 1). One effect of this disruption is that eastern equatorial Africa is dry (weaker cross-equatorial flow also occurs during the north- ern winter; Fig. 1). Normally, land that lies in the path of the equatorial easterlies receives abundant rainfall (e.g., eastern equatorial South America). Second, the contrast intensifies circulation. This is strikingly illustrated in the response of the south- ern Indian Ocean subtropical high-pressure cell. Subtropical high-pressure cells normally weaken in the winter, when the adjacent land is cool, so during the southern winter (July), the southern Indian Ocean subtropical high would be expected to be weakest. However, the contrast with the
7 / . . . . . . . . ~..._~_....~___
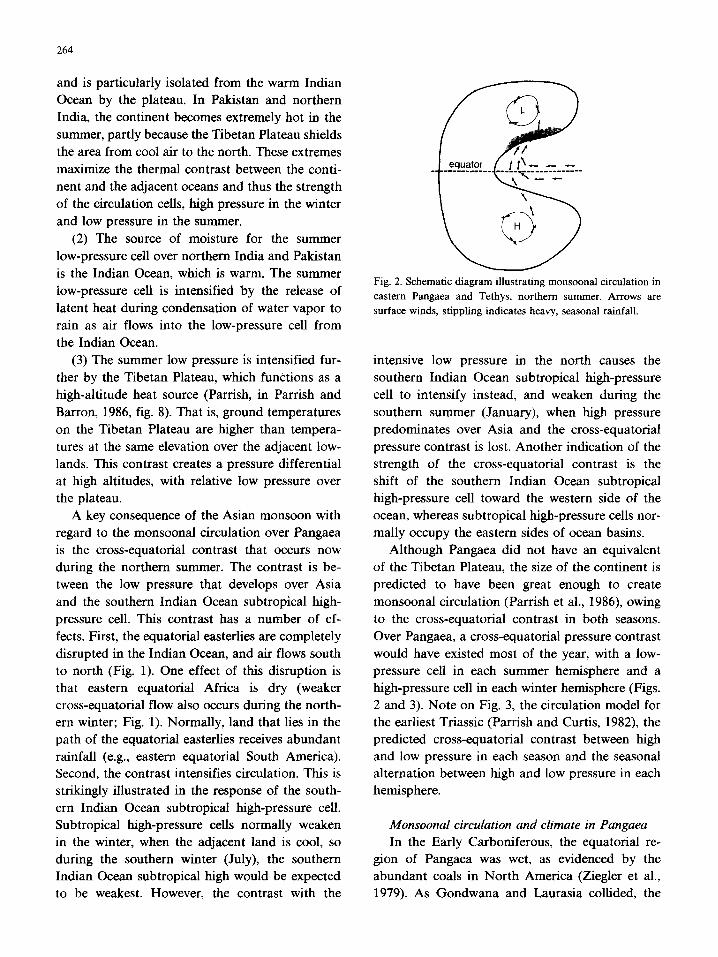
Fig. 2. Schematic diagram illustrating monsoonal circulation in eastern Pangaea and Tethys, northern summer. Arrows are surface winds, stippling indicates heavy, seasonal rainfall.
intensive low pressure in the north causes the southern Indian Ocean subtropical high-pressure cell to intensify instead, and weaken during the southern summer (January), when high pressure predominates over Asia and the cross-equatorial pressure contrast is lost. Another indication of the strength of the cross-equatorial contrast is the shift of the southern Indian Ocean subtropical high-pressure cell toward the western side of the ocean, whereas subtropical high-pressure cells nor- mally occupy the eastern sides of ocean basins.
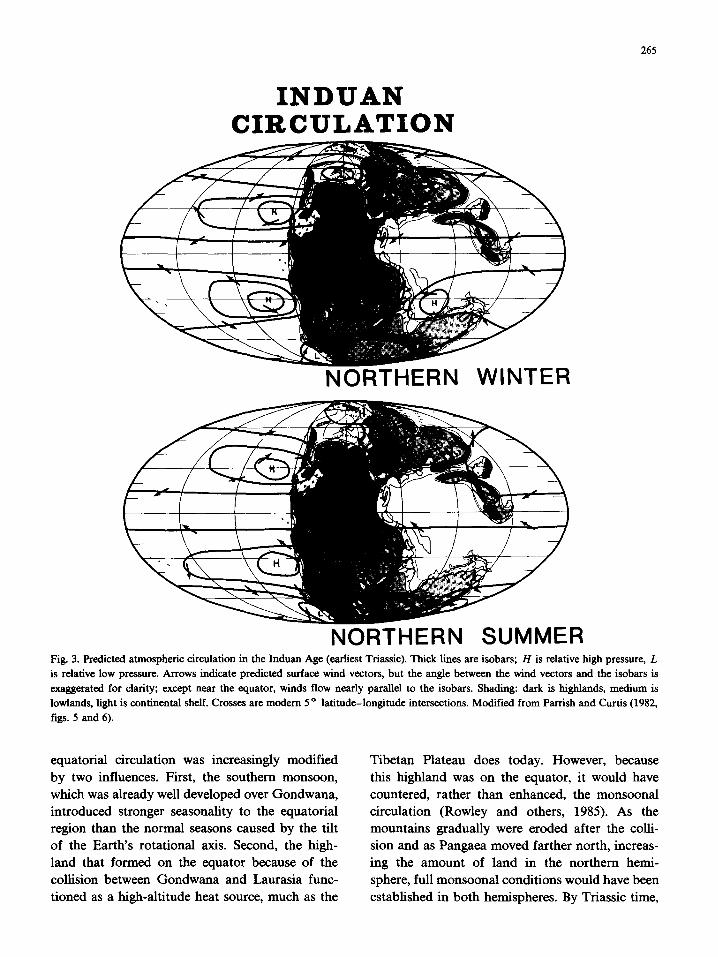
Although Pangaea did not have an equivalent of the Tibetan Plateau, the size of the continent is predicted to have been great enough to create monsoonal circulation (Parrish et al., 1986), owing to the cross-equatorial contrast in both seasons. Over Pangaea, a cross-equatorial pressure contrast would have existed most of the year, with a low- pressure cell in each summer hemisphere and a high-pressure cell in each winter hemisphere (Figs. 2 and 3). Note on Fig. 3, the circulation model for the earliest Triassic (Parrish and Curtis, 1982), the predicted cross-equatorial contrast between high and low pressure in each season and the seasonal alternation between high and low pressure in each hemisphere.
Monsoonal circulation and climate in Pangaea
In the Early Carboniferous, the equatorial re- gion of Pangaea was wet, as evidenced by the abundant coals in North America (Ziegler et al., 1979). As Gondwana and Laurasia collided, the
265
I N D U A N C I R C U L A T I O N
NORTHERN WINTER
NORTHERN SUMMER Fig. 3. Predicted atmospheric circulation in the Induan Age (earliest Triassic), Thick lines are isobars; H is relative high pressure, L is relative low pressure. Arrows indicate predicted surface wind vectors, but the angle between the wind vectors and the isobars is exaggerated for clarity; except near the equator, winds flow nearly parallel to the isobars. Shading: dark is highlands, medium is lowlands, light is continental shelf. Crosses are modern 5 o latitude-longitude intersections. Modified from Parrish and Curtis (1982, figs. 5 and 6).
equatorial circulation was increasingly modified
by two influences. First, the southern monsoon, which was already well developed over Gondwana,
introduced stronger seasonality to the equatorial region than the normal seasons caused by the tilt of the Earth's rotational axis. Second, the high-
land that formed on the equator because of the collision between Gondwana and Laurasia func-
tioned as a high-altitude heat source, much as the
Tibetan Plateau does today. However, because
this highland was on the equator, it would have
countered, rather than enhanced, the monsoonal circulation (Rowley and others, 1985). As the mountains gradually were eroded after the colli-
sion and as Pangaea moved farther north, increas- ing the amount of land in the northern hemi-
sphere, full monsoonal conditions would have been
estabhshed in both hemispheres. By Triassic time,
266
Pangaea was nearly symmetrically disposed about the equator (Parrish et al., 1986). Thus, monsoonal conditions are expected to have been strongest and the eastern equatorial region driest in the Triassic. The maximum monsoonal circulation also might have been strong enough to draw moisture across the equatorial region from the west, that is, to reverse normal equatorial flow. This occurs in western equatorial Africa today during the north- ern summer, when low pressure over the Sahara, which is an extension of the monsoonal low pres- sure over Pakistan, draws moisture east and north. The northward component, a least, is controlled by the shape of the African coastline. For this reason, Parrish et al. (1982) did not predict a western wet region for the Induan Age, as western Pangaea did not have a corresponding shape.
Wind predictions for the western United States
Figure 3 shows that the western United States was in a region of seasonally fluctuating circula- tion in the earliest Triassic. This was true also in the Late Carboniferous and Late Permian but less so in the Jurassic, when the region was farther from the equator. In addition, the area was in the boundary region between two or more major fea- tures of circulation during all five time intervals. For this study, the isobars in the original maps of Parrish (1982) and Parrish and Curtis (1982) were extrapolated in order to predict the prevailing winds over the western United States in detail. Three types of predictions are presented.
(1) Parts of western North America were con- tinually under the influence of one wind regime year-round. This is particularly true fore the northern and western regions (paleocoordinates), where the winds of the subtropical high-pressure cell predominated.
(2) In other parts of western North America, the prevailing wind directions are predicted to have been different between summer and winter. This was true for all time intervals. Thus, both summer and winter winds are shown on Figs. 4-8.
(3) Isobars from the center of a cell to the center of an adjacent cell form a continuum, much like the contours on a topographic map. The spac- ing of the isobars in the original circulation maps
of Parrish (1982) and Parrish and Curtis (1982) was appropriate for global-scale studies, but pre- sented a problem for this study. The problem is that extrapolating the contours symmetrically be- tween two adjacent cells may not be correct; just as in topography, the changes may be either abrupt or gradual from place to place. The resolution of the qualitative method of atmospheric circulation modeling is such that no a priori reason exists for extrapolating the isobars a particular way. How- ever, in all eases, only two alternate wind direc- tions were possible, one for dominance of one cell and the other for dominance of the adjacent cell. Therefore, alternate wind predictions are given for each season in certain regions on Figs. 4-8. It should be stressed that the presentation of such alternatives is not required simply by limitations of the models. Different components of cl imate-- in this case, different circulation cel ls--do change in intensity and position.
It is not strictly correct to say that winds are associated with one or the other cell in the boundary region between two cells, as the whole forms a continuum. However, extrapolation away from the centers toward the boundary will give different wind directions for the same region. For the purposes of the following discussion, the pre- dicted winds are referred to the particular cell from which they were extrapolated. "Subtropical" circulation or winds refers to those extrapolated from the subtropical high-pressure cell off the northwest coast of Pangaea and "monsoonal" re- fers to those extrapolated from the monsoonal pressure systems to the east and consisting mostly of winds flowing into the low-pressure cells. The term "tradewinds" has been used to refer to several different components of atmospheric circulation and thus is avoided here. Rather, we use "equa- torial easterlies" to refer to the zone or to the southern limb of the subtropical high-pressure cell in the northeast paleo-Pacific. We also refer to the eastern limb of the subtropical high-pressure cell, which paralleled the paleo-west coast of North America, and to the westerlies, which formed the northern limb of the subtropical high-pressure cell. The eastern limb of a subtropical high-pressure cell commonly is referred to as the "wheel- around". In addition, all compass directions dis-
cussed below refer to paleocoordinates except where specific localities are discussed (for exam- ple, "northerly winds" refers to the paleo-north but "eastern Colorado" denotes the eastern part of the state in its present orientation).
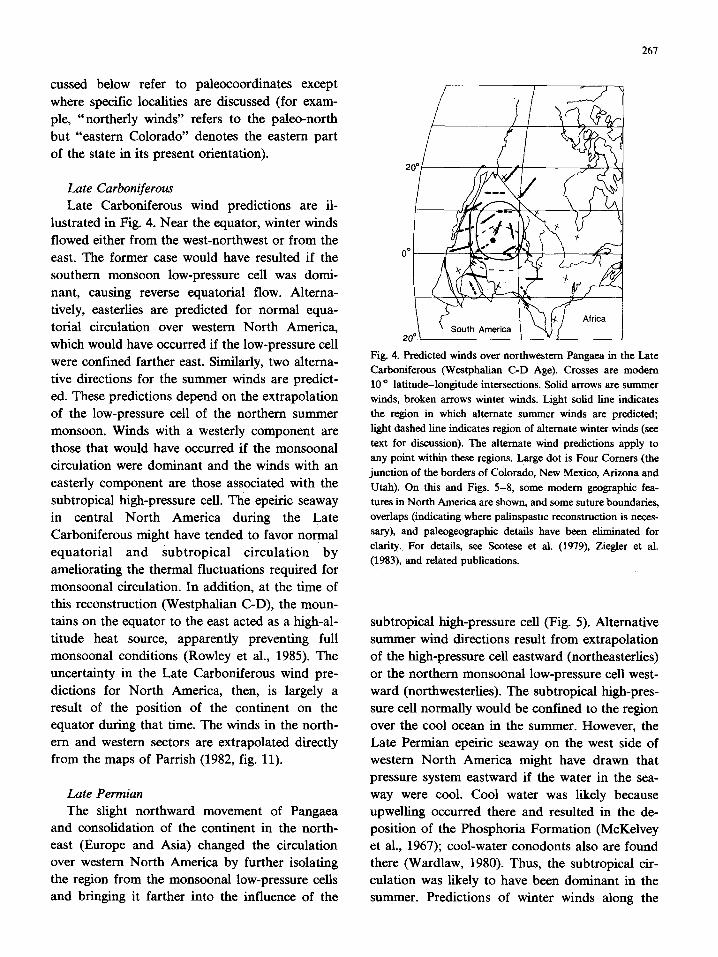
Late Carboniferous Late Carboniferous wind predictions are il-
lustrated in Fig. 4. Near the equator, winter winds flowed either from the west-northwest or from the east. The former case would have resulted if the southern monsoon low-pressure cell was domi- nant, causing reverse equatorial flow. Alterna- tively, easterlies are predicted for normal equa- torial circulation over western North America, which would have occurred if the low-pressure cell were confined farther east. Similarly, two alterna- tive directions for the summer winds are predict- ed. These predictions depend on the extrapolation of the low-pressure cell of the northern summer monsoon. Winds with a westerly component are those that would have occurred if the monsoonal circulation were dominant and the winds with an easterly component are those associated with the subtropical high-pressure cell. The epeiric seaway in central North America during the Late Carboniferous might have tended to favor normal equatorial and Subtropical circulation by ameliorating the thermal fluctuations required for monsoonal circulation. In addition, at the time of this reconstruction (Westphalian C-D), the moun- tains on the equator to the east acted as a high-al- titude heat source, apparently preventing full monsoonal conditions (Rowley et al., 1985). The uncertainty in the Late Carboniferous wind pre- dictions for North America, then, is largely a result of the position of the continent on the equator during that time. The winds in the north- ern and western sectors are extrapolated directly from the maps of Parrish (1982, fig. 11).
Late Permian The slight northward movement of Pangaea
and consolidation of the continent in the north- east (Europe and Asia) changed the circulation over western North America by further isolating the region from the monsoonal low-pressure cells and bringing it farther into the influence of the
267
20 o
0 °
2o °.
! ;J /
i i South Amer i ca
Y
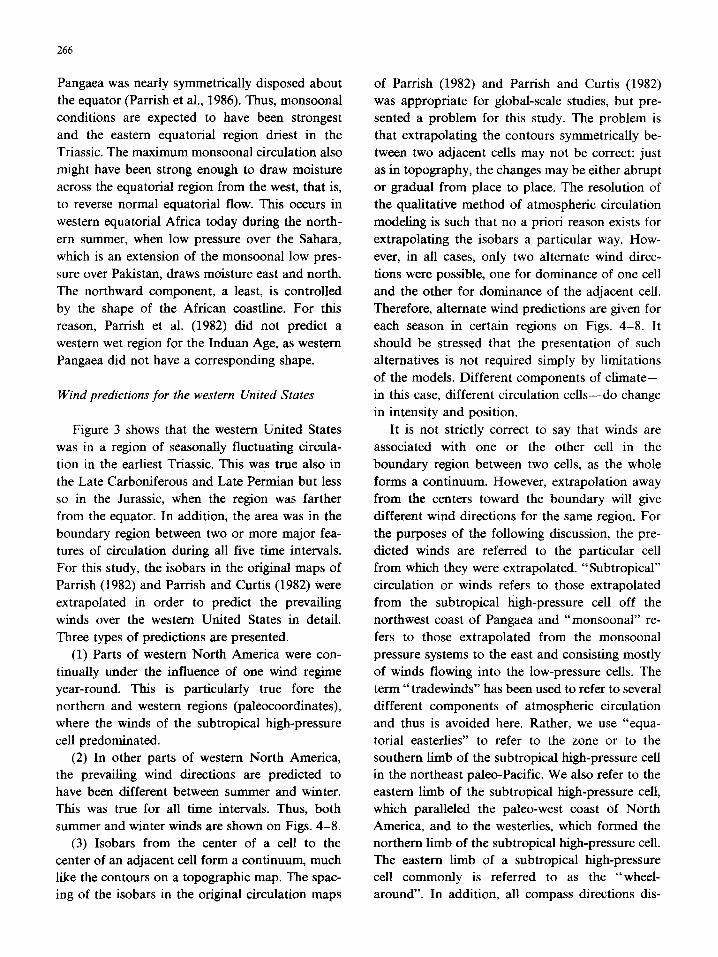
J Fig. 4. Predicted winds over northwestern Pangaea in the Late Carboniferous (Westphalian C-D Age). Crosses are modern 10 o latitude-longitude intersections. Solid arrows are summer winds, broken arrows winter winds. Light solid line indicates the region in which alternate summer winds are predicted; light dashed line indicates region of alternate winter winds (see text for discussion). The alternate wind predictions apply to any point within these regions. Large dot is Four Comers (the junction of the borders of Colorado, New Mexico, Arizona and Utah). On this and Figs. 5-8, some modern geographic fea- tures in North America are shown, and some suture boundaries, overlaps (indicating where pahnspastic reconstruction is neces- sary), and paleogeographic details have been eliminated for clarity.. For details, see Scotese et al. (1979), Ziegler et al. (1983), and related publications.
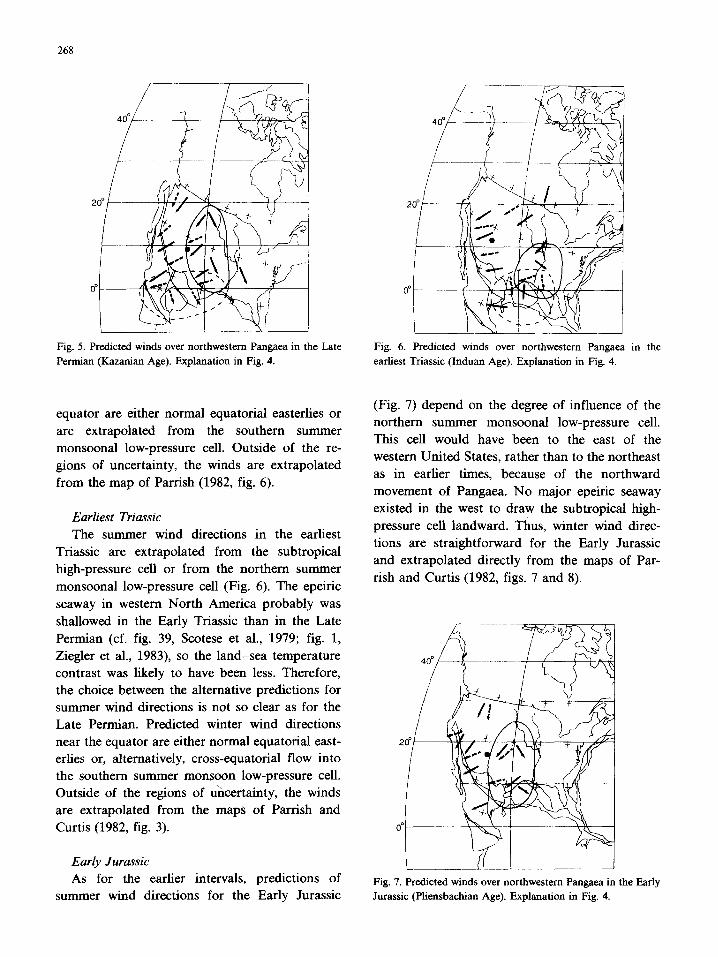
subtropical high-pressure cell (Fig. 5). Alternative summer wind directions result from extrapolation of the high-pressure cell eastward (northeasterlies) or the northern monsoonal low-pressure cell west- ward (northwesterlies). The subtropical high-pres- sure cell normally would be confined to the region over the cool ocean in the summer. However, the Late Permian epeiric seaway on the west side of western North America might have drawn that pressure system eastward if the water in the sea- way were cool. Cool water was likely because upwelling occurred there and resulted in the de- position of the Phosphoria Formation (McKelvey et al., 1967); cool-water conodonts also are found there (Wardlaw, 1980). Thus, the subtropical cir- culation was likely to have been dominant in the summer. Predictions of winter winds along the
268
00
Fig. 5. Predicted winds over northwestern Pangaea in the Late Permian (Kazanian Age). Explanation in Fig. 4.
Fig. 6. Predicted winds over northwestern Pangaea in the earliest Triassic (Induan Age). Explanation in Fig. 4.
equator are either normal equatorial easterlies or are extrapolated from the southern summer monsoonal low-pressure cell. Outside of the re- gions of uncertainty, the winds are extrapolated from the map of Parrish (1982, fig. 6).
Earliest Triassic The summer wind directions in the earliest
Triassic are extrapolated from the subtropical high-pressure cell or from the northern summer
monsoonal low-pressure cell (Fig. 6). The epeiric seaway in western North America probably was
shallowed in the Early Triassic than in the Late Permian (cf. fig. 39, Scotese et al., 1979; fig. 1, Ziegler et al., 1983), so the land-sea temperature contrast was likely to have been less. Therefore, the choice between the alternative predictions for summer wind directions is not so clear as for the Late Permian. Predicted winter wind directions near the equator are either normal equatorial east- erlies or, alternatively, cross-equatorial flow into the southern summer monsoon low-pressure cell. Outside of the regions of uncertainty, the winds are extrapolated from the maps of Parrish and
Curtis (1982, fig. 3).
Early Jurassic As for the earlier intervals, predictions of
summer wind directions for the Early Jurassic
(Fig. 7) depend on the degree of influence of the northern summer monsoonal low-pressure cell. This cell would have been to the east of the western United States, rather than to the northeast
as in earlier times, because of the northward movement of Pangaea. No major epeiric seaway existed in the west to draw the subtropical high- pressure cell landward. Thus, winter wind direc- tions are straightforward for the Early Jurassic and extrapolated directly from the maps of Par- rish and Curtis (1982, figs. 7 and 8).
Fig. 7. Predicted winds over northwestern Pangaea in the Early Jurassic (Pliensbachian Age). Explanation in Fig. 4.
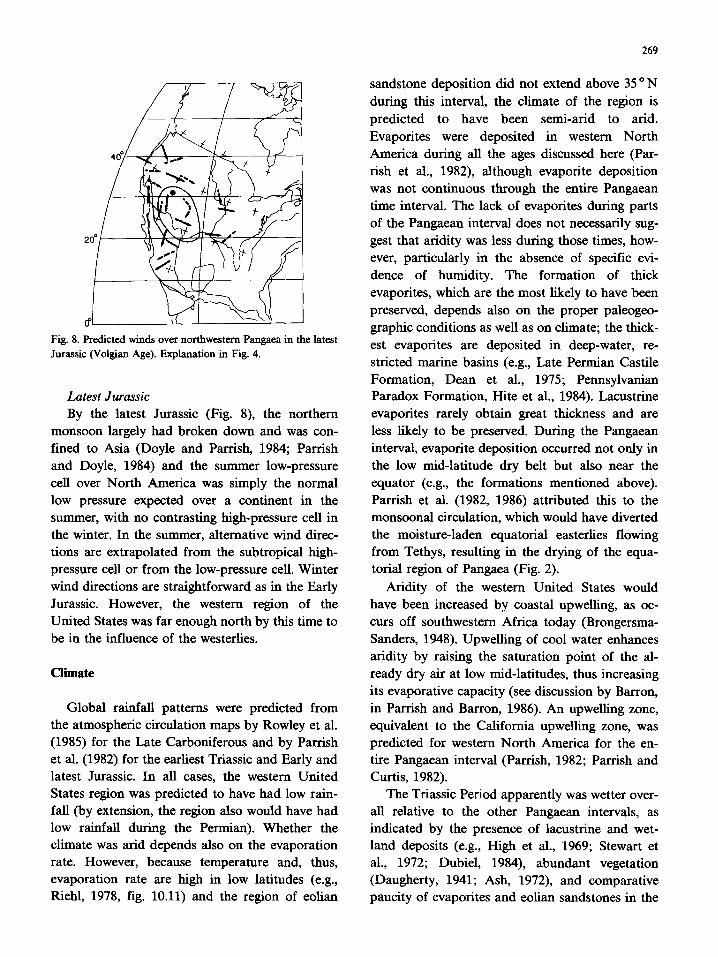
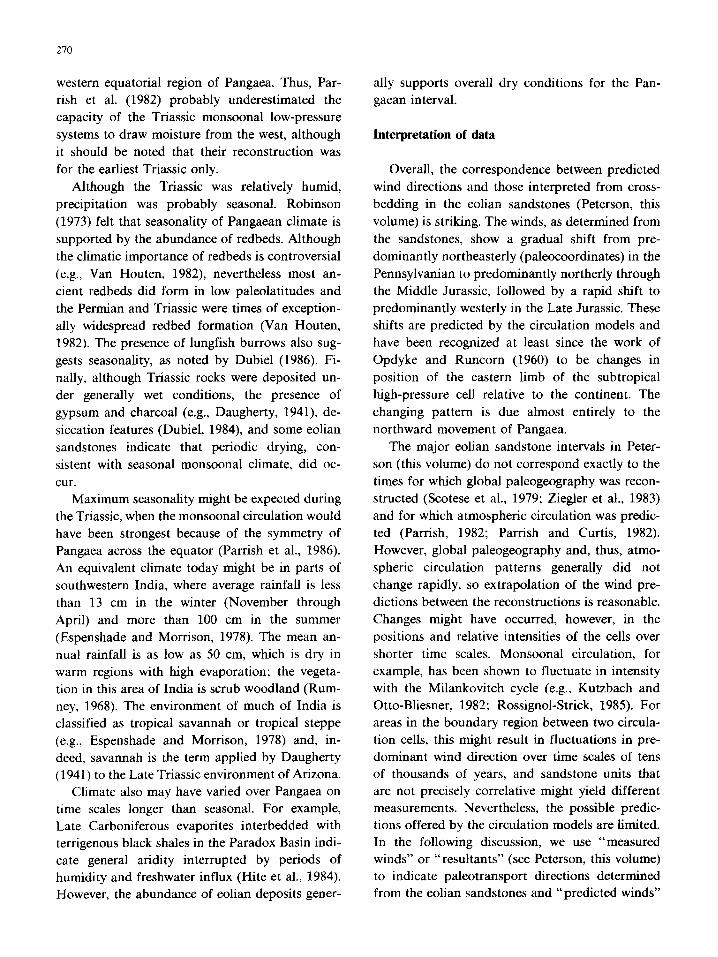
Fig. 8. Predicted winds over northwestern Pangaea in the latest Jurassic (Volgian Age). Exphmation in Fig. 4.
Latest Jurassic
By the latest Jurassic (Fig. 8), the northern monsoon largely had broken down and was con- fined to Asia (Doyle and Parrish, 1984; Parrish and Doyle, 1984) and the summer low-pressure cell over North America was simply the normal low pressure expected over a continent in the summer, with no contrasting high-pressure cell in the winter. In the summer, alternative wind direc- tions are extrapolated from the subtropical high- pressure cell or from the low-pressure cell. Winter wind directions are straightforward as in the Early Jurassic. However, the western region of the United States was far enough north by this time to be in the influence of the westerlies.
Climate
Global rainfall patterns were predicted from the atmospheric circulation maps by Rowley et al. (1985) for the Late Carboniferous and by Parrish et al. (1982) for the earliest Triassic and Early and latest Jurassic. In all cases, the western United States region was predicted to have had low rain- fall (by extension, the region also would have had low rainfall during the Permian). Whether the climate was arid depends also on the evaporation rate. However, because temperature and, thus, evaporation rate are high in low latitudes (e.g., Riehl, 1978, fig. 10.11) and the region of eolian
269
sandstone deposition did not extend above 35 °N during this interval, the climate of the region is predicted to have been semi-arid to arid. Evaporites were deposited in western North America during all the ages discussed here (Par- rish et al., 1982), although evaporite deposition was not continuous through the entire Pangaean time interval. The lack of evaporites during parts of the Pangaean interval does not necessarily sug- gest that aridity was less during those times, how- ever, particularly in the absence of specific evi- dence of humidity. The formation of thick evaporites, which are the most likely to have been preserved, depends also on the proper paleogeo- graphic conditions as well as on climate; the thick- est evaporites are deposited in deep-water, re- stricted marine basins (e.g., Late Permian Castile Formation, Dean et al., 1975; Pennsylvanian Paradox Formation, Hite et al., 1984). Lacustrine evaporites rarely obtain great thickness and are less likely to be preserved. During the Pangaean interval, evaporite deposition occurred not only in the low mid-latitude dry belt but also near the equator (e.g., the formations mentioned above). Parrish et al. (1982, 1986) attributed this to the monsoonal circulation, which would have diverted the moisture-laden equatorial easterlies flowing from Tethys, resulting in the drying of the equa- torial region of Pangaea (Fig. 2).
Aridity of the western United States would have been increased by coastal upwelling, as oc- curs off southwestern Africa today (Brongersma- Sanders, 1948). Upwelling of cool water enhances aridity by raising the saturation point of the al- ready dry air at low mid-latitudes, thus increasing its evaporative capacity (see discussion by Barron, in Parrish and Barron, 1986). An upwelling zone, equivalent to the California upwelling zone, was predicted for western North America for the en- tire Pangaean interval (Parrish, 1982; Parrish and Curtis, 1982).
The Triassic Period apparently was wetter over- all relative to the other Pangaean intervals, as indicated by the presence of lacustrine and wet- land deposits (e.g., High et al., 1969; Stewart et al., 1972; Dubiel, 1984), abundant vegetation (Daugherty, 1941; Ash, 1972), and comparative paucity of evaporites and eolian sandstones in the
270
western equatorial region of Pangaea. Thus, Par- rish et al. (1982) probably underestimated the capacity of the Triassic monsoonal low-pressure systems to draw moisture from the west, although it should be noted that their reconstruction was for the earliest Triassic only.
Although the Triassic was relatively humid, precipitation was probably seasonal. Robinson (1973) felt that seasonality of Pangaean climate is supported by the abundance of redbeds. Although the climatic importance of redbeds is controversial (e.g., Van Houten, 1982), nevertheless most an- cient redbeds did form in low paleolatitudes and the Permian and Triassic were times of exception- ally widespread redbed formation (Van Houten, 1982). The presence of lungfish burrows also sug- gests seasonality, as noted by Dubiel (1986). Fi- nally, although Triassic rocks were deposited un- der generally wet conditions, the presence of gypsum and charcoal (e.g., Daugherty, 1941), de- siccation features (Dubiel, 1984), and some eolian sandstones indicate that periodic drying, con- sistent with seasonal monsoonal climate, did oc- cur.
Maximum seasonality might be expected during the Triassic, when the monsoonal circulation would have been strongest because of the symmetry of Pangaea across the equator (Parrish et al., 1986). An equivalent climate today might be in parts of southwestern India, where average rainfall is less than 13 cm in the winter (November through April) and more than 100 cm in the summer (Espenshade and Morrison, 1978). The mean an- nual rainfall is as low as 50 cm, which is dry in warm regions with high evaporation; the vegeta- tion in this area of India is scrub woodland (Rum- ney, 1968). The environment of much of India is classified as tropical savannah or tropical steppe (e.g., Espenshade and Morrison, 1978) and, in- deed, savannah is the term applied by Daugherty (l 941) to the Late Triassic environment of Arizona.
Climate also may have varied over Pangaea on time scales longer than seasonal. For example, Late Carboniferous evaporites interbedded with terrigenous black shales in the Paradox Basin indi- cate general aridity interrupted by periods of humidity and freshwater influx (Hite et al., 1984). However, the abundance of eolian deposits gener-
ally supports overall dry conditions for the Pan- gaean interval.
Interpretation of data
Overall, the correspondence between predicted wind directions and those interpreted from cross- bedding in the eolian sandstones (Peterson, this volume) is striking. The winds, as determined from the sandstones, show a gradual shift from pre- dominantly northeasterly (paleocoordinates) in the Pennsytvanian to predominantly northerly through the Middle Jurassic, followed by a rapid shift to predominantly westerly in the Late Jurassic. These shifts are predicted by the circulation models and have been recognized at least since the work of Opdyke and Runcorn (1960) to be changes in position of the eastern limb of the subtropical high-pressure cell relative to the continent. The changing pattern is due almost entirely to the northward movement of Pangaea.
The major eolian sandstone intervals in Peter- son (this volume) do not correspond exactly to the times for which global paleogeography was recon- structed (Scotese et al., 1979; Ziegler et al., 1983) and for which atmospheric circulation was predic- ted (Parrish, 1982; Parrish and Curtis, 1982). However, global paleogeography and, thus, atmo- spheric circulation patterns generally did not change rapidly, so extrapolation of the wind pre- dictions between the reconstructions is reasonable. Changes might have occurred, however, in the positions and relative intensities of the cells over shorter time scales. Monsoonal circulation, for example, has been shown to fluctuate in intensity with the Milankovitch cycle (e.g., Kutzbach and Otto-Bliesner, 1982; Rossignol-Strick, 1985). For areas in the boundary region between two circula- tion cells, this might result in fluctuations in pre- dominant wind direction over time scales of tens of thousands of years, and sandstone units that are not precisely correlative might yield different measurements. Nevertheless, the possible predic- tions offered by the circulation models are limited. In the following discussion, we use "measured winds" or "resultants" (see Peterson, this volume) to indicate paleotransport directions determined from the eolian sandstones and "predicted winds"
to indicate the wind directions predicted from the climate models (Parrish, 1982; Parrish and Curtis, 1982).
Middle Pennsylvanian and Earliest Permian (Earliest Wolfcampian)
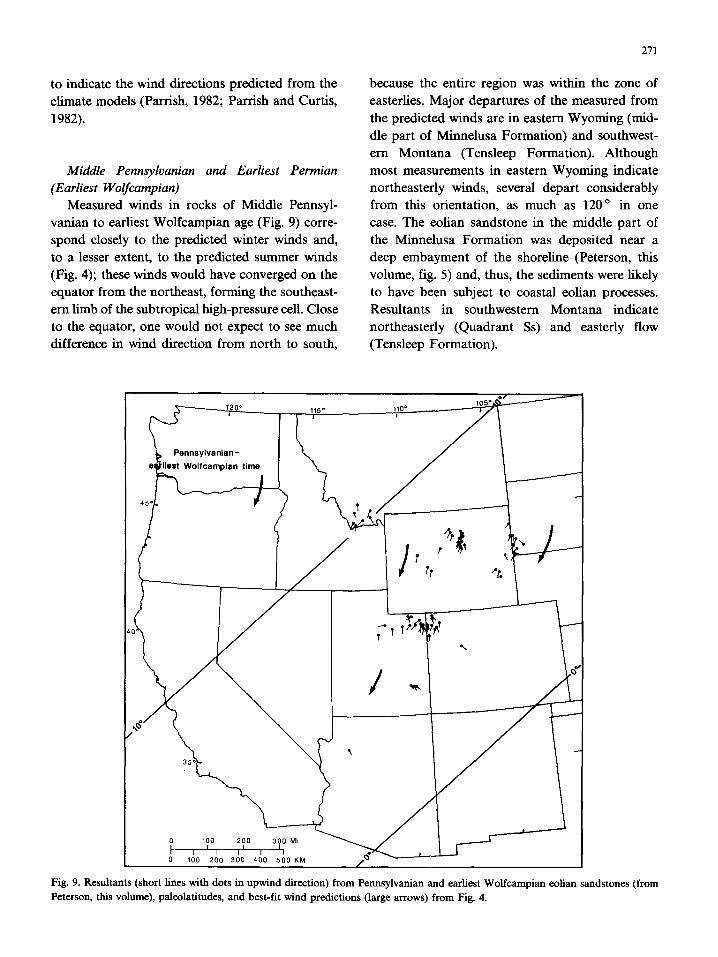
Measured winds in rocks of Middle Permsyl- vanian to earliest Wolfcampian age (Fig. 9) corre- spond closely to the predicted winter winds and, to a lesser extent, to the predicted summer winds (Fig. 4); these winds would have converged on the equator from the northeast, forming the southeast- ern limb of the subtropical high-pressure cell. Close to the equator, one would not expect to see much difference in wind direction from north to south,
271
because the entire region was within the zone of easterlies. Major departures of the measured from the predicted winds are in eastern Wyoming (mid- dle part of Minnelusa Formation) and southwest- ern Montana (Tensleep Formation). Although most measurements in eastern Wyoming indicate northeasterly winds, several depart considerably from this orientation, as much as 120 ° in one case. The eolian sandstone in the middle part of the Minnelusa Formation was deposited near a deep embayment of the shoreline (Peterson, this volume, fig. 5) and, thus, the sediments were likely to have been subject to coastal eolian processes. Resultants in southwestern Montana indicate northeasterly (Quadrant Ss) and easterly flow (Tensleep Formation).
115" 110* j I
/ }' ~'I'
I Trp
1 0 ,00 I t I I I I I o IOO 20o 3o0 4~o 50oK. j
Fig. 9. Resultants (short lines with dots in upwind direction) from Permsylvanian and earliest Wolfcampian eolian sandstones (t'rom Peterson, this volume), paleolatitudes, and best-fit wind predictions (large arrows) from Fig. 4.
272
Early Permian (Wolfcampian) By Permian time, the measured winds in
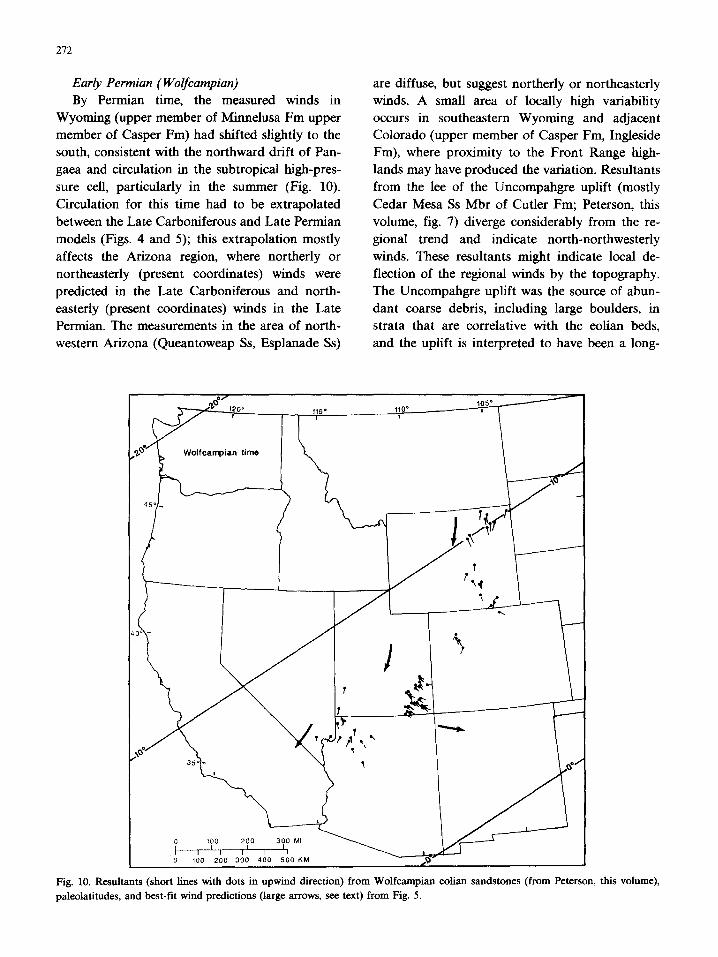
Wyoming (upper member of Minnelusa Fm upper member of Casper Fm) had shifted slightly to the south, consistent with the northward drift of Pan- gaea and circulation in the subtropical high-pres- sure cell, particularly in the summer (Fig. 10). Circulation for this time had to be extrapolated between the Late Carboniferous and Late Permian models (Figs. 4 and 5); this extrapolation mostly affects the Arizona region, where northerly or northeasterly (present coordinates) winds were predicted in the Late Carboniferous and north- easterly (present coordinates) winds in the Late Permian. The measurements in the area of north- western Arizona (Queantoweap Ss, Esplanade Ss)
are diffuse, but suggest northerly or northeasterly winds. A small area of locally high variability occurs in southeastern Wyoming and adjacent Colorado (upper member of Casper Fm, Ingleside Fm), where proximity to the Front Range high- lands may have produced the variation. Resultants from the lee of the Uncompahgre uplift (mostly Cedar Mesa Ss Mbr of Cutler Fm; Peterson, this volume, fig. 7) diverge considerably from the re- gional trend and indicate north-northwesterly winds. These resultants might indicate local de- flection of the regional winds by the topography. The Uncompahgre uplift was the source of abun- dant coarse debris, including large boulders, in strata that are correlative with the eolian beds, and the uplift is interpreted to have been a long-
I_20 ~ 115 ° 1.10° I I I I
. t05 °
Wolfcampian t i m e
1 ?
100 2 0 0 3 0 0 MI
0 II0 I I I I I 1 i 2 0 0 3 0 0 4 0 0 5 0 0 KM
Fig. 10. Resultants (short lines with dots in upwind direction) from Wolfcampian eolian sandstones (from Peterson, this volume), paleolatitudes, and best-fit wind predictions (large arrows, see text) from Fig. 5.
lasting positive and possibly mountainous topo- graphic region. Similar wind anomalies occur in approximately this region throughout the Pan- gaean interval; these will be pointed out in the following sections and examined further toward the end of this discussion. However, these re- sultants extend as much as 250 km from the highland, and it is unlikely that the effect of the highland on the wind would extend that far. Alter- natively, this dune field might have been more subject to the influence of the summer monsoonal winds, to which the measurements correspond.
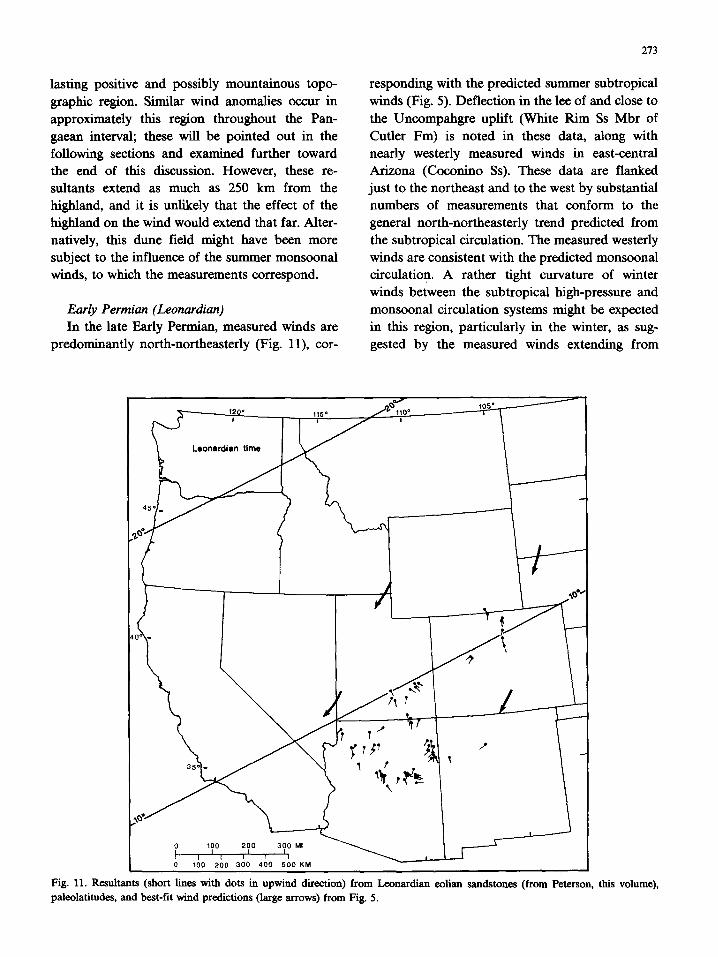
Early Permian (Leonardian) In the late Early Permian, measured winds are
predominantly north-northeasterly (Fig. 11), cor-
273
responding with the predicted summer subtropical winds (Fig. 5). Deflection in the lee of and close to the Uncompahgre uplift (White Rim Ss Mbr of Cutler Fm) is noted in these data, along with nearly westerly measured winds in east-central Arizona (Coconino Ss). These data are flanked just to the northeast and to the west by substantial numbers of measurements that conform to the general north-northeasterly trend predicted from the subtropical circulation. The measured westerly winds are consistent with the predicted monsoonal circulation. A rather tight curvature of winter winds between the subtropical high-pressure and monsoonal circulation systems might be expected in this region, particularly in the winter, as sug- gested by the measured winds extending from
!
Leonardien time
115 ° I
35*
\
0 100 2 0 0 3 0 0 MI / 0 100 2 0 0 3 0 0 4 0 0 5 0 0 KM - - J
Fig. 11. Resultants (short lines with dots in upwind dkectJon) from Lconardian eolian sandstones (from Peterson, this volume), paleolatitudes, and best-fit wind predictions (large arrows) from Fig. 5.
274
northwestern to east-central Arizona. This ex- planation does not, however, satisfy the resultants in northeastern Arizona, which have the north- easterly trend expected from the predicted sub- tropical circulation. The paleogeography of this region (Peterson, this volume, fig. 8), shorelines and uplifts, might have contributed to the variabil- ity in the measured winds from this region. The area was bordered on three sides by ocean and on the fourth side by the Uncompahgre uplift. The greatest deviations of measured winds from the predicted subtropical circulation are near the up- lift and on the downwind coast of this peninsula. Finally, as mentioned in Peterson (this volume), the eolian sandstones in this region may not be entirely correlative.
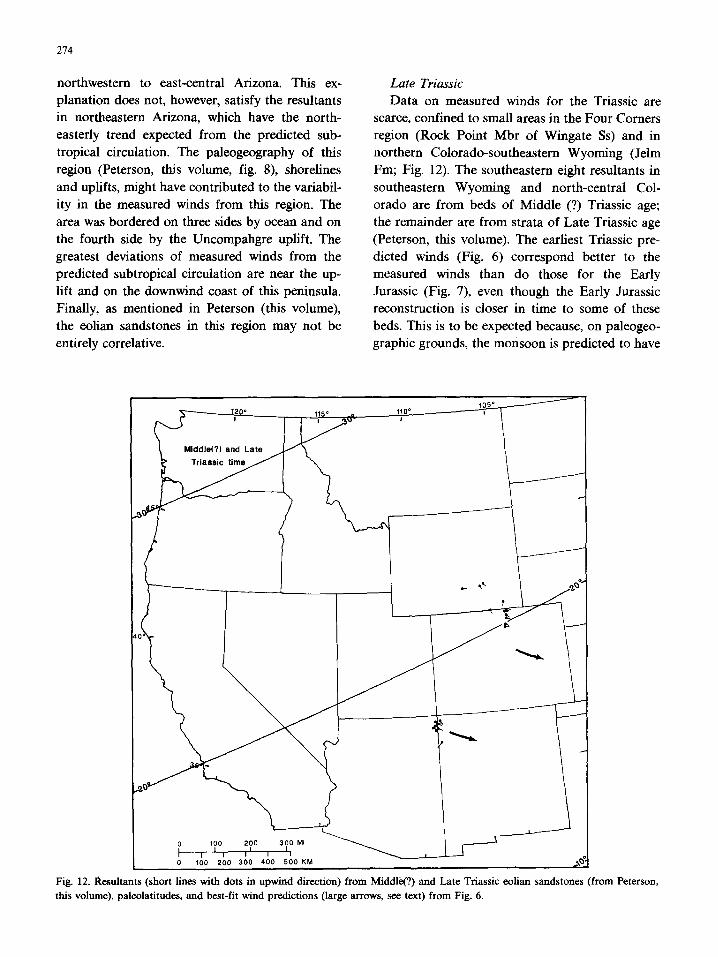
Late Triassic
Data on measured winds for the Triassic are scarce, confined to small areas in the Four Corners region (Rock Point Mbr of Wingate Ss) and in northern Colorado-southeastern Wyoming (Jelm Fro; Fig. 12). The southeastern eight resultants in southeastern Wyoming and north-central Col- orado are from beds of Middle (?) Triassic age; the remainder are from strata of Late Triassic age (Peterson, this volume). The earliest Triassic pre- dicted winds (Fig. 6) correspond better to the measured winds than do those for the Early Jurassic (Fig. 7), even though the Early Jurassic reconstruction is closer in time to some of these beds. This is to be expected because, on paleogeo- graphic grounds, the monsoon is predicted to have
- !
Middle(?) and Late
Triassic time J
T
L 0 01100 200 300MI ~ ' - ~ I I I I I II 0 1 0 200 300 400 500 KM =
Fig. 12. Resultants (short lines with dots in upwind direction) from Middle(?) and Late Triassic eolian sandstones (from Peterson, this volume), paleolatitudes, and best-fit wind predictions (large arrows, see text) from Fig. 6.
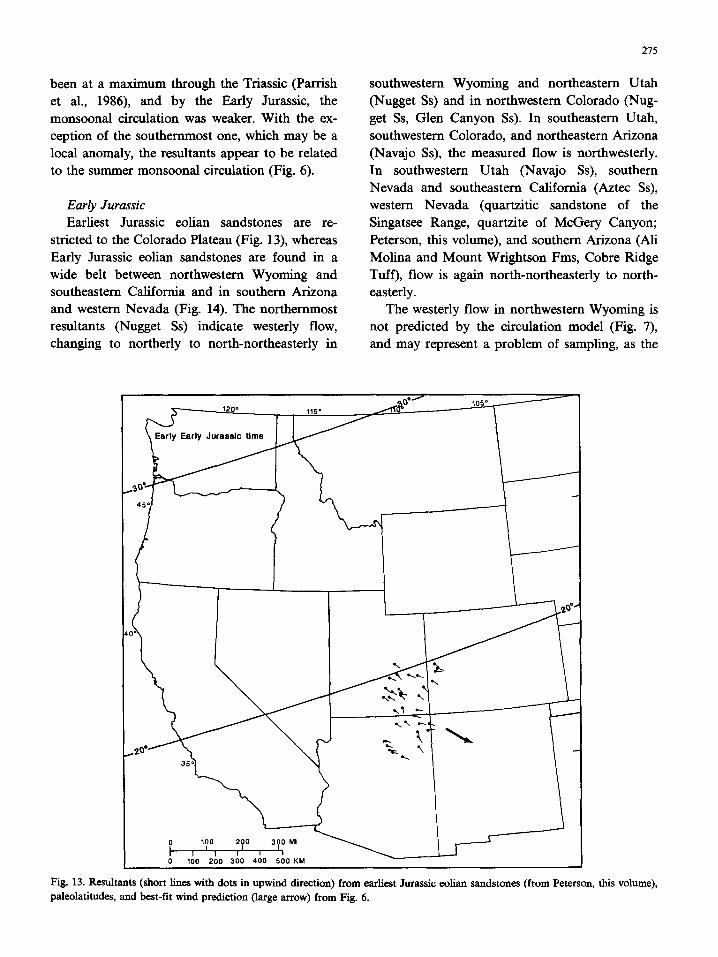
been at a maximum through the Triassic (Parrish et al., 1986), and by the Early Jurassic, the monsoonal circulation was weaker. With the ex- ception of the southernmost one, which may be a local anomaly, the resultants appear to be related to the summer monsoonal circulation (Fig. 6).
Early Jurassic Earliest Jurassic eolian sandstones are re-
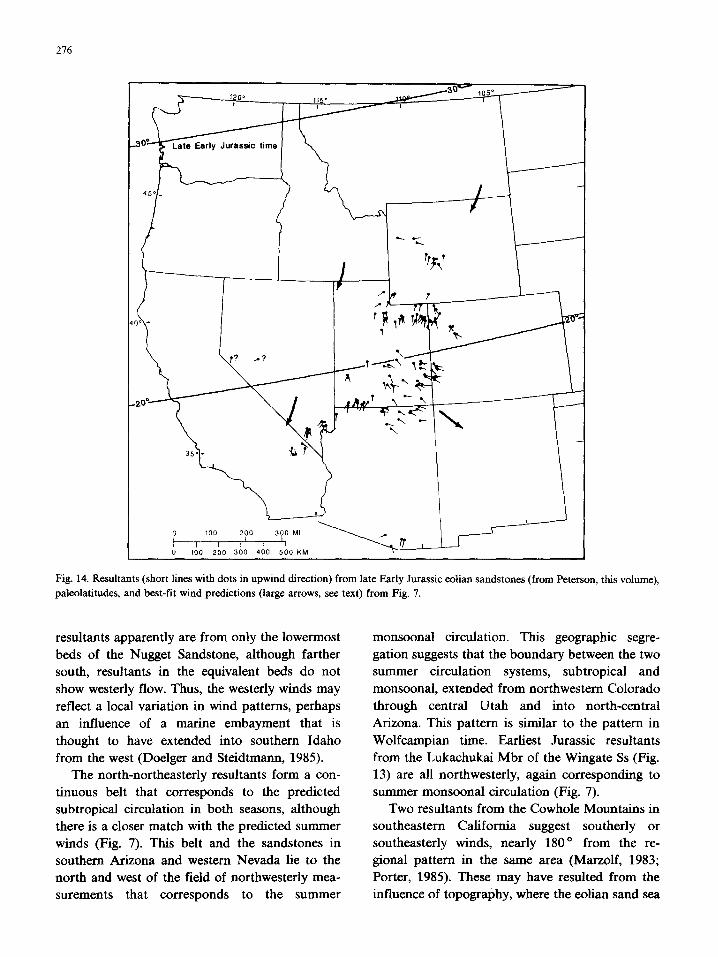
stricted to the Colorado Plateau (Fig. 13), whereas Early Jurassic eolian sandstones are found in a wide belt between northwestern Wyoming and southeastern California and in southern Arizona and western Nevada (Fig. 14). The northernmost resultants (Nugget Ss) indicate westerly flow, changing to northerly to north-northeasterly in
275
southwestern Wyoming and northeastern Utah (Nugget Ss) and in northwestern Colorado (Nug- get Ss, Glen Canyon Ss). In southeastern Utah, southwestern Colorado, and northeastern Arizona (Navajo Ss), the measured flow is northwesterly. In southwestern Utah (Navajo Ss), southern Nevada and southeastern California (Aztec Ss), western Nevada (quartzitic sandstone of the Singatsee Range, quartzite of McGery Canyon; Peterson, this volume), and southern Arizona (Ali Molina and Mount Wrightson Fms, Cobre Ridge Tuff), flow is again north-northeasterly to north- easterly.
The westerly flow in northwestern Wyoming is not predicted by the circulation model (Fig. 7), and may represent a problem of sampling, as the
Early Early Jurassic time
115 °
0 100 200 3 0 0 4 0 0 500 KM
Fig. 13. Resultants (short lines with dots in upwind direction) from earliest Jurassic eolian sandstones (from Peterson, this volume), paleolatitudes, and best-fit wind prediction (large arrow) from Fig. 6.
276
115 °
Late Early Jurassic time
,? ..,,?
% \
0 100 2 0 0 3 0 0 MI t I I I I l LI 0 1 / 0 2 0 0 3 0 0 4 0 0 5 0 0 KM
Fig. 14. Resultants (short lines with dots in upwind direction) from late Early Jurassic eolian sandstones (from Peterson, this volume), paleolatitudes, and best-fit wind predictions (large arrows, see text) from Fig. 7.
resultants apparently are from only the lowermost beds of the Nugget Sandstone, although farther south, resultants in the equivalent beds do not show westerly flow. Thus, the westerly winds may reflect a local variation in wind patterns, perhaps an influence of a marine embayment that is thought to have extended into southern Idaho from the west (Doelger and Steidtmann, 1985).
The north-northeasterly resultants form a con- tinuous belt that corresponds to the predicted subtropical circulation in both seasons, although there is a closer match with the predicted summer winds (Fig. 7). This belt and the sandstones in southern Arizona and western Nevada lie to the north and west of the field of northwesterly mea- surements that corresponds to the summer
monsoonal circulation. This geographic segre- gation suggests that the boundary between the two summer circulation systems, subtropical and monsoonal, extended from northwestern Colorado through central Utah and into north-central Arizona. This pattern is similar to the pattern in Wolfcampian time. Earliest Jurassic resultants from the Lukachukai Mbr of the Wingate Ss (Fig. 13) are all northwesterly, again corresponding to summer monsoonal circulation (Fig. 7).
Two resultants from the Cowhole Mountains in southeastern California suggest southerly or southeasterly winds, nearly 180 ° from the re- gional pattern in the same area (Marzolf, 1983; Porter, 1985). These may have resulted from the influence of topography, where the eolian sand sea
lapped onto the magmatic arc. Alternatively, they could reflect tectonic rotation of the Cowhole Mountains crustal block during movement on a nearby strike-slip fault (Marzolf, 1983).
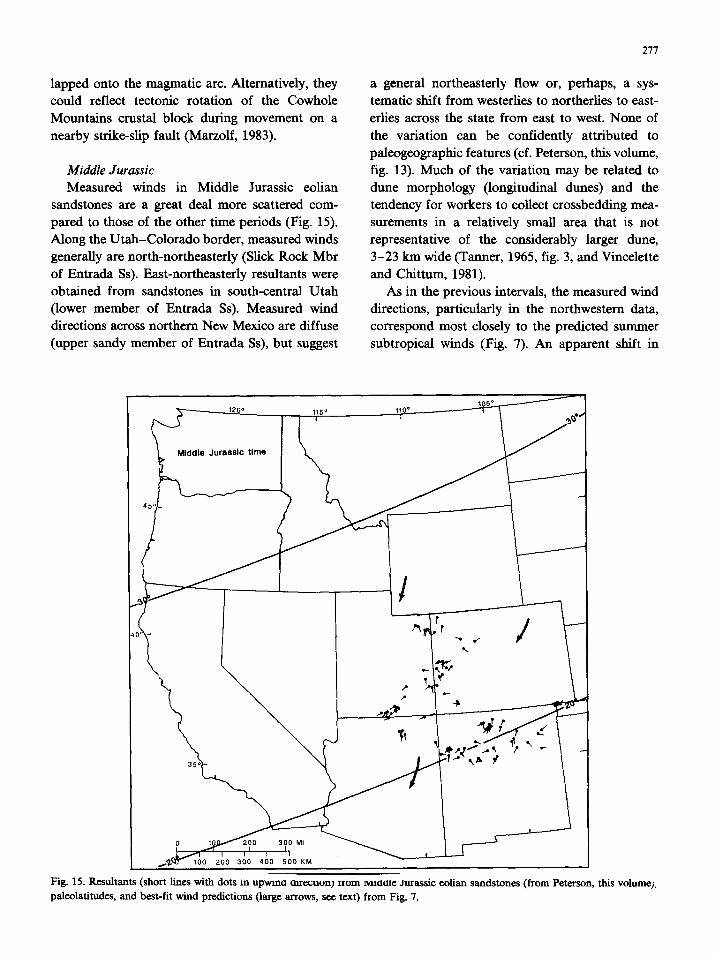
Middle Jurassic Measured winds in Middle Jurassic eolian
sandstones are a great deal more scattered com- pared to those of the other time periods (Fig. 15). Along the Utah-Colorado border, measured winds generally are north-northeasterly (Slick Rock Mbr of Entrada Ss). East-northeasterly resultants were obtained from sandstones in south-central Utah (lower member of Entrada Ss). Measured wind directions across northern New Mexico are diffuse (upper sandy member of Entrada Ss), but suggest
277
a general northeasterly flow or, perhaps, a sys- tematic shift from westerlies to northerlies to east- erlies across the state from east to west. None of the variation can be confidently attributed to paleogeographic features (cf. Peterson, this volume, fig. 13). Much of the variation may be related to dune morphology (longitudinal dunes) and the tendency for workers to collect crossbedding mea- surements in a relatively small area that is not representative of the considerably larger dune, 3-23 km wide (Tanner, 1965, fig. 3, and Vincelette and Chittum, 1981).
As in the previous intervals, the measured wind directions, particularly in the northwestern data, correspond most closely to the predicted summer subtropical winds (Fig. 7). An apparent shift in
Middle Jurassic time
115 ° !
/
%
\
P / t
0 300 MI
~9,.~IT 100 200 300 400 500 KM
Fig. 15. Resultants (short lines with dots in upwmo otrecuon) irom ~Jo(lle Jurassic eolian sandstones (from Peterson, this volume)~ paleolatitudes, and best-fit wind predictions (large arrows, see text) from Fig. 7.
278
measured wind directions across New Mexico may be the remnant of the boundary between subtropi- cal and monsoonal circulation described for previ- ous intervals.
Two major geographic changes occurred be- tween the Early Jurassic and latest Jurassic that had corresponding effects on the circulation (Figs. 7 and 8). First, North America moved about 15 ° farther north, bringing the western portion of the continent into the belt of westerlies. Second, North America rotated about 15 ° clockwise with the opening of the North Atlantic. The combination of these two changes resulted in a shift of wind directions at least 45 o and, in places 90 °, relative to the continent. Early Jurassic wind predictions are the most appropriate for the Middle Jurassic
because a major change in global circulation, the breakdown of the northern monsoon, occurred between the Middle and Late Jurassic (Doyle and Parrish, 1984; Parrish and Doyle, 1984; Hallam, 1984). Therefore, it is expected that the Middle Jurassic measurements would conform better to the Early Jurassic circulation predictions (Fig. 7) than to the latest Jurassic predictions (Fig. 8). On the other hand, although the monsoonal circula- tion did not break down until the end of the Middle Jurassic, it was certainly weakening rela- tive to the Triassic because Pangaea was less sym- metrical around the equator (Parrish et al., 1986) and because sea level was rising (e.g., Vail et al., 1984), reducing the size of the continent (Parrish, 1985) and its climatic effects. Thus, a high degree
Late Jurassic t ime
115 ° I
~1o._.L i
. a
i , ~ l .
i 0 300 MI ~ 1
200 300 400 500 KM
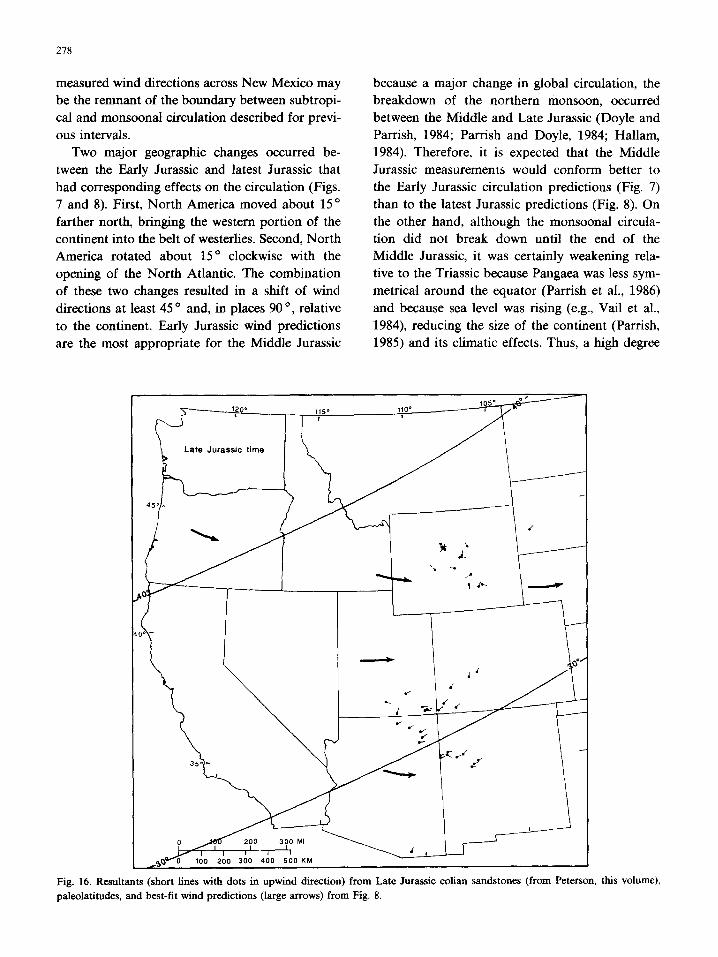
Fig. 16. Resultants (short lines with dots in upwind direction) from Late Jurassic eolian sandstones (from Peterson, this volume), paleolatitudes, and best-fit wind predictions (large arrows) from Fig. 8.
of variability in the winds, reflecting a transition between the monsoonal and non-monsoonal circu- lation states, would be expected for this interval.
Late Jurassic
The paleogeographic and global circulation changes described in the previous paragraph brought about a dramatic change in winds over the western United States. Circulation is predicted to have shifted from predominantly northerly to west-northwesterly or westerly. The resultants come mostly from outcrops of the Morrison Fm and Junction Creek Ss (Fig. 16) and indicate westerly flow. This corresponds to the normal predicted subtropical winter winds and to the summer flow into the low-pressure cell over the central part of the continent.
Resultants in Wyoming are highly variable and statistically randomly distributed (Peterson, this volume). Apparently, the winds in this area were more closely related to local uplifts and irregular- ities in the shoreline of the retreating Windy Hill seaway than to regional wind patterns.
Summary and discussion
For most of the Pangaean interval, with the exception of the Pennsylvanian and Late Jurassic, predicted summer winds corresponded best to the measured wind directions. In the Pennsylvanian, predicted winter subtropical/equatorial easterly winds correspond best to the measured wind di- rections. Subtropical/equatorial easterly winds predominated because the monsoonal circulation was barely established. Owing to the position of the western United States on the equator, the winter winds were likely to have been stronger than the summer winds. This is because the sub- tropical high-pressure cell is closer to the geo- graphic equator during the winter than during the summer owing to the tilt of the Earth's axis and the consequent seasonal shift of the thermal equa- tor.
In the Permian, the predominant winds were the summer winds in the southeastern limb of the subtropical high-pressure cell, although small dune fields might have been influenced by summer monsoonal circulation. In the Late Triassic and
279
earliest Jurassic, the low-pressure cells associated with the predicted summer monsoonal circulation seem to have dominated, although data are scarce. This was toward the end of the time of maximum monsoonal circulation predicted by Parrish et al. (1986). In the late Early and Middle Jurassic, the measured winds corresponded with the predicted summer subtropical winds to the north and west and summer monsoonal winds to the south and east. Thus, for the interval from the Permian to the Middle Jurassic, the predicted summer sub- tropical circulation seems to have been the dominating influence on eolian sand deposition except when the monsoon was at a maximum and where sands were deposited far enough to the south and east to be within the influence of the summer monsoonal circulation.
Finally, in the Late Jurassic, either summer or winter wind predictions corresponded to all or part of the measured wind directions. The combi- nation of the northward movement and rotation of North America brought the western United States into the belt of westerlies, which are per- sistent year-round.
Why was subtropical circulation apparently so important? The subtropical high-pressure cells are very stable and persistent components of atmo- spheric circulation. Among paleoclimatic indica- tors, those related in some way to the subtropical circulation seem to be the most consistent. For example, phosphate, which is deposited in upwell- ing zones, commonly occurs on the low-latitude, paleo-west coasts of continents (e.g., McKelvey, 1959; Freas and Eckstrom, 1968; Parrish et al., 1983), where upwelling is driven by the winds in the eastern limbs of the subtropical high-pressure cells. These winds are generally persistent and strong. Of the settings for upwelling (see Parrish, 1982), the paleo-west coast is the most common and reliably predicted. This suggests, then, that the subtropical circulation would be expected to predominate.
Why were summer subtropical and monsoonal winds apparently more important for eolian sand deposition than winter winds? The most likely explanation is simply that the subtropical circula- tion is more intense during the summer than dur- ing the winter. Subtropical high-pressure cells form
280
in response to land-sea temperature contrast. At low mid-latitudes, land is generally wanner than adjacent ocean. In the summer, the contrast is greatest and the winds are correspondingly strong- est. This effect might be expected to extend to the summer monsoonal circulation as well, in that the subtropical high pressure cell to the west would contrast with the monsoonal low pressure to the east. Seasonality of wind strength and direction under the monsoonal regime might explain cyclic- ity in the Navajo Sandstone, which Hunter and Rubin (1983) attributed to annually fluctuating flow regimes. They stressed that the alternating wind regimes were distinct and regular, criteria on which they rejected daily wind variations as the cause of cyclicity. Strong seasonality, which is particularly characteristic of the monsoonal re- gime, would provide the mechanism proposed by Hunter and Rubin (1983).
Times of high equator-to-pole temperature gradient commonly are stated to be times of vigor- ous circulation and some workers have attributed widespread eolian sandstones to intense winds in a glacial regime (e.g., Glennie, 1983). However, the evidence for a connection between eolian sandstone deposition and glaciation is equivocal. First, circulation, at least as reflected in wind- driven upweUing, does not uniformly increase in intensity during glacial epochs (see discussion in Parrish and Curtis, 1982). For example, west-coast, subtropical upwelling does appear to have been most effective for generating phosphate during the Early Cambrian, Permian, and Miocene (Parrish, in press). These three times were relatively cool periods in Earth history (the terminal Ordovician glacial event was intense but brief and, ap- parently, did not affect climate in the same way as the other three glacial epochs). However, only the west-coast upwellings seem to have strengthened during the three time intervals mentioned above; the circulation in no other setting was particularly affected. Second, glaciation cannot explain the widespread Jurassic eolian sandstones in North America or, more specifically, the resumption of widespread eolian sedimentation during the Jurassic after a lull in the Triassic. Evidence for glaciation during the Jurassic is scarce and highly questionable (Hambrey and Harland, 1981). At
the very least, the winds would have been greatly weakened relative to the Permian (as recognized, for example, by Hunter and Rubin, 1983); such a weakening within the Permian was proposed by Glennie (1983) to explain the decrease in eolian sedimentation in the Rotliegendes, so resumption of eolian sedimentation, according to the glacial model, would require resumption of widespread glaciation.
We suggest that global paleogeographic changes--the formation, northward drift, and breakup of Pangaea--and their effects on circula- tion patterns were the dominating influence on eolian sedimentation and its variations in the western United States and that the latitudinal temperature gradient was of secondary impor- tance. The first major change in circulation, from subtropical to monsoonal, occurred in the Tri- assic, when Pangaea was completely assembled and had drifted far enough north to straddle the equator symmetrically. This paleogeography maxi- mized the monsoonal circulation. The strong monsoonal circulation also drew moisture from the west, so that the Triassic climate in the west- ern United States was wetter and eolian sedi- mentation correspondingly less. As Pangaea moved farther north and the northern part of the conti- nent began to break up, the monsoonal circulation was weakened and dry conditions, expected at that latitude, resumed. The failure to shift back to predominantly subtropical circulation immedia- tely after the peak monsoonal period might indi- cate that the subtropical circulation did not regain its former strength because global climate was warmer. However, as noted previously, the geo- graphic distribution of the eolian sandstones also changed, and those affected by the monsoonal circulation also were deposited farther from the subtropical high-pressure cell.
Acknowledgements
We would like to thank Gary Kocurek for suggesting we look into the application of Parrish's atmospheric circulation models to eolian sand- stones of the western United States and for con- tinued encouragement, generosity of time, and sharing of knowledge about eolian processes. Dis-
281
cussions in N e w Mexico with Dav id M. R u b i n
also were of considerable value in unders tand ing
sedimentologic processes that fo rmed Midd le and
U p p e r Jurassic rocks.Reviews of the manuscr ip t
by and discussions wi th Sidney R. Ash, Russell F.
Dubiel , Ra lph E. Hunter , Denn i s R. Kerr , G a r y
Kocurek, John E. Marzolf , J. Michae l Parr ish and
Chr is topher J. Schenk are grateful ly acknowl-
edged.
References
Ash, S.R., 1972. Plant megafossils of the Chinle Formation. In: C.S. Breed and W.J. Breed (Editors), Investigations in the Triassic Chinle Formation. Mus. North. Ariz. Bull., 47: 23-44.
Bigarella, J.J., 1973. Paleocurrents and the problem of con- tinental drift. Geol. Rundsch. 62: 447-477.
Brongersma-Sanders, M., 1948. The importance of upweUing water to vertebrate paleontology and oil geology. Kon. Ned. Akad. Wetensch., Verb. Afd. Natuurk., 45: 1-112.
Dangherty, UH., 1941. The Upper Triassic flora of Arizona. Carnegie Institute of Washington Publ. 526:108 pp.
Dean, W.E., Davies, G.R. and Anderson, ILY., 1975. Sexli- mentological significance of nodular and laminated anhydrite. Geology, 3: 367-372.
Doelger, N.M. and Steidtmann, J.IL, 1985. Depositional environments of the Nugget S .andstone, Red Canyon Rim, Fremont county, Wyoming. Wyo, Contrib. Geol., 23: 1023.
Doyle, J.A. and Parrish, J.T., 1984. Jurassic-Early Cretaceous plant distributions and paleoclimatic models. Int. Organiza- tion of Paleobotany Conf., Abstracts.
Dubiel, R.F., 1984. Evidence for wet paleoenvironments, Up- per Triassic Chinle Formation, Utah. Geol. Soc. Am., Ab- str. with Programs, 16: p. 220.
Dubiel, R.F., 1986. Evolution of a fluvial-lacustrine system: Tectonic and climatic controls on deposition of the Upper Triassic Chinie Formation, Colorado Plateau. Geol. Soc. Am., Abstr. with Programs, 18: p. 352.
Espenshade Jr., E.E.B. and Morrison, J.L. (Editors), 1978. Goode's World Atlas. Rand McNally, Chicago, Ill., 372 pp.
Freas, D.H. and Eckstrom, C i . , 1968. Areas of potential upwelling and phosphorite deposition during Tertiary, Mesozoic, and Late Paleozoic time. In: Proc. Seminar of Sources of Mineral Raw Materials for the Fertilizer In- dustry in Asia and the Far East. United Nations Mineral Reserve Development Series, 32: 228-238.
Glermie, K.W., 1983. Lower Permian Rotliegend desert sedi- mentation in the North Sea area. In: M.E. Brookfield and T.S. Ahlbrandt (Editors), Eolian Sediments and Processes. (Developments in Sedimentology, 38) Elsevier, Amsterdam, pp. 521-541.
HaUam, A., 1984. Continental humid and arid zones during the Jurassic and Cretaceous. Palaeogeogr., Palaeoclimatol., Palaeoecol., 47: 195-223.
Hambrey, M.J. and Harland, W.B. (Editors), 1981. Earth's Pre-pleistocene Glacial Record. Cambridge Univ. Press, Cambridge, 1004 pp.
High Jr., L.R., Hepp, D.M., Clark, T. and Picard, M.D., 1969. Stratigraphy of Popo Agie Formation (Late Triassic), Uinta Mountain area, Utah and Colorado. Intermountain Associ- ation of Geologists, 16th Annual Field Conf., pp. 181-192.
Hite, R.J., Anders, D.E. and Ging, T.G., 1984. Organic-rich source rocks of Pennsylvanian age in the Paradox Basin of Utah and Colorado. In: J. Woodward, F.F. Meissner and J.L. Clayton (Editors), Hydrocarbon Source Rocks of the Greater Rocky Mountain Region. Rocky Mountain Associ- ation of Geologists, Denver, Colo., pp. 255-274.
Hunter, R.E. and Rubin, D.M., 1983. Interpreting cyclic cross- bedding, with an example from the Navajo Sandstone. In: M.E. Brookfield and T.S. Ahlbrandt (Editors), Eolian Sedi- ments and Processes. (Developments in Sedimentology, 38) Elsevier, Amsterdam, pp. 429-454.
Kolm, K.E., 1982. Predicting the surface wind characteristics of southern Wyoming from remote sensing and eolian geomorpliology. In: R.W. Marc and K.E. Kolm (Editors), Interpretation of Windflow Characteristics from Eolian Landforms. Geol. SOc. Am., Spec. Pap., 192: 25-53.
Kutzbach, J.E. and Otto-Bliesner, B.L., 1982. The sensitivity of African-Asian monsoonal climate to orbital parameter changes for 9000 years B.P. in a low-resohition general circulation model. J. Atmosph. Sei., 39: 1177-1188.
Marzolf, J.E., 1983. Changing winds and hydrologic regimes during deposition of the Navajo and Aztec Sandstones, Jurassic (?), southwestern U.S. In: M.E. Brookfield and T.S. Ahlbrandt (Editors), Eolian Sediments and Processes. (Developments in Sedimentology, 38) Elsevier, Amsterdam, pp. 635-660.
Marzolf, J.E., 1988. Controls on late Paleozoic and early Mesozoic eolian deposition of the western United States. In: G. Kocurek (Editor), Late Paleozoic and Mesozoic Eolian Deposits of the Western Interior of the United States. Sediment. Geol., 56:167-191 (this volume).
MeKee, E.D., 1979. Introduction to a study of global sand seas. In: E.D. McKee (Editor), A study of Global Sand Seas. U.S. Geol. Surv., Prof. Pap., 1052: 1-19.
McKelvey, V.E., 1959. Relation of marine upwelling waters to phosphorite and oil. Geol. Soc. Am. Bull., 70:1783-1784 (abstract).
MeKelvey, V.E., Williams, J.S., Sheldon, R.P., Cressman, E.R., Cheney, T.M. and Swanson, R.W., 1967. The Phosphoria, Park City, and Shedhorn Formations in western Phosphate Field. In: L.A. Hale (Editor), Anatomy of the Western Phosphate Field. Intermountain Association of Geologists, 15th Annual Field Conf., pp. 15-34.
Opdyke, N.D. and Runcorn, S.K., 1960. Wind direction in the western United States in the late Paleozoic. Geol. SOc. Am. BUR., 71: 959-972.
Paleogeographic Atlas Project, 1984. Data and Software. Univ. of Chicago, Chicago, Ill.
282
Parrish, J.M., Parrish, J.T. and Ziegler, A.M., 1986. Permian-Triassic paleogeograpliy and paleoclimatology and implications for therapsid distributions. In: N.H. Hotton, III, P.D. McLean, J.J. Roth and E.C. Roth (Editors), The Ecology and Biology of Mammal-Like Reptiles. Smithso- nian Press, Washington, D.C., pp. 109-132.
Parrish, J.T., 1982. Upwelling and petroleum source beds, with reference to the Paleozoic. Bull Am. Assoc. Pet. Geol., 66: 750-774.
Parrish, J.T., 1985. Latitudinal distribution of land and shelf and absorbed solar radiation during the Phanerozoic. U.S. Geol. Surv., Open-File Rep. 85-31, 21 pp.
Parrish, J.T., in press. Paleogeographic and paleoclimatic set- ting of the Miocene phosphogenic episode. In: W.C. Burnett and S.R. Riggs (Editors), Phosphate Deposits of the World. Vol. 3, Genesis of Neogene to Recent Phosphorites. Cam- bridge Univ. Press, Cambridge.
Parrish, J.T. and Barron, E.J., 1986. Paleoclimates and Eco- nomic Geology. Soc. Econ. Paleontol. Mineral., Short Course, 18; 162 pp.
Parrish, J.T. and Curtis, R.L., 1982. Atmospheric circulation, upwelling, and organic-rich rocks in the Mesozoic and Cenozoic Eras. Palaeogeogr., Palaeoclimatol., Palaeoecol., 40: 31-66.
Parrish, J.T. and Doyle, J.A., 1984. Predicted evolution of global climate in Late Jurassic-Cretaceous time. Int. Organization of Paleobotany Conf., Abstracts.
Parrish, J.T., Ziegler, A.M. and Scotese, C.R., 1982. Rainfall patterns and the distribution of coals and evaporites in the Mesozoic and Cenozoic. Palaeogeogr., Palaeoclimatol., Palaeoecol., 40: 67-101.
Parrish, J.T., Ziegler, A.M. and Humphreville, R.G., 1983. Upwelling in the Paleozoic Era. In: J. Thiede and E. Suess (Editors), Coastal UpweUing: Its Sediment Record. Part B. Plenum, New York, N.Y., pp. 553-578.
Peterson, F., 1988. Pennsyivanian to Jurassic eolian transporta- tion systems in the western United States. In: G. Kocurek (Editor), Late Paleozoic and Mesozoic Eolian Deposits of the Western Interior of the United States. Sediment. Geol., 56:207-260 (this volume).
Petterssen, S., 1969. Introduction to Meteorology. McGraw- Hill, New York, N.Y., 327 pp.
Poole, F.G., 1964. Paleowinds in the western United States. In: A.E.M. Nairn (Editor), Problems in Palaeoclimatology. Wi- ley, London, pp. 394-405.
Porter, M.L., 1985. Sedimentology and petrology of an Early Jurassic erg margin--Aztec Sandstone, southern Nevada and southern California. Unpubl. Ph.D. diss., Univ. of Wisconsin, Madison, Wisc., 217 pp.
Riehl, H., 1978. Introduction to the Atmosphere. McGraw-Hill, New York, N.Y., 410 pp.
Robinson, P.L., 1973. Palaeoclimatology and continental drift. In: D.H. Tarling and S.K. Runcorn (Editors), Implications of Continental Drift to the Earth Sciences, v. I. Academic Press, London, pp. 449-476.
Rossignol-Strick, M., 1985. Mediteranean Quaternary sapro- pels, an immediate response of the African monsoon to variation of insolation. Palaeogeogr., Palaeoclimatol., Palaeoecol., 49: 237-263.
Rowley, D.B., Raymond, A., Parrish, J.T., Lottes, A.L., Scotese, C.R. and Ziegler, A.M., 1985. Carboniferous paleogeo- graphic, phytogeographic, and paleoclimatic reconstruc- tions. Int. J. Coal. Geol., 5: 7-42.
Rumney, G.R., 1968. Climatology and the World's Climates. Macmillan, New York, N.Y., 656 pp.
Scotese, C.R., Bambach, R.K., Barton, C., Van der Voo, R. and Ziegier, A.M., 1979. Paleozoic base maps. J. Geol., 87: 217-277.
Stewart, J.H., Poole, F.G. and Wilson, R.F., 1972. Stratigraphy and origin of the Chinle Formation and related Upper Triassic strata in the Colorado Plateau region. U.S. Geol. Surv., Prof. Pap., 690:336 pp.
Tanner, W.F., 1965. Upper Jurassic paleogeography of the Four Corners region. J. Sediment. Petrol., 35: 564-574.
Vail, P.R., Hardenbol, J. and Todd, R.G., 1984. Jurassic un- conformities, chronostratigraphy, and sea-level changes from seismic stratigraphy and biostratigraphy. In J.S. Schlee (Editor), Interregional Unconformities and Hydrocarbon Accumulation. Mem. Am. Assoc. Pet. Geol., 36: 129-144.
Van Eysinga, F.W.B., 1975. Geological Time Table. Elsevier, Amsterdam, 3rd ed.
Van Houten, F.B., 1982. Redbeds. (McGraw-Hill Encyclopedia of Science and Technology, 5/e) McGraw-Hill, New York, N.Y., pp. 441-442.
Vincelette, R.R. and Chittum, W.E., 1981. Exploration for oil accumulations in Entrada Sandstone, San Juan basin, New Mexico. Bull. Am. Assoc. Pet. Geol., 65: 2546-2570.
Wardlaw, B.R., 1980. Middle-Late Permian paleogeography of Idaho, Nevada, Montana, Utah, and Wyoming. Bull. Am. Assoc. Pet. Geol., 64: p. 799.
Ziegler, A.M., Scotese, C.R., McKerrow, W.S., Johnson, M.E. and Bambach, R.K., 1979. Paleozoic paleogeography. Annu. Rev. Earth Planet. Sc., 7: 473-502.
Ziegler, A.M., Scotese, C.R. and Barrett, S.F., 1983. Mesozoic and Cenozoic paleogeographic maps. In P. Brosche and J. Siindermann (Editors), Tidal Friction and the Earth's Rota- tion, II. Springer, Berlin, pp. 240-252.