Embed Size (px)
Citation preview
1
WinBUGS DemoSaghir A. Bashir
Amgen Ltd, Cambridge, U.K.Email: [email protected]
4th January 2001
Outline
• Introduction• BUGS and WinBUGS• Graphical Models• DoodleBUGS• Example - Simulation• Power calculation• Summary
2
Introduction
• Bayesian Inference Using Gibbs Sampling• BUGS
• Analysis of Complex Models
• Bayesian Methods
• Markov Chain Monte Carlo Integration• Useful when no closed form exists
Classic BUGS
• Declarative Language • Similar to Splus
• Complex Statistical Models• Missing data• Measurement Error• No closed form for Likelihood
• Graphical Modelling• Flexible compared to approximations

3
WinBUGS
• Similar to Classic BUGS• Plus new methodological developments
• Graphical representation of model• DoodleBUGS
• Menu Control of session
• Cut and paste to other packages
BUGS and WinBUGS
• No data management facility• Why reinvent the wheel?
• “Easy” interface with other packages• R and Splus• Stata (S. Bashir)
• Simple analysis of output
4
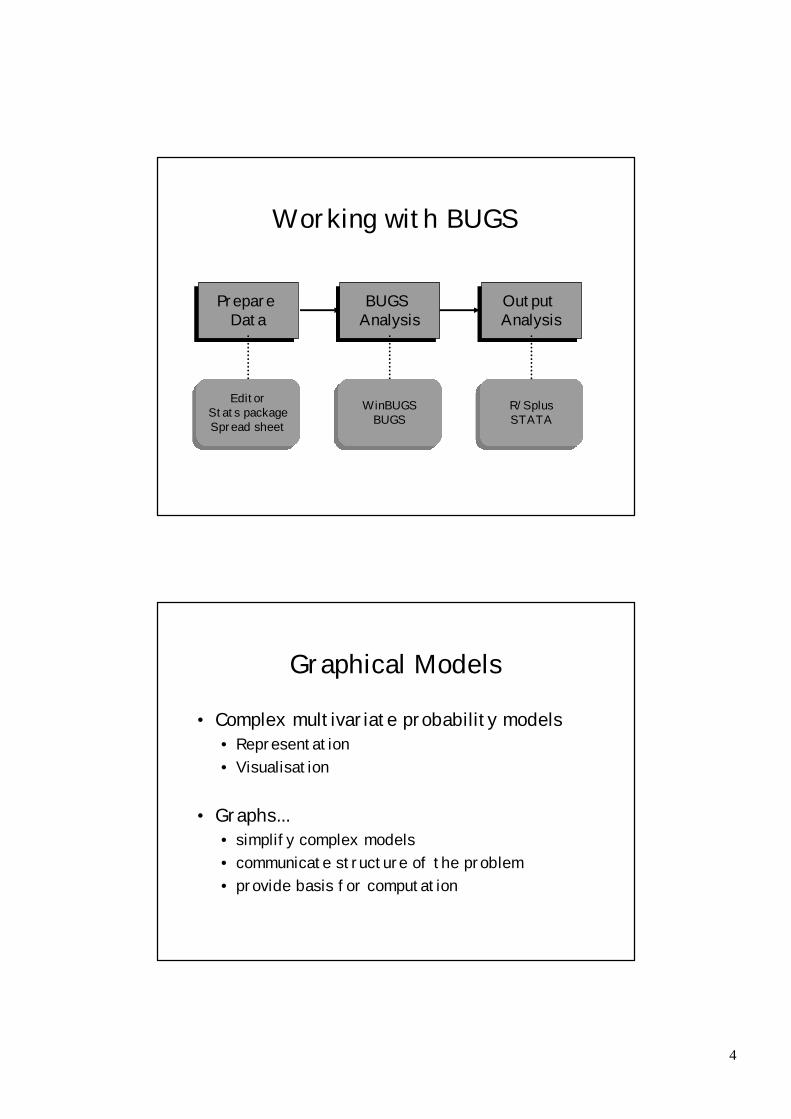
Working with BUGS
Output Analysis
R/SplusSTATA
Prepare Data
EditorStats packageSpread sheet
BUGS Analysis
WinBUGSBUGS
Graphical Models
• Complex multivariate probability models• Representation• Visualisation
• Graphs...• simplify complex models• communicate structure of the problem• provide basis for computation

5
WinBUGS
• BUGS language
• DoodleBUGS• Used for the purposed of this Demo.
• WinBUGS is currently free from:• http://www.mrc-bsu.cam.ac.uk/bugs/• Register to get full version access
DoodleBUGS
• Start WinBUGS• Select “Doodle” from menu bar
6
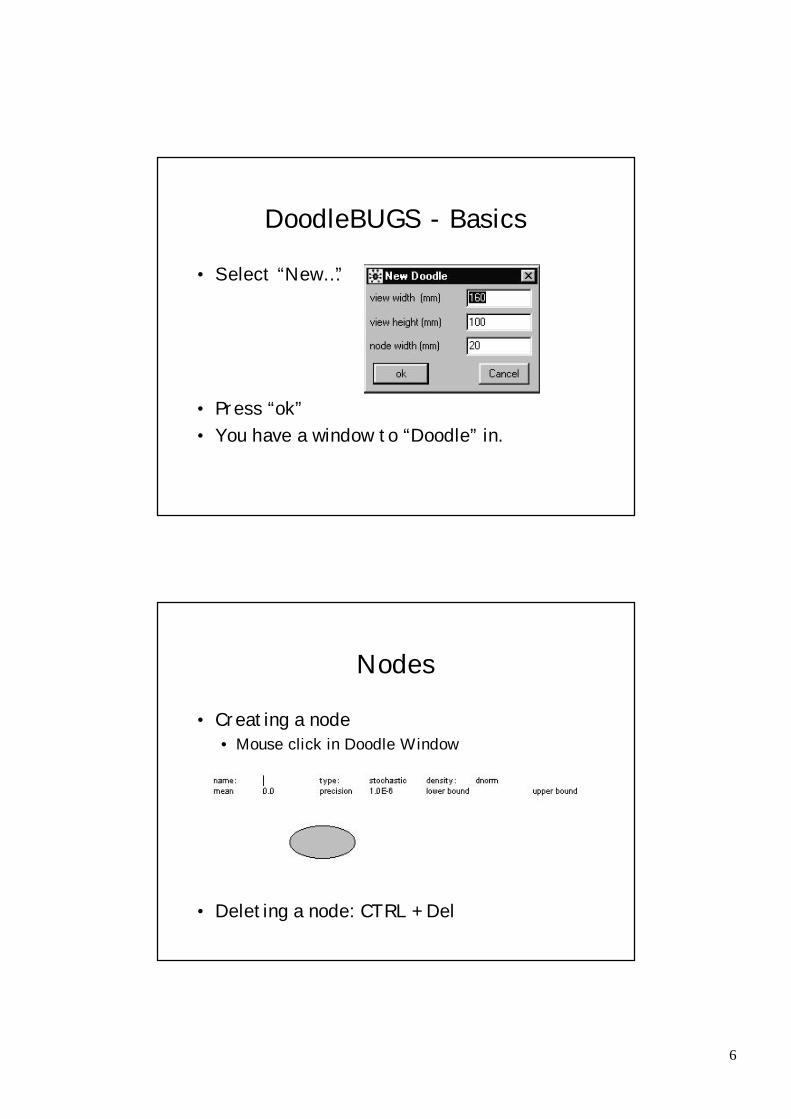
DoodleBUGS - Basics
• Select “New…”
• Press “ok”• You have a window to “Doodle” in.
Nodes
• Creating a node • Mouse click in Doodle Window
• Deleting a node: CTRL + Del
7
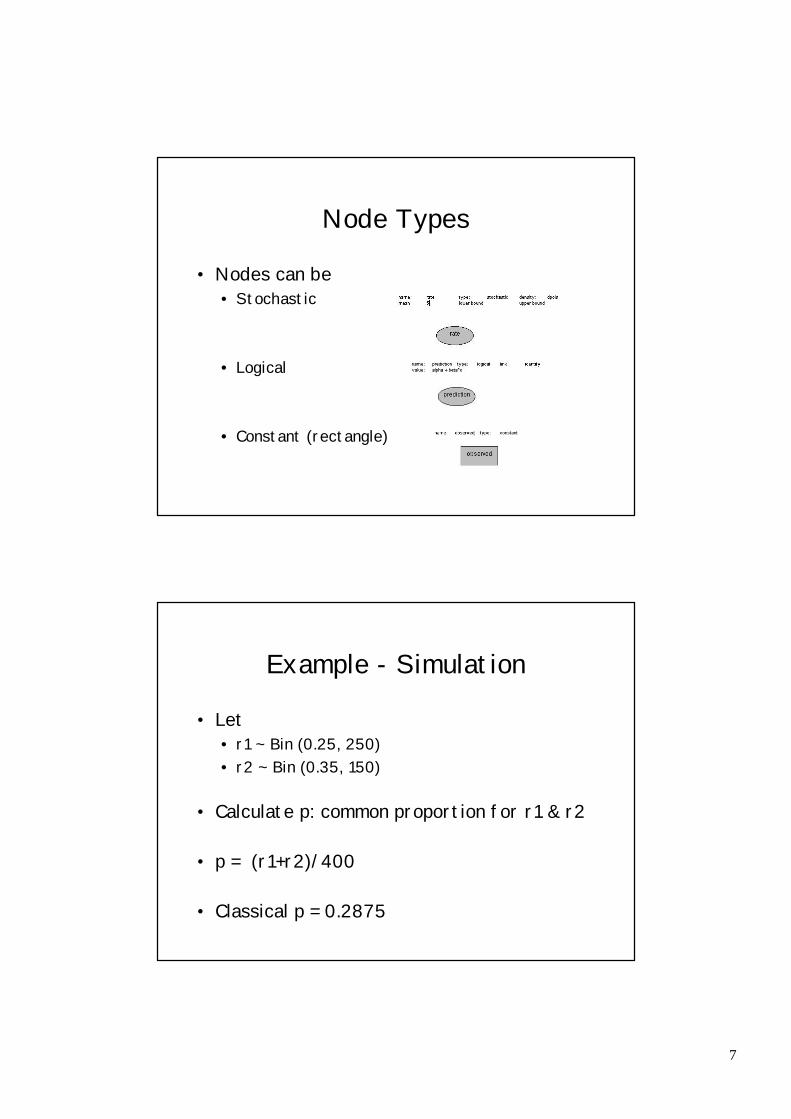
• Nodes can be• Stochastic
• Logical
• Constant (rectangle)
Node Types
Example - Simulation
• Let• r1 ~ Bin (0.25, 250)• r2 ~ Bin (0.35, 150)
• Calculate p: common proportion for r1 & r2
• p = (r1+r2)/400
• Classical p = 0.2875
8
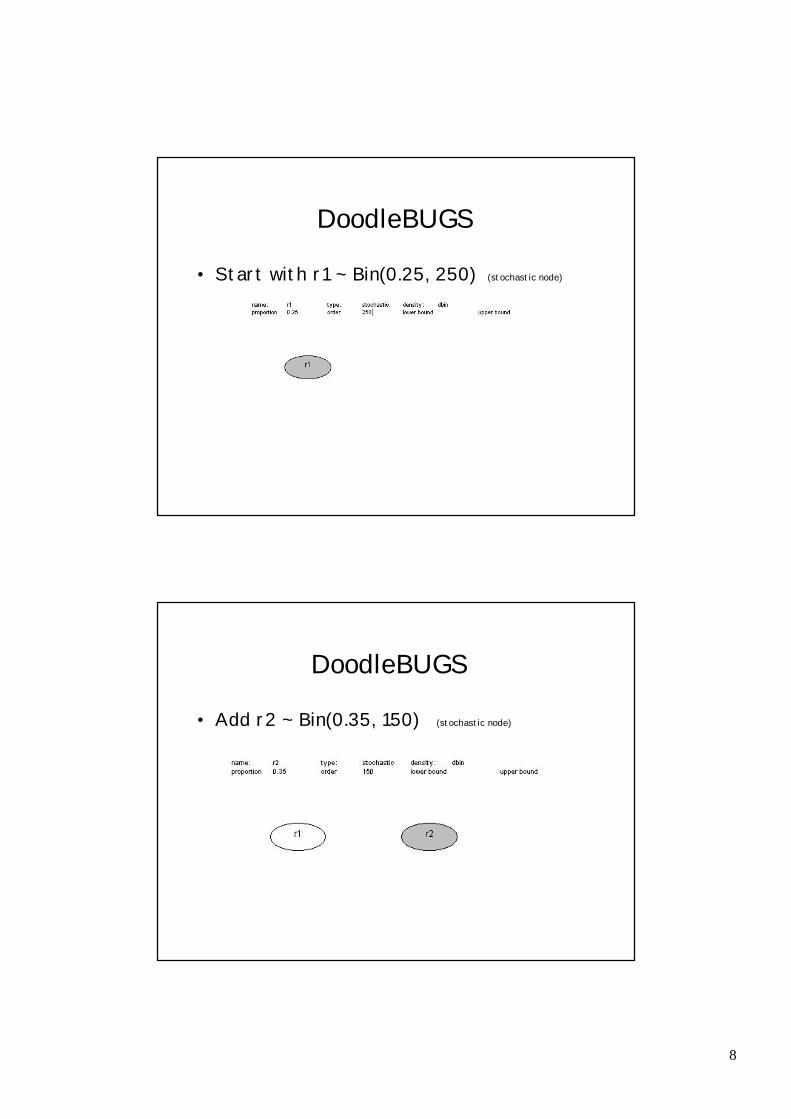
DoodleBUGS
• Start with r1 ~ Bin(0.25, 250) (stochastic node)
DoodleBUGS
• Add r2 ~ Bin(0.35, 150) (stochastic node)
9
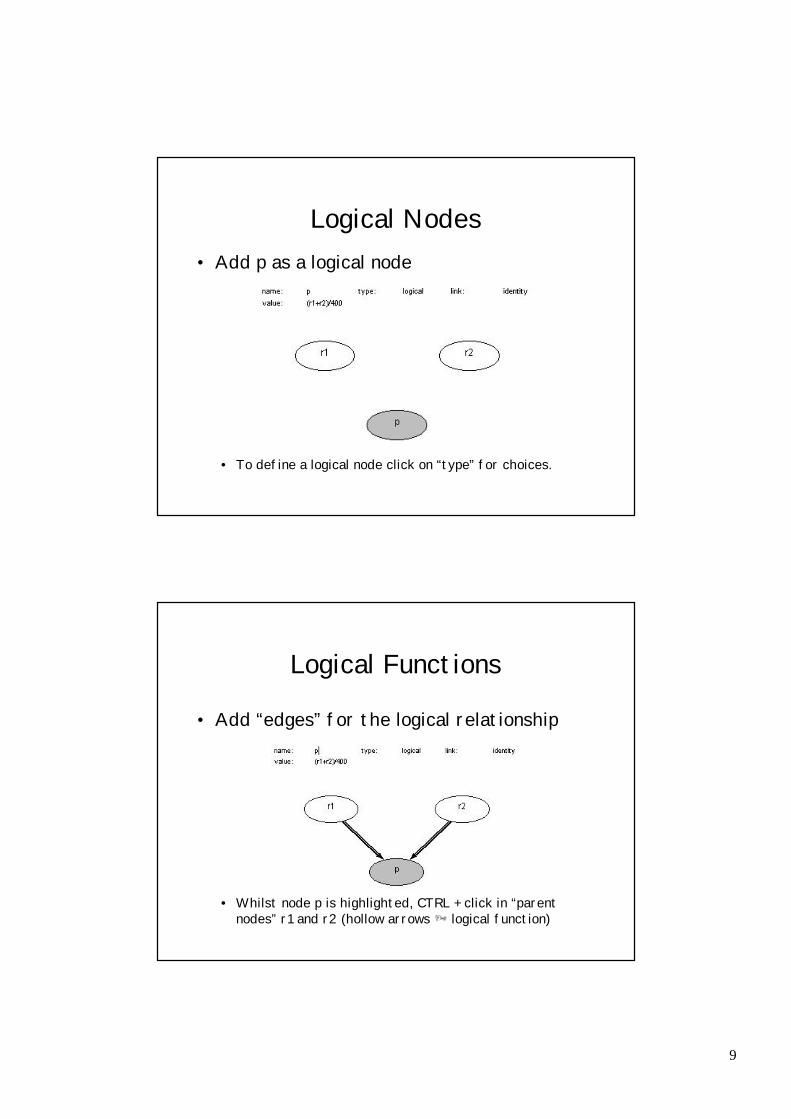
Logical Nodes• Add p as a logical node
• To define a logical node click on “type” for choices.
Logical Functions
• Add “edges” for the logical relationship
• Whilst node p is highlighted, CTRL + click in “parent nodes” r1 and r2 (hollow arrows Þ logical function)
10
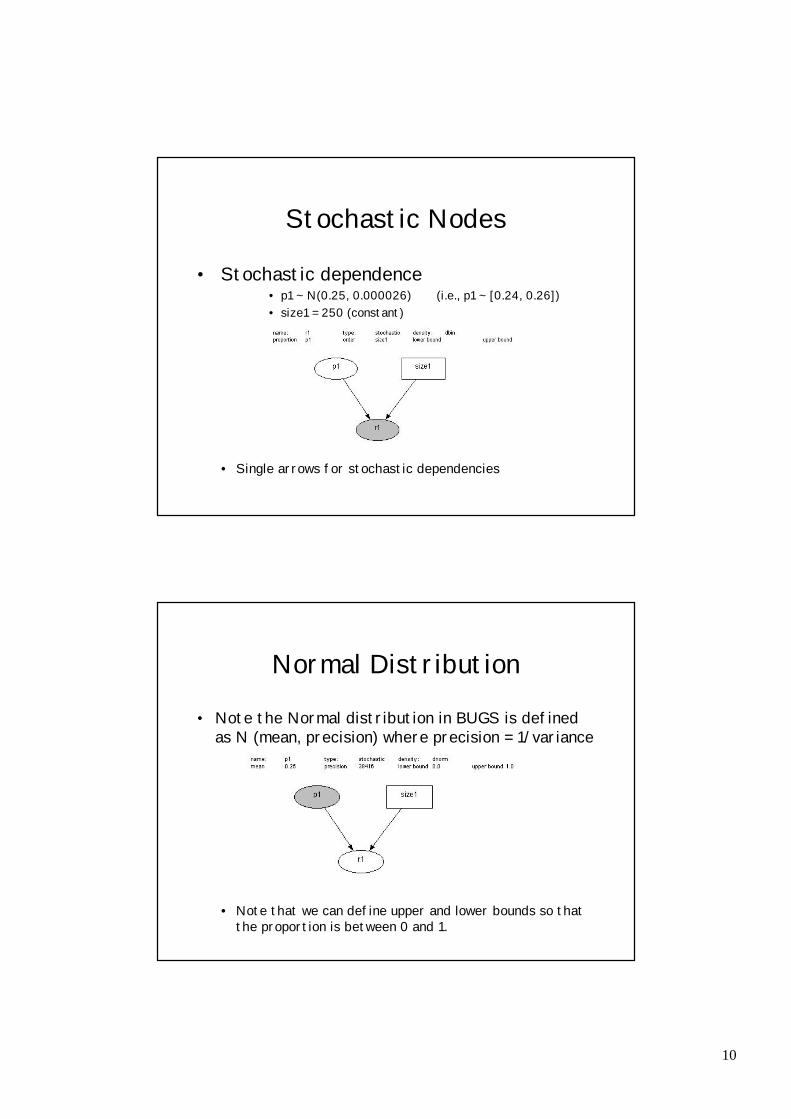
Stochastic Nodes
• Stochastic dependence• p1 ~ N(0.25, 0.000026) (i.e., p1 ~ [0.24, 0.26])• size1 = 250 (constant)
• Single arrows for stochastic dependencies
Normal Distribution
• Note the Normal distribution in BUGS is defined as N (mean, precision) where precision = 1/variance
• Note that we can define upper and lower bounds so that the proportion is between 0 and 1.
11
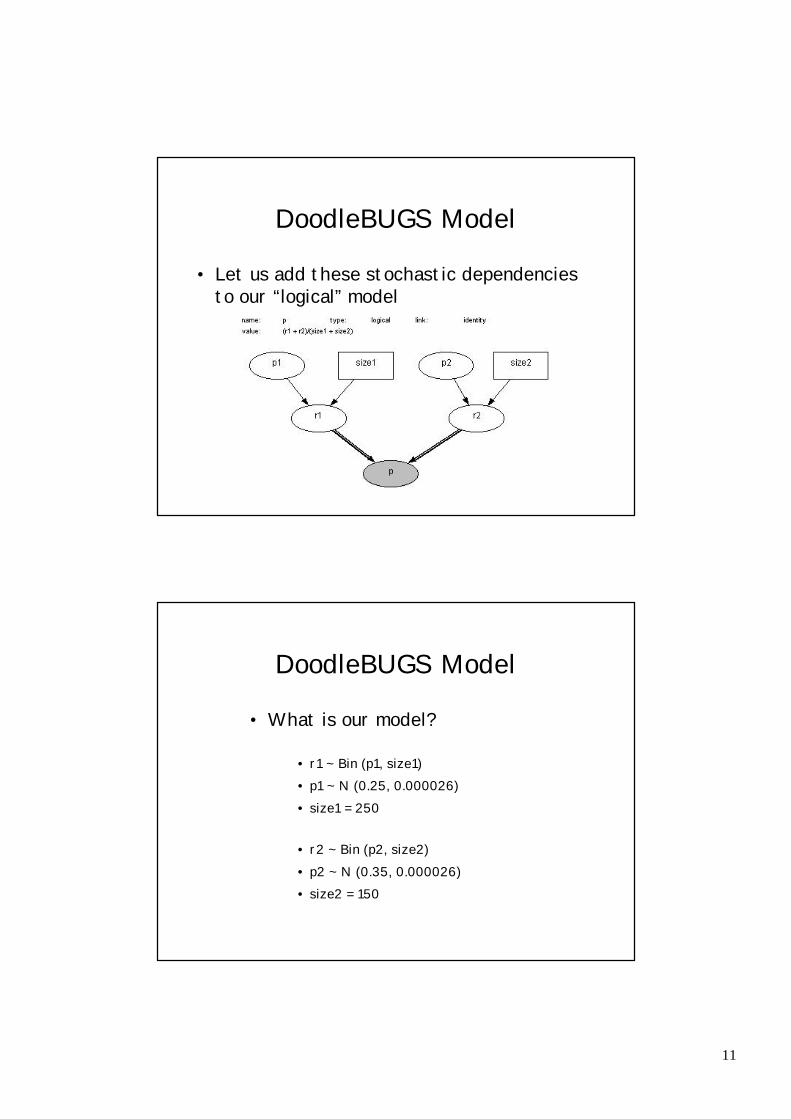
DoodleBUGS Model
• Let us add these stochastic dependencies to our “logical” model
DoodleBUGS Model
• What is our model?
• r1 ~ Bin (p1, size1)• p1 ~ N (0.25, 0.000026)• size1 = 250
• r2 ~ Bin (p2, size2)• p2 ~ N (0.35, 0.000026)• size2 = 150

12
WinBUGS Modelling
• Running our model in WinBUGS• Create a New document
• Menu bar - File - New
• A New document window will appear
WinBUGS Document
• Select your Doodle from your Doodle Window• Menu bar - Edit - Select Document
• Copy your Doodle• Menu bar - Edit - Copy
• Paste it into your New Document• Menu bar - Edit - Paste
13
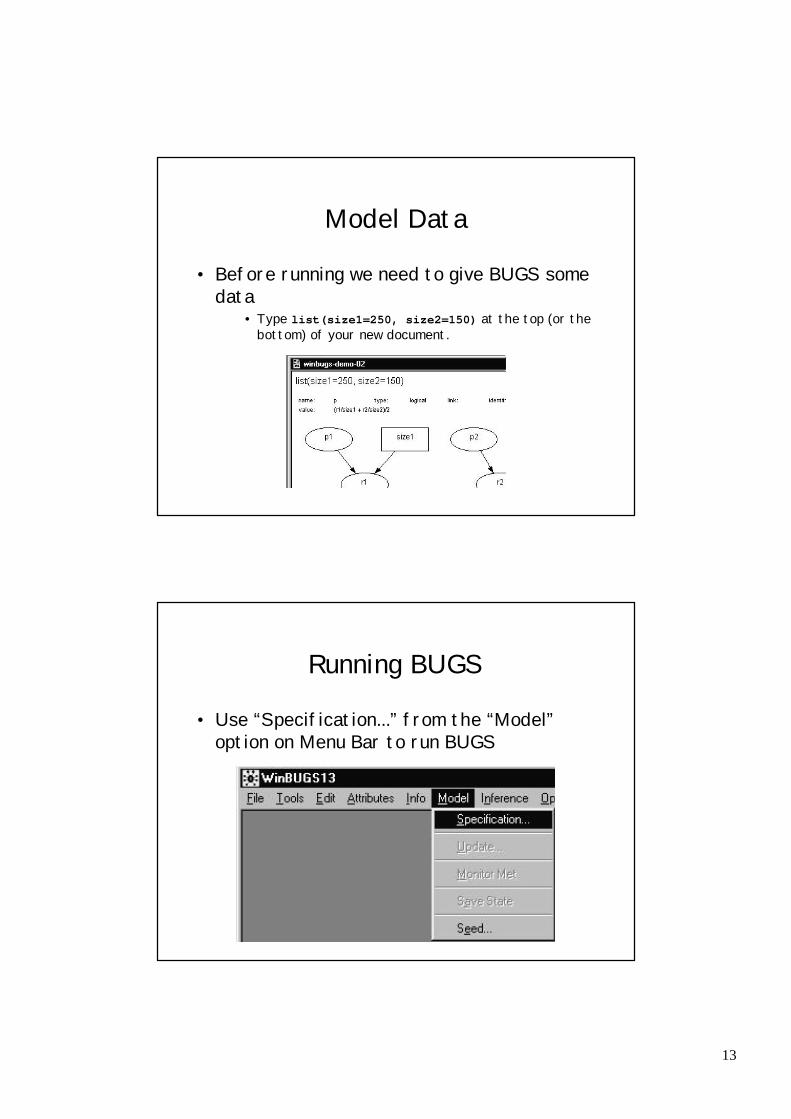
Model Data
• Before running we need to give BUGS some data
• Type list(size1=250, size2=150) at the top (or the bottom) of your new document.
Running BUGS
• Use “Specification...” from the “Model” option on Menu Bar to run BUGS
14
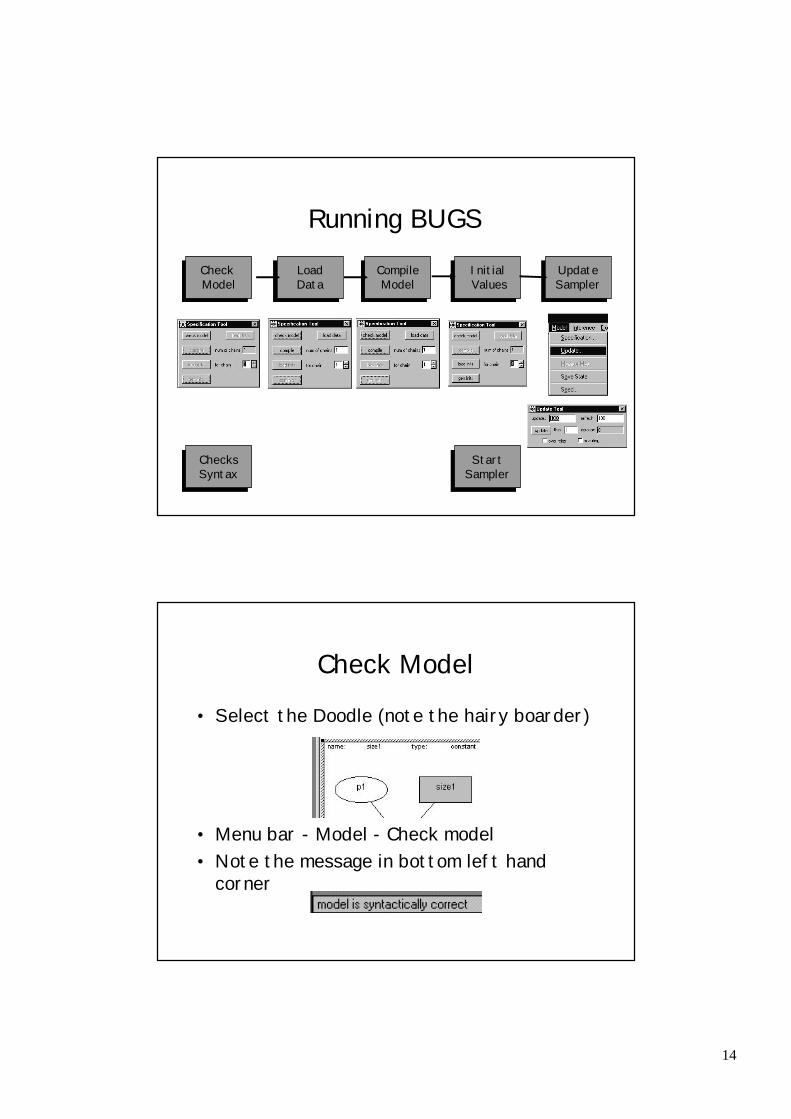
Running BUGS
ChecksSyntax
StartSampler
Check Model
LoadData
CompileModel
InitialValues
UpdateSampler
Check Model
• Select the Doodle (note the hairy boarder)
• Menu bar - Model - Check model• Note the message in bottom left hand
corner
15
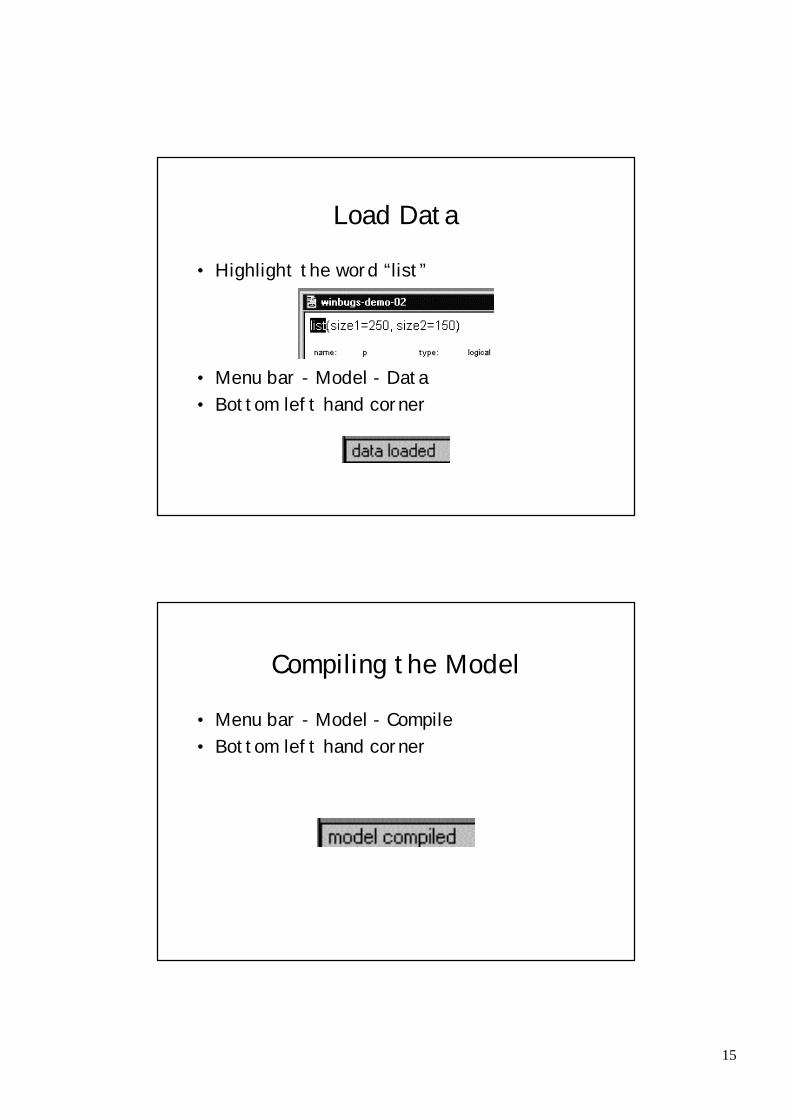
Load Data
• Highlight the word “list”
• Menu bar - Model - Data• Bottom left hand corner
Compiling the Model
• Menu bar - Model - Compile• Bottom left hand corner
16
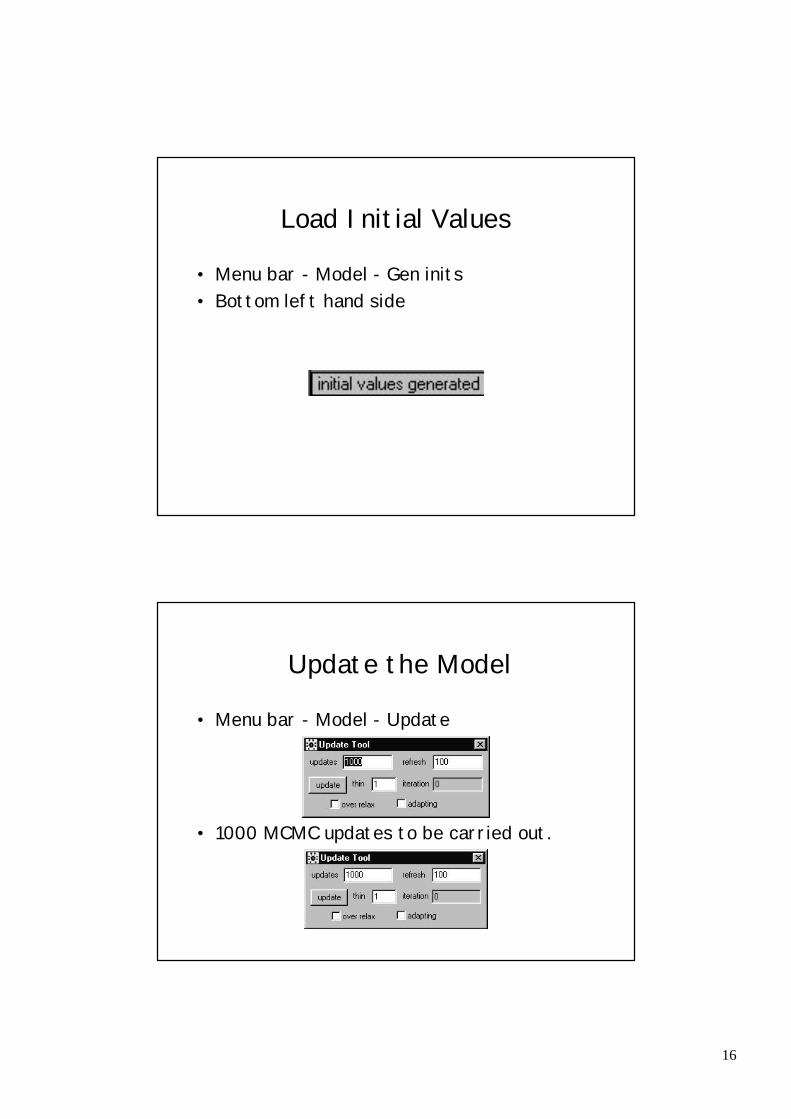
Load Initial Values
• Menu bar - Model - Gen inits• Bottom left hand side
Update the Model
• Menu bar - Model - Update
• 1000 MCMC updates to be carried out.
17
Burn In
• Model has been updated
• MCMC run did not store any data.• Used for the “burn in”
• Store values by “monitoring” them to• Draw inferences • Monitor MCMC run
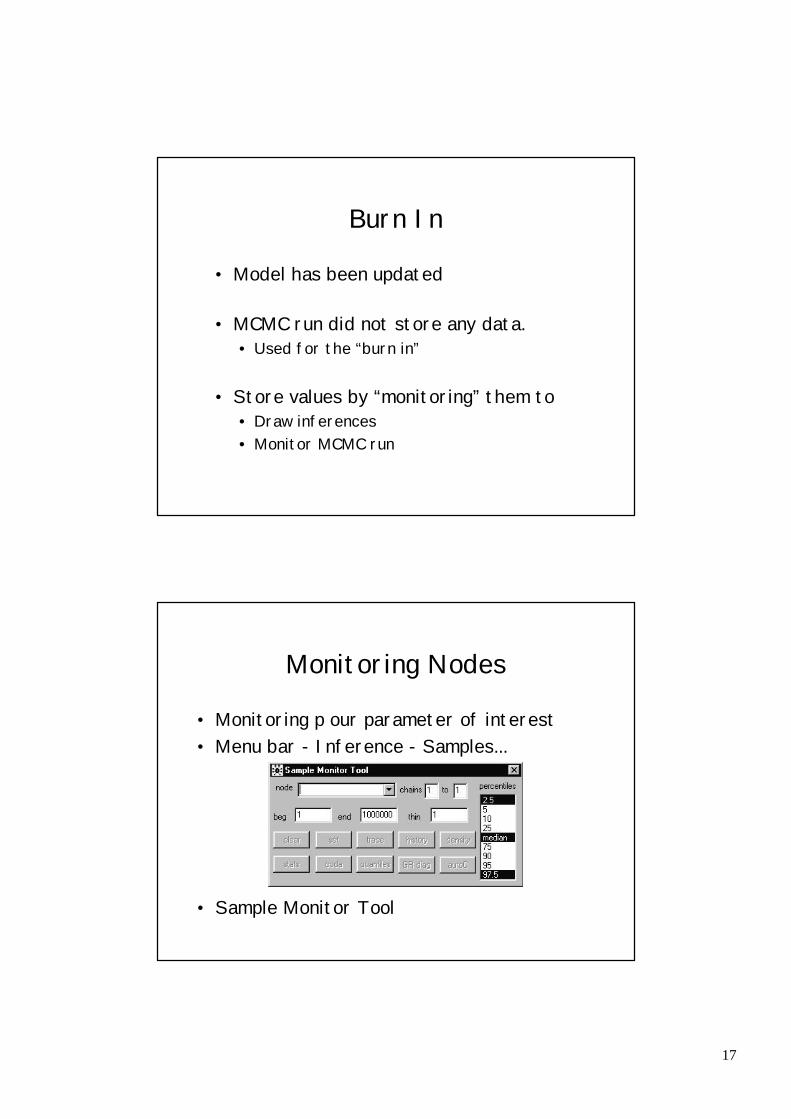
Monitoring Nodes
• Monitoring p our parameter of interest• Menu bar - Inference - Samples...
• Sample Monitor Tool
18
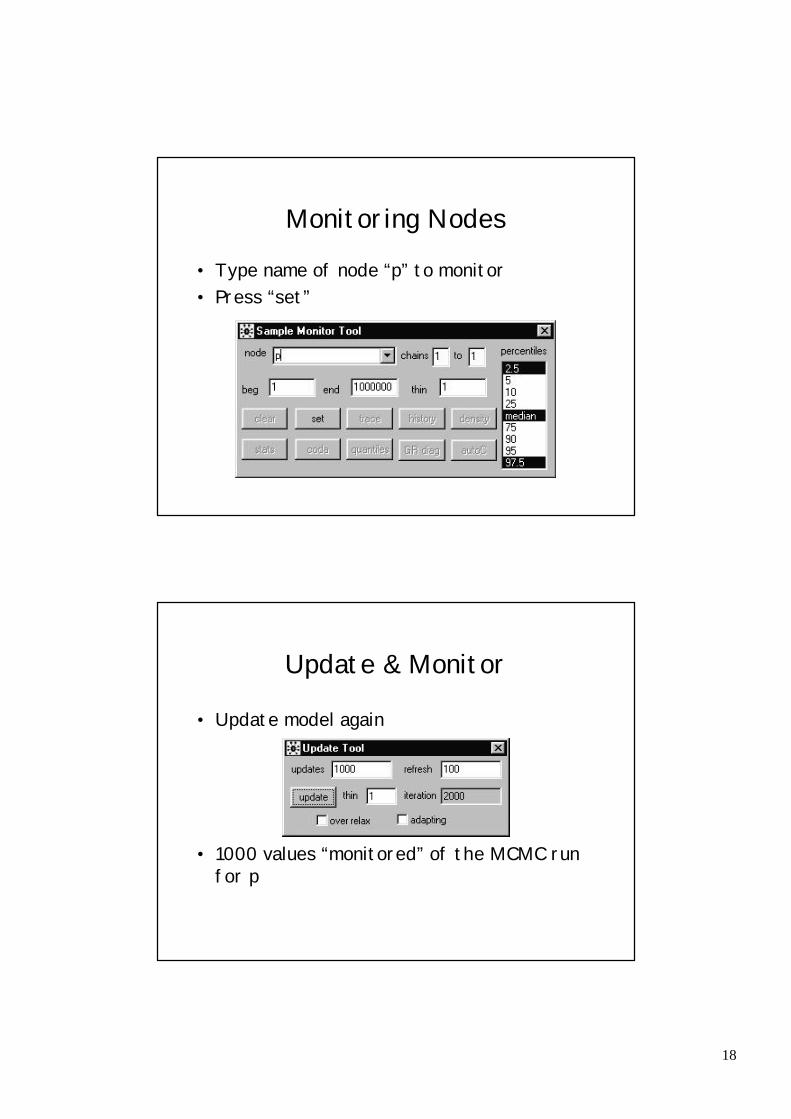
Monitoring Nodes
• Type name of node “p” to monitor• Press “set”
Update & Monitor
• Update model again
• 1000 values “monitored” of the MCMC run for p
19
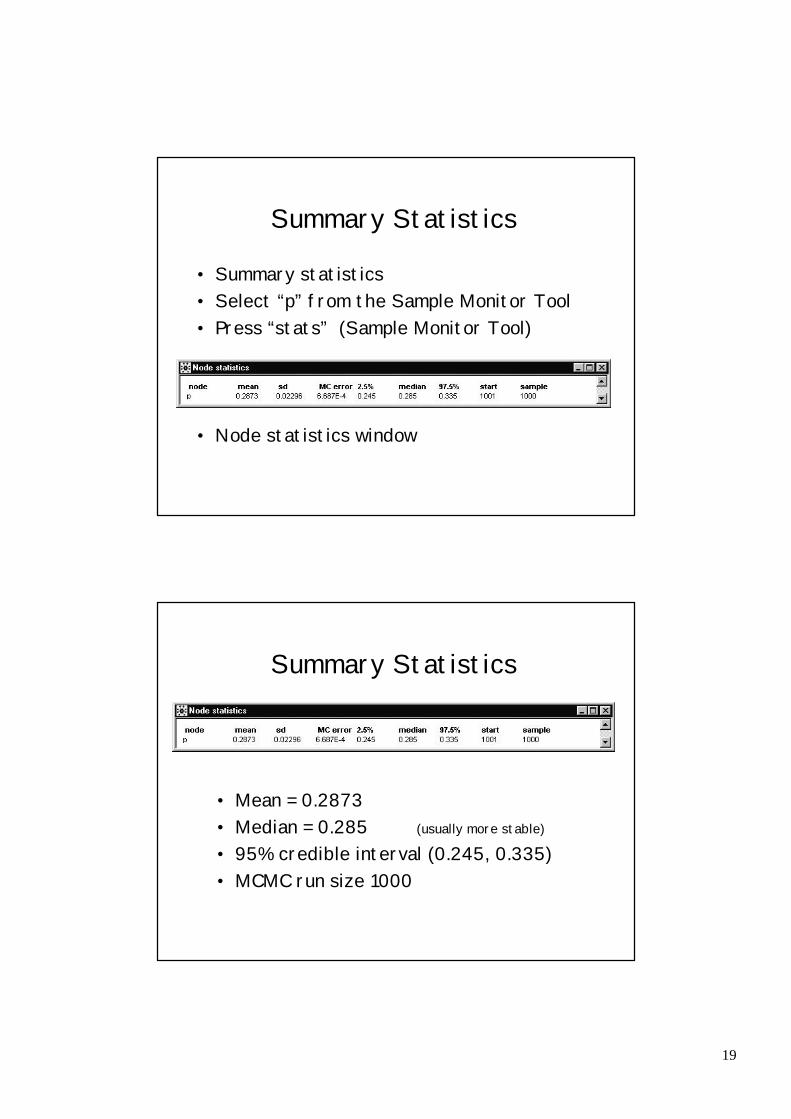
Summary Statistics
• Summary statistics• Select “p” from the Sample Monitor Tool• Press “stats” (Sample Monitor Tool)
• Node statistics window
Summary Statistics
• Mean = 0.2873• Median = 0.285 (usually more stable)
• 95% credible interval (0.245, 0.335)• MCMC run size 1000
20
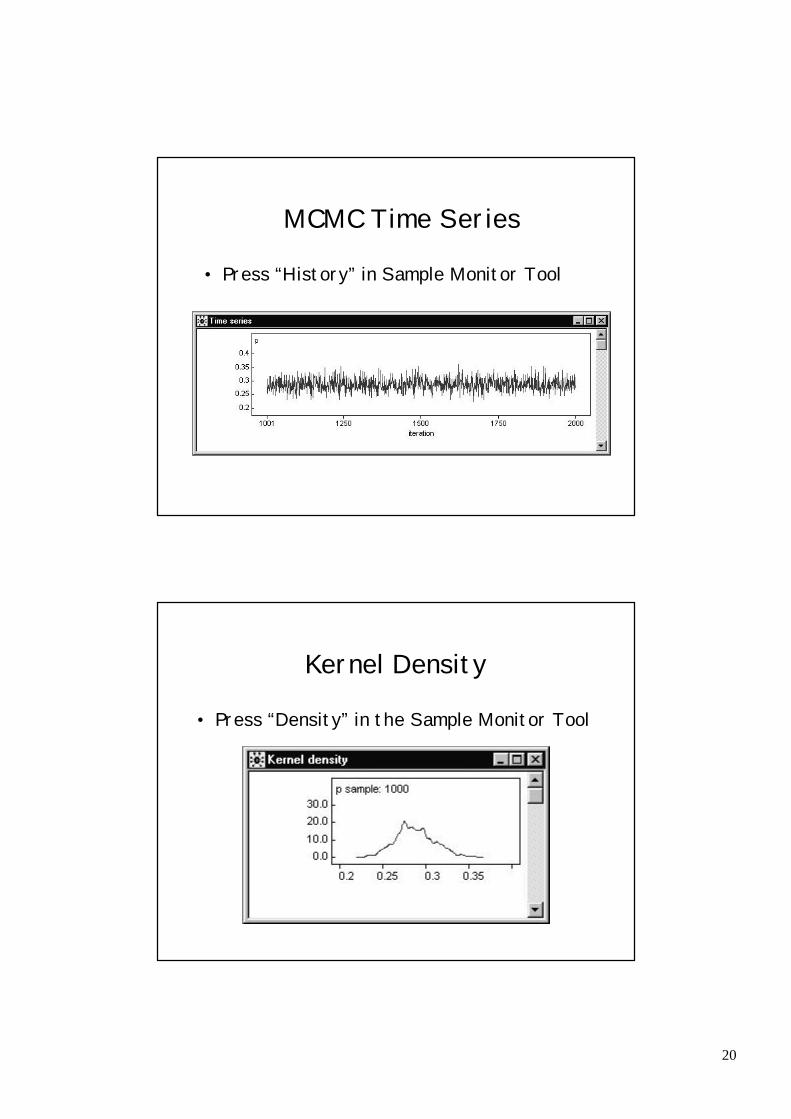
MCMC Time Series
• Press “History” in Sample Monitor Tool
Kernel Density
• Press “Density” in the Sample Monitor Tool
21
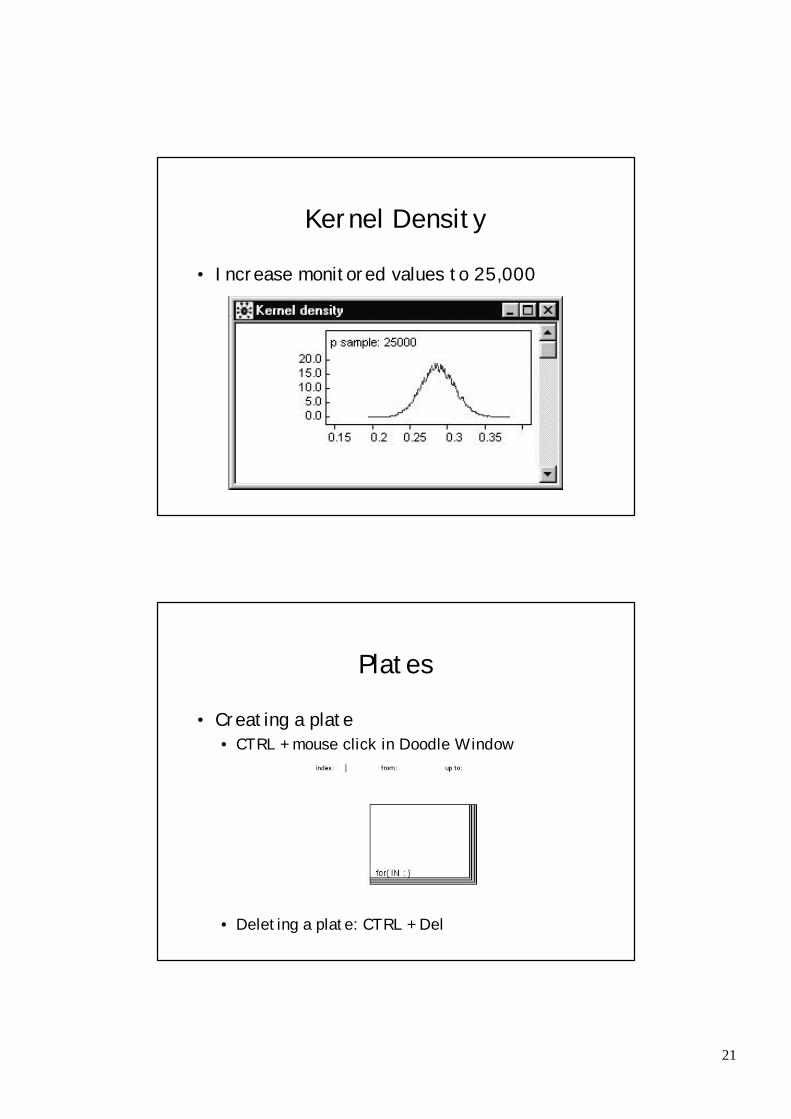
Kernel Density
• Increase monitored values to 25,000
Plates
• Creating a plate • CTRL + mouse click in Doodle Window
• Deleting a plate: CTRL + Del

22
• Allow more complex structure, e.g.,• Repeated measures• Hierarchical models
• Extend our example to calculate power• r1 and r2 from Binomial distribution• Simulte r1 and r2 100 times per “update”• Calculate test statistic• Count number of times it falls in critical region
Plates
• H0: p1 = p2 = p vs H1: p1 < p2
• p1 = r1/size1 & p2 = r2/size2
• Test statistic
Test Statistic
(p2 - p1)s.d.(p)
s.d.(p) = √√(p(1-p)(1/size1 + 1/size2))
23
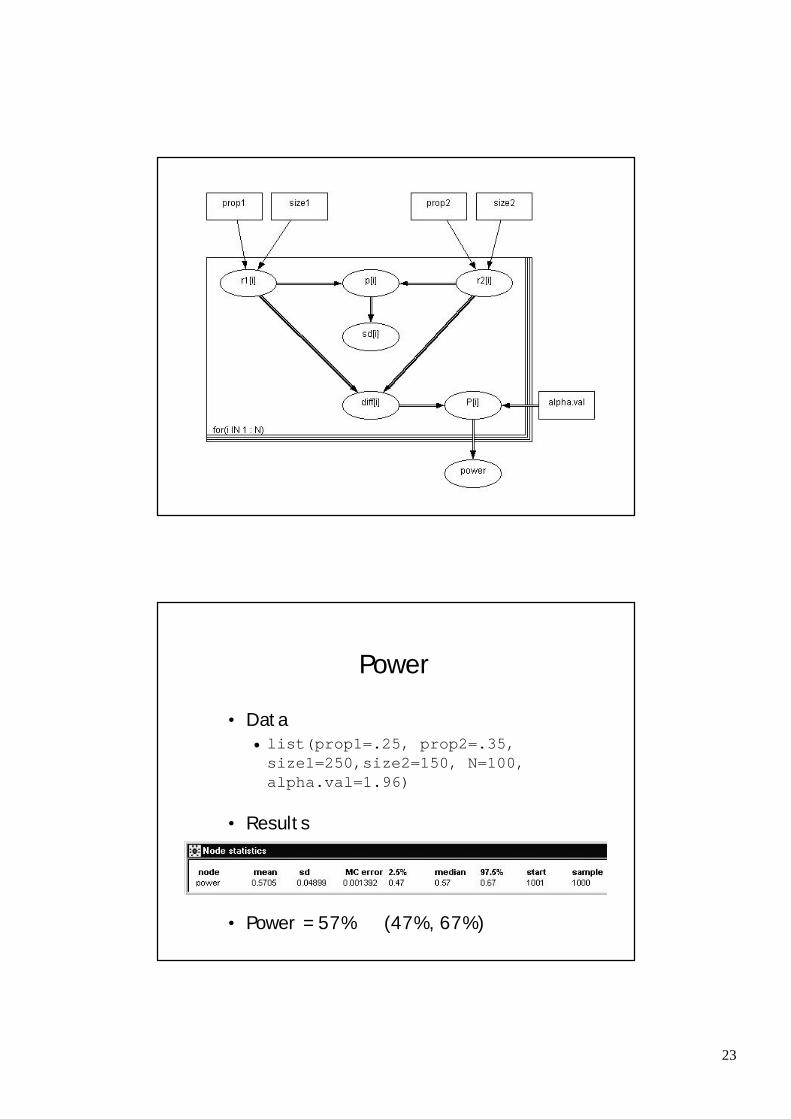
Power
• Data• list(prop1=.25, prop2=.35, size1=250,size2=150, N=100, alpha.val=1.96)
• Results
• Power = 57% (47%, 67%)

24
Power - History
Power - Density

25
Updates
• Updating - Bottom left hand corner
• After updates finish
Summary
• BUGS is a power tool• Bayesian Analysis• Simulation Tool
• Graphical Models • Doodle BUGS• Simple representation of model
• Easy to use!