Embed Size (px)
Citation preview
WinBUGS TrainingTricks & Tips – Interface with R
Catherine Dettori & Jonathan Jaeger
1
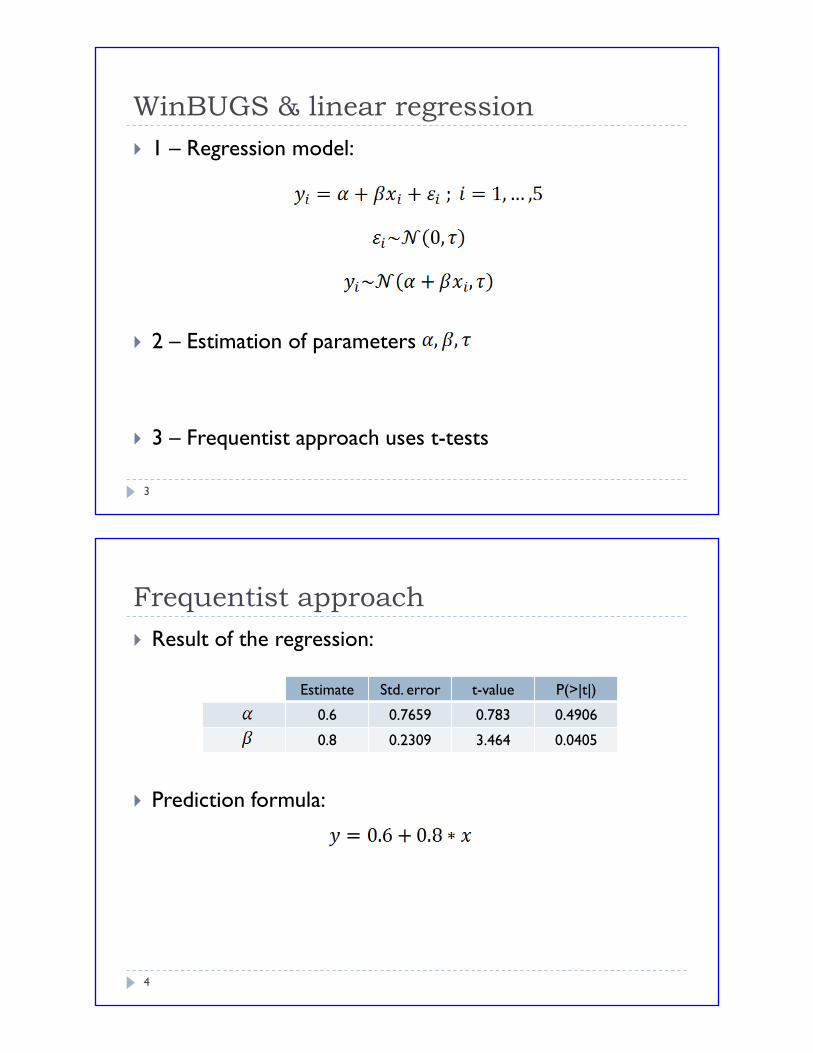
WinBUGS & linear regression
Data:
Plot:
1 2 3 4 5
1 3 3 3 5
2
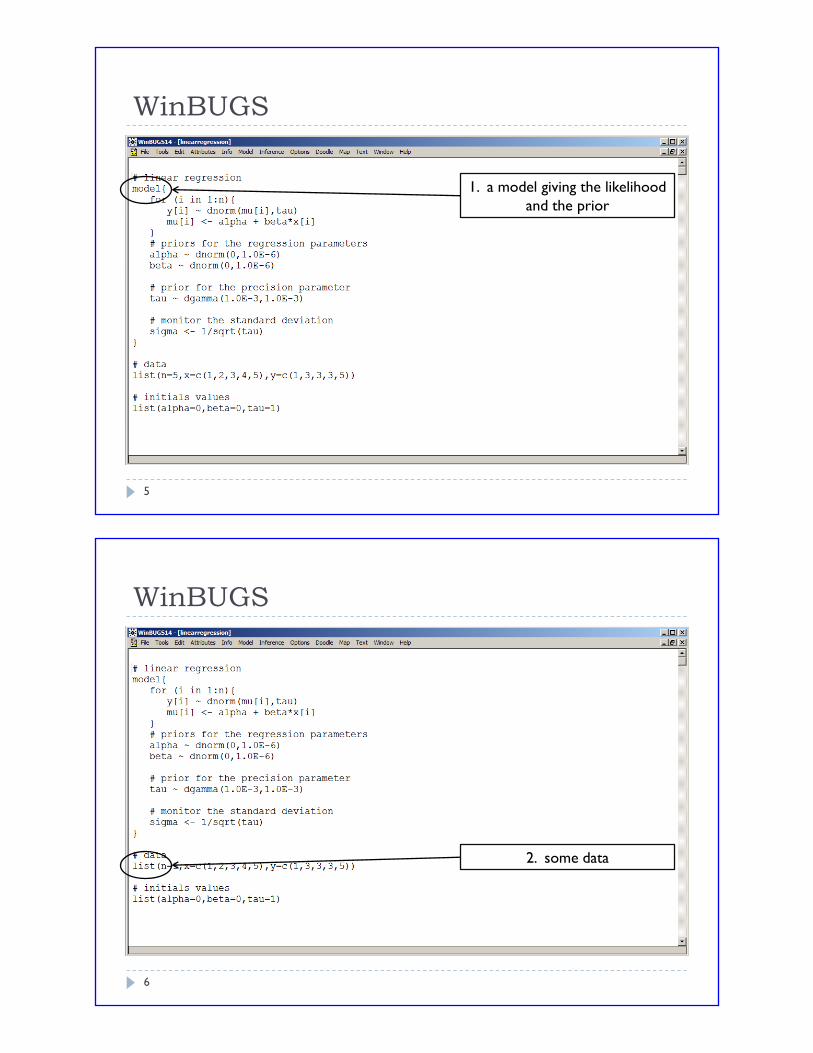
WinBUGS & linear regression
1 – Regression model:
2 – Estimation of parameters
3 – Frequentist approach uses t-tests
3
Frequentist approach
Result of the regression:
Prediction formula:
Estimate Std. error t-value P(>|t|)
0.6 0.7659 0.783 0.4906
0.8 0.2309 3.464 0.0405
4
WinBUGS
1. a model giving the likelihood
and the prior
5
WinBUGS
2. some data
6
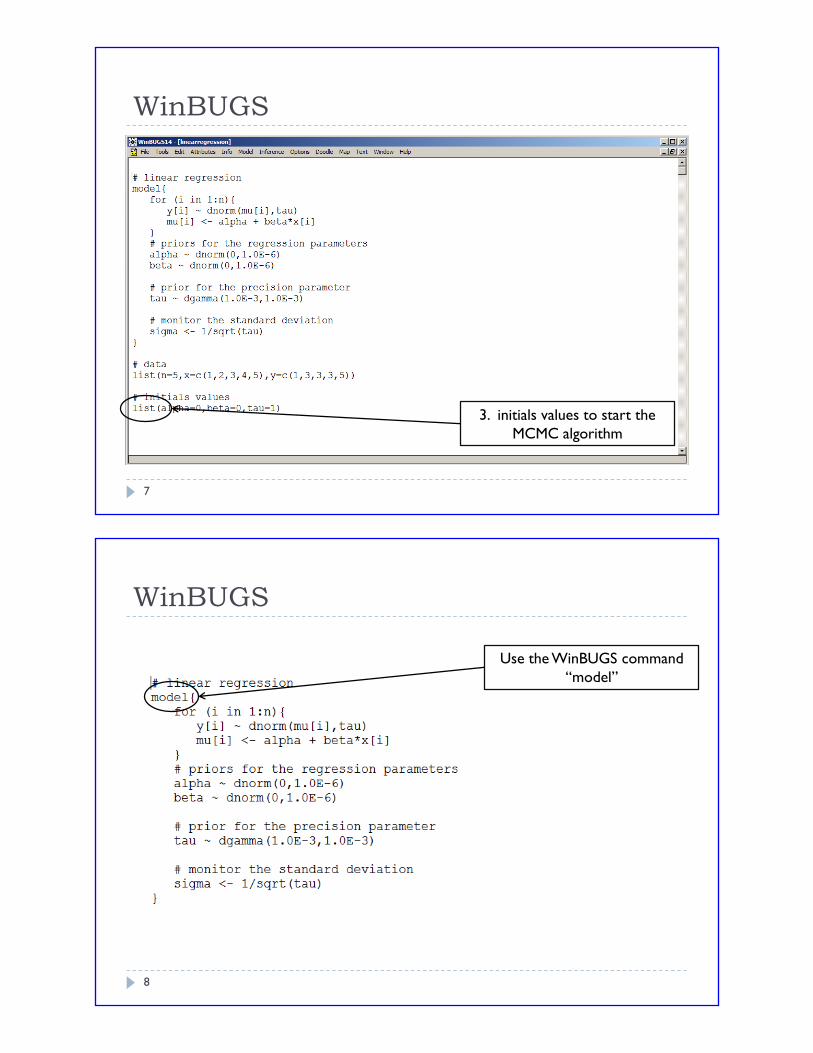
WinBUGS
3. initials values to start the
MCMC algorithm
7
WinBUGS
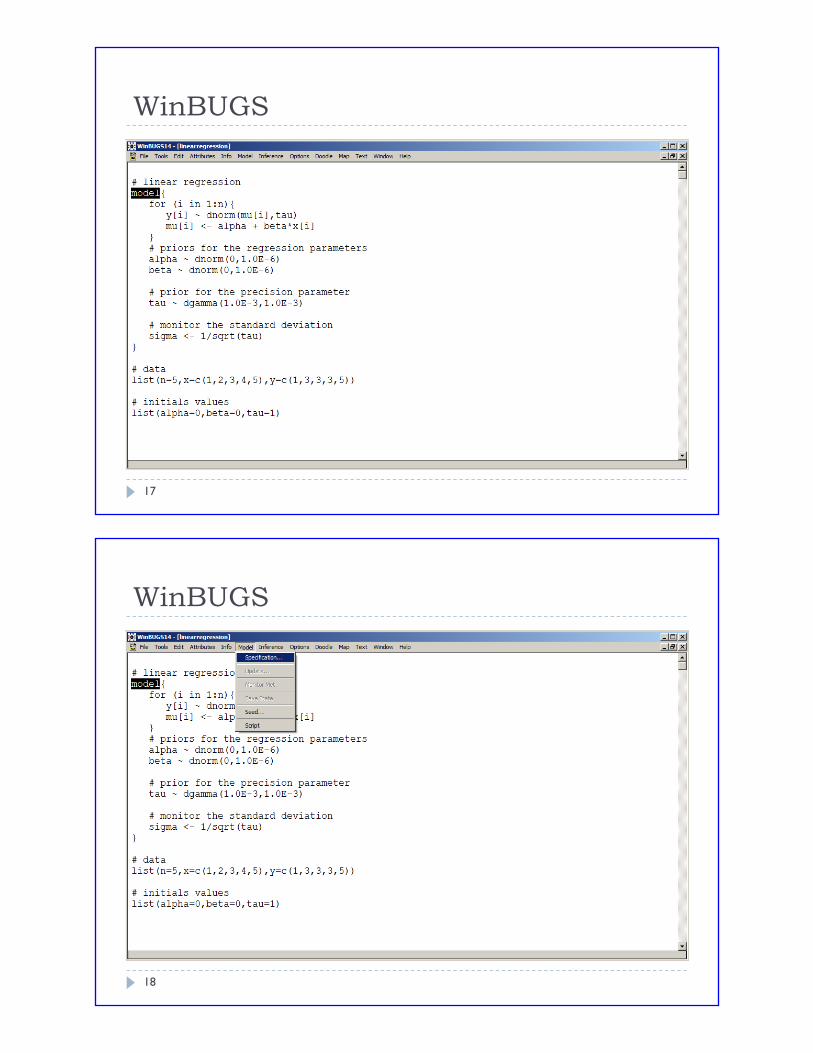
Use the WinBUGS command
“model”
8
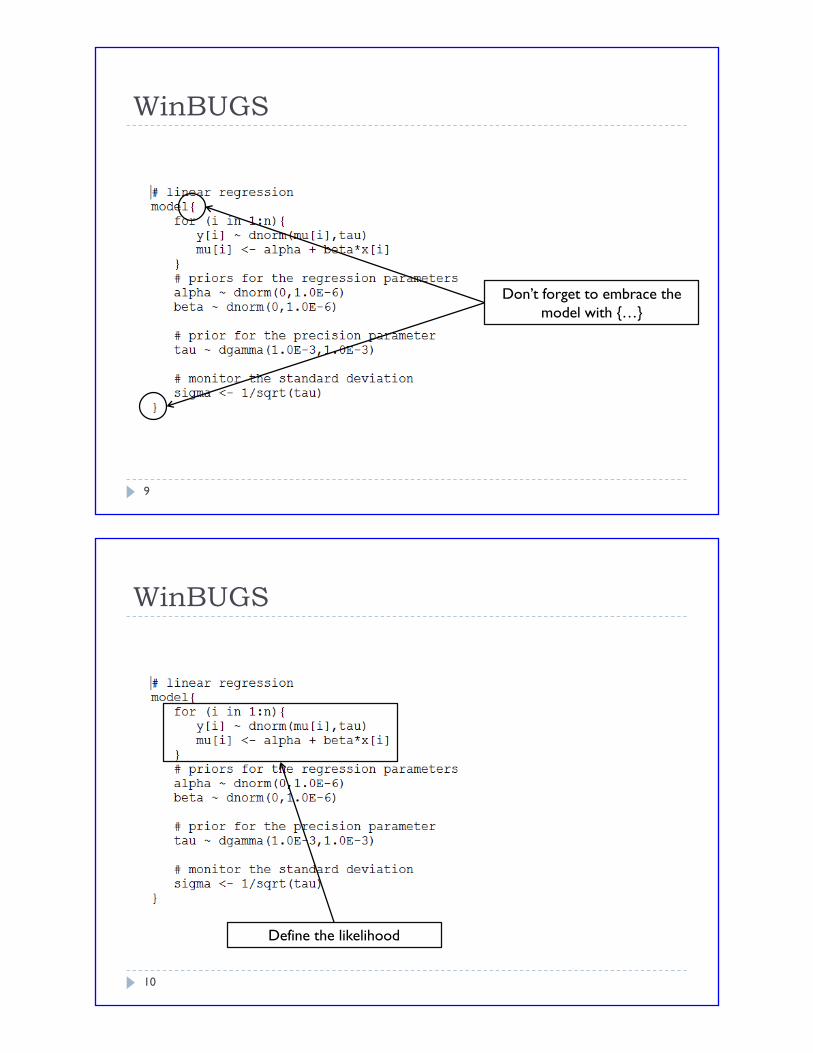
WinBUGS
Don’t forget to embrace the
model with {…}
9
WinBUGS
Define the likelihood
10
WinBUGS
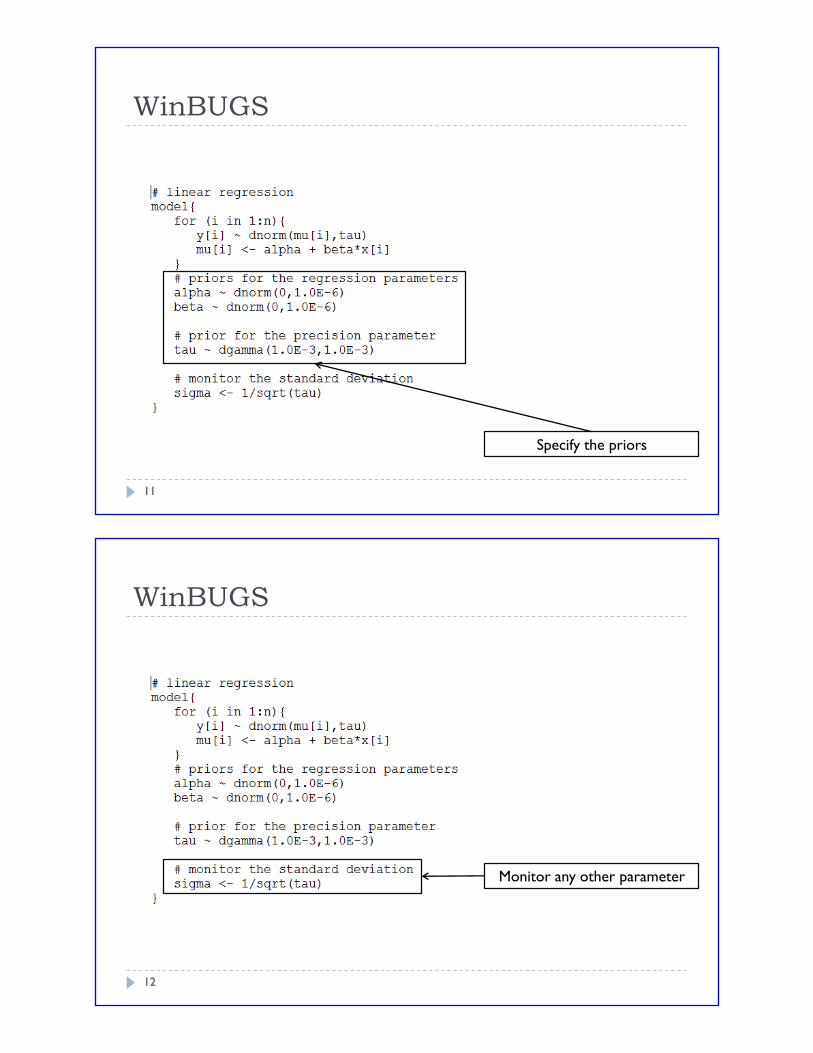
Specify the priors
11
WinBUGS
Monitor any other parameter
12
WinBUGS
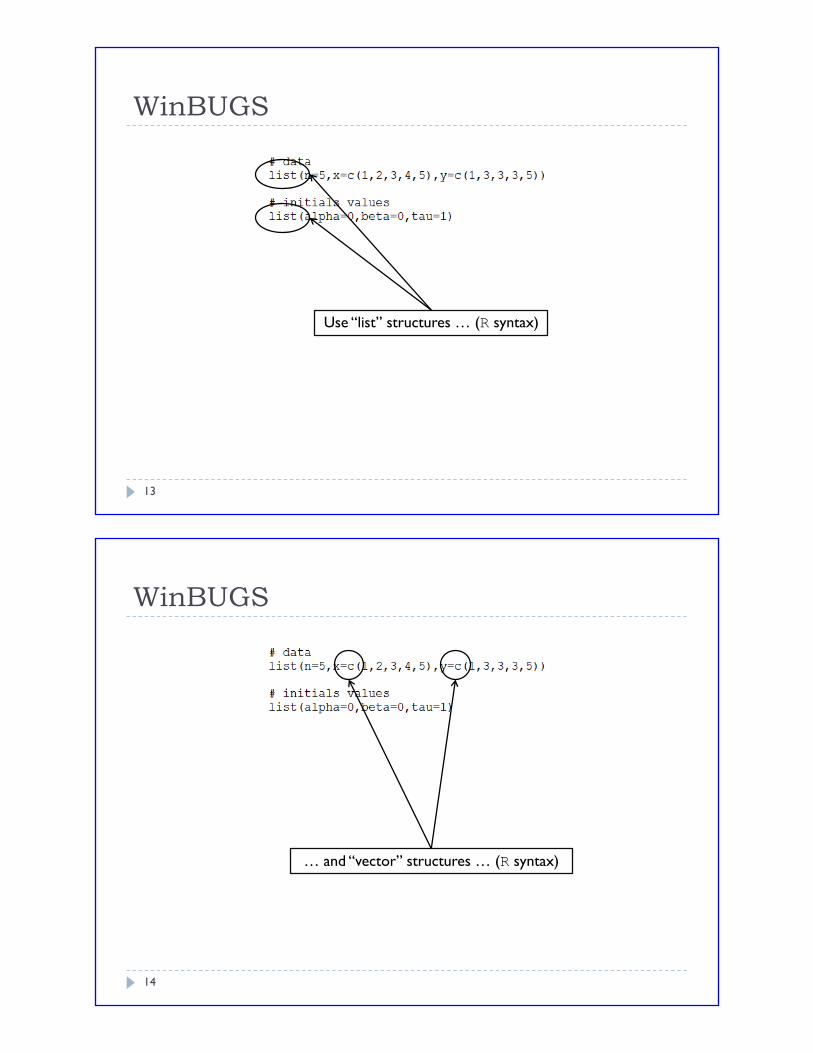
Use “list” structures … (R syntax)
13
WinBUGS
… and “vector” structures … (R syntax)
14
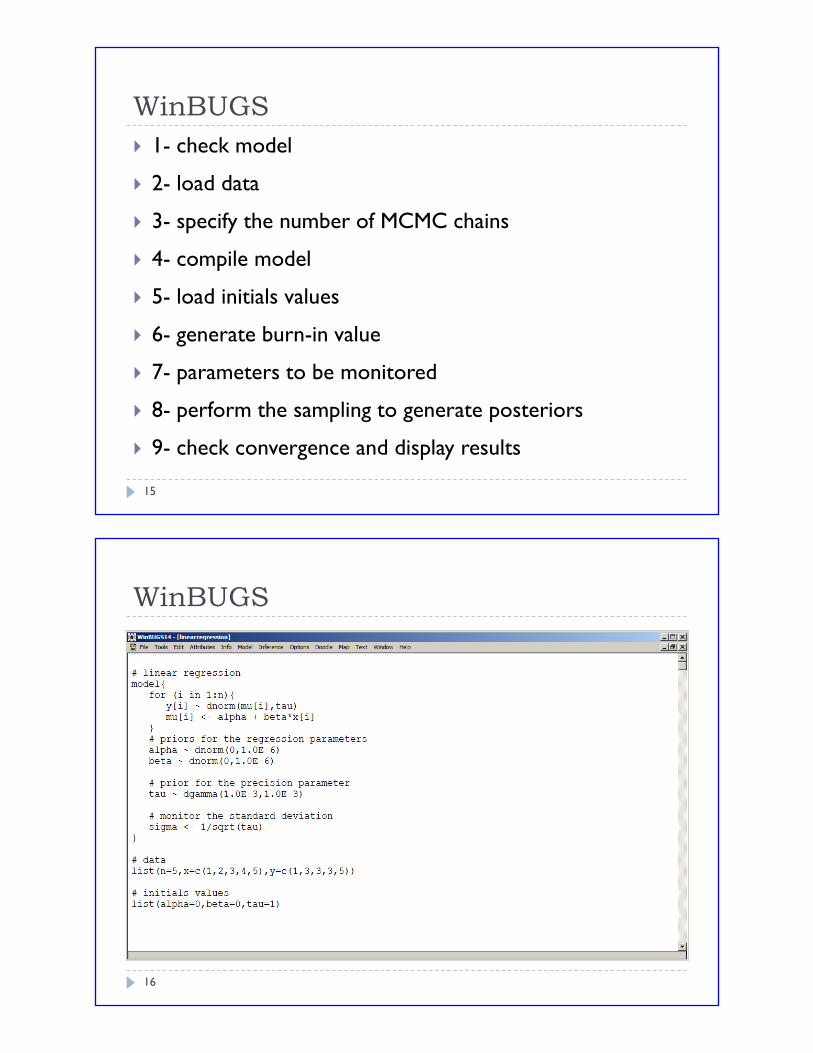
WinBUGS
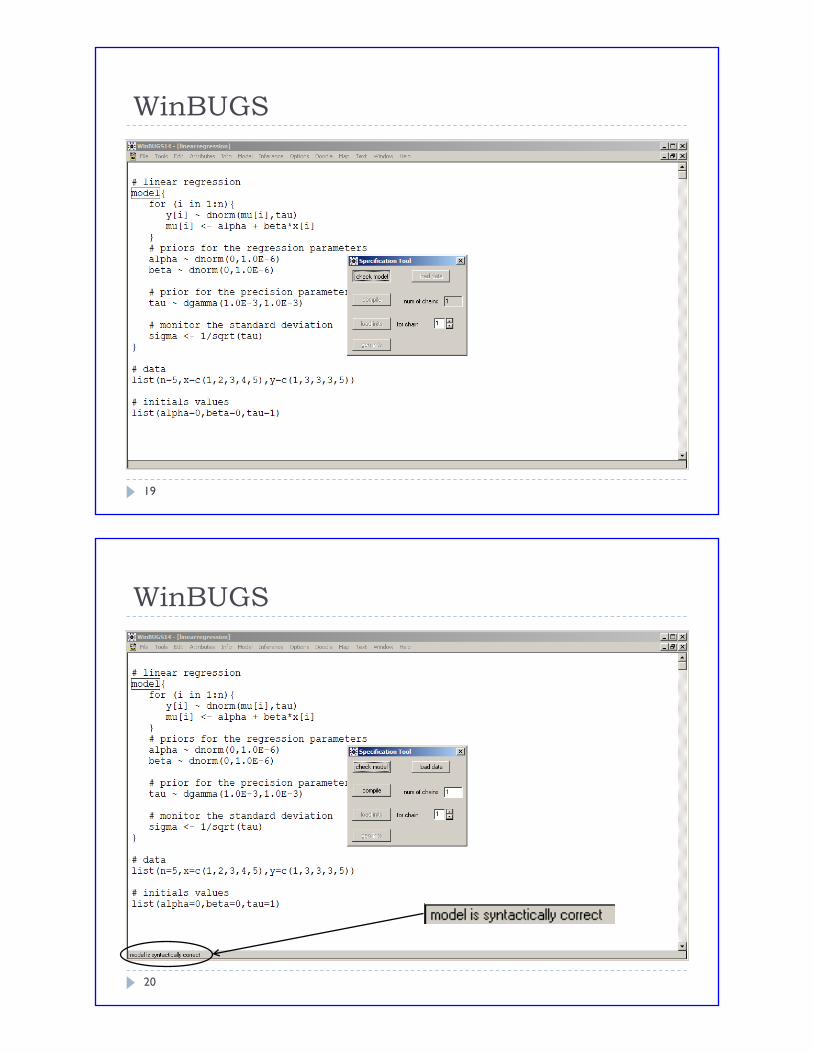
1- check model
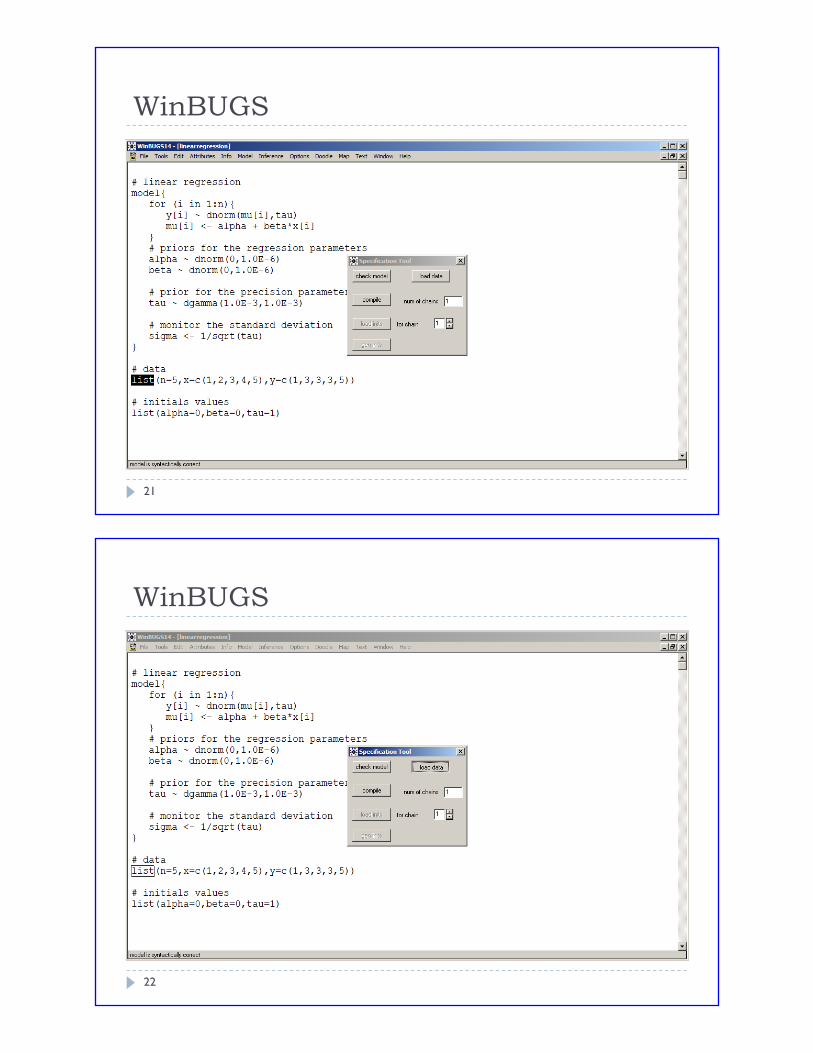
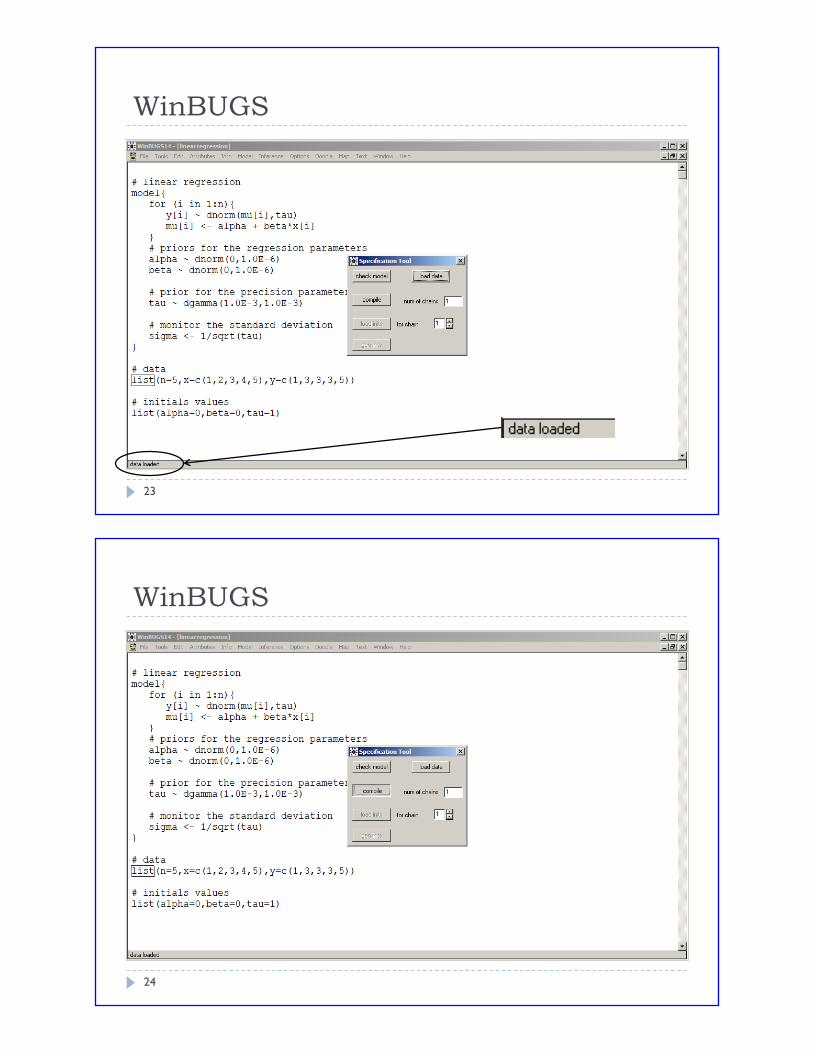
2- load data
3- specify the number of MCMC chains
4- compile model
5- load initials values
6- generate burn-in value
7- parameters to be monitored
8- perform the sampling to generate posteriors
9- check convergence and display results
15
WinBUGS
16
WinBUGS
17
WinBUGS
18
WinBUGS
19
WinBUGS
20
WinBUGS
21
WinBUGS
22
WinBUGS
23
WinBUGS
24
WinBUGS
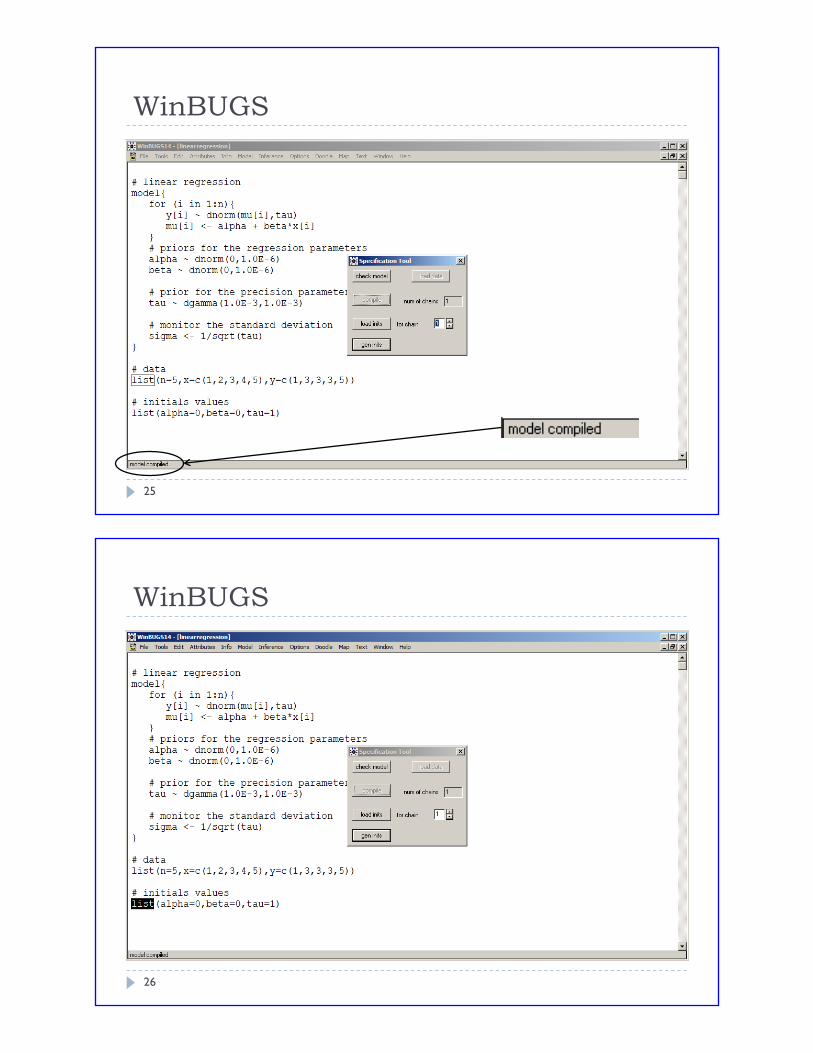
25
WinBUGS
26
WinBUGS
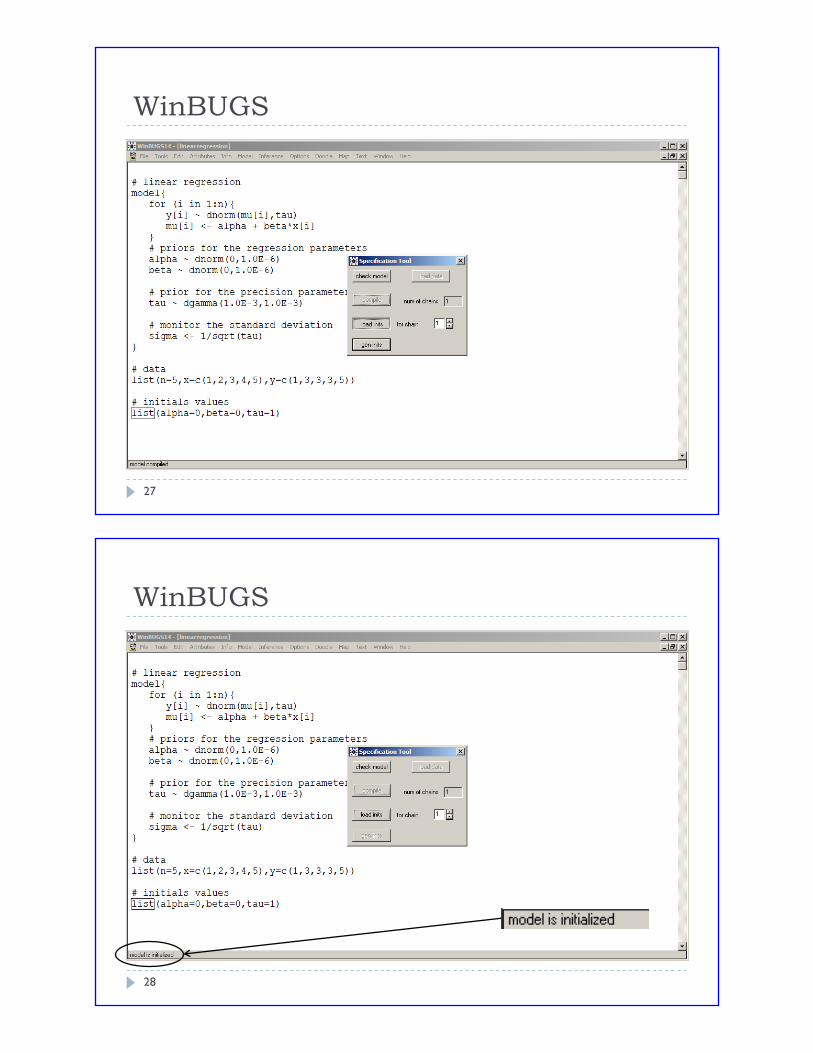
27
WinBUGS
28
WinBUGS
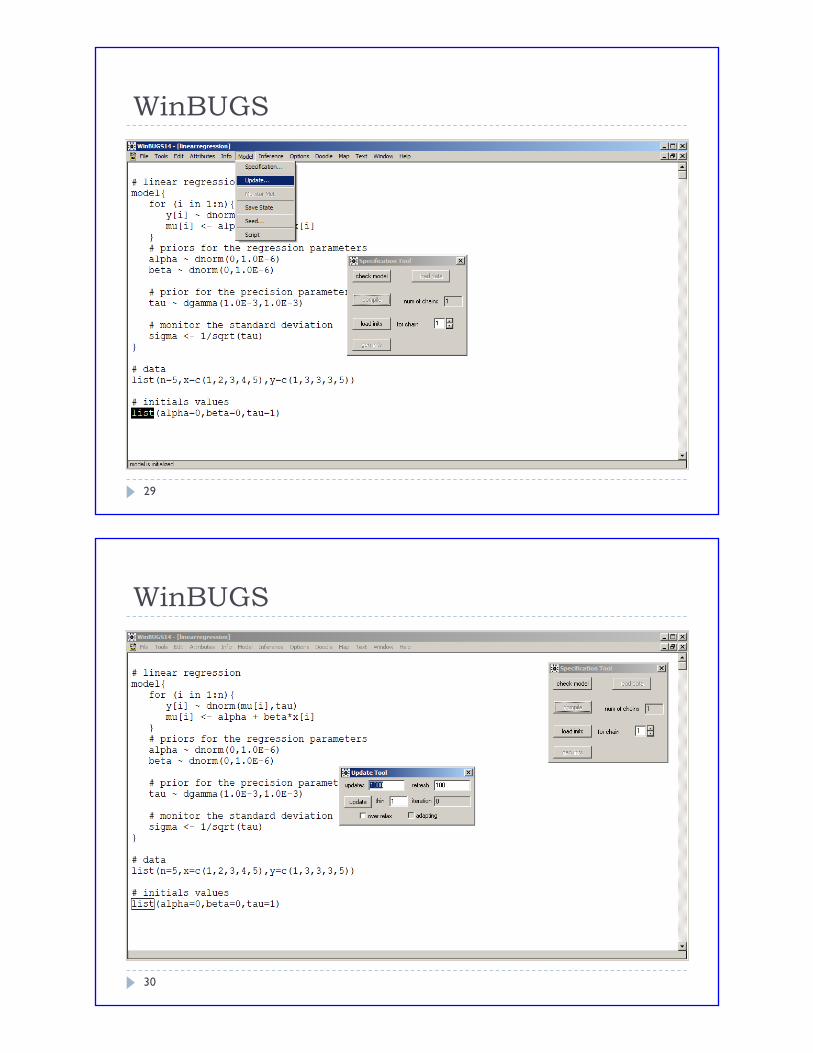
29
WinBUGS
30
WinBUGS
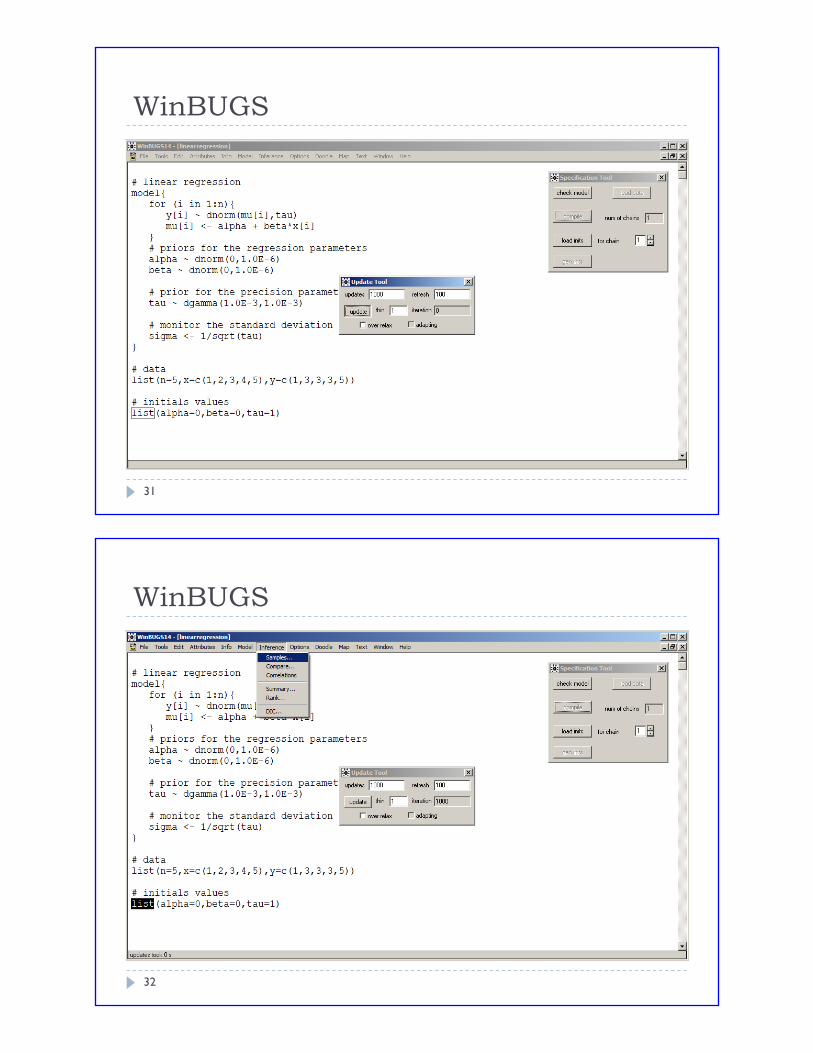
31
WinBUGS
32
WinBUGS
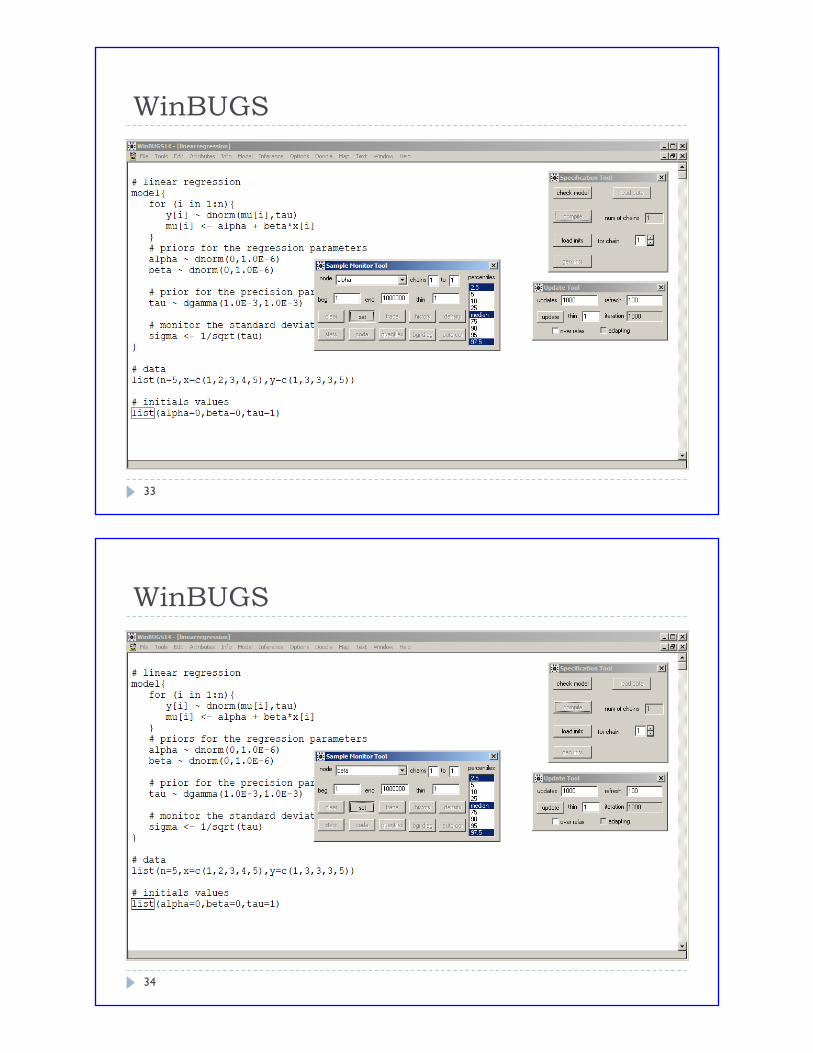
33
WinBUGS
34
WinBUGS
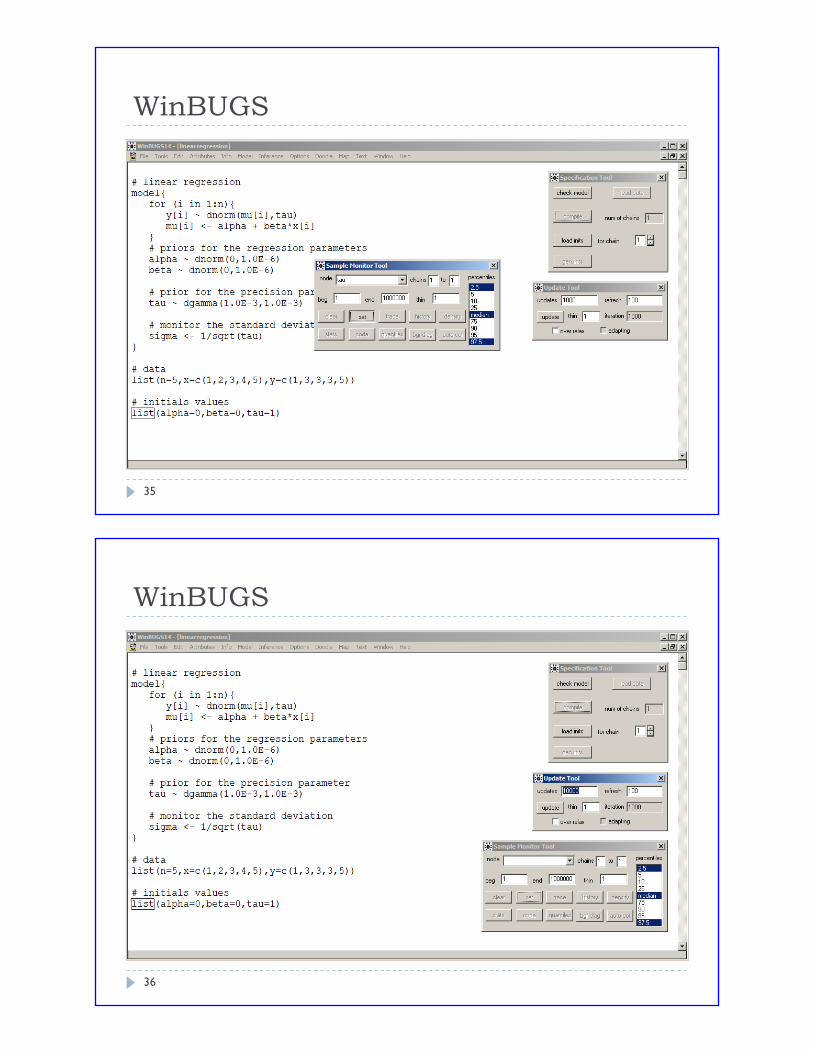
35
WinBUGS
36
WinBUGS
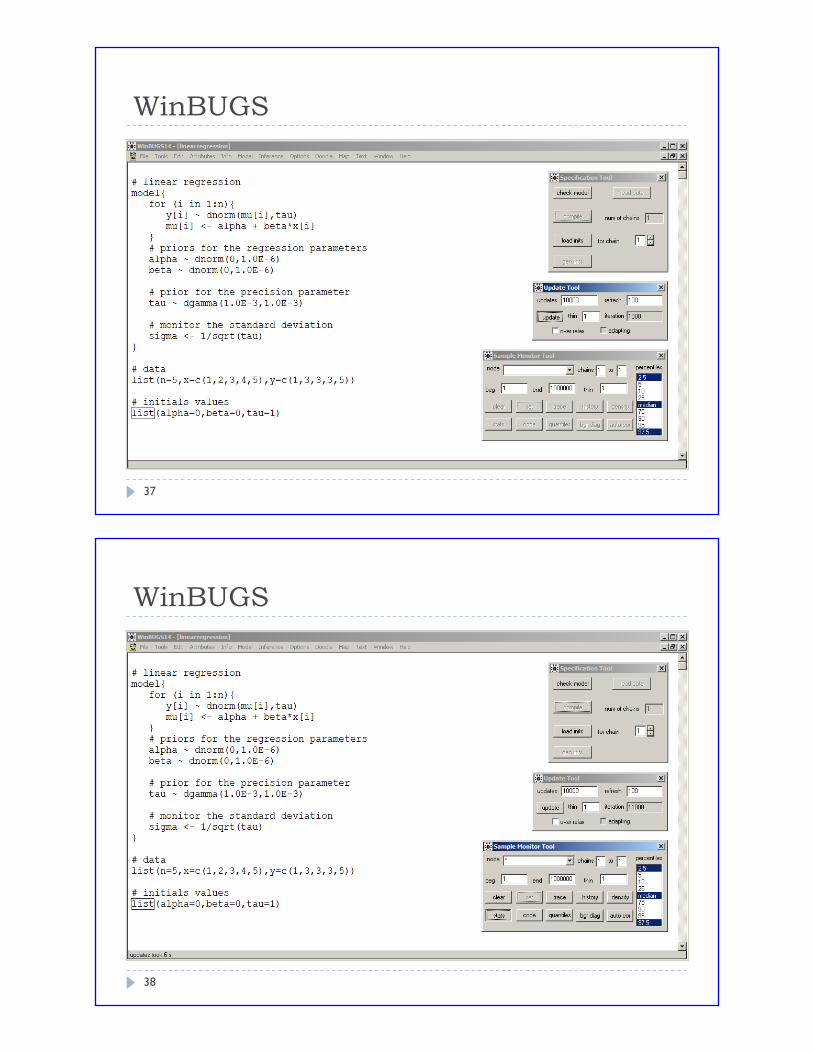
37
WinBUGS
38
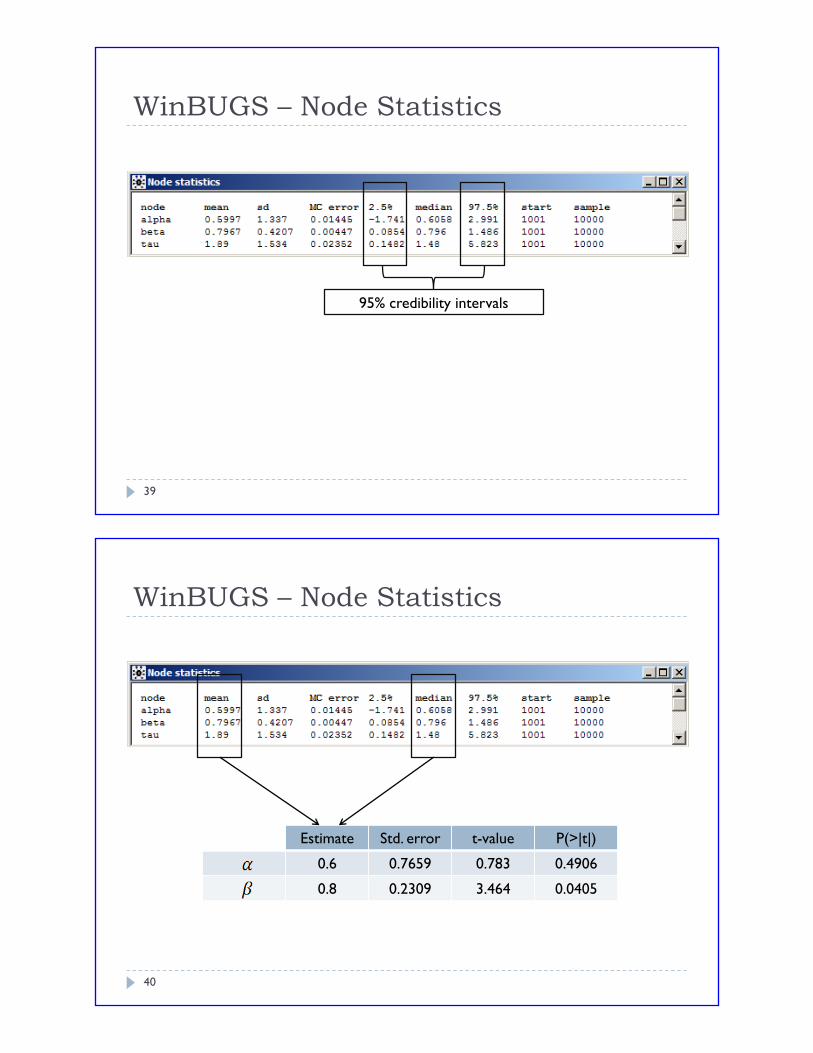
WinBUGS – Node Statistics
95% credibility intervals
39
WinBUGS – Node Statistics
Estimate Std. error t-value P(>|t|)
0.6 0.7659 0.783 0.4906
0.8 0.2309 3.464 0.0405
40
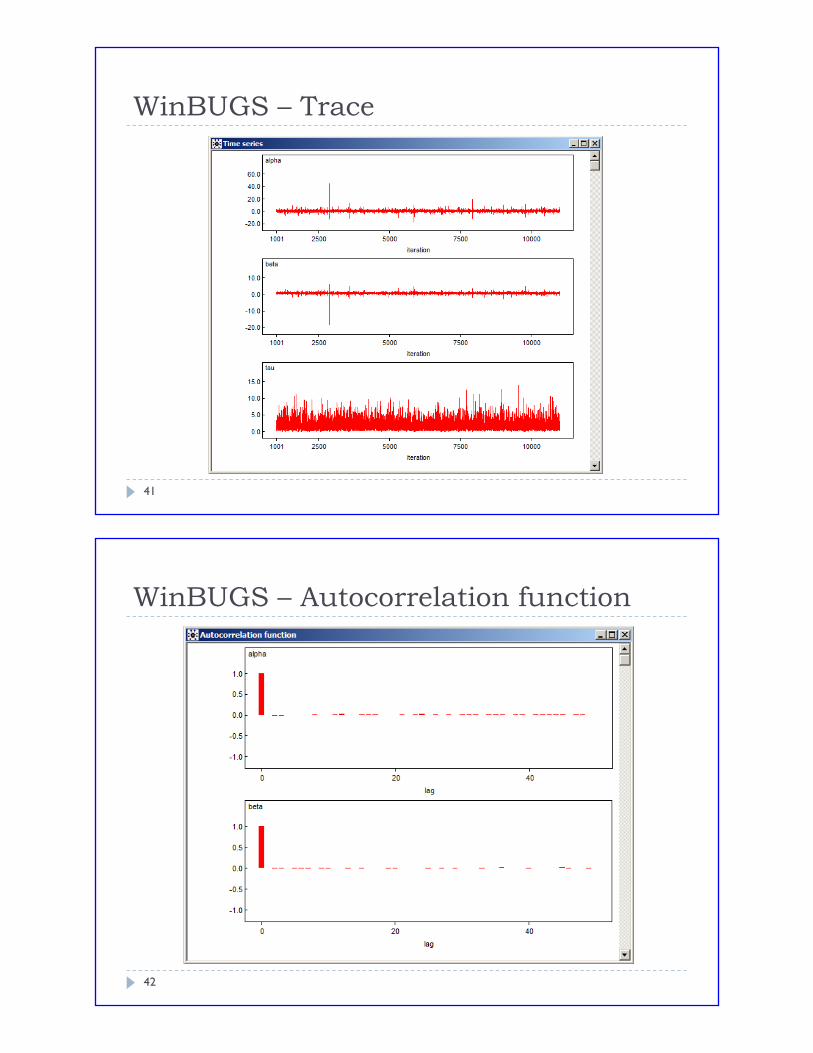
WinBUGS – Trace
41
WinBUGS – Autocorrelation function
42
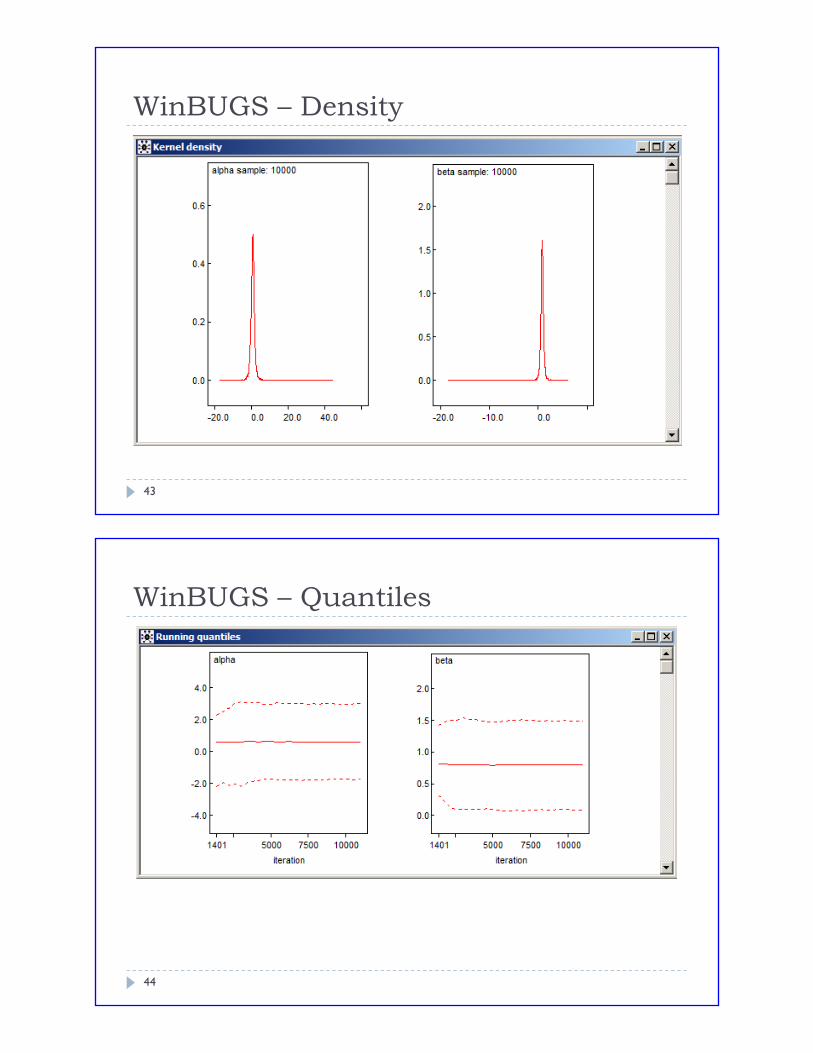
WinBUGS – Density
43
WinBUGS – Quantiles
44
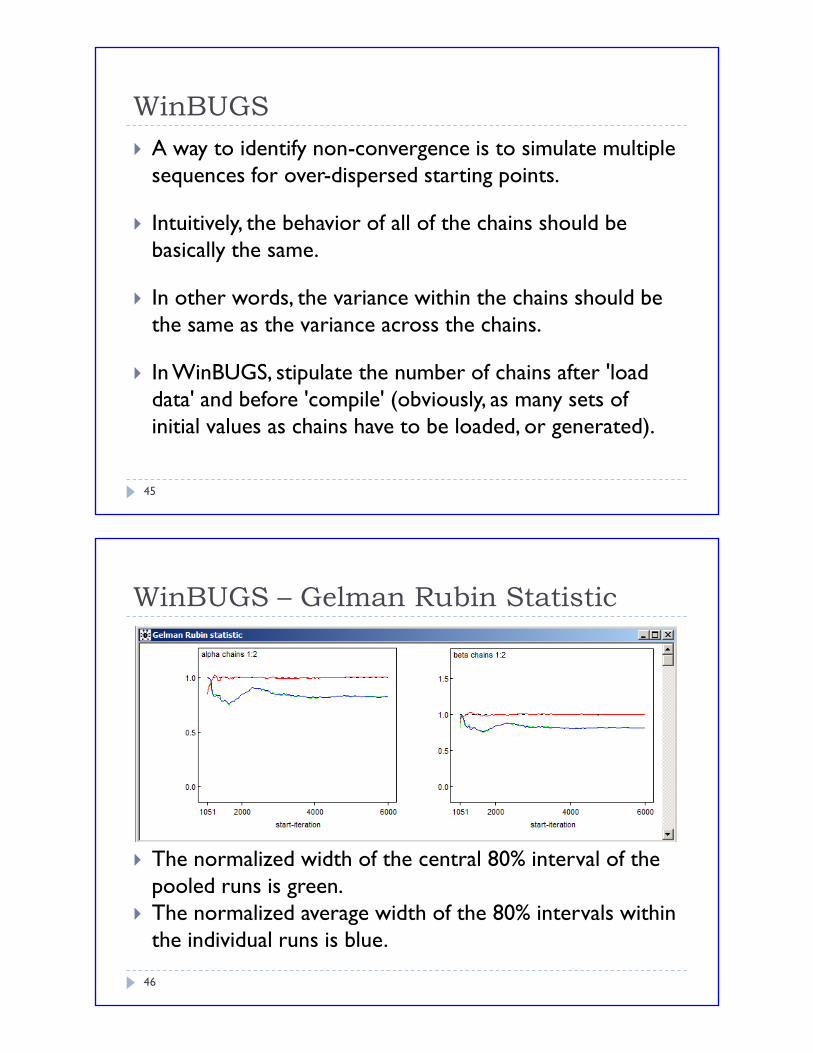
WinBUGS
A way to identify non-convergence is to simulate multiple
sequences for over-dispersed starting points.
Intuitively, the behavior of all of the chains should be
basically the same.
In other words, the variance within the chains should be
the same as the variance across the chains.
In WinBUGS, stipulate the number of chains after 'load
data' and before 'compile' (obviously, as many sets of
initial values as chains have to be loaded, or generated).
45
WinBUGS – Gelman Rubin Statistic
The normalized width of the central 80% interval of the
pooled runs is green.
The normalized average width of the 80% intervals within
the individual runs is blue.
46
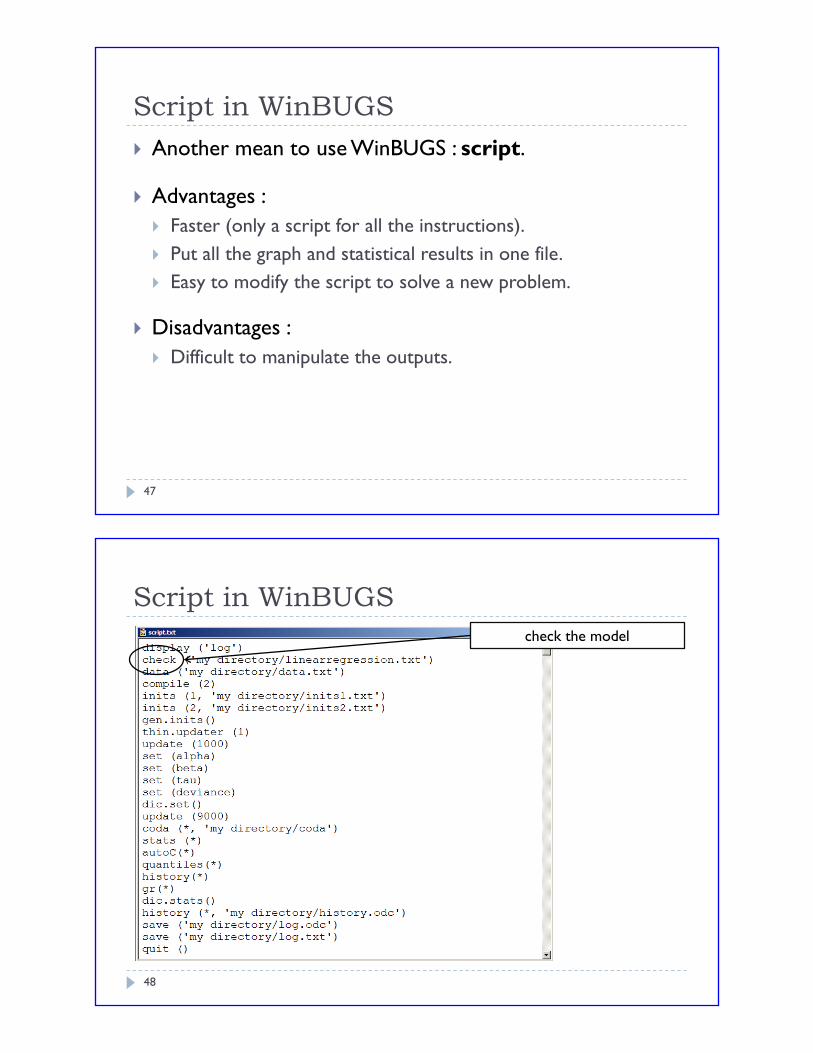
Script in WinBUGS
Another mean to use WinBUGS : script.
Advantages :
Faster (only a script for all the instructions).
Put all the graph and statistical results in one file.
Easy to modify the script to solve a new problem.
Disadvantages :
Difficult to manipulate the outputs.
47
Script in WinBUGS
check the model
48
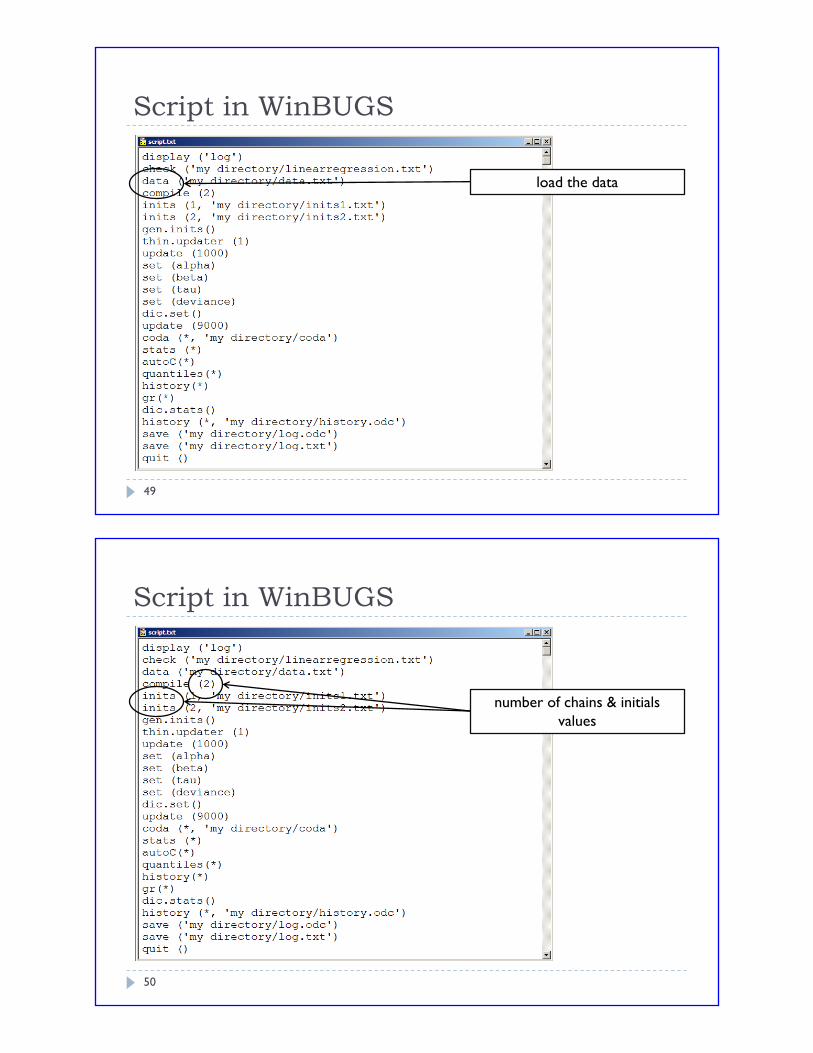
Script in WinBUGS
load the data
49
Script in WinBUGS
number of chains & initials
values
50
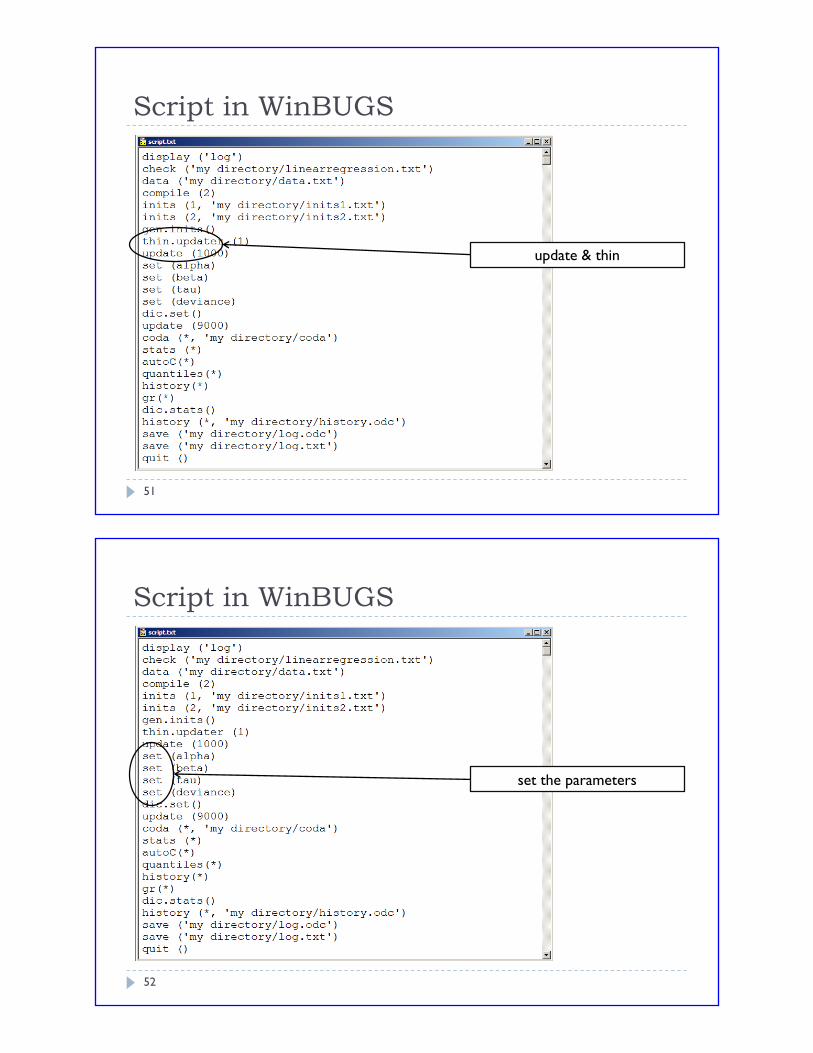
Script in WinBUGS
update & thin
51
Script in WinBUGS
set the parameters
52
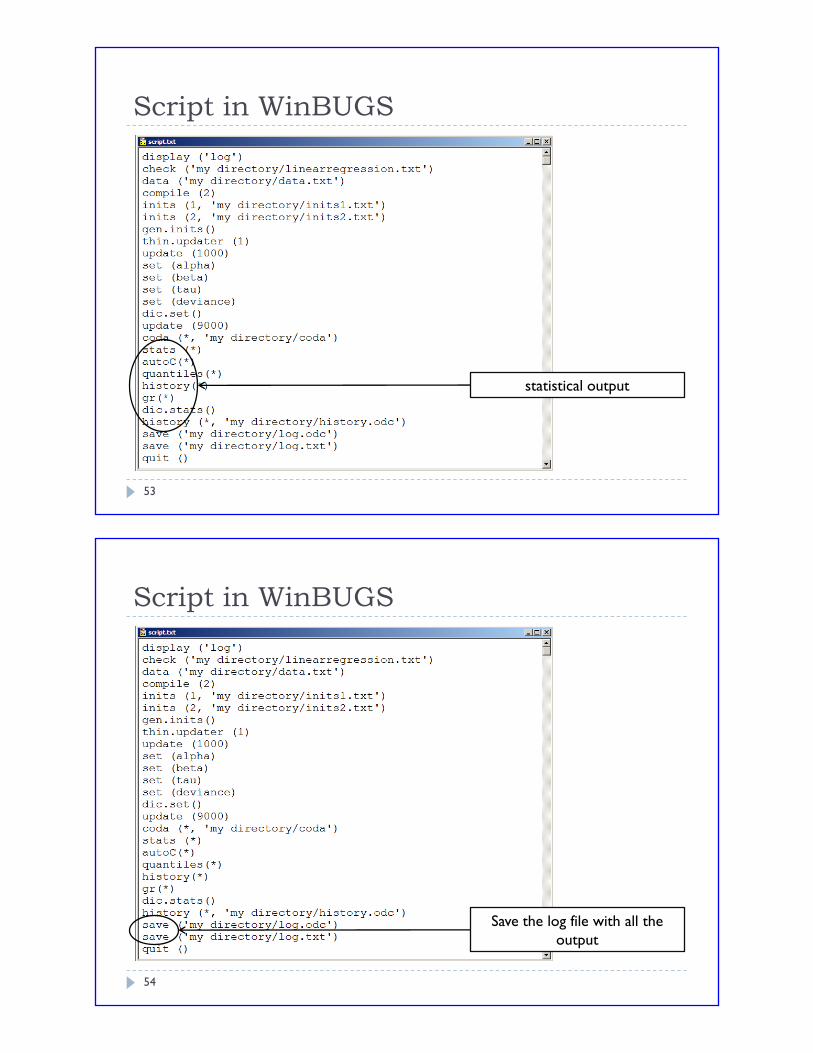
Script in WinBUGS
statistical output
53
Script in WinBUGS
Save the log file with all the
output
54
Running WinBUGS using R
WinBUGS : uneasy to read complex sets of data and
initial values.
Quite boring to specify the parameters to be monitored
in each run.
Interesting to save the output and read it into R for
further analyses :
R2WinBUGS allows WinBUGS to be run from R
Possibility to have the results of the MCMC and work with
them (plot, convergence diagnostics…)
55
R2WinBUGS
1- Create a .txt file with the model.
2- In R, load coda and R2WinBUGS packages.
3- Load the data in a list.
4- Load the initials values in a list.
5- Specify the parameters in a vector.
6- Create a bugs object using:
data,
initials values,
parameters,
model,
…
56
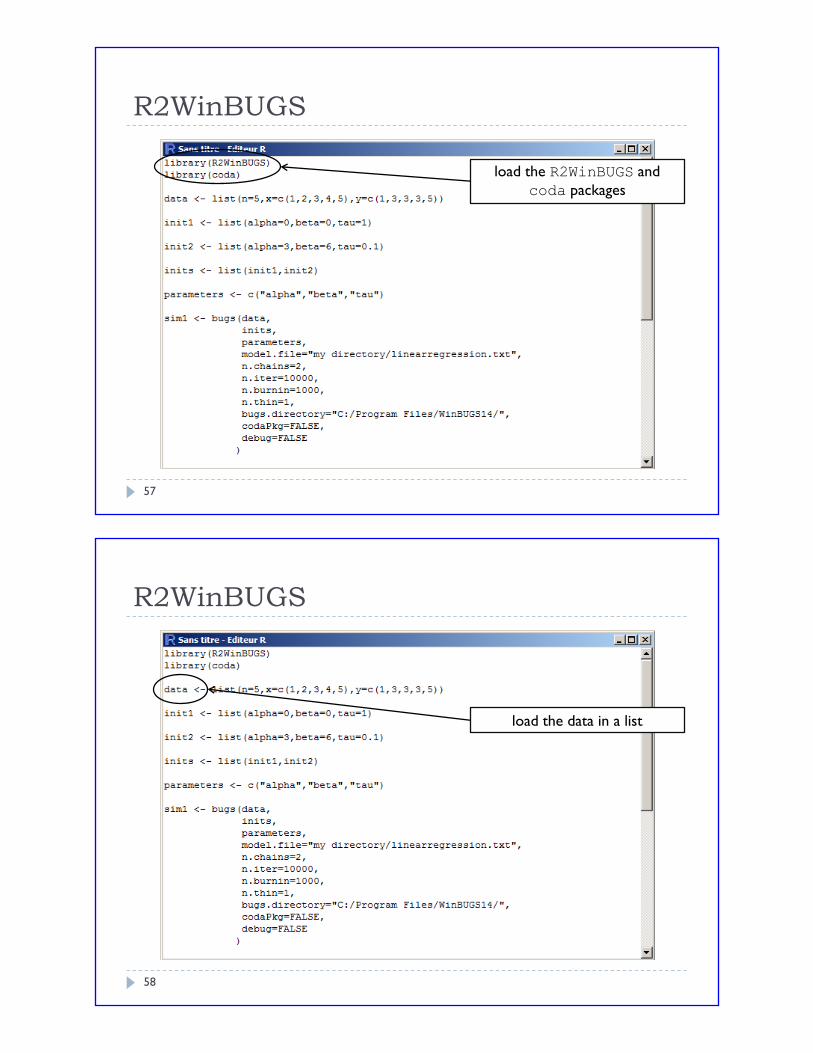
R2WinBUGS
load the R2WinBUGS and
coda packages
57
R2WinBUGS
load the data in a list
58
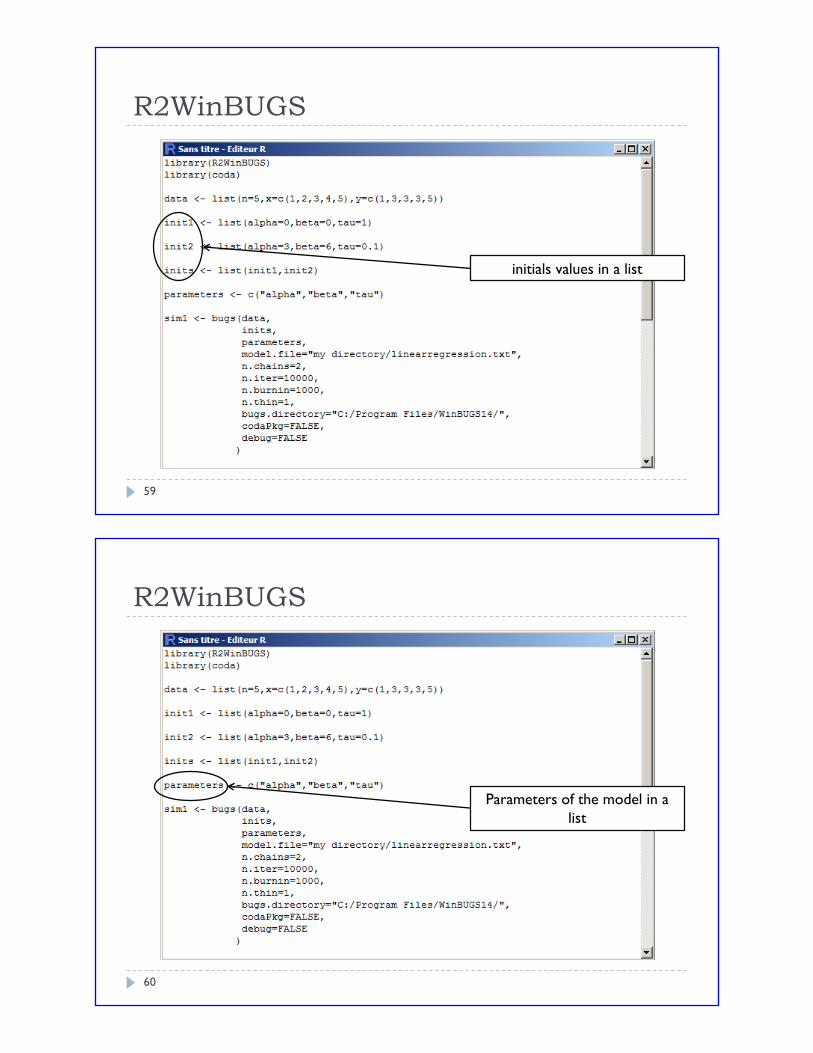
R2WinBUGS
initials values in a list
59
R2WinBUGS
Parameters of the model in a
list
60
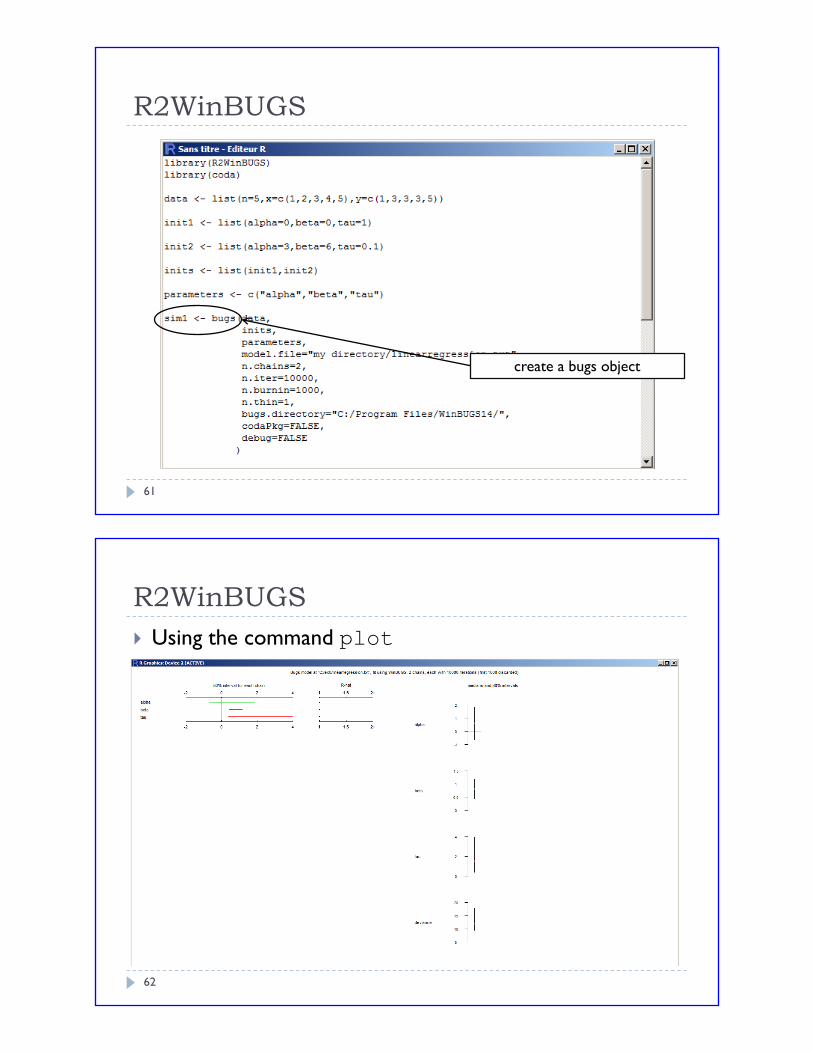
R2WinBUGS
create a bugs object
61
R2WinBUGS
Using the command plot
62
R2WinBUGS
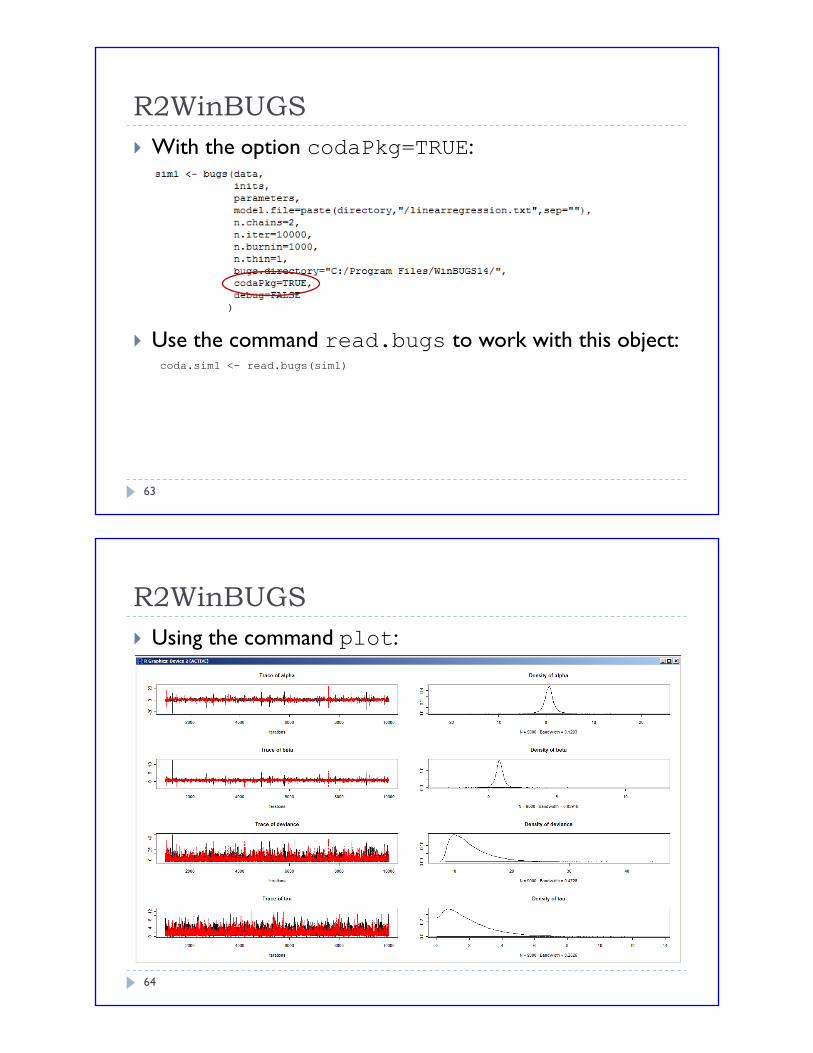
With the option codaPkg=TRUE:
Use the command read.bugs to work with this object:coda.sim1 <- read.bugs(sim1)
63
R2WinBUGS
Using the command plot:
64
R2WinBUGS
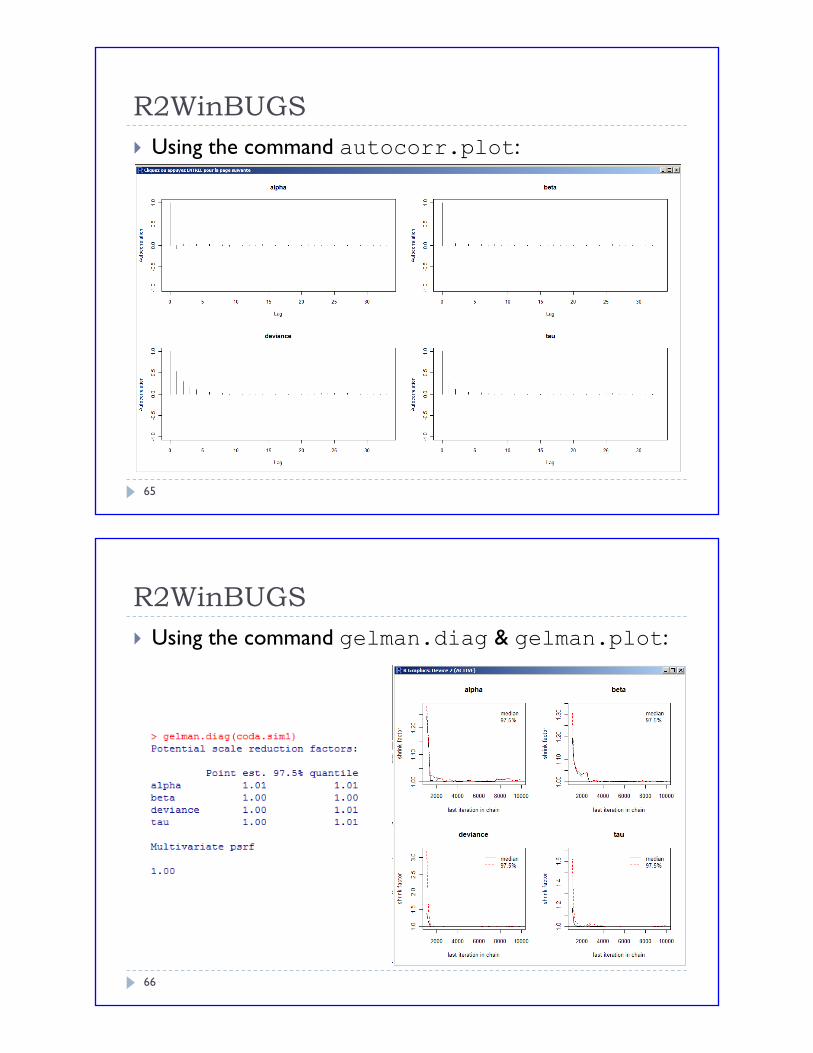
Using the command autocorr.plot:
65
R2WinBUGS
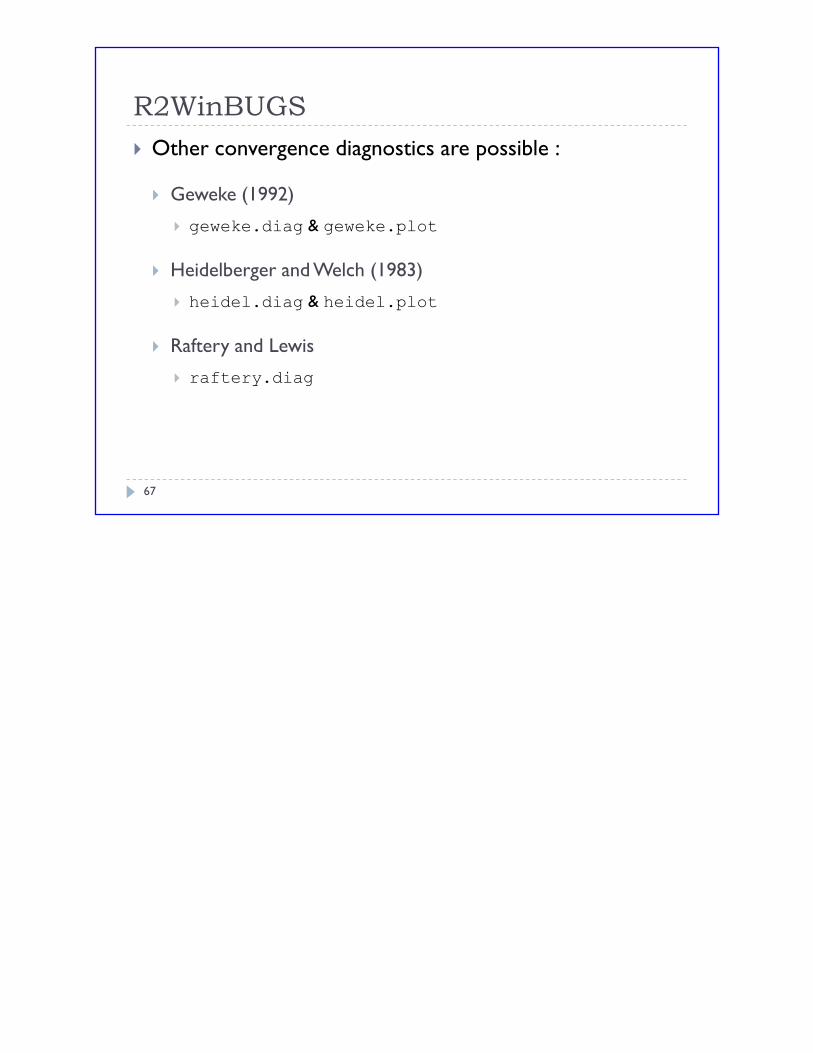
Using the command gelman.diag & gelman.plot:
66
R2WinBUGS
Other convergence diagnostics are possible :
Geweke (1992)
geweke.diag & geweke.plot
Heidelberger and Welch (1983)
heidel.diag & heidel.plot
Raftery and Lewis
raftery.diag
67