Embed Size (px)
Citation preview

M I T I n t e r n a t i o n a l C e n t e r f o r A i r T r a n s p o r t a t i o nM I T I n t e r n a t i o n a l C e n t e r f o r A i r T r a n s p o r t a t i o n
MIT MIT ICAT ICAT
WILLINGNESS TO PAY AND COMPETITIVE REVENUE MANAGEMENT
Peter P. Belobaba
With help from the MIT PODS Team:Maital Dar, Valenrina Soo, Thierry Vanhaverbeke
12th PROS Conference Houston, TX
March 5-8, 2006
MIT MIT ICAT ICAT
2
Traditional RM Systems Are Struggling Under Fare Simplification
Simplified fare structures characterized byOne-way fares with little or no product differentiation, priced at different fare levels Existing RM systems employed to control number of seats sold at each fare level
But RM systems were developed for restricted faresAssumed independent fare class demands, because restrictions kept full-fare passengers from buying lower faresTime series forecasting models used to predict future demand based on historical bookings in each fare classGiven independent demand forecasts, top-down protection for highest classes, extra seats made available to lowest class
MIT MIT ICAT ICAT
3
30,000
35,000
40,000
45,000
50,000
55,000
60,000
65,000
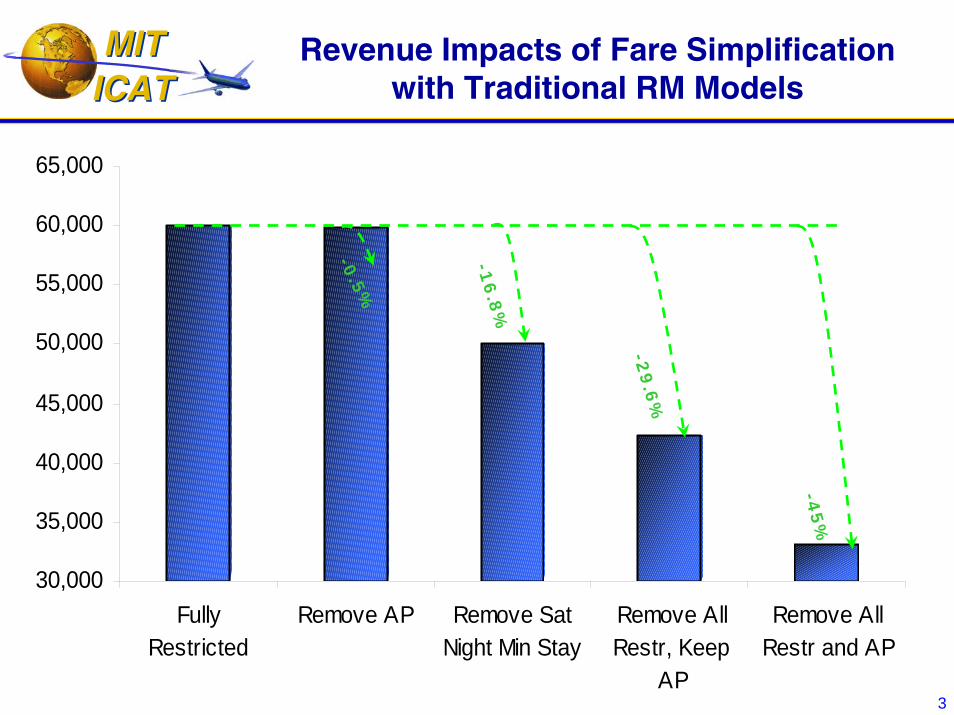
FullyRestricted
Remove AP Remove SatNight Min Stay
Remove AllRestr, Keep
AP
Remove AllRestr and AP
Revenue Impacts of Fare Simplification with Traditional RM Models
-0.5
%
-29.6
%
-45%
-16.8
%
MIT MIT ICAT ICAT
4
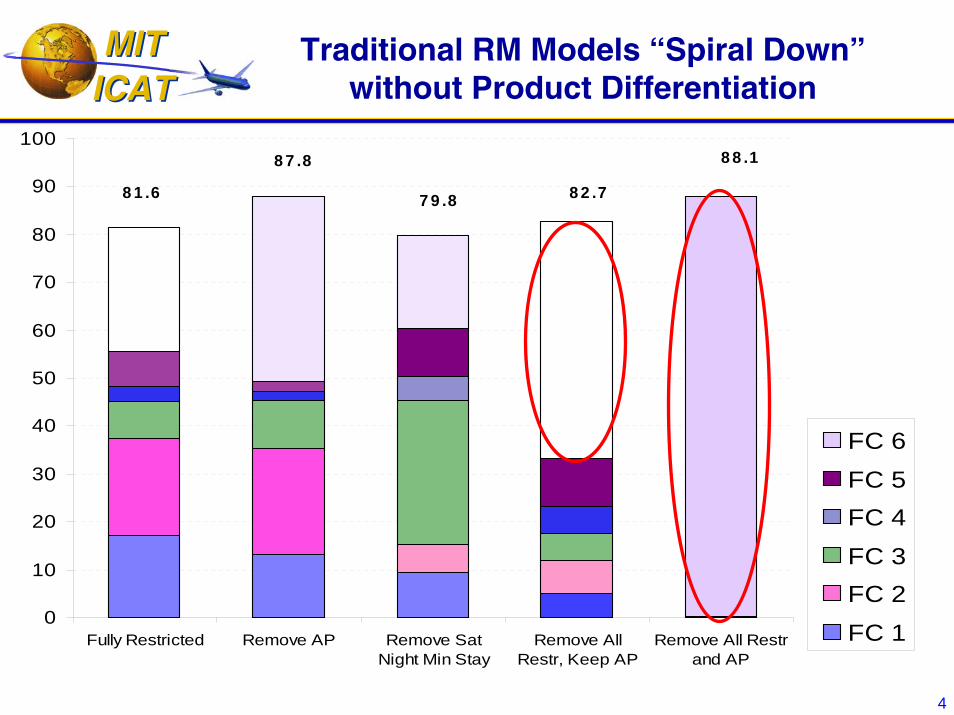
Traditional RM Models “Spiral Down”without Product Differentiation
0
10
20
30
40
50
60
70
80
90
100
Fully Restricted Remove AP Remove SatNight Min Stay
Remove AllRestr, Keep AP
Remove All Restrand AP
FC 6
FC 5FC 4
FC 3FC 2
FC 1
81.6
87.8
79.8 82.7
88.1
MIT MIT ICAT ICAT
5
Existing Airline RM Systems Need to be Modified for Changing Fare Structures
Without modification, these RM systems will not maximize revenues in less restricted fare structures
Unless demand forecasts are adjusted to reflect potential sell-up, high-fare demand will be consistently under-forecastOptimizer then under-protects, allowing more “spiral down”
Current RM system limitations are negatively affecting airline revenues
Existing systems, left unadjusted, generate high load factors but do not increase yieldsMany legacy carriers are using “rule-based” RM practices
RM forecasting models must be changed to reflect passenger willingness to pay (WTP)
MIT MIT ICAT ICAT
6
Forecasting by Willingness to Pay
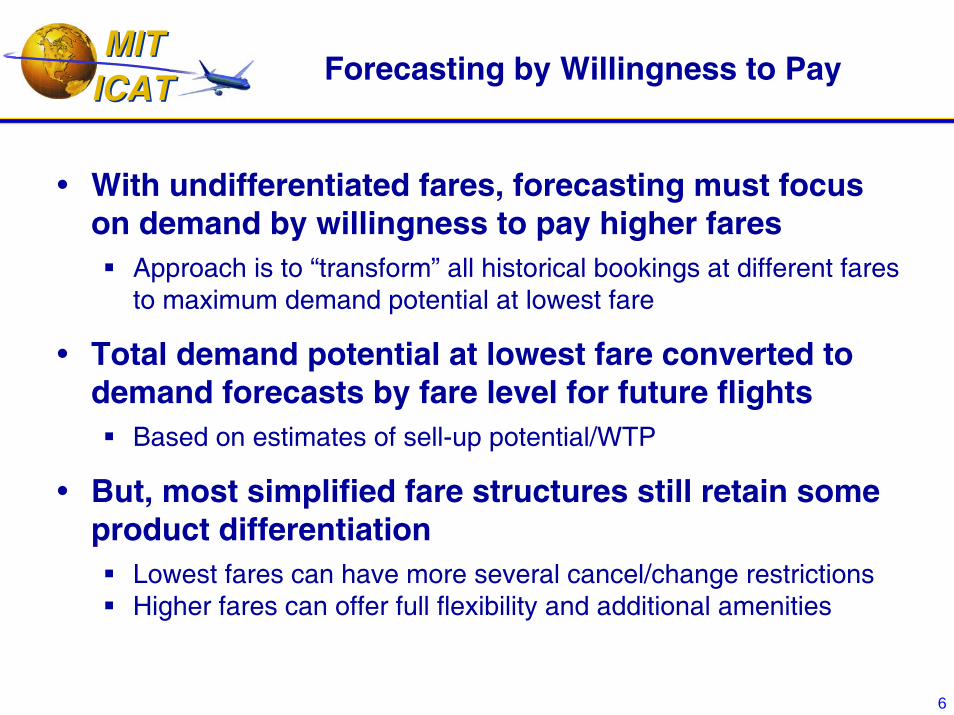
With undifferentiated fares, forecasting must focus on demand by willingness to pay higher fares
Approach is to “transform” all historical bookings at different fares to maximum demand potential at lowest fare
Total demand potential at lowest fare converted to demand forecasts by fare level for future flights
Based on estimates of sell-up potential/WTP
But, most simplified fare structures still retain some product differentiation
Lowest fares can have more several cancel/change restrictionsHigher fares can offer full flexibility and additional amenities
MIT MIT ICAT ICAT
7
Hybrid Forecasting For Partially Differentiated Fare Structures
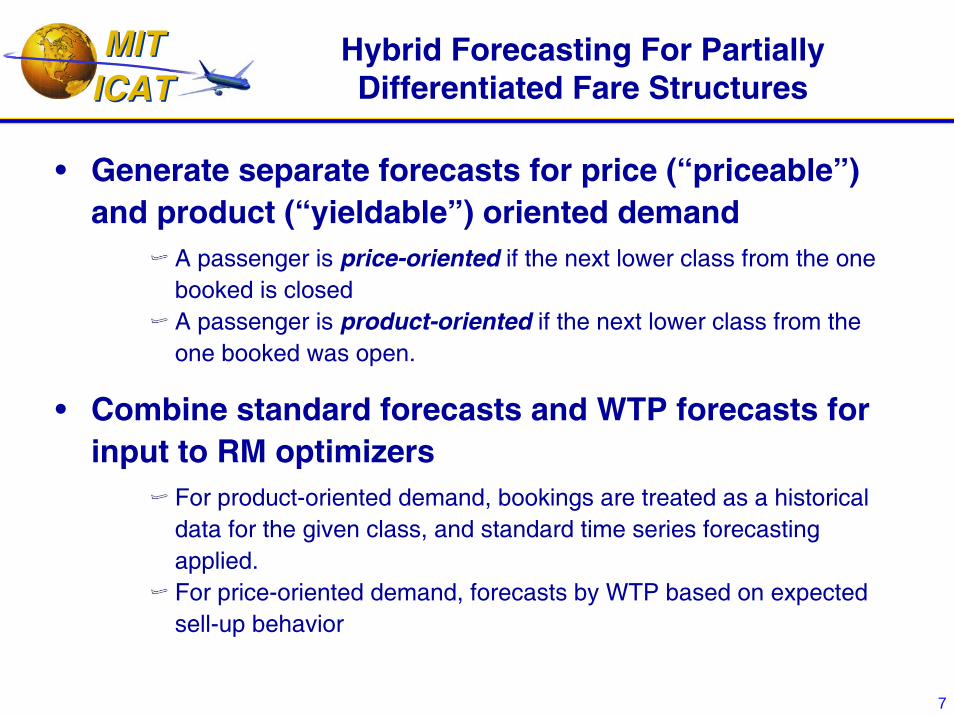
• Generate separate forecasts for price (“priceable”) and product (“yieldable”) oriented demand
A passenger is price-oriented if the next lower class from the one booked is closedA passenger is product-oriented if the next lower class from the one booked was open.
• Combine standard forecasts and WTP forecasts for input to RM optimizers
For product-oriented demand, bookings are treated as a historical data for the given class, and standard time series forecasting applied.For price-oriented demand, forecasts by WTP based on expected sell-up behavior
MIT MIT ICAT ICAT
8
PODS Simulations in Network D
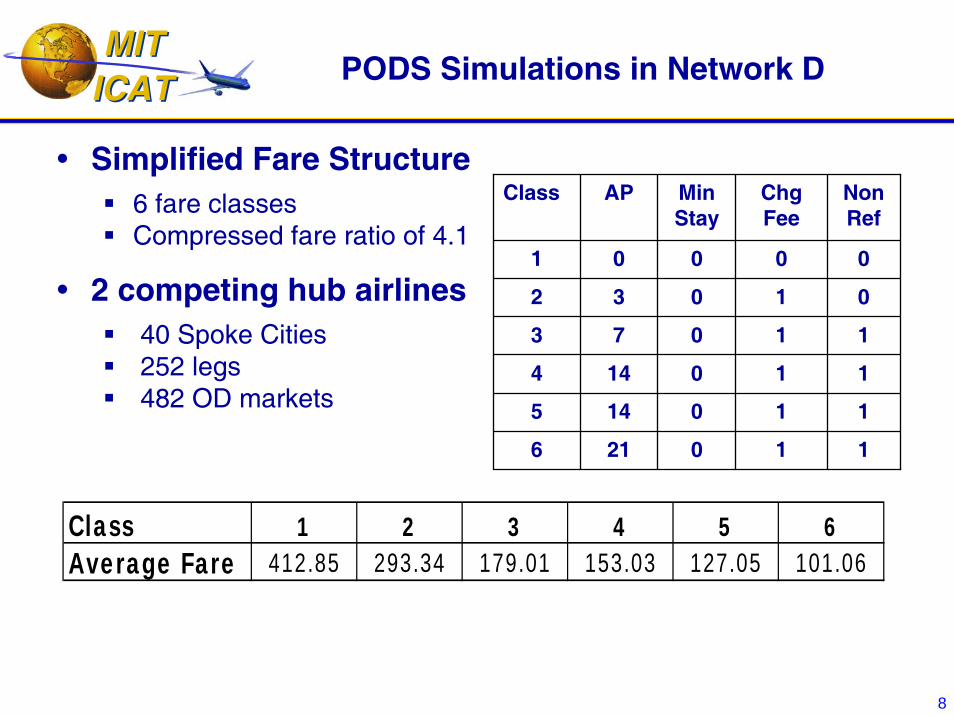
Simplified Fare Structure 6 fare classesCompressed fare ratio of 4.1
2 competing hub airlines40 Spoke Cities252 legs482 OD markets
Class AP Min Stay
Chg Fee
Non Ref
1 0 0 0 0
2 3 0 1 0
3 7 0 1 1
4 14 0 1 1
5 14 0 1 1
6 21 0 1 1
Class 1 2 3 4 5 6Average Fare 412.85 293.34 179.01 153.03 127.05 101.06
MIT MIT ICAT ICAT
9
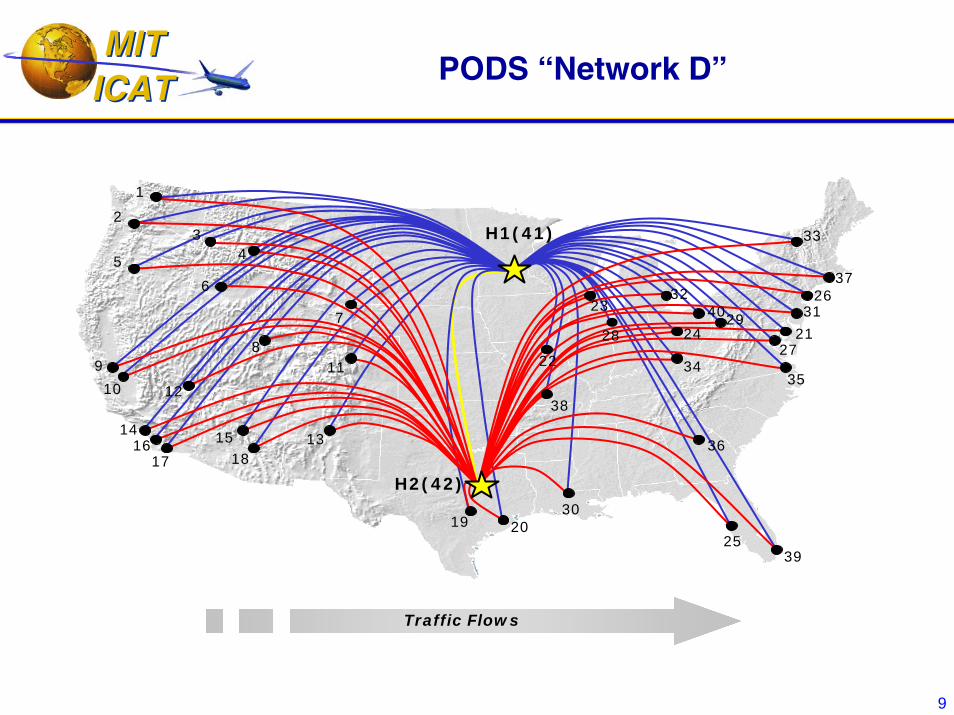
PODS “Network D”
H1(41)
19
28
H2(42)
43
2
1
10
98
7
6
5
15
1716
14
12
11 22
21
20
18
27
26
25
24
23
33
3231
30
29
39
38
37
36
3534
40
13
Traffic Flows
MIT MIT ICAT ICAT
10
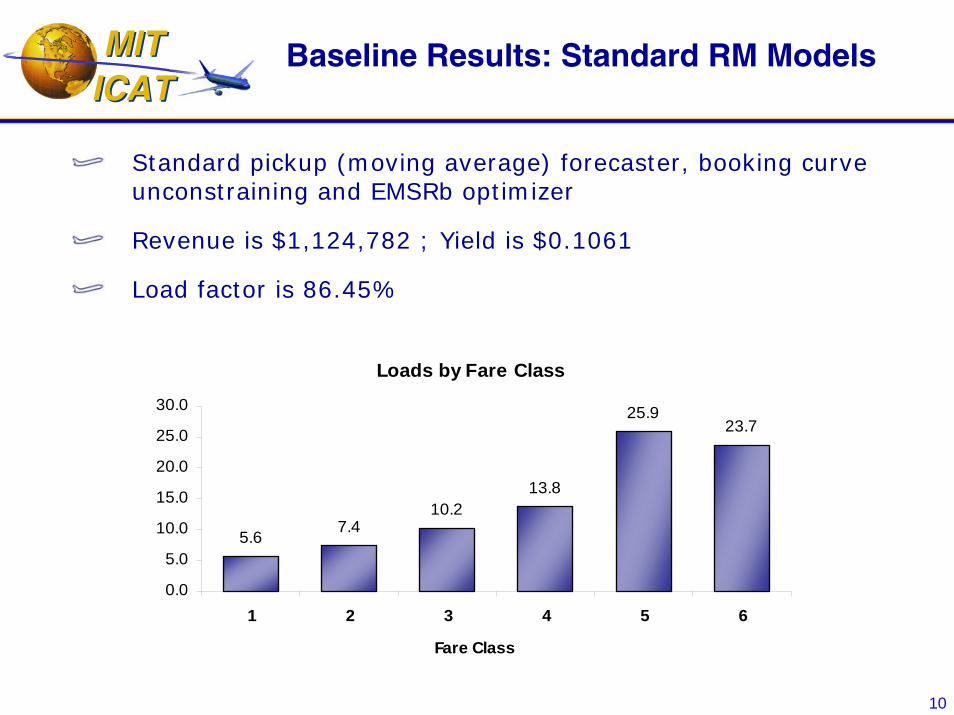
Baseline Results: Standard RM Models
Standard pickup (moving average) forecaster, booking curve unconstraining and EMSRb optimizer
Revenue is $1,124,782 ; Yield is $0.1061
Load factor is 86.45%
Loads by Fare Class
5.6 7.410.2
13.8
25.923.7
0.0
5.0
10.0
15.0
20.0
25.0
30.0
1 2 3 4 5 6
Fare Class
MIT MIT ICAT ICAT
11
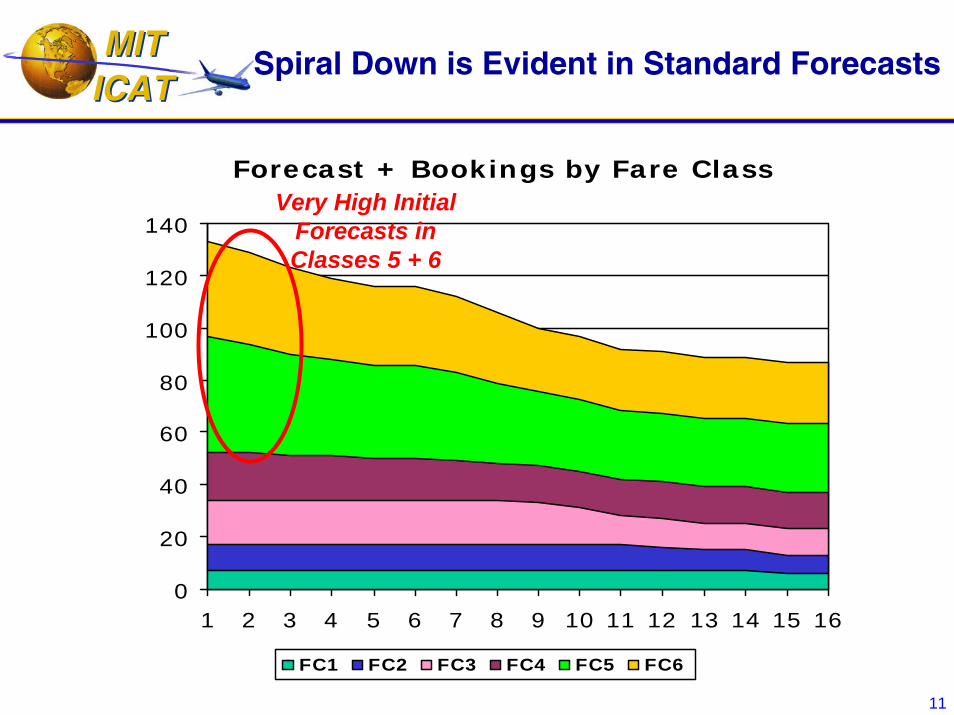
Spiral Down is Evident in Standard Forecasts
Forecast + Bookings by Fare Class
0
20
40
60
80
100
120
140
1 2 3 4 5 6 7 8 9 10 11 12 13 14 15 16
FC1 FC2 FC3 FC4 FC5 FC6
Very High Initial Forecasts in Classes 5 + 6
MIT MIT ICAT ICAT
12
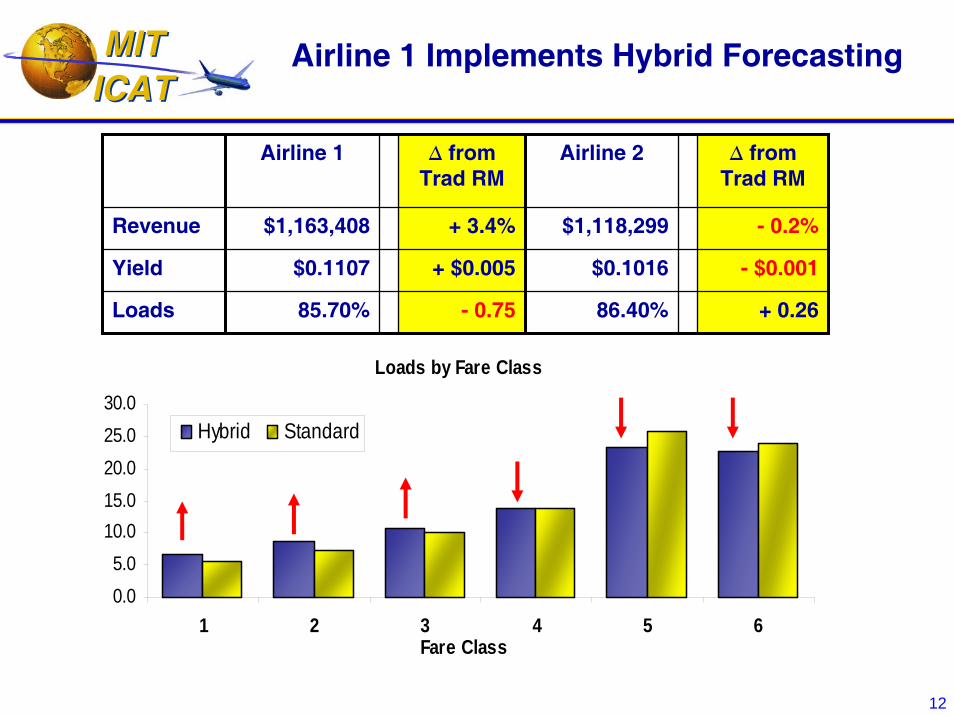
Airline 1 Implements Hybrid Forecasting
Loads by Fare Class
0.05.0
10.015.020.025.030.0
1 2 3 4 5 6Fare Class
Hybrid Standard
Airline 1
Revenue
Yield
Loads
∆ from Trad RM
Airline 2 ∆ from Trad RM
$1,163,408 + 3.4% $1,118,299 - 0.2%
$0.1107 + $0.005 $0.1016 - $0.001
85.70% - 0.75 86.40% + 0.26
MIT MIT ICAT ICAT
13
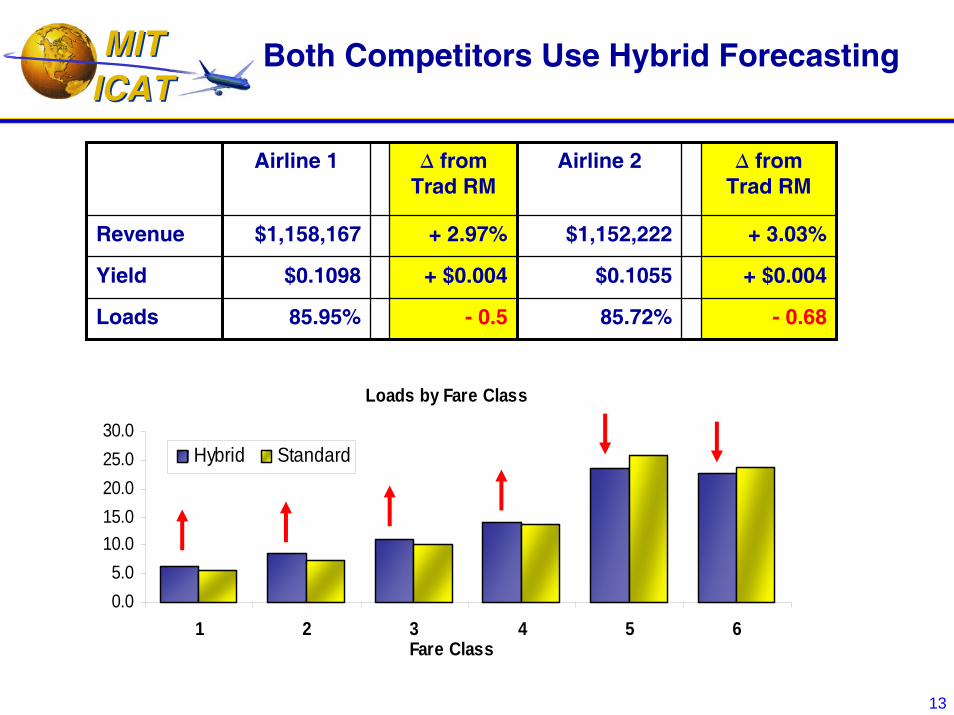
Both Competitors Use Hybrid Forecasting
Airline 1
Revenue
Yield
Loads
∆ from Trad RM
Airline 2 ∆ from Trad RM
$1,158,167 + 2.97% $1,152,222 + 3.03%
$0.1098 + $0.004 $0.1055 + $0.004
85.95% - 0.5 85.72% - 0.68
Loads by Fare Class
0.05.0
10.015.020.025.030.0
1 2 3 4 5 6Fare Class
Hybrid Standard
MIT MIT ICAT ICAT
14
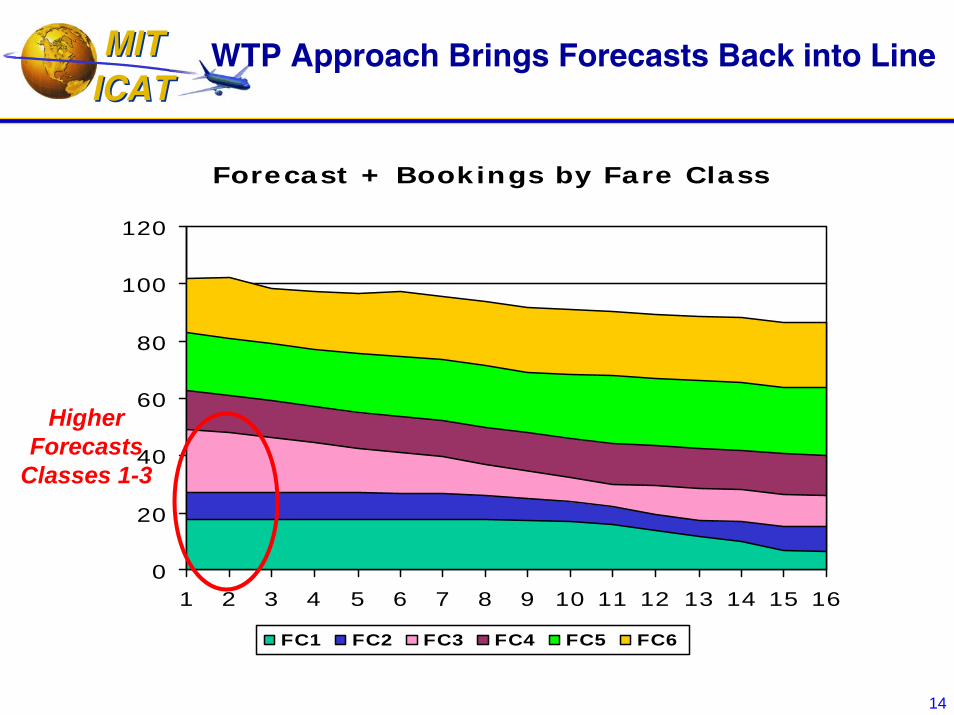
WTP Approach Brings Forecasts Back into Line
Forecast + Bookings by Fare Class
0
20
40
60
80
100
120
1 2 3 4 5 6 7 8 9 10 11 12 13 14 15 16
FC1 FC2 FC3 FC4 FC5 FC6
Higher Forecasts
Classes 1-3
MIT MIT ICAT ICAT
15
Distorted Forecasts Affect RM Performance
Spiral-down leads to high forecasts in lower classesAnd, in turn, forecasts that are too low in higher classes
In EMSR-based leg RM, at least the lowest class demand is rejected when demand is high
Not revenue maximizing, but some benefit from booking limits
Recent PODS simulations illustrate impacts of distorted forecasts on O+D method performance:
Mismatch between independent path/class demands assumed by network optimizer and reality of passenger sell-upNetwork optimizers over-protect for forecast low-class connecting traffic, leading to distorted bid prices or displacement costs
MIT MIT ICAT ICAT
16
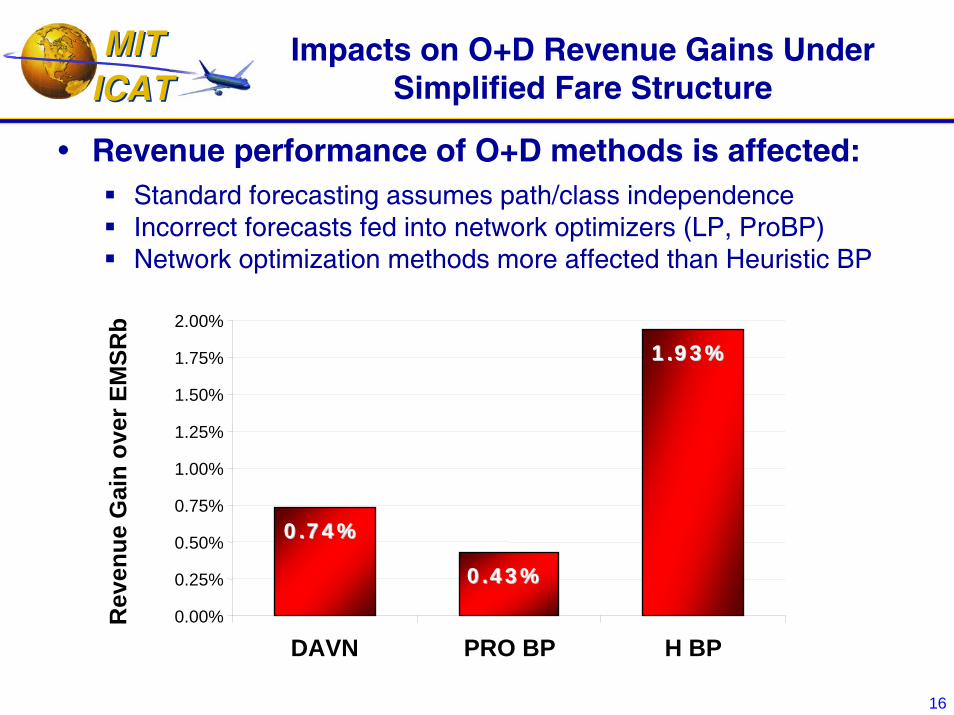
Impacts on O+D Revenue Gains Under Simplified Fare Structure
Revenue performance of O+D methods is affected:Standard forecasting assumes path/class independenceIncorrect forecasts fed into network optimizers (LP, ProBP)Network optimization methods more affected than Heuristic BP
Rev
enue
Gai
n ov
er E
MSR
b
0.74%0.74%
0.43%0.43%
1.93%1.93%
0.00%
0.25%
0.50%
0.75%
1.00%
1.25%
1.50%
1.75%
2.00%
DAVN PRO BP H BP
MIT MIT ICAT ICAT
17
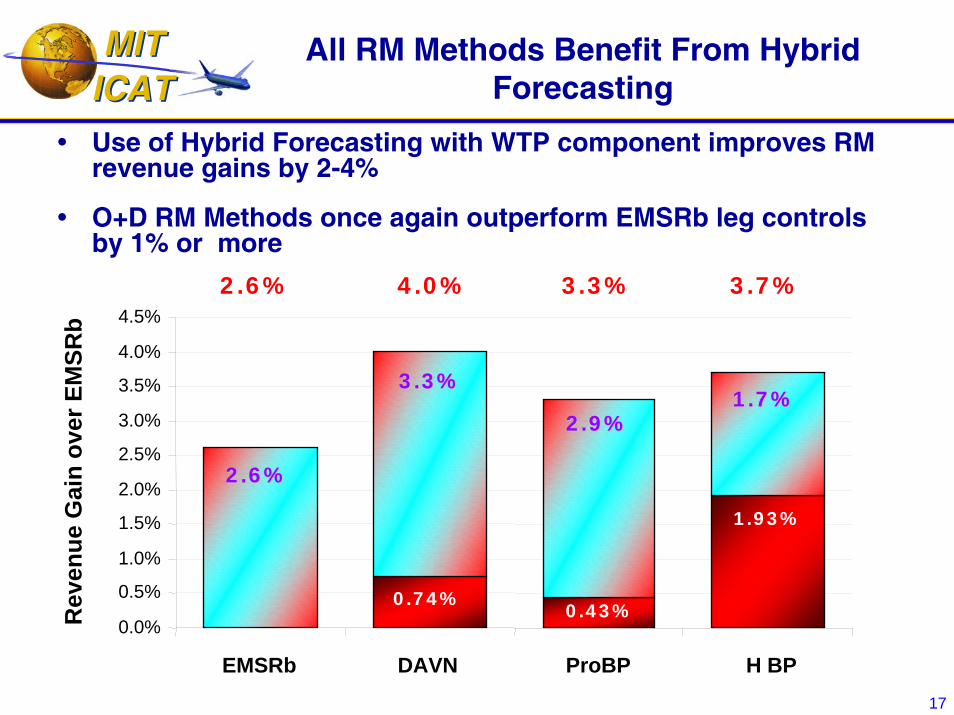
All RM Methods Benefit From Hybrid Forecasting
Use of Hybrid Forecasting with WTP component improves RM revenue gains by 2-4%
O+D RM Methods once again outperform EMSRb leg controls by 1% or more
0.0%
0.5%
1.0%
1.5%
2.0%
2.5%
3.0%
3.5%
4.0%
4.5%
2.6%2.6%
3.3%3.3%
2.9%2.9%1.7%1.7%
0.74%0.43%
1.93%
2.6% 4.0% 3.3% 3.7%
Rev
enue
Gai
n ov
er E
MSR
b
EMSRb DAVN ProBP H BP
MIT MIT ICAT ICAT
18
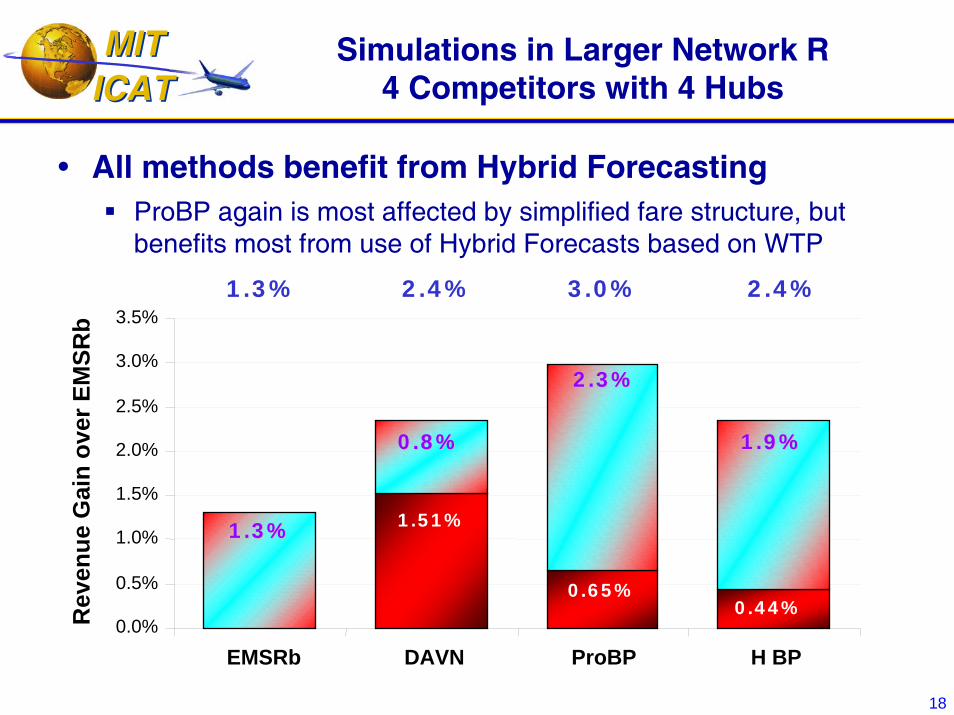
Simulations in Larger Network R4 Competitors with 4 Hubs
All methods benefit from Hybrid ForecastingProBP again is most affected by simplified fare structure, but benefits most from use of Hybrid Forecasts based on WTP
0.0%
0.5%
1.0%
1.5%
2.0%
2.5%
3.0%
3.5%
EMSRb DAVN ProBP H BP
1.3%1.3%
0.8%0.8%
2.3%2.3%
1.9%1.9%
1.51%
0.65%0.44%
1.3% 2.4% 3.0% 2.4%
Rev
enue
Gai
n ov
er E
MSR
b
MIT MIT ICAT ICAT
19
Existing RM Forecasts Are Inadequate for Simplified Fare Structures
Existing RM systems need to be modifiedMismatch between RM model assumptions and fare structures
Price/product hybrid forecasting increases revenuesCompared to use of standard RM forecasting methodsGains come from higher forecasts in upper/middle classes, increasing protection and helping to reduce “spiral down”
Modified forecasters require estimates of passenger WTP by time to departure for each flight
Approach is to forecast maximum demand potential at lowest fare, and convert into “partitioned” forecasts for each fare class
But, WTP forecasting is much more difficult…
MIT MIT ICAT ICAT
20
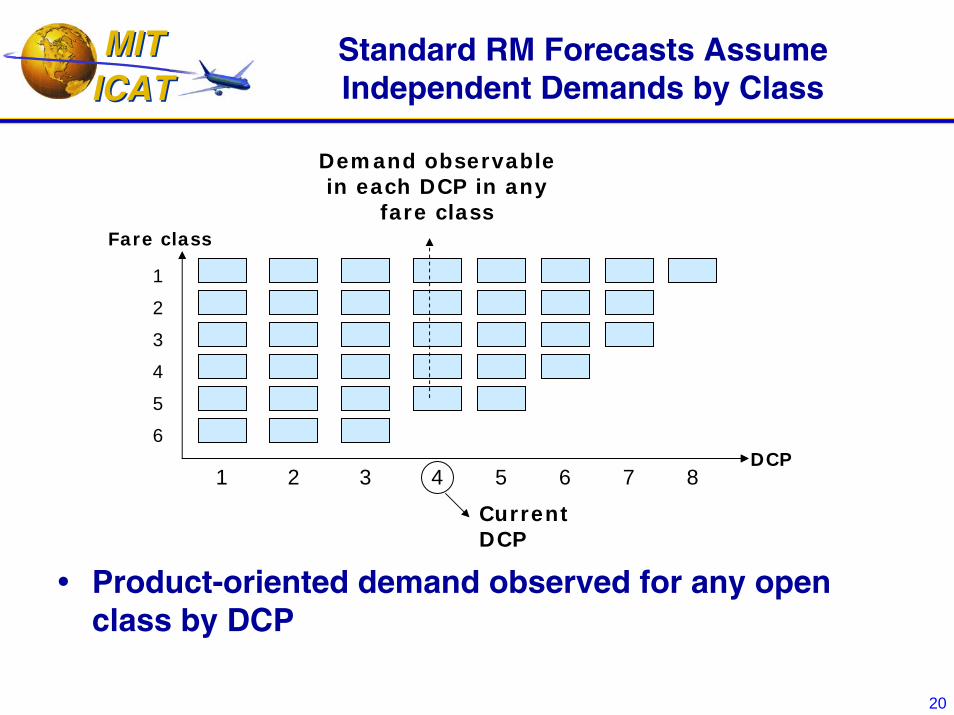
Standard RM Forecasts Assume Independent Demands by Class
Demand observable in each DCP in any
fare classFare class
DCP6
5
4
3
2
1
1 2 3 4 5 6 7 8
Current DCP
Product-oriented demand observed for any open class by DCP
MIT MIT ICAT ICAT
21
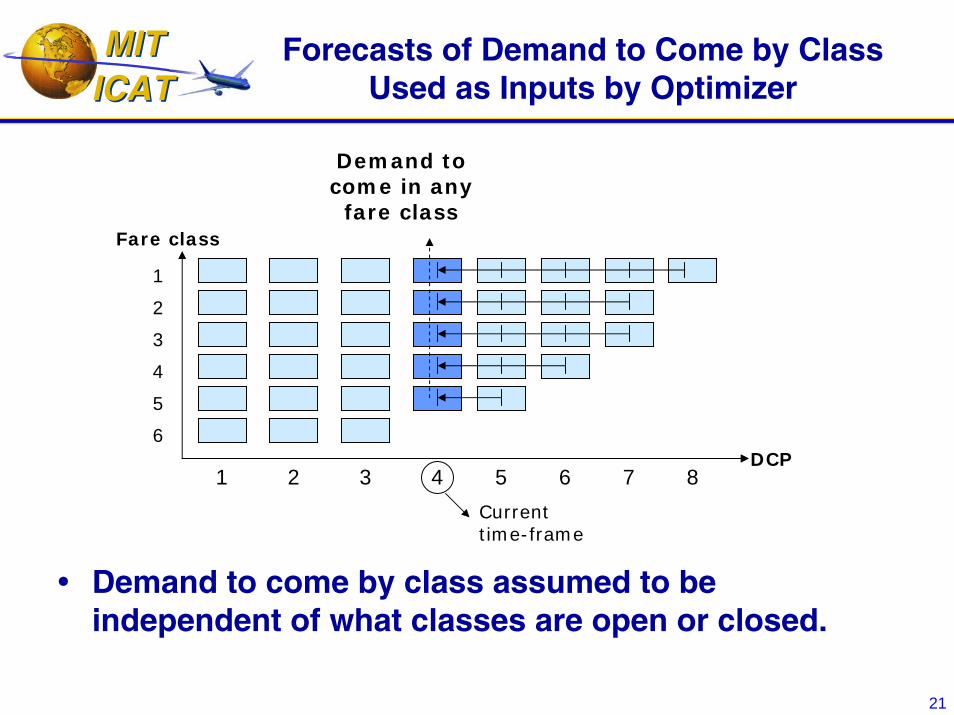
Forecasts of Demand to Come by Class Used as Inputs by Optimizer
Demand to come in any
fare classFare class
DCP6
5
4
3
2
1
1 2 3 4 5 6 7 8
Current time-frame
Demand to come by class assumed to be independent of what classes are open or closed.
MIT MIT ICAT ICAT
22
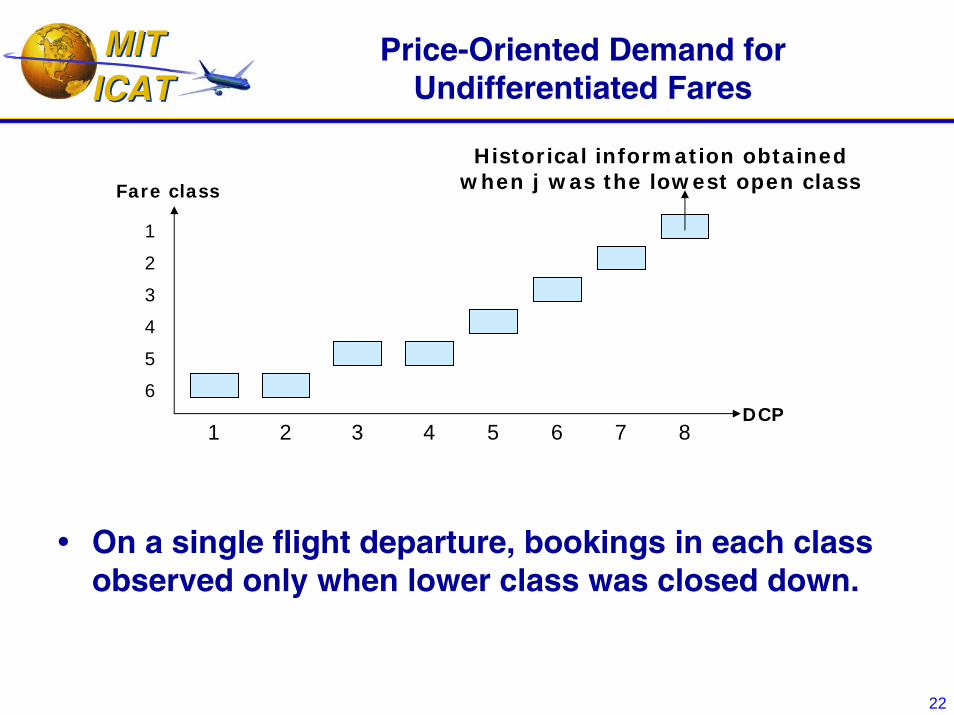
Price-Oriented Demand for Undifferentiated Fares
Fare class
On a single flight departure, bookings in each class observed only when lower class was closed down.
DCP
Historical information obtained when j was the lowest open class
1 2 3 4 5 6 7 8
1
2
3
4
5
6
MIT MIT ICAT ICAT
23
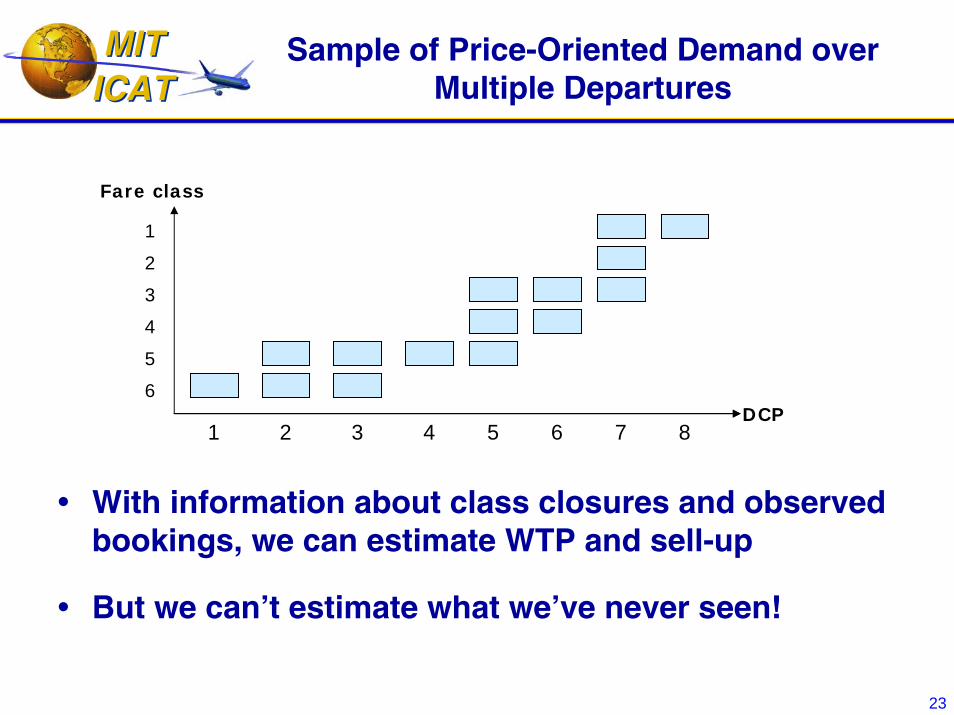
Sample of Price-Oriented Demand over Multiple Departures
Fare class
With information about class closures and observed bookings, we can estimate WTP and sell-up
But we can’t estimate what we’ve never seen!
DCP1 2 3 4 5 6 7 8
1
2
3
4
5
6
MIT MIT ICAT ICAT
24
Factors Affecting WTP Estimates
Time to departureBusiness travelers with higher WTP book closer to departure date
Peak vs. off-peak periodsHigher demand periods tend to have higher WTP
Market characteristicsLimited competition and low capacity (relative to demand) means a higher WTP among consumers
RM seat availability – your own and your competitors’Weak RM controls on previous flights mean historical bookings don’t reflect higher WTP of consumersHigh availability of low-fare seats on competitor makes it difficult (impossible) to observe high-fare bookings
MIT MIT ICAT ICAT
25
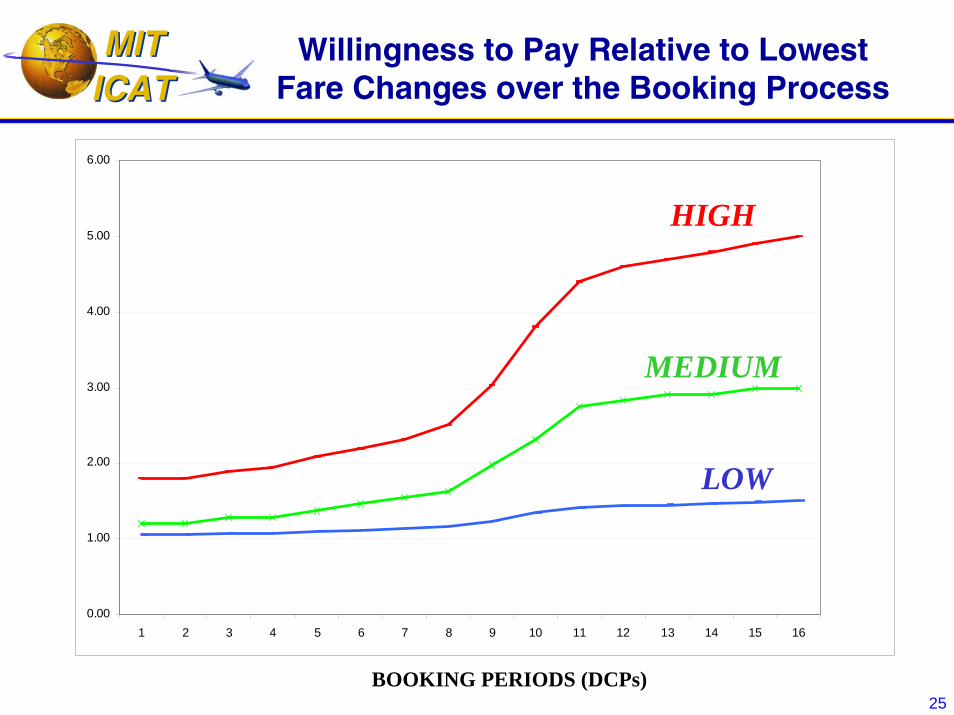
Willingness to Pay Relative to Lowest Fare Changes over the Booking Process
0.00
1.00
2.00
3.00
4.00
5.00
6.00
1 2 3 4 5 6 7 8 9 10 11 12 13 14 15 16
HIGH
MEDIUM
LOW
BOOKING PERIODS (DCPs)
MIT MIT ICAT ICAT
26
WTP Estimates are Critical to Effective RM under Simplified Fares
Nothing simple about RM models required by these simplified fare structures
Traditional RM methods do not maximize revenuesWithout forecasting modifications, even O+D control gains are affected
New approaches to “hybrid” forecasting of price- vs. product-oriented demand show good potential
Significant revenue gains over standard forecasting methods
Recent PODS research shows potential for conditional WTP estimates:
Requires separate estimation of WTP for each scenario of class closure, for own airline and potentially competitor(s)


![$ EDUCATIONAL FACILITIES REVENUE [AND REVENUE REFUNDING… · EDUCATIONAL FACILITIES REVENUE [AND REVENUE REFUNDING] ... Educational Facilities Revenue [and Revenue ... Aeronautical](https://img.pdfslide.us/doc/110x75/5b16e1207f8b9a686d8e7aa7/-educational-facilities-revenue-and-revenue-refunding-educational-facilities.jpg)