Embed Size (px)
Citation preview

Willamette Post Office Bar Sampled February 11, 2009
________________________________________________ WILLAMETTE RIVER FNC
POST OFFICE BAR REACH (RM 2.2) SEDIMENT QUALITY EVALUATION
REPORT
Number 01 Core – 10.2’ Recovery
February 2009
Prepared by: Tim Sherman
Technical Review
Mark Siipola
Portland District Corps of Engineers CENWP-EC-HR

ACRONYMS
Ag Silver As Arsenic Cd Cadmium CERCLA Comprehensive Environmental Response, Compensation, and Liability Act CoC Contaminate of concern Cr Chromium CRCIP Columbia River Channel Improvement Project CRD Columbia River Datum CRM Columbia River Mile Cu Copper CY Cubic Yard(s) DDT Dichlorodiphenyltrichloroethane DEQ Oregon Department of Environmental Quality DMEF Dredge Material Evaluation Framework DMMP Dredge Material Management Plan DP Dredge Prism DQO Data Quality Objectives EPA Environmental Protection Agency FNC Federal Navigation Channel Hg Mercury J Laboratory estimated value detected between MRL & MDL MDL Method Detection Limit MLLW Mean Lower Low Water MRL Method Reporting Limit ND Non-detected at MRL or MDL NSM New Surface Material - Exposed Surface after dredging Ni Nickel OSM Oregon Steel Mill PAH Polynuclear Aromatic Hydrocarbon Pb Lead PCB Polychlorinated Biphenyl PQL Practical Quantitation Limit PRG Project Review Group (federal and state agencies) QA/QC Quality Assurance/Quality Control RM River Mile SAP Sampling and Analysis Plan Sb Antimony SEF Sediment Evaluation Framework SL Screening Level(s) TBT Tributyltin TEL Threshold Effects Level Tier II Physical (a) & Chemical (b) analyses Tier III Bioassay & Bioaccumulation analyses TOC Total Organic Carbon U Laboratory non-detect at MRL or MDL USFWS U. S. Fish & Wildlife Service WDOE Washington Department of Ecology WDNR Washington Department of Natural Resources Zn Zinc ∑ DDT Total value (i.e. DDT + DDE + DDD)
ii

Table of Contents
ABSTRACT..........................................................................................................................1
INTRODUCTION................................................................................................................2
Sampling and Analysis Objectives......................................................................................2
PREVIOUS STUDIES.........................................................................................................3
CURRENT SAMPLING EVENT DISCUSSION .............................................................4
Planning Team and Responsibilities ..................................................................................5
Table 1: Planning Team ......................................................................................................5
Location.................................................................................................................................5
Table 2: Sampling Station Coordinates NAD 83, Oregon State Plane North ................6
COORDINATION ...............................................................................................................6
SAMPLING AND ANALYSIS REQUIREMENTS .........................................................6
Ranking .................................................................................................................................6
Sampling Requirements ......................................................................................................6
Sampling Device ...................................................................................................................7
Sediment Disposal ................................................................................................................7
RESULTS .............................................................................................................................7
Physical-Grain-size (ASTM D422) .....................................................................................7
Metals (EPA methods 6010B/6020/7471/7742), Total Organic Carbon (method 9060) 7
Pesticides/PCBs (EPA method 8081/8082).........................................................................7
Chlorinated Hydrocarbons, Phenols, Phthalates and Miscellaneous Extractables (EPA methods 8151/8270) ..................................................................................................7
Polynuclear Aromatic Hydrocarbons (PAHs) (EPA method 8270C) .............................8
Total Petroleum Hydrocarbons (TPHs) (NWTPH Method)............................................8
Organotin (Tributyltin) (Krone Method) ..........................................................................8
iii

Table of Contents
iv
Volatile Organic Compounds (VOCs) (Method 8260B) ...................................................8
CONCLUSION.....................................................................................................................8
REFERENCES...................................................................................................................10
Table 3: Physical – Grain Size ..........................................................................................12
Table 4: Inorganic Metals and Total Organic Carbon...................................................13
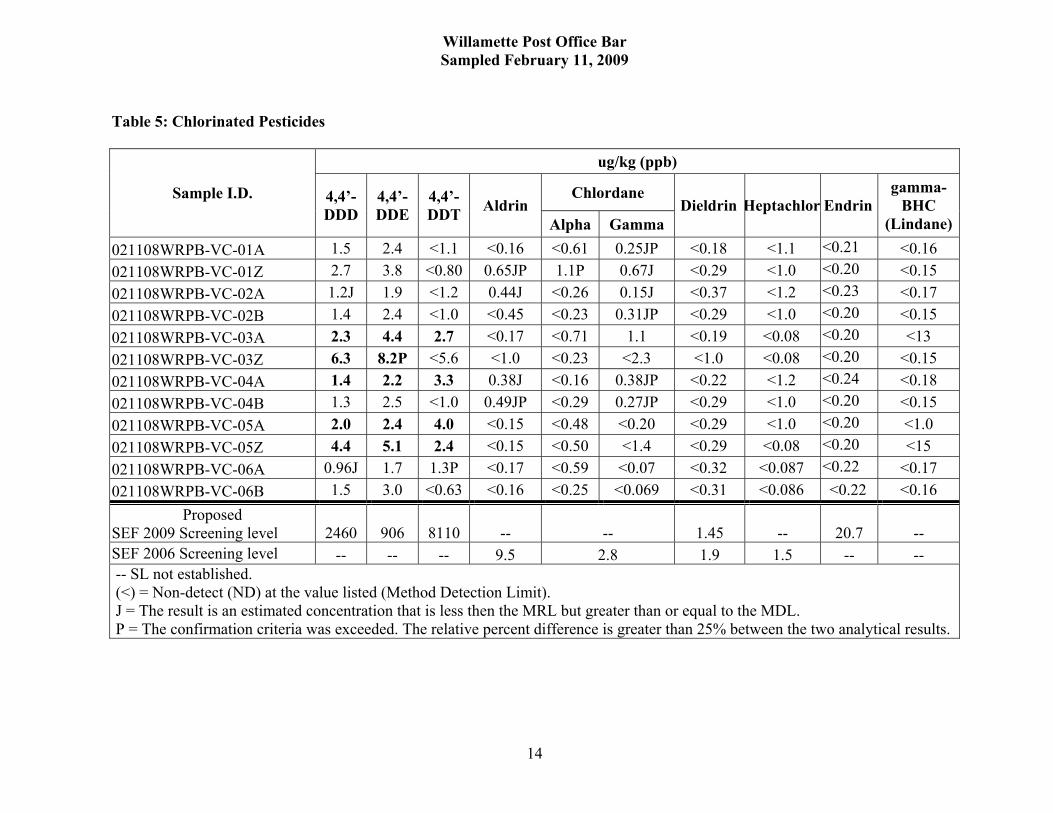
Table 5: Chlorinated Pesticides ........................................................................................14
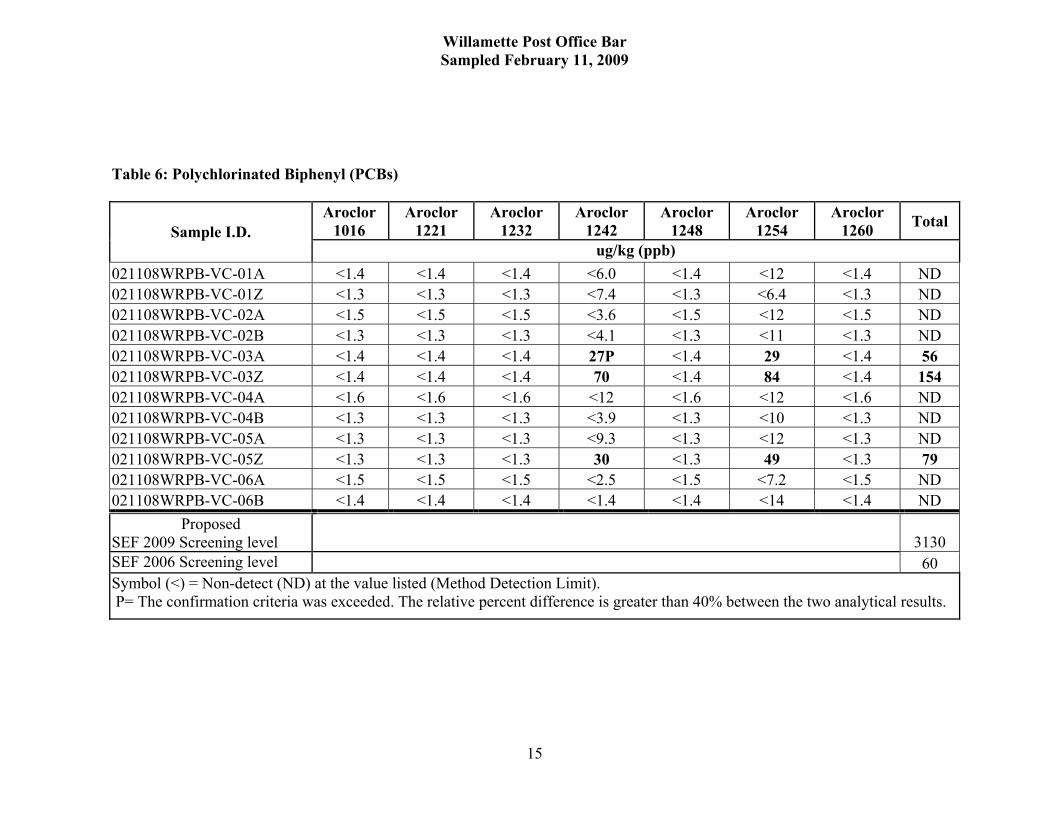
Table 6: Polychlorinated Biphenyl (PCBs) ......................................................................15
Table 7: Chlorinated Hydrocarbons ................................................................................16
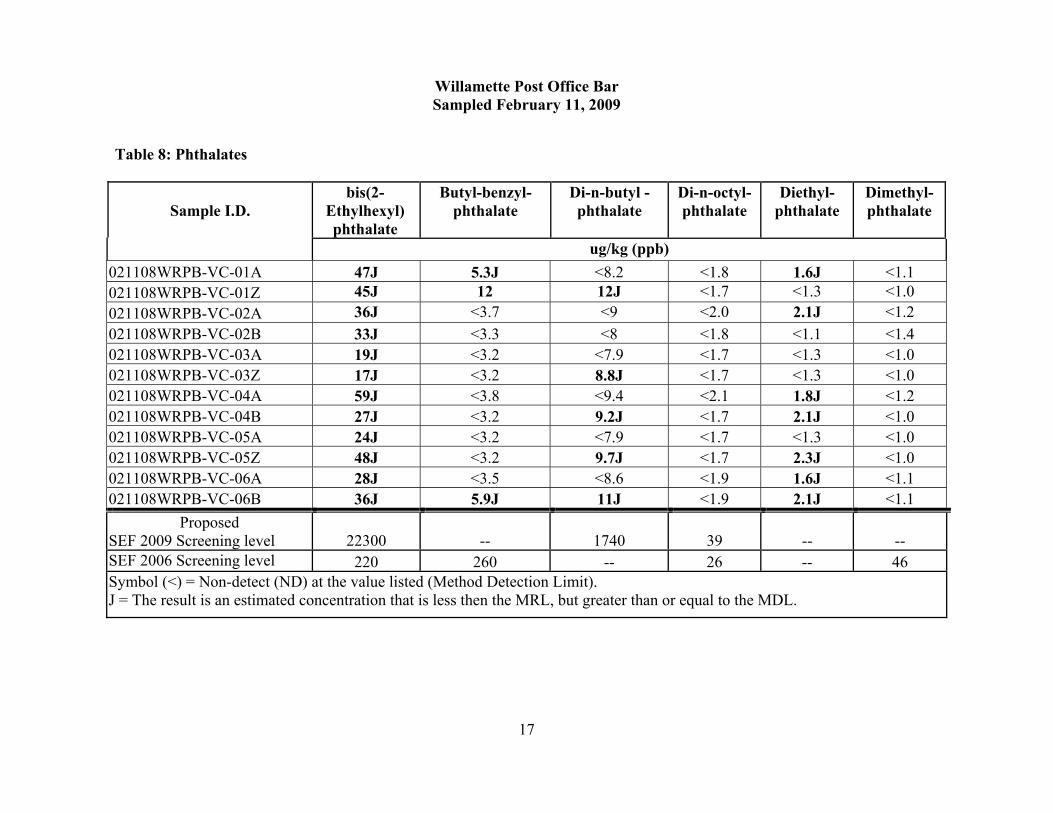
Table 8: Phthalates.............................................................................................................17
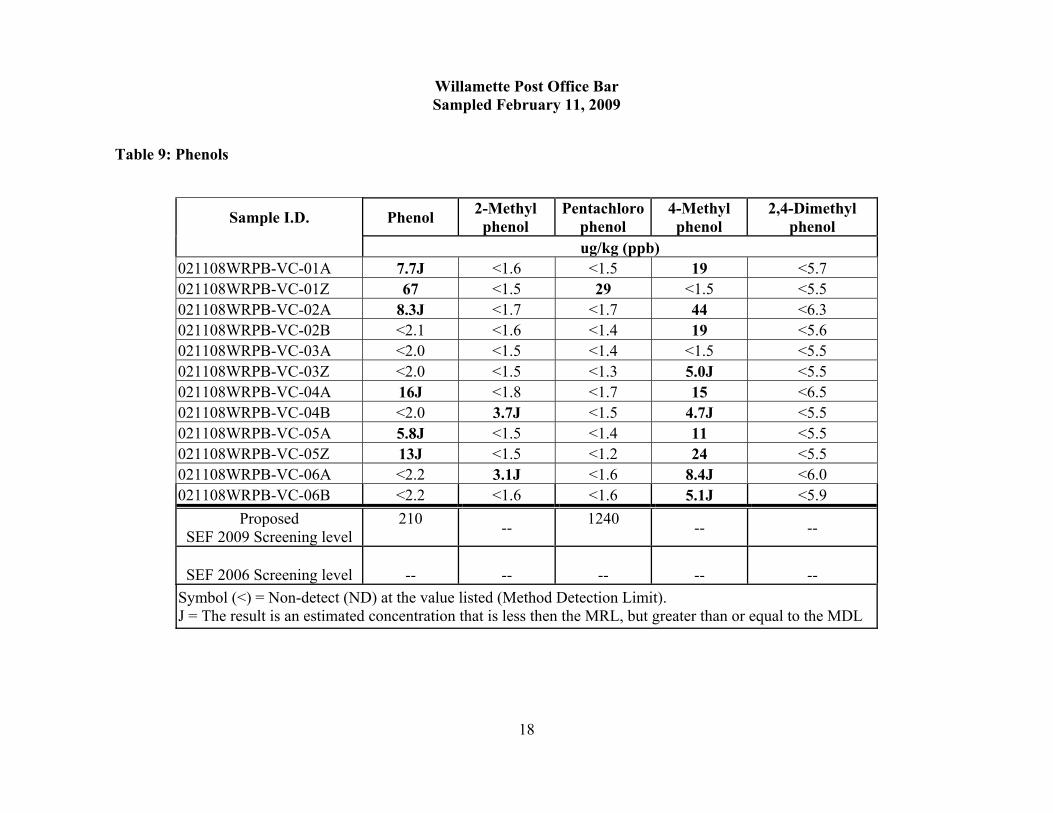
Table 9: Phenols .................................................................................................................18
Table 10: Miscellaneous Extractables ..............................................................................19
Table 11: Polynuclear Aromatic Hydrocarbons (PAHs), Low Molecular Weight Analytes...............................................................................................................................20
Table 12: Polynuclear Aromatic Hydrocarbons (PAHs), High Molecular Weight Analytes...............................................................................................................................21
Table 13: Petroleum..........................................................................................................22
Table 14: Organotin (Tributyltin) ...................................................................................23
Table 15: Volatile Organic Compounds..........................................................................24
Figure 1: Willamette River, Post Office Bar, Vicinity Map...........................................25
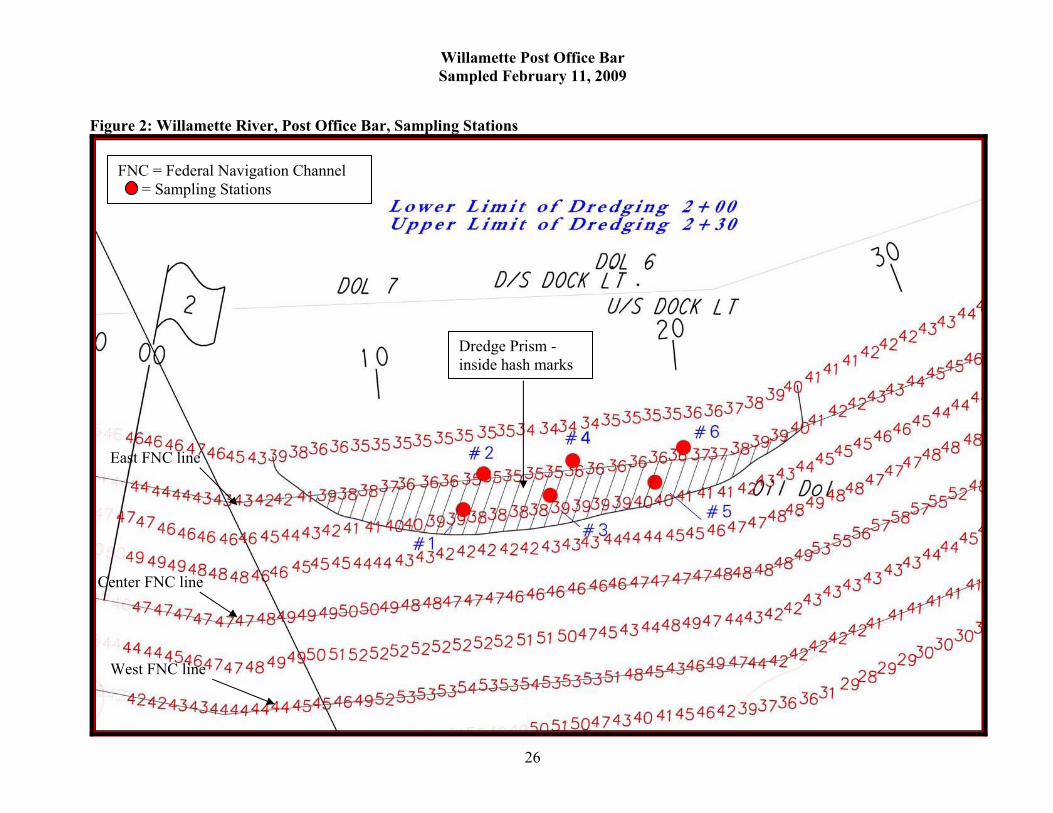
Figure 2: Willamette River, Post Office Bar, Sampling Stations ..................................26
Figure 3: Historic Sampling Stations 1999 & 2004 Reports ..........................................27
Figure 4: Historic Sampling Stations 2006 Report .........................................................28

Willamette Post Office Bar Sampled February 11, 2009
ABSTRACT The Willamette River federal navigation channel (FNC) project is 11.6 miles long; from the confluence with the Columbia River (RM 0.0) to near the Broadway Bridge in Portland, Oregon. Congressional authorization is to a depth of 43-feet (-43-feet CRD) (plus 2-feet advanced maintenance) and a 600 to 1,900-ft. width, but it is currently maintained to a 40-ft. depth (plus 2-feet advanced maintenance), with an “as needed” width for users. Dredging is being requested by the Columbia River Pilots (ref. October 8, 2004 letter). It should, also, be noted that this material was last dredged in 1997 and all sampling event data from 1998 to 2006 (listed above) represents the material currently in need of dredging. The current need for characterization stems from proposed dredging within the study area of the Portland Harbor superfund. The entire river within the study area (confluence to the falls) has been classified with a ranking of “high” unless the existing data can provide a weight of evidence for a lower ranking. Recency of data within a high ranked area is 2-years. The current characterization is being done to fulfill the recency of data requirement even though the existing data would allow for a “low” ranking, as material has passed SEF guidance for 2 separate (1999 & 2004) rounds of bioassay testing. The material characterized in this report is for sediment shoals, within the FNC, at approximate river mile (RM) 2.1-2.4, Post Office Bar. The proposed dredging prism (DP) varies from 4 to 7-feet deep, which includes 2-feet advanced maintenance and contains approximately 50,000 CY of silt, with approximately 10% sand. A total of six (6) vibra-core samples were collected February 11, 2009. Three (3) cores were collected in the dredging prism (DP) and were retained as discrete samples, which were then divided to represent the dredging prism and the new surface material (NSM). Three (3) additional vibra-core samples were collected just shoreward of the DP to represent the potential sloughing materials; surface material and the area below that which might have the potential to slough. The physical analyses classified material as elastic silt with 89.4% fines and 10.6% sand, with mean grain-size of 0.024 mm and 2.47% total organic carbon; ranging from 1.97% to 2.94 % (Table 3and 4). Chemical data from this sampling event are presented in tables 2 – 12. The Clean Water Act (CWA) requires characterization of sediment prior to dredging and disposal. Regional guidance developed to implement the CWA is the Sediment Evaluation framework (SEF), which is currently in the process of being updated. Screening levels to evaluate freshwater sediment have not been published in the 2009 SEF, currently under public review. Some freshwater SL numbers have been calculated based on biological testing results and will be presented later in the spring of 2009. The SLs being proposed (2009 SL) are included in the data tables along with the 2006 interim SEF screening levels.
1

Willamette Post Office Bar Sampled February 11, 2009
Some chemical data results exceed the interim 2006 SLs in one or more samples for Cd, Zn, DDT, PCBs and PAHs, but do not exceed any of the proposed 2009 screening levels (see data Tables 3-15). INTRODUCTION This report outlines the characterization of the sediment within the Willamette River FNC at Post Office Bar for the purposes of dredging and disposal. The sampling and analysis objectives are stated in the RRG approved Sampling and Analysis Plan (SAP January 2009), and are also listed below. This report will outline the procedures used to accomplish these objectives. Sampling and Analysis Objectives
Characterize sediments in accordance with the regional and national dredge material testing manual protocols:
o Sediment Evaluation Framework (SEF), regional guidance for the Clean Water
Act. o Data results are compared to both the Interim 2006 SEF and updated 2009 SEF
version, with proposed 2009 screening levels added. o The Evaluation of Dredged Material Proposed for Disposal at Island,
Nearshore, or Upland Confined Disposal Facilities – Testing manual (Upland Testing Manual).
o ODEQ -NWR Clean Fill Screening Table for Unrestricted Upland Disposal Greater than 100 Feet from a Surface Water Body.
Collect, handle and analyze representative sediment from the Willamette River FNC at
Post Office Bar reach in accordance with protocols and Quality Assurance/Quality Control (QA/QC) requirements.
Characterize sediments to be dredged for disposal and the new surface following
dredging. Material will be compared to the open-inwater screening levels, but material management is planning upland placement at the Port of Portland’s West Hayden Island disposal facility; material will be placed upland without return water.
Analyze for full suite of physical parameters for the dredging prism samples and
chemical parameters as outlined the SEF for samples within the channel proposed for dredging; including potential sloughing material and evaluate the surface exposed after dredging is complete. SEF – Table 7.2 contains the list of analytes, methods of analysis and reporting limits required.
2

Willamette Post Office Bar Sampled February 11, 2009
PREVIOUS STUDIES 1996 TBT was detected in all of the samples testing for total (bulk) TBT, but was below the level of concern and the material approved for in-water disposal (last time Willamette FNC was dredged). 1997 The sediment-sampling event for Columbia River Channel Deepening Feasibility Study (currently CRCIP) collected 1 surface sample at RM 2.05 (WR-BC-09) mid-channel. Results did not exceed any DMEF screening levels for unconfined in-water placement. 1998 During permit dredging (around the water intake) at the Oregon Steel Mill (OSM) dock (RM 2.2), an oil sheen was detected on the water surface during the dredging activity, the site was contained and all dredging was suspended. The OSM dredging area is approximately 750 feet to the east of where the sediment shoal evaluated in the April 1999 sampling event is located. April 1999 Two (2) vibra-core samples were collected from the Post Office Bar shoal. These cores penetrated into what will be the new surface material (NSM) following dredging and was included as part of the dredging prism analyses. The grain-size for these 2 cores averaged 29.3% sand and 70.7% fine-grained material. The results were compared to the screening levels (SL) found in the 1998 DMEF. In the 02 sample DDT analytical results exceeded SLs total DDT (6.9ug /kg) at 11.3 ug/kg (2006 SEF has no SL for DDT). The laboratory detection level for TBT was 0.17ug/L; although it wasn’t detected, the detection level exceeded the SL of 0.15 ug/L (2006 SEF has no porewater SL; it has total TBT of 75 ug/kg SL). It was determined that further characterization was needed; scheduled for November 1999. November 1999 A vibra-core sediment sample was collected at the 02 sampling station where TBT and DDT analytical levels were in need of further characterization (See April 1999). These cores penetrated into what will be the new surface material (NSM) following dredging and was included as part of the dredging prism analyses. Enough sediment was collected to re-run physical and chemical, with additional volume collected to run bioassays. The grain-size for this core was 19.6% sand and 80.4% fine-grained material. Analytical results showed all chemicals of concern were below their respective SLs; all bioassays passed the DMEF guidance (and current SEF guidance) for unconfined in-water placement. Hart Crowser for USACE 2004 As part of the operation and maintenance characterization, three (3) vibra-cores were collected from the Post Office Bar shoal and composited for one analysis. These cores penetrated into what will be the new surface material (NSM) following dredging and was included as part of the dredging prism analyses. The grain-size for this composite core was 16.2% sand and 83.8% fine-grained material. The result of the chemical analyses indicated a total DDT value of 14.3 ug/kg, which was the only DMEF SL exceedance (2006 SEF has no SL for DDT). Bioassay results: all 10-day Hyalella azteca and 10-day Chironomus tentans bioassay test results passed the DMEF guidance (and current SEF guidance) for unconfined in-water placement.
3

Willamette Post Office Bar Sampled February 11, 2009
Tetra Tech for USACE 2006 In this study, the LWR FNC was divided into reaches including a reach encompassing Post Office Bar (WRM 0 to 3). On the eastside of the FNC at the Post Office Bar shoal, currently proposed for dredging, two surface samples were collected in 2005. This material was collected to characterize the material that had potential to slough into the channel if dredging occurred. The grain-size for these 2 surface samples averaged 4.8% sand and 95.2% fine-grained material, with all chemistry below their respective 2006 SEF screening levels. CURRENT SAMPLING EVENT DISCUSSION Dredging is being requested by the Columbia River Pilots (ref. October 8, 2004 letter). It should, also, be noted that this material was last dredged in 1997 and all sampling event data from 1998 to 2006 (listed above) represents the material currently in need of dredging. The current need for characterization stems from proposed dredging within the study area of the Portland Harbor superfund. The entire river within the study area (confluence to the falls) has been classified with a ranking of “high” unless the existing data can provide a weight of evidence for a lower ranking. Recency of data within a high ranked area is 2-years. The current characterization is being done to fulfill the recency of data requirement even though the existing data would allow for a “low” ranking, as material has passed SEF guidance for 2 separate (1999 & 2004) rounds of bioassay testing. The proposed dredging is for sediment shoals on the east side of the FNC, at approximate river mile (RM) 2.1-2.4, Post Office Bar. The proposed dredging prism (DP) varies from 4 to 7-feet deep, which includes 2-feet advanced maintenance and contains approximately 50,000 CY of silt with sand. Three (3) full length vibra-core samples were taken to 1-foot (or more) below the dredging prism as planned, with an additional 3 shorter (5-foot) vibra-core samples collected at the shoreward boundary of the dredge prism, to represent the material that could potentially slough in to the channel following dredging. Each of the 6 vibra-core samples was divided horizontally for a total of 12 discrete analyses; 3 analyses will represent each of the following:
Dredging prism New surface material (NSM) Potential surface sloughing material Potential at depth sloughing material (see Figure 2)
The six (6) vibra-core samples were collected February 11, 2009. The three (3) cores collected in the dredging prism (DP) had recoveries from 8.9’to 10.2’. The dredging prism in the study area varies from 4’ to 7’, which includes authorized advanced maintenance and precision of dredging considerations. Each of the 3 cores collected in the DP were retained as discrete samples, which were then divided to represent the dredging prism and the new surface material (NSM). The three (3) additional vibra-core samples were collected just shoreward of the DP to represent the potential sloughing materials, which were, also, divided horizontally to represent the surface material and the area below that which might have the potential to slough (cores recoveries from 5.3’ to 5.6’). All 12 sub-samples were then submitted for all standard SEF chemical parameters and because this material is scheduled to be placed upland ODEQ’s clean-fill screening list. Only three (3) samples were submitted for
4

Willamette Post Office Bar Sampled February 11, 2009
organotin (TBT) and volatile analyses. The dredge prism samples (3) and the 3-cores outside the DP were submitted for physical analyses (total of 6) were submitted for physical analyses. The physical analyses classified material as elastic silt with 89.4% fines and 10.6% sand, with mean grain-size of 0.024 mm and 2.47% total organic carbon; ranging from 1.97% to 2.94 % (Table 3). Chemical data from this sampling event are presented in Tables 4 – 15. The Clean Water Act (CWA) requires characterization of sediment prior to dredging and disposal. Regional guidance developed to implement the CWA is the Sediment Evaluation Framework (SEF), which is currently in the process of being updated. Screening levels to evaluate freshwater sediment have not been published in the 2009 SEF currently under public review. Some freshwater SL numbers have been calculated based on biological testing results and will be presented later in the spring of 2009. The SLs being proposed (2009 SL) are included in the data tables along with the 2006 interim SL values. The chemical data results exceed the interim 2006 SLs in one or more samples for Cd, Zn, DDT, PCBs and PAHs, but do not exceed any of the proposed 2009 screening levels (see data Tables 4-15).
Planning Team and Responsibilities
Table 1 lists the Project Team’s duties and responsibilities for the sediment-sampling project at the Willamette River (RM 2.1-2.4) Post Office Bar Reach.
Table 1: Planning Team
Task/Responsibility CENWP
Tim Sherman CENWP
Donna Ebner Contractor(s) CENWP
Mark Siipola
Overall Project Management X
Sampling Plan Development X
Agency Coordination X X
Positioning/Log Record X X
Sediment Sampling X X X
Physical Analysis X
Chemical Analysis X
Final Report X
Technical Review X
Vibra Core Equipment X
Boat & Operator X
Location
Table 2 lists the actual sampling coordinates at the Willamette River (RM 2.1-2.4) Post Office Bar (POB) (see Figure 2). Coordinates are based on the Lambert Projection for Oregon;
5

Willamette Post Office Bar Sampled February 11, 2009
North Zone (NAD 83, U.S. Survey Feet), Datum is Columbia River Datum (CRD). CRD is 1.40 feet above National Geodetic Vertical Datum at Willamette River mile 0.4, 1947 adjustment).
Table 2: Sampling Station Coordinates NAD 83, Oregon State Plane North
Sample ID Latitude Longitude
021108WRPB-VC-01 45º 37’ 50.0” 122º 47’ 20.4”
021108WRPB-VC-02 45º 37’ 49.0” 122º 47’ 19.4”
021108WRPB-VC-03 45º 37’ 47.3” 122º 47’ 21.6”
021108WRPB-VC-04 45º 37’ 46.3” 122º 47’ 20.5”
021108WRPB-VC-05 45º 37’ 44.0” 122º 47’ 23.0”
021108WRPB-VC-06 45º 37’ 42.6” 122º 47’ 22.1”
COORDINATION
All aspects of the sampling and analysis plan (SAP) and the sediment evaluation report have been coordinated with the Project Review Group (PRG) consisting of these federal and state service agencies EPA, National Marine Fisheries Service (NMFS), US Fish and Wildlife (USF&W), Oregon Department of Environmental Quality (ODEQ) and Washington Department of Ecology (WDOE).
SAMPLING AND ANALYSIS REQUIREMENTS
Ranking
The Post Office Bar Reach (WRM 2.2) is within the designated study area for the Portland Harbor CERCLA (Super Fund) site. Any area within the Super Fund study area is automatically considered high ranked by the PRG unless sufficient data exists to demonstrate another ranking applies. Historic data for ∑ DDT has exceeded the 6.9 ug/kg screening level adopted as an interim guideline by the PRG until an acceptable freshwater guideline was developed as part of the SEF (see proposed 2009 levels in data tables). However, 2 rounds (1999 & 2004) of subsequent sampling have passed bioassays testing, justifying a low ranking. Material is schedule to go upland at the Port of Portland’s West Hayden Island disposal site.
Sampling Requirements
Sampling requirements depend on: type of sediment (heterogeneous or homogeneous) grain-size organic content volume of sediment to be dredged level of contamination (ranking in the SEF) depth of dredging prism
6

Willamette Post Office Bar Sampled February 11, 2009
need to characterize the new surface material after dredging need to characterize the potential sloughing material
Sampling Device
The sampling device of choice was a 4“diameter vibra-core sampler; allowing for both a full length dredging prism core and new surface material (NSM) characterization. No difficulties were encountered in coring sediments at Post Office Bar during this sampling event.
Sediment Disposal A management decision has been made to place the dredge material upland at the Port of Portland’s West Hayden Island disposal facility. Due to the size of the facility all water transported to the disposal site will be contained at the disposal site, no water will return to the river. RESULTS Physical-Grain-size (ASTM D422) Six (6) samples were submitted for physical analyses, with data presented in Table 3. The mean grain-size for all samples was 0.024 mm, with 10.6% sand and 89.4% fines. Material was classified as elastic silt. Metals (EPA methods 6010B/6020/7471/7742), Total Organic Carbon (method 9060) Twelve (12) sub-samples were submitted for metals and TOC testing, with data presented in Table 4. The TOC analyses ranged from 1.97% to 2.94%. One (1) sample (3Z) exceeded the SEF 2006 SL (1.1 mg/kg) for cadmium (Cd) at 1.49 mg/kg (proposed 2009 SEF SL is 6.3 mg/kg). Two (2) samples (3Z and 5Z) exceeded the SEF 2006 SL (130 mg/kg) for zinc (Zn) at 226 and 156 mg/kg respectively (proposed 2009 SEF SL is 3190 mg/kg). All other metal analytical results were below both the 2006 and the 2009 (proposed) SEF screening levels. Pesticides/PCBs (EPA method 8081/8082) Twelve (12) sub-samples were submitted for pesticides/PCBs, with data presented in Table 5 and 6. DDT and its breakdown products were detected in all of the samples. The highest level detected was 14.5 ug/kg ∑ DDT. This level is similar to the level found in the 2004 sampling event (14.3 ug/kg), which passed (see SEF) bioassay analyses. Total PCBs were detected above the 2006 SEF screening level of 60 ug/kg, but below the proposed 2009 screening level of 3130 ug/kg, at 154 ug/kg and 79 ug/kg in samples 3Z and 5Z respectively. Chlorinated Hydrocarbons, Phenols, Phthalates and Miscellaneous Extractables (EPA methods 8151/8270) Twelve (12) sub-samples were submitted for chlorinated hydrocarbons, phthalates, phenols and miscellaneous extractables, with data presented in Table 8, 9 and 10. None of these analytes were detected in any of the samples at levels approaching their respective screening levels in either the 2006 or proposed 2009 SEF.
7

Willamette Post Office Bar Sampled February 11, 2009
Polynuclear Aromatic Hydrocarbons (PAHs) (EPA method 8270C) Twelve (12) sub-samples were submitted for low and high molecular weight PAHs, with data presented in Table 11 and 12. All samples contained Low density PAHs and High density PAHs. The sum of Benzo (b+k)-fluoranthene detected in the 5Z sample totaled 700 ug/kg, which exceeds the 2006 SEF screening level of 600 ug/kg. The proposed 2009 SEF screening levels do not have individual analyte SLs, but has a combined LPAH and HPAH total of 7610 ug/kg. The screening level (proposed 2009 SEF) for total PAHs was not exceeded in the results of the 5Z sample. Total Petroleum Hydrocarbons (TPHs) (NWTPH Method) Twelve (12) sub-samples were submitted for TPHs, with data presented in Table 13. No gasoline TPHs were detected in any of the samples. Diesel range organic (DRO) and residual range organics (RRO) were detected in all but 1 sample. The 2006 SEF does not nave any SLs established for TPH. The proposed 2009 SEF SLs were not approached in any of the sample data results. Organotin (Tributyltin) (Krone Method) Three (3) sub-samples were submitted for total organotin analyses, with data presented in Table 14. Low levels of tributyltin and dibutyltin were detected in the dredging prism and in the potential sloughing material. None of the organotin detected in these areas approached either the 2006 or proposed 2009 SEF screening levels. Volatile Organic Compounds (VOCs) (Method 8260B) Three (3) samples from the dredging prism were submitted for total VOC analyses, with data presented in Table 12. This method was run for DEQ’s upland solid waste disposal criteria; there are no SEF screening levels for these analytes. No levels of concern were detected. CONCLUSION This evaluation was conducted following procedures set forth in the Sediment Evaluation Framework (SEF), which is consistent with the federal guidance in the Inland Testing Manual. The SEF was developed jointly with regional federal and state agencies to address environmental issues associated with dredging and sediment management, which is currently in the process of being updated. This document is a guideline for implementing the Clean Water Act (40 CFR 230), Section 404 (b) (1). Dredging is being requested by the Columbia River Pilots (ref. October 8, 2004 letter). It should, also, be noted that this material was last dredged in 1997 and all sampling event data from 1998 to 2006 (listed above) represents the material currently in need of dredging. The current need for characterization stems from proposed dredging within the study area of the Portland Harbor superfund. The entire river within the study area (confluence to the falls) has been classified with a ranking of “high” unless the existing data can provide a weight of evidence for a lower ranking. Recency of data within a high ranked area is 2-years. The current characterization is being done to fulfill the recency of data requirement even though the existing data would allow for a “low” ranking, as material has passed SEF guidance for 2 separate (1999 & 2004) rounds of bioassay testing.
8

Willamette Post Office Bar Sampled February 11, 2009
9
A total of six (6) vibra-core samples were collected February 11, 2009. Three (3) cores were collected in the dredging prism (DP) and were retained as discrete samples, which were then divided to represent the dredging prism and the new surface material (NSM). Three (3) additional vibra-core samples were collected just shoreward of the DP to represent the potential sloughing materials; surface material and the area below that which might have the potential to slough. All method detection levels (MDLs) were well below the Sediment Evaluation Framework (SEF) screening levels (SL). The physical analyses classified material as elastic silt with 89.4% fines and 10.6% sand, with mean grain-size of 0.024 mm and 2.47% total organic carbon; ranging from 1.97% to 2.94 %. Sediment results were compared to both the Interim 2006 SEF screening levels and the proposed 2009 SEF screening levels. The proposed 2009 freshwater SL numbers have been calculated based on biological testing results and will be presented later in the spring of 2009. The chemical data results exceed the interim 2006 SLs in one or more samples for Cd, Zn, DDT, PCBs and PAHs, but do not exceed any of the proposed 2009 screening levels (see data tables 4-15). The data results will be discussed internally within the Corps and with state and federal agencies to determine the necessary protocol for dredging and disposal and will be added to this report when a consensus is determined.

Willamette Post Office Bar Sampled February 11, 2009
REFERENCES
1. U.S. Army Corps of Engineers, NW Division, Portland District and Seattle District; U.S. Environmental Protection Agency, Region 10; Oregon Department of Environmental Quality; Idaho Department of Environmental Quality; Washington State Department of Natural Resources and Department of Ecology, NOAA fisheries and US Fish and Wild Life. 2006 Interim Final. Sediment Evaluation Framework.
2. U.S. Army Corps of Engineers, Engineer Research and Development Center, January
2003, 3. Evaluation of Dredged material Proposed for Disposal at Island, nearshore, or Upland
confined Disposal Facilities- Testing manual
4. U.S. Environmental Protection Agency and U.S. Army Corps of Engineers. February 1998. Evaluation of Dredged Material Proposed for Discharge in Inland and Near Coastal Waters - Testing Manual (referred to as the “Inland Testing Manual”).
5. U.S. Army Corps of Engineers, U.S. Environmental Protection Agency. February 6. 1991. Evaluation of Dredged Material Proposed for Ocean Disposal - Testing 7. Manual (referred to as the OTM or the “Green Book”). U.S. Army Corps of
Engineers. January 2003. Evaluation of Dredged Material Proposed for Disposal at Island, Nearshore, or Upland Confined Disposal Facilities - Testing Manual (referred to as the “Upland Testing Manual”).
8. Clean Water Act, 40 CFR 230 (b)(1), as revised 1977.
9. U.S. Army Corps of Engineers, Portland District. 1988. Results of 1988 Lower
Willamette River Sediment Quality Testing—USACE Portland Districting O&M Dredging.
10. U.S. Army Corps of Engineers, Portland District. 1992. Lower Willamette River
Sediment Evaluation – Portland Harbor.
11. U.S. Army Corps of Engineers, Portland District. 1992. Columbia and Lower Willamette River Project, Lower Willamette River, Portland Harbor Sediment Evaluation, November 1996.
12. U.S. Army Corps of Engineers, Seattle District; U.S. Environmental Protection Agency,
Region 10; Washington State Department of Natural Resources and Washington State Department of Ecology. Dredge Material Evaluation and Disposal Procedures (A Users Manual for the Puget Sound Dredge Disposal Analysis (PSDDA) Program, February 2000.
10

Willamette Post Office Bar Sampled February 11, 2009
11
13. U.S. Environmental Protection Agency. 1989. Interim procedures for estimating risks associated with exposures to mixtures of chlorinated dibenzo-p-dioxins and –dibenzofurans (CDDs and CFDs and 1989 update. U.S. Environmental Protection Agency, Risk Assessment Form, Washington, DC; EPA/625/3-89/016.
14. U.S. Army Corps of Engineers, Portland District. 1999. Columbia and Lower Willamette River Project, Lower Willamette River, Portland Harbor Sediment Evaluation.
15. Moore, D. 2000. Bioassay Report Willamette River Report. February 25, 2000. MEC Analytical Systems, Inc. Carlsbad, CA.
16. U.S. Army Corps of Engineers, Portland District. 2000. Columbia and Lower Willamette River Project, Lower Willamette River, Portland Harbor Sediment Evaluation.
17. Hard Crowser for the U.S. Army Corps of Engineers, Portland District. 2004. Columbia and Lower Willamette River Project, Lower Willamette River, Portland Harbor Sediment Evaluation.
18. Tetra Tech for the U.S. Army Corps of Engineers, Portland District. 2006. Columbia and Lower Willamette River Project, Lower Willamette River, Portland Harbor Sediment Evaluation, November 1996
19. Portland District Reports available at https://www.nwp.usace.army.mil/ec/sqer.asp.

Willamette Post Office Bar Sampled February 11, 2009
Table 3: Physical – Grain Size
Percent Area Represented Sample I.D.
Gravel Sand Silt/Clay Grain-size
(μm) 021108WRPB-VC-01A 0.1 16.7 83.4 28.8 021108WRPB-VC-03A 0.2 5.6 94.2 17.3 Dredging Prism
021108WRPB-VC-05A 0.0 6.1 93.9 20.8 021108WRPB-VC-02A 0.0 9.3 90.7 22.8 021108WRPB-VC-04A 0.0 9.1 90.9 24.9
Potential Sloughing Material
021108WRPB-VC-06A 0.0 16.6 83.5 29.5 Mean 0.05 10.55 89.40 24.0
12

Willamette Post Office Bar Sampled February 11, 2009
Table 4: Inorganic Metals and Total Organic Carbon
Sb As Ba Cd Cr Cu Pb Hg Ni Se Ag Zn TOCSample I.D.
mg/kg (ppm) %
021108WRPB-VC-01A 0.16 3.2 176 0.264 24.7 35.9 12.2 0.058 21.7 0.16 0.226 89.0 2.78
021108WRPB-VC-01Z 0.26 2.7 154 0.187 22.4 34.4 11.1 0.070 21.0 0.19 0.172 68.9 2.20
021108WRPB-VC-02A 0.19 3.3 162 0.280 23.0 33.7 10.5 0.094 20.3 0.19 0.169 83.8 2.94 021108WRPB-VC-02B 0.18 3.2 174 0.231 24.8 35.1 11.0 0.052 21.9 0.16 0.203 82.8 2.58
021108WRPB-VC-03A 0.17 3.1 174 0.223 24.4 37.0 14.5 0.075 21.8 0.24 0.198 87.1 2.06
021108WRPB-VC-03Z 0.41 4.2 162 1.49 25.0 40.0 30.5 0.154 20.4 0.21 0.336 226 2.24 021108WRPB-VC-04A 0.22 3.1 171 0.24 22.8 33.1 10.3 0.063 20.3 0.21 0.208 80.4 2.88
021108WRPB-VC-04B 0.21 3.5 178 0.265 26.1 38.1 12.0 0.062 23.2 0.17 0.228 87.5 2.41
021108WRPB-VC-05A 0.15 2.9 163 0.197 23.1 32.1 10.4 0.049 20.5 0.16 0.166 77.2 2.33 021108WRPB-VC-05Z 0.27 3.4 164 0.643 23.6 33.6 27.6 0.093 21.8 0.13 0.374 156 1.97
021108WRPB-VC-06A 0.16 2.9 152 0.188 21.2 30.5 9.73 .005 18.5 0.23 0.145 73.2 2.45
021108WRPB-VC-06B 0.21 3.7 194 0.23 28.2 40.6 12.2 0.061 25.7 0.21 0.227 87.7 2.84
Proposed SEF 2009 Screening level 11.8 7.56 -- 6.3 72.3 1240 -- 0.796 31.3 11.4 1.72 3190 --
SEF 2006 Screening level 20 -- 1.1 95 80 340 0.28 60 -- 2.0 130 -- -- = SL not established.
13
Willamette Post Office Bar Sampled February 11, 2009
Table 5: Chlorinated Pesticides
ug/kg (ppb)
Chlordane Sample I.D. 4,4’- DDD
4,4’- DDE
4,4’- DDT
Aldrin Alpha Gamma
Dieldrin Heptachlor Endringamma-
BHC (Lindane)
021108WRPB-VC-01A 1.5 2.4 <1.1 <0.16 <0.61 0.25JP <0.18 <1.1 <0.21 <0.16
021108WRPB-VC-01Z 2.7 3.8 <0.80 0.65JP 1.1P 0.67J <0.29 <1.0 <0.20 <0.15
021108WRPB-VC-02A 1.2J 1.9 <1.2 0.44J <0.26 0.15J <0.37 <1.2 <0.23 <0.17
021108WRPB-VC-02B 1.4 2.4 <1.0 <0.45 <0.23 0.31JP <0.29 <1.0 <0.20 <0.15
021108WRPB-VC-03A 2.3 4.4 2.7 <0.17 <0.71 1.1 <0.19 <0.08 <0.20 <13
021108WRPB-VC-03Z 6.3 8.2P <5.6 <1.0 <0.23 <2.3 <1.0 <0.08 <0.20 <0.15
021108WRPB-VC-04A 1.4 2.2 3.3 0.38J <0.16 0.38JP <0.22 <1.2 <0.24 <0.18
021108WRPB-VC-04B 1.3 2.5 <1.0 0.49JP <0.29 0.27JP <0.29 <1.0 <0.20 <0.15
021108WRPB-VC-05A 2.0 2.4 4.0 <0.15 <0.48 <0.20 <0.29 <1.0 <0.20 <1.0
021108WRPB-VC-05Z 4.4 5.1 2.4 <0.15 <0.50 <1.4 <0.29 <0.08 <0.20 <15
021108WRPB-VC-06A 0.96J 1.7 1.3P <0.17 <0.59 <0.07 <0.32 <0.087 <0.22 <0.17
021108WRPB-VC-06B 1.5 3.0 <0.63 <0.16 <0.25 <0.069 <0.31 <0.086 <0.22 <0.16
Proposed SEF 2009 Screening level 2460 906 8110 -- -- 1.45 -- 20.7 -- SEF 2006 Screening level -- -- -- 9.5 2.8 1.9 1.5 -- -- -- SL not established. (<) = Non-detect (ND) at the value listed (Method Detection Limit). J = The result is an estimated concentration that is less then the MRL but greater than or equal to the MDL. P = The confirmation criteria was exceeded. The relative percent difference is greater than 25% between the two analytical results.
14
Willamette Post Office Bar Sampled February 11, 2009
Table 6: Polychlorinated Biphenyl (PCBs)
Aroclor 1016
Aroclor 1221
Aroclor 1232
Aroclor 1242
Aroclor 1248
Aroclor 1254
Aroclor 1260
Total Sample I.D.
ug/kg (ppb)
021108WRPB-VC-01A <1.4 <1.4 <1.4 <6.0 <1.4 <12 <1.4 ND 021108WRPB-VC-01Z <1.3 <1.3 <1.3 <7.4 <1.3 <6.4 <1.3 ND 021108WRPB-VC-02A <1.5 <1.5 <1.5 <3.6 <1.5 <12 <1.5 ND 021108WRPB-VC-02B <1.3 <1.3 <1.3 <4.1 <1.3 <11 <1.3 ND 021108WRPB-VC-03A <1.4 <1.4 <1.4 27P <1.4 29 <1.4 56 021108WRPB-VC-03Z <1.4 <1.4 <1.4 70 <1.4 84 <1.4 154 021108WRPB-VC-04A <1.6 <1.6 <1.6 <12 <1.6 <12 <1.6 ND 021108WRPB-VC-04B <1.3 <1.3 <1.3 <3.9 <1.3 <10 <1.3 ND 021108WRPB-VC-05A <1.3 <1.3 <1.3 <9.3 <1.3 <12 <1.3 ND 021108WRPB-VC-05Z <1.3 <1.3 <1.3 30 <1.3 49 <1.3 79 021108WRPB-VC-06A <1.5 <1.5 <1.5 <2.5 <1.5 <7.2 <1.5 ND 021108WRPB-VC-06B <1.4 <1.4 <1.4 <1.4 <1.4 <14 <1.4 ND
Proposed SEF 2009 Screening level 3130 SEF 2006 Screening level 60 Symbol (<) = Non-detect (ND) at the value listed (Method Detection Limit). P= The confirmation criteria was exceeded. The relative percent difference is greater than 40% between the two analytical results.
15

Willamette Post Office Bar Sampled February 11, 2009
Table 7: Chlorinated Hydrocarbons
Sample I.D.
Hexachlorobenzene1,2,4-
Trichlorobenzene 1,2-
Dichlorobenzene 1,4-
Dichlorobenzene ug/kg (ppb)
021108WRPB-VC-01A <1.3 <2.7 <3.0 <3.0
021108WRPB-VC-01Z <1.2 <2.6 <2.9 <2.9
021108WRPB-VC-02A <1.4 <3.0 <3.3 <3.3
021108WRPB-VC-02B <1.3 <2.7 <3.0 <3.0
021108WRPB-VC-03A <1.2 <2.6 <2.9 <2.9
021108WRPB-VC-03Z <1.2 <2.6 <2.9 <2.9
021108WRPB-VC-04A <1.5 <3.1 <3.5 <3.5
021108WRPB-VC-04B <1.2 <2.6 <2.9 <2.9
021108WRPB-VC-05A <1.2 <2.6 <2.9 <2.9
021108WRPB-VC-05Z <1.2 <2.6 <2.9 4.1J 021108WRPB-VC-06A <1.3 <2.9 <3.2 <3.2
021108WRPB-VC-06B <1.3 <2.8 <3.1 <3.1
Proposed SEF 2009 Screening level
SEF 2006 Screening level -- -- -- -- Symbol (<) = Non-detect (ND) at the value listed (Method Detection Limit). J = The result is an estimated concentration that is less then the MRL, but greater than or equal to the MDL.
16
Willamette Post Office Bar Sampled February 11, 2009
Table 8: Phthalates
Sample I.D. bis(2-
Ethylhexyl) phthalate
Butyl-benzyl-phthalate
Di-n-butyl -phthalate
Di-n-octyl- phthalate
Diethyl-phthalate
Dimethyl-phthalate
ug/kg (ppb)
021108WRPB-VC-01A 47J 5.3J <8.2 <1.8 1.6J <1.1 021108WRPB-VC-01Z 45J 12 12J <1.7 <1.3 <1.0
021108WRPB-VC-02A 36J <3.7 <9 <2.0 2.1J <1.2
021108WRPB-VC-02B 33J <3.3 <8 <1.8 <1.1 <1.4 021108WRPB-VC-03A 19J <3.2 <7.9 <1.7 <1.3 <1.0 021108WRPB-VC-03Z 17J <3.2 8.8J <1.7 <1.3 <1.0 021108WRPB-VC-04A 59J <3.8 <9.4 <2.1 1.8J <1.2 021108WRPB-VC-04B 27J <3.2 9.2J <1.7 2.1J <1.0 021108WRPB-VC-05A 24J <3.2 <7.9 <1.7 <1.3 <1.0 021108WRPB-VC-05Z 48J <3.2 9.7J <1.7 2.3J <1.0 021108WRPB-VC-06A 28J <3.5 <8.6 <1.9 1.6J <1.1 021108WRPB-VC-06B 36J 5.9J 11J <1.9 2.1J <1.1
Proposed SEF 2009 Screening level 22300 -- 1740 39 -- -- SEF 2006 Screening level 220 260 -- 26 -- 46 Symbol (<) = Non-detect (ND) at the value listed (Method Detection Limit). J = The result is an estimated concentration that is less then the MRL, but greater than or equal to the MDL.
17
Willamette Post Office Bar Sampled February 11, 2009
Table 9: Phenols
Sample I.D. Phenol 2-Methyl
phenol Pentachloro
phenol 4-Methyl phenol
2,4-Dimethyl phenol
ug/kg (ppb) 021108WRPB-VC-01A 7.7J <1.6 <1.5 19 <5.7 021108WRPB-VC-01Z 67 <1.5 29 <1.5 <5.5 021108WRPB-VC-02A 8.3J <1.7 <1.7 44 <6.3 021108WRPB-VC-02B <2.1 <1.6 <1.4 19 <5.6 021108WRPB-VC-03A <2.0 <1.5 <1.4 <1.5 <5.5 021108WRPB-VC-03Z <2.0 <1.5 <1.3 5.0J <5.5 021108WRPB-VC-04A 16J <1.8 <1.7 15 <6.5 021108WRPB-VC-04B <2.0 3.7J <1.5 4.7J <5.5 021108WRPB-VC-05A 5.8J <1.5 <1.4 11 <5.5 021108WRPB-VC-05Z 13J <1.5 <1.2 24 <5.5 021108WRPB-VC-06A <2.2 3.1J <1.6 8.4J <6.0 021108WRPB-VC-06B <2.2 <1.6 <1.6 5.1J <5.9
Proposed SEF 2009 Screening level
210
-- 1240
-- --
SEF 2006 Screening level --
-- --
--
--
Symbol (<) = Non-detect (ND) at the value listed (Method Detection Limit). J = The result is an estimated concentration that is less then the MRL, but greater than or equal to the MDL
18

Willamette Post Office Bar Sampled February 11, 2009
Table 10: Miscellaneous Extractables
Sample I.D.
Hexachloro-butadiene
Benzoic Acid Benzyl Alcohol Dibenzofuran N-Nitroso diphenylamine
ug/kg (ppb) 021108WRPB-VC-01A <2.6 <99 7.0J 2.0J <1.7 021108WRPB-VC-01Z <2.5 <96 8.6J 4.3J <1.6 021108WRPB-VC-02A <2.9 <110 <2.4 1.4J <1.9 021108WRPB-VC-02B <2.6 <97 <2.2 2.1J <1.7 021108WRPB-VC-03A <2.5 <96 4.0J 9.5J <1.6 021108WRPB-VC-03Z <2.5 <96 <2.1 35 5.9J 021108WRPB-VC-04A <3.0 <120 6.6J <1.5 <1.9 021108WRPB-VC-04B <2.5 <96 6.7J 1.7J <1.6 021108WRPB-VC-05A <2.5 <96 5.9J 2.2J <1.6 021108WRPB-VC-05Z <2.5 <96 <2.1 <1.2 <1.6 021108WRPB-VC-06A <2.8 <110 5.1J <1.3 <1.8 021108WRPB-VC-06B <2.7 <110 6.0J 2.5J <1.8
Proposed SEF 2009 Screening level -- 2910 -- 3810 -- SEF 2006 Screening level -- -- -- 400 --
Symbol (<) = Non-detect (ND) at the value listed (Method Detection Limit). J = The result is an estimated concentration that is less then the MRL, but greater than or equal to the MDL.
19

Willamette Post Office Bar Sampled February 11, 2009
Table 11: Polynuclear Aromatic Hydrocarbons (PAHs), Low Molecular Weight Analytes
Acenaphthene
Acenaph thylene
Anthracene
Fluorene 2-Methyl
naphthaleneNaphthalene
Phen anthrene
Total Low PAHs Sample I.D.
ug/kg (ppb) 021108WRPB-VC-01A 11J 16 18 6.5J 4.5J 11J 49 116 021108WRPB-VC-01Z 15 15 16 9.2J 6.5J 18 52 114
021108WRPB-VC-02A 5.9J 7.3J 9.2J 5.3J 4.1J 9.8J 32 74
021108WRPB-VC-02B 8.6J 5.3J 8.6J 6.0J 3.3J 7.0J 40 79 021108WRPB-VC-03A 36 19 35 22 17 28 150 307
021108WRPB-VC-03Z 90 28 52 60 100 94 270 694
021108WRPB-VC-04A 9.7J 6.7J 14 6.0J 3.6J 6.8J 37 84 021108WRPB-VC-04B 3.8J 4.5J 5.3J 3.4J 2.3J 6.0J 18 43
021108WRPB-VC-05A 11 11 18 6.8J 5.5J 16 55 123
021108WRPB-VC-05Z 130 85 100 80 77 140 410 1022 021108WRPB-VC-06A 3.1J 4.3J 5.8J 2.2J <2.4 4.6J 15 35
021108WRPB-VC-06B 8.8J 11J 20 6.4J 4.5J 15 42 108
Proposed SEF 2009 Screening level -- -- -- -- -- -- -- --
SEF 2006 Screening level 1100 470 1200 1000 470 500 61002 6600 Symbol (<) = Non-detect (ND) at the value listed (Method Detection Limit) J = The result is an estimated concentration that is less then the MRL, but greater than or equal to the MDL.
20

Willamette Post Office Bar Sampled February 11, 2009
Table 12: Polynuclear Aromatic Hydrocarbons (PAHs), High Molecular Weight Analytes
Benzo(a)-anthracene
Benzo(b)-
fluro-anthene
Benzo(k)-fluro-
anthene
Benzo-(g,h,i)-
peryleneChrysene Pyrene
Benzo(a)-pyrene
Dibenz(a,h)-anthracene
Indeno-(1,2,3-cd)-
pyrene
Fluor-anthene
Total High PAHs Sample I.D.
ug/kg (ppb) 021108WRPB-VC-01A 83 130 40 62 96 140 130 22 110 130 943 021108WRPB-VC-01Z 51 93 25 58 61 96 86 23 86 99 678 021108WRPB-VC-02A 23 32 9.0J 51 26 53 33 7.9J 28 52 315 021108WRPB-VC-02B 26 44 12 24 36 55 38 11J 37 59 342 021108WRPB-VC-03A 79 130 43 71 100 170 130 19 110 160 1012 021108WRPB-VC-03Z 96 170 55 78 140 220 180 24 160 210 1333 021108WRPB-VC-04A 47 49 12 48 61 120 47 6.2J 33 100 524 021108WRPB-VC-04B 18 30 9.6J 35 22 35 29 5.7J 27 36 247 021108WRPB-VC-05A 47 72 21 120 57 110 79 12 70 110 698 021108WRPB-VC-05Z 350 560 140 460 430 550 590 72 500 520 5222 021108WRPB-VC-06A 16 25 6.8J 28 20 36 26 4.9J 23 33 219 021108WRPB-VC-06B 46 73 22 32 59 96 79 14 75 93 589
Proposed SEF 2009 Screening level -- -- -- -- -- -- -- -- --
Low & high total 7610
SEF 2006 Screening level 4300 b + k = 600 4000 5900 8800 3300 800 4100 11000 55000 Symbol (<) = Non-detect (ND) at the value listed (Method Detection Limit). J = The result is an estimated concentration that is less then the MRL but greater than or equal to the MDL.
21

Willamette Post Office Bar Sampled February 11, 2009
22
Table 13: Petroleum
Gasoline Range Organics Diesel Range Organics Residual Range OrganicsSample I.D.
ug/kg (ppb) 021108WRPB-VC-01A ND 58 260 021108WRPB-VC-01Z ND ND ND 021108WRPB-VC-02A ND 55 360 021108WRPB-VC-02B ND 51 380 021108WRPB-VC-03A ND 45 270 021108WRPB-VC-03Z ND 140 330 021108WRPB-VC-04A ND 49 290 021108WRPB-VC-04B ND 49 280 021108WRPB-VC-05A ND ND ND 021108WRPB-VC-05Z ND 93 240 021108WRPB-VC-06A ND 46 300 021108WRPB-VC-06B ND 69 410
Proposed SEF 2009 Screening level 1700 4400 SEF 2006 Screening level -- -- -- Symbol (<) = Non-detect (ND) at the value listed (Method Reporting Limit).

Willamette Post Office Bar Sampled February 11, 2009
Table 14: Organotin (Tributyltin)
Total Butyltin ug/Kg
Sample I.D. Tetra Tri Di
021108WRPB-VC-01A <0.94 8.1 2.2P 021108WRPB-VC-03Z <0.84 <0.54 <0.43 021108WRPB-VC-06B <0.99 5.4 2.4
Proposed SEF 2009 Screening level 97 320 910 SEF 2006 Screening level 75 total
Porewater Butyltin ug/L 021108WRPB-VC-01A <0.038 <0.012 <0.0073 021108WRPB-VC-03Z <0.070 <0.022 0.025J 021108WRPB-VC-06B <0.038 <0.012 <0.0073 Symbol (<) = Non-detect (ND) at the value listed (Method Detection Limit). Not SL for TBT in Freshwater P=
23

Willamette Post Office Bar Sampled February 11, 2009
Table 15: Volatile Organic Compounds
n-Propylbenzene
1,3,5-Trimethyl benzene
1,2,4-Trimethyl benzene
Isopropylbenzene
Methyl tert- Butyl Ether
Benzene TolueneEthyl
benzenem,p-
Xyleneso-XyleneSample I.D.
ug/kg (ppb) 021108WRPB-VC-01A <0.13 <0.081 <0.19 <0.063 4.1J <0.29 0.28J <0.083 <0.19 <0.12
021108WRPB-VC-03A <0.12 <0.077 <0.18 <0.060 2.9J <0.27 0.15J <0.079 <0.18 <0.12
021108WRPB-VC-05A <0.13 <0.081 <0.19 <0.063 4.1J <0.29 0.28J <0.083 <0.19 <0.12
Symbol (<) = Non-detect (ND) at the value listed (Method Detection Limit).
J = The result is an estimated concentration that is less then the MRL but greater than or equal to the MDL.
24

Willamette Post Office Bar Sampled February 11, 2009
Figure 1: Willamette River, Post Office Bar, Vicinity Map
Study Area
Disposal Site
25
Willamette Post Office Bar Sampled February 11, 2009
Figure 2: Willamette River, Post Office Bar, Sampling Stations
FNC = Federal Navigation Channel = Sampling Stations
Dredge Prism - inside hash marks
East FNC line
Center FNC line
West FNC line
26

Willamette Post Office Bar Sampled February 11, 2009
27
Figure 3: Historic Sampling Stations 1999 & 2004 Reports

Willamette Post Office Bar Sampled February 11, 2009
Figure 4: Historic Sampling Stations 2006 Report