Embed Size (px)
Citation preview
Will smart pricing finally take off?
Andrew Odlyzko
School of Mathematics
University of Minnesota
Minneapolis, MN 55455, USA
http://www.dtc.umn.edu/∼odlyzko
Revised version, October 20, 2013
Abstract. “Smart pricing” has been the goal of the networking research com-munity and the telecommunications industry for decades. Yet it has also provedremarkably hard to achieve. This paper presents a brief overview of telecom-munications economics and technology, and the major changes that are takingplace. Special emphasis is placed on the many popular but harmful notionsthat continue to lead this industry astray, such as that content is king, or thattelecom is characterized by high fixed costs. The influence of such factors on ad-visability of various pricing strategies is then considered. The main conclusionis that flat rates for individual users should be regarded not as a pernicious can-cer, but as necessary for the healthy development of wired networks. However,in the wireless arena, there is a mismatch between potential demand and whattechnology can provide, and this likely means that some forms of not-very-smartpricing will dominate.
1 Introduction
Will smart pricing dominate telecommunications? We certainly do see growth in sophisti-cated pricing in many areas of the economy. Congestion charges for cars entering centralbusiness districts and “smart” electric meter deployments are spreading. Airlines are evenbeginning to auction seat upgrades [31]. And there is no shortage of desire for smart pricingin telecommunications. For a survey of recent developments, see [58]. Many new techno-logical developments, such as SDN, are touted as facilitating differentiated services anddifferentiated pricing. The overwhelming consensus of the industry, as well as of the re-search community, and of regulators, is that flat rates are irrational. Thus, for example,in 2011, Jon Leibowitz, the then-Chairman of the U.S. Federal Trade Commission couldnot “quite understand why something like metering hasn’t taken off yet.” (See [52] forreferences to this and similar recent quotes, as well as as for a summary of the argumentsin favor of flat rates.)
Yet there are reasons for caution in the rush to smart pricing. After all, the modernconsensus about its desirability is not new. It goes back centuries, to the days of snail mail.Furthermore, industry has often either stumbled onto flat or almost flat rates, or beenforced into them, all against its will, and ended up benefiting. Thus, for example, U.S.
2 Andrew Odlyzko
wireless service providers have been boasting of the low per-minute voice call revenues thatreign in America, much lower than in most of the world. What they universally neglectto mention is that these low prices are the result of the success of the block-pricing planintroduced by AT&T Wireless in 1998, which also eliminated roaming and long-distancecharges. This plan, the result not of a careful study of historical precedents or the economicsof communications, but rather the fruit of a desperate carrier looking for a way to gaincustomers, was widely derided, but proved unexpectedly popular. It forced the rest ofthe industry to follow suit with similar plans, and led to large increases in voice usage(see the chart in [27], for example). The end result is that U.S. has the world’s highestper-subscriber voice usage, yielding those low average per-minute prices that the industryboasts of. Probably not coincidentally, U.S. wireless service providers are among the world’smost profitable. This story, and others like it, should make one cautious about rushing tofollow the industry consensus. This is true even when such a consensus is fortified byscholarly studies, since those tend to be even more biased towards fine-grained pricing.The telecom industry and telecom researchers have historically been notorious for notunderstanding what is in the industry’s own interests.
The traditional preoccupation with smart pricing is likely reinforced by the economics oftelecom. Contrary to common opinion, it is not all that capital intensive. As is demonstratedin Section 8, telecom is simply not in the same category as such large and importantindustries as electricity or roads when it comes to the ratio of capital investment to revenues.Telecom is primarily about service, customer inertia, and territorial strategic plays (wherethe territories may be physical or virtual).
Although the telecom industry is not very capital intensive, communications is ex-tremely valuable, and society is willing to pay astonishing amounts for it. As an example,by some measures the U.S. spends almost 50% more on telecom services than it does forelectricity. (See Section 5 for more data and references.) Furthermore, in spite of all thecomplaints from the industry about its supposedly impoverished state, there appear to bevery large profits in many parts of it. As this passage is being written in the summer of2013, Verizon is in the process of buying out Vodafone’s 45% stake in the Verizon Wirelessunit for $130 billion. This means that the whole of Verizon Wireless is being valued atalmost $300 billion. As will be shown in Section 9, that is about four times the cost ofreplacing all the tangible assets of that enterprise. It is also almost enough to replace theentire U.S. telecom infrastructure, wireless and wired both, with the latter redone in fiber.This is anomalous by traditional standards, but then, as will be discussed in Section 9,the entire economy is behaving anomalously, with very high corporate profits, low interestrates, and low capital investment. Whether this is a temporary aberration, or whether weare in a new economic era, remains to be seen. However, telecom is very much in the main-stream of this historically unusual behavior, so many traditional yardsticks of financialperformance may not apply.
While the telecom industry has often been blind to profitable opportunities, it hasalways been aware that high profits are possible. However, it has usually faced difficultiesin using their favorite methods for profit extraction because of various combinations of legaland regulatory constraints, and the peculiar nature of demand for communication services.
Smart pricing prospects 3
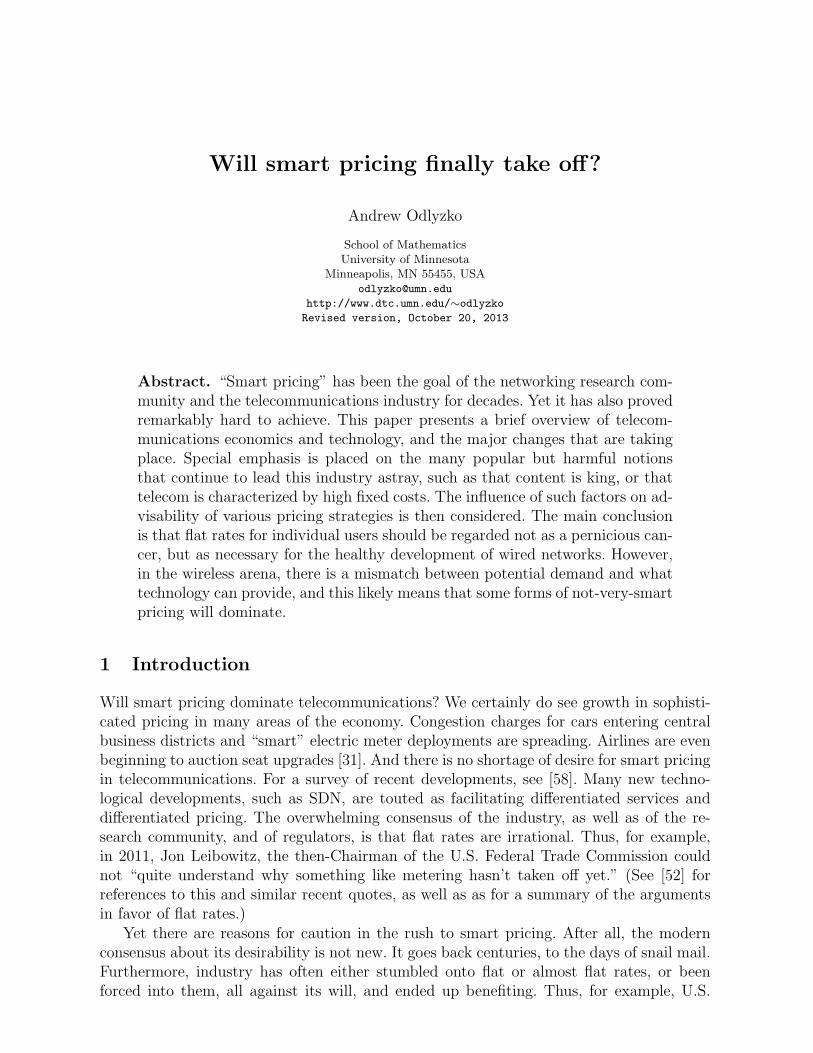
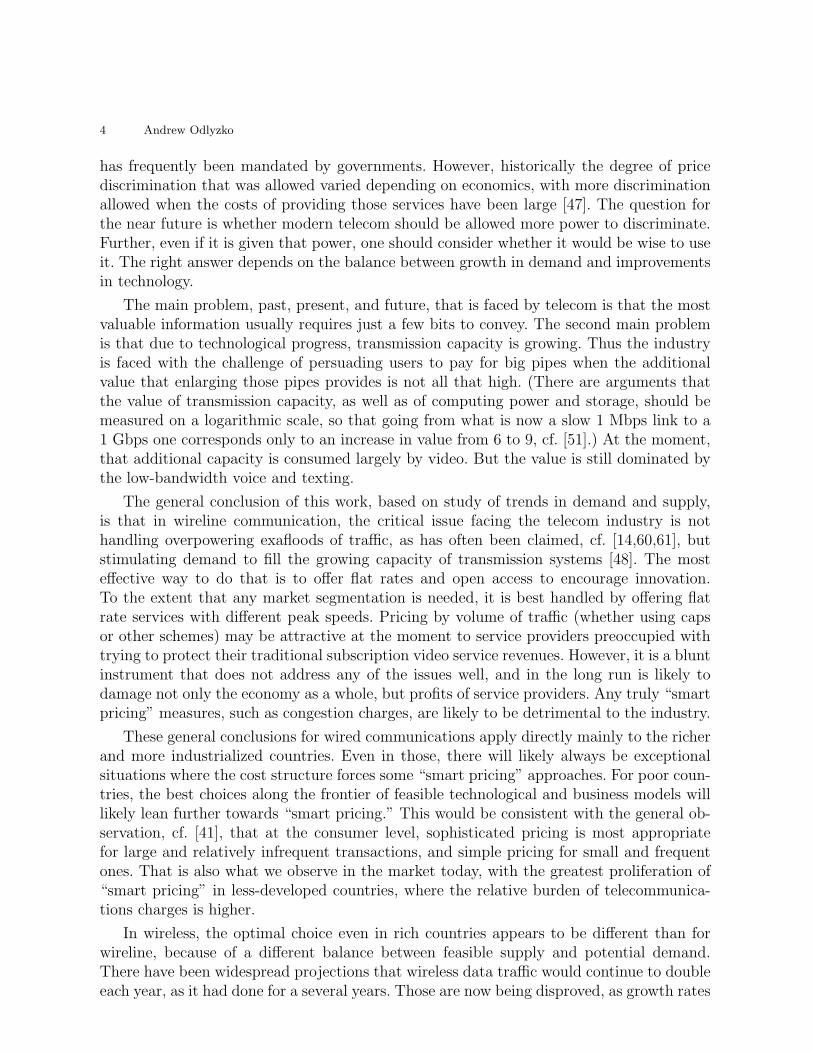
Table 1 shows an approximation of current prices paid by users for varying amounts ofdata from various services.
Table 1. Price per megabyte.
SMS $1,000.00cellular voice 1.00wireline voice 0.10residential Internet 0.01backbone Internet 0.0001
This table demonstrates the main problem faced by telecom. The most valuable infor-mation can often be conveyed in just a few bits. Thus, for example, in the early days ofpostal services, when receivers paid on delivery, information would often be transmitted inthe form of small modifications in the address. The addressee would then scan the envelope,figure out what the message was, and refuse to accept (and pay for) the letter.
Practices from two centuries ago may seem irrelevant, but in fact they are very instruc-tive to study, as the basic economic issues have always been the same, even as technologyhas changed drastically, cf. [41]. Thus, for example, today we have the telecom industryinvesting heavily in Deep Packet Inspection. In the past, post offices had employees holdletters up against burning candles, to make sure that there were no enclosures that weresubject to extra fees. The basic incentive is to extract as much value as possible, and thatusually requires fine-grained pricing to achieve successful price discrimination. But usually,in communication as well as in transportation, limits are placed on what service providersare allowed to do. The Net Neutrality debate is just another instance of the ancient conflictbetween economic efficiency and fairness in markets [50]. Giving unfettered control of anycritical service to any provider, or an oligopoly of providers, either de jure or de facto (byallowing natural monopoly mechanisms to operate), is equivalent to abolishing propertyrights with the usual negative impacts on innovation and efficiency. Hence we have almostalways had constraints, such as those of common carriage. The real question is about theappropriate level of constraints.
Public talk of capacity limits is often just a public relations measure, designed to over-come opposition to service provider strategies. Thus, for example, in early 2013, MichaelPowell, the President of the U.S. cable industry association (and former Chairman of theFCC) admitted, contradicting many earlier declarations by a variety of executives andexperts, that “cable’s interest in usage-based pricing was not principally about networkcongestion, but instead about pricing fairness” [9]. Whenever business leaders talk of “fair-ness,” it is generally safe to assume they are really after extracting more revenues throughdifferential pricing. This is not novel, nor is it nefarious. In fact, differential pricing wasand is at the core of regulatory economics, as it can be used to promote social welfare, and
4 Andrew Odlyzko
has frequently been mandated by governments. However, historically the degree of pricediscrimination that was allowed varied depending on economics, with more discriminationallowed when the costs of providing those services have been large [47]. The question forthe near future is whether modern telecom should be allowed more power to discriminate.Further, even if it is given that power, one should consider whether it would be wise to useit. The right answer depends on the balance between growth in demand and improvementsin technology.
The main problem, past, present, and future, that is faced by telecom is that the mostvaluable information usually requires just a few bits to convey. The second main problemis that due to technological progress, transmission capacity is growing. Thus the industryis faced with the challenge of persuading users to pay for big pipes when the additionalvalue that enlarging those pipes provides is not all that high. (There are arguments thatthe value of transmission capacity, as well as of computing power and storage, should bemeasured on a logarithmic scale, so that going from what is now a slow 1 Mbps link to a1 Gbps one corresponds only to an increase in value from 6 to 9, cf. [51].) At the moment,that additional capacity is consumed largely by video. But the value is still dominated bythe low-bandwidth voice and texting.
The general conclusion of this work, based on study of trends in demand and supply,is that in wireline communication, the critical issue facing the telecom industry is nothandling overpowering exafloods of traffic, as has often been claimed, cf. [14,60,61], butstimulating demand to fill the growing capacity of transmission systems [48]. The mosteffective way to do that is to offer flat rates and open access to encourage innovation.To the extent that any market segmentation is needed, it is best handled by offering flatrate services with different peak speeds. Pricing by volume of traffic (whether using capsor other schemes) may be attractive at the moment to service providers preoccupied withtrying to protect their traditional subscription video service revenues. However, it is a bluntinstrument that does not address any of the issues well, and in the long run is likely todamage not only the economy as a whole, but profits of service providers. Any truly “smartpricing” measures, such as congestion charges, are likely to be detrimental to the industry.
These general conclusions for wired communications apply directly mainly to the richerand more industrialized countries. Even in those, there will likely always be exceptionalsituations where the cost structure forces some “smart pricing” approaches. For poor coun-tries, the best choices along the frontier of feasible technological and business models willlikely lean further towards “smart pricing.” This would be consistent with the general ob-servation, cf. [41], that at the consumer level, sophisticated pricing is most appropriatefor large and relatively infrequent transactions, and simple pricing for small and frequentones. That is also what we observe in the market today, with the greatest proliferation of“smart pricing” in less-developed countries, where the relative burden of telecommunica-tions charges is higher.
In wireless, the optimal choice even in rich countries appears to be different than forwireline, because of a different balance between feasible supply and potential demand.There have been widespread projections that wireless data traffic would continue to doubleeach year, as it had done for a several years. Those are now being disproved, as growth rates
Smart pricing prospects 5
are declining. (See Section 13.) Still, those rates are high, and there is far more traffic thatwould likely use the radio path if that were feasible, as wireless data traffic is under 5% ofwireline. Coupled with the low value of most of this data, and the resulting low likelihoodof service providers being able to extract large new revenues, it appears probable thatthe incentives for the industry will be to constrain usage, and to implement differentiatedquality of service to protect the most valuable low-bandwidth applications. So somewhatfiner-grained pricing is likely to prevail in this domain than in wireline. Still, the need tolimit what Nick Szabo [62] has aptly called the “mental transaction costs” involved in fine-grained pricing, and related concerns, are likely to restrict the complexity of schemes thatsucceed. The sophisticated pricing plans so beloved of researchers are likely to be confinedto areas such as business-to-business dealings, and may be of limited applicability eventhere.
However, the strong prejudice in favor of “smart pricing” among both industry leadersand academic researchers guarantees that many schemes will be developed, and quite afew will be deployed. Chances are that, as was true of many sophisticated prioritizationschemes developed for voice PBXs or early data switches, they will not see much use. Butfor those cases where they might be used, it appears that most of current research, as well asacademic instruction is missing some important ingredients. As is discussed in Section 12,it will likely be important to explore the most effective ways to introduce noise and otherimpairments into communication systems to provide differential quality of service. (On theother hand, there will likely also be demand for methods to detect such actions.)
The next section reviews briefly some of the main fallacies that invigorate the push for“smart pricing.” This is followed by a section on some missed opportunities in telecom,demonstrating how this industry tends to “stumble to success,” pursuing mistaken goalsand prospering by accident. Section 4 then has a very brief discussion of the reasonstelecom has been so poor at innovating in services, and is likely to remain poor in thefuture. Section 5 discusses this industry’s place in the entire economy. Section 6 points outthat high profits have not infrequently been obtained in this sector. Section 7 sketches themain changes that have taken place in the money flows in telecommunications in recentdecades. Section 8 demonstrates that, contrary to general opinion, this industry is not allthat capital intensive. Section 9 discusses some of the puzzles of the modern economy,and the degree to which the telecom industry exhibits similar behavior. Section 12, citedabove, discusses some missing ingredients in modern research and education, should “smartpricing” become widespread. Sections 10 and 11 take a historical look at some earlier workon telecom pricing, and the degree to which it reflected the prejudices we observe today.Sections 13 and 14 then discuss growth in demand for data traffic and improvements intransmission technologies, and what the contrasts between those imply for optimal pricingstrategies. Finally, Section 15 has the conclusions.
2 Telecom mistakes
Many of the basic but general issues that bear on the possible adoption of smart pricinghave already been explored in the literature (see, for example, [41,43,45,46]), and so will betouched on very lightly here. However, they do need to be mentioned, since there are many
6 Andrew Odlyzko
misapprehensions about the nature of telecom, and they often have important bearing onoptimal choices of pricing policies. For example, we are constantly told that content is king.(Content is taken here to mean material prepared by professionals for wide distribution,and not, as some use it, to denote anything in digital form.) But
Content is not king.
Yes, content, in the sense of material prepared by professionals for wide distribution, isimportant. But it is simply nowhere near as important as basic connectivity, and therevenues of various services reflect that. This is discussed in detail in [41,42]. Evidenceof this fundamental fact is all around, and some will show up later in this paper (forexample, in the observation that U.S. wireless carriers have revenues about three times aslarge as those that the cable industry derives from subscription video). However, contenthas historically attracted disproportionate attention, and continues to do so today. Forexample, an article in the Economist [7] stated:
A common saying in the industry is that Mexico’s phone sector may be aboutfour times more valuable than the television market, but the latter is four times aspowerful.
What is especially perplexing about the centuries-old preoccupation with content isthat content is not cheap. For telecom service providers to sell content, they generallyhave to buy it at high prices. (And so, net of what they pay to content producers, U.S.cable networks appear to be getting more revenue out of Internet access and voice servicesthan out of carrying subscription video, and all on a far smaller slice of their transportcapacity.) Back in 2005, Ed Whitacre, then the CEO of AT&T, caused a flareup in thenet neutrality debate with his threat that he would not let Google use his wires withoutpayment. Strangely enough, it is not clear if anybody raised the question as to whetherhis basic premise was correct, that in the absence of any legal or regulatory constraint,it would be Google paying AT&T. Why should not AT&T have to pay Google? PerhapsWhitacre was right, and Bing might have been an acceptable substitute for Google searchfor AT&T customers. But perhaps not. Imagine that Whitacre had said he was not goingto let ESPN or HBO use AT&T’s U-Verse wires without payment. Instead of being calledevil by small groups of advocates of an open Internet, he surely would have been calledinsane by almost everybody.
Because content is not king, the vast majority of papers and discussions about netneutrality, industry structure, and related issues are of doubtful relevance. For example,many academic papers start with the assumption that the Internet is a two-sided market. Itsimply is not. Most of the value that users get from it is not content, but simple connectivity,such as being able to tell their friends business partners they are stuck in traffic. Comparedto old communication technologies, the Internet does provide many unique features, and inparticular allows for bridging between content and connectivity. (The main search serviceof Google, which provides the bulk of that company’s revenues and profits, but very littletraffic, is in this intermediate zone, as are most of the facilities of social networks that userscare about.) However, the features that matter the most are not the ones that allow content
Smart pricing prospects 7
providers to target individual consumers, but the ones that allow for group formation, andfor individuals or groups to become creators and distributors.
Closely allied to the misleading myth that content is king is another extremely widespreadand extremely damaging notion, that of streaming video, [49]. However, all the evidencesuggests that
True streaming video is, and will remain, a very small fraction of traffic.
Video does dominate current Internet traffic by volume, but it is almost exclusively trans-mitted as faster-than-real-time progressive downloads. That is the only method that makessense technologically. (Video conferencing is completely different, but we now have enoughexperience to be able to predict with safety that it will not be contributing giant amountsof traffic.) Furthermore, this was easily predictable and was predicted a long time ago.George Gilder wrote about it two decades ago, for example, and he attributes the ideato Nicholas Negroponte even earlier. Their prediction has come true, yet almost everyonethinks that the floods of video they consume are true streaming video. This skewes businessdecisions and public policy discussions, since networks dominated by real-time long-liveddata flows of predictable size and with tight latency constraints do indeed lend themselvesto many of the pricing and network management techniques that are so beloved by bothtop managers and telecom researchers, cf. [40].
The myth of real-time streaming video is so pervasive and strong that it also affectsnetworking researchers. For the last decade, this author has been taking polls asking thosein the audience to raise their hands if they saw any advantage at all, for anyone, in trans-mitting video faster than real time. Usually, even among networking researchers, at most10% have responded. The highest positive response rates were around 40%, among a coupleof audiences packed with researchers working on wireless ad-hoc networks, who understandthat on connectivity being maintained, but can use buffers to compensate. (While one canenvisage ultra-reliable wired networks, in the wireless arena this is simply not achievable,there are far too many unpredictable sources of impairments.) This demonstrates that evennetworking researchers don’t know what is happening in today’s networks, nor why it ishappening.
The preoccupation with real-time streaming video leads to the constant questioningabout the potential demand for high speed access. Who needs gigabit to the home, is beingasked, since the most that most observers can imagine is a few streams that might possiblycome to 20 Mbps each in some future high-definition TV. This perfectly illustrates the lackof vision not just on the future, but on the present, that afflicts this industry. After all, whyare people buying 300 Mbps home WiFi access points, if all they are after is streaming afew movies? Yet such routers are selling, and high speed home access is also selling (whenoffered at reasonable cost), because they allow for low transaction latency.
The main function of data networks is to cater to human impatience.
This is something that the computer industry, as well as many other competitive industries,whether online search, or Internet commerce, understand well. If users don’t get their websearch results in a second, they go away. On the other hand, the telecom industry has ahard time assimilating this notion. Yet, if you want to download a video that is 8 GB to

8 Andrew Odlyzko
your portable device in less than a minute, you absolutely have to have a gigabit link.Hence
Overprovisioning is not a bug but a feature, as it indispensable
to provide low transaction latency, the main function of data networks.
Once you have overengineered your network, it becomes clearer that pricing by volume isnot particularly appropriate, as it is the size and availability of the connection that createsmost of the value. That is also what the users perceive directly. Generally speaking (andthere are obviously exceptions, buffer bloat can lead to contrary experience), increasedbandwidth means that things happen faster, the network is more responsive, etc. That issomething that is immediately perceptible to users. It does not require them to engage inany mental transaction costs to figure out where they are with respect to violating somevolume caps, for example.
In wireline, the vision of a largely empty network dominated (initially in value, eventu-ally likely also in volume) by cascades of mostly machine-to-machine transactions drivenby human impatience that was easy to predict a long time ago, cf. [40], does appear to berealistic, and likely inevitable. As George Gilder has said, You waste that which is plen-
tiful, and in most wired networks bandwidth is plentiful. Wireless, though, appears to bedifferent, as will be discussed later.
3 Voice and other missed opportunities in telecom
Correct technological predictions are hard in general, but telecom seems to be even worseat it than other areas. Some of the many mistakes are easy to excuse. For example, thepopularity of wireless had been consistently underestimated by the industry for severaldecades. But this was understandable, the service was novel, and the high value thatpeople have placed on mobility was not easy to predict. (There is a saying that you cannottell how many people will use a bridge by counting how many swim across a river.) Butothers are far more surprising, and illustrate well how telecom has often “stumbled tosuccess.” As just one example, as recently as the summer of 2006, on an email discussionlist, one of the top technical officers of a major U.S. cable company insisted that the idea oftaking some of the bandwidth away from video services and employing it for Internet accesswas impractical. He insisted that “[t]he vast majority of folk in this country watch analogtv and don’t have electronics to consume them digitally, don’t want them or can’t affordthem.” Yet today, Internet access is already, or is about to become, the main business ofthe cable networks.
The most perplexing of the many mistakes that telecom has made is in neglect of voice.Even today, voice services provide the bulk of worldwide telecom revenues, but the industryhas not been paying attention. When 3G was being prepared for deployment around theturn of the millennium, industry was touting it as enabler of all sorts of fancy digital “con-tent” services. But it was obvious that voice offered the greatest profit opportunities [44],and voice has indeed been the main revenue generator for 3G. However, while the industrydid benefit from this easy to anticipate but unanticipated windfall, it has neglected other
Smart pricing prospects 9
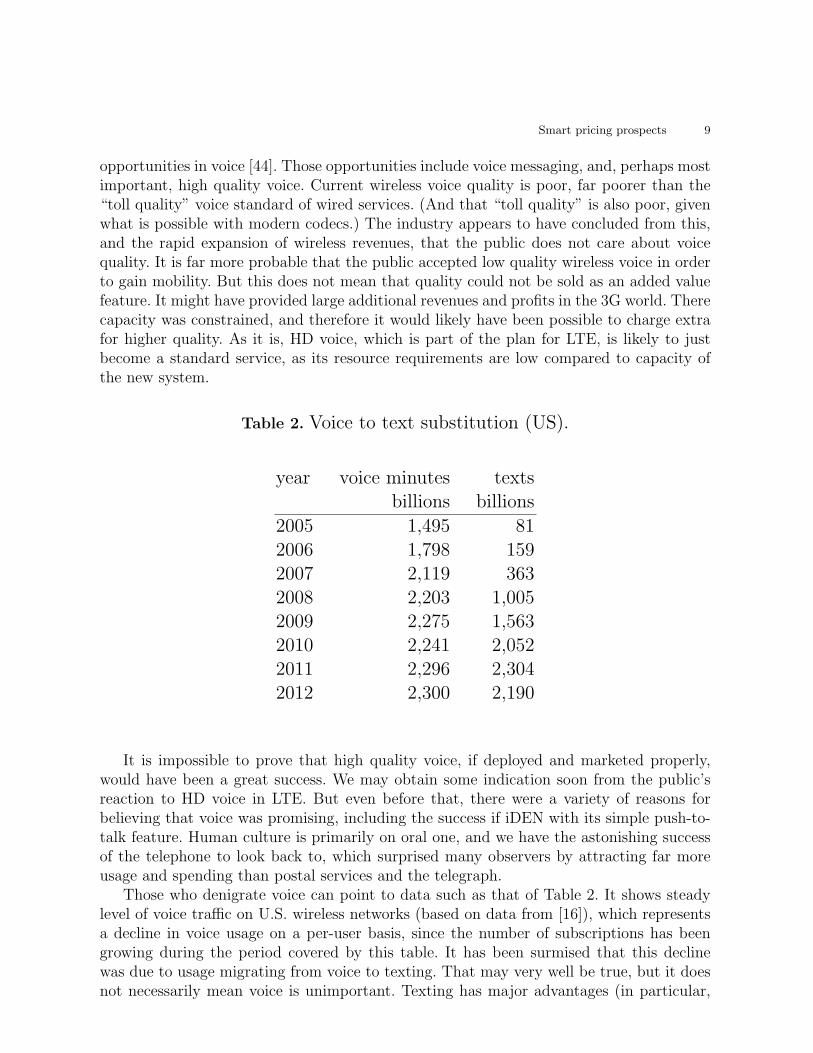
opportunities in voice [44]. Those opportunities include voice messaging, and, perhaps mostimportant, high quality voice. Current wireless voice quality is poor, far poorer than the“toll quality” voice standard of wired services. (And that “toll quality” is also poor, givenwhat is possible with modern codecs.) The industry appears to have concluded from this,and the rapid expansion of wireless revenues, that the public does not care about voicequality. It is far more probable that the public accepted low quality wireless voice in orderto gain mobility. But this does not mean that quality could not be sold as an added valuefeature. It might have provided large additional revenues and profits in the 3G world. Therecapacity was constrained, and therefore it would likely have been possible to charge extrafor higher quality. As it is, HD voice, which is part of the plan for LTE, is likely to justbecome a standard service, as its resource requirements are low compared to capacity ofthe new system.
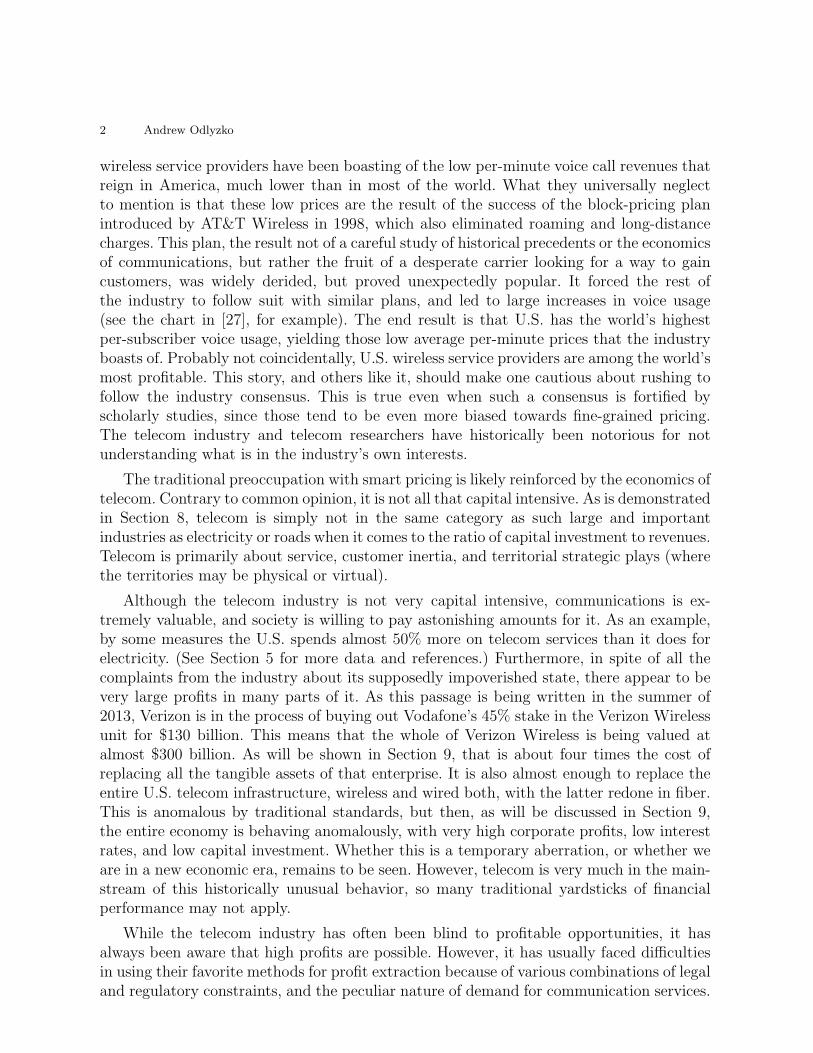
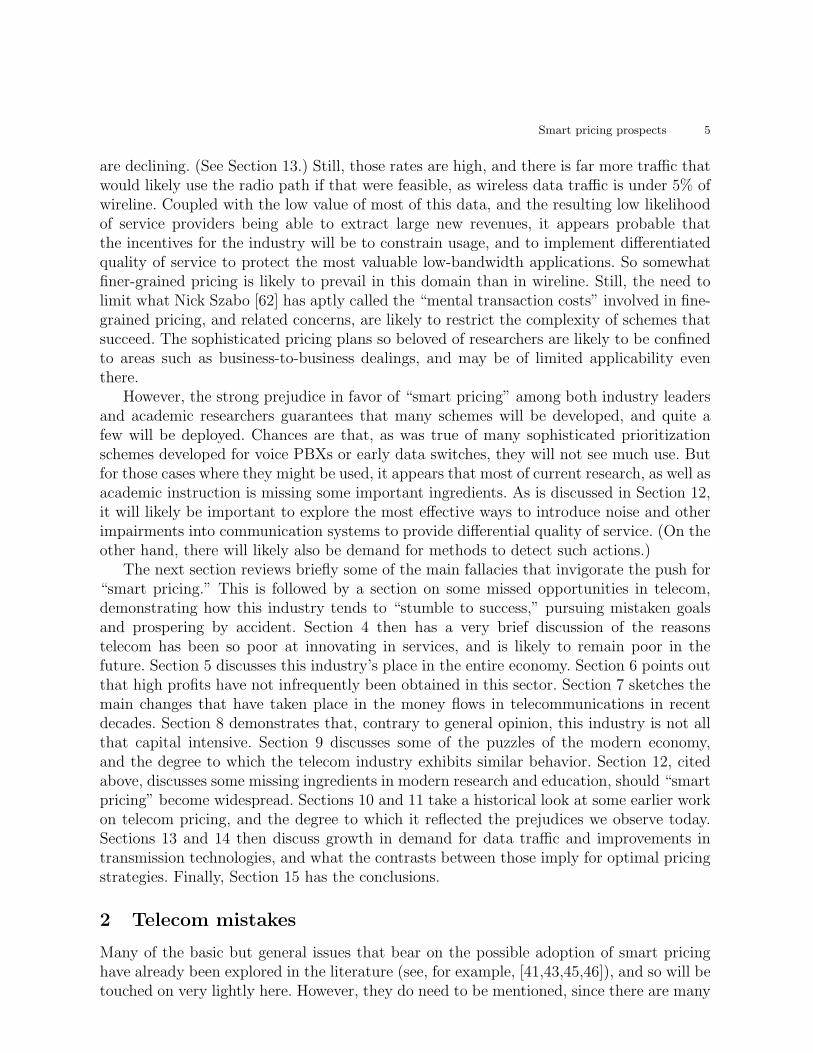
Table 2. Voice to text substitution (US).
year voice minutes textsbillions billions
2005 1,495 812006 1,798 1592007 2,119 3632008 2,203 1,0052009 2,275 1,5632010 2,241 2,0522011 2,296 2,3042012 2,300 2,190
It is impossible to prove that high quality voice, if deployed and marketed properly,would have been a great success. We may obtain some indication soon from the public’sreaction to HD voice in LTE. But even before that, there were a variety of reasons forbelieving that voice was promising, including the success if iDEN with its simple push-to-talk feature. Human culture is primarily on oral one, and we have the astonishing successof the telephone to look back to, which surprised many observers by attracting far moreusage and spending than postal services and the telegraph.
Those who denigrate voice can point to data such as that of Table 2. It shows steadylevel of voice traffic on U.S. wireless networks (based on data from [16]), which representsa decline in voice usage on a per-user basis, since the number of subscriptions has beengrowing during the period covered by this table. It has been surmised that this declinewas due to usage migrating from voice to texting. That may very well be true, but it doesnot necessarily mean voice is unimportant. Texting has major advantages (in particular,
10 Andrew Odlyzko
being asynchronous, and thus less intrusive than voice), and the phenomenon shown inthis table may be an indicator of a substantial opportunity in voice messaging, one thatpossibly could have generated good revenues in the restricted 3G environment.
Moving forward, the opportunity to gain additional revenues with HD voice appearsto be gone, but voice should not be neglected, as it is right now, in a variety of services.Furthermore, it appears that in the development of video services, the industry is neglectingsocial communication in the traditional preoccupation with content.
4 The telecom industry and innovation
The telecom industry has repeatedly shown that it can perform well in increasing trans-mission capacity. It has also shown itself to be miserably poor at inventing new services.This may very well be the result of a basic cultural mismatch. The basic mission of telecomcarriers is to provide ubiquitous connectivity. This is not an easy task, especially since itinvolves being able to respond to massive disasters, natural or man-made. Most likely theskills, mindset, and organization that can accomplish this are simply not tuned to antici-pating what the capricious public will want. Even when very smart people with innovativeideas join such organizations, their initiatives tend to be blocked. From this perspective, itwould be best, both for society and for their shareholders, if telcos stuck to their expertise,which is that of providing “dumb pipes.” Unfortunately that is not likely to happen, astheir managers (and shareholders) dream of “content” and other glamorous futures.
5 The large telecommunications revenues
Measuring revenues of the telecommunications sector is not simple. (For example, shouldone count the home WiFi access points people buy, or the cost of the WiFi equipment ina PC or tablet?) Even concentrating just on revenues of service providers presents seriousproblems, as various bundles mix communications with content. However, any reasonablemethodology shows that telecom attracts very large revenues. Here we cite some figuresfrom [53], which has extensive statistics (and discussion) based on data up to the year2011. A very attractive feature is that those statistics cover all the advanced industrializednations over about two decades, and thus provide interesting international comparisons. (Itshould be mentioned that other sources sometimes show different estimates. For example,for 2011, Table 3.4 of [53] shows U.S. wireless telecom revenues of $210 billion, while CTIA,the industry association, computes it at $170 billion for that year.) In that year, telecomrevenues inside the OECD countries came to $1.35 trillion, with U.S. accounting for $526billion (others sometimes cite figures as low as $350 billion for the U.S.). Hence it seemssafe to estimate worldwide telecom revenues in 2011 as being close to $2 trillion. About halfof the revenues (for OECD, and therefore likely for the whole world) comes from wireless.
For comparison, worldwide advertising spending for 2013 is projected to come to $518billion, so only around a quarter of telecom revenues [55]. (In the U.S. alone, advertisingis more significant, as at $172 billion it comes close to a third of telecom revenues.) Sinceonly about $100 billion of advertising goes into online forms, there is still plenty of room
Smart pricing prospects 11
for Facebook, Google, and other companies to grow their ad businesses. But there is noway that the telecom business can be supported at anything like its present size by adsalone.
Yet another interesting comparison (relevant to later discussions of capital intensity) iswith the electric power industry. In the U.S., total revenues from electricity sales from endusers, residential as well as commercial, came to $364 billion in 2012 (based on statisticsfrom the U.S. Energy Information Administration). Of this amount, something like a thirdwent to pay for fuel, so that the total amount this industry had to cover maintenance,non-fuel operations, and provide for profits and interest was only about half of what thetelecom industry received.
Yet another interesting comparison is with Google. In 2012, its worldwide revenues cameto just about $50 billion. Its growth and profit rates were far higher than for most telecomservice providers, but still, it commanded just 2.5% of the telecom revenue stream. So telcoswill not get rich by squeezing Google alone. (Even squeezing Microsoft, with worldwiderevenues of about $80 billion per year, would be of limited help.)
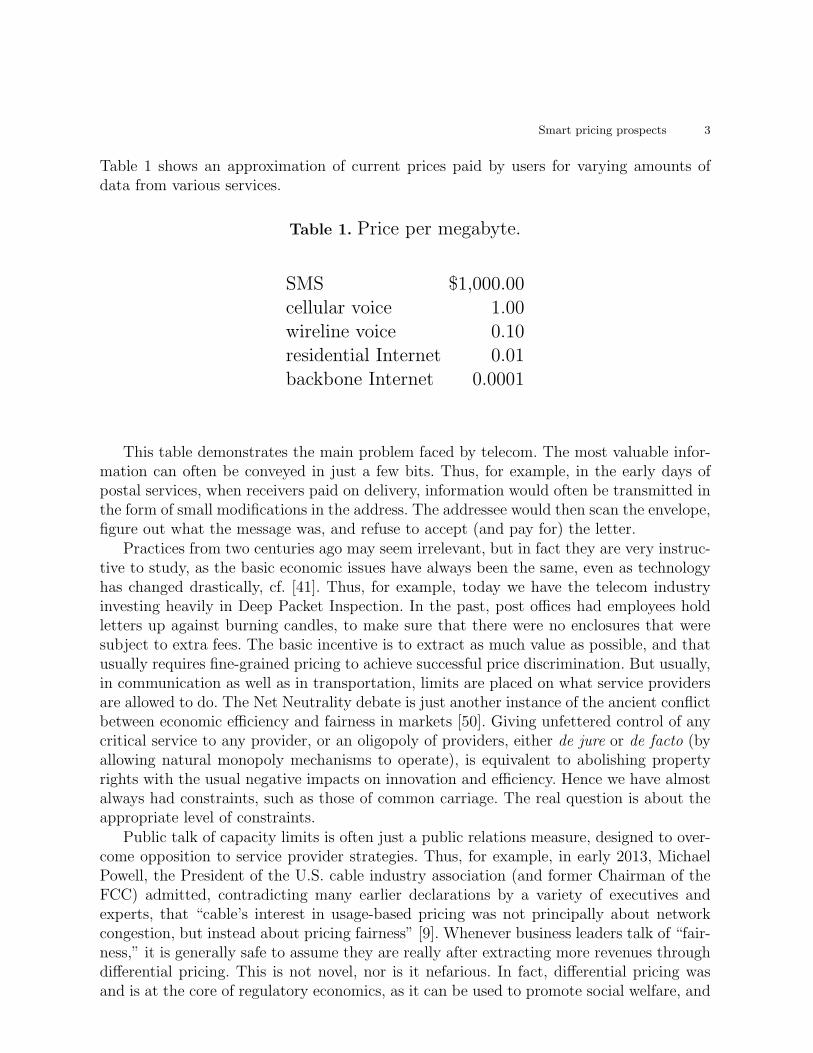
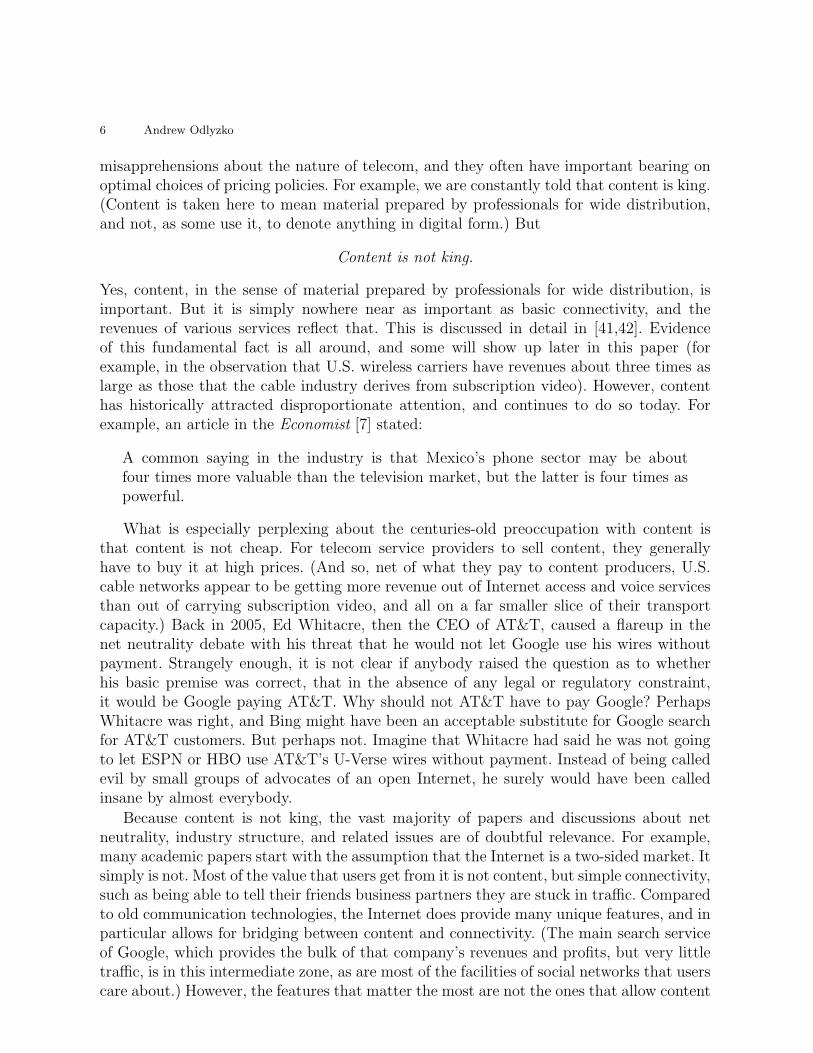
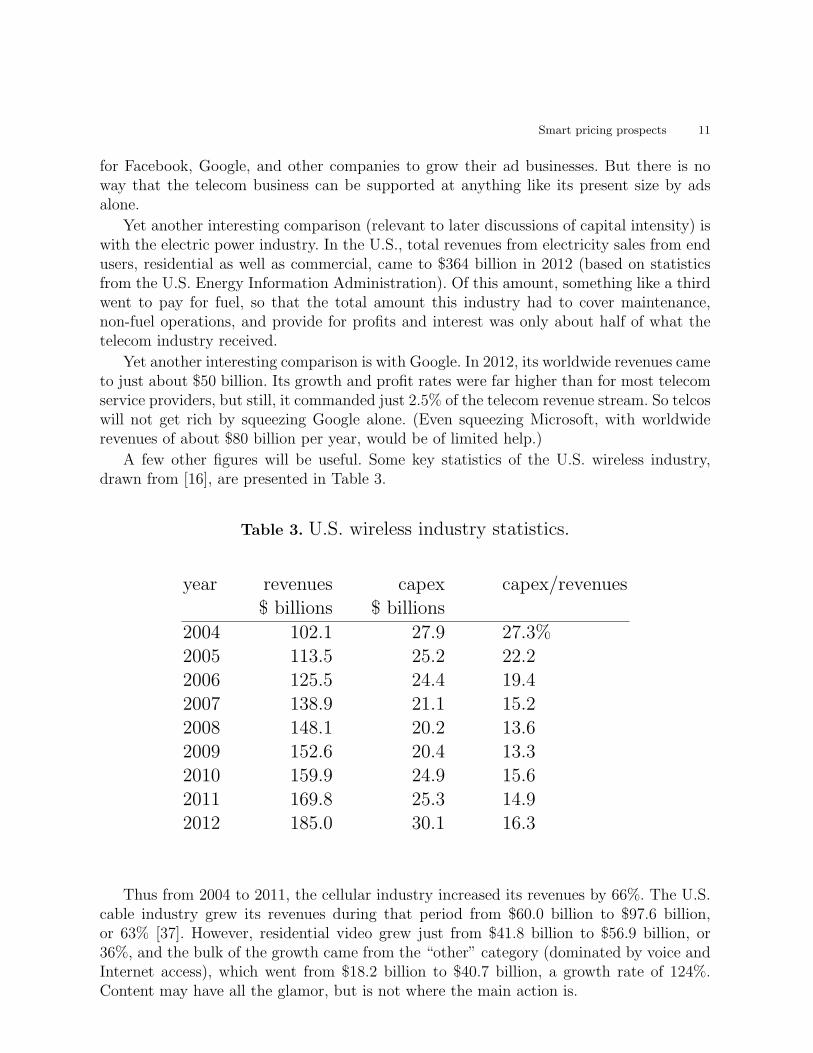
A few other figures will be useful. Some key statistics of the U.S. wireless industry,drawn from [16], are presented in Table 3.
Table 3. U.S. wireless industry statistics.
year revenues capex capex/revenues$ billions $ billions
2004 102.1 27.9 27.3%2005 113.5 25.2 22.22006 125.5 24.4 19.42007 138.9 21.1 15.22008 148.1 20.2 13.62009 152.6 20.4 13.32010 159.9 24.9 15.62011 169.8 25.3 14.92012 185.0 30.1 16.3
Thus from 2004 to 2011, the cellular industry increased its revenues by 66%. The U.S.cable industry grew its revenues during that period from $60.0 billion to $97.6 billion,or 63% [37]. However, residential video grew just from $41.8 billion to $56.9 billion, or36%, and the bulk of the growth came from the “other” category (dominated by voice andInternet access), which went from $18.2 billion to $40.7 billion, a growth rate of 124%.Content may have all the glamor, but is not where the main action is.
12 Andrew Odlyzko
6 The high potential for profits in telecommunications
The telecom industry has often earned very high profits. For example, the British PostOffice had an extraordinarily high net profit margin of 68% in 1839, on the eve of the PennyPost reform [41]. (This was a conscious move to tax first class letters. It served primarilyas just another tax, to help pay for the general government expenses, and secondarily asa subsidy for the “content” inside newspapers, which were carried for free.) More recently,over the last few years, Carlos Slim Helu has been ranked as the richest person in theworld. This resulted largely from the splendid profits of Telmex and Telcel, which enjoydominant positions in Mexican communications, and, by most evaluations, manage to keepprices high and penetration of advanced services low in a poor country.
Monopolies have at times been very innovative, and have worked to lower costs andpromote usage. The examples of the pre-1840 British Post Office and of Mexican telecomindustry today (as well as many others, including many governments in recent times whichmilked the telecom sector to support other activities) suggest that in telecom, the incentivesmay not always point in that direction. Instead, short-term profit maximization can oftenbe achieved by raising prices and limiting usage. Advocates of the Penny Post reform inBritain not infrequently promised that the increase in business from the new, lower andsimpler, postage rates, would compensate for decreased revenue per letter. This did nothappen, and the profits from this service declined drastically. Still, no serious attemptsto go back were made, as the reform was wildly popular, both for lowering the costs ofcommunication and for the simplicity it brought, with the complex system of distance-dependent tariffs and limitations to a single sheet dispensed with.
On the other hand, the Penny Post reform did lead to a switch from a regime of staticrevenues to one of rapid growth. This is a phenomenon that has occurred a number oftimes when prices were simplified and lowered, a phenomenon that typically does not fitthe economic models used to support “smart pricing,” which tend to be static. While ittook a quarter century, eventually British Post Office profits exceeded those attained beforethe Penny Post reform [41].
7 Telco (r)evolutions
The historical pattern, going back centuries, has been for telecommunications to growfaster than the economy as a whole [41]. That applied also at the end of the 20th century.Among the OECD countries, telecommunications revenue as a fraction of GDP increasedfrom 2.13% in 1985 and 2.36% in 1995 to 3.58% in 2001 (Table 3.2 on p. 77 of [53]). Thatwas the high point, though, and over the last few years it has been close to 3%. One ofthe contemporary justifications offered for the Internet bubble was the expectations thatthe creation of the Internet, allowing interconnection of the growing number of comput-ers, would yield dramatic productivity improvements, and this would stimulate increasedspending on telecom. Some analysts predicted that the fraction of GDP going to the thissector would double. It did for some countries (Korea went from 2.05% in 1990 to 4.70%in 2002, and was at 4.36% in 2011), but overall the growth has been far more modest. TheU.S. went from 2.71% in 1995 to 4.10% in 2001, and then down to 3.51% in 2011. Thus it
Smart pricing prospects 13
appears that modern economies are only willing to expand around 3% of their output ontelecommunications.
What is especially intriguing is that some countries that are not just rich, but haveexcellent telecom infrastructures, manage to spend only modest amounts on that industry.There are some outliers (Luxembourg and Norway, in particular, with 1.2% of GDP goinginto telecom) that can be disregarded, since they have very high incomes per capita, sothat looking at fractions of GDP conceals substantial total spending. However, Finlandat 2.58% and Sweden at 1.51% (both for 2011) provide intriguing examples that deservedeeper investigations.
In addition to overall growth, there have been large additional changes inside the in-dustry. The most obvious one is the rise of wireless. In terms of the number of peopleserved, and the revenues and profits, it dwarfs the Internet. (It was also built primarilyon the value of the low-bandwidth voice and messaging services, and until recently, thecontribution of content to this growth has been negligible.) According to statistics in [53](Table 3.4), mobile revenues accounted for 47.8% of total telecom revenues in the OECDcountries in 2011, 39.9% in the U.S., and a record high of 84.4% in Japan. (This figurefor Japan is suspiciously high, as it is hard to imagine how that country could maintainand expand its wired infrastructure on just 15.6% of telco revenues that came to 2.85%of GDP in 2011. Accordingly to Table 4.1.12 in [53], in June 2012 Japan had almost halfof the OECD’s fiber connections, with 65% of its broadband subscribers on fiber.) Thusthe share of GDP that goes to wireline has been decreasing. It appears that wired servicessurvived largely because of a collapse in most of their costs.
In the U.S. setting, a rough rule of thumb a couple of decades ago, before the rise of theInternet, was that access, switching, and long distance each accounted for about a third ofthe total cost of the phone system. Today, only access is significant. This can be seen bylooking at financials of two prominent companies. Level 3, especially after its absorptionof Global Crossing, is universally regarded as the largest Tier-1 backbone carrier. Its shareof world Internet traffic has been estimated at 10 to 20% (partially depending on how onecounts its relatively new CDN business). Yet its revenues for 2012 were only $6.4 billion. Inthe worldwide telecom industry with revenues of $2 trillion (or even in the wireline sectorof that industry with revenues of $1 trillion), this is extremely small. This demonstratesthat long distance transport has become very inexpensive.
The other prominent company is Akamai, the largest CDN company. It has at varioustimes claimed to deliver up to 20% of the world Internet traffic. But its revenues in 2012were just $1.4 billion. Thus switching (of which Akamai has to do a lot), has also becomeinexpensive.
The same conclusions about the relatively low significance of long-distance transmissionand switching in modern telecom can also be reached by looking at prices for Internet transit(in which large customers, whether ISPs or businesses or universities, pay for access to theInternet) or for CDN services. At current CDN prices for about $0.01 to $0.02 per GB (inlarge volumes, several petabytes per month), the whole volume of world Internet traffic,still under 50,000 PB per month in mid-2013, would cost only $6 to 12 billion per year todeliver.
14 Andrew Odlyzko
The collapse in costs of switching and transport is what has led to the transformation ofthe effective architecture of the Internet documented in [25,26]. (The excess fiber buildoutof the Internet bubble was also an enabler of this transformation.) Tier-1 carriers such asLevel 3 have become much less significant, as lower-ranked ISPs have been interconnecting,and large content providers have been building out their own long-distance networks thatallow them to reach the ISPs at the edges.
Various other changes have taken place, often ones that appear not to have been doc-umented. For example, at least in the U.S., businesses used to provide a disproportionatefraction of telecom revenues through a conscious and government-sanctioned price discrim-ination policy. That price discrimination has disappeared, or even reversed, as enterprisesare able to obtain advantageous deals in many cases.
Several conclusions appear inescapable when one considers the figures cited above. Oneis that with practically all costs coming from the access piece, that is (for wired services)installing and maintaining the wire to the end user, the marginal costs of carrying extratraffic are close to negligible. Hence charging according to volume of traffic cannot easilybe justified on the basis of costs.
An even more fundamental implication of the new cost structure is for network en-gineering and management. An important goal of much of telecom research has been todevise ways to increase the engineering efficiency of the system. We now have practical ap-plications where this was achieved [21,22]. However, the high utilization there occurred incontrolled environments, with high volumes of predictable traffic, and with highly trainedprofessional managing the network. (Something similar has happened to the backbones ofthe public Internet. The low utilizations that were prevailed in the late 1990, cf. [40], havebeen increased in many, perhaps most, networks, although there are no publicly availablestatistics on the subject. This was a result of more attention paid to traffic engineering, aswell as slower rates of traffic growth, and slower progress in available transmission tech-nologies.) However, on a global scale, and from the perspective of the welfare of the entiresystem, any efficiency gains at the core have to be balanced against the costs at the edges.Given the imbalance we have, with edge costs dwarfing those at the core, it makes senseto overprovision the core to an absurd degree in order to keep things simple (and thusinexpensive) for the users at the edges. But of course optimizations are done locally, notglobally, so the temptation is always to introduce something clever that ends up hurtingthe system.
The final point is that the collapse of costs means that even with a diminished flowof funding for the wireline sector, it is possible to build high capacity networks. The bigquestion is whether one can induce incumbent service providers to do so.
8 Capital intensity
The telecom industry frequently boasts of its high capital investments. It is also widelyaccepted that this industry is characterized by very high fixed capital commitments. Butneither of these notions is true. For examples of truly capital intensive businesses, oneneeds to look at industries such as electric power, railroads, or highways.
Smart pricing prospects 15
In the OECD countries, telecom investment as fraction of revenues was 13.9% in 2011(Table 3.8 in [53]). U.S. wireless service providers have also been investing about 15% oftheir revenues in recent years, as is shown by Table 3. This has been typical also for thewireline telephone industry for the last half a century at least, with the exception of theInternet bubble years. Then investment spiked up to 27.2% of revenues for OECD as awhole. Similarly, the U.S. cellular industry invested close to 30% of its revenues in theearly 2000s, during its rapid growth phase. But now it is down to the traditional telco levelof about 15%. That is not very high by the standards of industries that are really capitalintensive.
A 2006 estimate of what is needed to maintain U.S. highways (not just the interstatesystem, but all major highways, but excluding local streets) at about their then level ofservice called for spending $223.4 billion in 2013 (Table 2.1 of [38]). Of this amount $125.1billion was to be for capital expenditures (with 40% of that for additional capacity), and$98.4 billion for operations and maintenance (ordinary repairs, snow removal, etc.). Actualexpenditures have fallen short of these desiderata, but the main point is that transportationexperts estimated that a healthy state of their industry required devoting 56% of the totalannual expenditures to capital investments.
A good way to compare capital intensity of different industries is to look at replacementcosts as compared to annual revenues. In 1913, U.S. railroads had book value of $16.6billion, and annual revenues of $3.2 billion (in current dollars) [65]. Thus it would havetaken 5 years of revenues to pay for the investment that went into creating that network.This comparison has to be treated with caution, in that the book value had a lot of whatwas then called “water” in it, so was overstated. On the other hand, book value wasalso understated, in that it was based on historical costs, and a brand new replacementof various lines, with the need to tear down buildings in cities that had become denselypopulated in the meantime, would have cost far more.
U.S. electric power industry had revenues of $364 billion in 2012, as was mentionedbefore, and of this something close to a third was accounted for by fossil fuel purchases.Hence a fairer comparison to telecom, where most of the “fuel” that provides value isgenerated by users, is closer to $250 billion, or half of telecom revenues. Yet the book valueof the U.S. electric power industry is around $1 trillion. Replacement cost would likely befar higher, as the NIMBY (“not in my backyard”) opposition, environmental concerns, andthe like have driven costs of construction very high. An extreme example is presented bythe nuclear power plants. Until recently, U.S. had 104 operational nuclear reactors thatprovided about 20% of the nation’s electricity. While there have been promises of noveldesigns for nuclear reactors that would be both safe and inexpensive to build, so far nonehave been shown to satisfy both criteria, and current estimates of building new ones areon the order of $5-10 billion each. Hence just replacing existing U.S. reactors would cost$500-1,000 billion.
Compared to roads, railroads, or the electric power industry, telecom is not very capitalintensive. Just one year of the OECD estimate of $526 billion telecom revenue for the U.S.would suffice to provide a brand new infrastructure, with fiber to almost every house orbusiness. For example, financial analysts estimate that wiring up from scratch every home
16 Andrew Odlyzko
in Kansas City with fiber would cost about $1,200 per household [24]. At that rate, everyone of the roughly 140 million households and business establishments could be coveredfor just $170 billion. Of course, not every place is as easy to operate as Kansas City, but ifwe exclude some small proportion of the nation (and the debates are whether this is 3%,5%, or 10%), we could accomplish a complete rewiring for under $200 billion.
In wireless, industry statistics show that cumulative capital investment, from the startof service three decades ago, came to $365 billion by the end of 2012 [16]. Much of thatinvestment has of course been written off, as old equipment gets replaced. So to replaceeverything (and it is far easier to replace telecom installations, even cell towers, than it isto replace electric power plants), would probably not cost more than half of the cumulativetotal, or about $180 billion. But just to be safe, let’s assume it would take $240 billion.
When we add this up, we find that a modern telecom infrastructure for the U.S., withfiber to almost every premise, would not cost more than $450 billion, well under one year’sannual revenue. But there is no sign of willingness to spend that kind of money by theindustry, even though Verizon is willing to pay $130 billion to buy out Vodafone’s share ofVerizon Wireless.
Hence we can indeed conclude that modern telecom is less about high capital invest-ments and far more a game of territorial control, strategic alliances, services, and marketing,than of building a fixed infrastructure.
9 Mysteries of investment, costs, profits, and prices
The relatively low capital intensity of telecommunications has to be placed in the propercontext. Industrialized countries in general have been reducing their capital investments.For example, in 2012, U.S. investment came to only 16.2% of GDP, as compared to about20% for most of the 1980s and 1990s [54]. Some sources put U.S. fixed capital formationrate even lower. For example, the World Bank reports U.S. investments at 20% of GDPas recently as 2006, but down to 14% in 2010 and 15% in 2011 [69]. (In contrast, China’scapital investments came to 46.1% of GDP in 2012 [54].)
The low capital investments in the rich economies is one of the major modern puzzles.Another one is the very high level of profits at the same time that interest rates arevery low. (This phenomenon, as well as the historically abnormally high fraction of profitsgoing to the finance sector, predates the crash of 2008 and the resulting action by monetaryauthorities to drive down interest rates.) Why don’t entrepreneurs take advantage of thoserecord low bond rates and compete away those abnormally high profits? (An interestingperspective is that in the 19th century, it was taken for granted that, just as basic economiclogic would predict, low interest rates go together with low corporate profits. It is only inmodern times that the mantra of low interest rates boosting profits has become dominant.)That would reduce the high unemployment and increase growth rates. Yet that is nothappening, showing that the normal dynamics of capitalism are not operating the waytheory and historical norms predict.
One worry is that a substantial part of the apparently high profits is an accountingmirage. After all, if profits can be moved around the world to escape all taxmen, so that
Smart pricing prospects 17
even Starbucks in the UK shows up as not making any profits, while the parent companyis thriving, how far can one trust any of these figures? But even if this is a factor, otherstatistics, such as the record lows of GDP going for wages, still present a conundrum.
An illustration of the these modern financial puzzles is provided by the valuation ofVerizon Wireless. At the price of $130 billion for the 45% share owned by Vodafone, theentire business is valued at almost $300 billion. Yet based on the capital investment figuresfor U.S. wireless industry cited in the previous section, the assets of this service providercould be replaced for something like $80 billion, a quarter of the market value. Traditionally,the Tobin Q (the ratio of market value to replacement cost) has been around 1 for mostindustries, and recently has been around 2. For wireless to be at twice even the elevatedlevel found elsewhere is remarkable. It likely reflects the inertia of the system. The limitedradio spectrum, multi-year contracts, and the like keep this sector locked up.
Yet another puzzle is the claim that building out fiber networks to the home is impos-sibly expensive. Yet at the cost of $1,500 per household (in excess of the $1,200 estimateof [24] for the Google project in Kansas City, were it to reach every household), and at acost of capital of 8% (which we are told is an impossible target for state and municipalpension funds to reach), this would cost only $10 per house per month. The problem isthat managers and their shareholders expect much higher rates of return than 8% per year.One of the paradoxes is that the same observers who claim that pension funds cannot hopeto earn 8% annually are also predicting continuation of much higher corporate profit rates.
Associated to the puzzle of high profits and low interest rates is the decreased relationof visible costs relevant to the ostensible provision of goods and services to the pricesand profits we see in the marketplace. Thus, for example, a recent investigation by a U.S.Senate committee found that among 30 for-profit colleges, “an average of 22.4 percentof revenue went to marketing and recruiting, 19.4 percent to profits and 17.7 percent toinstruction” [28]. The American for-profit higher education industry might be thoughtof as an outlier, in that its real business could be regarded as more to find naive andeducationally unqualified people who will sign up for student loans, and less to providereal education and training. However, it is not all that unusual (and is not certain justhow high the instructional spending is in the non-profit educational sector). Consider thepharmaceutical sector. The high cost of R&D there is supposed to be driving the economicsof this industry. Yet the statistics for the 19 largest pharmaceutical and biotech companiesin the world showed that of their healthcare revenues of $498 billion, $71 billion went forR&D, $110 billion for profits (a mixture of figures for 2006 and 2008 from [67]), and thebulk for various other expenses.
Similarly surprising statistics occur in telecom. A recent financial analyst report esti-mated that for Sprint and T-Mobile, the costs of running the network in 2012 came to31.1% and 26.7%, respectively, while the costs of acquiring new customers (just selling andmarketing expenses, and handset subsidies, but excluding overhead expenses, and resourcesdevoted to retaining current customers) were 26.6% and 22.1%, respectively [36].
Statistics such as those above demonstrate that the focus in our modern world is onseizing strategic bottlenecks in the economy and squeezing high profits out of them withas little investment as possible. Apple is an outstanding success at this (and so is Google).
18 Andrew Odlyzko
Apple’s own R&D expenditures are extraordinarily low for what is a shining light fortechnical innovation (much less than half of Nokia’s R&D spending in 2010, for example,cf. [64]). Most of the R&D that makes Apple products attractive is performed by suppliersthat have to accept very modest profits. More than that, the key advantage that Applehas now is the plethora of apps for its devices, apps built largely by independent suppliers.These app developers received $6.5 billion over four years [59], but there are about 300,000of these developers, so the average payout has been very modest. On the other hand, Applehas been earning each quarter more than twice in profits as much as all the app developersearned in revenue in four years ($13.1 billion in the fourth quarter of 2012).
It is noteworthy that initially Apple had a closed app system, and it achieved successby opening it up to outside developers, but keeping tight control.
The conclusion of this discussion is that the modern economy is full of paradoxes, anddoes not fit the traditional model of how capitalism is supposed to function. But in anyevent, it appears that service providers are reluctant to invest much, but are anxious toobtain high profits. Thus the drive for “smart pricing” is natural. On the other hand,the low marginal costs of handling actual traffic means that there is a lot of flexibility inpricing. Hence user preferences can play substantial role, no matter what management’sfavorite models tell them to do.
10 A historical vignette: Bridger Mitchell and flat rates
In evaluating prospects for various pricing plans it is useful to take a historical view,especially since this is almost never done. For instance, modern arguments in favor of“smart pricing” for data networks are nowhere near as strong as those a century ago for thevoice telephone network. In those days, the industry faced high marginal costs (primarilythose of the human operators involved in setting up calls), so the case for charging for callswas overwhelming in the standard model the industry used. Arguments can be made thatmoving to usage based pricing was instrumental in promoting the spread of telephony inlarge cities, cf. [23]. However, what is most remarkable is that flat rates persisted in mostof the U.S. It does not appear that the industry ever tried to understand how it happened,or why they were prospering with the supposedly irrational and ruinous flat pricing model.
An excellent example of the strength of the “smart pricing” dogma is offered by by anarticle of Bridger Mitchell from 1978 on charging for local voice calls [34]. It was based onan earlier and more extensive Rand report issued two years earlier, acknowledged extensivecomments and suggestions from numerous other researchers in the field, and was publishedin one of the most prestigious journals in economics. Hence it can be taken as representingthe consensus of the established telecom economics community of that time.
Unlike most papers and books in this area, Mitchell did not use strongly derogatoryterms for flat rates. However, a deep-seated bias against them pervades the paper. Thereis also a very obvious ignorance of their effects. Aside from the savings on the costs ofthe measurement and billing system, there is no hint that flat rates are advantageous foranyone, and it is hard not to draw the impression from the paper that they are just acancerous sore on the body politic, and ought to be eliminated as soon as possible.
Smart pricing prospects 19
While Mitchell did mention that “most telephone subscribers prefer flat rates,” that isas far as he went. Nowhere did he mention the experiments that showed that vast majoritiesof people in the AT&T experiments (and later in experiments at GTE) who were offereda choice continued with flat rates, even though it cost them more than switching to whatMitchell referred to as “usage-sensitive pricing” (USP) (also in the literature of the periodoften called local measured service (LMS)). Nor did he mention the analyses of the reasonsfor the preference. To what extent he had access to such studies is not clear. Some of thepeople he thanks for “comments and suggestions” were involved in the AT&T studies, butactual publication did not come until after the Mitchell paper appeared (such as [15,19,68]).However, there was plenty of older historical evidence on telecom pricing, and that also isnot mentioned.
The Mitchell paper started off with:
Although payment for nearly all other goods and services, including toll (longdistance) telephone calls, increases with greater consumption, nearly 90 percent ofthe residential telephone subscribers and more than half the business subscribers inthe United States now pay a flat monthly rate for local calls ...
Recently, however, the telephone companies and regulatory commissions havebeen moving cautiously towards imposing usage charges for local telephone calls. ...
This was then followed by a long recitation, taking up the rest of the first page, of variousreasons USP was supposedly advancing or about to advance in the U.S. (With the benefitof hindsight, we can tell those reasons were not strong enough. The trend went the otherway, with even long distance voice telephony moving towards flat rates.)
What was the basic justification for the move to USP? “[T]he costs of local service [had]moved upward since the late 1960’s at a rate not far below the general price index.” (Allquotes in this section not attributed to any other source are from the Mitchell paper.) Sothere was not a crisis caused by surging usage, just the general pressure to avoid raisingrates in a high-inflation environment that led to the Nixon wage-price freeze, which was fol-lowed by even more dramatic price escalation. On the other hand, “technological advances[had] benefited long distance far more than local telephone calling.” And what were theadvances that Mitchell cited? “Development in microwave communications, coaxial cable,satellites, and waveguides.” Certainly all these contributed to lowering costs of providingphone service. What is interesting is Mitchell listed only advances in transmission, andsaid nothing at all about switching. Electronic switching systems were advancing rapidlyby the mid-1970s. The Bell System introduced the 1ESS switch a decade earlier, for exam-ple. With the ongoing and widely recognized advances in computing technologies, it shouldhave been obvious that switching costs would decline dramatically (even if they had not atthat point), and that this would apply to local as well as long distance telephony. Mitchellwas not unaware of electronic switching, as in discussing the costs of metering local calls,he did mention that such costs were much lower in local offices with electronic exchangesthan in those with electro-mechanical ones, which made USP more attractive. But he com-pletely ignored the effect of the new technologies on the basic costs of switching, and thusof providing voice services.
20 Andrew Odlyzko
The one cost element that was clearly not going to decline to any appreciable extentwas local transmission, which meant primarily maintenance of the copper wire from thelocal central office to the customer. This was the 1970s, long before the era of the Internetor the various online computer services, and before PCs started penetrating households inany numbers. Hence only voice services were of interest to regulators, legislators, and thepublic. So the link to the home was expected to continue as a copper wire. And the costsof installing and maintaining that copper were almost completely independent of usage.Hence all the discussion about advantages of USP in Mitchell’s paper ignored the vitalpoint that the one component of costs of service that could not be appreciably reducedwould not be affected by switching to USP.
Mitchell noted that “[a] welfare analysis of two-part tariffs requires knowledge of de-mand at different prices.” However, “no data are available as yet on calling rates underusage-sensitive pricing,” so he proceeded to make a variety of assumptions (which he ad-mitted were simplified). Some of the questionable features of those assumptions will benoted below. However, this is not a careful review of his paper, so not everything is ex-amined. The point is just to point out some of the more strikingly peculiar features of hiswork.
Mitchell decided to “[ignore] ... the dynamic effects of the number of subscribers in thetelephone network on the value of service to any one subscriber.” Today, it appears to bewidely understood that the number of users is extremely important in determining value,especially for new products and services. This is shown, for example, by the frequent invo-cations of Metcalfe’s Law, which does convey the message about the value of connectivity,even though though there are serious arguments that its quantitative form is incorrect [11].Interestingly enough, the first modern studies of network effects were carried out inside thephone industry by Jeff Rohlfs [57] some years before Metcalfe formulated his “Law” andbefore Mitchell wrote his paper. Still, as Mitchell explained, ignoring this effect was notunreasonable for voice telephony in the U.S. in the 1970s, where this service had achievedan almost complete penetration. He did cite some published papers that had consideredthe influence of this effect on the early development of the telephone system.
What Mitchell did not say, but was implicit in his analysis, is that he was also ignoringthe intensity of usage as a determinant of value. This is now widely recognized as important.Financial analysts, investors, and the press cite figures from social networks, say, or frommore neutral outside monitoring organizations such as comScore about the average lengthof time that users spend on those networks. The big change in this perception, that heavyusage increases value, took place in the early days of the Internet bubble, when AOL,then the dominant online service provider, switched from metered rates to flat ones [41].Management resisted the move, and was only induced to make it by competition, as itfeared (correctly) that the time spent online would jump. But once they moved to the newenvironment (assisted by improvements in technology, as well as presence of competitivelocal service providers who were able to lease modems for the AOL dial service at moreaffordable rates than the ILECs had charged), they came to appreciate the value of intensityof usage, and proudly hailed measures showing its was increasing. But that was two decadeslater, so one cannot fault Mitchell too much for ignoring it, as there were not many examples
Smart pricing prospects 21
of this effect playing a major role in telephony in his time. On the other hand, there wasextensive historical evidence of such effects, going back to the early days of postal services.An interested researcher could easily have discovered this.
Overall, Mitchell’s models are simplistic, but that is of necessity true of all economicmodels. Still, even given the low level of complexity that Mitchell limited himself to, thereare many questionable aspects of his work. For example, there is little analysis of thesensitivity of the results to basic assumptions. (This can be excused to some extent, ofcourse, since this was before the era of wide spread of desktop PCs and spreadsheets,so such calculations were not as easy to perform then as they are today.) In particular,Mitchell did not exhibit any combination of basic parameters for his model under whichflat rates are optimal. Yet such must exist. The logic of bundling (clearly understood tomerchants since time immemorial, and explicated in the economics literature in the 1960sand visible in Fig. 1 of Mitchell’s paper) argues that for some parameters flat rates providehigher profits for service providers.
The strangest omission on Mitchell’s part was of the basic comparison of U.S. andforeign volumes of usage. He allowed that one should do some real studies of the effects ofUSP. He also wrote that “new insights for U.S. practice could be gained from a comparativeanalysis of the telephone pricing and demand experience of foreign utilities that havelong operated with various forms of measured service.” (Note that what he regarded aspotentially valuable were just the lessons about applying USP, an indication of the deepbias against flat rates.) And earlier he cited briefly some Norwegian experiences with peak-load pricing. But nowhere did he even hint at the most salient difference between U.S. andthe rest of the world in the 1970s, namely that daily usage of a phone line was about threetimes higher in the U.S. than in the rest of the world (see [41] for data and references).This dramatic difference (especially when combined with a look at revenues of telcos indifferent countries) cast doubts on various of Mitchell’s estimates of marginal costs, as wellas his assumptions about marginal utilities and about the effects that USP might have onusage.
Another major issue, although one probably inevitable given the kinds of economicmodels that Mitchell relied on, was the static nature of his analysis. Consumers weresupposed to have certain willingness to spend, and once prices were changed, they wouldadjust quickly and settle into a new equilibrium usage pattern. Yet what we observe inpractice is that changes in pricing lead not only to an instantaneous response, but also tochanges in long-term growth rates. This occurred when AOL introduced flat rates in 1996.There was a quick jump, followed by vigorous growth, as opposed to static level of usageunder metered rates. Earlier, the same phenomenon took place with the introduction of thePenny Post in Britain in 1840, as well as with the drastic lowering of taxes on newspapersin 1836 [51].
In justice to the many researchers in the telecommunications economics communityit should be said that there were some papers that did consider some of the long-rangeeffects. Particularly noteworthy was the work of Jeff Rohlfs [57] on network effects. Also,about the time that the Mitchell paper [34] appeared, results from the AT&T and GTEexperiments with metered local rates were becoming available, and so the awareness of the
22 Andrew Odlyzko
limitations of the consensus view was becoming wider. But this consensus view continued,and continues, to dominate.
11 Another historical vignette: Flat rates for data
Another interesting historical vignette is the advocacy of flat rates for data services byLoretta Anania and Richard Jay Solomon. They were among the early pioneers researchingpricing of broadband services, in the days of ISDN and ATM [3,4,5]. They also appear tohave been unique in that community in arguing for flat rates. Furthermore, they had verygood arguments, based on excellent insights into data networks, in particular about thelack of direct relation between volume and value of data transfers.
There are at least two interesting aspects to the work of Anania and Solomon. Oneis the very limited impact it has had, as measured in citations. This appears to reflectthe strong bias in favor of “smart pricing.” The other interesting aspect of Anania’s andSolomon’s work is the limited range of arguments they presented, which reflects the lack onstudies of flat rates. Their early arguments for flat rates were basically limited to pointingout that users would have large opportunities to bypass service provider controls [4]:
... dynamic allocation of network resources will become increasingly difficult for thecarrier (or regulator) to track. So, with integrated digital networks, the flat-rate, orpay-in-advance subscription solution, may be the best method of pricing.
Later, they began to mention user preferences, but without much emphasis or detail [5].This can again be taken as an indication of how little attention has been paid historically toflat rates. This tradition continues. One can cite a variety of recent papers, such as [8,39],that fail to address many of the key advantages of flat rates.
Given all these precedents, it appears inevitable that the industry, and the networkingresearch community, will continue to press for “smart pricing.” As will be explained later,there are reasons to doubt whether they will be very successful. However, to the extentthey are, it appears they are neglecting some important aspect of implementing “smartpricing.”
12 Directions for smart pricing research and deployment
Current research directions on smart pricing are probably not optimal for influencing ap-plications. Most of the work appears to be inspired by the desire to control congestion,and to maximize the engineering efficiency of networks. However, engineering efficiency wasseldom the main driving force behind telecom pricing in the past, and it is not now. Farmore important has been the incentive to maximize revenues through price discrimination.While the basic incentives and practices of price discrimination are ancient, they were firstexplicated by the French “econo-engineers” of the middle of the 19th century [18]. Theirwork was motivated by the desire to understand business policies of the most revolutionaryindustry of that era, namely railroads. There is a memorable and oft-quoted 1849 passageon this subject by Jules Dupuit [17]:
Smart pricing prospects 23
It is not because of the few thousand francs which would have to be spent to puta roof over the third-class carriages or to upholster the third-class seats that somecompany or other has open carriages with wooden benches. ... What the companyis trying to do is to prevent the passengers who can pay the second-class fare fromtraveling third class; it hits the poor, not because it wants to hurt them, but tofrighten the rich. ... And it is again for the same reason that the companies, havingproved almost cruel to the third-class passengers and mean to the second-class ones,become lavish in dealing with first-class passengers. Having refused the poor whatis necessary, they give the rich what is superfluous.
This description is not an exaggeration. In fact, many railroads did not have any seats inthird-class carriages. Some refused to run any third-class carriages, and among those thatdid, such carriages went by special trains that were slow and ran at inconvenient times.Thus not only was “versioning” common, so was a form of what is now called “damagedgoods” practice, where extra costs were incurred in order to offer an inferior service at alower price. A contemporary account claimed that “the humbler order of passengers will noteasily forget that a [railway] director once proposed to hire a number of chimney-sweeps torender–what, with the best company, are nothing better than locomotive hutches–perfectlyuntenable” [6]. (It should be said that no evidence has been found that any chimney-sweepswere actually hired to make third-class travel less attractive. This was just a suggestion,but a very revealing one in explaining the motivations driving many policy decisions.)
The incentives that drove railroad managers to versioning and damaged goods havealso been present in telecommunications. One of the fundamental obstructions to the in-troduction of either fundamentally new networking technologies, or of sophisticated pricingfor the current ones, is that, in a slight paraphrase of Scott Bradner’s memorably pithyquote [10],
The Internet is not reliably bad enough to drive the creation of a new network.
But that could be changed through “damaged goods” practices. “Buffer-bloat,” whichis now an accidental impairment on many networks, could be introduced systematically.Various types of noise or artificial packet drops (coupled with Deep Packet Inspectionand statistical profiling, as is already done in various traffic-shaping practices) could beintroduced much more widely. For example, since the most valuable types of communicationtend to use little bandwidth (as will be discussed in more depth later), and voice is verylatency-sensitive, artificial increases in latency could decrease the quality of VoIP services.If smart pricing is to spread, there should be far more research on such approaches, andthey should be part of the standard networking courses.
There is also too little research on bamboozling customers. The financial analyst CraigMoffett and his colleagues noted that “[f]or years, the telecom industry has thrived on ob-fuscation” [35]. Even earlier, back in 1998, Scott Adams in one of his Dilbert books talkedof phone companies that “form confusopolies to make it impossible for the average indi-vidual to determine who has the lowest price,” [2], p. 161. Furthermore, there is now solidquantitative research that demonstrates the effectiveness of confusing users with complexpricing plans [32]. Hence this feature of complicated pricing deserves more attention bothin research programs and in the education of students for the workplace.
24 Andrew Odlyzko
13 Growth in demand
To evaluate prospects of various pricing schemes, we have to consider the balance of demandand supply of data transport.
Wireline traffic growth has been decelerating over the last few years, and is now takingmore than two years to double. This is shown by the mostly widely cited project to estimateand predict traffic growth, Cisco’s Visual Networking Index (VNI) [13]. The May 2013 VNIreport projects that the traffic on the wired Internet will grow only 25% from 2012 to 2013,and will have a compound growth rate of 21% from 2012 to 2017. The sources for the VNIstudies are confidential, though, and there are some estimates of growth rates that aresomewhat higher than those of VNI.
Here we cite some public data that generally support the VNI observations. (Referencesand URLs are available at [33].) The European IX association reports their aggregate peaktraffic growth has declined from 57% in 2008 to 45% in 2012. TeleGeography estimatesthat the “[g]rowth in worldwide international Internet capacity declined from 63% in 2009to 33% in 2013,” [63]. Australia is an outlier among industrialized countries in that it isstill maintaining a high growth rate, at 59% during the year ended June 2013, just aboutthe same as the annual compound rate of 60% over the previous four years. However,Australia’s Internet traffic per capita is still only about half that of the U.S.
The most intriguing outlier in the available statistics is Japan. It has the most advancedinfrastructure in the world, in terms of fraction of wireline broadband subscribers who havefiber. Along with Hong Kong and South Korea, it usually shows up at the top of rankings byeffective speed of connections. Yet Japanese Internet traffic is relatively low, and is growingslowly. The latest measurement from the remarkable cooperative industry effort, coveringabout 40% of the Japanese market (see [33]), taken in May 2013 and kindly provided byKenjiro Cho (see also [12] for earlier but more detailed summary) shows a continuation ofthe 20-25% annual growth rate of wireline traffic that has prevailed over the last half adozen years.
In wireless, the calls for urgent action to deal with the perceived spectrum shortage wereand continue to be fueled by reports and predictions of data traffic more than doublingeach year (cf. [66], p. 76 and [1,56]).
In Australia, the data downloaded to mobile handsets grep 43% from the 4th quarterof 2012 to the 2nd of 2013, an annual rate of 105%. However, in the U.S., the growth of123% from 2010 to 2011 moderated to 69% in the following year. The Cisco VNI of May2013 projects a 66% annual growth rate of mobile data between 2012 and 2017. While thisis a substantial decline from earlier VNI projections, it is doubtful whether even that ratecan be sustained for long, as will be discussed in the next section.
While growth rates for wireless traffic far exceed those for wireline, it is importantto remember that total volumes of data transmitted by mobile wireless technologies (soexcluding WiFi) are still low. For both Australia in mid-2013 and the U.S. for year-end2012, they were under 3% of total Internet traffic for those countries. Thus the potentialdemand just from people switching their usage from wireline to wireless is huge.
Smart pricing prospects 25
14 Technology trends
The three main ingredients of the ICT (information and communication technologies)industry are computing, storage, and communication. They have all been riding the Moore’sLaw curve, with relatively steady and relatively predictable rates of improvement. (See [33]for some statistics and references.) Those rates have declined, but over the last few years,the amount of raw computing, or raw storage, or basic photonic transmission that can beperformed for a unit cost has been doubling about every two years. While there have alwaysbeen fears that progress might grind to a halt, that has not happened, even though thereare various indications of slowdowns. But perhaps even more important than a generalslowdown is that locality is becoming more pronounced. While magnetic storage densitiesare still increasing rapidly, the bandwidth to disks is growing much more slowly. Similarly,much of the improvement in raw computing power is now coming from putting morecores on a chip, but the bandwidth to the chip is an increasingly important barrier to theutilization of that power. Thus in both computing and storage, data moves less, or, as thedatabase community has been saying for a long time, is becoming “cooler.”
The arrival of the Internet led to a dramatic jump in data traffic in the mid-1990s,when for a while there actually was the “Internet traffic doubling every 100 days” phe-nomenon. This was followed by several years of doubling every year. However, for most ofthe last decade, worldwide Internet traffic growth has been decelerating, as discussed inthe previous section. It is not impossible that it may fall substantially below the level ofgrowth in computing power and storage, as has been predicted by the Cisco measurementand forecasting effort [13], especially since that has happened in Japan.
On the other hand, the volumes of either broadcast video or of magnetic disk storagedwarf the Internet’s transmission capacity. Thus should masses of people suddenly “cutthe cord” and attempt to obtain their favorite TV programs over the Internet, networkswould collapse under the load. However, there is no sign of that happening, the switchto the more natural mode of on-demand viewing is proceeding fairly slowly (facilitatedby kludgy half-way solutions such as video recorders). Similarly, there is great promise inmachine-to-machine communication, but it is also arriving at a measured pace. Thereforewireline networks do have an incentive to encourage innovative uses of their facilities. Thisincentive is especially important because of the competition from wireless. As we havediscovered over the last three decades, mobility is extremely attractive. Both usage andinvestment are moving towards wireless, and if application developers concentrate theirenergies on the low traffic, small screen size, and low power mobile devices, wireline couldbecome a backwater.
As for mobile wireless, it is very difficult to estimate the growth of transmission ca-pacity, because there are so many technological and economic dimensions to this problem.Currently, the shift to 4G and LTE offers a quantum jump in data capacity. However,beyond that, the possible improvements in modulation and related approaches appear tobe rather limited. The industry is aiming for a 1000x boost, and while it usually does saythat the time frame for this jump in traffic is impossible to predict, it does cite prominentlythe recent 2x annual growth rates, cf. [1,56]. It appears very unlikely that even 50% peryear growth rates could be maintained for long.
26 Andrew Odlyzko
Note that one of the favorite routes to increasing capacity, namely assigning morespectrum for mobile wireless, can offer only limited relief. The National Broadband Planreleased by the Federal Communications Commission in March 2010 reports that the U.S.currently has 547 megahertz that can be used for such purposes, and calls for doublingthat within 10 years [66]. However, such a doubling would only compensate for one year of100% annual growth, and of two years of 50% annual growth.
Substantial improvements in capacity could be achieved just by building more facilities,but that would require greatly increased capital spending. That could come from eitherhigher revenues from users, or from restructuring the industry so it spends less on mar-keting, lobbying, and other activities, and more on construction. Since neither is likely tohappen, we are likely to see traffic limited by available capacity. Combined with the widedisparity of various types of bits, this suggests that pricing will play a significant role inbalancing demand and supply.
For wired networks, the capacity limitations of mobile wireless, as well as the “mentaltransactions costs” that are likely to be imposed by pricing, leave a substantial opening.However, to exploit their advantage, they will need to encourage use, and that argues forthe simplest possible pricing, which is flat rate.
15 Conclusions
As technology advances, implementing “smart pricing” is becoming easier. Further, thedeep (and irrational) prejudice in favor of “smart pricing” will likely drive the industryand academic researchers to continue pursuing a variety of schemes, some to the point ofdeployment.
At the same time, general technology advances are complicating life, and intensifyingusers’ desire for simplicity. In the wireline arena, we find rapid improvements in transmis-sion capacity, and relatively slow growth in demand from consumers. This creates incentivesfor service providers to stimulate usage, and thus argues for flat rates and simple networks,with large pipes, with any market segmentation determined by the size of the pipe.
In wireless, technology improvements are slower, and likely demand growth faster. Thusin this area pricing is likely to play a larger role. But the human desire to avoid “mentaltransaction costs” will still argue for simplicity, at least at individual consumer level.
There may well be more sophistication at the business to business level, when compa-nies contract with service providers to provide certain transmissions in ways invisible toconsumers, just as today Amazon sells ebooks with the wireless delivery achieved seam-lessly by an established carrier. The arguments for simplicity are not as important at thebusiness-to-business level as it is with consumers, since companies come closer to the eco-nomic rationality so beloved by experts. However, it is not clear whether “smart pricing”will spread far even there, since managers appear to much prefer strategic games to realmarket. Furthermore, the example of Apple’s app store shows that even at the level ofbusinesses, there are advantages to simplicity.
Smart pricing prospects 27
Acknowledgements
This paper was prepared with the partial support of DARPA contract FA8750-13-2-0023on “The evolution of control plane resilience.”
References
1. 4G Americas, Meeting the 1000x Challenge: The Need for Spectrum, Tech-
nology and Policy Innovation, white paper, October 2013. Available at〈http://www.4gamericas.org/documents/2013 4G
2. S. Adams, The Dilbert Future: Thriving on Business Stupidity in the 21st Century,
HarperCollins, 1998.3. L. Anania and R. J. Solomon, “User arbitrage and ISDN,” InterMedia, Jan. 1988, pp. 25–
31.4. L. Anania and R. J. Solomon, “Models of network infrastructure: Pricing ISDN for
access,” in J. H. Alleman and R. D. Emmerson, eds., Perspectives on the Telephone
Industry: The Challenge for the Future, Harper & Row, 1989, pp. 287–303.5. L. Anania and R. J. Solomon, “Flat—The minimalist price,” in L. W. McKnight and
J. P. Bailey, eds., Internet Economics, MIT Press, 1997, pp. 91–118.6. Anonymous, “Railway comfort,” Household Words: A Weekly Journal Conducted by
Charles Dickens, Aug. 3, 1850, pp. 449–450.7. Anonymous, “Let Mexico’s moguls battle,” Economist, Feb. 4, 2012.8. J. M. Bauer and S. S. Wildman, “The economics of usage-based pric-
ing in local broadband markets,” NCTA white paper, Dec. 2012,〈http://i.ncta.com/ncta com/PDFs/Wildmanreport web.pdf〉.
9. K. Bode, “Cable industry finally admits caps not about congestion after in-sisting for years caps were about congestion,” DSL Reports, Jan. 17, 2013.〈http://www.dslreports.com/shownews/Cable-Industry-Finally-Admits-Caps-Not-About-Congestion-122791〉.
10. S. Bradner, “Will there be a next-generation network?,” Network World, July 21, 2003.〈http://www.networkworld.com/columnists/2003/0721bradner.html〉.
11. B. Briscoe, A. Odlyzko, and B. Tilly, “Metcalfe’s Law is wrong,” IEEE Spectrum, July2006, pp. 26–31. Available at 〈http://www.spectrum.ieee.org/jul06/4109〉.
12. K. Cho, “Broadband traffic report: Traffic trends over the past year,” In-
ternet Infrastructure Review, vol. 16, August 2012, pp. 33-37. Available at〈http://www.iij.ad.jp/en/company/development/iir/pdf/iir vol16 report EN.pdf〉.
13. Cisco Visual Networking Index,〈http://www.cisco.com/en/US/netsol/ns827/networking solutions sub solution.html〉.
14. R. N. Clarke, “Costs of neutral/unmanaged IP networks,” Review of
Network Economics, vol. 8, no. 1, March 2009. Preprint available at〈http://ssrn.com/abstract=903433〉.
15. J. G. Cosgrove and P. B. Linhart, “Customer choices under local measured telephoneservice,” Public Utilities Fortnightly, Aug. 30, 1979, pp. 27–31.
28 Andrew Odlyzko
16. CTIA - The Wireless Association, Semi-Annual Year-End 2012 Top-Line Survey Re-
sults, 〈http://files.ctia.org/pdf/CTIA Survey YE 2012 Graphics- FINAL.pdf〉.
17. R. B. Ekelund, “Price discrimination and product differentiation in economic theory:An early analysis,” Quarterly Journal of Economics, vol. 84, no. 2, 1970, pp. 268–278.
18. R. B. Ekelund, Jr., and R. F. Hebert, Secret Origins of Microeconomics: Dupuit and
the Engineers, Univ. Chicago Press, 1999.
19. L. Garfinkel and P. B. Linhart, “The transition to local measured telephone service,”Public Utilities Fortnightly, Aug. 16, 1979, pp. 17–21.
20. L. Garfinkel and P. B. Linhart, “The revenue analysis of local measured telephoneservice,” Public Utilities Fortnightly, Oct. 9, 1980, pp. 15–21.
21. C.-H. Hong, S. Kandula, R. Mahajan, M. Zhang, V. Gill, M. Nanduri, and R. Watten-holer, “Achieving high utilization with software-driven WAN,” ACM SIGCOMM 2013,〈http://conferences.sigcomm.org/sigcomm/2013/papers/sigcomm/p15.pdf〉.
22. S. Jain, A. Kumar, S. Mandal, J. Ong, L. Poutievski, A. Singh, S. Venkata, J. Wan-derer, J. Zhou, M. Zhu, J. Zolla, U. Holzle, S. Stuart, and A. Vahdat, “B4: Ex-perience with a globally-deployed software defined WAN,” ACM SIGCOMM 2013,〈http://conferences.sigcomm.org/sigcomm/2013/papers/sigcomm/p3.pdf〉.
23. R. R. John, Network Nation: Inventing American Telecommunications, Harvard Univ.Press, 2010.
24. C. Kirjner and R. Parameswaran, “Google Fiber – How much will Google spend tooverbuild Kansas City? How much would it cost to expand?,” BernsteinResearch report,April 8, 2013.
25. C. Labovitz, S. Iekel-Johnson, D. McPherson, J. Oberheide, F. Jahanian,and M. Karir, ATLAS Internet Observatory 2009 Annual Report, available at〈http://www.nanog.org/meetings/nanog47/presentations/Monday/Labovitz ObserveReport N47 Mon.pdf〉.
26. C. Labovitz, S. Iekel-Johnson, D. McPherson, J. Oberheide,and F. Jahanian, “Internet inter-domain traffic,” ACM Com-
puter Communication Review, Oct. 2010, pp. 75-86. Available at〈http://www.sigcomm.org/sites/default/files/ccr/papers/2010/October/1851275-1851194.pdf〉.
27. D. Levinson and A. Odlyzko, “Too expensive to meter: The influence oftransaction costs in transportation and communication,” Phil. Trans. Royal
Soc. A, vol. 366, no. 1872, 2008, pp. 2033-2046. Preprint available at〈http://ssrn.com/abstract=1735657〉.
28. T. Lewin, “Senate committee report on for-profit colleges condemns costs and prac-tices,” New York Times, July 30, 2012.
29. D. Lyons, “Internet policy’s next frontier: Data caps, tiered service plans, and usage-based broadband pricing,” Federal Communications Law Journal, vol. 66, no. 1, 2013,to appear. Preprint available at 〈http://ssrn.com/abstract=2239921〉.
30. S. Marek, “AT&T’s Stephenson: Content players will subsidize consumer’s data,”FierceWireless, May 15, 2013, 〈http://www.fiercewireless.com/story/atts-stephenson-content-players-will-subsidize-consumers-data/2013-05-15〉.
Smart pricing prospects 29
31. S. McCartney, “Flier auctions: Better seats, going once, going twice ...,” Wall Street
Journal, April 25, 2013.32. M. Miao and K. Jayakar, “Bounded rationality and consumer choice: An eval-
uation of consumer choice of mobile bundles in China.” Preprint available at〈http://ssrn.com/abstract=2241581〉.
33. MINTS, Minnesota Internet Traffic Studies project. Available at〈http://www.dtc.umn.edu/mints/〉.
34. B. M. Mitchell, “Optimal pricing of local telephone service,” American Economic Re-
view, vol. 68, no. 4, Sept. 1978, pp. 517-537.35. C. Moffett, N. Del Deo, and A. Chan, “Quick take – AT&T (T): Market share(ing)
Part II ... A quieter voice,” BernsteinResearch report, July 18, 2012.36. C. Moffett and N. Del Deo, “Sprint: How long is long-term?,” MoffettNathanson Re-
search report, Oct. 11, 2013.37. National Cable & Telecommunications Association, cable industry revenue 1996 - 2011,
〈http://www.ncta.com/Stats/CustomerRevenue.aspx〉. Downloaded Sept. 28, 2012.38. National Cooperative Highway Research Program (NCHRP), Future Dinanc-
ing Options to Meet Highway and Transit Needs, Dec. 2006. Available at〈http://onlinepubs.trb.org/onlinepubs/nchrp/nchrp w102.pdf〉.
39. A. Nevo, J. L. Turner, and J. W. Williams, “Usage-based pricing anddemand for residential broadband,” preprint, Sept. 2013. Available at〈http://ssrn.com/abstract=2330426〉.
40. A. Odlyzko, “The current state and likely evolution of the Internet,”Proc. Globecom’99, IEEE, 1999, pp. 1869–1875. Preprint available at〈http://www.dtc.umn.edu/∼odlyzko/doc/globecom99.pdf〉.
41. A. M. Odlyzko, “The history of communications and its implications for the Internet,”2000 unpublished manuscript, available at 〈http://ssrn.com/abstract=235284〉.
42. A. M. Odlyzko, “Content is not king,” First Monday, vol. 6, no. 2, February 2001,http://firstmonday.org/htbin/cgiwrap/bin/ojs/index.php/fm/article/view/833/742.
43. A. M. Odlyzko, “Internet pricing and the history of communications,”Computer Networks, vol. 36, 2001, pp. 493–517. Preprint available at〈http://ssrn.com/abstract=235283〉.
44. A. M. Odlyzko, “Talk, Talk, Talk: So who needs streaming videoon a phone? The killer app for 3G may turn out to be–surprise–voice calls,” Forbes, August 20, 2001, p. 28. Preprint available at〈http://www.dtc.umn.edu//∼odlyzko/doc/3g.accidental.success.txt〉.
45. A. M. Odlyzko, “The many paradoxes of broad-band,” First Monday, vol. 8, no. 9, Sept. 2003.〈http://firstmonday.org/htbin/cgiwrap/bin/ojs/index.php/fm/article/view/1072/992〉.
46. A. M. Odlyzko, “Telecom dogmas and spectrum alloca-tions,” 2004 paper written for the Wireless Unleashed blog,〈http://www.dtc.umn.edu/∼odlyzko/doc/telecom.dogmas.spectrum.pdf〉.
47. A. M. Odlyzko, “The evolution of price discrimination in transportation and its impli-cations for the Internet,” Review of Network Economics, vol. 3, no. 3, September 2004,pp. 323–346. Preprint available at 〈http://ssrn.com/abstract=596301〉.
30 Andrew Odlyzko
48. A. M. Odlyzko, “Threats to the Internet: Too muchor too little growth?,” Internet Evolution, Feb. 25, 2008,〈http://www.internetevolution.com/author.asp?section id=592&doc id=146747&〉.
49. A. M. Odlyzko, “The delusions of net neutrality,”Telecommunications Policy Research Conference, 2008,〈http://www.dtc.umn.edu//∼odlyzko/doc/net.neutrality.delusions.pdf〉.
50. A. M. Odlyzko, “Network neutrality, search neutrality, and the never-ending conflictbetween efficiency and fairness in markets,” Review of Network Economics, vol. 8, no. 1,March 2009, pp. 40–60. Preprint available at 〈http://ssrn.com/abstract=1095350〉.
51. A. M. Odlyzko, “The volume and value of information,” International Journal of Com-
munication, vol. 6, 2012, 〈http://ijoc.org/ojs/index.php/ijoc/article/view/1570/740〉.
52. A. Odlyzko, B. St. Arnaud, E. Stallman, and M. Weinberg, Know Your Limits: Con-
sidering the Role of Data Caps and Usage Based Billing in Internet Access Service,
Public Knowledge, 2012. Available at 〈http://publicknowledge.org/files/UBP
53. OECD, OECD Communications Outlook 2013,
〈http://www.oecd-ilibrary.org/science-and-technology/oecd-communications-outlook-2013 comms outlook-2013-en〉.
54. T. Orlik, “Beijing falls short on rebalancing,” Wall Street Journal, May 23, 2013.
55. Plunkett Research, Advertising & Banding Industry Overview,〈http://www.plunkettresearch.com/advertising-branding-market-research/industry-statistics〉. Downloaded Sept. 26, 2013.
56. Qualcomm, Inc., The 1000x Mobile Data Challenge: More Small Cells, More
Spectrum, Higher Efficiency, July 25, 2013 presentation deck. Available at〈http://www.qualcomm.com/media/documents/tags/1000x-challenge〉.
57. J. Rohlfs, “A theory of interdependent demand for a communications service,” Bell
Journal of Economics and Management Science, vol. 5, 1974, pp. 16–37.
58. S. Sen, C. Joe-Wong, S. Ha, and M. Chiang, “A survey of broadband data pricing:Past proposals, current plans, and future trends,” to be published. Preprint available at〈http://arxiv.org/pdf/1201.4197v2.pdf〉.
59. D. Streitfeld, “As boom lures app creators, tough part is making a living,” New York
Times, Nov. 18, 2012.
60. B. Swanson, “The coming exaflood,” Wall Street Journal, Jan. 20, 2007.
61. B. Swanson and G. Gilder, “Estimating the exaflood,” Discovery Institute white paper,Jan. 29, 2008, 〈http://www.discovery.org/a/4428〉.
62. N. Szabo, “The mental accounting barrier to micropayments,” 1996 white paper,〈http://szabo.best.vwh.net/micropayments.html〉.
63. TeleGeography, “Europe emerges as global Internet hub,” Sept. 18, 2013 press release,〈http://www.telegeography.com/products/commsupdate/articles/2013/09/18/europe-emerges-as-global-internet-hub/〉.
64. A. Troianovski and S. Grundberg, “Nokia’s bad call on smartphones,” Wall Streen
Journal, July 19, 2012.
65. U.S. Department of Commerce, Bureau of the Census, Historical Statistics of the United
States: Colonial Times to 1970, 1975.
Smart pricing prospects 31
66. U.S. Federal Communications Commission, Connecting America: The National Broad-
band Plan, March 2010, available at 〈http://download.broadband.gov/plan/national-broadband-plan.pdf〉.
67. Wikipedia entry for the pharmaceutical industry,〈http://en.wikipedia.org/wiki/Pharmaceutical industry〉. Downloaded Oct. 7, 2013.
68. T. F. Wong, “Identifying tariff induced shifts in the subscriber distribution of local tele-phone usage,” in L. Courville, A. de Fontenay, and R. Dobell, eds., Economic Analysis
of Telecommunications: Theory and Applications, North-Holland, 1983, pp. 263–278.69. World Bank, Gross fixed capital formation (% of GDP), interactive table at
〈http://data.worldbank.org/indicator/NE.GDI.FTOT.ZS〉, downloaded May 27, 2013.