Embed Size (px)
Citation preview
Will Penny
StatisticalParametricMapping
Nested OscillationMEG
Configural
SPM
MultivariateAnalysisSource Reconstruction
Replay
Statistical Parametric Mapping, MultivariateAnalysis and Brain Connectivity
Will PennyWellcome Trust Centre for Neuroimaging.University College London.
Workshop on Statistics, Machine Learning and Neuroscience,International Conference on Machine Learning (ICML).29th June 2012, Edinburgh.
Will Penny
StatisticalParametricMapping
Nested OscillationMEG
Configural
SPM
MultivariateAnalysisSource Reconstruction
Replay
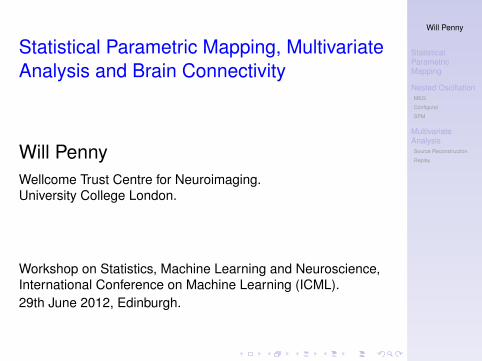
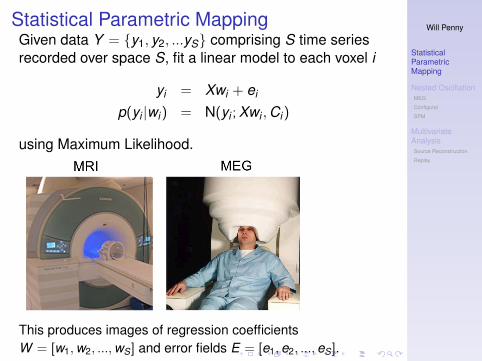
Statistical Parametric MappingGiven data Y = {y1, y2, ...yS} comprising S time seriesrecorded over space S, fit a linear model to each voxel i
yi = Xwi + ei
p(yi |wi) = N(yi ;Xwi ,Ci)
using Maximum Likelihood.
This produces images of regression coefficientsW = [w1,w2, ...,wS] and error fields E = [e1,e2, ...,eS].
Will Penny
StatisticalParametricMapping
Nested OscillationMEG
Configural
SPM
MultivariateAnalysisSource Reconstruction
Replay
Statistical Parametric Mapping
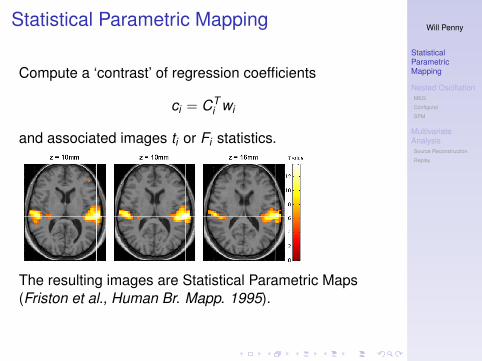
Compute a ‘contrast’ of regression coefficients
ci = CTi wi
and associated images ti or Fi statistics.
The resulting images are Statistical Parametric Maps(Friston et al., Human Br. Mapp. 1995).
Will Penny
StatisticalParametricMapping
Nested OscillationMEG
Configural
SPM
MultivariateAnalysisSource Reconstruction
Replay
Statistical Parametric Mapping
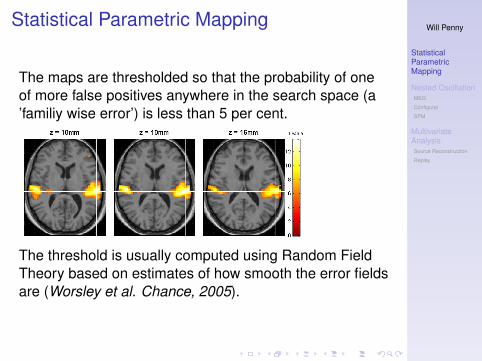
The maps are thresholded so that the probability of oneof more false positives anywhere in the search space (a’familiy wise error’) is less than 5 per cent.
The threshold is usually computed using Random FieldTheory based on estimates of how smooth the error fieldsare (Worsley et al. Chance, 2005).
Will Penny
StatisticalParametricMapping
Nested OscillationMEG
Configural
SPM
MultivariateAnalysisSource Reconstruction
Replay
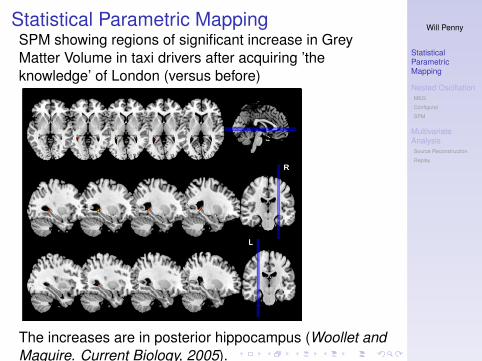
Statistical Parametric MappingSPM showing regions of significant increase in GreyMatter Volume in taxi drivers after acquiring ’theknowledge’ of London (versus before)
The increases are in posterior hippocampus (Woollet andMaguire. Current Biology, 2005).
Will Penny
StatisticalParametricMapping
Nested OscillationMEG
Configural
SPM
MultivariateAnalysisSource Reconstruction
Replay
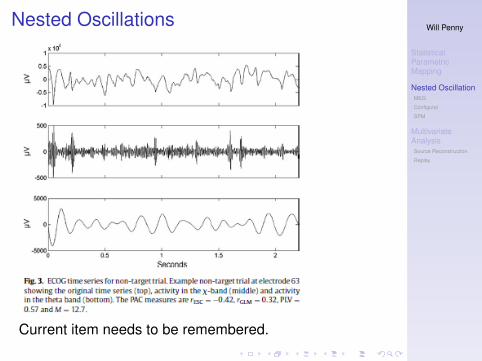
Nested Oscillations
Current item needs to be remembered.
Will Penny
StatisticalParametricMapping
Nested OscillationMEG
Configural
SPM
MultivariateAnalysisSource Reconstruction
Replay
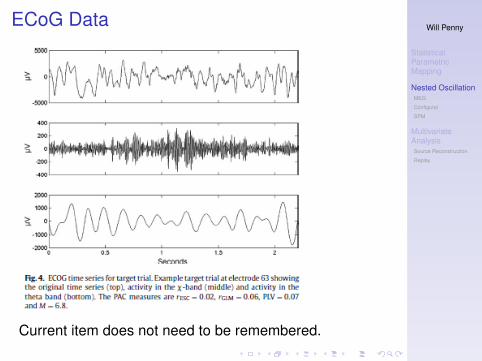
ECoG Data
Current item does not need to be remembered.
Will Penny
StatisticalParametricMapping
Nested OscillationMEG
Configural
SPM
MultivariateAnalysisSource Reconstruction
Replay
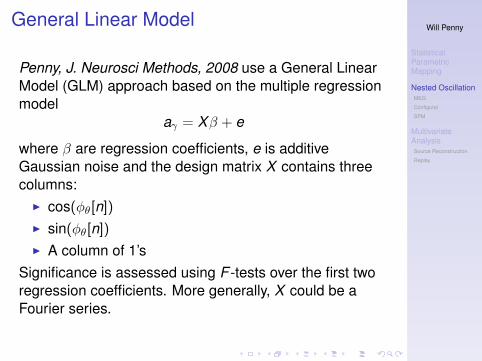
General Linear Model
Penny, J. Neurosci Methods, 2008 use a General LinearModel (GLM) approach based on the multiple regressionmodel
aγ = Xβ + e
where β are regression coefficients, e is additiveGaussian noise and the design matrix X contains threecolumns:
I cos(φθ[n])I sin(φθ[n])I A column of 1’s
Significance is assessed using F -tests over the first tworegression coefficients. More generally, X could be aFourier series.
Will Penny
StatisticalParametricMapping
Nested OscillationMEG
Configural
SPM
MultivariateAnalysisSource Reconstruction
Replay
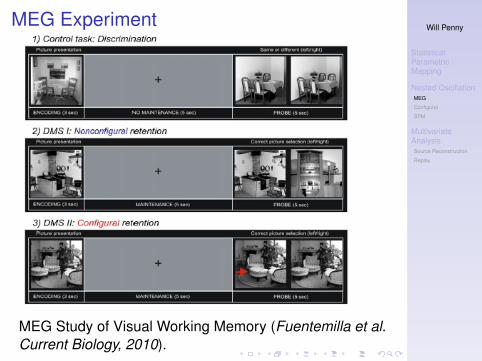
MEG Experiment
MEG Study of Visual Working Memory (Fuentemilla et al.Current Biology, 2010).
Will Penny
StatisticalParametricMapping
Nested OscillationMEG
Configural
SPM
MultivariateAnalysisSource Reconstruction
Replay
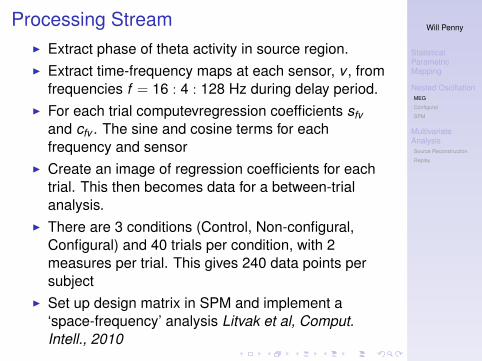
Processing StreamI Extract phase of theta activity in source region.I Extract time-frequency maps at each sensor, v , from
frequencies f = 16 : 4 : 128 Hz during delay period.I For each trial computevregression coefficients sfv
and cfv . The sine and cosine terms for eachfrequency and sensor
I Create an image of regression coefficients for eachtrial. This then becomes data for a between-trialanalysis.
I There are 3 conditions (Control, Non-configural,Configural) and 40 trials per condition, with 2measures per trial. This gives 240 data points persubject
I Set up design matrix in SPM and implement a‘space-frequency’ analysis Litvak et al, Comput.Intell., 2010
Will Penny
StatisticalParametricMapping
Nested OscillationMEG
Configural
SPM
MultivariateAnalysisSource Reconstruction
Replay
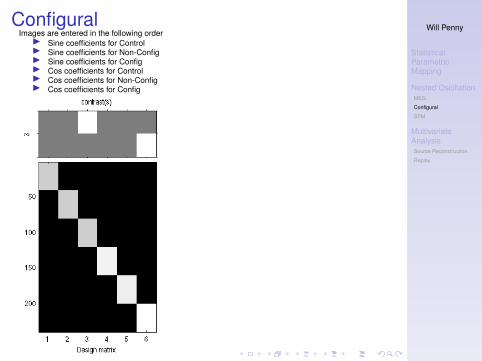
ConfiguralImages are entered in the following order
I Sine coefficients for ControlI Sine coefficients for Non-ConfigI Sine coefficients for ConfigI Cos coefficients for ControlI Cos coefficients for Non-ConfigI Cos coefficients for Config
Will Penny
StatisticalParametricMapping
Nested OscillationMEG
Configural
SPM
MultivariateAnalysisSource Reconstruction
Replay
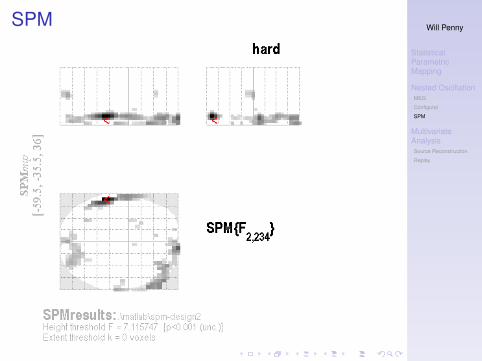
SPM
Will Penny
StatisticalParametricMapping
Nested OscillationMEG
Configural
SPM
MultivariateAnalysisSource Reconstruction
Replay
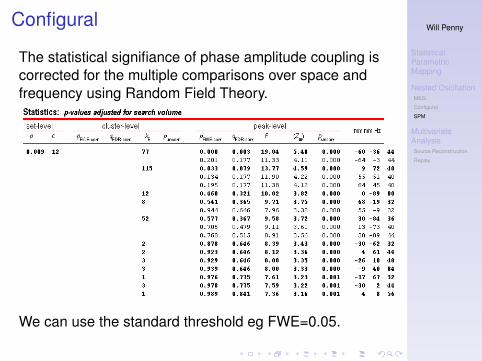
Configural
The statistical signifiance of phase amplitude coupling iscorrected for the multiple comparisons over space andfrequency using Random Field Theory.
We can use the standard threshold eg FWE=0.05.
Will Penny
StatisticalParametricMapping
Nested OscillationMEG
Configural
SPM
MultivariateAnalysisSource Reconstruction
Replay
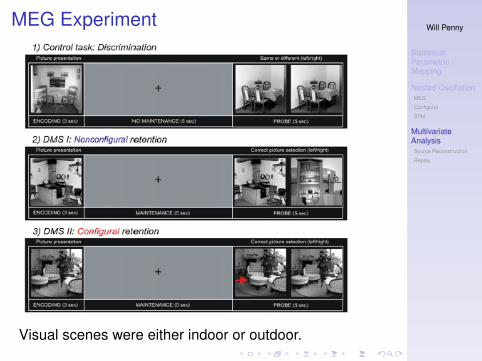
MEG Experiment
Visual scenes were either indoor or outdoor.
Will Penny
StatisticalParametricMapping
Nested OscillationMEG
Configural
SPM
MultivariateAnalysisSource Reconstruction
Replay
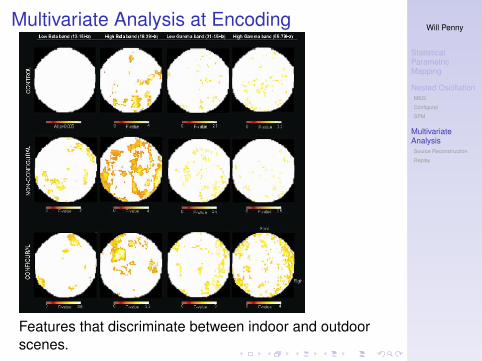
Multivariate Analysis at Encoding
Features that discriminate between indoor and outdoorscenes.
Will Penny
StatisticalParametricMapping
Nested OscillationMEG
Configural
SPM
MultivariateAnalysisSource Reconstruction
Replay
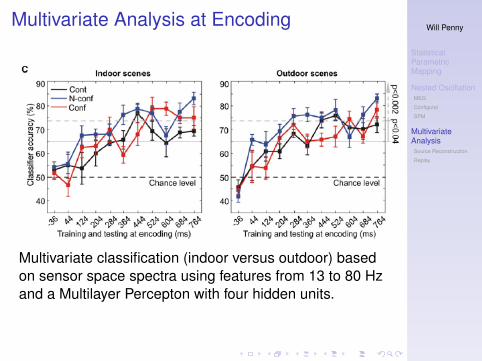
Multivariate Analysis at Encoding
Multivariate classification (indoor versus outdoor) basedon sensor space spectra using features from 13 to 80 Hzand a Multilayer Percepton with four hidden units.
Will Penny
StatisticalParametricMapping
Nested OscillationMEG
Configural
SPM
MultivariateAnalysisSource Reconstruction
Replay
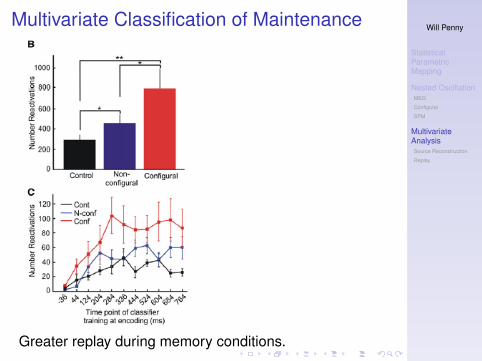
Multivariate Classification of Maintenance
Greater replay during memory conditions.
Will Penny
StatisticalParametricMapping
Nested OscillationMEG
Configural
SPM
MultivariateAnalysisSource Reconstruction
Replay
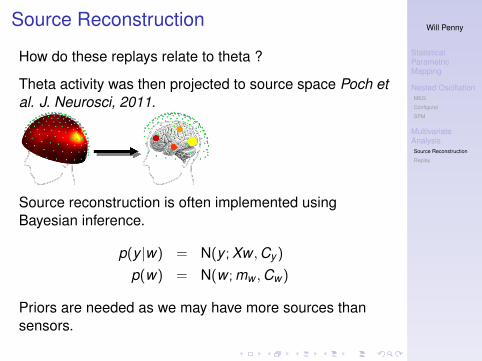
Source Reconstruction
How do these replays relate to theta ?
Theta activity was then projected to source space Poch etal. J. Neurosci, 2011.
Source reconstruction is often implemented usingBayesian inference.
p(y |w) = N(y ;Xw ,Cy )
p(w) = N(w ;mw ,Cw )
Priors are needed as we may have more sources thansensors.
Will Penny
StatisticalParametricMapping
Nested OscillationMEG
Configural
SPM
MultivariateAnalysisSource Reconstruction
Replay
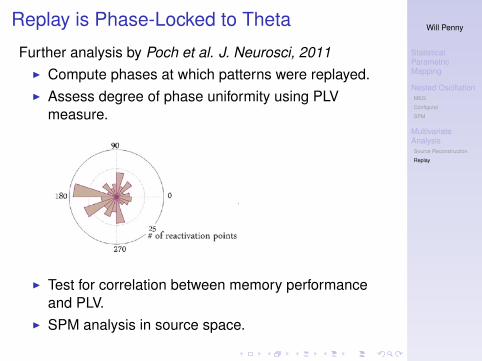
Replay is Phase-Locked to Theta
Further analysis by Poch et al. J. Neurosci, 2011I Compute phases at which patterns were replayed.I Assess degree of phase uniformity using PLV
measure.
I Test for correlation between memory performanceand PLV.
I SPM analysis in source space.
Will Penny
StatisticalParametricMapping
Nested OscillationMEG
Configural
SPM
MultivariateAnalysisSource Reconstruction
Replay
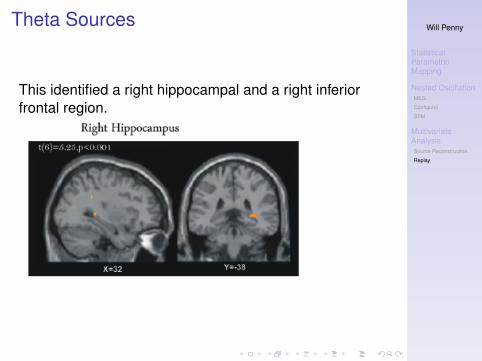
Theta Sources
This identified a right hippocampal and a right inferiorfrontal region.
Will Penny
StatisticalParametricMapping
Nested OscillationMEG
Configural
SPM
MultivariateAnalysisSource Reconstruction
Replay
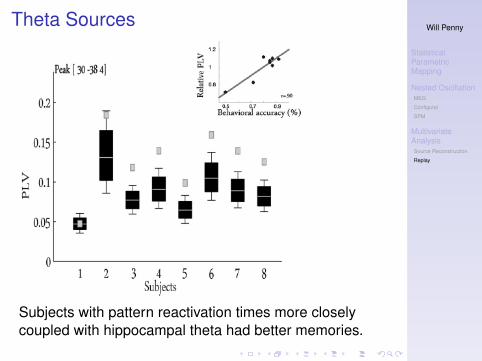
Theta Sources
Subjects with pattern reactivation times more closelycoupled with hippocampal theta had better memories.
Will Penny
StatisticalParametricMapping
Nested OscillationMEG
Configural
SPM
MultivariateAnalysisSource Reconstruction
Replay
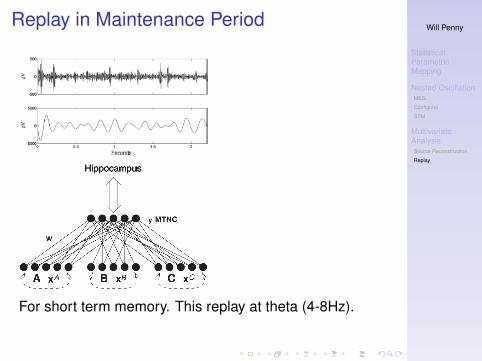
Replay in Maintenance Period
For short term memory. This replay at theta (4-8Hz).
Will Penny
StatisticalParametricMapping
Nested OscillationMEG
Configural
SPM
MultivariateAnalysisSource Reconstruction
Replay
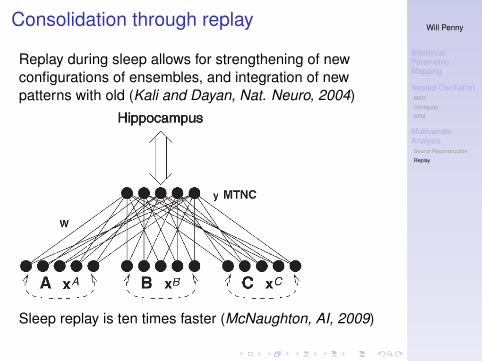
Consolidation through replay
Replay during sleep allows for strengthening of newconfigurations of ensembles, and integration of newpatterns with old (Kali and Dayan, Nat. Neuro, 2004)
Sleep replay is ten times faster (McNaughton, AI, 2009)
Will Penny
StatisticalParametricMapping
Nested OscillationMEG
Configural
SPM
MultivariateAnalysisSource Reconstruction
Replay
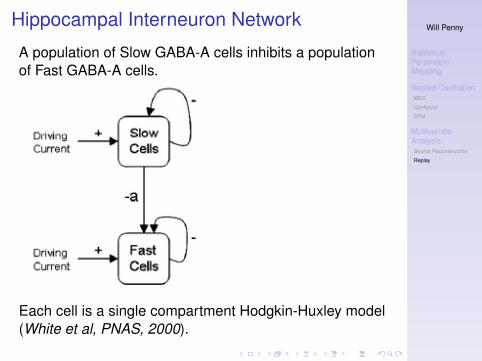
Hippocampal Interneuron Network
A population of Slow GABA-A cells inhibits a populationof Fast GABA-A cells.
Each cell is a single compartment Hodgkin-Huxley model(White et al, PNAS, 2000).
Will Penny
StatisticalParametricMapping
Nested OscillationMEG
Configural
SPM
MultivariateAnalysisSource Reconstruction
Replay
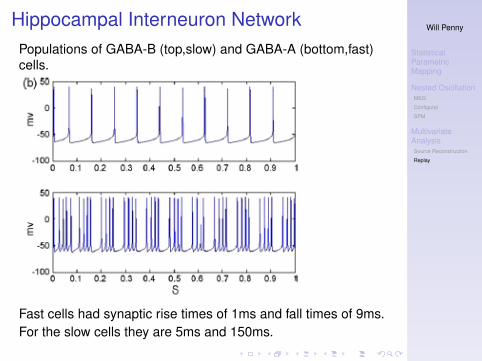
Hippocampal Interneuron NetworkPopulations of GABA-B (top,slow) and GABA-A (bottom,fast)cells.
Fast cells had synaptic rise times of 1ms and fall times of 9ms.For the slow cells they are 5ms and 150ms.