Embed Size (px)
Citation preview
Compliance with the Planning Standards in Regulating
Building Lines. The Case of Kisii Town, Kenya
Wilfred Ochieng OMOLLO*1 * Corresponding author 1 Kisii University, Department of Planning and Development, Kisii, KENYA
E-mail: [email protected]
DOI: 10.24193/JSSP.2020.2.04 https://doi.org/10.24193/JSSP.2020.2.04
K e y w o r d s: spatial planning, building lines, planning standard, non-compliance, Kisii town, Kenya
A B S T R A C T
1. INTRODUCTION
Most countries in Africa are witnessing rapid
urbanization, a trend that has given rise to the
proliferation of unplanned settlements. The current
population of 1.3 billion people on the continent in
2020 is projected to double by 2050, over 80% of whom
will be residing in urban areas. This is an indication that
countries should develop strategies that would
guarantee a suitable environment for their citizens to
comfortably live and work (Muggah and Hill, 2018).
This may, however, not be accomplished if land-use
regulation is not prioritized as one of the pillars of
economic development by sternly enforcing building
development control regulations (Atamewan, 2019;
Olujimi, 1992). Such failures eventually present
challenges in the implementation and enforcement of
planning standards mostly in the cities of the
developing countries (Keivani, 2010).
A standard is a document unanimously
established and ratified by a recognized institution that
provides for mutual and recurrent use, rules, guidelines
or characteristics for activities or their results, aimed at
attaining the optimum degree of order in a given
context (International Organization for
Standardization, 2020). It measures quality or the
Centre for Research on Settlements and Urbanism
Journal of Settlements and Spatial Planning
J o u r n a l h o m e p a g e: http://jssp.reviste.ubbcluj.ro
Planning standards provide a basis for controlling land use to attain orderly spatial development. This study examined the extent to
which developments in Kenya have been complying with the planning standard on building lines, having Kisii town as a case study. It
also investigated the factors contributing to the observed non-compliance. The analysis was based on the public interest theory of
regulation. A sample size of 364 residential developments was randomly and proportionately drawn from the seven neighbourhoods.
Remote sensing and questionnaires were used to collect data and thereafter analyzed using GIS, descriptive and inferential statistics.
Research findings disclosed that most residential developments did not comply with the recommended building lines. The results of
hypothesis similarly confirmed low compliance that was statistically significant. Non-compliance was found to be caused by the failure
of the County Government of Kisii to ensure that developers obtained the obligatory development permissions in addition to meeting
other requirements namely using registered professionals and ensuring regular inspection of buildings during construction. Also, the
interpretation of the applicable planning standards of building lines by the County Government when approving building plans was
misleading and eventually contributed to non-compliance. These problems ensue due to insufficient development control, therefore
contributing to unsustainable spatial development. This study addresses a critical issue in spatial planning practice and aims to
contribute to the specialist literature by demonstrating how compliance with the planning standards that regulate building lines may be
statistically and spatially evaluated.
Wilfred Ochieng OMOLLO
Journal of Settlements and Spatial Planning, vol. 11, no. 2 (2020) 95-111
96
requisite degree of excellence (Arku et al., 2016;
Olujimi, 2008). Planning standards, therefore, denote
the regulatory measures that are established by
planning authorities to control land use development
(Omollo, 2020a; Clarke 1994). The target is that
developers should not perform below the minimum
standards (for instance, 50% of the building coverage
ratio), though the target is usually the upper limit. They
embody statutory instruments that are premeditated to
safeguard, regulate, conserve and distribute land in the
interest of the public together with controlling the
character, appearance and arrangement of buildings
and facilities (Kabando and Pu, 2014; Otieno, 2012;
Onokerhoraye and Omuta, 1986; Agbola, 1985).
Planning standards are also known to set the
lawful limits of the use of public and private land to
attain a spatial structure that promotes the
development control principles of safety, access,
conservation, conformity and compatibility (Omollo,
2020b; Omollo et al., 2018, Makato, 2013). However, as
observed by Akeem et al. (2018), weak implementation
of planning standards due to insufficient administrative
and political goodwill undermines the implementation
of approved land use development plans.
From the foregoing, this study has two
objectives. First, to explore the extent to which
residential developments in Kenya, namely in Kisii
town, comply with the planning standards that regulate
building lines. Second, to examine the factors that
influence the non-compliance with the recommended
building lines in Kisii town. The study also tests the
hypothesis that there is no statistically significant
difference between the recommended planning
standards on the building lines and the observed extent
of compliance in the case of residential developments in
Kisii town. The variable “building line” was
operationalized as defined under the Physical Planning
(Building and Development) (Control) Rules in 1998
(the Government of Kenya, 1998) to mean, a line is
drawn across a plot such that no building or
permanent structure (except a wall of approved
design) may be constructed between that line and the
road fronted by the plot.
The current study was motivated by three
emerging issues. First, although the county
governments in Kenya are mandated to undertake
development control, they often lack empirical evidence
on the extent to which the planning standard on
building lines are complied with by developers. Second,
the literature is scarce on how compliance with building
lines may be analyzed statistically and spatially. The
current study sought to fill this gap. Third, for the
County Government of Kisii (CGOK) and other key
policy formulating bodies to effectively discharge their
legislative or policy formulation role, they require
evidence supported with a sound theoretical
underpinning on what prompts developers not to
comply with the planning standards. The study,
therefore, sought to provide a point of reference for
drafting key legislation and policies that may influence
the regulation of buildings development.
A growing body of literature states that
developers seldom comply with planning standards. For
instance, Kumar and Pushplata (2017) found out that
the recommended building coverage ratio in Shimla,
India, exceeded the prescribed planning standard
resulting in lesser open space that could not support
landscaping, recreation, and plantation purposes. In
Hong Kong, Yau et al. (2009) observed that
unauthorized external walls of buildings posed serious
threats to the safety of the community since 98% of
them were constructed without approval from the
planning authority. A contrasting study by Kumudini
and Wickramarachchi (2018) in Galle Fort-Sri Lanka, a
United Nations Educational, Scientific and Cultural
Organization heritage site established that 7.23% of
developers disregarded the recommended maximum
building height standard of 10 floors under the pretext
that such regulation would hinder the attraction of
tourists.
According to Kamarulzaman et al. (2019),
although planning standards should also apply to the
renovation of buildings, this was not the case in
Malaysia owing to weak enforcement along with limited
collaboration between policy makers and practising
professionals. In a related study in the city of Old Salt,
Jordan, Alnsour and Meaton (2008) found out that
level of public awareness regarding planning standards
did not translate into compliance. Key variables that
influenced compliance comprised enforcement,
monitoring, size of the households and their average
monthly income. The findings are in line with that of by
Arku et al. (2016) who revealed that although
developers in Accra city, Ghana, were aware of the
building regulations, this did not contribute to
compliance during construction. On the contrary,
Hameed and Albazaz (2019) established that the level of
awareness of developers influenced compliance with the
planning standards in the city of Baghdad. The study,
however, agrees with that of Alnsour and Meaton
(2008) that income level influences compliance.
Studies have also been undertaken in Africa to
determine the extent of compliance with planning
standards. Sylvester (2014) established that 60% of
developments in Makurdi town, Nigeria, contravened
the approved development plan, in which case 57% of
the non-compliance was related to residential
construction. Further, in Nigeria, Obongha et al. (2016)
found out that most buildings disregarding standards
such as setbacks, building lines, and building coverage
ratio. In Uganda, Goodfellow (2013), through a case
study, argued that planning standards were more
enforced in Rwanda than in Uganda due to a positive
culture. According to Windapo and Cattell (2010),
developers in South Africa rarely comply with planning
standards due to inadequate professional qualifications
Compliance with the Planning Standards in Regulating Building Lines. The Case of Kisii Town, Kenya
Journal of Settlements and Spatial Planning, vol. 11, no. 2 (2020) 95-111
97
of site managers, an argument supported by Omollo
(2019) who established that the construction industry
in Kisii town, Kenya, faced challenges in regulation
because of contractors who had no formal training in
building construction.
Further in Kenya, Makato (2016) found a
negative correlation between building lines and the
building coverage ratio in Kitengela town. As the
building line increased, the building coverage ratio
conversely decreased. Compliance was low due to
inadequate supervision and inspection of buildings
under construction by the County Government of
Kajiado. A related study in Eldoret town by Ngetich et
al. (2016) established that 12% of the buildings violated
the minimum building line of 3 metres. Similarly, 49%
encroached on the distance between the fence on both
sides of the plot and the walls of the buildings.
From the reviewed literature, though it is
apparent that planning standards are infrequently
complied with, there is a scarcity in knowledge on how
compliance with the standard that regulates building
lines may be statistically and spatially analyzed.
Besides, in the case of previous studies attempting to
establish that standards of building heights, setbacks
and building lines were disregarded, the adopted
methodologies were descriptive, with no attempt to
incorporate field measurements to spatially quantify the
extent of non-compliance. The current study aimed to
fill this gap by working on quantifiable observations
through onsite measurements. This approach was
adopted because it depicts the magnitude of the
problem by accurately demonstrating the extent of
compliance with the recommended planning standards.
The study was guided by the theory of regulatory
compliance that advocates for regulation in a market
economy.
The paper is organized into four sections,
addressing different, but related aspects. The first
section presents an introduction that covers study
objectives, hypothesis, a justification for undertaking
the study and literature review. While the second
section is focused on theory and methodology, the third
section delves on the results and discussions of the
research findings. The fourth section presents a
conclusion based on the stated objectives. It also
highlights the policy implications of the research
findings in addition to the proposed recommendations
towards compliance with the recommended building
lines in Kisii town.
2. THEORY AND METHODOLOGY
2.1. Theory
This study was guided by the Theory of
Regulatory Compliance (TRC) which supports the need
to comply with regulations. The theory materialized in
the 1970s when its protagonists argued that compliance
with the sanctioning rules or regulations significantly
contributes to positive results (Fiene, 2016). In the
current study, the theory reinforces why developers in
Kisii town should comply with the planning standard
that regulates building lines. To link the theory with the
applicable legislative framework in Kisii town, Rule 12
(2) (a-b) of the Physical Planning Rules of 1998
(Building and Development) (Control), issued by the
Government of Kenya (1998) as legal notice number
135/1998 has set the minimum width of building lines
that developers ought to comply with. To ensure the
implementation of this regulation, section 56 (a) of the
Physical and Land Use Planning Act (PLUPA) (the
Government of Kenya, 2019) gives the county
governments the power to control the use and
development of land and buildings to ensure orderly
development. Since the CGOK is the statutory planning
authority in Kisii town, it ought to take advantage of the
stated provision in the PLUPA to enforce the
requirements of the legal notice 135/1998 on building
lines through development control. This underpins the
application of the TRC in enforcing compliance with the
planning standards that regulate building lines in Kisii
town.
2.2. Methodology
2.2.1. Research design and philosophy
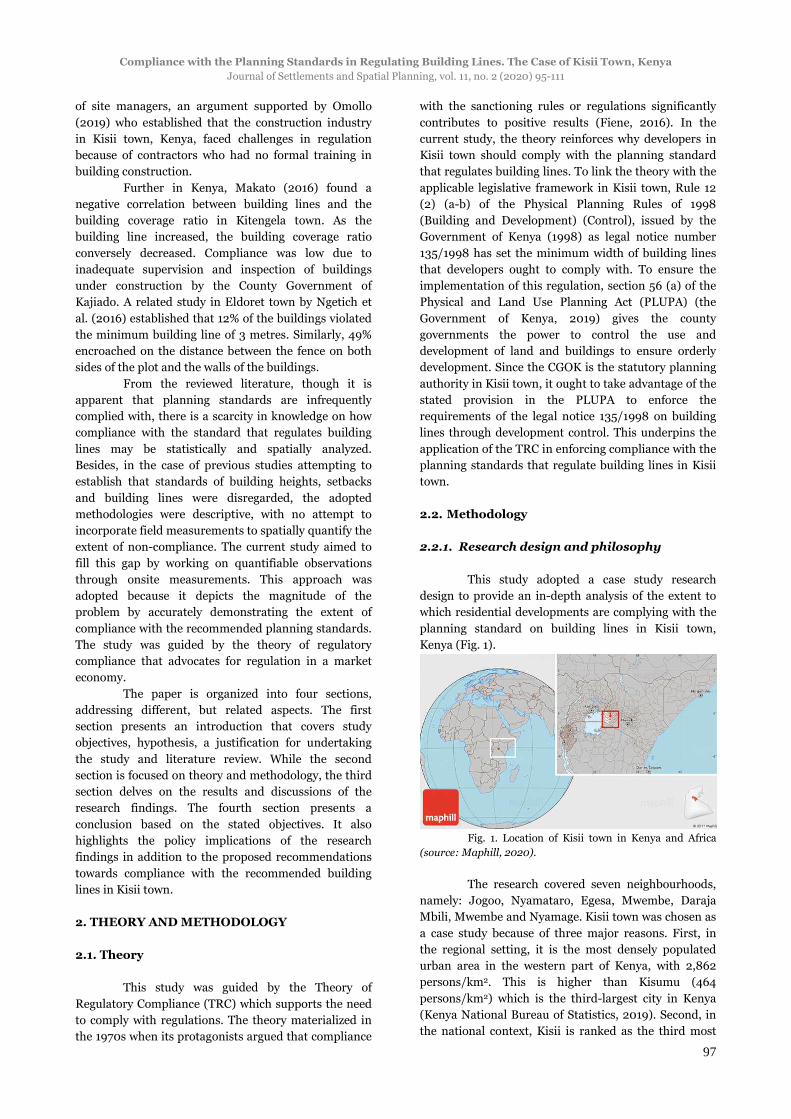
This study adopted a case study research
design to provide an in-depth analysis of the extent to
which residential developments are complying with the
planning standard on building lines in Kisii town,
Kenya (Fig. 1).
Fig. 1. Location of Kisii town in Kenya and Africa
(source: Maphill, 2020).
The research covered seven neighbourhoods,
namely: Jogoo, Nyamataro, Egesa, Mwembe, Daraja
Mbili, Mwembe and Nyamage. Kisii town was chosen as
a case study because of three major reasons. First, in
the regional setting, it is the most densely populated
urban area in the western part of Kenya, with 2,862
persons/km2. This is higher than Kisumu (464
persons/km2) which is the third-largest city in Kenya
(Kenya National Bureau of Statistics, 2019). Second, in
the national context, Kisii is ranked as the third most
Wilfred Ochieng OMOLLO
Journal of Settlements and Spatial Planning, vol. 11, no. 2 (2020) 95-111
98
densely populated urban area after Nairobi City County
(4,515 persons/km2) and Mombasa County (4,292
persons/km2). Third, according to the Kenya National
Bureau of Statistics (2019), the town’s annual
population growth rate of 2.7% is ranked among the
highest in Kenya, in fact, higher than the national
average of 2.6% per year.
The town is geographically positioned in the south-
western part of Kenya and currently designated as the
administrative headquarters of Kisii County, one of the
47 county governments in the Government of Kenya.
The current study followed the positivist
research philosophy, which relies on a deductive
method of inquiry through data collection and
hypothesis testing. This was attained by working on
quantifiable and measurable observations, along with
statistical analyses. The emphasis was on replication,
meaning that other researchers can find similar results.
In this case, compliance with building lines was
measured per residential building. According to Leedy
(2005), replication is the ultimate test of knowledge
since positivists uphold that different groups of
observers looking at the same facts should obtain the
same results.
2.2.2. Population, sample size and sampling
design
An immediate challenge faced before
commencing the collection of primary data was how to
obtain a readily available sampling frame that could
also be used to determine the population size for each
residential neighbourhood in the study area. This was
because the CGOK did not maintain a record of the
spatial location of residential developments in Kisii
town. To overcome this limitation, the study relied on
the recommendation made by Escamilla et al. (2014)
that high-resolution satellite images alongside
geographic analysis software may be used to digitize
each building development within an area of interest to
generate an accurate list in the form of a representative
sampling frame, which can then be used to draw
random samples. Based on this commendation, all
buildings were first identified using a high spatial
resolution satellite image (pre-processed QuickBird-2,
0.34-meter spatial resolution) obtained from the
Regional Centre for Mapping of Resources for
Development, Nairobi, and subsequently digitized using
QGIS 3.6.3-Noosa software to establish a sampling
frame in the form of the feature attribute table.
The GIS analysis process entailed the
delineation of neighbourhood boundaries, followed by
the digitization of all building developments. This was
accomplished through a deliberate participatory
mapping exercise that involved the Assistant Chiefs
drawn from sublocations where each of the seven
neighbourhoods were located, consequently giving
credence that there were no overlaps in data collection.
As justified by Warner (2015) and Natarajan (2017) in
their studies, such participatory mapping has the
advantage of collecting and consolidating local
knowledge from different people to create a
comprehensive base map that provides an in-depth
knowledge than can be attained from traditional
mapping techniques. To ensure that all of the mapped
buildings were residential, a two-week ground
validation exercise was undertaken in each residential
neighbourhood. In the end, 7,430 houses were
successfully mapped.
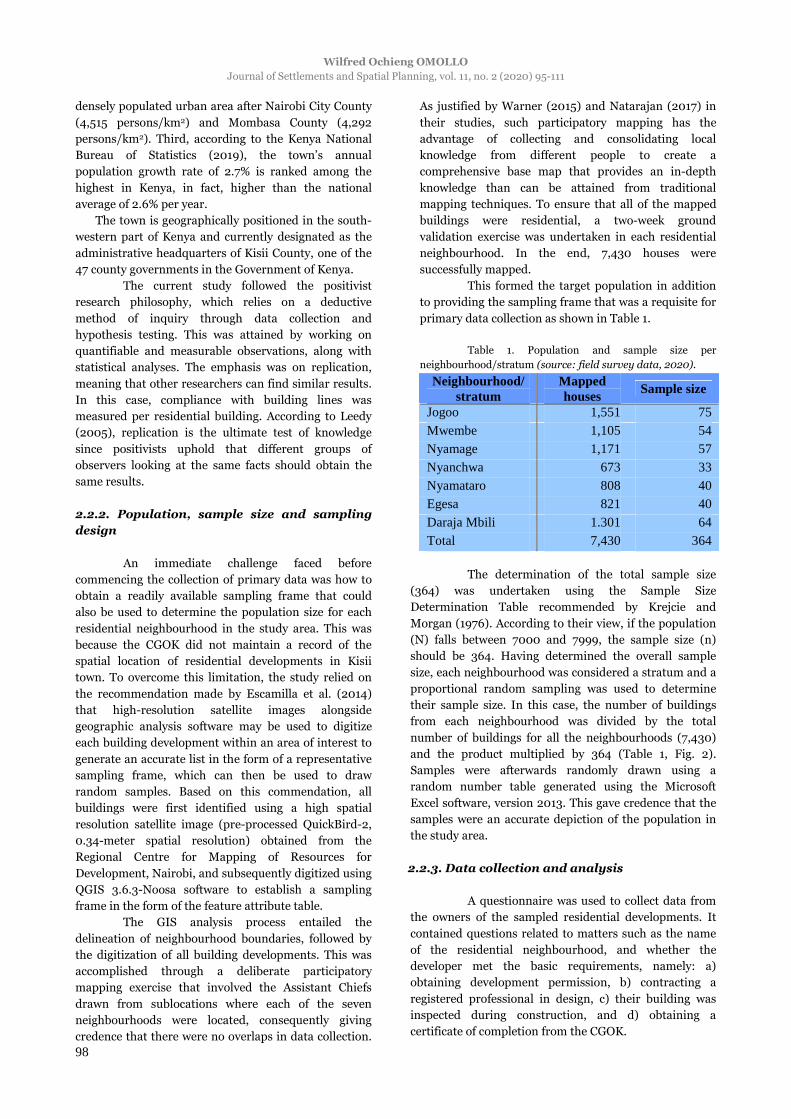
This formed the target population in addition
to providing the sampling frame that was a requisite for
primary data collection as shown in Table 1.
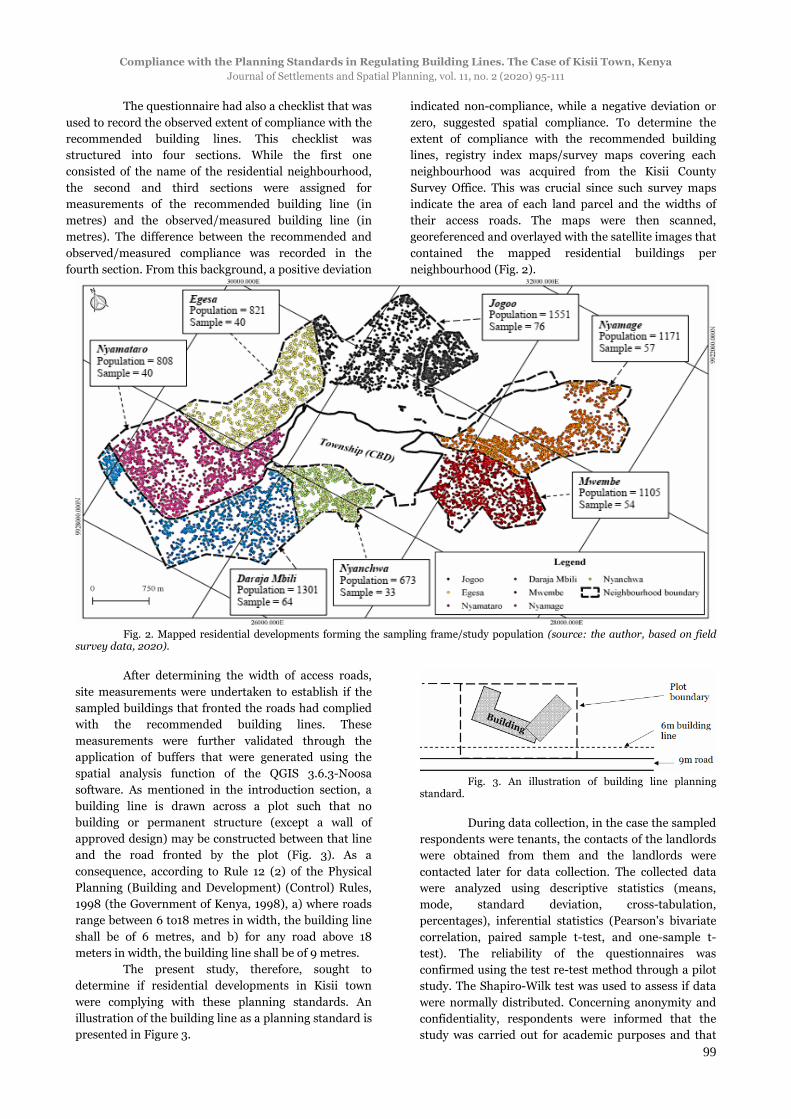
Table 1. Population and sample size per
neighbourhood/stratum (source: field survey data, 2020).
Neighbourhood/ stratum
Mapped houses
Sample size
Jogoo 1,551 75 Mwembe 1,105 54 Nyamage 1,171 57 Nyanchwa 673 33 Nyamataro 808 40 Egesa 821 40 Daraja Mbili 1.301 64 Total 7,430 364
The determination of the total sample size
(364) was undertaken using the Sample Size
Determination Table recommended by Krejcie and
Morgan (1976). According to their view, if the population
(N) falls between 7000 and 7999, the sample size (n)
should be 364. Having determined the overall sample
size, each neighbourhood was considered a stratum and a
proportional random sampling was used to determine
their sample size. In this case, the number of buildings
from each neighbourhood was divided by the total
number of buildings for all the neighbourhoods (7,430)
and the product multiplied by 364 (Table 1, Fig. 2).
Samples were afterwards randomly drawn using a
random number table generated using the Microsoft
Excel software, version 2013. This gave credence that the
samples were an accurate depiction of the population in
the study area.
2.2.3. Data collection and analysis
A questionnaire was used to collect data from
the owners of the sampled residential developments. It
contained questions related to matters such as the name
of the residential neighbourhood, and whether the
developer met the basic requirements, namely: a)
obtaining development permission, b) contracting a
registered professional in design, c) their building was
inspected during construction, and d) obtaining a
certificate of completion from the CGOK.
Compliance with the Planning Standards in Regulating Building Lines. The Case of Kisii Town, Kenya
Journal of Settlements and Spatial Planning, vol. 11, no. 2 (2020) 95-111
99
The questionnaire had also a checklist that was
used to record the observed extent of compliance with the
recommended building lines. This checklist was
structured into four sections. While the first one
consisted of the name of the residential neighbourhood,
the second and third sections were assigned for
measurements of the recommended building line (in
metres) and the observed/measured building line (in
metres). The difference between the recommended and
observed/measured compliance was recorded in the
fourth section. From this background, a positive deviation
indicated non-compliance, while a negative deviation or
zero, suggested spatial compliance. To determine the
extent of compliance with the recommended building
lines, registry index maps/survey maps covering each
neighbourhood was acquired from the Kisii County
Survey Office. This was crucial since such survey maps
indicate the area of each land parcel and the widths of
their access roads. The maps were then scanned,
georeferenced and overlayed with the satellite images that
contained the mapped residential buildings per
neighbourhood (Fig. 2).
Fig. 2. Mapped residential developments forming the sampling frame/study population (source: the author, based on field
survey data, 2020).
After determining the width of access roads,
site measurements were undertaken to establish if the
sampled buildings that fronted the roads had complied
with the recommended building lines. These
measurements were further validated through the
application of buffers that were generated using the
spatial analysis function of the QGIS 3.6.3-Noosa
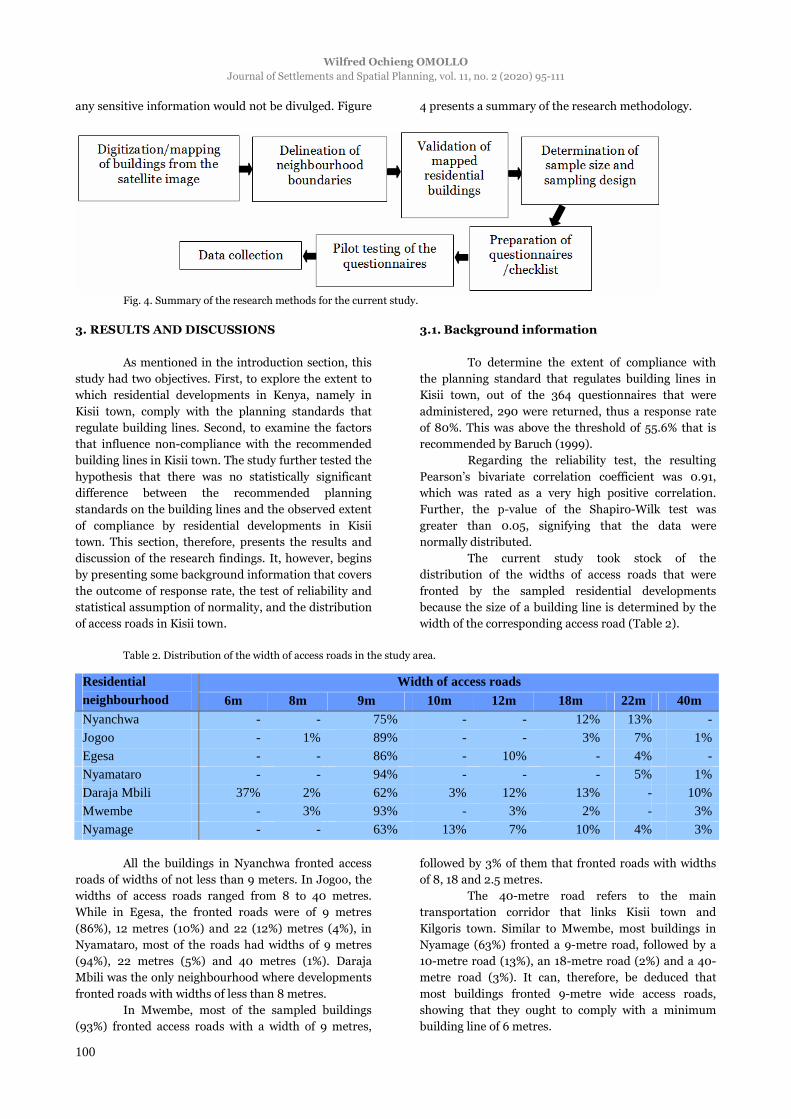
software. As mentioned in the introduction section, a
building line is drawn across a plot such that no
building or permanent structure (except a wall of
approved design) may be constructed between that line
and the road fronted by the plot (Fig. 3). As a
consequence, according to Rule 12 (2) of the Physical
Planning (Building and Development) (Control) Rules,
1998 (the Government of Kenya, 1998), a) where roads
range between 6 to18 metres in width, the building line
shall be of 6 metres, and b) for any road above 18
meters in width, the building line shall be of 9 metres.
The present study, therefore, sought to
determine if residential developments in Kisii town
were complying with these planning standards. An
illustration of the building line as a planning standard is
presented in Figure 3.
Fig. 3. An illustration of building line planning
standard.
During data collection, in the case the sampled
respondents were tenants, the contacts of the landlords
were obtained from them and the landlords were
contacted later for data collection. The collected data
were analyzed using descriptive statistics (means,
mode, standard deviation, cross-tabulation,
percentages), inferential statistics (Pearson's bivariate
correlation, paired sample t-test, and one-sample t-
test). The reliability of the questionnaires was
confirmed using the test re-test method through a pilot
study. The Shapiro-Wilk test was used to assess if data
were normally distributed. Concerning anonymity and
confidentiality, respondents were informed that the
study was carried out for academic purposes and that
Wilfred Ochieng OMOLLO
Journal of Settlements and Spatial Planning, vol. 11, no. 2 (2020) 95-111
100
any sensitive information would not be divulged. Figure 4 presents a summary of the research methodology.
Fig. 4. Summary of the research methods for the current study.
3. RESULTS AND DISCUSSIONS
As mentioned in the introduction section, this
study had two objectives. First, to explore the extent to
which residential developments in Kenya, namely in
Kisii town, comply with the planning standards that
regulate building lines. Second, to examine the factors
that influence non-compliance with the recommended
building lines in Kisii town. The study further tested the
hypothesis that there was no statistically significant
difference between the recommended planning
standards on the building lines and the observed extent
of compliance by residential developments in Kisii
town. This section, therefore, presents the results and
discussion of the research findings. It, however, begins
by presenting some background information that covers
the outcome of response rate, the test of reliability and
statistical assumption of normality, and the distribution
of access roads in Kisii town.
3.1. Background information
To determine the extent of compliance with
the planning standard that regulates building lines in
Kisii town, out of the 364 questionnaires that were
administered, 290 were returned, thus a response rate
of 80%. This was above the threshold of 55.6% that is
recommended by Baruch (1999).
Regarding the reliability test, the resulting
Pearson’s bivariate correlation coefficient was 0.91,
which was rated as a very high positive correlation.
Further, the p-value of the Shapiro-Wilk test was
greater than 0.05, signifying that the data were
normally distributed.
The current study took stock of the
distribution of the widths of access roads that were
fronted by the sampled residential developments
because the size of a building line is determined by the
width of the corresponding access road (Table 2).
Table 2. Distribution of the width of access roads in the study area.
Width of access roads Residential neighbourhood 6m 8m 9m 10m 12m 18m 22m 40m Nyanchwa - - 75% - - 12% 13% - Jogoo - 1% 89% - - 3% 7% 1% Egesa - - 86% - 10% - 4% - Nyamataro - - 94% - - - 5% 1% Daraja Mbili 37% 2% 62% 3% 12% 13% - 10% Mwembe - 3% 93% - 3% 2% - 3% Nyamage - - 63% 13% 7% 10% 4% 3%
All the buildings in Nyanchwa fronted access
roads of widths of not less than 9 meters. In Jogoo, the
widths of access roads ranged from 8 to 40 metres.
While in Egesa, the fronted roads were of 9 metres
(86%), 12 metres (10%) and 22 (12%) metres (4%), in
Nyamataro, most of the roads had widths of 9 metres
(94%), 22 metres (5%) and 40 metres (1%). Daraja
Mbili was the only neighbourhood where developments
fronted roads with widths of less than 8 metres.
In Mwembe, most of the sampled buildings
(93%) fronted access roads with a width of 9 metres,
followed by 3% of them that fronted roads with widths
of 8, 18 and 2.5 metres.
The 40-metre road refers to the main
transportation corridor that links Kisii town and
Kilgoris town. Similar to Mwembe, most buildings in
Nyamage (63%) fronted a 9-metre road, followed by a
10-metre road (13%), an 18-metre road (2%) and a 40-
metre road (3%). It can, therefore, be deduced that
most buildings fronted 9-metre wide access roads,
showing that they ought to comply with a minimum
building line of 6 metres.
Compliance with the Planning Standards in Regulating Building Lines. The Case of Kisii Town, Kenya
Journal of Settlements and Spatial Planning, vol. 11, no. 2 (2020) 95-111
101
3.2. Extent of compliance with the
recommended building lines in Kisii town
The first research objective was to explore the
extent to which residential developments in Kisii town
were complying with the planning standards that
regulate building lines. A compliance assessment was
therefore undertaken per residential neighbourhood as
follows.
3.2.1. Nyanchwa
The preliminary descriptive statistics revealed
that the mean for recommended minimum building line
planning standard (M =6.50, SD = 1.14) in Nyanchwa
neighbourhood was less than the observed building line
(M = 3.52, SD = 1.38) and statistically significant, t (23)
= 7.12, p = .000. Compliance declined by a mean of
2.98 (Table 3, Fig. 5).
Table 3. Paired samples test for building line standard, Nyanchwa.
Paired differences
Mean SD t
df
Sig. (2-tailed)
Recommended building line versus observed building line
2.98 2.05 7.12 24 .000
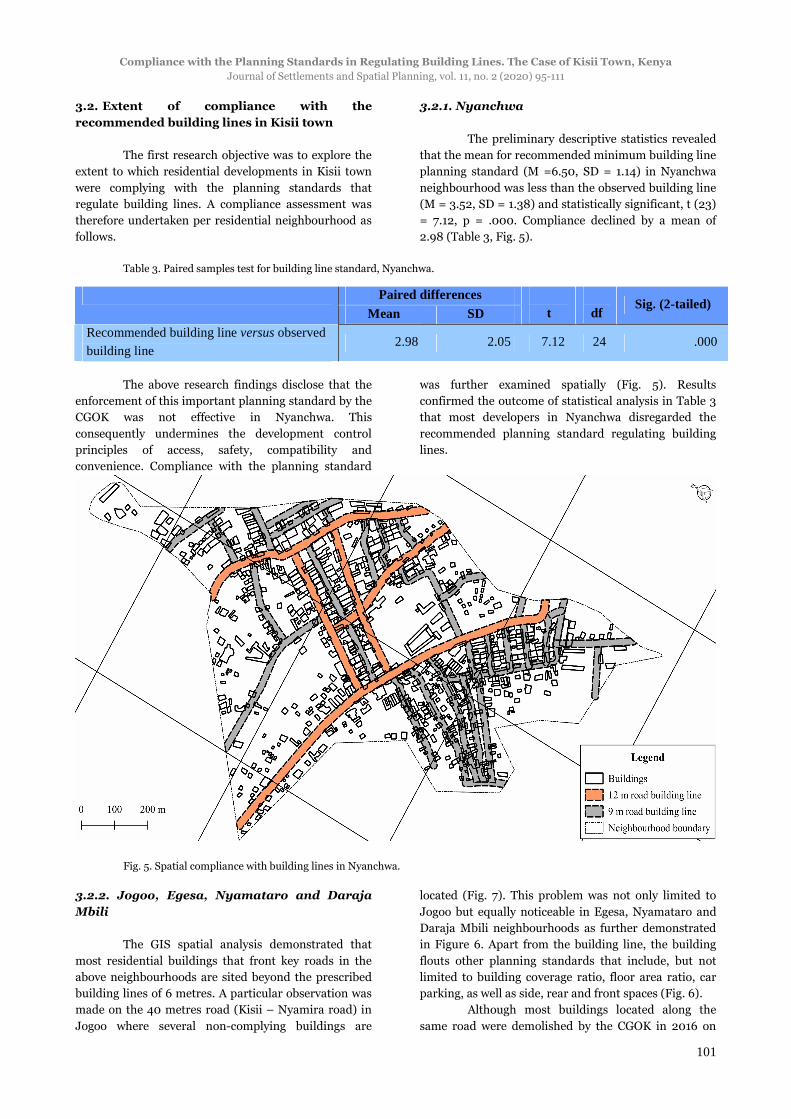
The above research findings disclose that the
enforcement of this important planning standard by the
CGOK was not effective in Nyanchwa. This
consequently undermines the development control
principles of access, safety, compatibility and
convenience. Compliance with the planning standard
was further examined spatially (Fig. 5). Results
confirmed the outcome of statistical analysis in Table 3
that most developers in Nyanchwa disregarded the
recommended planning standard regulating building
lines.
Fig. 5. Spatial compliance with building lines in Nyanchwa.
3.2.2. Jogoo, Egesa, Nyamataro and Daraja
Mbili
The GIS spatial analysis demonstrated that
most residential buildings that front key roads in the
above neighbourhoods are sited beyond the prescribed
building lines of 6 metres. A particular observation was
made on the 40 metres road (Kisii – Nyamira road) in
Jogoo where several non-complying buildings are
located (Fig. 7). This problem was not only limited to
Jogoo but equally noticeable in Egesa, Nyamataro and
Daraja Mbili neighbourhoods as further demonstrated
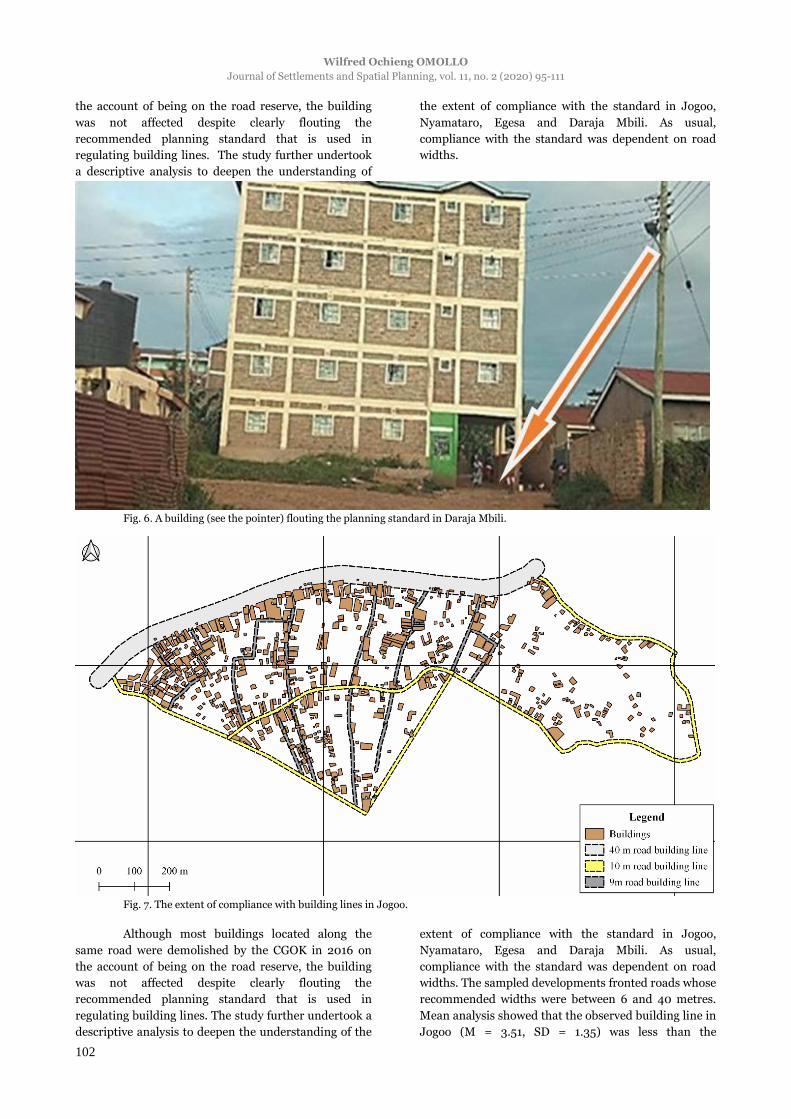
in Figure 6. Apart from the building line, the building
flouts other planning standards that include, but not
limited to building coverage ratio, floor area ratio, car
parking, as well as side, rear and front spaces (Fig. 6).
Although most buildings located along the
same road were demolished by the CGOK in 2016 on
Wilfred Ochieng OMOLLO
Journal of Settlements and Spatial Planning, vol. 11, no. 2 (2020) 95-111
102
the account of being on the road reserve, the building
was not affected despite clearly flouting the
recommended planning standard that is used in
regulating building lines. The study further undertook
a descriptive analysis to deepen the understanding of
the extent of compliance with the standard in Jogoo,
Nyamataro, Egesa and Daraja Mbili. As usual,
compliance with the standard was dependent on road
widths.
Fig. 6. A building (see the pointer) flouting the planning standard in Daraja Mbili.
Fig. 7. The extent of compliance with building lines in Jogoo.
Although most buildings located along the
same road were demolished by the CGOK in 2016 on
the account of being on the road reserve, the building
was not affected despite clearly flouting the
recommended planning standard that is used in
regulating building lines. The study further undertook a
descriptive analysis to deepen the understanding of the
extent of compliance with the standard in Jogoo,
Nyamataro, Egesa and Daraja Mbili. As usual,
compliance with the standard was dependent on road
widths. The sampled developments fronted roads whose
recommended widths were between 6 and 40 metres.
Mean analysis showed that the observed building line in
Jogoo (M = 3.51, SD = 1.35) was less than the
Compliance with the Planning Standards in Regulating Building Lines. The Case of Kisii Town, Kenya
Journal of Settlements and Spatial Planning, vol. 11, no. 2 (2020) 95-111
103
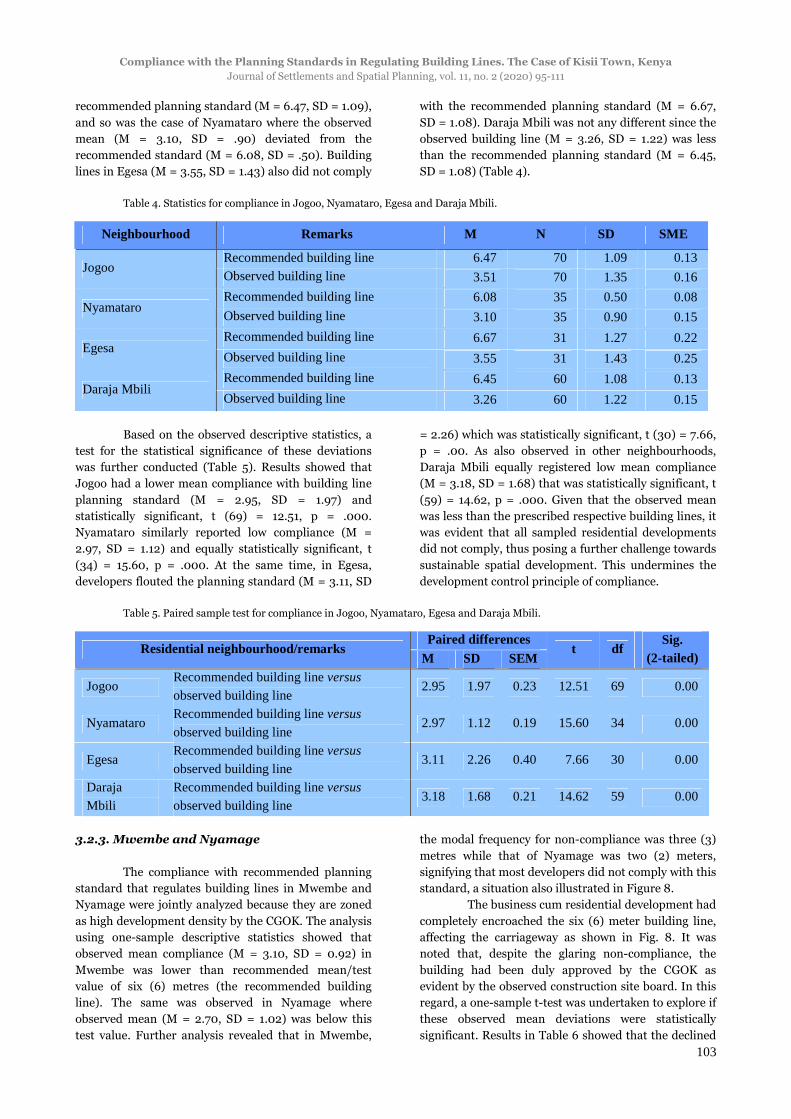
recommended planning standard (M = 6.47, SD = 1.09),
and so was the case of Nyamataro where the observed
mean (M = 3.10, SD = .90) deviated from the
recommended standard (M = 6.08, SD = .50). Building
lines in Egesa (M = 3.55, SD = 1.43) also did not comply
with the recommended planning standard (M = 6.67,
SD = 1.08). Daraja Mbili was not any different since the
observed building line (M = 3.26, SD = 1.22) was less
than the recommended planning standard (M = 6.45,
SD = 1.08) (Table 4).
Table 4. Statistics for compliance in Jogoo, Nyamataro, Egesa and Daraja Mbili.
Neighbourhood Remarks M N SD SME
Recommended building line 6.47 70 1.09 0.13 Jogoo
Observed building line 3.51 70 1.35 0.16
Recommended building line 6.08 35 0.50 0.08 Nyamataro
Observed building line 3.10 35 0.90 0.15
Recommended building line 6.67 31 1.27 0.22 Egesa
Observed building line 3.55 31 1.43 0.25
Recommended building line 6.45 60 1.08 0.13 Daraja Mbili
Observed building line 3.26 60 1.22 0.15
Based on the observed descriptive statistics, a
test for the statistical significance of these deviations
was further conducted (Table 5). Results showed that
Jogoo had a lower mean compliance with building line
planning standard (M = 2.95, SD = 1.97) and
statistically significant, t (69) = 12.51, p = .000.
Nyamataro similarly reported low compliance (M =
2.97, SD = 1.12) and equally statistically significant, t
(34) = 15.60, p = .000. At the same time, in Egesa,
developers flouted the planning standard (M = 3.11, SD
= 2.26) which was statistically significant, t (30) = 7.66,
p = .00. As also observed in other neighbourhoods,
Daraja Mbili equally registered low mean compliance
(M = 3.18, SD = 1.68) that was statistically significant, t
(59) = 14.62, p = .000. Given that the observed mean
was less than the prescribed respective building lines, it
was evident that all sampled residential developments
did not comply, thus posing a further challenge towards
sustainable spatial development. This undermines the
development control principle of compliance.
Table 5. Paired sample test for compliance in Jogoo, Nyamataro, Egesa and Daraja Mbili.
Paired differences Residential neighbourhood/remarks
M SD SEM t df
Sig. (2-tailed)
Jogoo Recommended building line versus observed building line
2.95 1.97 0.23 12.51 69 0.00
Nyamataro Recommended building line versus observed building line
2.97 1.12 0.19 15.60 34 0.00
Egesa Recommended building line versus observed building line
3.11 2.26 0.40 7.66 30 0.00
Daraja Mbili
Recommended building line versus observed building line
3.18 1.68 0.21 14.62 59 0.00
3.2.3. Mwembe and Nyamage
The compliance with recommended planning
standard that regulates building lines in Mwembe and
Nyamage were jointly analyzed because they are zoned
as high development density by the CGOK. The analysis
using one-sample descriptive statistics showed that
observed mean compliance (M = 3.10, SD = 0.92) in
Mwembe was lower than recommended mean/test
value of six (6) metres (the recommended building
line). The same was observed in Nyamage where
observed mean (M = 2.70, SD = 1.02) was below this
test value. Further analysis revealed that in Mwembe,
the modal frequency for non-compliance was three (3)
metres while that of Nyamage was two (2) meters,
signifying that most developers did not comply with this
standard, a situation also illustrated in Figure 8.
The business cum residential development had
completely encroached the six (6) meter building line,
affecting the carriageway as shown in Fig. 8. It was
noted that, despite the glaring non-compliance, the
building had been duly approved by the CGOK as
evident by the observed construction site board. In this
regard, a one-sample t-test was undertaken to explore if
these observed mean deviations were statistically
significant. Results in Table 6 showed that the declined
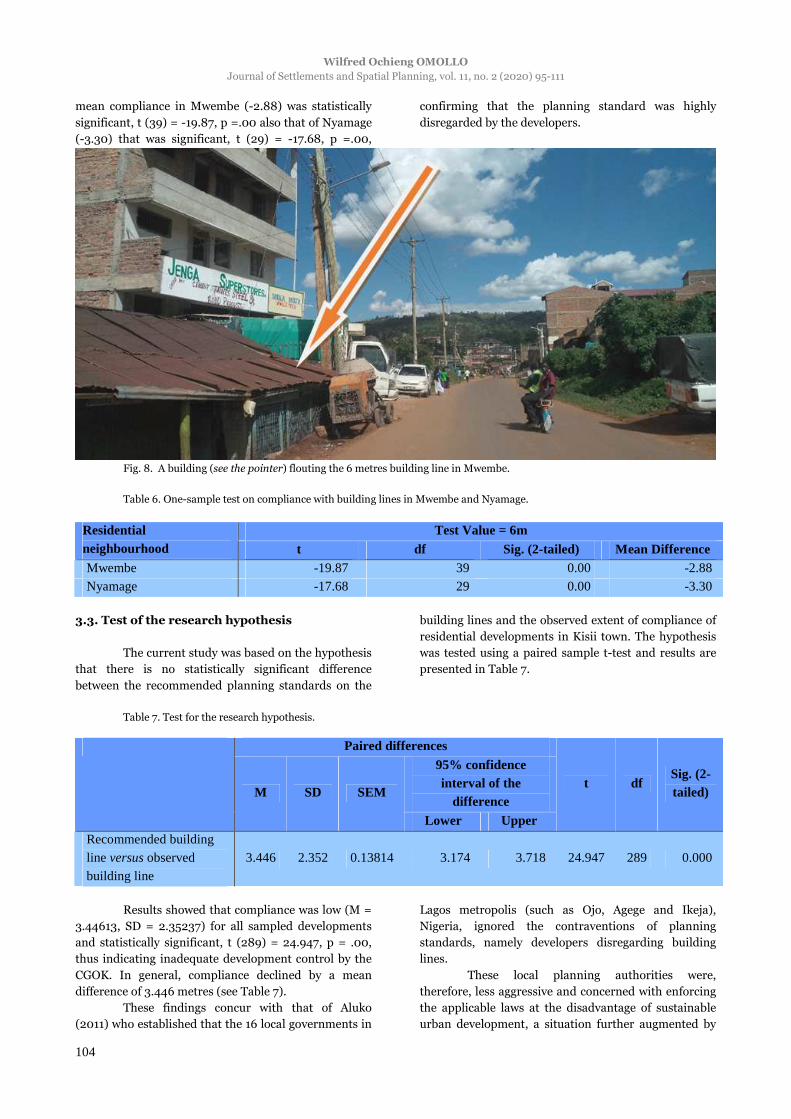
Wilfred Ochieng OMOLLO
Journal of Settlements and Spatial Planning, vol. 11, no. 2 (2020) 95-111
104
mean compliance in Mwembe (-2.88) was statistically
significant, t (39) = -19.87, p =.00 also that of Nyamage
(-3.30) that was significant, t (29) = -17.68, p =.00,
confirming that the planning standard was highly
disregarded by the developers.
Fig. 8. A building (see the pointer) flouting the 6 metres building line in Mwembe.
Table 6. One-sample test on compliance with building lines in Mwembe and Nyamage.
Test Value = 6m Residential neighbourhood t df Sig. (2-tailed) Mean Difference Mwembe -19.87 39 0.00 -2.88 Nyamage -17.68 29 0.00 -3.30
3.3. Test of the research hypothesis
The current study was based on the hypothesis
that there is no statistically significant difference
between the recommended planning standards on the
building lines and the observed extent of compliance of
residential developments in Kisii town. The hypothesis
was tested using a paired sample t-test and results are
presented in Table 7.
Table 7. Test for the research hypothesis.
Paired differences 95% confidence interval of the
difference
M SD SEM
Lower Upper
t df Sig. (2-tailed)
Recommended building line versus observed building line
3.446 2.352 0.13814 3.174 3.718 24.947 289 0.000
Results showed that compliance was low (M =
3.44613, SD = 2.35237) for all sampled developments
and statistically significant, t (289) = 24.947, p = .00,
thus indicating inadequate development control by the
CGOK. In general, compliance declined by a mean
difference of 3.446 metres (see Table 7).
These findings concur with that of Aluko
(2011) who established that the 16 local governments in
Lagos metropolis (such as Ojo, Agege and Ikeja),
Nigeria, ignored the contraventions of planning
standards, namely developers disregarding building
lines.
These local planning authorities were,
therefore, less aggressive and concerned with enforcing
the applicable laws at the disadvantage of sustainable
urban development, a situation further augmented by
Compliance with the Planning Standards in Regulating Building Lines. The Case of Kisii Town, Kenya
Journal of Settlements and Spatial Planning, vol. 11, no. 2 (2020) 95-111
105
the lack of dedicated and competent staff to undertake
development control.
3.4. Factors influencing non-compliance with
building lines in Kisii town
The second research objective sought to
examine the factors that influence non-compliance with
planning standards that regulate building lines in Kisii
town. Results are presented and discussed in the
subsequent subsections.
3.4.1. Obtaining of development permission
According to section 57 (1) of the PLUPA (the
Government of Kenya, 2019), nobody is permitted to
carry out development in Kenya without development
permission granted by the respective member of the
county executive committee. The current study,
therefore, sought to find out if developers in Kisii town
had obtained development permission before starting
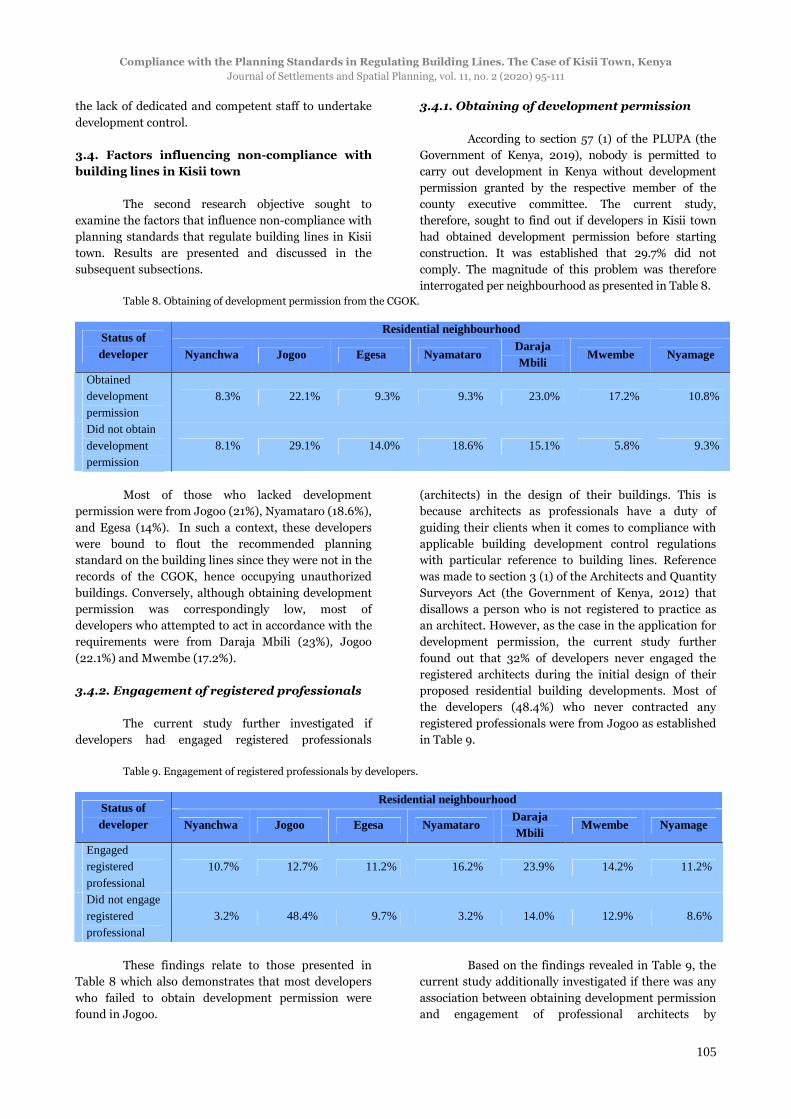
construction. It was established that 29.7% did not
comply. The magnitude of this problem was therefore
interrogated per neighbourhood as presented in Table 8.
Table 8. Obtaining of development permission from the CGOK.
Residential neighbourhood Status of developer Nyanchwa Jogoo Egesa Nyamataro
Daraja Mbili
Mwembe Nyamage
Obtained development permission
8.3% 22.1% 9.3% 9.3% 23.0% 17.2% 10.8%
Did not obtain development permission
8.1% 29.1% 14.0% 18.6% 15.1% 5.8% 9.3%
Most of those who lacked development
permission were from Jogoo (21%), Nyamataro (18.6%),
and Egesa (14%). In such a context, these developers
were bound to flout the recommended planning
standard on the building lines since they were not in the
records of the CGOK, hence occupying unauthorized
buildings. Conversely, although obtaining development
permission was correspondingly low, most of
developers who attempted to act in accordance with the
requirements were from Daraja Mbili (23%), Jogoo
(22.1%) and Mwembe (17.2%).
3.4.2. Engagement of registered professionals
The current study further investigated if
developers had engaged registered professionals
(architects) in the design of their buildings. This is
because architects as professionals have a duty of
guiding their clients when it comes to compliance with
applicable building development control regulations
with particular reference to building lines. Reference
was made to section 3 (1) of the Architects and Quantity
Surveyors Act (the Government of Kenya, 2012) that
disallows a person who is not registered to practice as
an architect. However, as the case in the application for
development permission, the current study further
found out that 32% of developers never engaged the
registered architects during the initial design of their
proposed residential building developments. Most of
the developers (48.4%) who never contracted any
registered professionals were from Jogoo as established
in Table 9.
Table 9. Engagement of registered professionals by developers.
Residential neighbourhood Status of developer Nyanchwa Jogoo Egesa Nyamataro
Daraja Mbili
Mwembe Nyamage
Engaged registered professional
10.7% 12.7% 11.2% 16.2% 23.9% 14.2% 11.2%
Did not engage registered professional
3.2% 48.4% 9.7% 3.2% 14.0% 12.9% 8.6%
These findings relate to those presented in
Table 8 which also demonstrates that most developers
who failed to obtain development permission were
found in Jogoo.
Based on the findings revealed in Table 9, the
current study additionally investigated if there was any
association between obtaining development permission
and engagement of professional architects by
Wilfred Ochieng OMOLLO
Journal of Settlements and Spatial Planning, vol. 11, no. 2 (2020) 95-111
106
developers. The results of this inquest are presented in Table 10.
Table 10. Obtaining development permission and engagement of registered professionals.
Status of developer Engaged registered professional Did not engaged registered
professional Obtained development permission
79.4% 20.6%
Did not obtain development permission
40.7% 59.3%
The cross-tabulated results in Table 10 show
that out of developers who obtained development
permission, 20.6% did not involve registered architects.
This indicates a lapse in the development control
process, a situation that appears where non-
professional architects, acting as brokers, obtain a job
from a client, design the building and then at a
negotiated fee approach a registered architect to
endorse the proposed building plans. The problem was
heightened by the results of the current study revealing
that 35% of the developers were unaware of the
documented process to be followed in obtaining
development permission from the CGOK. Additionally,
among those who never obtained development
permission, 59.3% did not engage registered architects.
This could suggest that engaging a registered architect
is a precursor for obtaining development permission,
consequently increasing the odds of complying with the
recommended planning standard on building lines.
3.4.3. Inspection of buildings during
development
To promote compliance with planning
standards during construction, section 16 (1) of the
Local Government (Adoptive By-Laws) (Building)
Order 1968 (the Government of Kenya, 1968),
commonly known as the ‘Building Code’, requires all
buildings to be regularly inspected during construction.
Further, section three (3) mandates a person who has
constructed a building to give a notice of its completion
to facilitate the final inspection audit to be undertaken
towards the issuance of the certificate of completion.
This underpins why section four (4) prohibits the use of
a building before a certificate of completion has been
issued by the CGOK. On this account, the current study
determined the extent to which residential buildings
that were under construction were inspected by the
CGOK. Initial research findings showed that 37% of the
developers were unaware that buildings should be
inspected during the construction process at planned
intervals. On account of this gap, 40% of them did not
issue a notice to the CGOK to initiate the inspection of
their buildings. Relatively, out of the 37% of developers
who were unaware of the statutory inspection
requirement, a high majority (92%) never issued a
notice of inspection, a problem further corroborated by
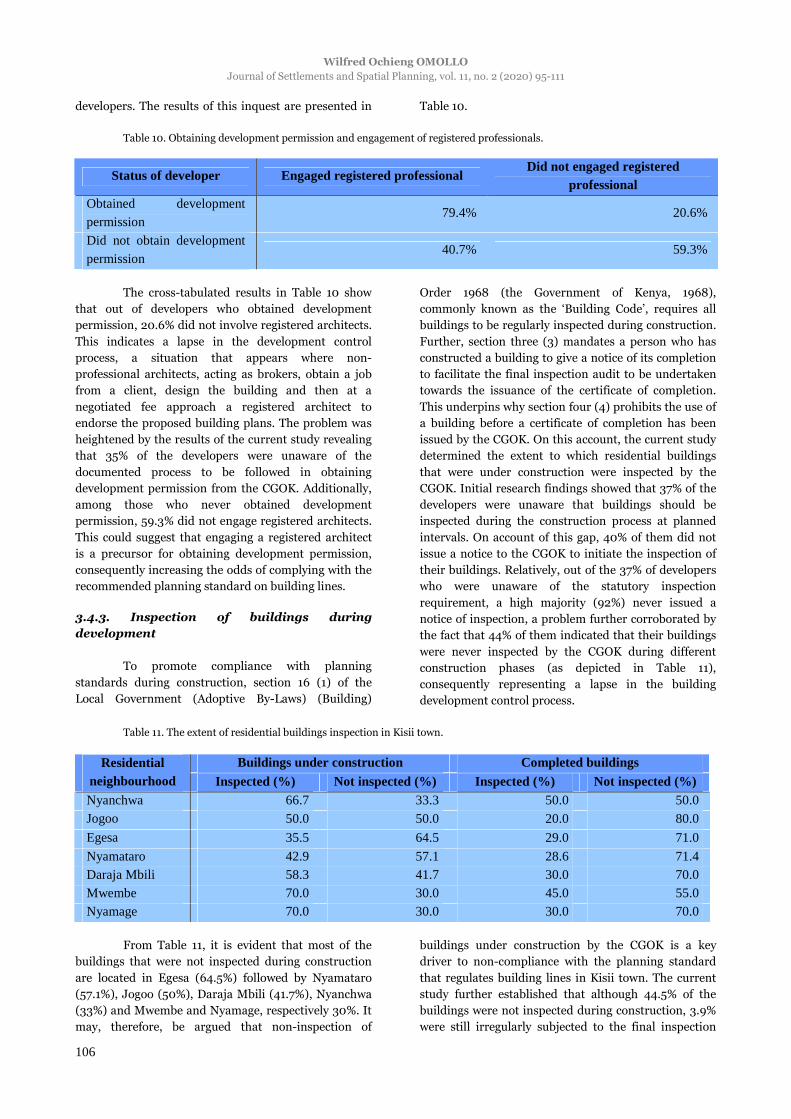
the fact that 44% of them indicated that their buildings
were never inspected by the CGOK during different
construction phases (as depicted in Table 11),
consequently representing a lapse in the building
development control process.
Table 11. The extent of residential buildings inspection in Kisii town.
Buildings under construction Completed buildings Residential neighbourhood Inspected (%) Not inspected (%) Inspected (%) Not inspected (%) Nyanchwa 66.7 33.3 50.0 50.0 Jogoo 50.0 50.0 20.0 80.0
Egesa 35.5 64.5 29.0 71.0
Nyamataro 42.9 57.1 28.6 71.4 Daraja Mbili 58.3 41.7 30.0 70.0 Mwembe 70.0 30.0 45.0 55.0 Nyamage 70.0 30.0 30.0 70.0
From Table 11, it is evident that most of the
buildings that were not inspected during construction
are located in Egesa (64.5%) followed by Nyamataro
(57.1%), Jogoo (50%), Daraja Mbili (41.7%), Nyanchwa
(33%) and Mwembe and Nyamage, respectively 30%. It
may, therefore, be argued that non-inspection of
buildings under construction by the CGOK is a key
driver to non-compliance with the planning standard
that regulates building lines in Kisii town. The current
study further established that although 44.5% of the
buildings were not inspected during construction, 3.9%
were still irregularly subjected to the final inspection
Compliance with the Planning Standards in Regulating Building Lines. The Case of Kisii Town, Kenya
Journal of Settlements and Spatial Planning, vol. 11, no. 2 (2020) 95-111
107
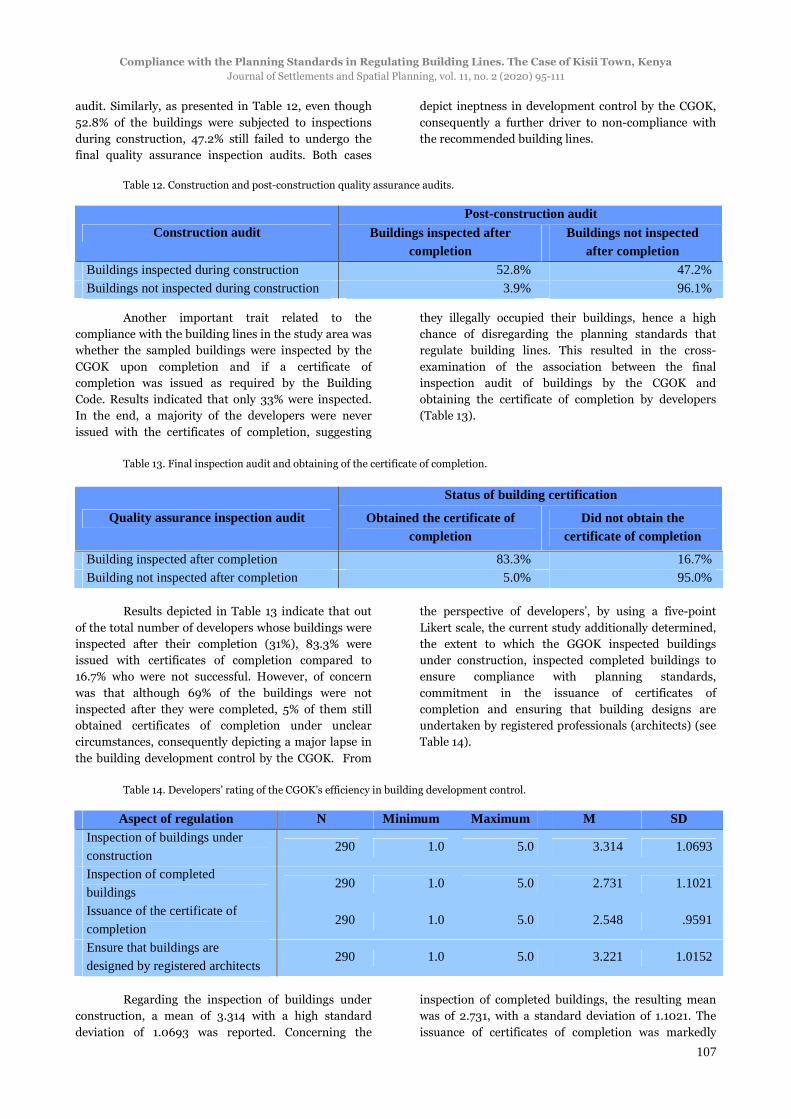
audit. Similarly, as presented in Table 12, even though
52.8% of the buildings were subjected to inspections
during construction, 47.2% still failed to undergo the
final quality assurance inspection audits. Both cases
depict ineptness in development control by the CGOK,
consequently a further driver to non-compliance with
the recommended building lines.
Table 12. Construction and post-construction quality assurance audits.
Post-construction audit Construction audit Buildings inspected after
completion Buildings not inspected
after completion Buildings inspected during construction 52.8% 47.2% Buildings not inspected during construction 3.9% 96.1%
Another important trait related to the
compliance with the building lines in the study area was
whether the sampled buildings were inspected by the
CGOK upon completion and if a certificate of
completion was issued as required by the Building
Code. Results indicated that only 33% were inspected.
In the end, a majority of the developers were never
issued with the certificates of completion, suggesting
they illegally occupied their buildings, hence a high
chance of disregarding the planning standards that
regulate building lines. This resulted in the cross-
examination of the association between the final
inspection audit of buildings by the CGOK and
obtaining the certificate of completion by developers
(Table 13).
Table 13. Final inspection audit and obtaining of the certificate of completion.
Status of building certification
Quality assurance inspection audit Obtained the certificate of completion
Did not obtain the certificate of completion
Building inspected after completion 83.3% 16.7% Building not inspected after completion 5.0% 95.0%
Results depicted in Table 13 indicate that out
of the total number of developers whose buildings were
inspected after their completion (31%), 83.3% were
issued with certificates of completion compared to
16.7% who were not successful. However, of concern
was that although 69% of the buildings were not
inspected after they were completed, 5% of them still
obtained certificates of completion under unclear
circumstances, consequently depicting a major lapse in
the building development control by the CGOK. From
the perspective of developers’, by using a five-point
Likert scale, the current study additionally determined,
the extent to which the GGOK inspected buildings
under construction, inspected completed buildings to
ensure compliance with planning standards,
commitment in the issuance of certificates of
completion and ensuring that building designs are
undertaken by registered professionals (architects) (see
Table 14).
Table 14. Developers’ rating of the CGOK’s efficiency in building development control.
Aspect of regulation N Minimum Maximum M SD Inspection of buildings under construction
290 1.0 5.0 3.314 1.0693
Inspection of completed buildings
290 1.0 5.0 2.731 1.1021
Issuance of the certificate of completion
290 1.0 5.0 2.548 .9591
Ensure that buildings are designed by registered architects
290 1.0 5.0 3.221 1.0152
Regarding the inspection of buildings under
construction, a mean of 3.314 with a high standard
deviation of 1.0693 was reported. Concerning the
inspection of completed buildings, the resulting mean
was of 2.731, with a standard deviation of 1.1021. The
issuance of certificates of completion was markedly
Wilfred Ochieng OMOLLO
Journal of Settlements and Spatial Planning, vol. 11, no. 2 (2020) 95-111
108
rated the lowest (M=2.548, SD=.9591). Lastly, ensuring
that building design was undertaken by registered
architects reported a mean of 3.221 and a subsequent
standard deviation of 1.015. Since the reported means
are less than the Likert scale values of five (coded as
‘very high’), it can, therefore, be further construed that
the CGOK’s inadequacy in undertaking building
development control is a key barrier to the effective
regulation of compliance with the building lines. The
above research corroborates to that of Raji and Atta
(2017) who found out that most developers in Suleja
City, Nigeria, ignored recommended building lines, as
well as to the findings of Rukwaro (2009) who
established that the residential extensions in Buru Buru
Estate, Nairobi, overlooked this important standard.
The findings further compare to that of Fashina et al.
(2020) who proposed that the government of
Somaliland should initiate the process of implementing
building codes as a strategy towards a sustainable
future. However, unlike Raji and Atta (2017), Rukwaro
(2009) and Fashina et al. (2020) who relied on field
observations, the current study undertook actual field
measurements coupled with spatial analysis,
consequently contributing to the growing body of
literature in urban building development control.
3.4.4. The delusion of building lines by the
CGOK
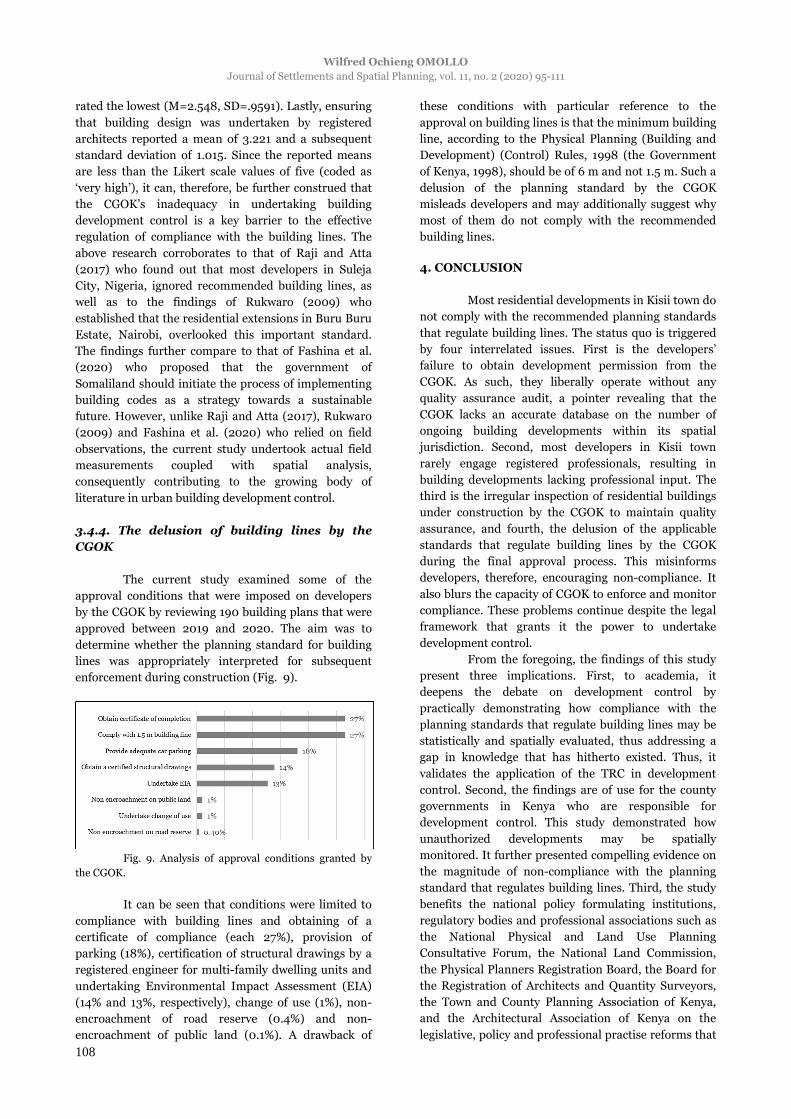
The current study examined some of the
approval conditions that were imposed on developers
by the CGOK by reviewing 190 building plans that were
approved between 2019 and 2020. The aim was to
determine whether the planning standard for building
lines was appropriately interpreted for subsequent
enforcement during construction (Fig. 9).
Fig. 9. Analysis of approval conditions granted by
the CGOK.
It can be seen that conditions were limited to
compliance with building lines and obtaining of a
certificate of compliance (each 27%), provision of
parking (18%), certification of structural drawings by a
registered engineer for multi-family dwelling units and
undertaking Environmental Impact Assessment (EIA)
(14% and 13%, respectively), change of use (1%), non-
encroachment of road reserve (0.4%) and non-
encroachment of public land (0.1%). A drawback of
these conditions with particular reference to the
approval on building lines is that the minimum building
line, according to the Physical Planning (Building and
Development) (Control) Rules, 1998 (the Government
of Kenya, 1998), should be of 6 m and not 1.5 m. Such a
delusion of the planning standard by the CGOK
misleads developers and may additionally suggest why
most of them do not comply with the recommended
building lines.
4. CONCLUSION
Most residential developments in Kisii town do
not comply with the recommended planning standards
that regulate building lines. The status quo is triggered
by four interrelated issues. First is the developers’
failure to obtain development permission from the
CGOK. As such, they liberally operate without any
quality assurance audit, a pointer revealing that the
CGOK lacks an accurate database on the number of
ongoing building developments within its spatial
jurisdiction. Second, most developers in Kisii town
rarely engage registered professionals, resulting in
building developments lacking professional input. The
third is the irregular inspection of residential buildings
under construction by the CGOK to maintain quality
assurance, and fourth, the delusion of the applicable
standards that regulate building lines by the CGOK
during the final approval process. This misinforms
developers, therefore, encouraging non-compliance. It
also blurs the capacity of CGOK to enforce and monitor
compliance. These problems continue despite the legal
framework that grants it the power to undertake
development control.
From the foregoing, the findings of this study
present three implications. First, to academia, it
deepens the debate on development control by
practically demonstrating how compliance with the
planning standards that regulate building lines may be
statistically and spatially evaluated, thus addressing a
gap in knowledge that has hitherto existed. Thus, it
validates the application of the TRC in development
control. Second, the findings are of use for the county
governments in Kenya who are responsible for
development control. This study demonstrated how
unauthorized developments may be spatially
monitored. It further presented compelling evidence on
the magnitude of non-compliance with the planning
standard that regulates building lines. Third, the study
benefits the national policy formulating institutions,
regulatory bodies and professional associations such as
the National Physical and Land Use Planning
Consultative Forum, the National Land Commission,
the Physical Planners Registration Board, the Board for
the Registration of Architects and Quantity Surveyors,
the Town and County Planning Association of Kenya,
and the Architectural Association of Kenya on the
legislative, policy and professional practise reforms that
Compliance with the Planning Standards in Regulating Building Lines. The Case of Kisii Town, Kenya
Journal of Settlements and Spatial Planning, vol. 11, no. 2 (2020) 95-111
109
Kenya should prioritize to address the recurring
problem of development control in urban areas. It will
therefore offer a practical point of reference when
reviewing the current Physical Planning Handbook, the
1968 Building Code, or when setting up regulations for
implementing the PLUPA. A justification for reviewing
the 1968 Building Code has previously been echoed by
Kabando and Pu (2014) and Otieno (2012).
To promote compliance with the planning
standard that regulate building lines in Kisii town, four
recommendations are proposed. First, the CGOK
should improve the current monitoring system to
ensure that each building under construction has been
duly approved and that each developer has the statutory
certifications. However, for this to happen, the CGOK
should regularly sensitize the public on the procedures
and importance of having approved building plans. This
may be undertaken in liaison with the Assistant County
Commissioners who frequently convene public
meetings at the local administrative levels to
communicate and monitor the implementation of the
government’s development agenda. To further aid
surveillance, the CGOK should establish a
comprehensive Planning Monitoring System (PMS) that
integrates GIS and remote sensing to provide a real-
time platform for monitoring the spatial extent of
developments in the study area, therefore providing an
avenue for detecting unauthorized developments along
with those that disregard planning standards.
Second, the CGOK should ensure that the
design of building plans is exclusively undertaken by
registered architects. For this to succeed, it should
partner with the Board for the Registration of Architects
and Quantity Surveyors to ensure that individuals who
are not registered as architects alongside errand
architects who endorse building plans at a fee are
reprimanded as per the existing code of ethics for
professional practice. Third, to promote quality
assurance in the construction industry, the CGOK
should inspect the construction of each building
previously approved to ensure compliance, at planned
intervals. Each building should be certified as safe for
occupation once construction is completed. The
proposed PMS should also present an opportunity for
monitoring the certification of buildings. Fourth, while
approving building plans, the CGOK should adhere to
Rule 12 (2) of the Physical Planning (Building and
Development) (Control) Rules, 1998 (the Government
of Kenya, 1998) which stipulates the correct planning
standard for building lines.
Although this study determined the extent to
which the planning standard that regulates building
lines is complied with in addition to what drives non-
compliance, it was limited to residential land use. This
gap presents an opportunity for further research with a
prospect investigating if other categories of urban land
use such as educational, industrial or commercial are
complying with the applicable standards.
5. ACKNOWLEDGEMENTS
The author acknowledges the National
Commission for Science, Technology and Innovation
and the Kisii County Commissioner for granting of a
research permit to undertake the study.
REFERENCES
Agbola T. (1985), The concept, evolution and role of
development control and planning administration in
Nigeria. Paper presented at the national workshop on
development control and planning administration in
Nigeria, June 24-28. URL: https://www.researchgate.
net/publication/326504102_Planning_Regulations_and
_Implementation_Mechanisms_in_Postcolonial_Lagos
Akeem O. A., Olutayo O. O., Theophilus A. A.
(2018), Planning Regulations and Implementation
Mechanisms In Postcolonial Lagos, Journal of
Globalization Studies, 9 (2), 91–106. https://www.
socionauki.ru/journal/articles/1646256/
Alnsour J., Meaton J. (2009), Factors affecting
compliance with residential standards in the city of Old
Salt, Jordan. Habitat International, 33 (4) 301-309.
https://www.sciencedirect.com/science/article/abs/pii
/S0197397508000453
Aluko O. (2011), Development Control in Lagos State:
An assessment of public compliance to space standards
for urban development. African Research Review, 5
(22), 169-184. https://www.ajol.info/index.php/afrrev/
article/view/72306
Arimah B. C, Adeagbo D. B. (2000), Compliance
with urban development and planning regulations in
Ibadan, Nigeria. Habitat International, 24 279-294.
https://www.sciencedirect.com/science/article/abs/pii
/S0197397599000430
Arku G., Mensah K. O., Allotey N, K., Frempong
E. A. (2016), Non-compliance with building permit
regulations in Accra-Tema city-region, Ghana:
exploring the reasons from the perspective of multiple
stakeholders. Planning Theory & Practice, 1-20.
https://www.tandfonline.com/doi/abs/10.1080/14649
357.2016.1192216
Atamewan E. E. (2019), factors affecting
implementation and compliance with housing standards
for sustainable housing delivery in Bayelsa State, Nigeria.
European Scientific Journal 15 (3), 1857-7881.
https://eujournal.org/index.php/esj/article /view/11709
Baker T. L. (1994), Doing social research (2nd Ed.).
New York: McGraw-Hill Inc. https://archive.org/
details/doingsocia lresea00bake_0
Baruch Y. (1999), Response Rate in Academic
Studies-A Comparative Analysis. Human Relations. 5
(4), 421-438. https:// journals.sagepub.com/do i/10.11
77/001872679905200401
Clarke G. (1994), Reappraisal of the Urban Planning
Process as an Instrument for Sustainable Urban
Wilfred Ochieng OMOLLO
Journal of Settlements and Spatial Planning, vol. 11, no. 2 (2020) 95-111
110
Development and Management. Mosha, A. C. (ed.), A
Reappraisal of the Urban Planning Process (pp. 13–28).
Nairobi: UNCHS. https://www.worldcat.org/title/
reappraisal-of-the-urban-planning-
process/oclc/35042499.
Escamilla V., Emch M., Dandalo L., Miller W.,
Martinson F., Hoffman F. (2014), Sampling at
community level by using satellite imagery and
geographical analysis. Bull World Health Organ, 690–
694. https://www.ncbi. nlm.nih.gov/ pmc/articles/
PMC4208578/.
Fashina, A. A., Sheikh, A. A., Fakunle, F. F.,
Opiti, C. (2020), The drawbacks of the lack of building
codes and regulations in Somaliland: Public health and
safety implications, PM World Journal, 9 (7), 1–24.
https://www.researchgate.net/publication/342702974
_The_drawbacks_of_the_lack_of_building_codes_an
d_regulations_in_Somaliland_Public_health_and_saf
ety_implications
Fiene R. (2016), Theory of regulatory compliance.
SSRN Electronic Journal. https://doi.org/10.2139/
ssrn.3239691
Goodfellow T (2013), Planning and development
regulation amid rapid urban growth: explaining
divergent trajectories in Africa. Geoforum, 48, 83-93.
https://www.sciencedirect.com/science/article/abs/pii
/S0016718513000791
Hameed H. A. S. A., Albazaz I. (2019), The
Reasons behind non-compliance with building
legislation in the residential areas of the City of
Baghdad. Journal of University of Babylon for
Engineering Sciences, 27 (2) 319-333. https://www.
journalofbabylon.com/index.php/JUBES/article/view/
2478.
ISO (2020), What are standards in this context?
https://www.iso.org/sites/ConsumersStandards/1_sta
ndards.html
Kabando K. E., Pu W. (2019), Flaws in the Current
Building Code and Code Making Process in Kenya. Civil
and Environmental Research, 6 (5) 24-31.
https://core.ac.uk/download/pdf/234677771.pdf
Kamarulzaman P. N., Azmi N. F., Sulaiman R.
(2019), A Review of Constraint Factors in Complying
with Building Control Regulation Related to House
Renovation. Journal of Surveying, Construction and
Property, 10 (1) 57-62. https://webcache.google
usercontent.com/search?q=cache:VUM9nVy3JZ8J:htt
ps://ejournal.um.edu.my/index.php/JSCP/article/view
/18609+&cd=1&hl=en&ct=clnk&gl=ke
Keivani R. (2010), A review of the main challenges to
urban sustainability. International Journal of Urban
Sustainable Development, 1 (2), 5–16. https://www.
tandfonline.com/doi/full/10.1080/19463131003704213
Krejcie R. V., Morgan D. W. (1970), Determining
sample size for research activities. Educational and
Psychological Measurement, 30, 607-610. https://
home.kku.ac.th/sompong/guest speaker/ Krejcieand
Morgan _article.pdf.
Kumar A., Pushplata B. (2017), Problems and
prospects of building regulations in Shimla, India – A
step towards achieving sustainable development.
International Journal of Sustainable Built Environment
6, 207–215. https://www.sciencedirect. com/science/
article/pii/S2212609016300619
Kumudini Y., Wickramaarachchi N. C. (2018), An
Investigation of non-compliance with Building
Regulations in Heritage Areas; A Case Study in Galle
Fort-Sri Lanka. http://journals.sjp.ac.lk/index.php/
SLJRE/article/view/4357
Leedy P. D. (2005), Practical research. Planning and
design. 8th Ed. Pearson Education, Upper Saddle River,
New Jersey
Makato E. W. (2013), Analysis of Development
Control Regulations Compliance in Kitengela Town,
Kajiado County in Kenya M.A Planning Thesis
University of Nairobi. http://erepository.uonbi.ac.ke/
handle/11295/101229
Maphill (2020), Gray Location Map of Kisii
Municipality, highlighted grandparent region, within
the entire country. http://www.maphill.com/kenya/
nyanza/kisii/kisii-municipality/location-maps/gray-
map/highlighted-grandparent-region/entire-country/
Muggah R., Hill K. (2008), African cities will double
in population by 2050. Here are 4 ways to make sure
they thrive. https://www.weforum.org/agenda/
2018/06/Africa-urbanization-cities-double-population-
2050-4%20ways-thrive/
Natarajan L. (2017), Socio-spatial learning: A case
study of community knowledge in participatory spatial
planning. Progress in Planning, 111, 1–23.
http://kns.cnki.net/ kcms /detail/detail.aspx?filename
=SJES15122600196329&dbcode=SJES
Ngetich J. K., Opata G. P., Mulongo L. S. (2016),
Making urban planning and development control
instruments work for Kenyan cities: The case of the city
of Eldoret. Journal of Emerging Trends in Economics
and Management Sciences 7(4):246-254. http://jetems.
scholarlinkresearch.com/articles/Making%20Urban%
20Planning %20and%20Development%20newest.pdf.
Obongha U. E, Ojikpong Samuel, B. E., Upuji J.
K. (2016), Assessment of building regulations
enforcement and housing development in Calabar
South-Nigeria. International Journal of Modern
Sciences and Engineering Technology, 3 (7), 7-14.
https://nebula.wsimg.com/8c8dff7447ab1dd063a07c51
854abd38?AccessKeyId=D81D660734BCB585516F&di
sposition=0&alloworigin=1
Olujimi J. A. B (1992), The administration of physical
planning in Nigeria: The Ondo state experience.
Landscape and urban planning 25, 115-136.
https://www.sciencedirect.com/science/article/pii/016
920469390127Y
Olujimi J. A. B. (2008), Development Control -
Unpublished Course Paper on GSP 211. Dept. Of
Geography and Planning, Adekunle Ajasin University,
Akungba-Akoko
Compliance with the Planning Standards in Regulating Building Lines. The Case of Kisii Town, Kenya
Journal of Settlements and Spatial Planning, vol. 11, no. 2 (2020) 95-111
111
Omollo W. O. (2019), Barriers to the Effective
Regulation of the Building Construction Industry: An
Empirical Analysis. Journal of Construction Business
and Management, 3(2), 49-58. https://doi.org/
10.15641/jcbm.3.2.745
Omollo W. O. (2020a), Provision of car parking space
in the residential neighbourhoods: A development
control challenge in urban areas. International Journal
of Human Capital in Urban Management, 5(1):59-68.
http://www.ijhcum.net/article_38444.html
Omollo W. O. (2020b), Compliance with planning
standards related to the setbacks around domestic
buildings: Empirical evidence from Kenya. Journal of
Contemporary Urban Affairs, 4(2), 95-108.
https://doi.org/10.25034/ijcua.2020.v4n2-9
Omollo W. O., Hayombe P. O., Owino F. O.
(2018), Compliance with physical planning standards
by residential developments in Kisii Town, Kenya.
Architecture Research, 8 (2), 62-73. http://article.
sapub.org/10.5923.j.arch.20180802.03.html
Onokerhoraye A. G., Omuta G. E. D. (1986),
Urban systems and planning for Africa. Benin City,
Nigeria: Editorial Committee, Geography and Planning
Series, University of Benin. https://www.worldcat.org
/title/urban-systems-and-planning-for-africa/oclc/153
01346?page=citation
Otieno J. (2012), Current building code fit for
archives. Standard Newspaper. https://www.standard
media.co.ke/lifestyle/article/2000056052/current-
building-code-fit-for-archives
Raji A. U., Attah U. A. (2017), Enforcing building
setbacks as a viable strategy for an emerging city. Path
of Science, 3(6), 21-27. https://www.ceeol.com/search/
article-detail?id=544064
Rukwaro R. W. (2009), Owner occupier and violation
of building by-laws. Habitat International, 33, 485-498.
https://doi.org/10.1016/j.habitatint.2009.03.004
Sylvester I. T. (2014), The dialectics between physical
plans and physical development in contemporary urban
Nigeria: empirical evidence from the Kighir-Adeke
Layout, Makurdi, Nigeria. Academic Research
International 5(4), 142-152. http://www.savap.org.
pk/journals/ARInt./Vol.5(4)/2014(5.4-16).pdf.
The Government of Kenya (1968), The Local
Government (Adoptive By-Laws) (Building) Order 1968
and The Local Government (Adoptive By-Laws) (Grade
II Building) Order 1968. https://eregulations.invest.
go.ke/media/BUILDING%20CODE.pdf
The Government of Kenya (1998), Architects and
Quantity Surveyors Act Government Printer: Nairobi.
http://kenyalaw.org: 8181/exist/kenyalex/actview.xql?
actid=CAP.%20525.
The Government of Kenya (1998), Physical
Planning (Building and Development) (Control) Rules.
Government Printer: Nairobi. http://faolex.fao.org
/docs/ pdf/ ken14866b.pdf
The Government of Kenya (2012), Architects and
Quantity Surveyors Act. Government Printer: Nairobi.
https://eregulations.invest.go.ke/media/Architectsand
QuantitySurveyorsAct.pdf
The Government of Kenya (2013), Science,
Technology and Innovation Act: Government Printer:
Nairobi. https: //www.nacosti .go.ke/images/docs
/2018/november/Science-Technology-and-Innovation-
Act-No.-28-of-2013.pdf.
The Government of Kenya (2019), Physical
Planning and Land Use Planning Act. Government
Printer: Nairobi. http://kenyalaw.org/kl/ fileadmin/
pdfdownloads/Acts/2019/PhysicalandLandUsePlannin
gAct_No13of2019.pdf
The Kenya National Bureau of Statistics (2019),
Kenya population and housing census, volume I:
Population by county and sub-county. https://www.
knbs. or.ke/ ?page_id=3142
Warner C. (2015), Participatory mapping: A literature
review of community-based research and participatory
planning. https://pdfs.semanticscholar.org/883f/768
308cac12556b9 12750590e9720c42b146.pdf
Windapo A., Cattell K. (2010), A Study of Building
Contractors’ Compliance with National Building
Regulations in Cape Town. https://mafiadoc.com/a-
study-of-building-contractors-compliance-with-
national-building-_599c1fcd1 723dd09401ad6fe.html
Yau Y., Ho D. C. W., Chau K. W. (2010), On the
empirics of housing illegality: A case study in Hong
Kong. In: Built Environment: Design, Management and
Applications. Editor: Paul S. Gelle, Nova Science
Publishers, Inc. https://www.researchgate.net
/publication/259823813_On_the_empirics_of_housin
g_illegality_ A_case_study _in_Hong_Kong


![[Wilfred Carr] for Education](https://img.pdfslide.us/doc/110x75/563db813550346aa9a9058fa/wilfred-carr-for-education.jpg)