Embed Size (px)
Citation preview
IDAHO DEPARTMENT OF FISH AND GAME
Virgil Moore, Director
Surveys and Inventories
FY2015 Statewide Report
WILDLIFE HARVEST AND HUNTER SURVEYS
Study IV, Job 1
July 1, 2014 to June 30, 2015
Prepared By:
Bruce Ackerman Wildlife Staff Biologist
3/26/2017
Boise, Idaho
Idaho Department of Fish and Game (IDFG) adheres to all applicable state and federal laws and regulations related to discrimination on the basis of race, color, national origin, age, gender, disability or veteran’s status. If you feel you have been discriminated against in any program, activity, or facility of IDFG, or if you desire further information, please write to: Idaho Department of Fish and Game, PO Box 25, Boise, ID 83707 or US Fish and Wildlife Service, Division of Wildlife and Sport Fish Restoration Program, 5275 Leesburg Pike, MS: WSFR, Falls Church, VA 22041-3803, Telephone: (703) 358-2156. Findings in this report are preliminary in nature and not for publication without permission of the Director of the Idaho Department of Fish and Game. Please note that IDFG databases containing this information are dynamic. Records are added, deleted, and/or edited on a frequent basis. This information was current as of 3/20/17. Raw data do not have the benefit of interpretation or synthesis by IDFG. IDFG requests that you direct any requests for this information to us rather than forwarding this information to third parties. This publication will be made available in alternative formats upon request. Please contact IDFG for assistance.
i
TABLE OF CONTENTS
STATEWIDE HARVEST ...............................................................................................................2
ABSTRACT .........................................................................................................................2
INTRODUCTION ...............................................................................................................2
DEER, ELK, AND PRONGHORN ANTELOPE ...........................................................................2
MOOSE, BIGHORN SHEEP, MOUNTAIN GOATS, BLACK BEARS, MOUNTAIN LIONS, AND GRAY WOLVES ...................................................................................................................5
OTHER HUNTER SURVEYS ........................................................................................................6
HUNTER OPINION SURVEYS .....................................................................................................6
WOLF SIGHTINGS, SURVEY 2014 .................................................................................7
MISCELLANEOUS HUNTER OPINION SURVEYS ......................................................7
LITERATURE CITED ....................................................................................................................8
ACKNOWLEDGMENTS ...............................................................................................................8
APPENDIX A ................................................................................................................................13
LIST OF TABLES
Table 1. Statewide estimates of harvest, number of hunters, and activity for 2014. ......................9
Table 2. Big game harvest history, 1935-2014. ............................................................................10
APPENDIX A ................................................................................................................................13
Wildlife Harvest & Hunter Surveys Statewide 2015
STATEWIDE REPORT SURVEYS AND INVENTORY
JOB TITLE: Surveys and Inventories STUDY NAME: Big Game Harvest Statewide
PERIOD COVERED: July 1, 2014 to June 30, 2015
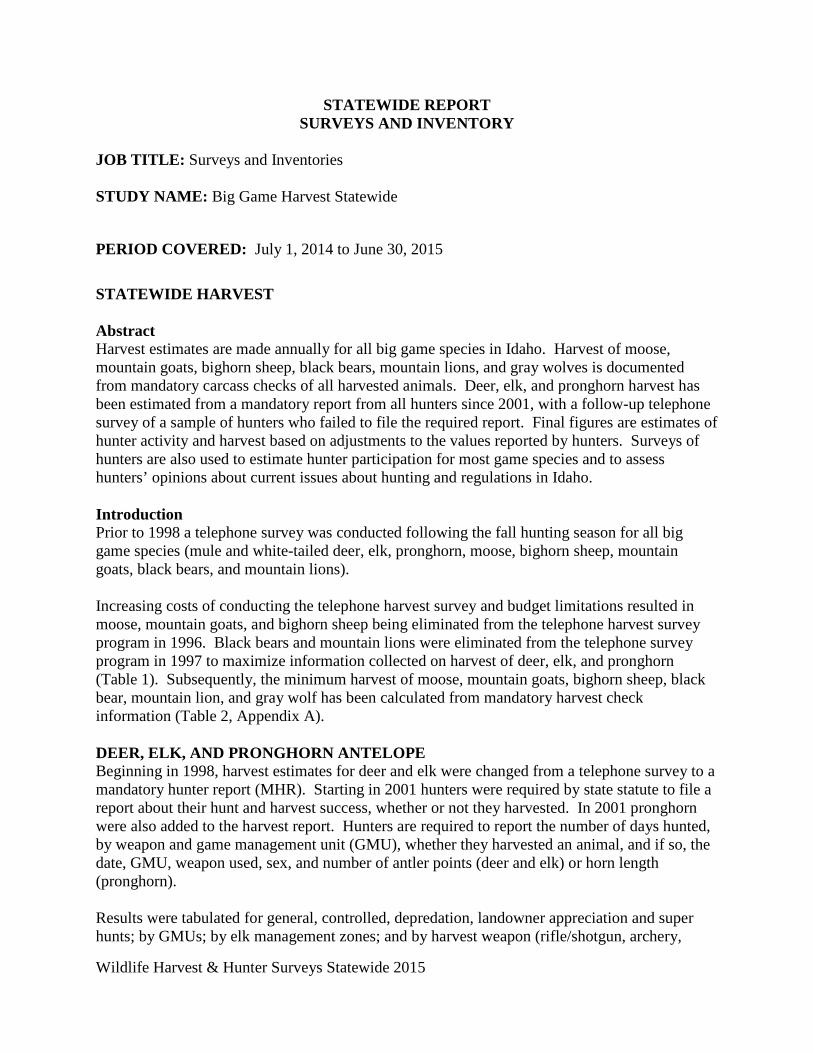
STATEWIDE HARVEST Abstract Harvest estimates are made annually for all big game species in Idaho. Harvest of moose, mountain goats, bighorn sheep, black bears, mountain lions, and gray wolves is documented from mandatory carcass checks of all harvested animals. Deer, elk, and pronghorn harvest has been estimated from a mandatory report from all hunters since 2001, with a follow-up telephone survey of a sample of hunters who failed to file the required report. Final figures are estimates of hunter activity and harvest based on adjustments to the values reported by hunters. Surveys of hunters are also used to estimate hunter participation for most game species and to assess hunters’ opinions about current issues about hunting and regulations in Idaho. Introduction Prior to 1998 a telephone survey was conducted following the fall hunting season for all big game species (mule and white-tailed deer, elk, pronghorn, moose, bighorn sheep, mountain goats, black bears, and mountain lions). Increasing costs of conducting the telephone harvest survey and budget limitations resulted in moose, mountain goats, and bighorn sheep being eliminated from the telephone harvest survey program in 1996. Black bears and mountain lions were eliminated from the telephone survey program in 1997 to maximize information collected on harvest of deer, elk, and pronghorn (Table 1). Subsequently, the minimum harvest of moose, mountain goats, bighorn sheep, black bear, mountain lion, and gray wolf has been calculated from mandatory harvest check information (Table 2, Appendix A). DEER, ELK, AND PRONGHORN ANTELOPE Beginning in 1998, harvest estimates for deer and elk were changed from a telephone survey to a mandatory hunter report (MHR). Starting in 2001 hunters were required by state statute to file a report about their hunt and harvest success, whether or not they harvested. In 2001 pronghorn were also added to the harvest report. Hunters are required to report the number of days hunted, by weapon and game management unit (GMU), whether they harvested an animal, and if so, the date, GMU, weapon used, sex, and number of antler points (deer and elk) or horn length (pronghorn). Results were tabulated for general, controlled, depredation, landowner appreciation and super hunts; by GMUs; by elk management zones; and by harvest weapon (rifle/shotgun, archery,
Wildlife Harvest & Hunter Surveys Statewide 2015
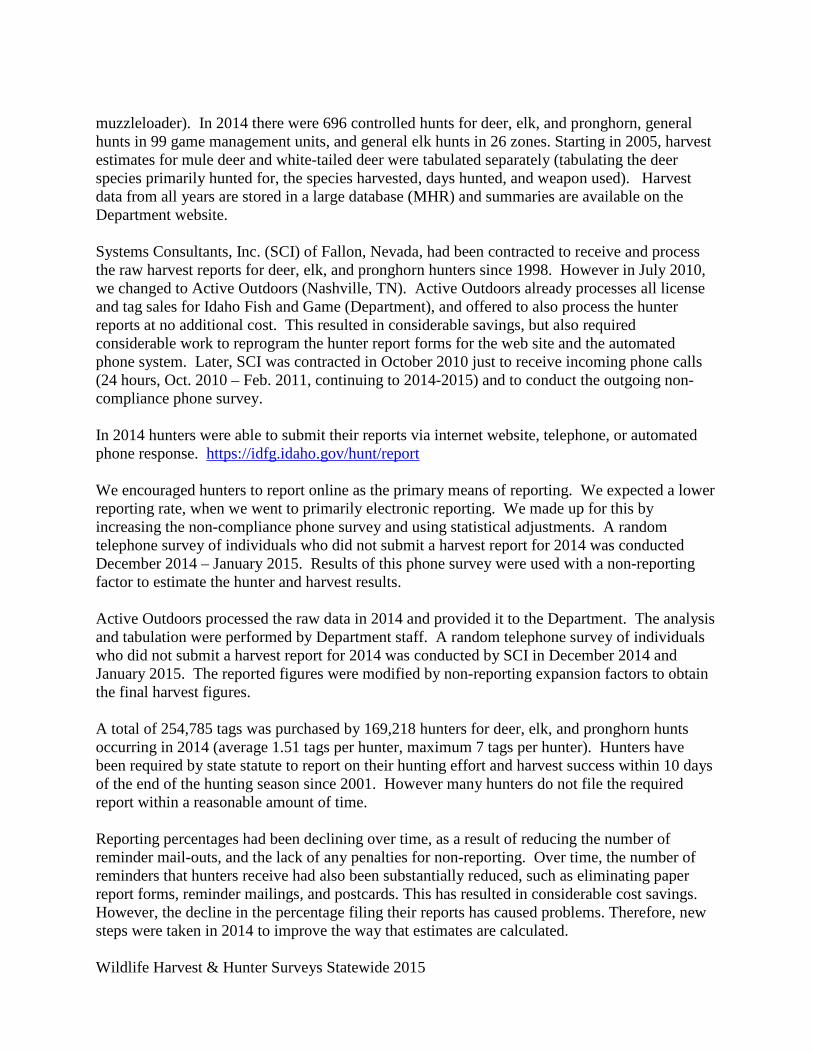
muzzleloader). In 2014 there were 696 controlled hunts for deer, elk, and pronghorn, general hunts in 99 game management units, and general elk hunts in 26 zones. Starting in 2005, harvest estimates for mule deer and white-tailed deer were tabulated separately (tabulating the deer species primarily hunted for, the species harvested, days hunted, and weapon used). Harvest data from all years are stored in a large database (MHR) and summaries are available on the Department website. Systems Consultants, Inc. (SCI) of Fallon, Nevada, had been contracted to receive and process the raw harvest reports for deer, elk, and pronghorn hunters since 1998. However in July 2010, we changed to Active Outdoors (Nashville, TN). Active Outdoors already processes all license and tag sales for Idaho Fish and Game (Department), and offered to also process the hunter reports at no additional cost. This resulted in considerable savings, but also required considerable work to reprogram the hunter report forms for the web site and the automated phone system. Later, SCI was contracted in October 2010 just to receive incoming phone calls (24 hours, Oct. 2010 – Feb. 2011, continuing to 2014-2015) and to conduct the outgoing non-compliance phone survey. In 2014 hunters were able to submit their reports via internet website, telephone, or automated phone response. https://idfg.idaho.gov/hunt/report We encouraged hunters to report online as the primary means of reporting. We expected a lower reporting rate, when we went to primarily electronic reporting. We made up for this by increasing the non-compliance phone survey and using statistical adjustments. A random telephone survey of individuals who did not submit a harvest report for 2014 was conducted December 2014 – January 2015. Results of this phone survey were used with a non-reporting factor to estimate the hunter and harvest results. Active Outdoors processed the raw data in 2014 and provided it to the Department. The analysis and tabulation were performed by Department staff. A random telephone survey of individuals who did not submit a harvest report for 2014 was conducted by SCI in December 2014 and January 2015. The reported figures were modified by non-reporting expansion factors to obtain the final harvest figures. A total of 254,785 tags was purchased by 169,218 hunters for deer, elk, and pronghorn hunts occurring in 2014 (average 1.51 tags per hunter, maximum 7 tags per hunter). Hunters have been required by state statute to report on their hunting effort and harvest success within 10 days of the end of the hunting season since 2001. However many hunters do not file the required report within a reasonable amount of time. Reporting percentages had been declining over time, as a result of reducing the number of reminder mail-outs, and the lack of any penalties for non-reporting. Over time, the number of reminders that hunters receive had also been substantially reduced, such as eliminating paper report forms, reminder mailings, and postcards. This has resulted in considerable cost savings. However, the decline in the percentage filing their reports has caused problems. Therefore, new steps were taken in 2014 to improve the way that estimates are calculated.
Wildlife Harvest & Hunter Surveys Statewide 2015
For example, for many years, a small paper report form was given to hunters with their tag purchase, with a return envelope for mailing it back. The paper report forms were discontinued in June 2010 to save considerable money on data entry, postage, and printing. After June 2010, no printed report forms and return envelopes were provided. Mail and fax responses have been gradually phased out. An automated computerized interactive telephone voice response system (IVR) was added in August 2010, but later eliminated because it was not well received by hunters. Hunters are increasingly encouraged to file their reports online or by telephone. In past years, a reminder letter (90,000 mailed in mid-December 2007 and mid-January 2008) was sent to hunters who had not yet filed reports. This letter was eliminated in 2008 to reduce costs and obtain results sooner. One reminder postcard was sent to 97,400 hunters who had not yet filed their reports by mid-November 2014 (one postcard per household). A total of 157,612 reports were filed by hunters by April 5, 2015 (61.9% of required reports). To estimate bias from non-compliance, we attempted to call a random sample of 50,000 of the remaining hunters by telephone to obtain their harvest reports (increased from 40,000 in 2010). These hunters were called in December 2014 and January 2015. This phone sample was larger than in 2009-2010, and four times as large as in 2006. The harvest results from the telephone sample were used to estimate the harvest by hunters who did not file reports. Therefore, we tried a new approach to obtain estimates earlier for 2014, starting in January 2015), and with improved confidence intervals around the estimates. Non-compliance phone surveys were completed in December 2014 and January 2015 to call a random sample of 50,000 hunters who had not yet filed their reports. Reports by these hunters were used for a new estimation method to obtain the hunter and harvest estimates earlier, with preliminary results starting in mid-January 2015. The primary purpose was to improve the process of setting regulations for the Fall 2015 hunting season, which is done in March 2015, using harvest data from Fall 2014. A real-time update on the number of reports filed was available for viewing in Fall 2014.
https://fishandgame.idaho.gov/content/mhr The number of hunters contacted by phone was increased to compensate for the anticipated lower percent who reported because of reduced mailings and elimination of the printed forms in 2010. Goals were to increase the statistical validity of the estimates and complete the project one month earlier. The phone sample was increased considerably over the previous years (50,000 in 2011-2014, 40,000 hunters in 2009-2010, 32,000 in 2008, 16,000 in 2007, and 8,000 in 2006). This phone survey was done one month earlier starting in 2008-2009 (Dec./Jan.) than in previous years (Jan./Feb.), to obtain results earlier. Therefore some hunters did not have as much time to report on their own as in past years. The 2014 survey was conducted in December 2014-January 2015. Online reporting has increased considerably over the last few years. A higher percentage of reports was received on-line (70%) than by phone (29%), an increasing trend in recent years.
Wildlife Harvest & Hunter Surveys Statewide 2015
All Pronghorn hunts were converted to only controlled hunts in 2009. Pronghorn hunters and those with controlled hunt tags for deer and elk were sampled at a higher rate to increase precision. The results of the telephone non-compliance survey were used to estimate the harvest and participation by hunters who did not file reports. Harvest data from Fall 2014 were analyzed at a general level by March 2015, and at a detailed level by May 2015. Based on these data, changes to big game regulations were approved in March 2015, so that regulations could be printed in April, and hunters could apply for controlled hunts in June 2015. The final harvest results were placed on the Department web site in May 2015. Improvements were made to the process of transferring results to the web site to be integrated with the Department’s Hunt Planner web site for better functionality. Hunters can search online for harvest statistics for each hunt, drawing odds for controlled hunt, and other pertinent information. Hunt Planner
http://fishandgame.idaho.gov/ifwis/huntplanner/ Harvest Estimates http://fishandgame.idaho.gov/ifwis/huntplanner/stats.aspx Drawing Odds http://fishandgame.idaho.gov/public/licenses/controlledHunts/lookupOdds.cfm
In 2014 we experimented with an online table combining the harvest statistics with the drawing odds for each controlled hunt (deer, elk, pronghorn, moose, bighorn sheep, and mountain goat). This process made it easier for hunters to understand their chances for drawing a permit and harvesting an animal in each controlled hunt.
https://fishandgame.idaho.gov/content/huntplanner/2014-hunt-stats A summary of deer, elk, and pronghorn harvest is presented in Tables 1 and 2 and Appendix A. Estimated harvest and hunter participation for these species are also listed in other Federal Aid reports about each species. These harvest data are used to fill many requests for information by managers, biologists, commissioners, legislators, research collaborators, interested citizens, and other stakeholders. MOOSE, BIGHORN SHEEP, MOUNTAIN GOATS, BLACK BEARS, MOUNTAIN LIONS, AND GRAY WOLVES Harvest of moose, bighorn sheep, mountain goats, black bears, mountain lions, and gray wolves was documented from mandatory carcass checks of all harvested animals (Table 2 and Appendix A). We conducted 4,002 checks for these species. Number of hunters that participated and days hunted are not calculated for these species. Estimated harvest and hunter participation for these species are also listed in other Federal Aid about each species.
Wildlife Harvest & Hunter Surveys Statewide 2015
These species were eliminated from the telephone harvest survey program in 1996-1997 to maximize information collected on harvest of deer, elk, and pronghorn. These mortality data are housed in a large database (BGMR, Big Game Mortality Reports). Other documented causes of mortality are also tracked in this database, such as illegal kills, road kills, and natural mortality. These harvest databases are used to fill many requests for information by managers, biologists, commissioners, legislators, research collaborators, interested citizens, and other stakeholders. Harvest estimates are posted on the Department website. More detailed information about these species is listed in other Federal Aid reports about each species. Hunt Planner
http://fishandgame.idaho.gov/ifwis/huntplanner/ Harvest Estimates http://fishandgame.idaho.gov/ifwis/huntplanner/stats.aspx Drawing Odds http://fishandgame.idaho.gov/public/licenses/controlledHunts/lookupOdds.cfm
In 2014 we experimented with an online table combining the harvest statistics with the drawing odds for each controlled hunt (deer, elk, pronghorn, moose, bighorn sheep, mountain goat). This process made it easier for hunters to understand their chances for drawing a permit and harvesting an animal in each controlled hunt.
https://fishandgame.idaho.gov/content/huntplanner/2014-hunt-stats We also added the drawing odds from 2014 into the 2015-2016 Trophy Species regulations booklet (moose, bighorn sheep, and mountain goat) to make it easier to choose among controlled hunts.
https://idfg.idaho.gov/hunt/rules/moose-sheep-goat OTHER HUNTER SURVEYS In addition to big game, further surveys were conducted to monitor hunter participation in 2014-2015 – number of hunters, number animals harvested, and days hunted -- for sandhill cranes, sage- and sharp-tailed grouse, wild turkeys, snow and white-fronted geese, and upland game (3 species of forest grouse (blue/dusky, ruffed, spruce), pheasants, gray partridge, chukars, quail, cottontails, and snowshoe hares). Detailed information about these species is listed in other Federal Aid Statewide reports. These harvest data are used to fill many requests for information by managers, biologists, commissioners, legislators, research collaborators, interested citizens, and other stakeholders. HUNTER OPINION SURVEYS In addition to estimating game harvest statistics, hunter survey questionnaires are also frequently used to ask hunter’s opinions about current issues about hunting and regulations in Idaho. These might include the hunter’s perception of the quality of hunting, expenditures during hunting, proposed changes in regulations, or the success of various programs. Sometimes stand-alone
Wildlife Harvest & Hunter Surveys Statewide 2015
surveys are used for more in-depth studies of hunter’s opinions. These data are valuable in monitoring the quality of the hunting programs. A stratified-random sample of hunters is typically contacted using a mailed survey questionnaire with a follow-up non-response phone call. Participants are drawn from the list of hunters who purchased various hunting licenses and/or specific relevant tags or permits. In some cases, selected hunters may also respond using a web-based survey form on the internet. Topics surveyed in 2014-2015 included:
• Sightings of wolves by deer and elk hunters in Fall 2014, and • Hunter opinion survey about big game hunting in Region 1.
Wolf Sightings Survey 2014 Deer and elk hunters were surveyed in January 2015 about their wolf sightings while hunting in Fall 2014. Hunters (n=9,166) who had reported seeing wolves on their MHR reporting form, while hunting deer and elk, were asked further questions about their wolf observations (live wolf sightings only). Wolf sightings by respondents in 2014 were mapped and compiled by specific week of the fall season, along with their deer and elk hunting report (# hunters, #wolves seen, #deer harvested, #elk harvested, harvest density, #hunter days). Surveys were mailed out and responses entered by the Department. Data analysis was conducted by University of Montana staff. The purpose of this survey is to assess the presence of wolf packs as reported by hunters, as one of several sources of information to assess wolf abundance. This is one part of an occupancy modeling approach to develop an efficient, low-cost monitoring method in the future to assess where wolf packs are located, perhaps without using radio-telemetry in the future. This is the seventh (2014) year of a study in collaboration with the University of Montana and the Nez Perce Tribe. A manuscript from the first phase of this analysis, with data from the Fall 2009 and 2010, has been published (Ausband, et al. 2014). To evaluate distribution of wolves in Idaho during 2014, a single-season occupancy model was developed using hunter observations (n=2,492) and radio-telemetry data (n=33 packs) with 6 covariates: forest cover, slope, antlered elk harvest density, hunter effort, sampling month, and proportion of cell in Idaho. Using this model, an estimated 50.2% of Idaho (108,482 km2) was used by groups or packs of 2+ wolves during fall 2014 (IDFG 2015 Wolf Monitoring Progress Report, page 12). Miscellaneous hunter opinion surveys
Elk hunter opinion survey about Region 1 (Feb 2015) -- A questionnaire was mailed to 1,000 Panhandle residents asking various questions about proposed changes to big game regulations, for deer, elk, black bears, mountain lions, and wolves. Results were analyzed by Region 1 staff. Committee Involvement
Wildlife Harvest & Hunter Surveys Statewide 2015
Biometrician Bruce Ackerman served on the Technical Working Group for the year-long 2016 National Survey of Fishing, Hunting, and Wildlife-Associated Recreation (NSFHWAR). This survey is conducted once every 5 years, since 1955, by the U.S. Fish and Wildlife Service and the U.S. Census Bureau, and funded by the national Association of Fish and Wildlife Agencies (AFWA). The Technical Working Group has worked since July 2013 to radically improve the methodology of this national survey to make the results more precise and more meaningful. Large numbers of hunters, anglers, and wildlife-watchers will be interviewed nationally during 2016-2017 about their participation in 2016. Final results are expected in 2018. Biometrician Bruce Ackerman also served on Boise State University’s Institutional Animal Care and Use Committee (IACUC), 2012-2015, which reviews all research projects involving living animals. Publications or in-house reports resulting from this work. IDFG. 2015. Wolf Monitoring Progress Report, Idaho Department of Fish and Game. Dated March 2016. Statewide Species Management Reports (available via [email protected]) at https://collaboration.idfg.idaho.gov/WildlifeTechnicalReports/Forms/AllItems.aspx LITERATURE CITED Ausband, D. E., L. N. Rich, E. M. Glenn, M. S. Mitchell, P. Zager, D. A.W. Miller, L. P. Waits,
B. B. Ackerman, and C. M. Mack. 2014. Monitoring gray wolf populations using multiple survey methods. Journal of Wildlife Management 78(2):335-346.
ACKNOWLEDGMENTS This survey was partially supported by Federal Aid in Wildlife Restoration (W-170-R) Statewide Big Game Harvest Survey. The 2014 raw harvest survey data for deer, elk, and pronghorn were processed by Active Outdoors, Nashville, Tennessee. Telephone services for the deer, elk, and pronghorn surveys were provided by Systems Consultants, Inc., Fallon, Nevada, under contract with the Idaho Department of Fish and Game.
Wildlife Harvest & Hunter Surveys Statewide 2015
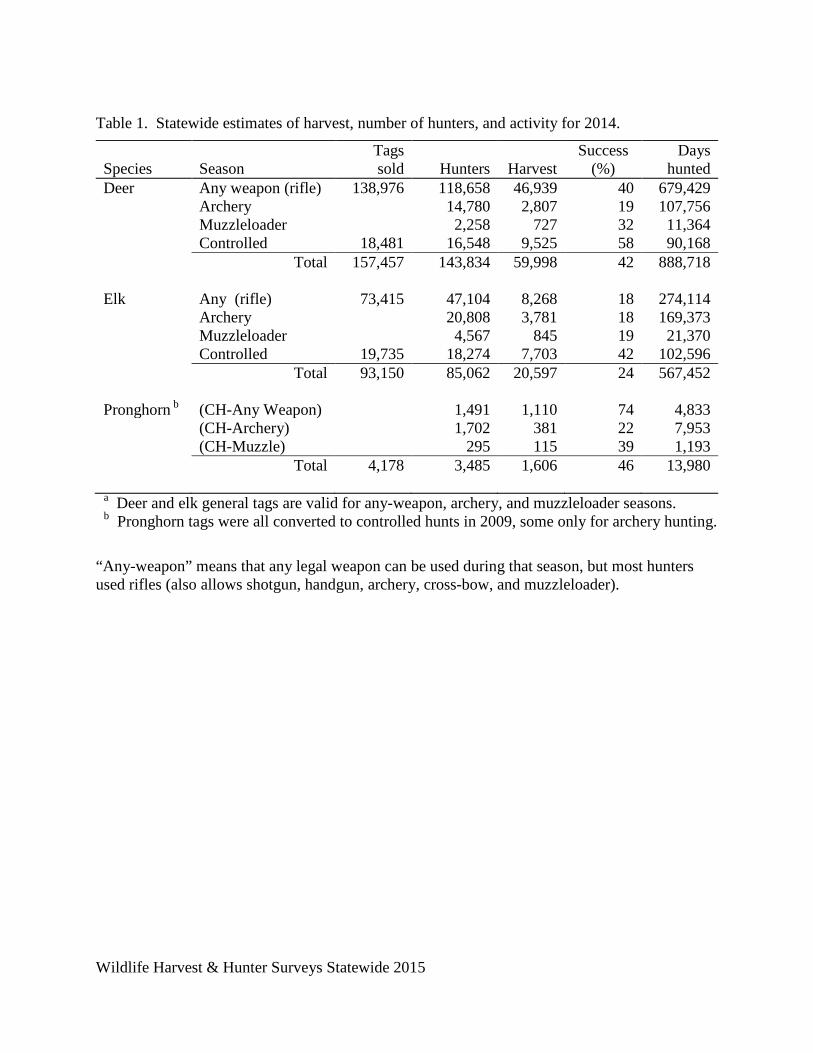
Table 1. Statewide estimates of harvest, number of hunters, and activity for 2014.
Species Season Tags sold Hunters Harvest
Success (%)
Days hunted
Deer Any weapon (rifle) 138,976 118,658 46,939 40 679,429 Archery 14,780 2,807 19 107,756 Muzzleloader 2,258 727 32 11,364 Controlled 18,481 16,548 9,525 58 90,168 Total 157,457 143,834 59,998 42 888,718 Elk Any (rifle) 73,415 47,104 8,268 18 274,114 Archery 20,808 3,781 18 169,373 Muzzleloader 4,567 845 19 21,370 Controlled 19,735 18,274 7,703 42 102,596 Total 93,150 85,062 20,597 24 567,452 Pronghorn b (CH-Any Weapon) 1,491 1,110 74 4,833 (CH-Archery) 1,702 381 22 7,953 (CH-Muzzle) 295 115 39 1,193 Total 4,178 3,485 1,606 46 13,980
a Deer and elk general tags are valid for any-weapon, archery, and muzzleloader seasons. b Pronghorn tags were all converted to controlled hunts in 2009, some only for archery hunting.
“Any-weapon” means that any legal weapon can be used during that season, but most hunters used rifles (also allows shotgun, handgun, archery, cross-bow, and muzzleloader).
Wildlife Harvest & Hunter Surveys Statewide 2015
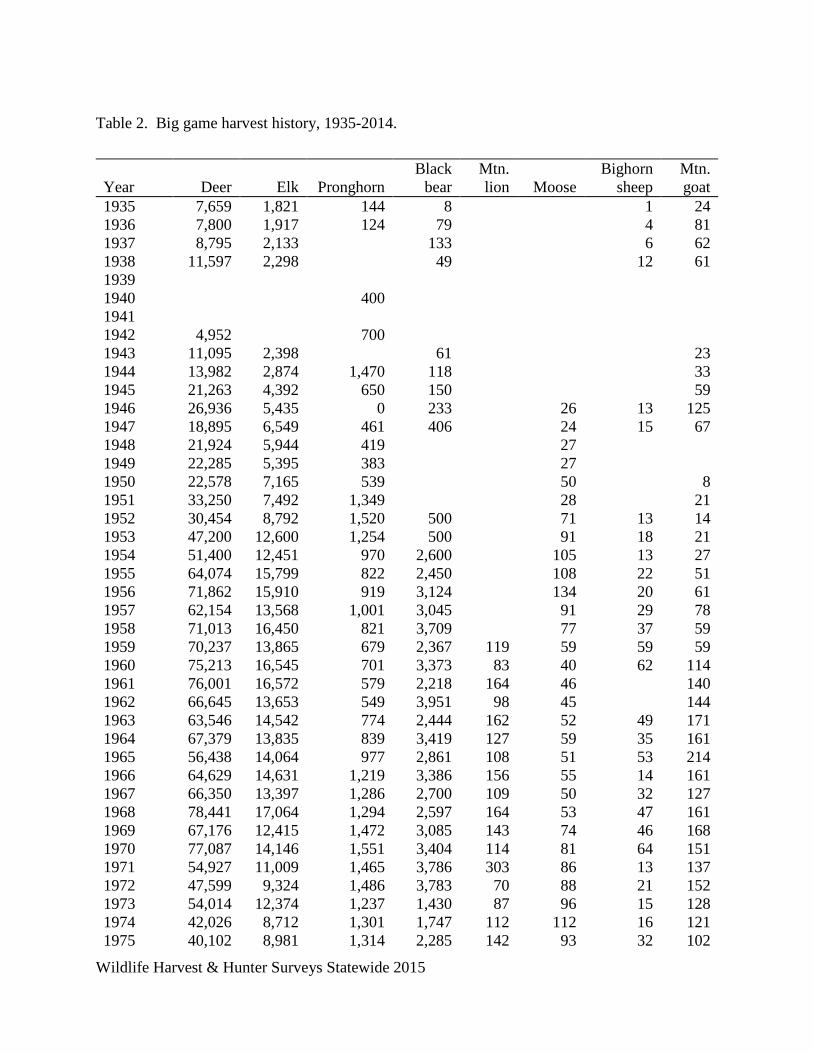
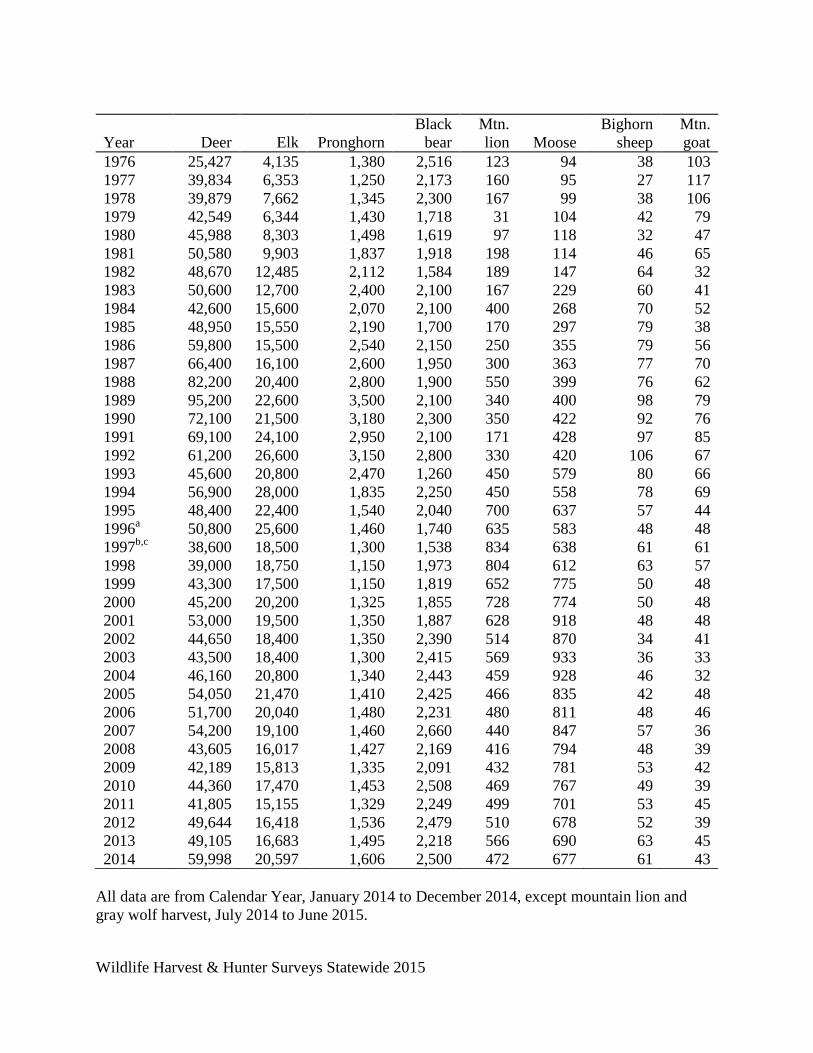
Table 2. Big game harvest history, 1935-2014.
Year Deer Elk Pronghorn Black
bear Mtn. lion Moose
Bighorn sheep
Mtn. goat
1935 7,659 1,821 144 8 1 24 1936 7,800 1,917 124 79 4 81 1937 8,795 2,133 133 6 62 1938 11,597 2,298 49 12 61 1939 1940 400 1941 1942 4,952 700 1943 11,095 2,398 61 23 1944 13,982 2,874 1,470 118 33 1945 21,263 4,392 650 150 59 1946 26,936 5,435 0 233 26 13 125 1947 18,895 6,549 461 406 24 15 67 1948 21,924 5,944 419 27 1949 22,285 5,395 383 27 1950 22,578 7,165 539 50 8 1951 33,250 7,492 1,349 28 21 1952 30,454 8,792 1,520 500 71 13 14 1953 47,200 12,600 1,254 500 91 18 21 1954 51,400 12,451 970 2,600 105 13 27 1955 64,074 15,799 822 2,450 108 22 51 1956 71,862 15,910 919 3,124 134 20 61 1957 62,154 13,568 1,001 3,045 91 29 78 1958 71,013 16,450 821 3,709 77 37 59 1959 70,237 13,865 679 2,367 119 59 59 59 1960 75,213 16,545 701 3,373 83 40 62 114 1961 76,001 16,572 579 2,218 164 46 140 1962 66,645 13,653 549 3,951 98 45 144 1963 63,546 14,542 774 2,444 162 52 49 171 1964 67,379 13,835 839 3,419 127 59 35 161 1965 56,438 14,064 977 2,861 108 51 53 214 1966 64,629 14,631 1,219 3,386 156 55 14 161 1967 66,350 13,397 1,286 2,700 109 50 32 127 1968 78,441 17,064 1,294 2,597 164 53 47 161 1969 67,176 12,415 1,472 3,085 143 74 46 168 1970 77,087 14,146 1,551 3,404 114 81 64 151 1971 54,927 11,009 1,465 3,786 303 86 13 137 1972 47,599 9,324 1,486 3,783 70 88 21 152 1973 54,014 12,374 1,237 1,430 87 96 15 128 1974 42,026 8,712 1,301 1,747 112 112 16 121 1975 40,102 8,981 1,314 2,285 142 93 32 102
Wildlife Harvest & Hunter Surveys Statewide 2015
Year Deer Elk Pronghorn Black
bear Mtn. lion Moose
Bighorn sheep
Mtn. goat
1976 25,427 4,135 1,380 2,516 123 94 38 103 1977 39,834 6,353 1,250 2,173 160 95 27 117 1978 39,879 7,662 1,345 2,300 167 99 38 106 1979 42,549 6,344 1,430 1,718 31 104 42 79 1980 45,988 8,303 1,498 1,619 97 118 32 47 1981 50,580 9,903 1,837 1,918 198 114 46 65 1982 48,670 12,485 2,112 1,584 189 147 64 32 1983 50,600 12,700 2,400 2,100 167 229 60 41 1984 42,600 15,600 2,070 2,100 400 268 70 52 1985 48,950 15,550 2,190 1,700 170 297 79 38 1986 59,800 15,500 2,540 2,150 250 355 79 56 1987 66,400 16,100 2,600 1,950 300 363 77 70 1988 82,200 20,400 2,800 1,900 550 399 76 62 1989 95,200 22,600 3,500 2,100 340 400 98 79 1990 72,100 21,500 3,180 2,300 350 422 92 76 1991 69,100 24,100 2,950 2,100 171 428 97 85 1992 61,200 26,600 3,150 2,800 330 420 106 67 1993 45,600 20,800 2,470 1,260 450 579 80 66 1994 56,900 28,000 1,835 2,250 450 558 78 69 1995 48,400 22,400 1,540 2,040 700 637 57 44 1996a 50,800 25,600 1,460 1,740 635 583 48 48 1997b,c 38,600 18,500 1,300 1,538 834 638 61 61 1998 39,000 18,750 1,150 1,973 804 612 63 57 1999 43,300 17,500 1,150 1,819 652 775 50 48 2000 45,200 20,200 1,325 1,855 728 774 50 48 2001 53,000 19,500 1,350 1,887 628 918 48 48 2002 44,650 18,400 1,350 2,390 514 870 34 41 2003 43,500 18,400 1,300 2,415 569 933 36 33 2004 46,160 20,800 1,340 2,443 459 928 46 32 2005 54,050 21,470 1,410 2,425 466 835 42 48 2006 51,700 20,040 1,480 2,231 480 811 48 46 2007 54,200 19,100 1,460 2,660 440 847 57 36 2008 43,605 16,017 1,427 2,169 416 794 48 39 2009 42,189 15,813 1,335 2,091 432 781 53 42 2010 44,360 17,470 1,453 2,508 469 767 49 39 2011 41,805 15,155 1,329 2,249 499 701 53 45 2012 49,644 16,418 1,536 2,479 510 678 52 39 2013 49,105 16,683 1,495 2,218 566 690 63 45 2014 59,998 20,597 1,606 2,500 472 677 61 43
All data are from Calendar Year, January 2014 to December 2014, except mountain lion and gray wolf harvest, July 2014 to June 2015.
Wildlife Harvest & Hunter Surveys Statewide 2015
a Because of budget shortfalls and increasing costs of conducting the telephone harvest survey, moose, bighorn sheep, and mountain goats were eliminated from the telephone survey in 1996. Harvest figures after 1996 result from mandatory harvest check-in records. b Harvest estimates from 1997-2000 do not include pronghorn harvest during the general archery season. c Black bear and mountain lions were dropped from the telephone survey program in 1997 because of budget restrictions. Harvest figures after 1997 result from mandatory harvest check-in records.
Wildlife Harvest & Hunter Surveys Statewide 2015
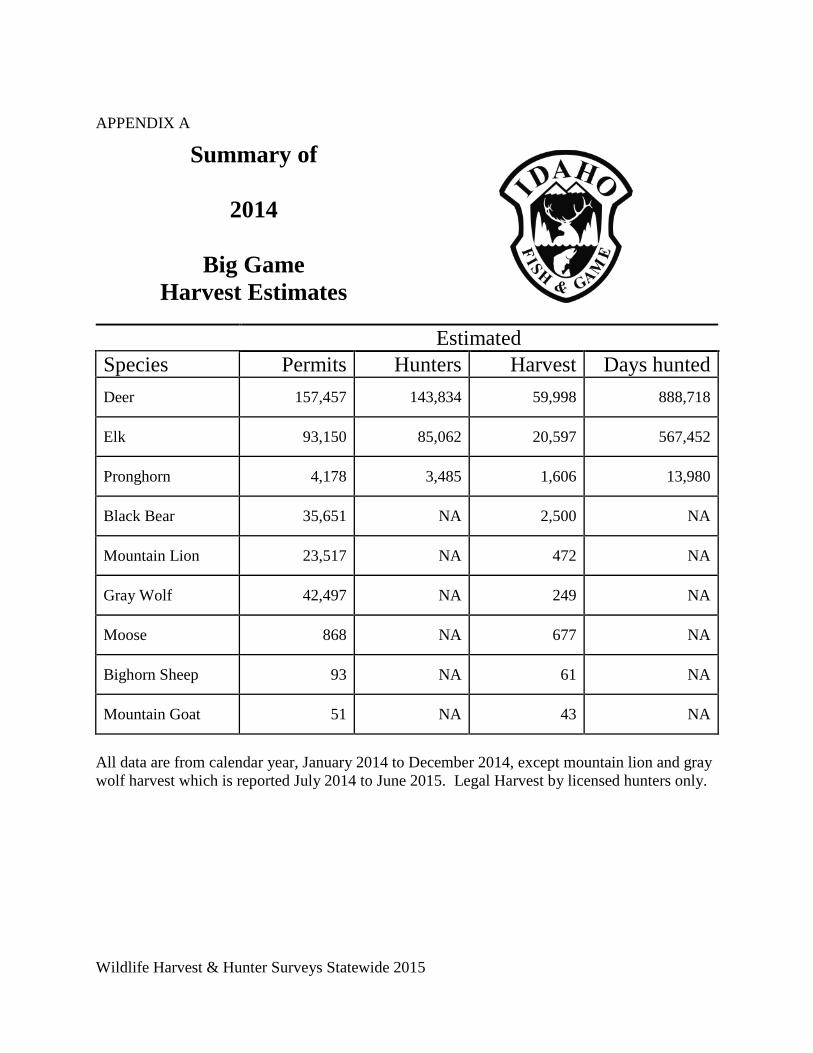
APPENDIX A
Summary of
2014
Big Game Harvest Estimates
Estimated Species Permits Hunters Harvest Days hunted Deer 157,457 143,834 59,998 888,718
Elk 93,150 85,062 20,597 567,452
Pronghorn 4,178 3,485 1,606 13,980
Black Bear 35,651 NA 2,500 NA
Mountain Lion 23,517 NA 472 NA
Gray Wolf 42,497 NA 249 NA
Moose 868 NA 677 NA
Bighorn Sheep 93 NA 61 NA
Mountain Goat 51 NA 43 NA
All data are from calendar year, January 2014 to December 2014, except mountain lion and gray wolf harvest which is reported July 2014 to June 2015. Legal Harvest by licensed hunters only.
Submitted by:
Bruce Ackerman, PhD. Wildlife Staff Biologist \ Biometrician \Statistician Bureau of Wildlife 208-287-2753, [email protected] Approved by: IDAHO DEPARTMENT OF FISH AND GAME Brad Compton, Asst. Chief Federal Aid Coordinator Bureau of Wildlife
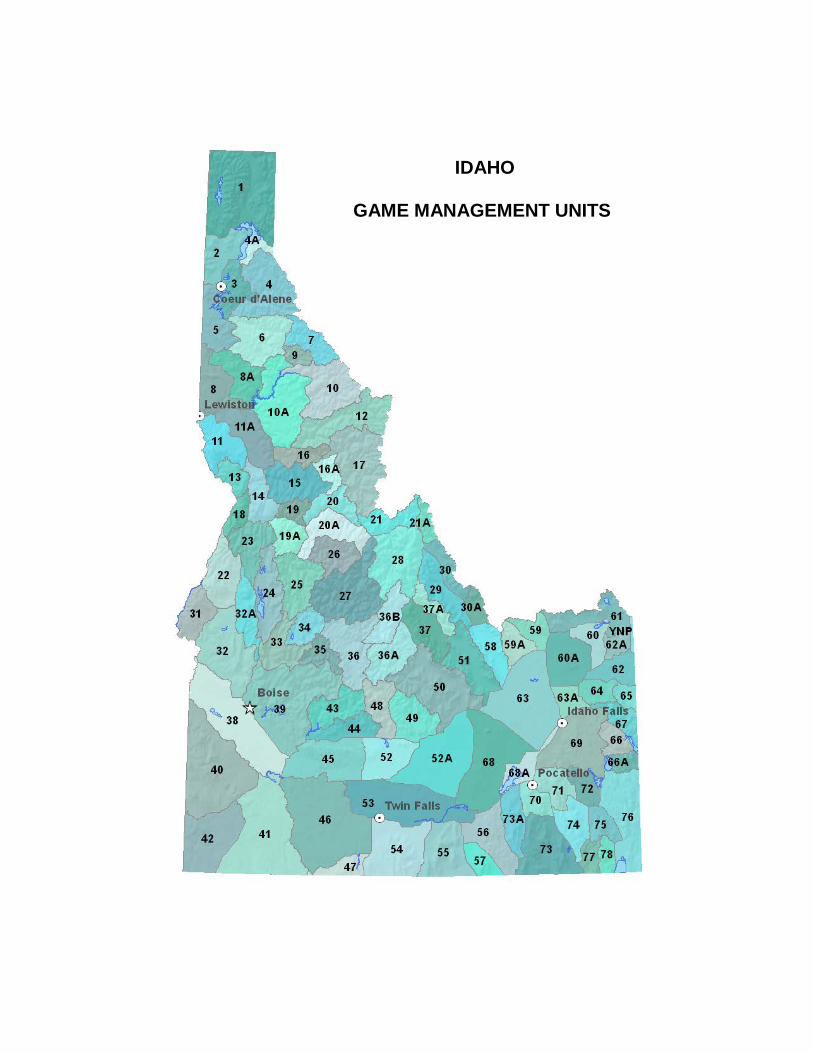
IDAHO
GAME MANAGEMENT UNITS
FEDERAL AID IN WILDLIFE RESTORATION
The Federal Aid in Wildlife Restoration Program consists of funds from a
10% to 11% manufacturer’s excise tax collected from the sale of
handguns, sporting rifles, shotguns, ammunition, and archery equipment.
The Federal Aid program then allots the funds back to states through a
formula based on each state’s
geographic area and the number of
paid hunting license holders in the
state. The Idaho Department of
Fish and Game uses the funds to
help restore, conserve, manage,
and enhance wild birds and
mammals for the public benefit.
These funds are also used to
educate hunters to develop the skills, knowledge, and attitudes necessary
to be responsible, ethical hunters. Seventy-five percent of the funds for
this project are from Federal Aid. The other 25% comes from license-
generated funds.


![ELK HUNTING IN IDAHO › old-web › docs › wildlife › elkPlan › surveyPanhandle.pdf[ELK HUNTING IN IDAHO: PANHANDLE] ELK HUNTER PROFILES (TRAVEL PATTERNS, HUNTING HISTORY, HARVEST](https://img.pdfslide.us/doc/110x75/5f0c1dc57e708231d433d1e4/elk-hunting-in-idaho-a-old-web-a-docs-a-wildlife-a-elkplan-a-elk-hunting.jpg)