Embed Size (px)
Citation preview
Evaluation of Alternative Moose Harvest Strategies in Game Management Zone
5B; East Cariboo
Ministry of Forests, Lands and Natural Resource Operations
September, 2011
Review of Alternative Moose Harvest Strategies in GMZ 5B (East Cariboo) 2
Table of Contents List of Figures ................................................................................................................................................ 3
List of Tables ................................................................................................................................................. 3
Introduction .................................................................................................................................................. 4
Moose Management in the Cariboo ............................................................................................................. 4
2011 GMZ 5B Population Assessment .......................................................................................................... 6
I. Population Estimate .......................................................................................................................... 6
II. Harvest Data Analysis ........................................................................................................................ 8
Alternative Harvest Strategies .................................................................................................................... 11
Estimating Harvest under Alternative Harvest Strategies .......................................................................... 12
I. First Nations Sustenance and Ceremonial Needs ........................................................................... 12
II. LEH Bull Harvest Estimates ............................................................................................................. 12
III. Spike-fork Harvest Estimates ...................................................................................................... 13
IV. Calf Harvest Estimates ................................................................................................................ 13
V. Total Estimated Moose Harvest Under Alternative Management Strategies ................................ 13
Modeling Alternative Harvest Strategies ................................................................................................ 16
I. Population Model ........................................................................................................................... 16
II. Risk Analysis; Probability of Not Meeting Population Targets........................................................ 17
Evaluation of Alternative Harvest Strategies .............................................................................................. 17
I. Modelling Results ............................................................................................................................ 17
II. Discussion ........................................................................................................................................ 20
References .................................................................................................................................................. 21
Appendices .................................................................................................................................................. 23
I) Estimated Spike-Fork Harvest ......................................................................................................... 23
II) Calf Harvest Estimate ...................................................................................................................... 24
III) First Nations Per Capita Needs from 2004-2008 Allocation ....................................................... 26
Review of Alternative Moose Harvest Strategies in GMZ 5B (East Cariboo) 3
List of Figures Figure 1. Game Management Zones (GMZs) within the Cariboo Region ..................................... 5
Figure 2. Average resident moose hunter success rate in Game Management Zone 5B (GMZ 5B)
from 2001 to 2009 ........................................................................................................................... 8
Figure 3. Average resident moose hunter days per kill in Game Management Zone 5B (GMZ 5B)
from 2001 to 2009 ........................................................................................................................... 9
Figure 4. Total resident moose hunter harvest in Management Units 5-01 and 5-02 from 2001 to
2009................................................................................................................................................. 9
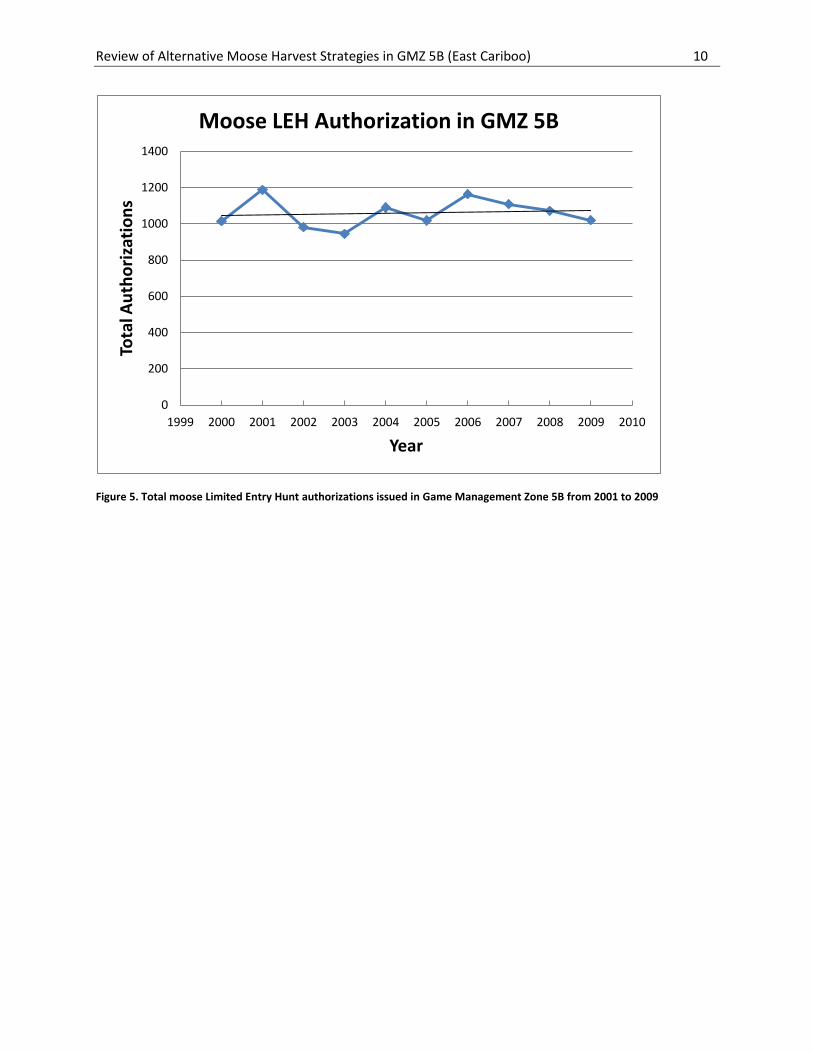
Figure 5. Total moose Limited Entry Hunt authorizations issued in Game Management Zone 5B
from 2001 to 2009 ......................................................................................................................... 10
Figure 6. Region 3 average spike-fork harvest related to calculated MU vulnerability and Region
5 expected spike-fork harvest using linear regression. ................................................................. 24
Figure 7. Region 7 average juvenile moose harvest related to average hunter days and expected
GMZ 5B MU calf harvest using linear regression ........................................................................ 25
List of Tables Table 1. Stratified Random Block (SRB) estimated moose densities from surveys conducted in
Game management Zone 5B (moose/km2). .................................................................................... 7
Table 2. 2011 Game Management Zone 5B (GMZ 5B) Moose population Estimate .................... 7
Table 3. Alternative Harvest Strategies Evaluated for the Cariboo Region 2012-2016 allocation
period ............................................................................................................................................ 11
Table 4. Estimated First Nations Sustenance and Ceremonial Needs by GMZ for 2003, 2008, and
2011............................................................................................................................................... 12
Table 5. Estimated moose harvest in GMZ 5B under each evaluated alternative harvest strategy
....................................................................................................................................................... 14
Table 6. Consequence Table; expected average growth rate and relative probabilities of not
meeting moose population targets under alternative harvest strategies in GMZ 5B .................... 19
Table 7. Region 3 spike fork harvest analysis .............................................................................. 23
Table 8. Region 5 estimated Spike-fork harvest in GMZ 5B. ...................................................... 23
Table 9. Area, average hunter days and average juvenile harvest in several Omineca management
units. .............................................................................................................................................. 24
Table 10. Area, expected hunter days, and expected harvest in GMZ 5B MUs based on Region 7
data. ............................................................................................................................................... 25
Table 11. 1978-1982 historic calf harvest, MU corrected harvest based on season length and
average annual GMZ 5B corrected calf harvest ........................................................................... 26
Review of Alternative Moose Harvest Strategies in GMZ 5B (East Cariboo) 4
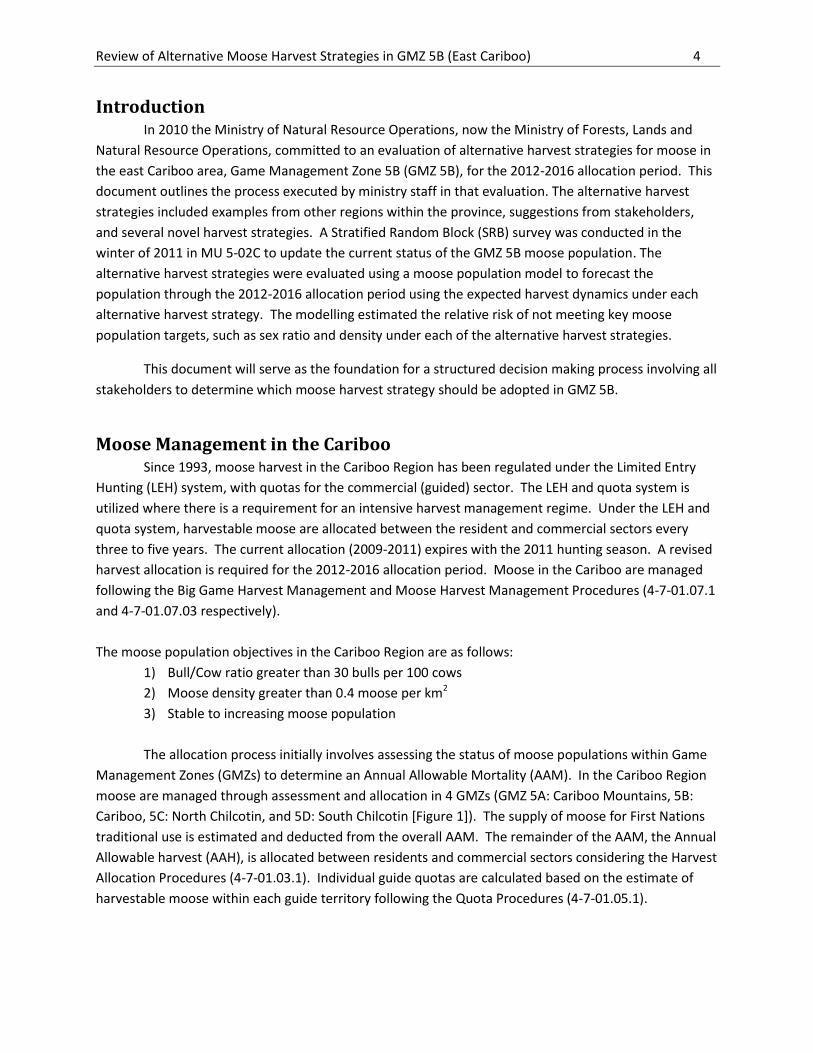
Introduction In 2010 the Ministry of Natural Resource Operations, now the Ministry of Forests, Lands and
Natural Resource Operations, committed to an evaluation of alternative harvest strategies for moose in
the east Cariboo area, Game Management Zone 5B (GMZ 5B), for the 2012-2016 allocation period. This
document outlines the process executed by ministry staff in that evaluation. The alternative harvest
strategies included examples from other regions within the province, suggestions from stakeholders,
and several novel harvest strategies. A Stratified Random Block (SRB) survey was conducted in the
winter of 2011 in MU 5-02C to update the current status of the GMZ 5B moose population. The
alternative harvest strategies were evaluated using a moose population model to forecast the
population through the 2012-2016 allocation period using the expected harvest dynamics under each
alternative harvest strategy. The modelling estimated the relative risk of not meeting key moose
population targets, such as sex ratio and density under each of the alternative harvest strategies.
This document will serve as the foundation for a structured decision making process involving all
stakeholders to determine which moose harvest strategy should be adopted in GMZ 5B.
Moose Management in the Cariboo Since 1993, moose harvest in the Cariboo Region has been regulated under the Limited Entry
Hunting (LEH) system, with quotas for the commercial (guided) sector. The LEH and quota system is
utilized where there is a requirement for an intensive harvest management regime. Under the LEH and
quota system, harvestable moose are allocated between the resident and commercial sectors every
three to five years. The current allocation (2009-2011) expires with the 2011 hunting season. A revised
harvest allocation is required for the 2012-2016 allocation period. Moose in the Cariboo are managed
following the Big Game Harvest Management and Moose Harvest Management Procedures (4-7-01.07.1
and 4-7-01.07.03 respectively).
The moose population objectives in the Cariboo Region are as follows:
1) Bull/Cow ratio greater than 30 bulls per 100 cows
2) Moose density greater than 0.4 moose per km2
3) Stable to increasing moose population
The allocation process initially involves assessing the status of moose populations within Game
Management Zones (GMZs) to determine an Annual Allowable Mortality (AAM). In the Cariboo Region
moose are managed through assessment and allocation in 4 GMZs (GMZ 5A: Cariboo Mountains, 5B:
Cariboo, 5C: North Chilcotin, and 5D: South Chilcotin [Figure 1]). The supply of moose for First Nations
traditional use is estimated and deducted from the overall AAM. The remainder of the AAM, the Annual
Allowable harvest (AAH), is allocated between residents and commercial sectors considering the Harvest
Allocation Procedures (4-7-01.03.1). Individual guide quotas are calculated based on the estimate of
harvestable moose within each guide territory following the Quota Procedures (4-7-01.05.1).
Review of Alternative Moose Harvest Strategies in GMZ 5B (East Cariboo) 5
GMZ population estimates are based on periodic abundance surveys (Stratified Random Block [SRB]
surveys) supplemented with compositional surveys. Harvest data from the LEH hunter questionnaire is
compiled and analyzed to corroborate the population estimates calculated from the survey data.
The AAH is determined using a population model as is the standard in North America for
ungulate management (White and Lubow 2002). The results of the modelling are evaluated to
determine the probability, under each alternative harvest option, that population objectives will not be
met. The modelling results are then discussed with First Nations and stakeholders, and the Regional
Manager selects an AAH considering the biological implications, First Nation concerns, and stakeholder
preferences.
Figure 1. Game Management Zones (GMZs) within the Cariboo Region
Review of Alternative Moose Harvest Strategies in GMZ 5B (East Cariboo) 6
2011 GMZ 5B Population Assessment
I. Population Estimate
The 2011 GMZ 5B population estimate was derived from the 2011 Management Unit 5-02C SRB
survey (Davis 2011). The survey estimate used Idaho Aerial Survey© to calculate an independent
Sightability Correction Factor (SCF) from vegetation cover observations made during the survey. The
Idaho Aerial Survey© sightability correction model was modified with data from British Columbia moose
sightability studies (Quayle et al. 2001, D. Heard unpublished data). The 2011 survey estimated a
density of 0.51 (±0.078) moose per km2, a bull/cow ratio of 43 (±11.6) bulls/100 cows, and a calf/cow
ratio of 35 (±8.9) calves/100 cows (Davis 2011). The prior MU 5-02C survey in 2001 estimated a density
of 0.62 (±0.088) moose per km2, a bull/cow ratio of 21 (±5.6) bulls/100 cows, and a calf/cow ratio of 45
(±9.6) calves/100 cows (Davis 2011).
GMZ 5B can be divided into two portions based on the average moose density from past SRB
surveys: the historically low density portion containing MUs 5-01 and 5-02A (1994-2011 average density
= 0.26), and the historically high density portion containing MUs 5-02B, 5-02C, and 5-02D (1994-2011
average density = 0.48) [Table 1 and Table 2]. To calculate the 2011 GMZ 5B population estimate, the
2011 MU 5-02C SRB survey density was extrapolated to the entire GMZ, maintaining the historic density
ratio between the low and high density areas. MU 5-02C is within the historically high density portion of
GMZ 5B, therefore we extrapolated the estimated density from the 2011 survey of 0.51 moose per km2
to the 9284km2 of suitable moose habitat within the high density portion of the GMZ (Table 2), for an
estimate of 4735 moose. We maintain the ratio between the historic densities (0.26 to 0.48) to calculate
an estimated 2011 density for the low density portion of GMZ 5B of 0.279 moose per km2. Extrapolating
this density out to the 5485km2 of suitable moose habitat in the low density portion of the GMZ, gives a
2011 estimate of 1530 moose. Adding the low and high density area estimates together gives a total
moose population estimate in GMZ 5B for 2011 of 6265 (Table 2).
The 2011 GMZ 5B moose estimate of 6265 moose is a decrease of 7% from the 2008 GMZ 5B
moose estimate of 6727 moose. The moose population composition estimates were made by applying
the sex and recruitment ratios estimated during the 2011 MU5-02C SRB survey (43 bulls/100 cows and
35 calves/100 cows). The 2011 calculated composition for the GMZ 5B moose population is 1514 bulls,
3519 cows, and 1232 calves. The 2008 estimated GMZ 5B composition was 1410 bulls, 3721 cows, and
1596 calves.
Review of Alternative Moose Harvest Strategies in GMZ 5B (East Cariboo) 7
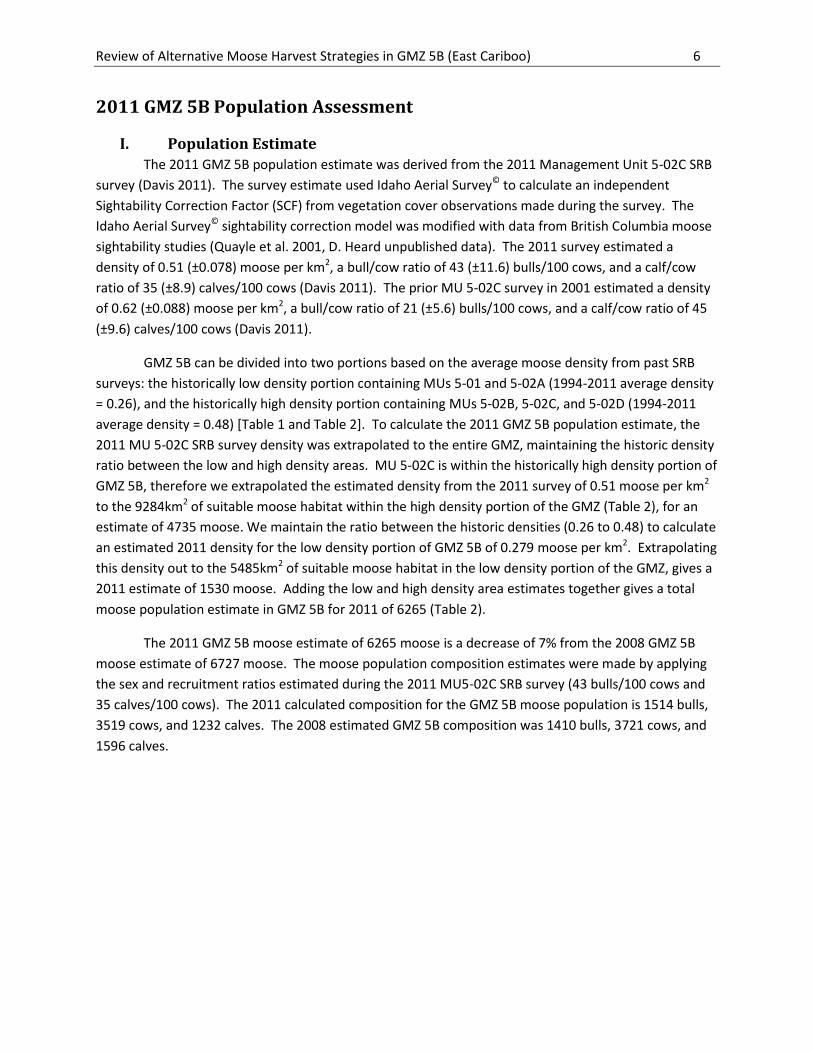
Table 1. Stratified Random Block (SRB) estimated moose densities from surveys conducted in Game management Zone 5B (moose/km
2).
Year 5-01 5-02A 5-02B 5-02C 5-02D
1994 0.50
1995
1996 0.43 0.09 0.65
1997 0.28
1998 0.26
1999 0.67
2000 0.32 0.59
2001 0.22 0.62
2002
2003
2004 0.13
2005
2006 0.39
2007
2008
2009
2010
2011 0.51
Table 2. 2011 Game Management Zone 5B (GMZ 5B) Moose population Estimate
Low Density MUs (5-01 and
5-02A) High Density MUs (5-02B,
5-02C, and 5-02D)
Game Management Zone
5B
Average Density 1994-2011
0.26 0.48
Estimated 2011 Density
0.28 0.51 0.42
Total Suitable Moose habitat (km2)
5,485 9,284 14,769
2011 Estimated Moose
1530 4735 6265
Review of Alternative Moose Harvest Strategies in GMZ 5B (East Cariboo) 8
II. Harvest Data Analysis
Resident harvest data from 2001-2009 was compiled and graphed to visualize any trends in the
harvest data. Non-Resident data was not utilized due to concerns relating to specific factors influencing
the harvest success of guided hunters (e.g. reports from guides that many clients choose only to harvest
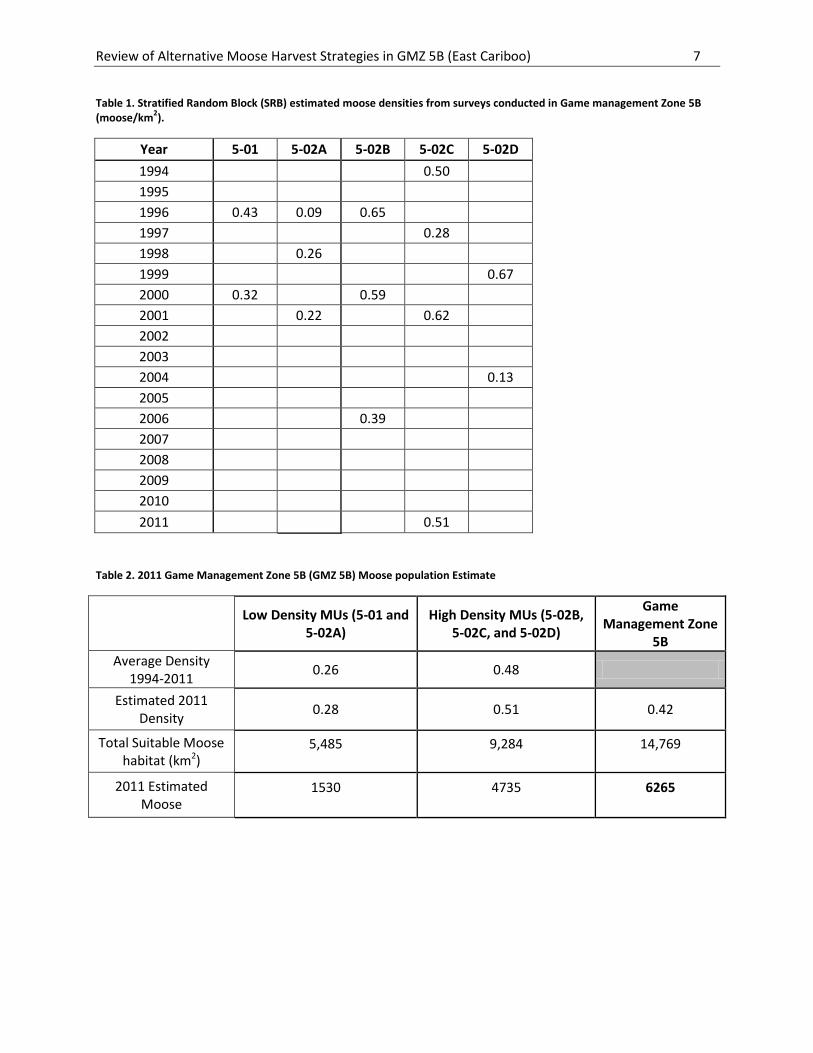
“trophy” animals and pass on smaller bulls). The average resident success rate (total moose killed
divided by the total number of hunters) in GMZ 5B has decline from approximately 48% in early 2000s to
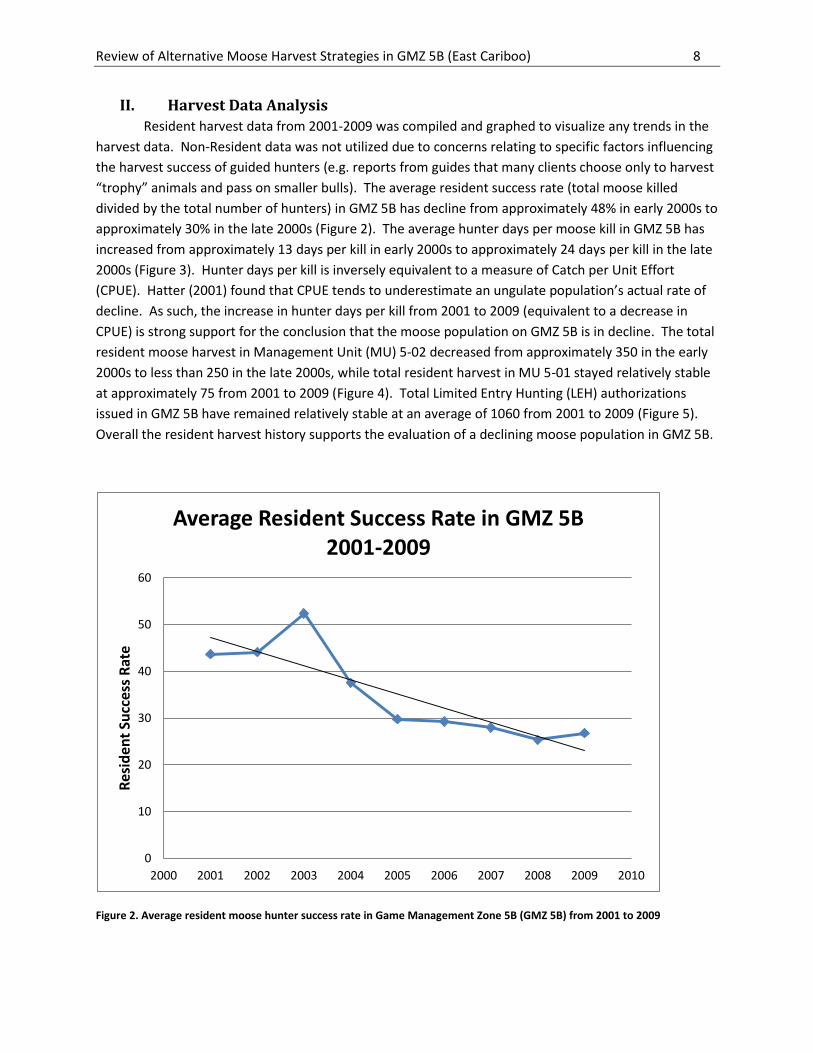
approximately 30% in the late 2000s (Figure 2). The average hunter days per moose kill in GMZ 5B has
increased from approximately 13 days per kill in early 2000s to approximately 24 days per kill in the late
2000s (Figure 3). Hunter days per kill is inversely equivalent to a measure of Catch per Unit Effort
(CPUE). Hatter (2001) found that CPUE tends to underestimate an ungulate population’s actual rate of
decline. As such, the increase in hunter days per kill from 2001 to 2009 (equivalent to a decrease in
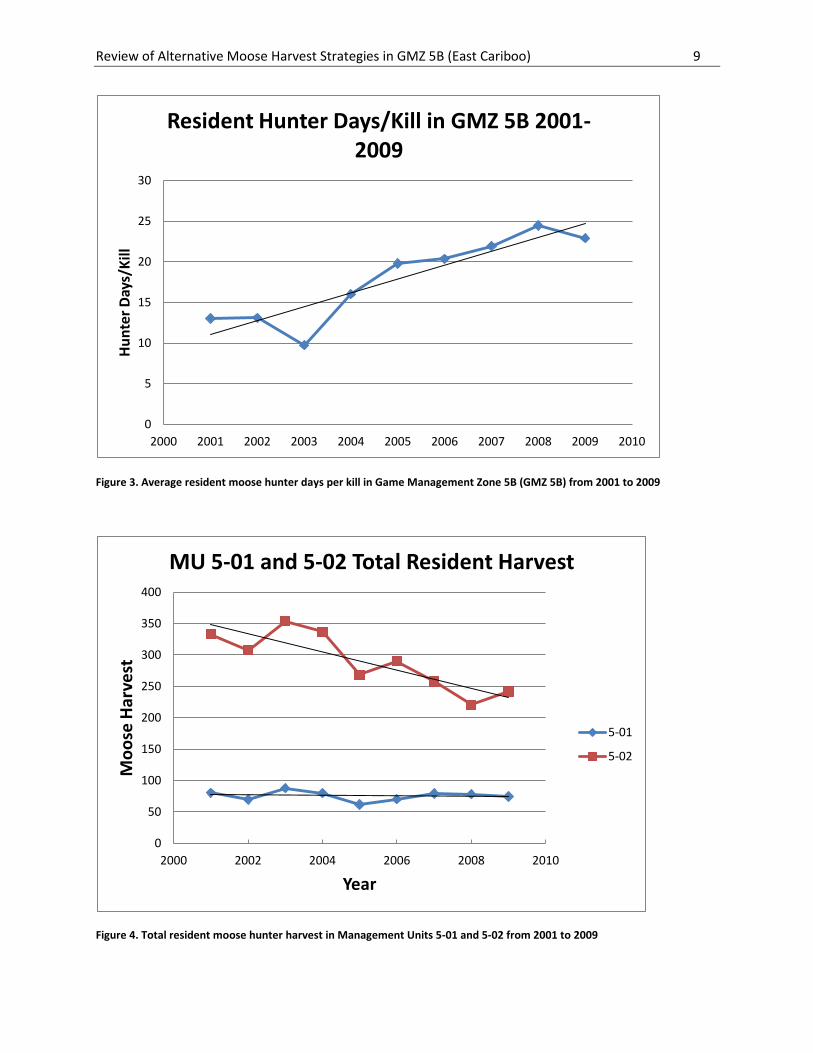
CPUE) is strong support for the conclusion that the moose population on GMZ 5B is in decline. The total
resident moose harvest in Management Unit (MU) 5-02 decreased from approximately 350 in the early
2000s to less than 250 in the late 2000s, while total resident harvest in MU 5-01 stayed relatively stable
at approximately 75 from 2001 to 2009 (Figure 4). Total Limited Entry Hunting (LEH) authorizations
issued in GMZ 5B have remained relatively stable at an average of 1060 from 2001 to 2009 (Figure 5).
Overall the resident harvest history supports the evaluation of a declining moose population in GMZ 5B.
Figure 2. Average resident moose hunter success rate in Game Management Zone 5B (GMZ 5B) from 2001 to 2009
0
10
20
30
40
50
60
2000 2001 2002 2003 2004 2005 2006 2007 2008 2009 2010
Res
iden
t Su
cces
s R
ate
Average Resident Success Rate in GMZ 5B 2001-2009
Review of Alternative Moose Harvest Strategies in GMZ 5B (East Cariboo) 9
Figure 3. Average resident moose hunter days per kill in Game Management Zone 5B (GMZ 5B) from 2001 to 2009
Figure 4. Total resident moose hunter harvest in Management Units 5-01 and 5-02 from 2001 to 2009
0
5
10
15
20
25
30
2000 2001 2002 2003 2004 2005 2006 2007 2008 2009 2010
Hu
nte
r D
ays/
Kill
Resident Hunter Days/Kill in GMZ 5B 2001-
2009
0
50
100
150
200
250
300
350
400
2000 2002 2004 2006 2008 2010
Mo
ose
Har
vest
Year
MU 5-01 and 5-02 Total Resident Harvest
5-01
5-02
Review of Alternative Moose Harvest Strategies in GMZ 5B (East Cariboo) 10
Figure 5. Total moose Limited Entry Hunt authorizations issued in Game Management Zone 5B from 2001 to 2009
0
200
400
600
800
1000
1200
1400
1999 2000 2001 2002 2003 2004 2005 2006 2007 2008 2009 2010
Tota
l Au
tho
riza
tio
ns
Year
Moose LEH Authorization in GMZ 5B
Review of Alternative Moose Harvest Strategies in GMZ 5B (East Cariboo) 11
Alternative Harvest Strategies Currently licensed moose harvest in GMZ 5B is limited to LEH bulls only for resident hunters and
bull only quotas for guide outfitters. First Nations harvest is not regulated. Eleven additional harvest
strategies were chosen to be evaluated as possible alternatives to the current harvest strategy.
Alternative harvest strategies modelled included examples from other regions in the province,
stakeholder suggestions, and several novel harvest strategies.
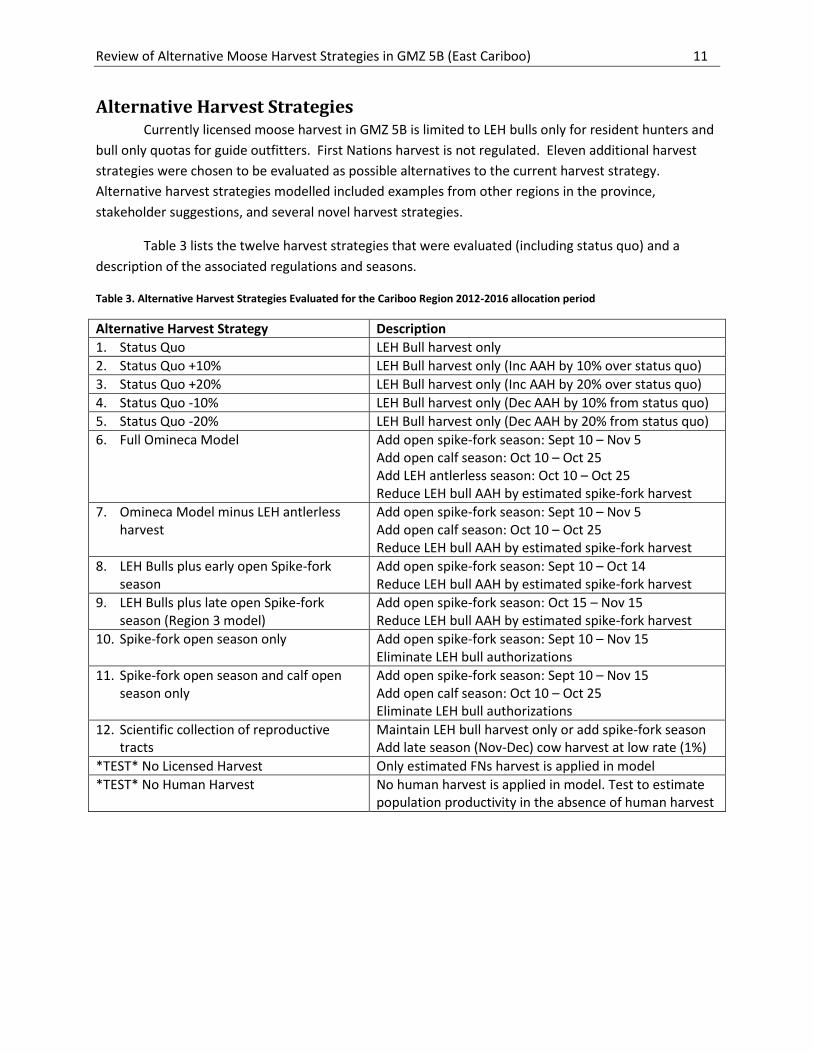
Table 3 lists the twelve harvest strategies that were evaluated (including status quo) and a
description of the associated regulations and seasons.
Table 3. Alternative Harvest Strategies Evaluated for the Cariboo Region 2012-2016 allocation period
Alternative Harvest Strategy Description
1. Status Quo LEH Bull harvest only
2. Status Quo +10% LEH Bull harvest only (Inc AAH by 10% over status quo)
3. Status Quo +20% LEH Bull harvest only (Inc AAH by 20% over status quo)
4. Status Quo -10% LEH Bull harvest only (Dec AAH by 10% from status quo)
5. Status Quo -20% LEH Bull harvest only (Dec AAH by 20% from status quo)
6. Full Omineca Model Add open spike-fork season: Sept 10 – Nov 5 Add open calf season: Oct 10 – Oct 25 Add LEH antlerless season: Oct 10 – Oct 25 Reduce LEH bull AAH by estimated spike-fork harvest
7. Omineca Model minus LEH antlerless harvest
Add open spike-fork season: Sept 10 – Nov 5 Add open calf season: Oct 10 – Oct 25 Reduce LEH bull AAH by estimated spike-fork harvest
8. LEH Bulls plus early open Spike-fork season
Add open spike-fork season: Sept 10 – Oct 14 Reduce LEH bull AAH by estimated spike-fork harvest
9. LEH Bulls plus late open Spike-fork season (Region 3 model)
Add open spike-fork season: Oct 15 – Nov 15 Reduce LEH bull AAH by estimated spike-fork harvest
10. Spike-fork open season only Add open spike-fork season: Sept 10 – Nov 15 Eliminate LEH bull authorizations
11. Spike-fork open season and calf open season only
Add open spike-fork season: Sept 10 – Nov 15 Add open calf season: Oct 10 – Oct 25 Eliminate LEH bull authorizations
12. Scientific collection of reproductive tracts
Maintain LEH bull harvest only or add spike-fork season Add late season (Nov-Dec) cow harvest at low rate (1%)
*TEST* No Licensed Harvest Only estimated FNs harvest is applied in model
*TEST* No Human Harvest No human harvest is applied in model. Test to estimate population productivity in the absence of human harvest
Review of Alternative Moose Harvest Strategies in GMZ 5B (East Cariboo) 12
Estimating Harvest under Alternative Harvest Strategies
I. First Nations Sustenance and Ceremonial Needs
First Nations consultation is ongoing and the GMZ 5B estimate of First Nations needs is
preliminary and could very likely change by the final determination of AAH and allocations in November
2011. Individual bands were contacted with letters requesting updated First Nations needs data for
sustenance and ceremonial purposes.
First Nations technical workshops are planned to be held at each community throughout August
and September 2011 to inform First Nations about current moose population status in the Cariboo, and
to inform First Nations of the allocation exercise the Ministry is undertaking. The Ministry will again
request updated First Nations needs information.
For the last allocation period (2009-2011) estimates of First Nations needs were based on
community specific estimates of per capita need developed for the 2004-2008 allocation period. For
2011, we have revised the First Nations requirements based on the 2004-2008 per capita estimates. We
applied the estimated per capita need from 2004-2008 to the current number of registered band
members to calculate an updated estimate of need for each band. Total First Nation’s estimated need
in the Cariboo rose from 1020 moose to 1070 moose from 2008 to 2011. Total First Nation need was
then divided into GMZ specific need based on traditional use information, and estimated harvest
locations. For more information on how per capita estimates were developed refer to Appendix III.
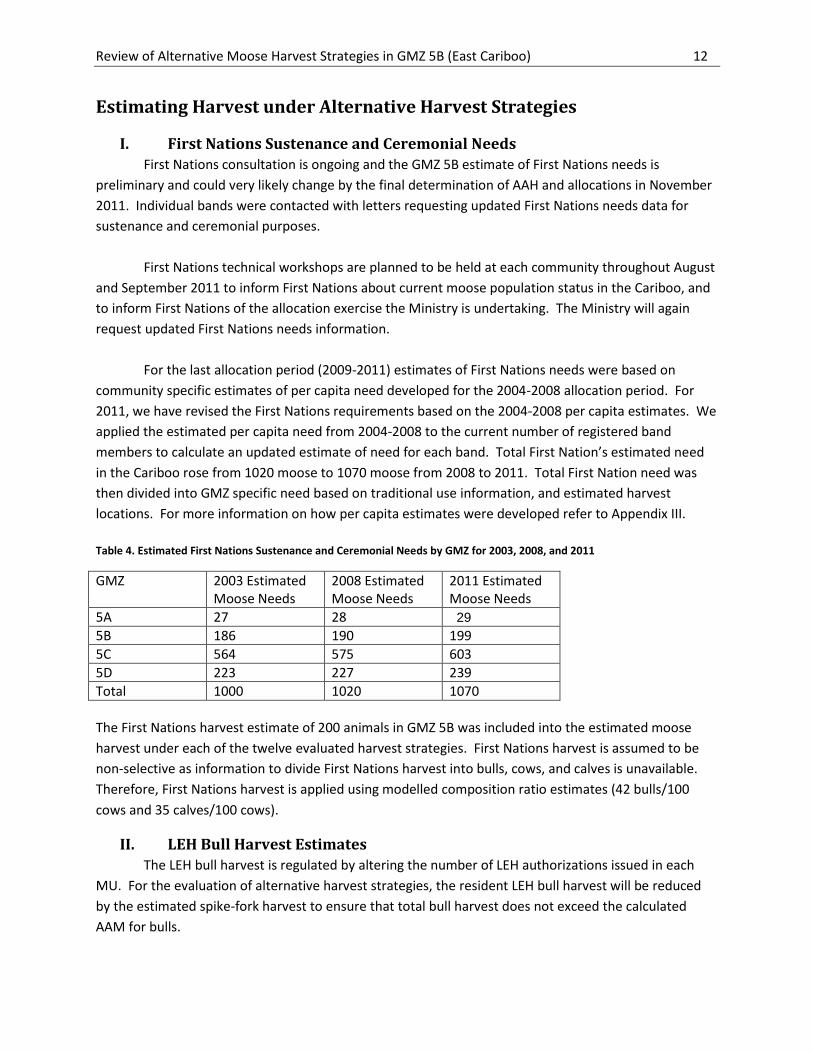
Table 4. Estimated First Nations Sustenance and Ceremonial Needs by GMZ for 2003, 2008, and 2011
GMZ 2003 Estimated Moose Needs
2008 Estimated Moose Needs
2011 Estimated Moose Needs
5A 27 28 29
5B 186 190 199
5C 564 575 603
5D 223 227 239
Total 1000 1020 1070
The First Nations harvest estimate of 200 animals in GMZ 5B was included into the estimated moose
harvest under each of the twelve evaluated harvest strategies. First Nations harvest is assumed to be
non-selective as information to divide First Nations harvest into bulls, cows, and calves is unavailable.
Therefore, First Nations harvest is applied using modelled composition ratio estimates (42 bulls/100
cows and 35 calves/100 cows).
II. LEH Bull Harvest Estimates
The LEH bull harvest is regulated by altering the number of LEH authorizations issued in each
MU. For the evaluation of alternative harvest strategies, the resident LEH bull harvest will be reduced
by the estimated spike-fork harvest to ensure that total bull harvest does not exceed the calculated
AAM for bulls.
Review of Alternative Moose Harvest Strategies in GMZ 5B (East Cariboo) 13
The 2008 combined resident and non-resident AAH for GMZ 5B was 473 bulls. For the status
quo alternative harvest strategy, the AAH was reduced to 440 bulls to account for the 7% decrease in
the moose population estimate from 2008 to 2011.
III. Spike-fork Harvest Estimates
The expected spike-fork harvests in GMZ 5B under alternative harvest strategies 6 through 11
(Table 3) were estimated using data from the Region 3 spike-fork season. Region 3 spike-fork harvest
was found to have a high correlation between the average spike-fork harvest in a Management Unit
(MU) and the MU’s calculated vulnerability (R2=0.96; Appendix I). MU vulnerability was defined as the
road density (road km per km2) multiplied by the percentage of the MU in early seral stage (<1.5m in
height) multiplied by a hunter effort ranking (0-1499 hunter days = 1, 1500-2499 = 2, 2500-3499 = 3, and
3500-5000 = 4). Only Region 3 MUs close to or adjacent to GMZ 5B were used in the analysis (MUs 3-27
through 3-31, 3-37 & 3-38). Comparable MU vulnerabilities were then calculated for MUs within GMZ
5B. Road density and percentage early seral were calculated using geomatic information in a
comparable process to that used for Region 3 MUs. Hunter effort was estimated from the one year
spike-fork open season that was implemented in the east Cariboo in 2004. From the GMZ 5B MU
vulnerabilities we used linear regression to estimate the expected spike-fork harvest within each MU
(Appendix I). It is estimated that the September 10 to November 5 spike-fork season would result in
approximately 170 spike-forks being harvested in GMZ 5B. In the early open spike-fork season (Sept 10
– Oct 14) it is estimated that 125 spike-forks would be harvested, and in the late spike-fork season (Oct
15 – Nov 15) approximately 90 spike-forks would be harvested. Under the Spike-fork only open season
(LEH bull harvest removed) it is estimated that approximately 200 spike-fork moose would be harvested.
Refer to appendix I for more information on the calculations of expected spike-fork harvest in GMZ 5B.
IV. Calf Harvest Estimates
The expected calf harvest under the October 10 – October 25 open season was estimated from
the Omineca Region juvenile harvest data. Average juvenile harvest in Region 7 MUs was found to be
highly correlated to average hunter effort in those MUs (R2=0.89; Appendix II). We used linear
regression to calculate the expected GMZ 5B calf harvest using the expected hunter effort in each of the
GMZ 5B MUs. Using Region 7 data, we estimate an expected calf harvest of approximately 310 in GMZ
5B. This estimate was corroborated by a secondary estimate of expected calf harvest calculated from
historic calf harvest during the late 1970s to early 1980s open calf season in Region 5. The historic calf
harvest estimates were corrected for differences in season lengths to estimate an Oct 10 – Oct 25 open
calf season harvest of approximately 290 calves (Appendix II). A harvest of 300 calves was used in the
evaluations as a best estimate of the expected calf harvest.
V. Total Estimated Moose Harvest Under Alternative Management Strategies
The total moose harvest under each alternative management strategy was calculated by
combing the estimates of harvest for each component of moose population under each of the evaluated
alternative harvest strategies (Table 5). The estimated harvest to each component of the moose
population was utilized as a parameter for the population modelling and evaluation of each alternative
harvest strategy.
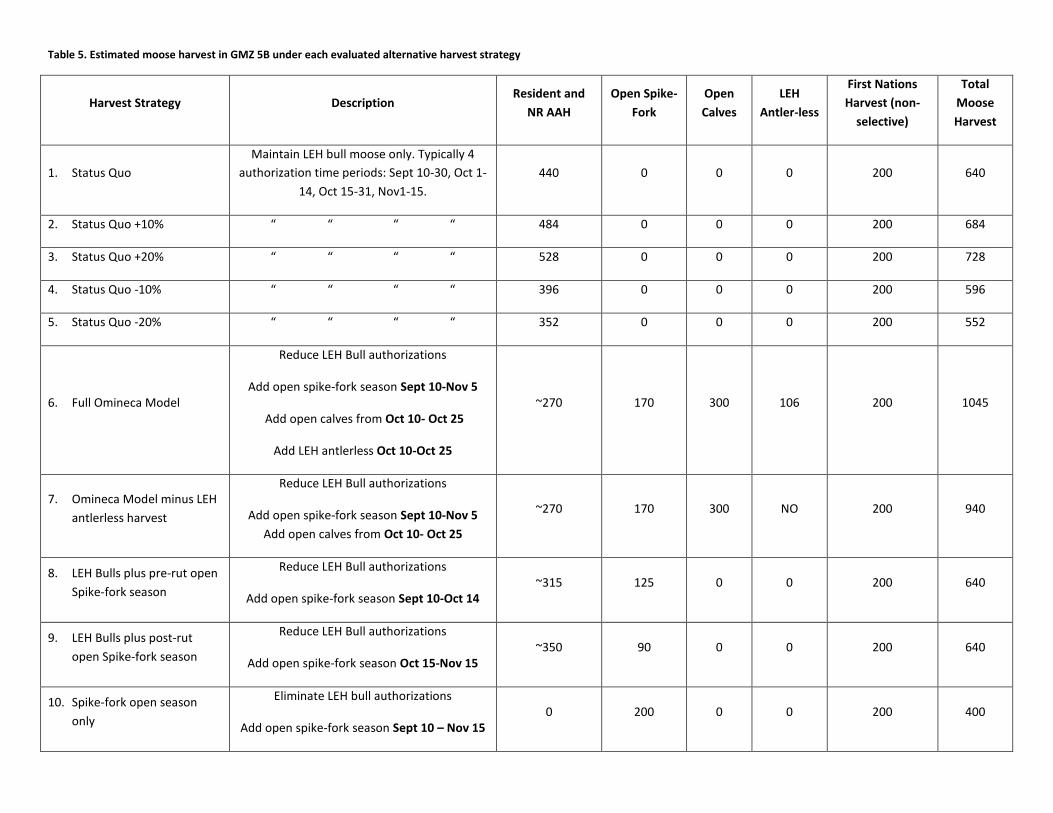
Table 5. Estimated moose harvest in GMZ 5B under each evaluated alternative harvest strategy
Harvest Strategy Description Resident and
NR AAH
Open Spike-
Fork
Open
Calves
LEH
Antler-less
First Nations
Harvest (non-
selective)
Total
Moose
Harvest
1. Status Quo
Maintain LEH bull moose only. Typically 4
authorization time periods: Sept 10-30, Oct 1-
14, Oct 15-31, Nov1-15.
440 0 0 0 200 640
2. Status Quo +10% “ “ “ “ 484 0 0 0 200 684
3. Status Quo +20% “ “ “ “ 528 0 0 0 200 728
4. Status Quo -10% “ “ “ “ 396 0 0 0 200 596
5. Status Quo -20% “ “ “ “ 352 0 0 0 200 552
6. Full Omineca Model
Reduce LEH Bull authorizations
Add open spike-fork season Sept 10-Nov 5
Add open calves from Oct 10- Oct 25
Add LEH antlerless Oct 10-Oct 25
~270 170 300 106 200 1045
7. Omineca Model minus LEH
antlerless harvest
Reduce LEH Bull authorizations
Add open spike-fork season Sept 10-Nov 5
Add open calves from Oct 10- Oct 25
~270 170 300 NO 200 940
8. LEH Bulls plus pre-rut open
Spike-fork season
Reduce LEH Bull authorizations
Add open spike-fork season Sept 10-Oct 14 ~315 125 0 0 200 640
9. LEH Bulls plus post-rut
open Spike-fork season
Reduce LEH Bull authorizations
Add open spike-fork season Oct 15-Nov 15 ~350 90 0 0 200 640
10. Spike-fork open season
only
Eliminate LEH bull authorizations
Add open spike-fork season Sept 10 – Nov 15 0 200 0 0 200 400

Review of Alternative Moose Harvest Strategies in GMZ 5B (East Cariboo) 15
Harvest Strategy Description Resident and
NR AAH
Open Spike-
Fork
Open
Calves
LEH
Antler-less
First Nations
Harvest (non-
selective)
Total
Moose
Harvest
11. Spike-fork open season and
calf open season only
Eliminate LEH bull authorizations
Add open spike-fork season Sept 10-Nov 15
Add open calf season Oct 10-Oct 25
0 200 300 0 200 700
12. Scientific collection of reproductive tracts
Maintain LEH bull only or add spike-fork season
Add late season (Nov-Dec) cow harvest at low rate (1%)
440 Y/N 0 35 200 675
*Test* No Licensed Harvest Only estimated First Nations harvest is applied
in model 0 0 0 0 200 200
*Test* No Human Harvest No human harvest is applied in model 0 0 0 0 0 0
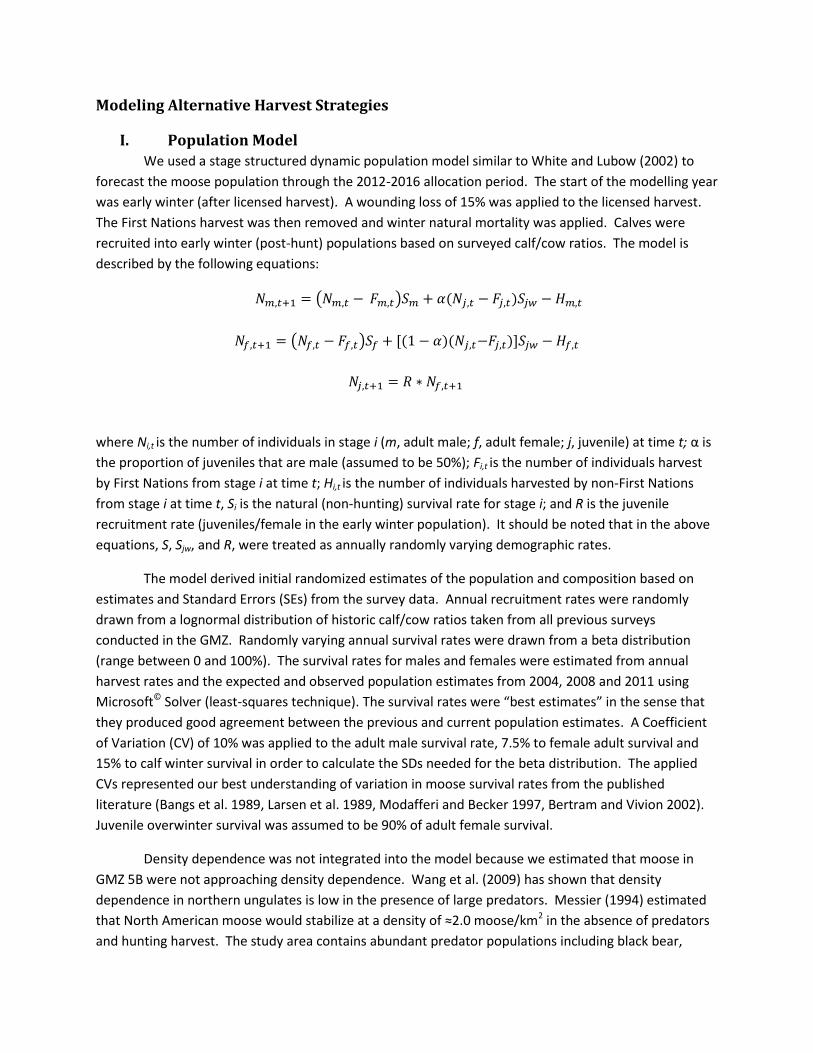
Modeling Alternative Harvest Strategies
I. Population Model
We used a stage structured dynamic population model similar to White and Lubow (2002) to
forecast the moose population through the 2012-2016 allocation period. The start of the modelling year
was early winter (after licensed harvest). A wounding loss of 15% was applied to the licensed harvest.
The First Nations harvest was then removed and winter natural mortality was applied. Calves were
recruited into early winter (post-hunt) populations based on surveyed calf/cow ratios. The model is
described by the following equations:
where Ni,t is the number of individuals in stage i (m, adult male; f, adult female; j, juvenile) at time t; α is
the proportion of juveniles that are male (assumed to be 50%); Fi,t is the number of individuals harvest
by First Nations from stage i at time t; Hi,t is the number of individuals harvested by non-First Nations
from stage i at time t, Si is the natural (non-hunting) survival rate for stage i; and R is the juvenile
recruitment rate (juveniles/female in the early winter population). It should be noted that in the above
equations, S, Sjw, and R, were treated as annually randomly varying demographic rates.
The model derived initial randomized estimates of the population and composition based on
estimates and Standard Errors (SEs) from the survey data. Annual recruitment rates were randomly
drawn from a lognormal distribution of historic calf/cow ratios taken from all previous surveys
conducted in the GMZ. Randomly varying annual survival rates were drawn from a beta distribution
(range between 0 and 100%). The survival rates for males and females were estimated from annual
harvest rates and the expected and observed population estimates from 2004, 2008 and 2011 using
Microsoft© Solver (least-squares technique). The survival rates were “best estimates” in the sense that
they produced good agreement between the previous and current population estimates. A Coefficient
of Variation (CV) of 10% was applied to the adult male survival rate, 7.5% to female adult survival and
15% to calf winter survival in order to calculate the SDs needed for the beta distribution. The applied
CVs represented our best understanding of variation in moose survival rates from the published
literature (Bangs et al. 1989, Larsen et al. 1989, Modafferi and Becker 1997, Bertram and Vivion 2002).
Juvenile overwinter survival was assumed to be 90% of adult female survival.
Density dependence was not integrated into the model because we estimated that moose in
GMZ 5B were not approaching density dependence. Wang et al. (2009) has shown that density
dependence in northern ungulates is low in the presence of large predators. Messier (1994) estimated
that North American moose would stabilize at a density of ≈2.0 moose/km2 in the absence of predators
and hunting harvest. The study area contains abundant predator populations including black bear,
Review of Alternative Moose Harvest Strategies in GMZ 5B (East Cariboo) 17
grizzly bear, and wolf. The average density of moose within GMZ 5B was 0.42 moose/km2 and was
assumed to be below habitat capacity. Secondly we limited model forecasting to a short, 5 year, time
period to limit the risk that density dependent effects would have an impact on the forecasted
populations.
To test the influence of density dependence on the GMZ 5B moose population a secondary
model was constructed which integrated density dependence. We ran two separate scenarios for the
Omineca alternative harvest model: 1) the moose population was near habitat carrying capacity (K)
(K=7,000), and 2) the moose population was near maximum sustainable yield (K=10,000). The two
alternative scenarios did not demonstrate significantly different results from the modelling results
excluding density dependence.
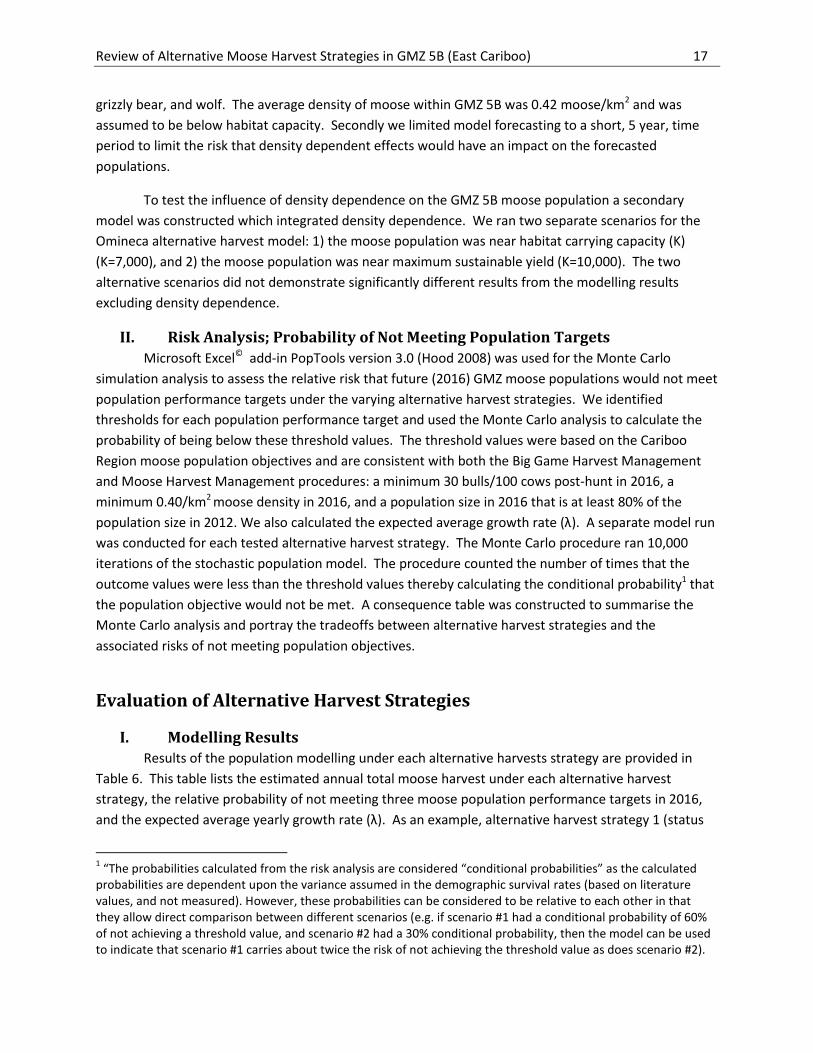
II. Risk Analysis; Probability of Not Meeting Population Targets
Microsoft Excel© add-in PopTools version 3.0 (Hood 2008) was used for the Monte Carlo
simulation analysis to assess the relative risk that future (2016) GMZ moose populations would not meet
population performance targets under the varying alternative harvest strategies. We identified
thresholds for each population performance target and used the Monte Carlo analysis to calculate the
probability of being below these threshold values. The threshold values were based on the Cariboo
Region moose population objectives and are consistent with both the Big Game Harvest Management
and Moose Harvest Management procedures: a minimum 30 bulls/100 cows post-hunt in 2016, a
minimum 0.40/km2 moose density in 2016, and a population size in 2016 that is at least 80% of the
population size in 2012. We also calculated the expected average growth rate (λ). A separate model run
was conducted for each tested alternative harvest strategy. The Monte Carlo procedure ran 10,000
iterations of the stochastic population model. The procedure counted the number of times that the
outcome values were less than the threshold values thereby calculating the conditional probability1 that
the population objective would not be met. A consequence table was constructed to summarise the
Monte Carlo analysis and portray the tradeoffs between alternative harvest strategies and the
associated risks of not meeting population objectives.
Evaluation of Alternative Harvest Strategies
I. Modelling Results
Results of the population modelling under each alternative harvests strategy are provided in
Table 6. This table lists the estimated annual total moose harvest under each alternative harvest
strategy, the relative probability of not meeting three moose population performance targets in 2016,
and the expected average yearly growth rate (λ). As an example, alternative harvest strategy 1 (status
1 “The probabilities calculated from the risk analysis are considered “conditional probabilities” as the calculated
probabilities are dependent upon the variance assumed in the demographic survival rates (based on literature values, and not measured). However, these probabilities can be considered to be relative to each other in that they allow direct comparison between different scenarios (e.g. if scenario #1 had a conditional probability of 60% of not achieving a threshold value, and scenario #2 had a 30% conditional probability, then the model can be used to indicate that scenario #1 carries about twice the risk of not achieving the threshold value as does scenario #2).
Review of Alternative Moose Harvest Strategies in GMZ 5B (East Cariboo) 18
quo) has an expected annual total moose harvest of 640 animals. The modelling estimates that the
Status Quo harvest strategy has a 51% probability of having less than 30 bulls per 100 cows in 2016, a
62% probability that the moose density will be less than 40 moose per 100 km2 in 2016, and a 41%
probability that the 2016 moose population will be less than 80% of the starting 2012 moose population.
The status quo moose harvest strategy has an expected average growth rate (λ) of 0.959. λ is a measure
of the annual rate of change for a population. If λ is less than 1 the population is declining, if λ is greater
than 1 the population is increasing.
The modelling exercise used to evaluate the alternative harvest strategies in GMZ 5B was
executed using the best science and information available under the circumstances but limitations to
the modelling and potential biases must be acknowledged. Some important ones are: inventory data
limitations and variation, natural variation in calf recruitment, changes to natural predation rates,
changing access and vulnerability to harvest, changing winter severity, and accuracy of harvest
estimates.
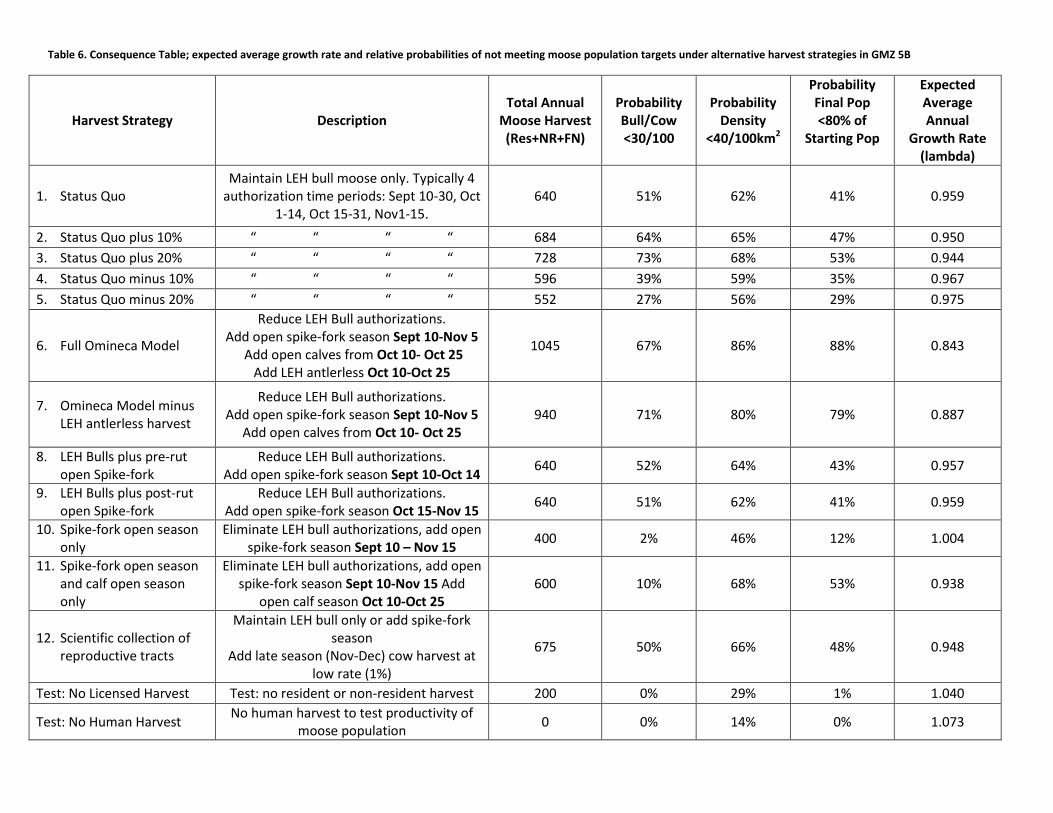
Table 6. Consequence Table; expected average growth rate and relative probabilities of not meeting moose population targets under alternative harvest strategies in GMZ 5B
Harvest Strategy Description Total Annual
Moose Harvest (Res+NR+FN)
Probability Bull/Cow <30/100
Probability Density
<40/100km2
Probability Final Pop <80% of
Starting Pop
Expected Average Annual
Growth Rate (lambda)
1. Status Quo Maintain LEH bull moose only. Typically 4
authorization time periods: Sept 10-30, Oct 1-14, Oct 15-31, Nov1-15.
640 51% 62% 41% 0.959
2. Status Quo plus 10% “ “ “ “ 684 64% 65% 47% 0.950
3. Status Quo plus 20% “ “ “ “ 728 73% 68% 53% 0.944
4. Status Quo minus 10% “ “ “ “ 596 39% 59% 35% 0.967
5. Status Quo minus 20% “ “ “ “ 552 27% 56% 29% 0.975
6. Full Omineca Model
Reduce LEH Bull authorizations. Add open spike-fork season Sept 10-Nov 5
Add open calves from Oct 10- Oct 25 Add LEH antlerless Oct 10-Oct 25
1045 67% 86% 88% 0.843
7. Omineca Model minus LEH antlerless harvest
Reduce LEH Bull authorizations. Add open spike-fork season Sept 10-Nov 5
Add open calves from Oct 10- Oct 25 940 71% 80% 79% 0.887
8. LEH Bulls plus pre-rut open Spike-fork
Reduce LEH Bull authorizations. Add open spike-fork season Sept 10-Oct 14
640 52% 64% 43% 0.957
9. LEH Bulls plus post-rut open Spike-fork
Reduce LEH Bull authorizations. Add open spike-fork season Oct 15-Nov 15
640 51% 62% 41% 0.959
10. Spike-fork open season only
Eliminate LEH bull authorizations, add open spike-fork season Sept 10 – Nov 15
400 2% 46% 12% 1.004
11. Spike-fork open season and calf open season only
Eliminate LEH bull authorizations, add open spike-fork season Sept 10-Nov 15 Add
open calf season Oct 10-Oct 25 600 10% 68% 53% 0.938
12. Scientific collection of reproductive tracts
Maintain LEH bull only or add spike-fork season
Add late season (Nov-Dec) cow harvest at low rate (1%)
675 50% 66% 48% 0.948
Test: No Licensed Harvest Test: no resident or non-resident harvest 200 0% 29% 1% 1.040
Test: No Human Harvest No human harvest to test productivity of
moose population 0 0% 14% 0% 1.073
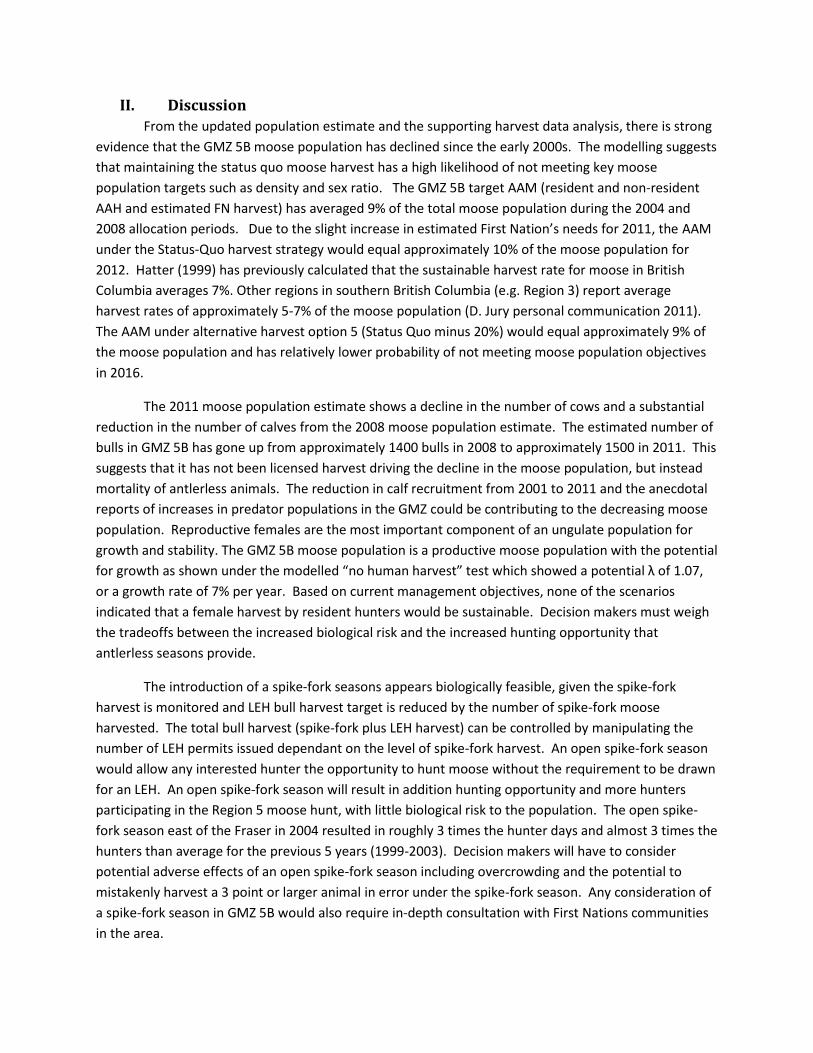
II. Discussion
From the updated population estimate and the supporting harvest data analysis, there is strong
evidence that the GMZ 5B moose population has declined since the early 2000s. The modelling suggests
that maintaining the status quo moose harvest has a high likelihood of not meeting key moose
population targets such as density and sex ratio. The GMZ 5B target AAM (resident and non-resident
AAH and estimated FN harvest) has averaged 9% of the total moose population during the 2004 and
2008 allocation periods. Due to the slight increase in estimated First Nation’s needs for 2011, the AAM
under the Status-Quo harvest strategy would equal approximately 10% of the moose population for
2012. Hatter (1999) has previously calculated that the sustainable harvest rate for moose in British
Columbia averages 7%. Other regions in southern British Columbia (e.g. Region 3) report average
harvest rates of approximately 5-7% of the moose population (D. Jury personal communication 2011).
The AAM under alternative harvest option 5 (Status Quo minus 20%) would equal approximately 9% of
the moose population and has relatively lower probability of not meeting moose population objectives
in 2016.
The 2011 moose population estimate shows a decline in the number of cows and a substantial
reduction in the number of calves from the 2008 moose population estimate. The estimated number of
bulls in GMZ 5B has gone up from approximately 1400 bulls in 2008 to approximately 1500 in 2011. This
suggests that it has not been licensed harvest driving the decline in the moose population, but instead
mortality of antlerless animals. The reduction in calf recruitment from 2001 to 2011 and the anecdotal
reports of increases in predator populations in the GMZ could be contributing to the decreasing moose
population. Reproductive females are the most important component of an ungulate population for
growth and stability. The GMZ 5B moose population is a productive moose population with the potential
for growth as shown under the modelled “no human harvest” test which showed a potential λ of 1.07,
or a growth rate of 7% per year. Based on current management objectives, none of the scenarios
indicated that a female harvest by resident hunters would be sustainable. Decision makers must weigh
the tradeoffs between the increased biological risk and the increased hunting opportunity that
antlerless seasons provide.
The introduction of a spike-fork seasons appears biologically feasible, given the spike-fork
harvest is monitored and LEH bull harvest target is reduced by the number of spike-fork moose
harvested. The total bull harvest (spike-fork plus LEH harvest) can be controlled by manipulating the
number of LEH permits issued dependant on the level of spike-fork harvest. An open spike-fork season
would allow any interested hunter the opportunity to hunt moose without the requirement to be drawn
for an LEH. An open spike-fork season will result in addition hunting opportunity and more hunters
participating in the Region 5 moose hunt, with little biological risk to the population. The open spike-
fork season east of the Fraser in 2004 resulted in roughly 3 times the hunter days and almost 3 times the
hunters than average for the previous 5 years (1999-2003). Decision makers will have to consider
potential adverse effects of an open spike-fork season including overcrowding and the potential to
mistakenly harvest a 3 point or larger animal in error under the spike-fork season. Any consideration of
a spike-fork season in GMZ 5B would also require in-depth consultation with First Nations communities
in the area.
Review of Alternative Moose Harvest Strategies in GMZ 5B (East Cariboo) 21
One criticism of the current Region 5 moose harvest strategy is that it allows older female
moose, past their reproductive years, to survive and compete for resources that could go to younger
productive animals. Heard et al. (1997) showed that pregnancy rate in central British Columbia moose
does not decline until 13 years of age and older. They also found that moose 13 years of age and older
make up a small portion of the cow population (<8%). We feel that the level of First Nations harvest and
natural predation is sufficient to prevent older females from becoming a large portion of the population
and thereby reducing population productivity. This assessment is supported by the observed decrease
in the cow population in MU 5-02C from 2001 to 2011, and the decrease in the estimated cows in the
GMZ from 2008 to 2011. An option to test this assumption would be the scientific collection of a small
portion of the cow population in late November or December to assess the age, condition, and
pregnancy rates for the cow population in GMZ 5B. This would require Compulsory Inspection of all
harvested cows to attain the required samples.
Moose harvest management in the Cariboo has been a controversial topic in recent years due to
the high importance all stakeholders in the region place on moose hunting and harvest. Despite any
particular stakeholders’ opinion, all seem to agree that the conservation of Cariboo Region moose is of
top priority to ensure ample opportunity for future hunters.
References BANGS, E. E., T. N. BAILEY, and M. F. PORTNER. 1989. Survival rates of adult female moose on the Kenai
Peninsula, Alaska. Journal of Wildlife Management 53:557-563.
BERTRAM, M. R., and M. T. VIVION. 2002. Moose mortality in eastern interior Alaska. Journal of Wildlife
Management 66:747-756.
BOERTJE, R. D., M. A. KEECH, D. D. YOUNG, K. A. KELLIE, and C. T. SEATON. 2009. Managing for elevated yield
of moose in interior Alaska. Journal of Wildlife Management 73:314-327.
DAVIS, LARRY. 2011. Rose Lake (MU 5-02C) 2011 winter moose inventory. Unpubl. BC Forests, Lands
and Natural Resource Operations. Williams Lake, British Columbia.
GASAWAY, W. C., S. D. DUBOIS, D. J. REID, and S. J. HARBO. 1986. Estimating moose population parameters
from aerial surveys. Biology Paper No. 22, University of Alaska, Fairbanks, Alaska.
HATTER, I. W. 1999. An evaluation of moose harvest management in central and northern British
Columbia. Alces 35:91-103.
HATTER, I. W. 2001. An assessment of catch per unit effort to estimate rate of change in deer and moose
populations. Alces 37:71-77.
Review of Alternative Moose Harvest Strategies in GMZ 5B (East Cariboo) 22
HAYES, R. D., R. FARNELL, R. M. P. WARD, J. CAREY, M. DEHN, G. W. KUZYK, A. M. BAER, C. L. GARDNER, and M.
O’DONOGHUE. 2003. Experimental reduction of wolves in the Yukon: ungulate responses and
management implications. Wildlife Monographs 152:1-35.
HEARD, D., S. BARRY, G. WATTS, and K. CHILD. Fertility of female moose (Alces alces) in relation to age and
body composition. Alces 33:165-176.
LARSEN, D. G., D. A. GAUTHIER, and R. L. MARKEL. 1989. Causes and rate of moose mortality in the
southwest Yukon. Journal of Wildlife Management 53:548-557.
LUKACS, P. M., G. C. WHITE, B. E. WATKINS, R. H. KAHN, B.A. BANULIS, D. J. FINLEY, A. A. HOLLAND, J.A. MARTENS,
and J. VAYHINGER. 2009. Separating components of variation in survival of mule deer in Colorado.
Journal of Wildlife Management 73:817-826.
MESSIER, F. 1994. Ungulate population models with predation: a case study with the North American
moose. Ecology 75:478-488.
MODAFFERI, R. D. and E. F. BECKER. 1997. Survival of radiocollared adult moose in lower Susitna River
valley, southcentral Alaska. Journal of Wildife Management 61:540-549.
STALBERG, M. 2001. 2001 – Rose Lake (5-02C) winter moose inventory. Unpubl. BC Ministry of
Environment. Williams Lake, British Columbia.
WANG, G., N. T. HOBBS, S. TWOMBLY, R. B. BOONE, A. W. ILLIUS, I. J. GORDON, and J. E. GROSS. 2009. Density
dependence in northern ungulates: interations with predation and resources. Population
Ecology 51:123-132.
WHITE, G. C., and B. C. LUBOW. 2002. Fitting population models to multiple sources of observed data.
Journal of Wildlife Management 66:300-309.
Review of Alternative Moose Harvest Strategies in GMZ 5B (East Cariboo) 23
Appendices
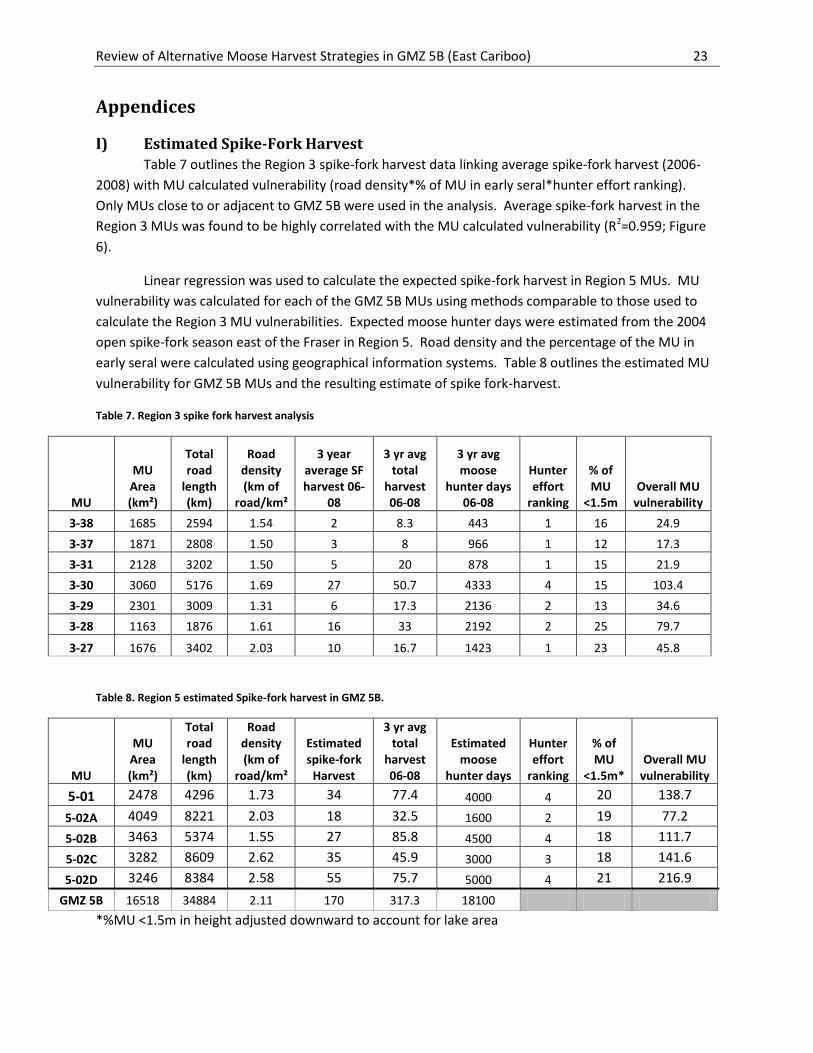
I) Estimated Spike-Fork Harvest
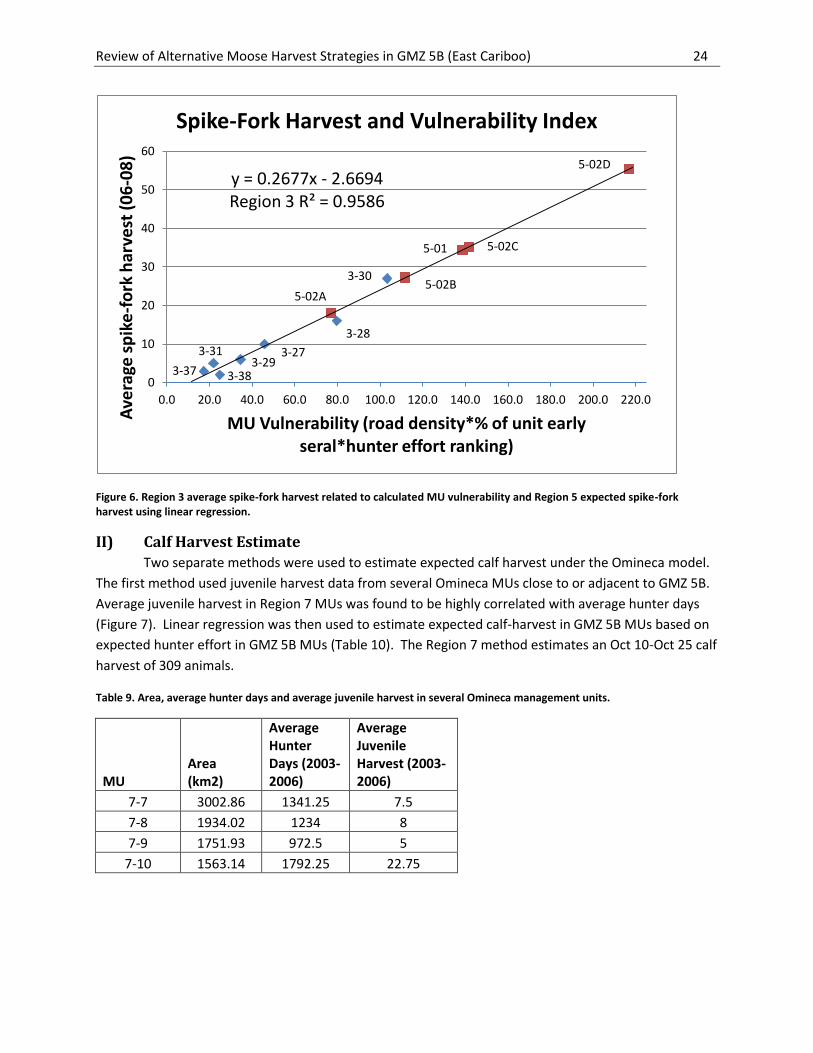
Table 7 outlines the Region 3 spike-fork harvest data linking average spike-fork harvest (2006-
2008) with MU calculated vulnerability (road density*% of MU in early seral*hunter effort ranking).
Only MUs close to or adjacent to GMZ 5B were used in the analysis. Average spike-fork harvest in the
Region 3 MUs was found to be highly correlated with the MU calculated vulnerability (R2=0.959; Figure
6).
Linear regression was used to calculate the expected spike-fork harvest in Region 5 MUs. MU
vulnerability was calculated for each of the GMZ 5B MUs using methods comparable to those used to
calculate the Region 3 MU vulnerabilities. Expected moose hunter days were estimated from the 2004
open spike-fork season east of the Fraser in Region 5. Road density and the percentage of the MU in
early seral were calculated using geographical information systems. Table 8 outlines the estimated MU
vulnerability for GMZ 5B MUs and the resulting estimate of spike fork-harvest.
Table 7. Region 3 spike fork harvest analysis
MU
MU Area (km²)
Total road
length (km)
Road density (km of
road/km²
3 year average SF harvest 06-
08
3 yr avg total
harvest 06-08
3 yr avg moose
hunter days 06-08
Hunter effort
ranking
% of MU
<1.5m Overall MU
vulnerability
3-38 1685 2594 1.54 2 8.3 443 1 16 24.9
3-37 1871 2808 1.50 3 8 966 1 12 17.3
3-31 2128 3202 1.50 5 20 878 1 15 21.9
3-30 3060 5176 1.69 27 50.7 4333 4 15 103.4
3-29 2301 3009 1.31 6 17.3 2136 2 13 34.6
3-28 1163 1876 1.61 16 33 2192 2 25 79.7
3-27 1676 3402 2.03 10 16.7 1423 1 23 45.8
Table 8. Region 5 estimated Spike-fork harvest in GMZ 5B.
MU
MU Area (km²)
Total road
length (km)
Road density (km of
road/km²
Estimated spike-fork
Harvest
3 yr avg total
harvest 06-08
Estimated moose
hunter days
Hunter effort
ranking
% of MU
<1.5m* Overall MU
vulnerability
5-01 2478 4296 1.73 34 77.4 4000 4 20 138.7
5-02A 4049 8221 2.03 18 32.5 1600 2 19 77.2
5-02B 3463 5374 1.55 27 85.8 4500 4 18 111.7
5-02C 3282 8609 2.62 35 45.9 3000 3 18 141.6
5-02D 3246 8384 2.58 55 75.7 5000 4 21 216.9
GMZ 5B 16518 34884 2.11 170 317.3 18100 *%MU <1.5m in height adjusted downward to account for lake area
Review of Alternative Moose Harvest Strategies in GMZ 5B (East Cariboo) 24
Figure 6. Region 3 average spike-fork harvest related to calculated MU vulnerability and Region 5 expected spike-fork harvest using linear regression.
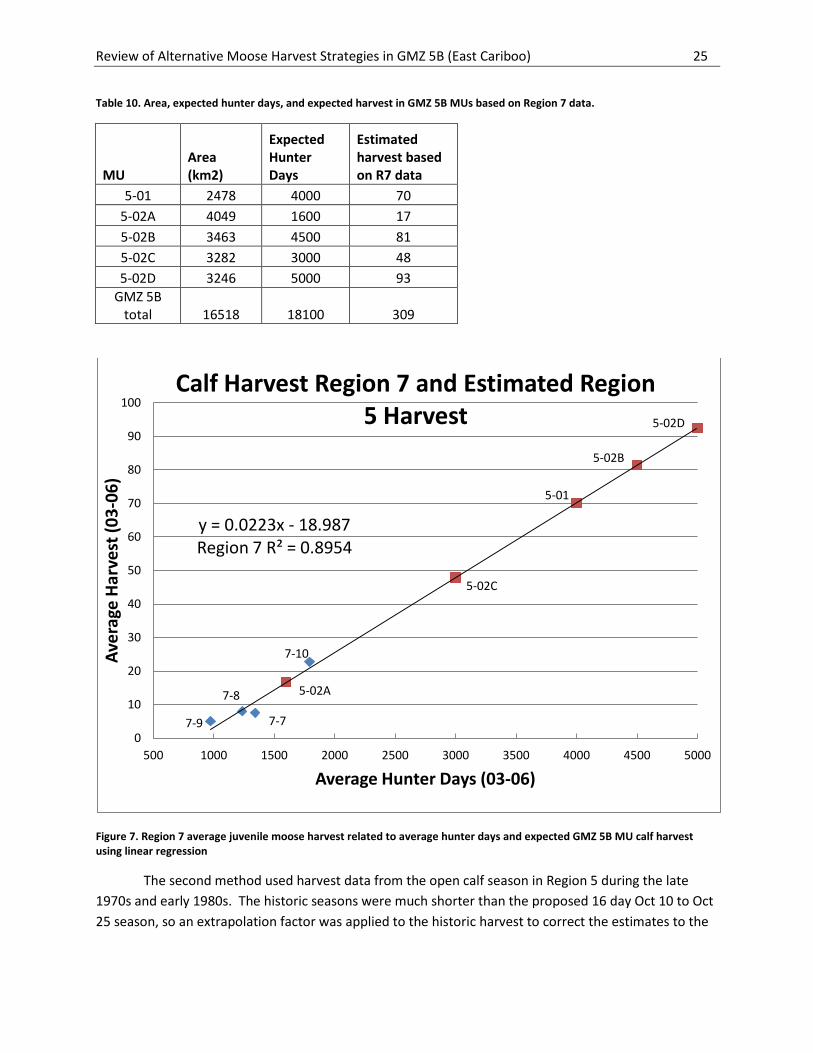
II) Calf Harvest Estimate
Two separate methods were used to estimate expected calf harvest under the Omineca model.
The first method used juvenile harvest data from several Omineca MUs close to or adjacent to GMZ 5B.
Average juvenile harvest in Region 7 MUs was found to be highly correlated with average hunter days
(Figure 7). Linear regression was then used to estimate expected calf-harvest in GMZ 5B MUs based on
expected hunter effort in GMZ 5B MUs (Table 10). The Region 7 method estimates an Oct 10-Oct 25 calf
harvest of 309 animals.
Table 9. Area, average hunter days and average juvenile harvest in several Omineca management units.
MU Area (km2)
Average Hunter Days (2003-2006)
Average Juvenile Harvest (2003-2006)
7-7 3002.86 1341.25 7.5
7-8 1934.02 1234 8
7-9 1751.93 972.5 5
7-10 1563.14 1792.25 22.75
3-38 3-37
3-31
3-30
3-29
3-28
3-27
5-01
5-02A 5-02B
5-02C
5-02D y = 0.2677x - 2.6694 Region 3 R² = 0.9586
0
10
20
30
40
50
60
0.0 20.0 40.0 60.0 80.0 100.0 120.0 140.0 160.0 180.0 200.0 220.0
Ave
rage
sp
ike
-fo
rk h
arve
st (
06
-08
)
MU Vulnerability (road density*% of unit early seral*hunter effort ranking)
Spike-Fork Harvest and Vulnerability Index
Review of Alternative Moose Harvest Strategies in GMZ 5B (East Cariboo) 25
Table 10. Area, expected hunter days, and expected harvest in GMZ 5B MUs based on Region 7 data.
MU Area (km2)
Expected Hunter Days
Estimated harvest based on R7 data
5-01 2478 4000 70
5-02A 4049 1600 17
5-02B 3463 4500 81
5-02C 3282 3000 48
5-02D 3246 5000 93
GMZ 5B total 16518 18100 309
Figure 7. Region 7 average juvenile moose harvest related to average hunter days and expected GMZ 5B MU calf harvest using linear regression
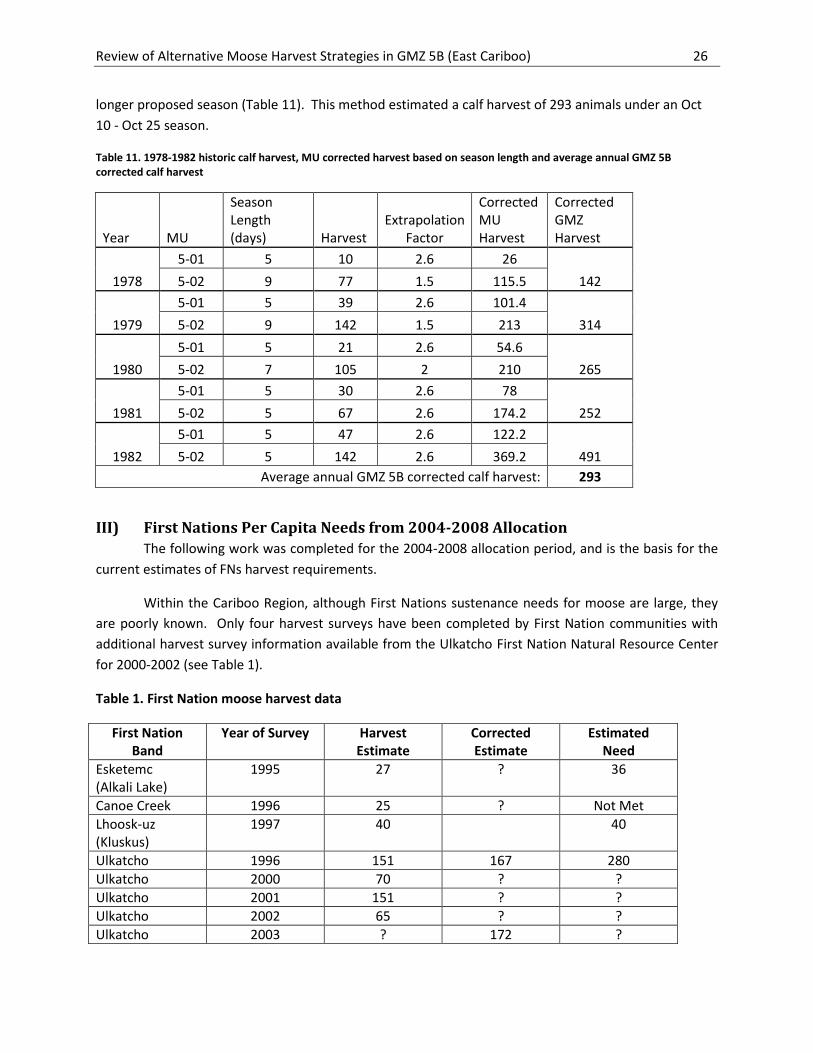
The second method used harvest data from the open calf season in Region 5 during the late
1970s and early 1980s. The historic seasons were much shorter than the proposed 16 day Oct 10 to Oct
25 season, so an extrapolation factor was applied to the historic harvest to correct the estimates to the
7-7
7-8
7-9
7-10
5-01
5-02A
5-02B
5-02C
5-02D
y = 0.0223x - 18.987 Region 7 R² = 0.8954
0
10
20
30
40
50
60
70
80
90
100
500 1000 1500 2000 2500 3000 3500 4000 4500 5000
Ave
rage
Har
vest
(0
3-0
6)
Average Hunter Days (03-06)
Calf Harvest Region 7 and Estimated Region 5 Harvest
Review of Alternative Moose Harvest Strategies in GMZ 5B (East Cariboo) 26
longer proposed season (Table 11). This method estimated a calf harvest of 293 animals under an Oct
10 - Oct 25 season.
Table 11. 1978-1982 historic calf harvest, MU corrected harvest based on season length and average annual GMZ 5B corrected calf harvest
Year MU
Season Length (days) Harvest
Extrapolation Factor
Corrected MU Harvest
Corrected GMZ Harvest
1978
5-01 5 10 2.6 26
142 5-02 9 77 1.5 115.5
1979
5-01 5 39 2.6 101.4
314 5-02 9 142 1.5 213
1980
5-01 5 21 2.6 54.6
265 5-02 7 105 2 210
1981
5-01 5 30 2.6 78
252 5-02 5 67 2.6 174.2
1982
5-01 5 47 2.6 122.2
491 5-02 5 142 2.6 369.2
Average annual GMZ 5B corrected calf harvest: 293
III) First Nations Per Capita Needs from 2004-2008 Allocation
The following work was completed for the 2004-2008 allocation period, and is the basis for the
current estimates of FNs harvest requirements.
Within the Cariboo Region, although First Nations sustenance needs for moose are large, they
are poorly known. Only four harvest surveys have been completed by First Nation communities with
additional harvest survey information available from the Ulkatcho First Nation Natural Resource Center
for 2000-2002 (see Table 1).
Table 1. First Nation moose harvest data
First Nation Band
Year of Survey Harvest Estimate
Corrected Estimate
Estimated Need
Esketemc (Alkali Lake)
1995 27 ? 36
Canoe Creek 1996 25 ? Not Met
Lhoosk-uz (Kluskus)
1997 40 40
Ulkatcho 1996 151 167 280
Ulkatcho 2000 70 ? ?
Ulkatcho 2001 151 ? ?
Ulkatcho 2002 65 ? ?
Ulkatcho 2003 ? 172 ?
Review of Alternative Moose Harvest Strategies in GMZ 5B (East Cariboo) 27
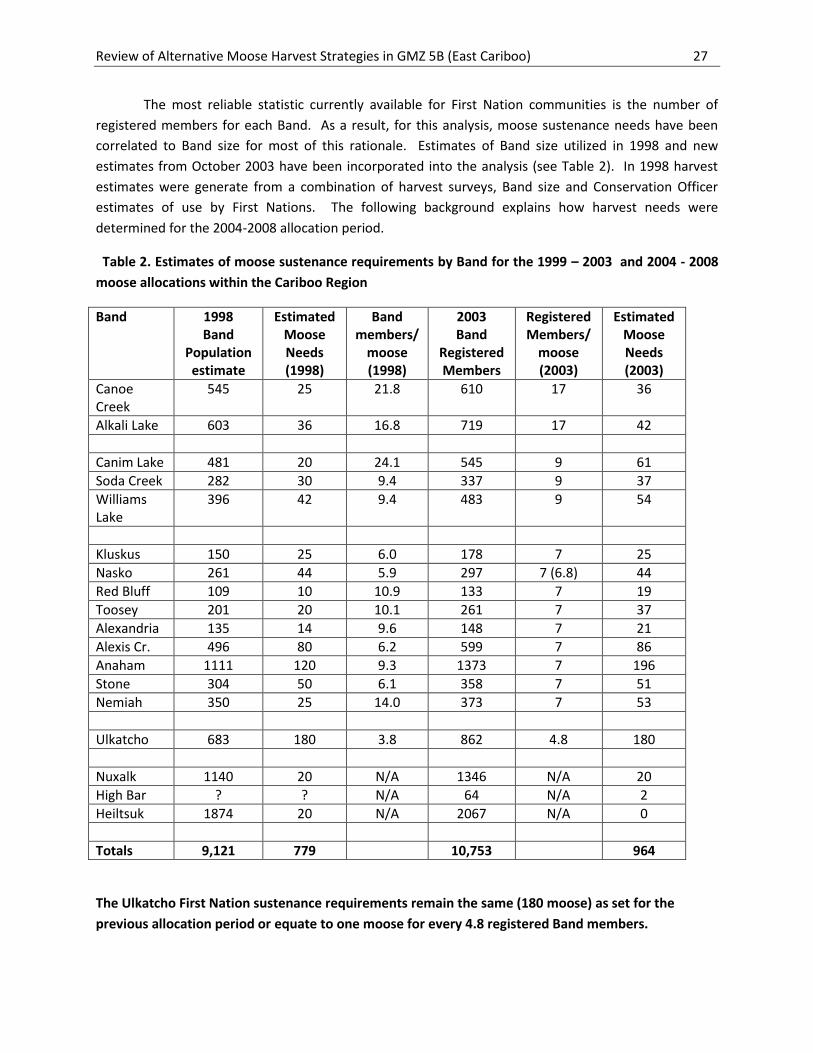
The most reliable statistic currently available for First Nation communities is the number of
registered members for each Band. As a result, for this analysis, moose sustenance needs have been
correlated to Band size for most of this rationale. Estimates of Band size utilized in 1998 and new
estimates from October 2003 have been incorporated into the analysis (see Table 2). In 1998 harvest
estimates were generate from a combination of harvest surveys, Band size and Conservation Officer
estimates of use by First Nations. The following background explains how harvest needs were
determined for the 2004-2008 allocation period.
Table 2. Estimates of moose sustenance requirements by Band for the 1999 – 2003 and 2004 - 2008
moose allocations within the Cariboo Region
Band 1998 Band
Population estimate
Estimated Moose Needs (1998)
Band members/
moose (1998)
2003 Band
Registered Members
Registered Members/
moose (2003)
Estimated Moose Needs (2003)
Canoe Creek
545 25 21.8 610 17 36
Alkali Lake 603 36 16.8 719 17 42
Canim Lake 481 20 24.1 545 9 61
Soda Creek 282 30 9.4 337 9 37
Williams Lake
396 42 9.4 483 9 54
Kluskus 150 25 6.0 178 7 25
Nasko 261 44 5.9 297 7 (6.8) 44
Red Bluff 109 10 10.9 133 7 19
Toosey 201 20 10.1 261 7 37
Alexandria 135 14 9.6 148 7 21
Alexis Cr. 496 80 6.2 599 7 86
Anaham 1111 120 9.3 1373 7 196
Stone 304 50 6.1 358 7 51
Nemiah 350 25 14.0 373 7 53
Ulkatcho 683 180 3.8 862 4.8 180
Nuxalk 1140 20 N/A 1346 N/A 20
High Bar ? ? N/A 64 N/A 2
Heiltsuk 1874 20 N/A 2067 N/A 0
Totals 9,121 779 10,753 964
The Ulkatcho First Nation sustenance requirements remain the same (180 moose) as set for the
previous allocation period or equate to one moose for every 4.8 registered Band members.
Review of Alternative Moose Harvest Strategies in GMZ 5B (East Cariboo) 28
The traditional territory of this Band overlaps an area where moose are more plentiful than mule deer.
A harvest survey has been completed for the Band which suggests that moose are used more for sustenance than deer:
o Ulkatcho Band corrected harvest estimate – 117 deer/167 moose or 0.7/1
A moose population survey completed in a portion of MU 5-12-B (traditional territory of the Ulkatcho Band) suggests that moose populations have increased from 580 moose in 1997 to 1,310 moose in 2002. The total moose harvest (or lack of) in the area is likely having an influence on the increase suggesting sustenance needs of the Ulkatcho Band may have been overestimated in 1998.
Although the resident harvest target is being met the success rate of moose Limited Entry Hunt authorization holders is one of the lowest for the Region within MU 5-12-B suggesting low numbers of bull moose in accessible areas. The average for 1999-2002 was 27%.
Feedback from the Ulkatcho Band suggests their minimum actual use for the four years there is information averages 109 moose (estimate not corrected for households missed) well below the identified 1998 sustenance need of 180. Although it must be remembered that this lower value is a minimum it is much closer to the Band member per moose ratio of the Kluskus and Nasko Bands:
o Minimum Ulkatcho Band ratio – 683 members/109 moose or 6.3/1.
Feedback from the Ulkatcho Band regarding a harvest survey being completed in November, 2003 suggests that the moose sustenance need is approximately equal to the value used in 1998. Using the same value results in the following identified need:
o Ulkatcho Band – 180 moose/year
With the exception of the Ulkatcho First Nation the Carrier-Chilcotin & Tsilhqot’in Bands sustenance
requirements equate to one moose for every seven registered Band members.
The traditional territories of these Bands overlap areas where moose are relatively plentiful and in some cases so are mule deer.
A harvest survey has been completed for one Band which suggest that moose are used more for sustenance than deer:
o Kluskus Band harvest estimate – 7 deer/40 moose or 0.2/1
A moose population survey completed in MU 5-13-A (traditional territory of the Anaham Band) suggests that moose populations have declined from 2,194 moose in 1998 to 1,524 moose in 2003. The total moose harvest for the area is likely influencing the decline and sustenance needs of the Anaham Band may have been underestimated in 1998.
Feedback from two of the Bands suggest the 1998 requirements for the Kluskus Band (25 moose) and the Nasko Band (44 moose) may still be appropriate thus they have been used as a benchmark. This approximated a registered member/ moose ratio of 7/1:
o Kluskus Band ratio – 178 members/25 moose or 7.1/1. o Nasko Band ratio – 297 members/44 moose or 6.8/1.
Utilizing a registered member/moose ratio of 7/1 for the Nasko Band would only allow for an estimated harvest of 42 moose, two below the estimate from 1998. As a result the value utilized was adjusted up slightly to the old estimate of 44 to insure the estimate was not less than the value from 1998.
Review of Alternative Moose Harvest Strategies in GMZ 5B (East Cariboo) 29
No quantitative feedback was received from seven of the nine Bands in this grouping. As a result, the needs of all the Bands in this group were aligned with the Kluskus and Nasko Bands registered members to moose ratio (7 members/ moose). This results in the following identified needs:
o Kluskus – 25 moose/year o Nasko – 44 moose/year o Red Bluff – 19 moose/year o Toosey – 37 moose/year o Alexandria – 21 moose/year o Alexis Creek – 86 moose/year o Anaham – 196 moose/year o Stone – 51 moose/year o Nemiah Valley – 53 moose/year
The Canim Lake, Soda Creek & Williams Lake Bands sustenance requirements equate to one moose for
every nine registered Band members.
The traditional territories of these three Bands overlap areas where mule deer and moose are both relatively plentiful.
Harvest surveys have not been completed for any of these Bands.
Although no quantitative feedback has been received from the individual Bands there was feedback suggesting the 1998 estimates were low. As a result the needs of the three Bands were aligned with those of the Band with the highest moose to registered members ratio. This resulted in the following identified needs:
o Canim Lake – 61 moose/year o Soda Creek – 37 moose/year o Williams Lake – 54 moose /year
The Canoe Creek & Alkali Lake Bands sustenance requirements equate to one moose for every
seventeen registered Band members.
The traditional territories of these two Bands overlap areas where mule deer are much more plentiful than moose.
Harvest surveys suggest a much higher use of deer for sustenance than moose. o Canoe Creek Band harvest estimate – 69 deer/25 moose or 2.8/1 o Alkali Lake Band harvest estimate – 97 deer/27moose or 3.6/1
Harvest surveys have been completed for both Bands although feedback from the Canoe Creek Band suggests that requirements may have been underestimated. The harvest surveys completed in the mid 1990’s suggested that the Canoe Creek Band required one moose for every 22 members (545 members/25 moose = 22) and the Alkali Lake Band one moose for every 17 members (603 members/36 moose = 17). As a result the Canoe Creek Band sustenance requirements for moose have been increased to align with those of the Alkali Lake Band. This results in the following identified needs:
o Canoe Creek Band – 36 moose/year o Alkali Lake Band – 42 moose/year
Review of Alternative Moose Harvest Strategies in GMZ 5B (East Cariboo) 30
The Nuxalk and High Bar Bands sustenance requirements are based on feedback from the individual
Bands during the consultation process.
Feedback from these bands suggests a very small moose sustenance requirement in relation to the size of the Band. As a result it is impractical to correlate sustenance requirements with the number of registered Band members and needs were calculated based on discussions with individual Bands.
Although feedback from the Nuxalk Band suggests a smaller need than was estimated in 1998 the requirement was not reduced as it was considered low based on feedback from the Ulkatcho First Nation who overlap their traditional territory. This results in the following identified needs:
o Nuxalk Band – 20 moose/year o High Bar Band – 2 moose /year
All other Bands are assumed to have a sustenance requirement of zero moose for the 2004-2008
allocation period.
All other Bands have traditional territories that are peripheral to the interior portion of the region where recreational hunting takes place.
The sustenance needs of the Heiltsuk Band have been reduced from 20 in 1998 to zero in 2003 as their traditional territory is peripheral to areas with recreational hunting for moose. However, it is acknowledged that this Band may be harvesting moose within coastal Management Units of the region (i.e. MU’s 5-08 and 5-09) for sustenance purposes.
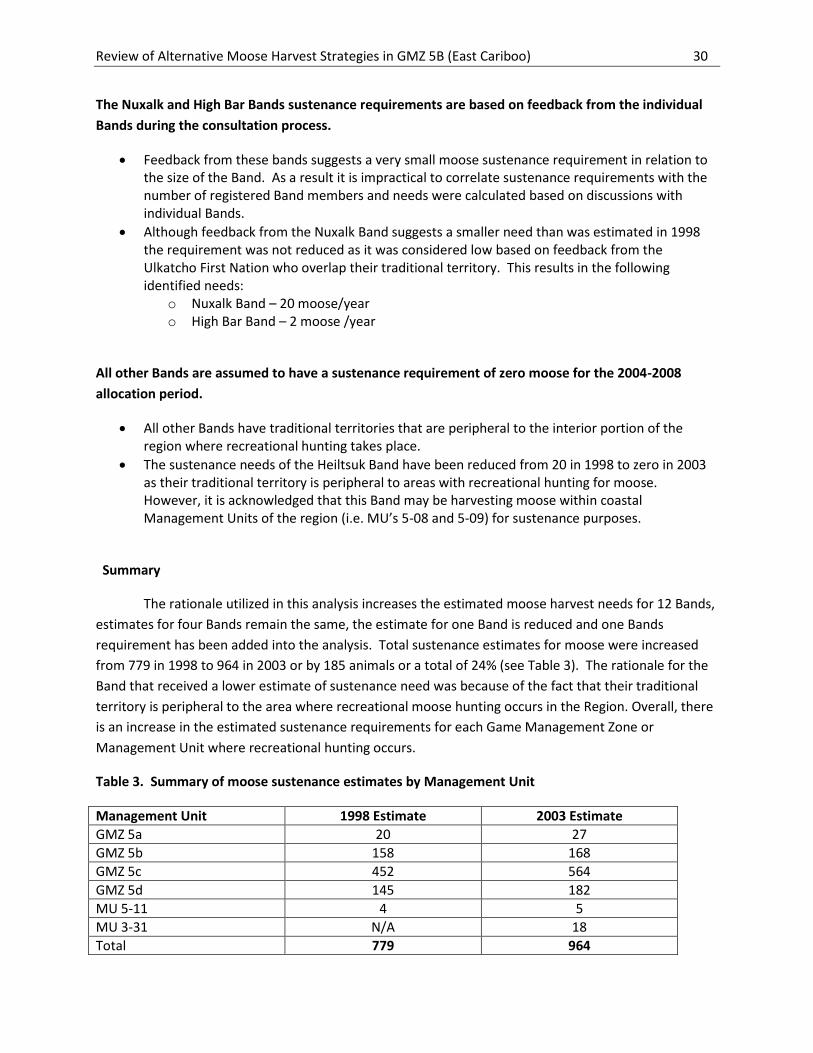
Summary
The rationale utilized in this analysis increases the estimated moose harvest needs for 12 Bands,
estimates for four Bands remain the same, the estimate for one Band is reduced and one Bands
requirement has been added into the analysis. Total sustenance estimates for moose were increased
from 779 in 1998 to 964 in 2003 or by 185 animals or a total of 24% (see Table 3). The rationale for the
Band that received a lower estimate of sustenance need was because of the fact that their traditional
territory is peripheral to the area where recreational moose hunting occurs in the Region. Overall, there
is an increase in the estimated sustenance requirements for each Game Management Zone or
Management Unit where recreational hunting occurs.
Table 3. Summary of moose sustenance estimates by Management Unit
Management Unit 1998 Estimate 2003 Estimate
GMZ 5a 20 27
GMZ 5b 158 168
GMZ 5c 452 564
GMZ 5d 145 182
MU 5-11 4 5
MU 3-31 N/A 18
Total 779 964
Review of Alternative Moose Harvest Strategies in GMZ 5B (East Cariboo) 31
With limited accurate harvest survey information available this analysis brings more consistency
to the approach used to calculate sustenance need by Band. Hopefully as more harvest surveys are
completed a more reliable method can be employed. As the sustenance estimates are based on limited
feedback from First Nation Bands and the method of estimating needs for most Bands is rudimentary
there is some risk that sustenance needs for some Bands are underestimated. On the other hand, there
is also a chance that the needs of some Bands are overestimated, particularly for the Bands that have
traditional territories that allow for harvesting of sizable numbers of both moose and deer. It is
assumed that these risks somewhat balance out and that the overall increases by Game Management
Zone recognize the increase in First Nation populations in the Region and account for any possible
increased sustenance need.
Moose population modelling for the new allocation period suggests that the overall moose
population is stable to increasing in each Game Management Zones 5a, 5b, 5c and 5d. This suggests
that current estimates of First Nation sustenance harvest and harvest levels for resident and non-
resident hunters are allowing for maintenance of the Regions moose population. However, current First
Nations harvest levels may not be equivalent to their actual need.
Although almost any new First Nation harvest information would improve determining moose
sustenance needs, of priority is obtaining a better estimate for Bands that use a sizable number of both
moose and deer for sustenance. This would include the Canim Lake, Soda Creek and Williams Lake
Bands. Also the Toosey, Alexandria, Anaham and Stone Bands may be more suited to this grouping as
their traditional territories have an abundance of both moose and mule deer.