Embed Size (px)
Citation preview
JNCC Report
R.F. Shore, L.A. Walker, A. Turk, C.L. Wienburg, J. Wright, A. Murk and S. Wanless
September 2006
© JNCC, Peterborough, 2006
For further information please contact: Habitats Advice
Joint Nature Conservation Committee Monkstone House, City Road Peterborough, PE1 1JY, UK
www.jncc.gov.uk
ISSN 0963-8091 (online)
No. 391
Wildlife and pollution:
2003/04 Annual report

This report should be cited as:
Shore, RF, Walker, LA , Turk, A, Wienburg, CL, Wright, J, Murk, A & Wanless, S. (2006) Wildlife and pollution: 2003/04 Annual report. JNCC Report, No. 391
Suggested keywords: Annual report; Birds of prey; Environmental contamination; Monitoring; Pesticides; Pollution; Predatory birds; United Kingdom (UK)
Centre for Ecology and Hydrology Project Number: C00554
JNCC Project Number 018 (contract number: F71-12-153)
Wildlife and pollution: 2003/2004 Annual report
3
Contents
1 Preface and Summary ...............................................................................................................5 1.1 Introduction..................................................................................................................................5 1.2 Organochlorines and mercury in the livers of predatory birds ....................................................6 1.3 Organochlorines in merlin (Falco columbarius) eggs .................................................................6 1.4 Organochlorines in golden eagle (Aquila chrysaetos) eggs.........................................................7 1.5 Organochlorines in gannet (Morus bassanus) eggs .....................................................................7 1.6 Organochlorines in sea eagle (Haliaeetus albicilla) eggs............................................................7 1.7 Second generation anticoagulant rodenticides (SGARs) in barn owls (Tyto alba),
kestrels (Falco tinnunculus), and red kites (Milvus milvus) ........................................................7 1.8 Comparison of toxic equivalents by chemical and CALUX measurements ................................8 1.9 The effect of nutritional state on liver contaminant concentrations.............................................8 1.10 Contaminant levels in sprats and sandeels from the North Sea ...................................................9
2 Organochlorines in the livers of predatory birds....................................................................11 2.1 Introduction..................................................................................................................................11 2.2 Results for birds received in 2003 ...............................................................................................11 2.3 Long-term trends..........................................................................................................................12 2.4 Summary ......................................................................................................................................13
3 Organochlorines in merlin (Falco columbarius) eggs .............................................................19 3.1 Introduction..................................................................................................................................19 3.2 Results for eggs received in 2003 ................................................................................................19 3.3 Long-term trends..........................................................................................................................20 3.4 Summary ......................................................................................................................................21
4 Organochlorines and mercury in golden eagle (Aquila chrysaetos) eggs ..............................26 4.1 Introduction..................................................................................................................................26 4.2 Results for eggs received in 2003 ................................................................................................26 4.3 Long-term trends in golden eagle eggs ........................................................................................27 4.4 Summary ......................................................................................................................................28
5 Organochlorines and mercury in northern gannet (Morus bassanus) eggs ..........................35 5.1 Introduction..................................................................................................................................35 5.2 Long-term trends in gannet eggs..................................................................................................35 5.3 Comparisons of colonies..............................................................................................................35 5.4 Summary ......................................................................................................................................36
6 Organochlorines and mercury in white-tailed eagle (Haliaeetus albicilla) eggs...................40 6.1 Introduction..................................................................................................................................40 6.2 Analysis of long-term data ...........................................................................................................40
7 Second generation anticoagulant rodenticides (SGARs) in barn owls (Tyto alba), kestrels (Falco tinnunculus) and red kites (Milvus milvus). ...................................................42
7.1 Introduction..................................................................................................................................42 7.2 Methods........................................................................................................................................42 7.3 Results of analyses of birds received in 2003 ..............................................................................42
Wildlife and pollution: 2003/04 annual report
4
8 Comparison of toxic equivalents by chemical and CALUX measurements .........................47 8.1 Introduction..................................................................................................................................47 8.2 Methods........................................................................................................................................48 8.3 Results..........................................................................................................................................49 8.4 Discussion ....................................................................................................................................53
9 The effect of nutritional state on liver contaminant concentrations......................................56 9.1 Introduction..................................................................................................................................56 9.2 Methods........................................................................................................................................56 9.3 Results..........................................................................................................................................57 9.4 Discussion ....................................................................................................................................70
10 Contaminant levels in sprats and sandeels from the North Sea.............................................72 10.1 Introduction..................................................................................................................................72 10.2 Methods........................................................................................................................................72 10.3 Results..........................................................................................................................................73 10.4 Discussion ....................................................................................................................................75
11 References ...................................................................................................................................76
12 Appendix .....................................................................................................................................79
Wildlife and pollution: 2003/2004 Annual report
5
1 Preface and Summary
1.1 Introduction The Wildlife and Pollution contract covers a long-term monitoring programme, the Predatory Bird Monitoring Scheme (PBMS), that examines the levels of certain pollutants in selected wildlife species in Britain. The programme was started in the early 1960s, when there were serious concerns over the effects of organochlorine insecticides and organomercury fungicides on various species of birds and mammals. This early work demonstrated the effects of the organochlorines and eventually contributed to the ban on their use in the UK and abroad. The programme has subsequently assessed the success of these bans by measuring whether there has been a decline in the concentrations of organochlorine pesticides in the livers and eggs of predatory and freshwater fish-eating birds. Investigations have also been made into the levels of industrial polychlorinated biphenyls (PCBs), following their identification as pollutants in 1966. Mercury levels, derived from both agricultural and industrial sources, have also been tracked, although mercury concentrations were not measured in birds collected in 2001. In recent years, investigations have been made into the effects of the newest generation of rodenticides on barn owls Tyto alba. Northern gannet Morus bassanus eggs are also collected approximately biennially from two colonies and, when available, from other sites; eggs were last collected in 2002 This programme is now the longest-running of its kind anywhere in the world and the findings stimulate considerable interest internationally, as well as in Britain. Annual reports give an interim summary of results. This current report presents the results of analyses carried out on material collected in 2003. Every three years these annual results are gathered together into a more substantial report in which they are integrated with previous findings. The last report of this type covered the period up to and including 2000 (Shore et al., 2005a) and is updated here. The present report summarises the long-term trends in all contaminants (except rodenticides, analysed in (Shore et al., 2005b)) that occurred during the monitoring period up to and including the year 2003. Results are published periodically in the scientific literature, and recent key papers are listed in the references to the present report. The Wildlife and Pollution contract was the subject of scientific assessment within JNCC’s rolling programme of peer review in autumn 1993 and was further assessed in 1996. As a result of the last two assessments, some monitoring was curtailed. Most notably, common kestrels Falco tinnunculus are no longer monitored for organochlorines. However, kestrels have been monitored for second-generation anticoagulant rodenticides since 2001. This is because an individual study, carried out as part of the PBMS activities, demonstrated that this species may be particularly vulnerable to exposure to these compounds (Shore et al., 2001b). Carcasses and eggs of predatory bird species (such as peregrine falcon Falco peregrinus, common buzzard Buteo buteo, long-eared owl Asio otus, little owl Athene noctua, common kingfisher Alcedo atthis, great crested grebe Podiceps cristatus, and great bittern Botaurus stellaris) which do not form the core part of the PBMS, but are sent to the Centre for Ecology & Hydrology (CEH) by volunteers, are not analysed chemically. However, post-mortem examinations are carried out the carcasses, relevant information is recorded and the cause of death is determined (and reported back to the volunteer who submitted the carcass). Samples of the egg contents and body organs for these species, and samples for the species that do form part of the core monitoring, are all archived at -20°C as part of CEH’s unique long-term tissue bank, and are often used in specific targeted research studies in subsequent years. Each section within the Wildlife and Pollution contract is summarised below. Each is dependent on the provision of material from amateur naturalists and other interested parties, and it is not always possible to obtain desired material for analysis, especially from remote areas.
Wildlife and pollution: 2003/04 annual report
6
1.2 Organochlorines and mercury in the livers of predatory birds
The main objective of this work is to analyse the bodies of certain predatory and fish-eating bird-species, supplied by members of the public, in order to continue the monitoring of organochlorine and mercury residues in livers. This enables surveillance of the effects of previous withdrawals of permitted uses of some of these chemicals, and to examine geographical variation in residues. For 2003, the livers from 22 Eurasian sparrowhawks Accipiter nisus and 11 grey herons Ardea cinerea from various localities in Scotland, England and Wales, were analysed for dichlorodiphenyldichloroethylene (DDE), hexachloro-epoxy-octahydro-dimethanonaphthalene (HEOD), PCBs and mercury (Hg). In addition, the toxic equivalence quotient (TEQ) concentration has been calculated for each liver. Calculating TEQ concentrations is a method of estimating the summed toxicity of a mixture of dioxin-like compounds and comparing it with that of 2,3,7,8- tetrachlorodibenzodioxin (TCDD), the most active dioxin. This calculation assumes an additive model of toxicity. None of the sparrowhawks or herons collected during 2003 had liver concentrations of organochlorine insecticides or PCBs which were indicative of lethal exposure. Average liver concentrations of organochlorine pesticides and PCBs were not significantly different from those recorded in birds that died in 2002, apart from an apparent decrease in liver mercury concentrations in sparrowhawks. There have been general long-term declines in liver residues of organochlorine pesticides and mercury during the monitoring period. These declines appear now to have largely levelled off. The long-term declines in organochlorine pesticides confirm the effectiveness of progressive restrictions that have been placed on the use and release of the parent compounds. There is little evidence of major long-term declines in PCB residues in sparrowhawks, even though the use of these compounds in open systems has been prohibited in many countries since 1972 and their production in most industrial countries was terminated by the late 1970s. In contrast to sparrowhawks, PCB residues in the piscivorous heron have declined significantly since the late 1970s, although there is little evidence of any significant change in liver residues since approximately the mid 1980s.
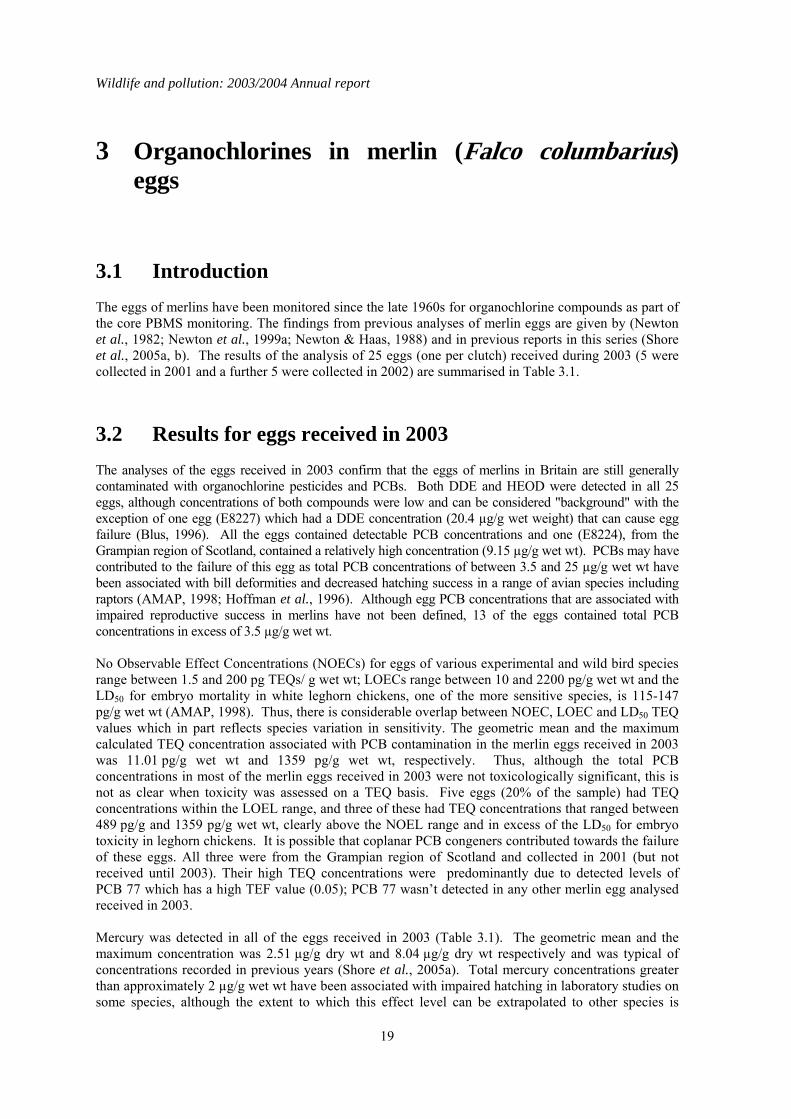
1.3 Organochlorines in merlin (Falco columbarius) eggs Single eggs from 25 merlin clutches from various parts of Scotland and England were received in 2003 and analysed. The results confirm that the eggs of merlins in Britain are still generally contaminated with organochlorine pesticides and PCBs but concentrations were generally low and below concentrations that are thought to be toxicologically significant. Concentrations of organochlorine pesticides in merlin eggs have declined significantly since bans on the use of these compounds have been implemented. This decline has been accompanied by an increase in shell indices and a widespread increase in breeding merlins in Britain, although there has been some regional variation in recovery. Neither PCB nor mercury residues have clearly declined in merlin eggs across Britain as a whole, apart from perhaps an initial decline in PCB concentrations during the 1970s. PCB and mercury residues detected in some eggs have been high both in the past and currently. Whether this simply reflects natural variability in exposure or hotspots of contamination is not clear. However, high mercury residues have consistently been detected in birds from the Shetlands and Orkneys, and this would suggest that there is significant regional variation in exposure to this contaminant at least. The PCB and mercury concentrations in the most-contaminated eggs are of a magnitude associated with embryotoxic effects in other species. If embryotoxicity does occur in some eggs, the scale of these effects has not been sufficient to prevent the population recovery of merlins that accompanied the decline in organochlorine pesticide contamination.
Wildlife and pollution: 2003/2004 Annual report
7
1.4 Organochlorines in golden eagle (Aquila chrysaetos) eggs Single eggs from five clutches from Scotland were analysed in 2003; three were from the Western Highlands, one from the Western Isles (South Uist) and one from the Eastern Highlands (Abernethy Forest). DDE, HEOD, PCB and mercury concentrations were relatively low in all five eggs and below concentrations thought to impair reproduction. As in the previous year, the highest DDE, PCB and mercury concentrations were measured in the egg from South Uist. This egg was the only one to have a detectable TEQ concentration which was within the range for NOEL concentrations for various experimental and wild bird species. A total of 382 unhatched golden eagle eggs, each from a different clutch, were analysed between 1963 and 2003. Concentrations of organochlorine pesticides, PCBs and mercury varied regionally and were higher in western than eastern areas, and generally greater in coastal than inland birds in the west. These regional differences most probably reflect variation in the degree of contamination in prey. Concentrations of organochlorine pesticides have declined significantly during the monitoring period, whereas there has been no overall pattern of change in PCB and mercury concentrations or shell indices for eagles from throughout Scotland. The current levels of most of the contaminats that have been measured in eagle eggs are generally unlikely to be directly embryotoxic, although PCB concentrations in some eggs may result in adverse effects.
1.5 Organochlorines in gannet (Morus bassanus) eggs No gannet eggs were received in 2003. Since monitoring was started, eggs have been obtained in 1-18 years from eight different gannet colonies around Britain and Ireland. Four of these colonies have been sampled in at least eight different years, and the colonies at Ailsa Craig and Bass Rock have been studied most intensively. Over the whole monitoring period, DDE and HEOD concentrations in eggs have generally declined whereas long-term trends in PCBs and mercury have been more variable, concentrations decreasing at some colonies but remaining the same or increasing at others.
1.6 Organochlorines in sea eagle (Haliaeetus albicilla) eggs No failed eggs were collected in 2003 and a total of ten eggs from Scottish white-tailed eagles have been obtained and analysed during the course of the PBMS. Of these ten eggs, four had lipid DDE concentrations above the LOEL for eggshell thickness, and two of them exceeded the LOEL for productivity. Six eggs also had total PCB lipid concentrations greater than 300 μg/g, and all but two had PCB residues of between 8 and 25 µg/g wet wt, the range associated with decreased hatching success in various avian species. Although it is not certain that DDE or PCBs were a contributory cause of reproductive failure in white-tailed eagles from Scotland, the residues in some eggs were of a magnitude that might have been expected to have adverse effects. It is clearly important to analyse further eggs that become available.
1.7 Second generation anticoagulant rodenticides (SGARs) in barn owls (Tyto alba), kestrels (Falco tinnunculus), and red kites (Milvus milvus)
A total of 88 barn owls, 40 kestrels but no red kites were received in 2003 and analysed for four SGARs: difenacoum, bromadiolone, brodifacoum and flocoumafen. Of the birds that had died that year, detectable residues of one or more compounds were found in 41 (60.3 %) barn owls and 33

Wildlife and pollution: 2003/04 annual report
8
(84.6%) kestrels. Difenacoum and bromadiolone were the compounds most frequently detected. The proportion of barn owls that contained residues, and (in comparison) the even higher proportion of kestrels that were contaminated, was higher than expected based on findings in previous years. Eight of the barn owls had liver residues that were in the potentially lethal range of > 0.1-0.2 µg/g wet weight, but none of these birds were diagnosed to have died from rodenticide poisoning. Seventeen kestrels (28.2%) had relatively high liver SGAR residues (> 0.2 µg/g wet weight) and, of these, review of the post-mortem examination findings and residue data suggested that SGARs may have contributed to the death of four birds. However, it is also possible that the birds may have died from other causes and whether SGARs were a contributory factor is uncertain.
1.8 Comparison of toxic equivalents by chemical and CALUX measurements
Persistent organic pollutants (POPs) are widely distributed in the environment, and are bioaccumulated by and potentially toxic to wild vertebrates. Many POPs can exert toxic effects through a common mode of action via the aryl-hydrocarbon (Ah) receptor. Simultaneous exposure to multiple POPs may therefore potentially result in additive toxicity. Methods have been developed to calculate the sum Ah receptor toxicity caused by multiple POPs. This is expressed as a sum Toxic Equivalence (TEQ) concentration, which is the toxicity equivalent to that caused by known concentration of 2, 3,7, 8 -tetrachlorodibenzo-p-dioxin (TCDD). The PBMS now annually monitors coplanar PCB congeners (which act via the Ah receptor) and reports the associated TEQ concentrations, thereby providing better information on likely toxic effects of POPs on UK raptors and their eggs. However, other POPs that act through the Ah receptor are not currently monitored. It is therefore possible that total TEQ concentrations, which are the result of assimilation of other POPs as well as PCBs, are underestimated. The objective of the present study was to compare TEQ concentrations in PBMS samples (as calculated from chemical determination of PCB coplanar congeners) with total TEQ concentrations which arise from the presence of all chemicals that act through the Ah receptor. This wider ranging measure of TEQs was obtained using a chemically-activated luciferase gene expression (CALUX) cell bioassay. Chemically determined PCB-TEQ concentrations were lower than CALUX-TEQ concentrations in merlin, peregrine falcon and gannet eggs that had relatively low levels of contamination, and in sparrowhawk, kestrel and heron livers that contained less than two detectable coplanar PCBs. In eggs and livers with relatively high levels of coplanar PCBs, PCB-TEQ concentrations were either similar to or exceeded CALUX-TEQ concentrations, suggesting that PCBs comprise most of the Ah-receptor mediated toxicity in these samples. Chemical determination of PCB-TEQs appears likely, therefore, to underestimate total TEQ concentrations (as measured by CALUX assay) in eggs and birds contaminated at low (but not high) levels. This will not cause a significant underestimation of likely toxicity. Overall, chemical and CALUX measurements suggest that TEQ concentrations in the livers of sparrowhawks, kestrels and herons and in the eggs of peregrines from Britain are not at toxicologically significant concentrations, but TEQ concentrations in merlin and gannet eggs can occur at levels that have been associated with adverse effects in other species.
1.9 The effect of nutritional state on liver contaminant concentrations
Body condition, age, and sex can all affect the magnitude of liver concentrations of lipophilic contaminants in raptors. Body condition appears to be the most important of these factors and is thought to affect liver residues because contaminants are remobilised from fat as starving birds deplete their body fat stores. Starvation would not be expected to have a major influence on liver
Wildlife and pollution: 2003/2004 Annual report
9
concentrations of inorganic and non-lipophilic compounds, such as heavy metals, because these are not typically stored in fat in high concentrations. To date, nutritional status has not been taken into account in any of the PBMS monitoring of long-term changes in OC insecticides and PCBs. Variation between years in the proportions of birds that were starving may have introduced considerable variation into the long-term dataset and potentially have masked long-term changes in liver concentrations or the rate of those changes. The aim of this study was to determine whether taking nutritional state into account affected the detection of long-term changes in liver concentrations of three lipophilic compounds (DDE, HEOD and PCBs) and one non-lipophilic compound (total mercury) measured by the PBMS in sparrowhawks, kestrels and herons. Analysis of long-term trends in liver contaminant concentrations in starved and non-starved birds demonstrated that inter-year variation in the proportion of birds in different nutritional states can obscure and/or delay the detection of changes in exposure to environmental contaminants. This was most apparent in the PBMS data for sparrowhawks, in which declines in liver PCB concentrations over time were only apparent once nutritional state was taken into account. Starvation was found to increase liver contaminant concentrations partly through remobilisation of residues from fat (and possibly other body tissues), although this was a relatively minor effect in kestrels for compounds such as PCBs. Starvation also increased liver contaminant concentrations because it was associated with liver wastage, which alone can elevate liver concentrations by two-three fold. Because of the physiological impacts of starvation, it is clearly important to take body condition into account when conducting long-term monitoring of liver contaminant concentrations in birds and other biota. This can be done by incorporating a measure of nutritional state as a factor in the data analysis and is necessary when monitoring inorganic as well as organic compounds because of the effects of liver wastage. Alternatively, data for animals in poor nutritional condition can be excluded from analysis when the aim is specifically to determine changes in environmental exposure, although such exclusion is likely to lead to an overall loss of information. Furthermore, examination of data for animals in poor nutritional state is important because starved individuals may be most at risk of suffering organ toxicity as they experience the highest internal doses of the contaminant.
1.10 Contaminant levels in sprats and sandeels from the North Sea
The breeding season in 2004 was the worst on record for many seabirds in the North Sea and was particularly critical for the common guillemot Uria aalge. Many chicks died before they left the colony, apparently of starvation, and it was notable that, in 2004, adult birds fed their chicks predominantly on sprats (Sprattus sprattus) rather than lesser sandeels (Ammodytes marinus), the normally preferred prey. Despite this, preliminary calculations of the energy intake of guillemot chicks at CEH’s long term study site on the Isle of May off the southeast coast of Scotland did not differ from the long term average. However, the calculations were based on previously published data for energy values in the fish rather than measured values. Reproductive failure may therefore have occurred because the prey was of unusually poor nutritional quality. Another possibility was that the prey contained high levels of contaminants that adversely affected growth. Sprats and sandeels were collected from seabirds on the Isle of May in 2004 and were analysed for organochlorine insecticides, PCBs, Hg and zinc (Zn—a key essential element for growth in chicks) to assess whether excessive contaminant or low Zn concentrations may have adversely affect growth in guillemots. This was done as part of the work undertaken for the current year of the Wildlife & Pollution contract. The nutrient content of the fish was also determined. This analysis was out-with of the Wildlife & Pollution contract but the major finding is summarised here. OC insecticide, PCB and Hg concentrations in fish were relatively low and none of the dioxin-like PCB congeners were detected in any of the fish analysed. The major differences between sandeels and sprats were that sprats had significantly more HEOD and less zinc than sprats. Although sprats
Wildlife and pollution: 2003/04 annual report
10
therefore appeared to be poorer diet than sand eels, there was no clear evidence that the Zn or contaminant concentrations in sprats and the unusually high dependence on sprats as prey accounted for the poor breeding success of guillemots in 2004. In contrast, the nutrient levels in both sprats and sandeels were significantly lower than expected based on analysis of fish from earlier years. It appeared from this wider nutrient analysis of the fish that poor food quality (in terms of its energy content) was the most likely proximate cause of the seabird breeding failure. Why the condition of the fish was poor in 2004 in the North Sea is uncertain.
Wildlife and pollution: 2003/2004 Annual report
11
2 Organochlorines in the livers of predatory birds
2.1 Introduction The main objective of this work is to analyse the livers of predatory birds in order to continue the monitoring of contamination by organochlorines and toxic metals. The livers were from carcasses of birds found dead by members of the public. The chemicals of interest included DDE (from the insecticide dichlorodiphenyltrichloroethane (DDT)), HEOD (from the insecticides aldrin and dieldrin), PCBs (polychlorinated biphenyls from industrial products) and mercury (Hg—from agricultural and industrial sources). Concentrations of gamma-hexachlorocyclohexane (g-HCH) are also reported. Liver organochlorine concentrations are reported in this section as µg/g wet weight (wet wt), and mercury concentrations are expressed as µg/g dry weight (dry wt). Sum polychlorinated biphenyl toxic equivalent (PCB TEQ) values were expressed as pg/g wet wt. Individual congener specific PCB and PCB TEQ concentration are reported in the appendices. The species analysed were the Eurasian sparrowhawk Accipiter nisus, representing the terrestrial environment, and the fish-eating grey heron Ardea cinerea, which represented the aquatic environment. A number of other species that do not form part of the core monitoring programme were also sent in to CEH during 2003. These were not analysed for organochlorine and mercury residues because of the reduction in the scope of the monitoring scheme agreed in 1998. However, post-mortem examinations were carried out on each of these birds, relevant information being recorded and the cause of death determined (and reported back to the volunteer who submitted the carcass). Body organs and tissues from all birds received in 2003 are archived at -20°C and can be analysed for organochlorines and other contaminants in specific future studies. Findings from previous years are given in earlier reports in this series.
2.2 Results for birds received in 2003 A total of 43 sparrowhawks were received at CEH in 2003. A post-mortem examination was conducted on all the birds and selected tissues from each were retained in the PBMS - 20ºC tissue archive. The livers of a stratified (by month of death) random sample of about half of the carcasses were analysed chemically. In all, livers from 22 sparrowhawks and 11 herons were analysed. The results from all these birds are listed in Table 2.1 and the geometric means for each chemical are given in Table 2.2 None of the sparrowhawks collected during 2003 had liver concentrations of organochlorine insecticides which were indicative of lethal exposure. Liver pp’-DDE and HEOD residues were all below 10 µg/g wet wt and 1 µg/g wet wt respectively, relatively low level concentrations typically now found in sparrowhawks in Britain (Newton et al., 1992, 1993). Gamma -HCH was only detected in the liver of one sparrowhawk and the concentration (0.006 µg/g wet wt) was approximately three orders of magnitude below residues associated with mortality (Wiemeyer, 1996). Liver total PCB concentrations in sparrowhawks were all lower than 20 µg/g wet wt; and so may be considered not to be high. The concentrations of organochlorine insecticides and PCBs in the 11 herons analysed were low and not considered to be toxicologically significant. Gamma-HCH was not detected in any bird. This is the second year in which TEQ concentrations have been reported. TEQ concentrations were highly variable. Approximately 40% of the sparrowhawks that died in 2003 had non-detected TEQ concentrations associated with their PCB contamination. The geometric mean TEQ concentration for
Wildlife and pollution: 2003/04 annual report
12
those sparrowhawks that had detectable residues was 5.71 pg/g wet wt. which was significantly less than that measured in birds that died in 2002 (Student t test on log-transformed data, T25=2.84; P<0.01). However, the geometric mean TEQ concentration of all sparrowhawks that had died in 2003 was not significantly different to that of birds that died in 2002 (Table 2.3). The liver concentrations reported here are within the ranges reported in the livers of various predatory bird species from Europe, the USA and Japan (Coady et al., 2001; Kannan et al., 2003; Senthilkumar et al., 2002). The toxicological significance of liver TEQ concentrations is less well established for livers than for eggs (Hoffman et al., 1996), but 25 ng/g on a lipid weight (lipid wt) basis has been reported as the lowest observed effect level (LOEL) for induction of cytochrome P450 enzymes and for a 50% reduction in plasma thyroxine levels in common tern (Sterna hirundo) chicks (Bosveld et al., 2000). The geometric mean TEQ concentration of 5.71 pg/g wet wt for the 2003 sparrowhawks that had detectable levels of TEQ concentrations approximately equates to 0.18 ng/g lipid wt. and is some 140-fold lower than the LOEL reported for tern chicks. The maximum TEQ concentration (1.7 ng/g lipid wt.) measured this year in a sparrowhawk (bird 14105), was over an order of magnitude lower than the LOAEL. The range of TEQ concentrations measured in heron livers was similar to that observed in sparrowhawks (non-detected to 1.6 ng/g lipid wt. compared with non-detected to 1.7 ng/g lipid wt. respectively). However, there was a larger proportion of detected concentrations in heron (82% of birds) than sparrowhawks, (59%); this difference was not quite statistically significant (Fisher’s Exact test; P=0.083). Mercury concentrations in sparrowhawks and herons were almost all below the concentration (20-30 µg/g wet wt, equivalent to approximately 70-105 µg/g dry wt) associated with toxic effects in birds of prey (Thompson, 1996). The only exception was one heron (bird 14026,) which had a liver mercury concentration of 108 µg/g dry wt. Poisoning symptoms of mercury in birds includes altered and erratic behaviour, weight loss, appetite suppression, and ataxia (Thompson, 1996). The heron was found frozen into the ice on a water course and post-mortem examination indicated that the probable cause of death was starvation but, given the high levels of mercury present in the liver, it is possible that mercury intoxication contributed to the death of this bird. Overall, there were no statistically significant differences between liver contaminant residues in birds that died in 2003 and those that died in the previous year except for mercury in sparrowhawks which was lower in 2003 than in 2002 (Table 2.3).
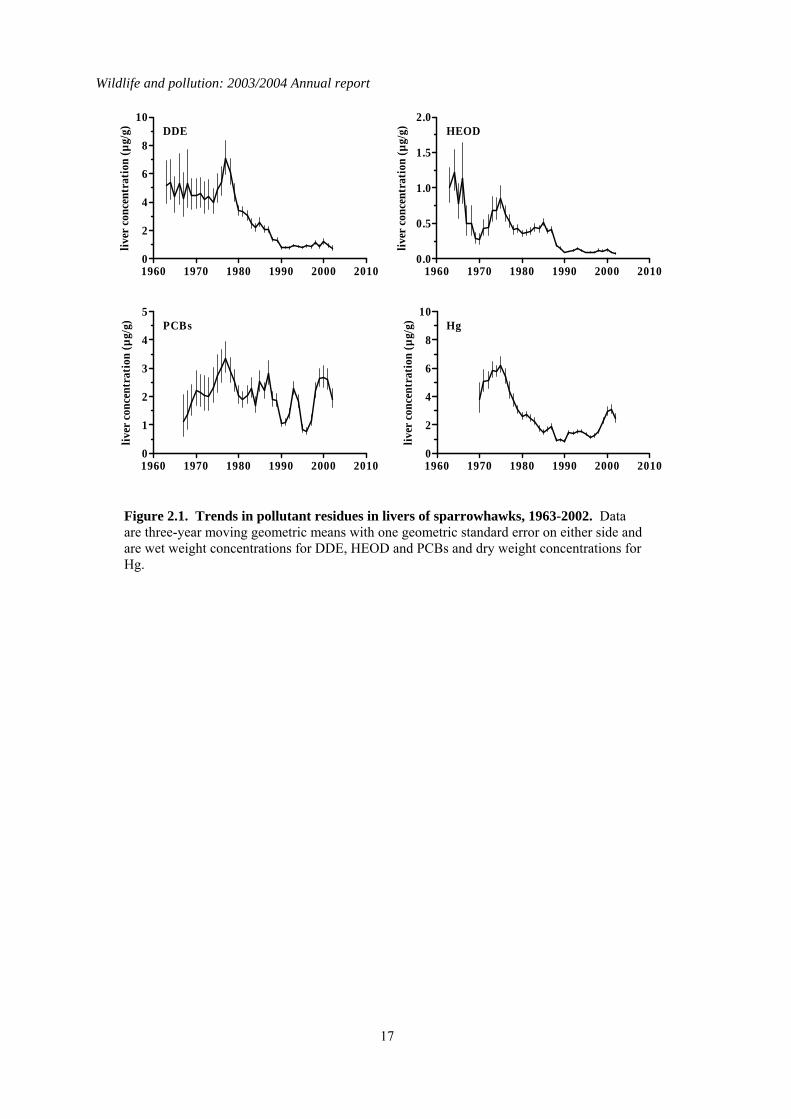
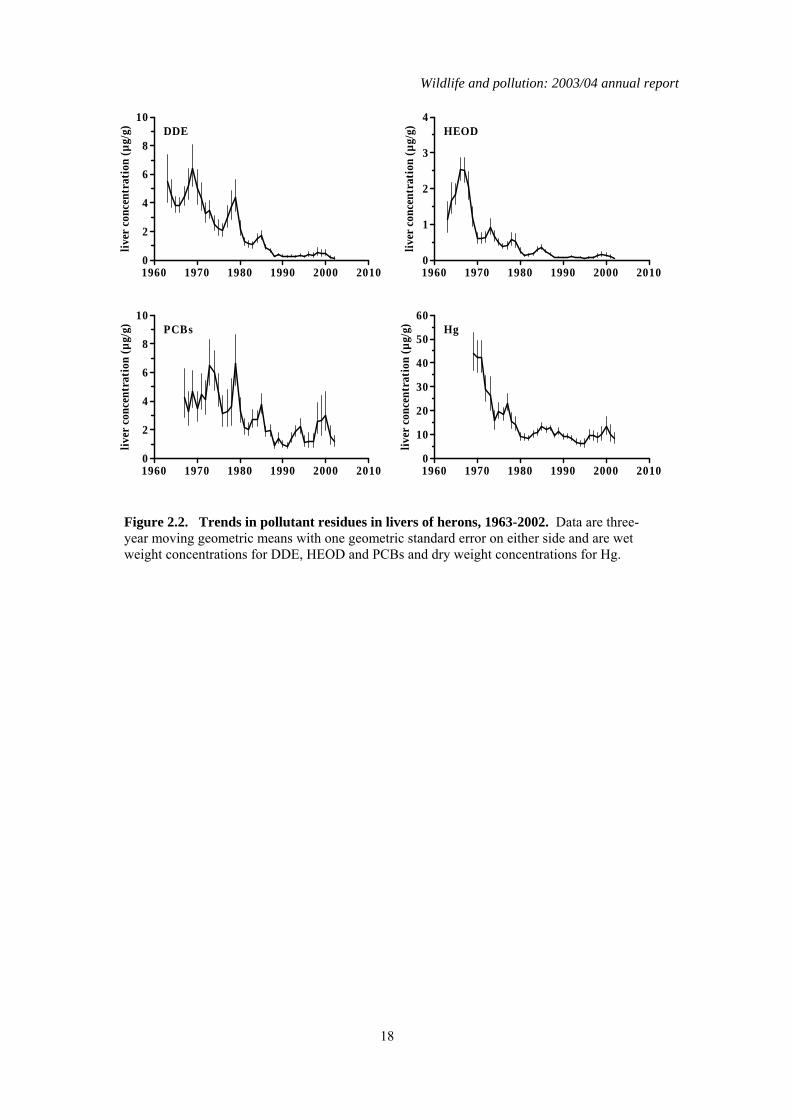
2.3 Long-term trends The nationwide trends in DDE, HEOD, PCB and mercury residues for sparrowhawks and herons are given in Figures 2.1 and 2.2 respectively. Analyses began in 1963-64 for DDE and HEOD, 1967-68 for PCBs and 1967-70 for mercury, depending on the species. Long-term trends were analysed by linear regression analyses of log-transformed individual residues on year for the whole analytical period for each contaminant (Table 2.4), as has been done in previous long-term reviews. This gives an overall robust assessment of the significance of any long-term trends, although other regression models may give a marginally better fits to the data in some instances. Separate analyses were carried out for each compound for the past six years (1995–2000) so that the most recent trends could be examined independently of earlier results (Table 2.4). In general, sparrowhawks and herons had broadly similar levels of DDE but herons had higher liver HEOD, PCB and mercury concentrations. This may reflect greater bioconcentration of these compounds through aquatic compared with terrestrial food-chains. Liver residues of DDE, HEOD and mercury in both sparrowhawks and herons have declined significantly over the whole course of the monitoring programme. Average liver concentrations appeared to stabilise at low levels by the early 1990s in sparrowhawks and perhaps a little earlier in herons. Individual birds of both species are still occasionally found to have high residues, however. The long-term pattern of liver PCB residues contrasts somewhat with the decline observed for the other contaminants. There is evidence of a
Wildlife and pollution: 2003/2004 Annual report
13
significant downward trend in liver total PCBs throughout the monitoring period in sparrowhawks (Table 2.4), but this decline is extremely slight. Residues in recent years were only slightly lower than the peak average concentration recorded in the late 1970s, and were higher than when monitoring first began, although it is possible that some of this difference may be a result of relatively poor analytical detection when analytical methods were first developed in the 1960s. Unlike in the terrestrial-feeding predatory birds, liver PCB residues have decreased significantly in herons over the whole of the monitoring period. Liver residues declined approximately two-fold during the 1970s and 1980s but have failed to decline significantly since then. Over the shorter period (1998–2003), there has been relatively little change in contaminant concentrations in the livers of sparrowhawks and herons (Table 2.4; Figures 2.1 & 2.2). Liver HEOD concentrations decreased significantly but the magnitude of the declines have been small. Overall, there has been little change in sparrowhawk or heron liver HEOD concentrations since the early 1990s, with residues remaining an order of magnitude below the critical concentration for the population, as defined by Newton (1988). Liver DDE and PCB and Mercury concentrations have not changed significantly in either species over the last five years and mean concentrations are below concentrations associated with adverse effects (Hoffman et al., 1996; Peakall, 1996; Thompson, 1996).
2.4 Summary There have been general long-term declines in liver residues of organochlorine pesticides and Mercury during the monitoring period. These declines appear now to have largely levelled off. The long-term declines in organochlorine pesticides confirm the effectiveness of progressive restrictions that have been placed on the use and release of the parent compounds. There is little evidence of major long-term declines in PCB residues in sparrowhawks, even though the use of these compounds in open systems has been prohibited in many countries since 1972 and their production in most industrial countries was terminated by the late 1970s (Hoffman et al., 2001). In contrast, PCB residues in the piscivorous heron have declined significantly since the late 1970s, although there is little evidence of any significant change in liver residues since approximately the mid 1980s.
Wildlife and pollution: 2003/04 annual report
14
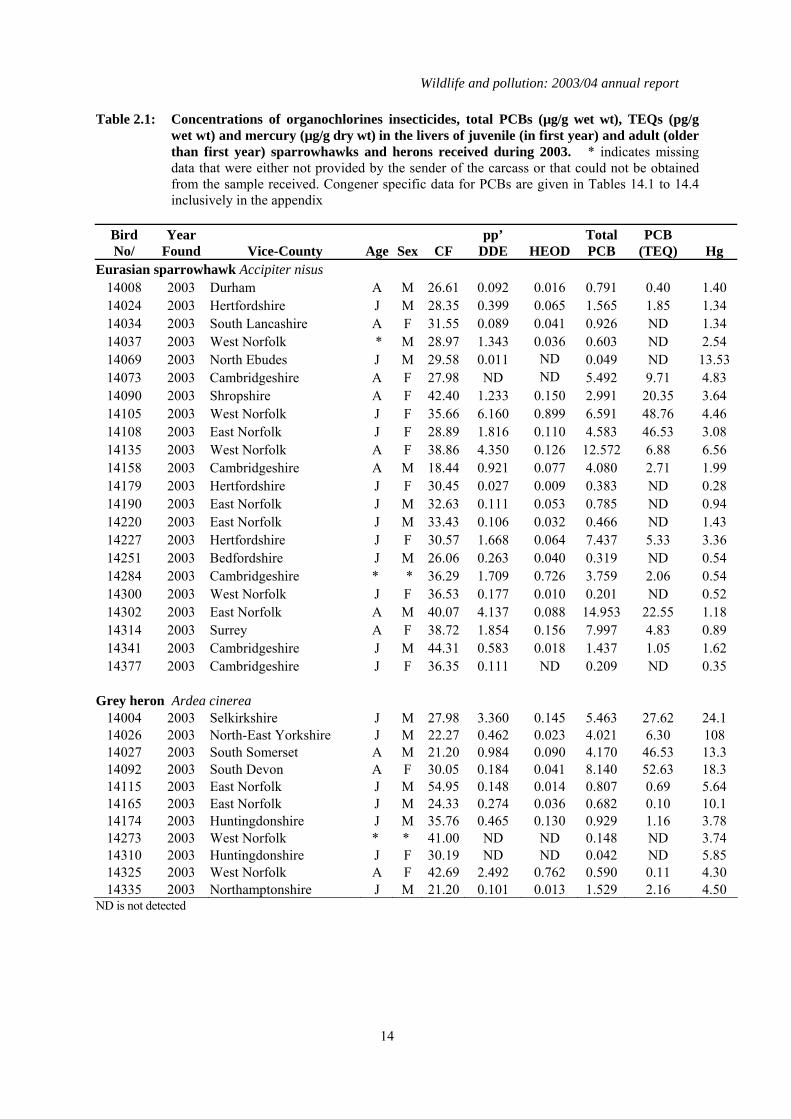
Table 2.1: Concentrations of organochlorines insecticides, total PCBs (µg/g wet wt), TEQs (pg/g wet wt) and mercury (µg/g dry wt) in the livers of juvenile (in first year) and adult (older than first year) sparrowhawks and herons received during 2003. * indicates missing data that were either not provided by the sender of the carcass or that could not be obtained from the sample received. Congener specific data for PCBs are given in Tables 14.1 to 14.4 inclusively in the appendix
Bird No/
Year Found Vice-County Age Sex CF
pp’ DDE HEOD
Total PCB
PCB (TEQ) Hg
Eurasian sparrowhawk Accipiter nisus 14008 2003 Durham A M 26.61 0.092 0.016 0.791 0.40 1.40 14024 2003 Hertfordshire J M 28.35 0.399 0.065 1.565 1.85 1.34 14034 2003 South Lancashire A F 31.55 0.089 0.041 0.926 ND 1.34 14037 2003 West Norfolk * M 28.97 1.343 0.036 0.603 ND 2.54 14069 2003 North Ebudes J M 29.58 0.011 ND 0.049 ND 13.53 14073 2003 Cambridgeshire A F 27.98 ND ND 5.492 9.71 4.83 14090 2003 Shropshire A F 42.40 1.233 0.150 2.991 20.35 3.64 14105 2003 West Norfolk J F 35.66 6.160 0.899 6.591 48.76 4.46 14108 2003 East Norfolk J F 28.89 1.816 0.110 4.583 46.53 3.08 14135 2003 West Norfolk A F 38.86 4.350 0.126 12.572 6.88 6.56 14158 2003 Cambridgeshire A M 18.44 0.921 0.077 4.080 2.71 1.99 14179 2003 Hertfordshire J F 30.45 0.027 0.009 0.383 ND 0.28 14190 2003 East Norfolk J M 32.63 0.111 0.053 0.785 ND 0.94 14220 2003 East Norfolk J M 33.43 0.106 0.032 0.466 ND 1.43 14227 2003 Hertfordshire J F 30.57 1.668 0.064 7.437 5.33 3.36 14251 2003 Bedfordshire J M 26.06 0.263 0.040 0.319 ND 0.54 14284 2003 Cambridgeshire * * 36.29 1.709 0.726 3.759 2.06 0.54 14300 2003 West Norfolk J F 36.53 0.177 0.010 0.201 ND 0.52 14302 2003 East Norfolk A M 40.07 4.137 0.088 14.953 22.55 1.18 14314 2003 Surrey A F 38.72 1.854 0.156 7.997 4.83 0.89 14341 2003 Cambridgeshire J M 44.31 0.583 0.018 1.437 1.05 1.62 14377 2003 Cambridgeshire J F 36.35 0.111 ND 0.209 ND 0.35
Grey heron Ardea cinerea
14004 2003 Selkirkshire J M 27.98 3.360 0.145 5.463 27.62 24.1 14026 2003 North-East Yorkshire J M 22.27 0.462 0.023 4.021 6.30 108 14027 2003 South Somerset A M 21.20 0.984 0.090 4.170 46.53 13.3 14092 2003 South Devon A F 30.05 0.184 0.041 8.140 52.63 18.3 14115 2003 East Norfolk J M 54.95 0.148 0.014 0.807 0.69 5.64 14165 2003 East Norfolk J M 24.33 0.274 0.036 0.682 0.10 10.1 14174 2003 Huntingdonshire J M 35.76 0.465 0.130 0.929 1.16 3.78 14273 2003 West Norfolk * * 41.00 ND ND 0.148 ND 3.74 14310 2003 Huntingdonshire J F 30.19 ND ND 0.042 ND 5.85 14325 2003 West Norfolk A F 42.69 2.492 0.762 0.590 0.11 4.30 14335 2003 Northamptonshire J M 21.20 0.101 0.013 1.529 2.16 4.50
ND is not detected
Wildlife and pollution: 2003/2004 Annual report
15
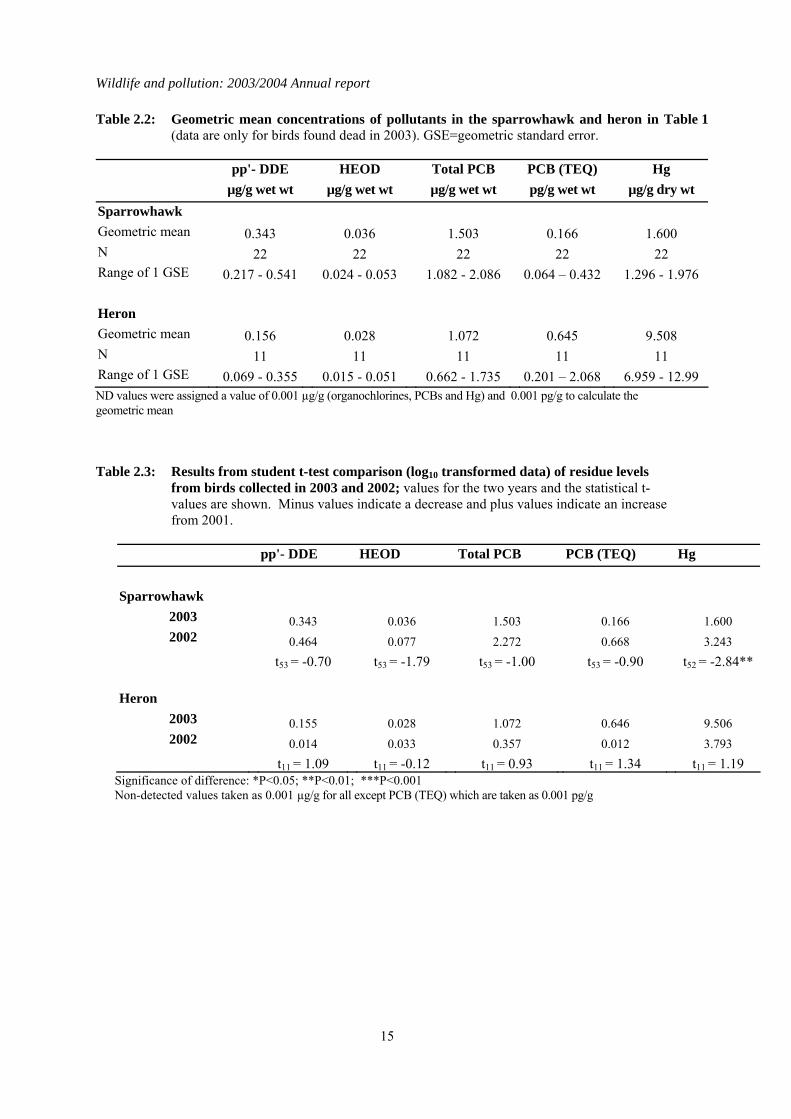
Table 2.2: Geometric mean concentrations of pollutants in the sparrowhawk and heron in Table 1 (data are only for birds found dead in 2003). GSE=geometric standard error.
pp'- DDE HEOD Total PCB PCB (TEQ) Hg µg/g wet wt µg/g wet wt µg/g wet wt pg/g wet wt µg/g dry wt Sparrowhawk Geometric mean 0.343 0.036 1.503 0.166 1.600 N 22 22 22 22 22 Range of 1 GSE 0.217 - 0.541 0.024 - 0.053 1.082 - 2.086 0.064 – 0.432 1.296 - 1.976 Heron Geometric mean 0.156 0.028 1.072 0.645 9.508 N 11 11 11 11 11 Range of 1 GSE 0.069 - 0.355 0.015 - 0.051 0.662 - 1.735 0.201 – 2.068 6.959 - 12.99 ND values were assigned a value of 0.001 µg/g (organochlorines, PCBs and Hg) and 0.001 pg/g to calculate the geometric mean Table 2.3: Results from student t-test comparison (log10 transformed data) of residue levels
from birds collected in 2003 and 2002; values for the two years and the statistical t-values are shown. Minus values indicate a decrease and plus values indicate an increase from 2001.
pp'- DDE HEOD Total PCB PCB (TEQ) Hg Sparrowhawk
2003 0.343 0.036 1.503 0.166 1.600 2002 0.464 0.077 2.272 0.668 3.243
t53 = -0.70 t53 = -1.79 t53 = -1.00 t53 = -0.90 t52 = -2.84** Heron
2003 0.155 0.028 1.072 0.646 9.506 2002 0.014 0.033 0.357 0.012 3.793
t11 = 1.09 t11 = -0.12 t11 = 0.93 t11 = 1.34 t11 = 1.19 Significance of difference: *P<0.05; **P<0.01; ***P<0.001 Non-detected values taken as 0.001 µg/g for all except PCB (TEQ) which are taken as 0.001 pg/g

Wildlife and pollution: 2003/04 annual report
16
Table 2.4: Trends in pollutant levels in livers of predatory birds during 1963-2003 and 1998-2003. Figures show sample sizes (N) and linear regression coefficients (b) based on log values regressed against year (analyses for PCBs and Hg were started in 1967 and 1970 respectively in sparrowhawk and heron). Data for TEQs not shown as data for previous years have not been reported.
1963-2003 1998-2003 N b N b
Sparrowhawk pp'-DDE 2032 -0.031 *** 289 -0.025 ns HEOD 2033 -0.032 *** 289 -0.052 * Total PCB 1988 -0.006 ** 289 -0.011 ns Hg 1734 -0.013 *** 239 0.016 ns Heron pp'-DDE 831 -0.043 *** 31 -0.168 ns HEOD 821 -0.048 *** 31 -0.204 * Total PCB 697 -0.021 *** 31 -0.108 ns Hg 530 -0.018 *** 27 -0.001 ns *P=<0.05; **P=<0.01;***P<0.001; ns=not significant Non-detected values taken as 0.001 µg/g
Wildlife and pollution: 2003/2004 Annual report
17
1960 1970 1980 1990 2000 20100
2
4
6
8
10DDE
liver
conc
entr
atio
n (µ
g/g)
1960 1970 1980 1990 2000 20100.0
0.5
1.0
1.5
2.0HEOD
liver
conc
entr
atio
n (µ
g/g)
1960 1970 1980 1990 2000 20100
1
2
3
4
5PCBs
liver
conc
entr
atio
n (µ
g/g)
1960 1970 1980 1990 2000 20100
2
4
6
8
10Hg
liver
conc
entr
atio
n (µ
g/g)
Figure 2.1. Trends in pollutant residues in livers of sparrowhawks, 1963-2002. Data are three-year moving geometric means with one geometric standard error on either side and are wet weight concentrations for DDE, HEOD and PCBs and dry weight concentrations for Hg.
Wildlife and pollution: 2003/04 annual report
18
1960 1970 1980 1990 2000 20100
2
4
6
8
10DDE
liver
con
cent
rati
on (µ
g/g)
1960 1970 1980 1990 2000 20100
1
2
3
4HEOD
liver
con
cent
rati
on (µ
g/g)
1960 1970 1980 1990 2000 20100
2
4
6
8
10PCBs
liver
con
cent
rati
on (µ
g/g)
1960 1970 1980 1990 2000 20100
10
20
30
40
50
60Hg
liver
con
cent
rati
on (µ
g/g)
Figure 2.2. Trends in pollutant residues in livers of herons, 1963-2002. Data are three-year moving geometric means with one geometric standard error on either side and are wet weight concentrations for DDE, HEOD and PCBs and dry weight concentrations for Hg.
Wildlife and pollution: 2003/2004 Annual report
19
3 Organochlorines in merlin (Falco columbarius) eggs
3.1 Introduction The eggs of merlins have been monitored since the late 1960s for organochlorine compounds as part of the core PBMS monitoring. The findings from previous analyses of merlin eggs are given by (Newton et al., 1982; Newton et al., 1999a; Newton & Haas, 1988) and in previous reports in this series (Shore et al., 2005a, b). The results of the analysis of 25 eggs (one per clutch) received during 2003 (5 were collected in 2001 and a further 5 were collected in 2002) are summarised in Table 3.1.
3.2 Results for eggs received in 2003 The analyses of the eggs received in 2003 confirm that the eggs of merlins in Britain are still generally contaminated with organochlorine pesticides and PCBs. Both DDE and HEOD were detected in all 25 eggs, although concentrations of both compounds were low and can be considered "background" with the exception of one egg (E8227) which had a DDE concentration (20.4 µg/g wet weight) that can cause egg failure (Blus, 1996). All the eggs contained detectable PCB concentrations and one (E8224), from the Grampian region of Scotland, contained a relatively high concentration (9.15 µg/g wet wt). PCBs may have contributed to the failure of this egg as total PCB concentrations of between 3.5 and 25 µg/g wet wt have been associated with bill deformities and decreased hatching success in a range of avian species including raptors (AMAP, 1998; Hoffman et al., 1996). Although egg PCB concentrations that are associated with impaired reproductive success in merlins have not been defined, 13 of the eggs contained total PCB concentrations in excess of 3.5 µg/g wet wt. No Observable Effect Concentrations (NOECs) for eggs of various experimental and wild bird species range between 1.5 and 200 pg TEQs/ g wet wt; LOECs range between 10 and 2200 pg/g wet wt and the LD50 for embryo mortality in white leghorn chickens, one of the more sensitive species, is 115-147 pg/g wet wt (AMAP, 1998). Thus, there is considerable overlap between NOEC, LOEC and LD50 TEQ values which in part reflects species variation in sensitivity. The geometric mean and the maximum calculated TEQ concentration associated with PCB contamination in the merlin eggs received in 2003 was 11.01 pg/g wet wt and 1359 pg/g wet wt, respectively. Thus, although the total PCB concentrations in most of the merlin eggs received in 2003 were not toxicologically significant, this is not as clear when toxicity was assessed on a TEQ basis. Five eggs (20% of the sample) had TEQ concentrations within the LOEL range, and three of these had TEQ concentrations that ranged between 489 pg/g and 1359 pg/g wet wt, clearly above the NOEL range and in excess of the LD50 for embryo toxicity in leghorn chickens. It is possible that coplanar PCB congeners contributed towards the failure of these eggs. All three were from the Grampian region of Scotland and collected in 2001 (but not received until 2003). Their high TEQ concentrations were predominantly due to detected levels of PCB 77 which has a high TEF value (0.05); PCB 77 wasn’t detected in any other merlin egg analysed received in 2003. Mercury was detected in all of the eggs received in 2003 (Table 3.1). The geometric mean and the maximum concentration was 2.51 µg/g dry wt and 8.04 µg/g dry wt respectively and was typical of concentrations recorded in previous years (Shore et al., 2005a). Total mercury concentrations greater than approximately 2 µg/g wet wt have been associated with impaired hatching in laboratory studies on some species, although the extent to which this effect level can be extrapolated to other species is
Wildlife and pollution: 2003/04 annual report
20
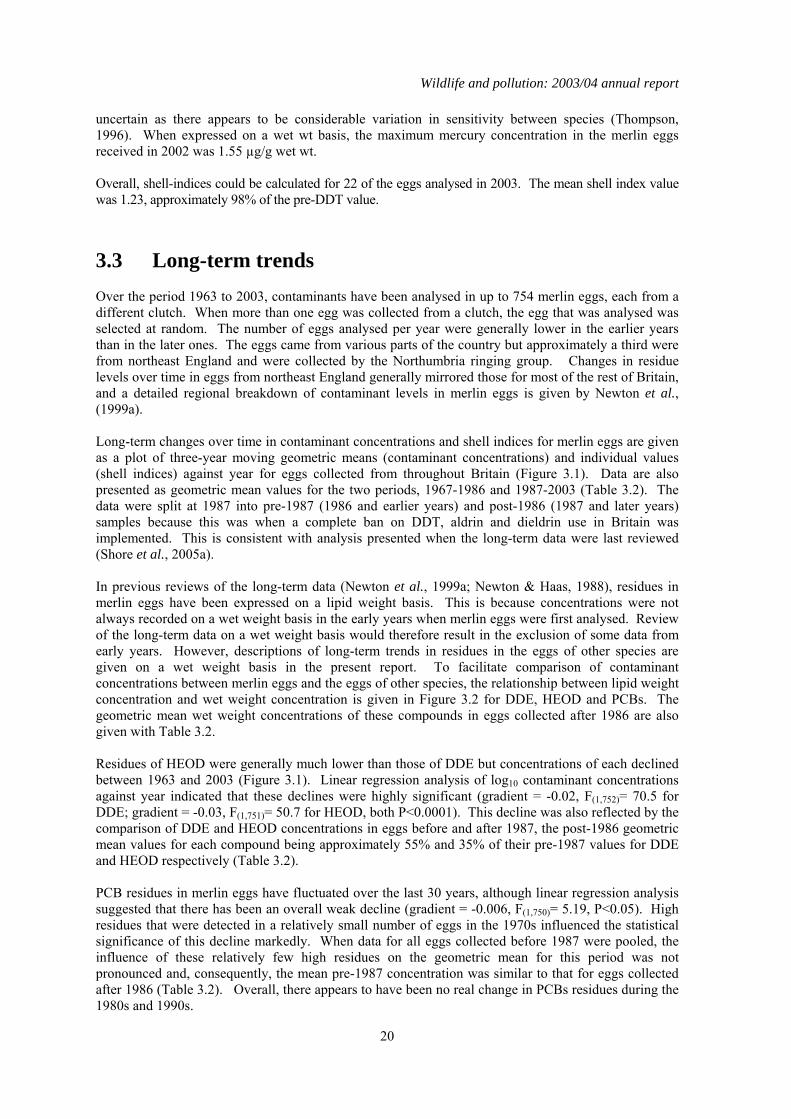
uncertain as there appears to be considerable variation in sensitivity between species (Thompson, 1996). When expressed on a wet wt basis, the maximum mercury concentration in the merlin eggs received in 2002 was 1.55 µg/g wet wt. Overall, shell-indices could be calculated for 22 of the eggs analysed in 2003. The mean shell index value was 1.23, approximately 98% of the pre-DDT value.
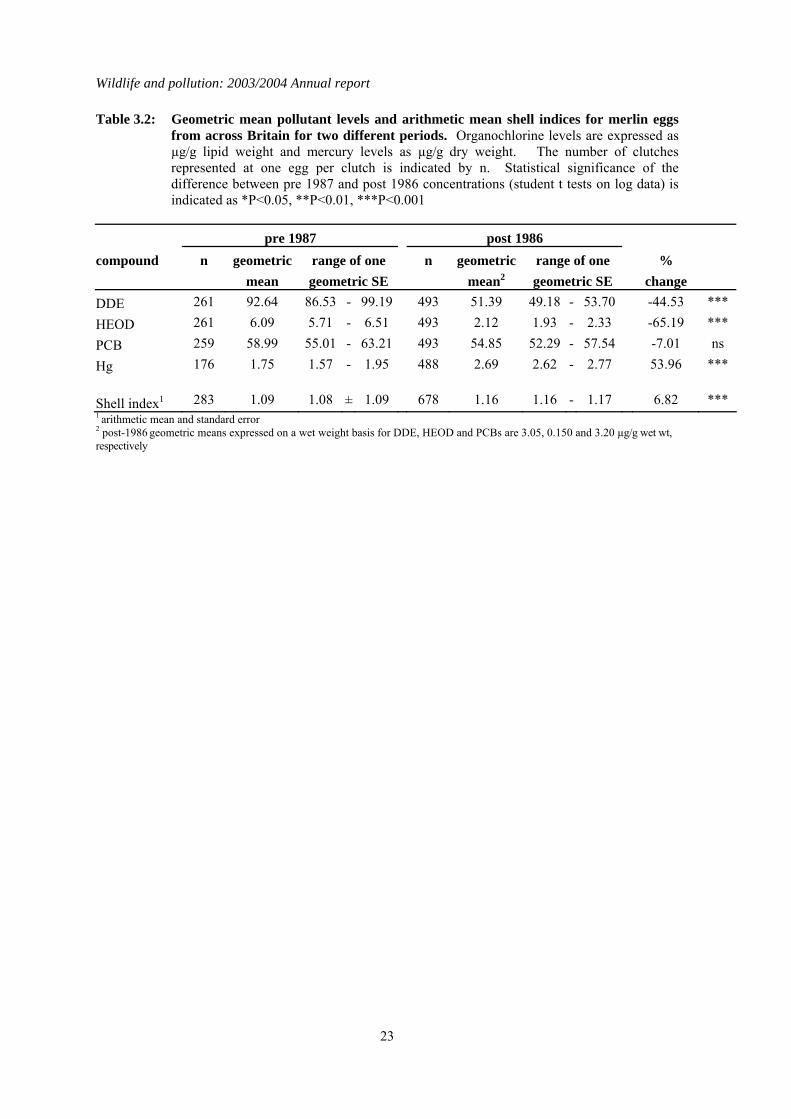
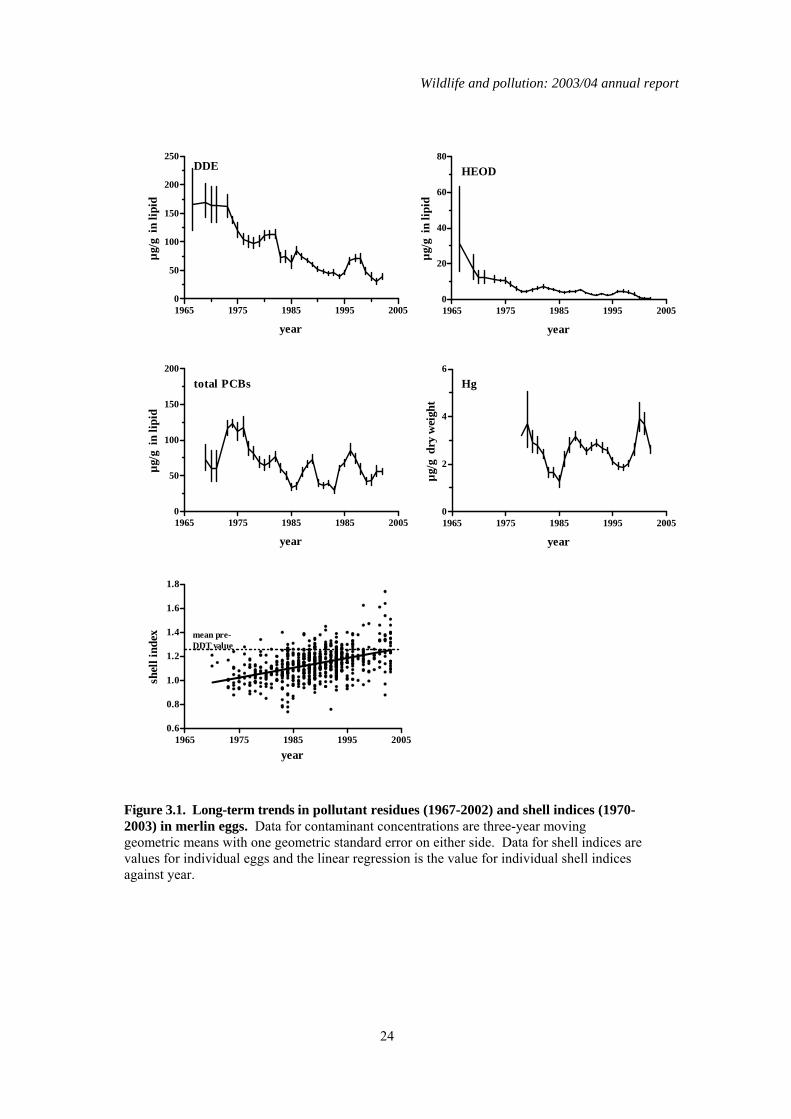
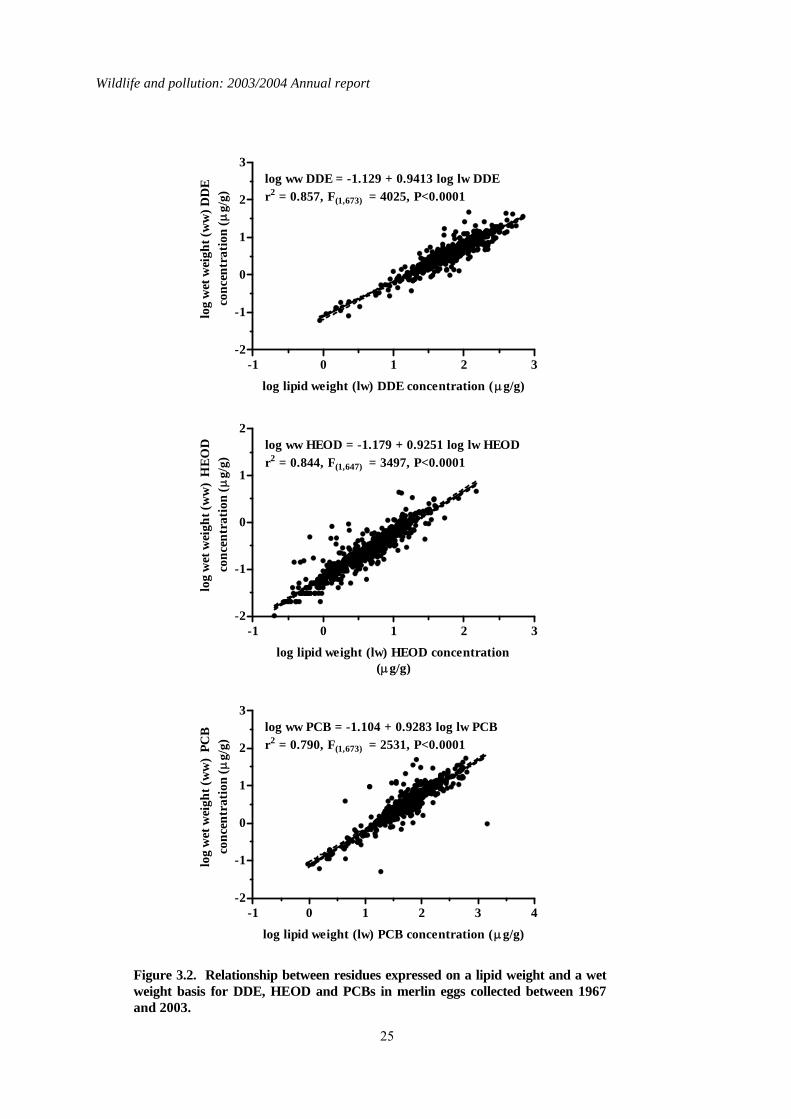
3.3 Long-term trends Over the period 1963 to 2003, contaminants have been analysed in up to 754 merlin eggs, each from a different clutch. When more than one egg was collected from a clutch, the egg that was analysed was selected at random. The number of eggs analysed per year were generally lower in the earlier years than in the later ones. The eggs came from various parts of the country but approximately a third were from northeast England and were collected by the Northumbria ringing group. Changes in residue levels over time in eggs from northeast England generally mirrored those for most of the rest of Britain, and a detailed regional breakdown of contaminant levels in merlin eggs is given by Newton et al., (1999a). Long-term changes over time in contaminant concentrations and shell indices for merlin eggs are given as a plot of three-year moving geometric means (contaminant concentrations) and individual values (shell indices) against year for eggs collected from throughout Britain (Figure 3.1). Data are also presented as geometric mean values for the two periods, 1967-1986 and 1987-2003 (Table 3.2). The data were split at 1987 into pre-1987 (1986 and earlier years) and post-1986 (1987 and later years) samples because this was when a complete ban on DDT, aldrin and dieldrin use in Britain was implemented. This is consistent with analysis presented when the long-term data were last reviewed (Shore et al., 2005a). In previous reviews of the long-term data (Newton et al., 1999a; Newton & Haas, 1988), residues in merlin eggs have been expressed on a lipid weight basis. This is because concentrations were not always recorded on a wet weight basis in the early years when merlin eggs were first analysed. Review of the long-term data on a wet weight basis would therefore result in the exclusion of some data from early years. However, descriptions of long-term trends in residues in the eggs of other species are given on a wet weight basis in the present report. To facilitate comparison of contaminant concentrations between merlin eggs and the eggs of other species, the relationship between lipid weight concentration and wet weight concentration is given in Figure 3.2 for DDE, HEOD and PCBs. The geometric mean wet weight concentrations of these compounds in eggs collected after 1986 are also given with Table 3.2. Residues of HEOD were generally much lower than those of DDE but concentrations of each declined between 1963 and 2003 (Figure 3.1). Linear regression analysis of log10 contaminant concentrations against year indicated that these declines were highly significant (gradient = -0.02, F(1,752)= 70.5 for DDE; gradient = -0.03, F(1,751)= 50.7 for HEOD, both P<0.0001). This decline was also reflected by the comparison of DDE and HEOD concentrations in eggs before and after 1987, the post-1986 geometric mean values for each compound being approximately 55% and 35% of their pre-1987 values for DDE and HEOD respectively (Table 3.2). PCB residues in merlin eggs have fluctuated over the last 30 years, although linear regression analysis suggested that there has been an overall weak decline (gradient = -0.006, F(1,750)= 5.19, P<0.05). High residues that were detected in a relatively small number of eggs in the 1970s influenced the statistical significance of this decline markedly. When data for all eggs collected before 1987 were pooled, the influence of these relatively few high residues on the geometric mean for this period was not pronounced and, consequently, the mean pre-1987 concentration was similar to that for eggs collected after 1986 (Table 3.2). Overall, there appears to have been no real change in PCBs residues during the 1980s and 1990s.

Wildlife and pollution: 2003/2004 Annual report
21
There was no significant change over time in egg mercury concentrations when analysed by regression analysis (gradient = +0.004, F(1,663) = 2.06, P>0.05). Concentrations did differ between pre-1987 and post-1986 eggs and, in contrast to the organochlorine pesticides, residues were significantly higher in the later period (Table 3.2). However, this is probably the result of the way that levels have varied over the years, concentrations being low in the early 1980s, and may also reflect variation between the time periods in the proportion of eggs that came from Shetland, Orkney and other parts of north-west Scotland. Some eggs from these areas have had unusually high mercury residues (Newton et al., 1999a; Shore et al., 2005a), and it is doubtful whether there has been any real overall increase in mercury residues in merlin eggs since 1987. Shell indices for merlin eggs increased significantly over the whole time that analyses has been carried out (F(1,645)= 161.8, P<0.0001, Figure 3.1) and values for post-1986 eggs were significantly higher than those for eggs collected earlier (Table 3.2). This is consistent with what would be expected given that DDE contamination in eggs, a main causal agent of eggshell thinning (Cooke, 1973), declined during this period. The linear regression model fitted to the long-term shell index data predicts a mean egg shell index that is 99.8% of the pre-DDT value, suggesting that merlin eggshell indices have now fully recovered to pre-DDT values.
3.4 Summary In comparison to the eggs of other predatory species that have been examined over the same time period, merlin eggs have contained higher concentrations of the contaminants that have been monitored. For example, the post-1986 geometric mean wet wt concentrations for DDE, HEOD PCB and dry wt concentration for mercury in merlin eggs (Table 3.2) were some 14 to 60 times greater than the equivalent concentrations in golden eagle eggs (Table 4.3). Currently, most merlin eggs are still contaminated with organochlorine pesticides but concentrations have declined significantly since bans on the use of these compounds have been implemented. This decline has been accompanied by an increase in shell indices and a widespread increase in breeding merlins in Britain, although there has been some regional variation in recovery (see Newton et al., (1999a) and references therein). Declines in organochlorine pesticide residues, with concomitant population recoveries, have also been observed in other raptors in Britain (Newton, 1986; Ratcliffe, 1980). Neither PCB nor mercury residues have clearly declined in merlin eggs across Britain as a whole, apart from perhaps an initial decline in PCB concentrations during the 1970s. PCB and mercury residues detected in some eggs have been high both in the past and currently. Whether this simply reflects natural variability in exposure or hotspots of contamination is not clear. However, high mercury residues have consistently been detected in birds from the Shetlands and Orkneys (Newton et al., 1999a), and this would suggest that there is significant regional variation in exposure to this contaminant at least. The PCB and mercury concentrations in the most-contaminated eggs are of a magnitude associated with embryotoxic effects in other species (Hoffman et al., 1996; Thompson, 1996). Whether these contaminants cause embryotoxicity in merlins is unknown. However, if embryotoxicity does occur in some eggs, the scale of these effects has not been sufficient to prevent the population recovery of this species that accompanied the decline in organochlorine pesticide contamination.

Wildlife and pollution: 2003/04 annual report
22
Table 3.1: Concentrations of organochlorines insecticides and total PCBs (all in µg/g wet wt), TEQs (pg/g wet wt), mercury (µg/g dry wt) and the shell indices (SI) for merlin eggs received in 2002. Lipid wt concentrations for organochlorines and PCBs can be calculated by multiplying the wet wt concentrations by the conversion factor (CF). * indicates where shell indices could not be measured because of the poor condition of the eggshell. Congener specific data for PCBs and TEQs are given in Tables 14.5 and 14.6 respectively of the Appendix.
Egg No/
Year Vice-County SI CF pp'-DDE
HEOD Total PCB
PCB TEQ
Hg
Northern Scotland E8211 2003 Tayside 1.23 17.66 2.03 0.09 6.55 6.98 2.08 E8213 2003 Tayside 1.23 13.52 4.74 0.05 4.55 9.70 2.09 E8215 2003 Tayside 1.24 14.53 3.43 0.12 4.15 9.06 1.73 E8221 2001 Grampian 1.11 16.87 1.85 0.15 1.50 2.30 2.57 E8222 2001 Grampian 1.15 11.64 3.91 0.12 4.32 1359 2.56 E8223 2001 Grampian 1.15 19.28 1.71 0.17 5.58 11.6 2.42 E8224 2001 Grampian 1.34 15.09 2.09 0.28 9.15 489 5.40 E8225 2001 Grampian 1.25 13.44 3.77 0.05 3.02 559 1.89 E8226 2002 Grampian 1.34 16.98 2.82 0.05 2.69 5.37 1.77 E8227 2002 Grampian 0.88 21.47 20.4 0.23 4.14 7.61 2.90 E8228 2002 Grampian 1.37 15.63 4.25 0.15 3.05 4.31 2.22 E8230 2002 Grampian 0.97 13.47 5.29 0.08 3.05 5.72 2.38 E8231 2002 Grampian 1.14 16.52 3.10 0.04 4.68 7.93 2.75 E8232 2003 Grampian 1.12 20.83 3.58 0.10 3.56 6.92 3.14 E8233 2003 Grampian 1.1 10.41 14.9 0.27 6.69 7.60 2.88 E8234 2003 Grampian 1.35 19.55 2.68 0.05 2.72 5.16 3.66 Southern Scotland E8143 2003 Borders * 13.87 1.78 0.04 4.68 4.98 2.17 E8144 2003 Borders 1.51 16.47 2.00 0.18 2.29 3.85 1.37 E8145 2003 Borders * 16.16 3.18 0.08 2.30 4.55 2.57 E8146 2003 Borders 1.25 13.44 9.90 0.09 4.92 9.59 2.07 E8149 2003 Borders 1.35 15.84 3.06 0.04 4.69 11.4 3.46 Western Isles E8150 2003 Rum * 18.72 0.66 0.03 2.62 4.69 8.04
North East England E8139 2003 Yorkshire 1.32 16.76 2.33 0.09 2.48 5.52 1.86 E8140 2003 Yorkshire 1.39 14.25 1.86 0.10 3.03 5.88 1.66 E8142 2003 Yorkshire 1.29 20.28 1.03 0.07 3.06 5.71 2.48
ND is not detected
Wildlife and pollution: 2003/2004 Annual report
23
Table 3.2: Geometric mean pollutant levels and arithmetic mean shell indices for merlin eggs from across Britain for two different periods. Organochlorine levels are expressed as µg/g lipid weight and mercury levels as µg/g dry weight. The number of clutches represented at one egg per clutch is indicated by n. Statistical significance of the difference between pre 1987 and post 1986 concentrations (student t tests on log data) is indicated as *P<0.05, **P<0.01, ***P<0.001
pre 1987 post 1986
compound n geometric range of one n geometric range of one %
mean geometric SE mean2 geometric SE change
DDE 261 92.64 86.53 - 99.19 493 51.39 49.18 - 53.70 -44.53 *** HEOD 261 6.09 5.71 - 6.51 493 2.12 1.93 - 2.33 -65.19 *** PCB 259 58.99 55.01 - 63.21 493 54.85 52.29 - 57.54 -7.01 ns Hg 176 1.75 1.57 - 1.95 488 2.69 2.62 - 2.77 53.96 ***
Shell index1 283 1.09 1.08 ± 1.09 678 1.16 1.16 - 1.17 6.82 *** 1 arithmetic mean and standard error 2 post-1986 geometric means expressed on a wet weight basis for DDE, HEOD and PCBs are 3.05, 0.150 and 3.20 µg/g wet wt, respectively
Wildlife and pollution: 2003/04 annual report
24
1965 1975 1985 1995 20050
50
100
150
200
250DDE
year
µg/g
in
lipid
1965 1975 1985 1995 20050
20
40
60
80HEOD
year
µg/g
in
lipid
1965 1975 1985 1985 20050
50
100
150
200total PCBs
year
µg/g
in
lipid
1965 1975 1985 1995 20050
2
4
6Hg
year
µg/g
dry
wei
ght
1965 1975 1985 1995 20050.6
0.8
1.0
1.2
1.4
1.6
1.8
mean pre-DDT value
year
shel
l ind
ex
Figure 3.1. Long-term trends in pollutant residues (1967-2002) and shell indices (1970-2003) in merlin eggs. Data for contaminant concentrations are three-year moving geometric means with one geometric standard error on either side. Data for shell indices are values for individual eggs and the linear regression is the value for individual shell indices against year.
Wildlife and pollution: 2003/2004 Annual report
25
-1 0 1 2 3-2
-1
0
1
2
3log ww DDE = -1.129 + 0.9413 log lw DDEr2 = 0.857, F(1,673) = 4025, P<0.0001
log lipid weight (lw) DDE concentration (μg/g)
log
wet
wei
ght (
ww
) DD
Eco
ncen
trat
ion
(μg/
g)
-1 0 1 2 3-2
-1
0
1
2log ww HEOD = -1.179 + 0.9251 log lw HEODr2 = 0.844, F(1,647) = 3497, P<0.0001
log lipid weight (lw) HEOD concentration(μg/g)
log
wet
wei
ght (
ww
) H
EOD
conc
entr
atio
n (μ
g/g)
-1 0 1 2 3 4-2
-1
0
1
2
3log ww PCB = -1.104 + 0.9283 log lw PCBr2 = 0.790, F(1,673) = 2531, P<0.0001
log lipid weight (lw) PCB concentration (μg/g)
log
wet
wei
ght (
ww
) PC
Bco
ncen
trat
ion
(μg/
g)
Figure 3.2. Relationship between residues expressed on a lipid weight and a wet weight basis for DDE, HEOD and PCBs in merlin eggs collected between 1967 and 2003.

Wildlife and pollution: 2003/04 annual report
26
4 Organochlorines and mercury in golden eagle (Aquila chrysaetos) eggs
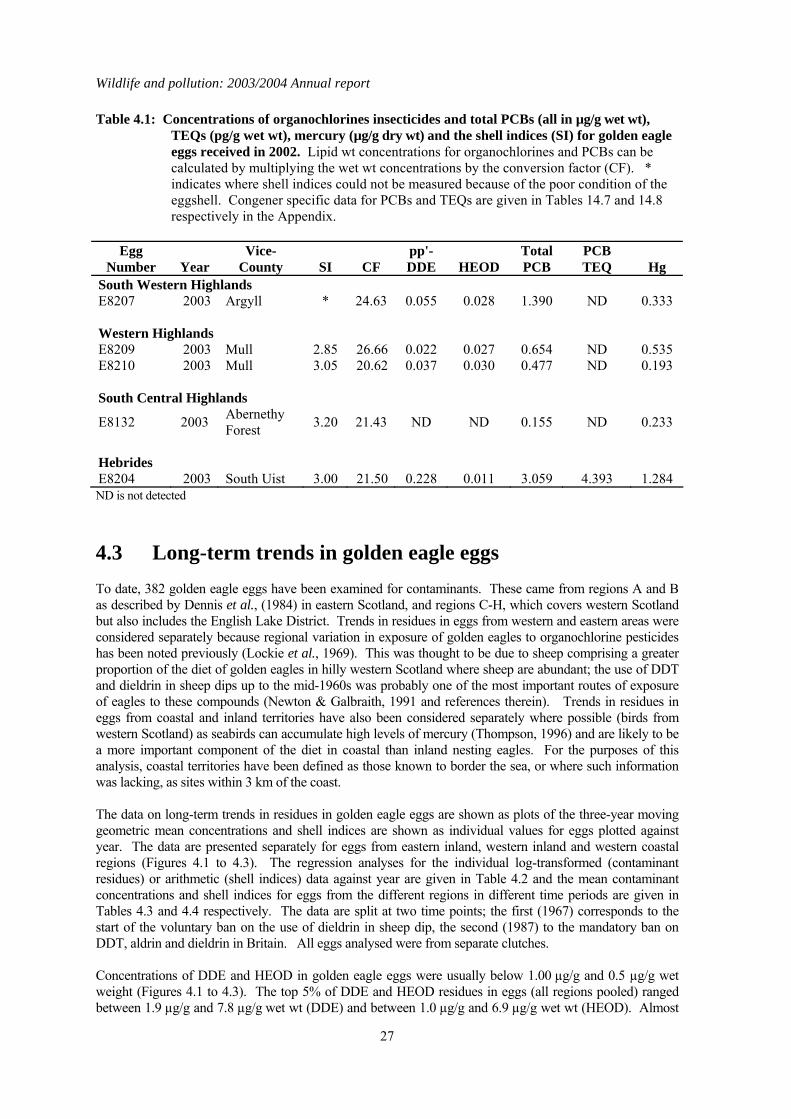
4.1 Introduction The findings from the long-term monitoring of contaminants in golden eagle eggs carried out as part of the PBMS have been reported by Newton & Galbraith, (1991) and were recently summarised as part of the series of reports for the PBMS (Shore et al., 2005a). Eggs from five clutches were received in 2003, and four were from coastal areas, (Argyll, Mull and South Uist). The results of the chemical analyses are given in Table 4.1.
4.2 Results for eggs received in 2003 The DDE, HEOD, total PCB and Hg concentrations in the eggs received in 2003 were generally low and below concentrations thought to impair reproduction (AMAP, 1998; Blus, 1996; Hoffman et al., 1996; Peakall, 1996; Thompson, 1996). This is the second year in which TEQ concentrations have been reported for golden eagle eggs. Four of the five eggs had non-detected TEQ concentrations. The only egg that had a detectable TEQ value was egg E8204 (Table 4.1) from a nest in South Uist. Neither the total PCB concentration nor the TEQ concentrations were high in this egg and the TEQ concentration was within the range for NOEL concentrations for various experimental and wild bird species (AMAP, 1998).
Wildlife and pollution: 2003/2004 Annual report
27
Table 4.1: Concentrations of organochlorines insecticides and total PCBs (all in µg/g wet wt), TEQs (pg/g wet wt), mercury (µg/g dry wt) and the shell indices (SI) for golden eagle eggs received in 2002. Lipid wt concentrations for organochlorines and PCBs can be calculated by multiplying the wet wt concentrations by the conversion factor (CF). * indicates where shell indices could not be measured because of the poor condition of the eggshell. Congener specific data for PCBs and TEQs are given in Tables 14.7 and 14.8 respectively in the Appendix.
Egg
Number Year Vice-
County SI CF pp'-DDE HEOD
Total PCB
PCB TEQ Hg
South Western Highlands E8207 2003 Argyll * 24.63 0.055 0.028 1.390 ND 0.333 Western Highlands E8209 2003 Mull 2.85 26.66 0.022 0.027 0.654 ND 0.535 E8210 2003 Mull 3.05 20.62 0.037 0.030 0.477 ND 0.193 South Central Highlands
E8132 2003 Abernethy Forest 3.20 21.43 ND ND 0.155 ND 0.233
Hebrides E8204 2003 South Uist 3.00 21.50 0.228 0.011 3.059 4.393 1.284 ND is not detected
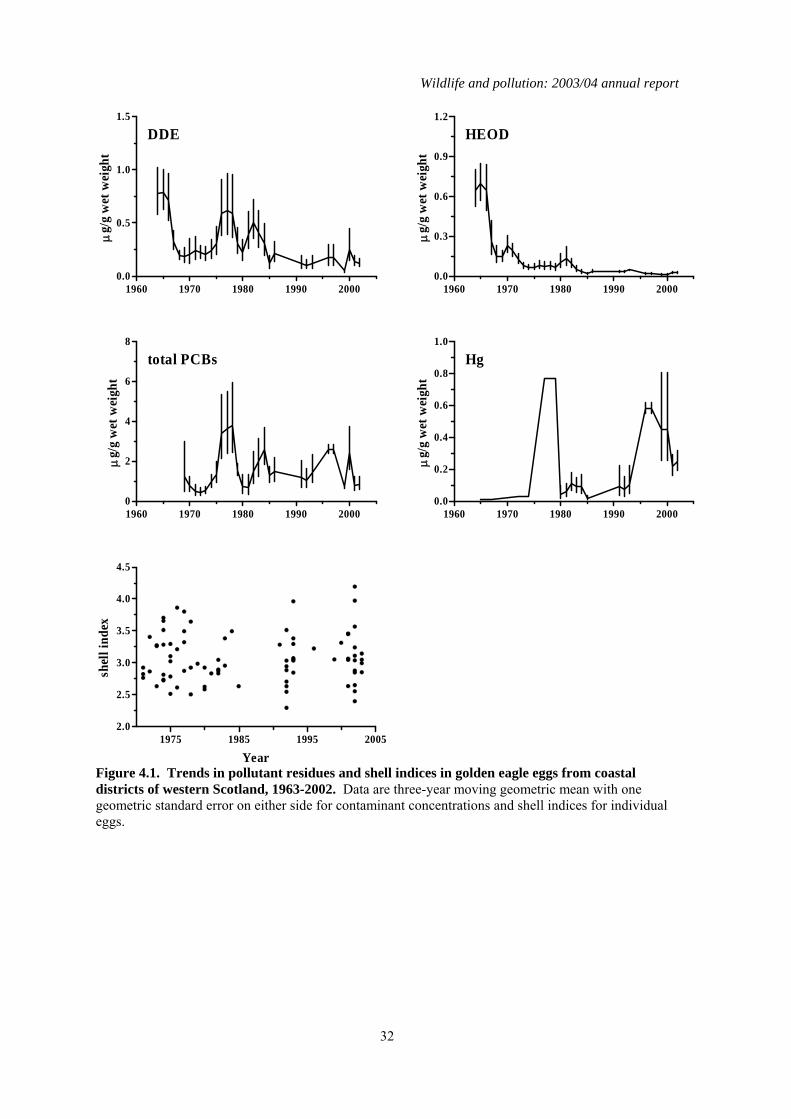
4.3 Long-term trends in golden eagle eggs To date, 382 golden eagle eggs have been examined for contaminants. These came from regions A and B as described by Dennis et al., (1984) in eastern Scotland, and regions C-H, which covers western Scotland but also includes the English Lake District. Trends in residues in eggs from western and eastern areas were considered separately because regional variation in exposure of golden eagles to organochlorine pesticides has been noted previously (Lockie et al., 1969). This was thought to be due to sheep comprising a greater proportion of the diet of golden eagles in hilly western Scotland where sheep are abundant; the use of DDT and dieldrin in sheep dips up to the mid-1960s was probably one of the most important routes of exposure of eagles to these compounds (Newton & Galbraith, 1991 and references therein). Trends in residues in eggs from coastal and inland territories have also been considered separately where possible (birds from western Scotland) as seabirds can accumulate high levels of mercury (Thompson, 1996) and are likely to be a more important component of the diet in coastal than inland nesting eagles. For the purposes of this analysis, coastal territories have been defined as those known to border the sea, or where such information was lacking, as sites within 3 km of the coast. The data on long-term trends in residues in golden eagle eggs are shown as plots of the three-year moving geometric mean concentrations and shell indices are shown as individual values for eggs plotted against year. The data are presented separately for eggs from eastern inland, western inland and western coastal regions (Figures 4.1 to 4.3). The regression analyses for the individual log-transformed (contaminant residues) or arithmetic (shell indices) data against year are given in Table 4.2 and the mean contaminant concentrations and shell indices for eggs from the different regions in different time periods are given in Tables 4.3 and 4.4 respectively. The data are split at two time points; the first (1967) corresponds to the start of the voluntary ban on the use of dieldrin in sheep dip, the second (1987) to the mandatory ban on DDT, aldrin and dieldrin in Britain. All eggs analysed were from separate clutches. Concentrations of DDE and HEOD in golden eagle eggs were usually below 1.00 µg/g and 0.5 µg/g wet weight (Figures 4.1 to 4.3). The top 5% of DDE and HEOD residues in eggs (all regions pooled) ranged between 1.9 µg/g and 7.8 µg/g wet wt (DDE) and between 1.0 µg/g and 6.9 µg/g wet wt (HEOD). Almost
Wildlife and pollution: 2003/04 annual report
28
all these were in eggs collected before 1983 and residues of both compounds have declined significantly in all three regions during the period in which monitoring has been carried out (Tables 4.2, 4.3 and Figures 4.1 to 4.3). This decline is associated with the ban on the agricultural use (including use in sheep dip) of these chemicals. Current concentrations in golden eagle eggs are low and unlikely to be of toxicological significance. DDE is a major causative agent of eggshell thinning and the decline in DDE levels in eastern Scotland coincided with a significant improvement in eggshell indices in that region (Table 4.2 and Figure 4.3). However, it is doubtful DDE was a significant factor in this instance. This is because DDE levels in eagle eggs were generally too low to have caused marked eggshell thinning and breakage. Furthermore, DDE levels similarly declined in golden eagle eggs in the other Scottish regions (Tables 4.2 and 4.4) but this was not associated with any significant increase in eggshell index. The underlying cause(s) for the increase in shell indices in birds from eastern Scotland is uncertain. Currently, there is no significant difference in golden eagle eggshell indices between the three regions (Table 4.4). Total PCBs have only been monitored in golden eagle eggs since 1970 and changes in concentrations over time have not shown the clear pattern of decline seen for the organochlorine pesticides. The only significant long-term decline has been in eggs for birds from inland western Scotland (Table 4.2). PCB concentrations have generally been higher in the eggs of coastal than inland birds (Figures 4.1 to 4.3 and Table 4.3). Total PCB concentrations of between 8 and 25 µg/g wet weight have been associated with bill deformities and decreased hatching success in a range of avian species, including some raptors (Hoffman et al., 1996). Approximately 6% (n=17) of all the golden eagle eggs analysed had concentrations within or exceeding this range. Almost all of these eggs were from coastal-nesting birds. Whether golden eagles are as sensitive to PCBs as species that have been tested is unknown and but it is possible that the relatively high PCBs residues detected in some eggs may have contributed to their failure. As with the organochlorines, mercury concentrations in eggs were generally higher in eggs from the west coast than elsewhere and levels in eggs from inland birds were higher in the west than the east (Table 4.3). There were no significant long-term changes in mercury residues in western coastal and eastern inland eggs. Mercury concentrations over the whole of the monitoring period have actually risen significantly in eggs from western inland areas (Tables 4.2), although average residue levels have generally fallen in recent years (Figure 4.2). The magnitude of residues in eggs from any region was relatively low and below that associated with embryotoxic effects. The overall greater level of contamination in birds from western compared with eastern Scotland and in coastal compared with inland birds is most likely to be explained by regional variations in diet (Newton & Galbraith, 1991). The diet of golden eagles in eastern areas is generally uncontaminated whereas birds from western areas take a wider range of prey, including seabirds that often contain high concentrations of organochlorines and mercury. Although breeding success in golden eagles is poorer in western than eastern Scotland, this is more likely to be due to the availability and quality of food supply rather than any direct effect of contaminants (Newton & Galbraith, 1991), although it is possible that PCBs may have contributed to the failure of some eggs.
4.4 Summary A total of 381 unhatched golden eagle eggs, each from a different clutch, were analysed between 1963 and 2003. Concentrations of organochlorine pesticides, PCBs and mercury varied regionally and were higher in western than eastern areas, and generally greater in coastal than inland birds in the west. These regional differences most probably reflect variation in the degree of contamination in prey. Concentrations of organochlorine pesticides have declined significantly during the monitoring period, whereas there has been no overall pattern of change in PCB and mercury concentrations or shell indices for eagles from throughout Scotland. The current levels of contamination in eagle eggs are generally unlikely to be directly embryotoxic although PCB concentrations in some eggs may result in adverse effects.

Wildlife and pollution: 2003/2004 Annual report
29
Table 4.2: Trends in pollutant levels in golden eagle eggs as revealed by regression analyses of
individual (log10) residue levels against year. Data are broken down into three geographical regions . N=number of clutches represented at one egg per clutch, b=regression coefficient slope and the significance of the linear regression analysis is indicated as:*P<0.05, **P<0.01, ***P<0.001.
DDE HEOD PCB Hg Shell Index N b N b N b N b N b
W. Scotland coastal 136 -0.0192 *** 136 -0.0329 *** 106 -0.0036 ns 58 0.0270 ns 82 0.0013 ns
W. Scotland
inland 184 -0.0237 *** 184 -0.0300 *** 133 -0.0131 * 83 0.0452 ** 107 -0.0001 ns
E. Scotland 61 -0.0298 *** 61 -0.0236 ** 47 -0.0186 ns 36 -0.0140 ns 36 0.0131 **
All areas 381 -0.0241 *** 381 -0.0315 *** 289 -0.0114 * 177 0.0255 * 225 0.0030 ns

Wildlife and pollution: 2003/04 annual report
30
Table 4.3: Geometric mean (GM) pollutant levels for golden eagle eggs from various regions of Britain in three different periods. DDE, HEOD and PCB concentrations are expressed in µg/g wet weight, mercury in µg/g dry weight. The number of clutches represented at one egg per clutch is indicated by n. The significance of differences in contaminant levels between regions within time periods is indicated by the F statistic and its associated probability value. The significance of differences between residue levels in eggs collected after 1986 and those in eggs collected in either 1963-1966 or 1967-1986 (as tested by Tukey pairwise comparison post-hoc tests following ANOVA) is indicated by: *P<0.05, **P<0.01, ***P<0.001. Statistical analyses were carried out on log transformed data.
1963-1966 1967-1986 Post 1986
n GM Range of one geometric SE n GM Range of one
geometric SE n GM Range of one geometric SE
DDE W. Scotland coastal 19 0.792 0.626 - 1.003 *** 77 0.302 0.256 - 0.355 ** 40 0.112 0.090 - 0.139W. Scotland inland 32 0.245 0.188 - 0.319 *** 92 0.123 0.110 - 0.138 *** 60 0.044 0.036 - 0.052E. Scotland 3 0.093 0.043 - 0.199 ns 32 0.054 0.043 - 0.067 *** 26 0.011 0.008 - 0.014ANOVA F2,51=6.15; P=0.004 F2,198=16.27; P<0.001 F2,123=22.72; P<0.001
HEOD W. Scotland coastal 19 0.695 0.570 - 0.847 *** 77 0.081 0.070 - 0.095 ** 40 0.030 0.026 - 0.036W. Scotland inland 32 0.416 0.331 - 0.524 *** 92 0.060 0.053 - 0.066 ** 60 0.029 0.024 - 0.034E. Scotland 3 0.058 0.034 - 0.099 ns 32 0.023 0.019 - 0.026 ns 23 0.013 0.009 - 0.018ANOVA F2,51=6.14; P=0.004 F2,198=10.28; P<0.001 F2,123=3.76; P=0.026
PCBs W. Scotland coastal - - - 66 1.365 1.112 - 1.678 ns 40 0.991 0.771 - 1.273W. Scotland inland - - - 73 0.961 0.841 - 1.098 ** 60 0.434 0.355 - 0.530E. Scotland - - - 24 0.258 0.174 - 0.383 ns 26 0.135 0.094 - 0.195ANOVA F2,160=10.91; P<0.001 F2,123=11.76; P<0.001
mercury W. Scotland coastal 1 0.010 - 21 0.083 0.055 - 0.125 ns 36 0.145 0.096 - 0.217W. Scotland inland - - - 23 0.014 0.011 - 0.017 * 60 0.048 0.034 0.066E. Scotland - - - 11 0.011 0.010 - 0.013 ns 25 0.008 0.005 - 0.013ANOVA F2,52=12.12; P<0.001 F2,118=9.94; P<0.001
Sum regions DDE 54 0.351 0.288 - 0.428 *** 201 0.152 0.138 - 0.168 *** 126 0.044 0.038 - 0.051HEOD 54 0.447 0.376 - 0.530 *** 201 0.058 0.053 - 0.063 *** 123 0.025 0.022 - 0.028PCB - - - 163 0.913 0.806 - 1.034 *** 126 0.426 0.361 - 0.502Hg 1 0.010 - 55 0.026 0.021 - 0.033 ns 121 0.046 0.037 - 0.059

Wildlife and pollution: 2003/2004 Annual report
31
Table 4.4: Arithmetic mean shell indices for golden eagle eggs from various regions of Britain in
two different periods. The number of clutches represented at one egg per clutch is indicated by n. The significance of differences in eggshell indices between regions within time periods is indicated by the F statistic and its associated probability value. The significance of differences between eggshell indices of eggs collected after 1986 and those of eggs collected in either 1963-1966 or 1967-1986 (as tested by Tukey pairwise comparison post-hoc tests following ANOVA) is indicated by: *P<0.05, **P<0.01, ***P<0.001.
1963-1966 1967-1986 Post 1986
n mean Range for one SE n mean Range for
one SE n mean Range for one SE
W. Scotland coastal - - - 43 3.052 2.995 - 3.109 ns 39 3.079 3.013 - 3.145W. Scotland inland 52 3.070 3.034 - 3.105 ns 55 3.090 3.049 - 3.131E. Scotland 16 2.969 2.908 - 3.031 ** 20 3.226 3.171 - 3.281ANOVA F2,108=0.67; P=0.513 F2,111=1.46; P=0.237 All regions - - - 111 3.048 3.019 - 3.077 ns 114 3.110 3.078 - 3.142
Wildlife and pollution: 2003/04 annual report
32
1960 1970 1980 1990 20000.0
0.5
1.0
1.5
DDE
μg/
g w
et w
eigh
t
1960 1970 1980 1990 20000.0
0.3
0.6
0.9
1.2
HEOD
μg/
g w
et w
eigh
t
1960 1970 1980 1990 20000
2
4
6
8
total PCBs
μg/
g w
et w
eigh
t
1960 1970 1980 1990 20000.0
0.2
0.4
0.6
0.8
1.0
Hg
μg/
g w
et w
eigh
t
1975 1985 1995 20052.0
2.5
3.0
3.5
4.0
4.5
Year
shel
l ind
ex
Figure 4.1. Trends in pollutant residues and shell indices in golden eagle eggs from coastal districts of western Scotland, 1963-2002. Data are three-year moving geometric mean with one geometric standard error on either side for contaminant concentrations and shell indices for individual eggs.
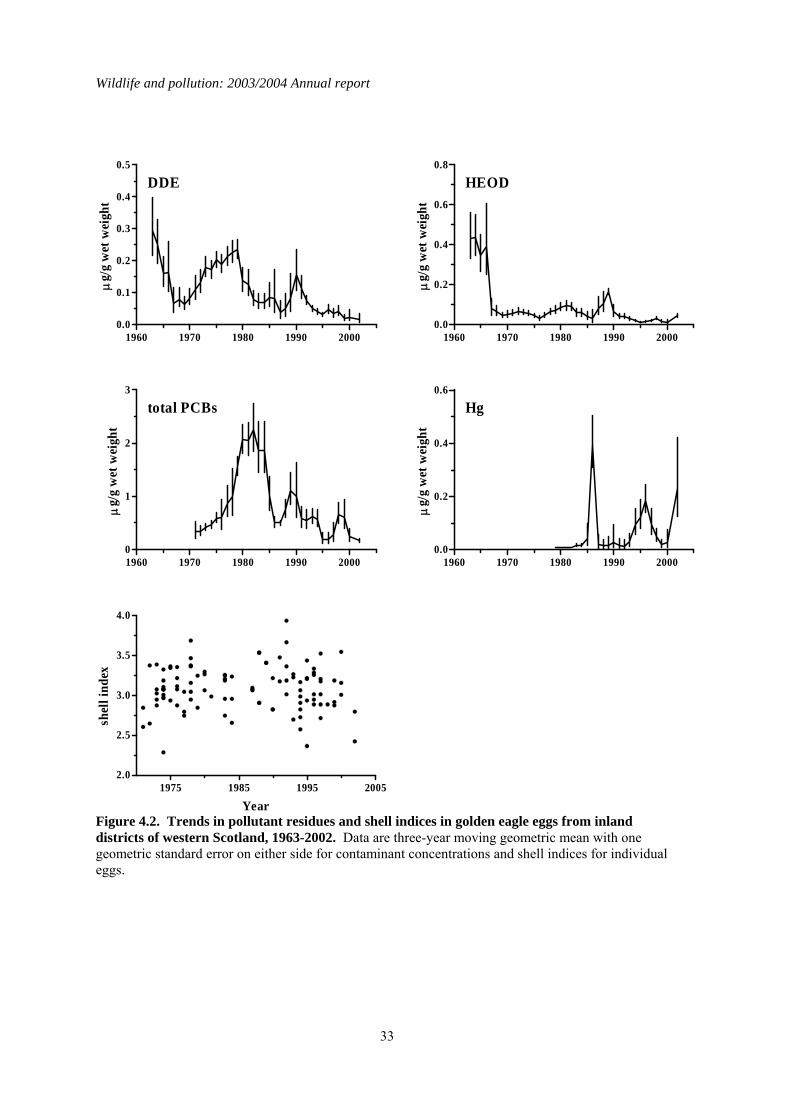
Wildlife and pollution: 2003/2004 Annual report
33
1960 1970 1980 1990 20000.0
0.1
0.2
0.3
0.4
0.5
DDE
μg/
g w
et w
eigh
t
1960 1970 1980 1990 20000.0
0.2
0.4
0.6
0.8
HEOD
μg/
g w
et w
eigh
t
1960 1970 1980 1990 20000
1
2
3
total PCBs
μg/
g w
et w
eigh
t
1960 1970 1980 1990 20000.0
0.2
0.4
0.6
Hgμ
g/g
wet
wei
ght
1975 1985 1995 20052.0
2.5
3.0
3.5
4.0
Year
shel
l ind
ex
Figure 4.2. Trends in pollutant residues and shell indices in golden eagle eggs from inland districts of western Scotland, 1963-2002. Data are three-year moving geometric mean with one geometric standard error on either side for contaminant concentrations and shell indices for individual eggs.
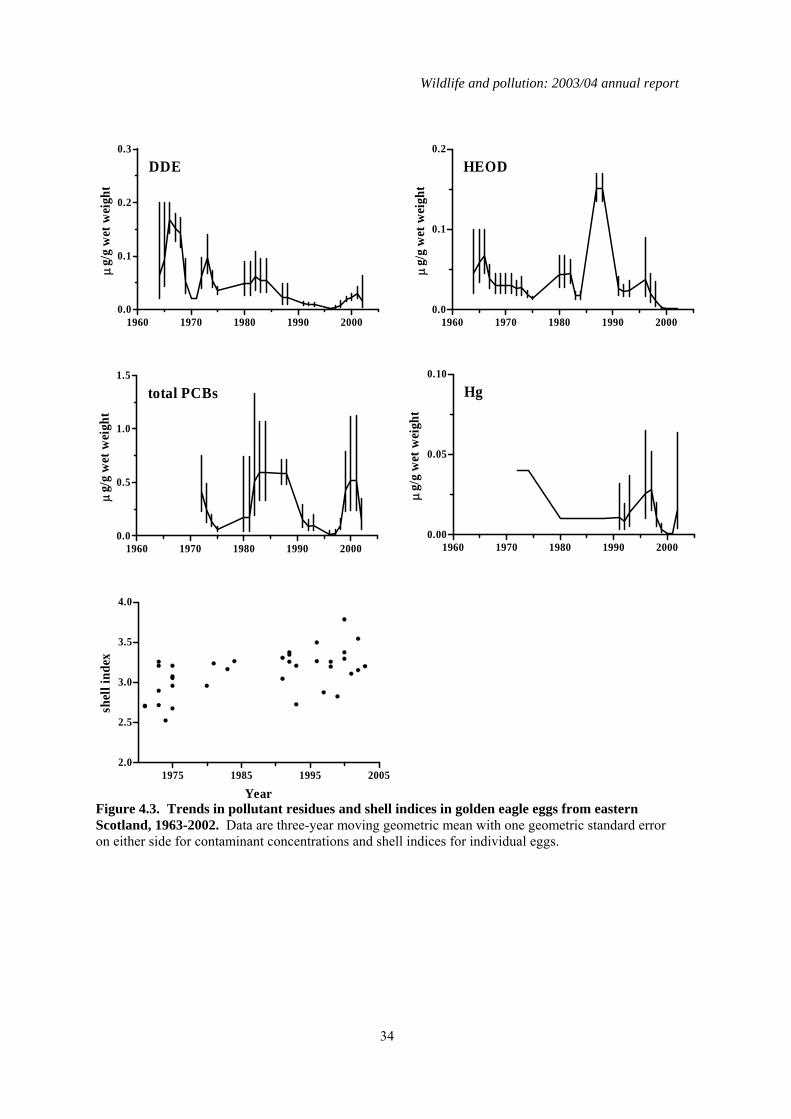
Wildlife and pollution: 2003/04 annual report
34
1960 1970 1980 1990 20000.0
0.1
0.2
0.3
DDE
μg/
g w
et w
eigh
t
1960 1970 1980 1990 20000.0
0.1
0.2
HEOD
μg/
g w
et w
eigh
t
1960 1970 1980 1990 20000.0
0.5
1.0
1.5
total PCBs
μg/
g w
et w
eigh
t
1960 1970 1980 1990 20000.00
0.05
0.10
Hgμ
g/g
wet
wei
ght
1975 1985 1995 20052.0
2.5
3.0
3.5
4.0
Year
shel
l ind
ex
Figure 4.3. Trends in pollutant residues and shell indices in golden eagle eggs from eastern Scotland, 1963-2002. Data are three-year moving geometric mean with one geometric standard error on either side for contaminant concentrations and shell indices for individual eggs.

Wildlife and pollution: 2003/2004 Annual report
35
5 Organochlorines and mercury in northern gannet (Morus bassanus) eggs
5.1 Introduction The findings from all gannet eggs examined up to 1988 were published by (Newton et al., 1990) and long-term trends in contaminant levels were summarised as part of the series of reports for the PBMS by Shore et al., (2005a). Gannet eggs are typically collected during visits to colonies made during laying or the early incubation period, and about ten eggs are taken from each colony. Collections are made approximately every two years. No gannet eggs were received for analysis in 2003.
5.2 Long-term trends in gannet eggs The significance of long-term trends in contaminant residues are given for the seven colonies for which time series data are available (Table 5.1). DDE levels declined significantly in all but one colony. The exception was at Little Skellig from where eggs were collected in two years only (1973 and 1988). DDE concentrations in eggs did, in fact, decline between the two collection periods (geometric mean concentrations in eggs in 1973 and 1988 were 1.247 and 0.568 µg/g wet weight, respectively), but the difference was not statistically significant. There was also a general downward trend in HEOD concentrations at most colonies but it was only statistically significant at Ailsa Craig and Bass Rock. In contrast to the other colonies, HEOD concentrations significantly increased at Grassholm but eggs were only sampled in two years and are not necessarily indicative of long-term change. The long-term declines in organochlorine pesticide concentrations in gannet eggs may reflect a reduction of inputs of these compounds into seawater following restrictions and bans on their use. Declines in concentrations of DDE and HEOD in gannet eggs have also been observed elsewhere (Chapdelaine et al., 1987; Elliott et al., 1988; Fimreite et al., 1982). Long-term trends in PCB and mercury concentrations were much more variable than the organochlorine pesticides and showed no overall consistent pattern. Concentrations of both contaminants increased at some colonies but decreased at others; these trends were only sometimes statistically significant (Table 5.1). The direction of change in concentrations of both contaminants was usually the same at any one particular colony. The long-term trends that are most meaningful are the ones from Ailsa Craig (Figure 5.1) and Bass Rock (Figure 5.2) because these colonies that have been sampled for the longest time period and the most frequently. The long-term decline in DDE and HEOD but more variable nature of changes in PCBs and Hg is apparent at these two sites. Eggshell indices have not changed significantly at Bass Rock (F(1,197)=0.22, P>0.05) over the whole monitoring period but have increased significantly at Ailsa Craig (F(1,156)=12.44, P<0.001). This was associated with the decline in contaminant levels and eggshell thinning in gannets has been largely attributed to DDE (Newton et al., 1990).
5.3 Comparisons of colonies Examination of the trends for individual compounds in eggs from each of the four colonies indicated
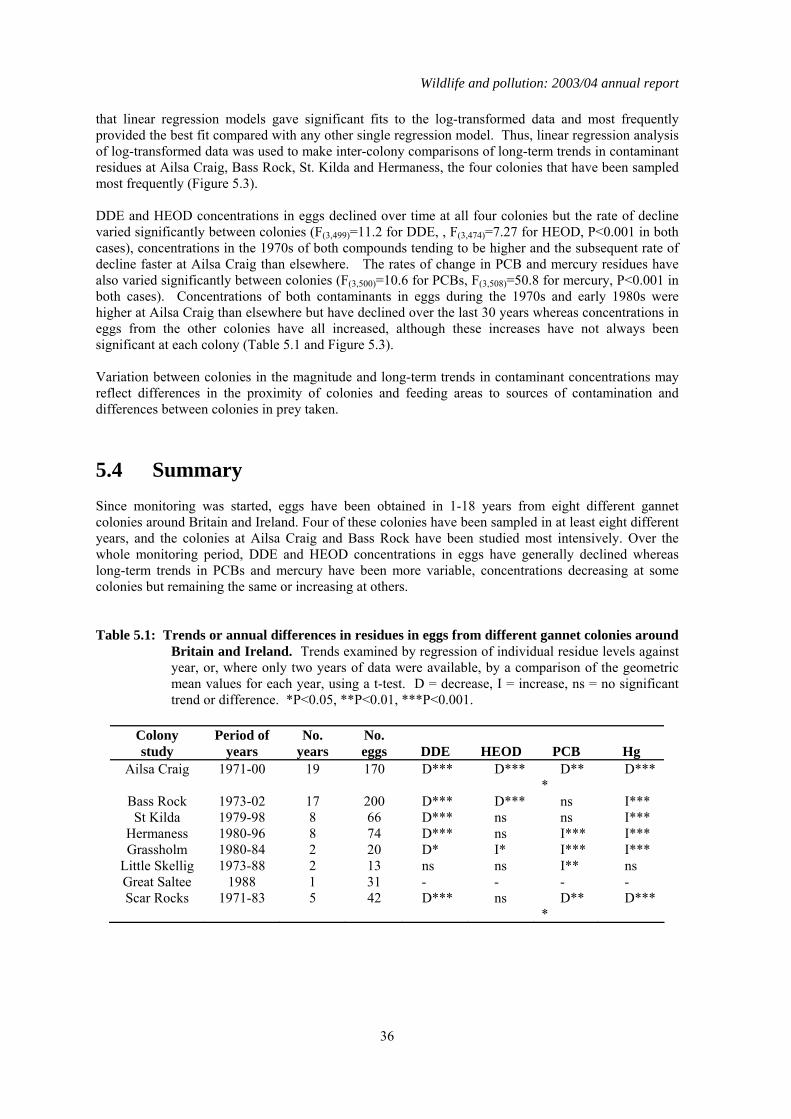
Wildlife and pollution: 2003/04 annual report
36
that linear regression models gave significant fits to the log-transformed data and most frequently provided the best fit compared with any other single regression model. Thus, linear regression analysis of log-transformed data was used to make inter-colony comparisons of long-term trends in contaminant residues at Ailsa Craig, Bass Rock, St. Kilda and Hermaness, the four colonies that have been sampled most frequently (Figure 5.3). DDE and HEOD concentrations in eggs declined over time at all four colonies but the rate of decline varied significantly between colonies (F(3,499)=11.2 for DDE, , F(3,474)=7.27 for HEOD, P<0.001 in both cases), concentrations in the 1970s of both compounds tending to be higher and the subsequent rate of decline faster at Ailsa Craig than elsewhere. The rates of change in PCB and mercury residues have also varied significantly between colonies (F(3,500)=10.6 for PCBs, F(3,508)=50.8 for mercury, P<0.001 in both cases). Concentrations of both contaminants in eggs during the 1970s and early 1980s were higher at Ailsa Craig than elsewhere but have declined over the last 30 years whereas concentrations in eggs from the other colonies have all increased, although these increases have not always been significant at each colony (Table 5.1 and Figure 5.3). Variation between colonies in the magnitude and long-term trends in contaminant concentrations may reflect differences in the proximity of colonies and feeding areas to sources of contamination and differences between colonies in prey taken.
5.4 Summary Since monitoring was started, eggs have been obtained in 1-18 years from eight different gannet colonies around Britain and Ireland. Four of these colonies have been sampled in at least eight different years, and the colonies at Ailsa Craig and Bass Rock have been studied most intensively. Over the whole monitoring period, DDE and HEOD concentrations in eggs have generally declined whereas long-term trends in PCBs and mercury have been more variable, concentrations decreasing at some colonies but remaining the same or increasing at others. Table 5.1: Trends or annual differences in residues in eggs from different gannet colonies around
Britain and Ireland. Trends examined by regression of individual residue levels against year, or, where only two years of data were available, by a comparison of the geometric mean values for each year, using a t-test. D = decrease, I = increase, ns = no significant trend or difference. *P<0.05, **P<0.01, ***P<0.001.
Colony Period of No. No. study years years eggs DDE HEOD PCB Hg
Ailsa Craig 1971-00 19 170 D*** D*** D***
D***
Bass Rock 1973-02 17 200 D*** D*** ns I*** St Kilda 1979-98 8 66 D*** ns ns I***
Hermaness 1980-96 8 74 D*** ns I*** I*** Grassholm 1980-84 2 20 D* I* I*** I***
Little Skellig 1973-88 2 13 ns ns I** ns Great Saltee 1988 1 31 - - - - Scar Rocks 1971-83 5 42 D*** ns D**
* D***
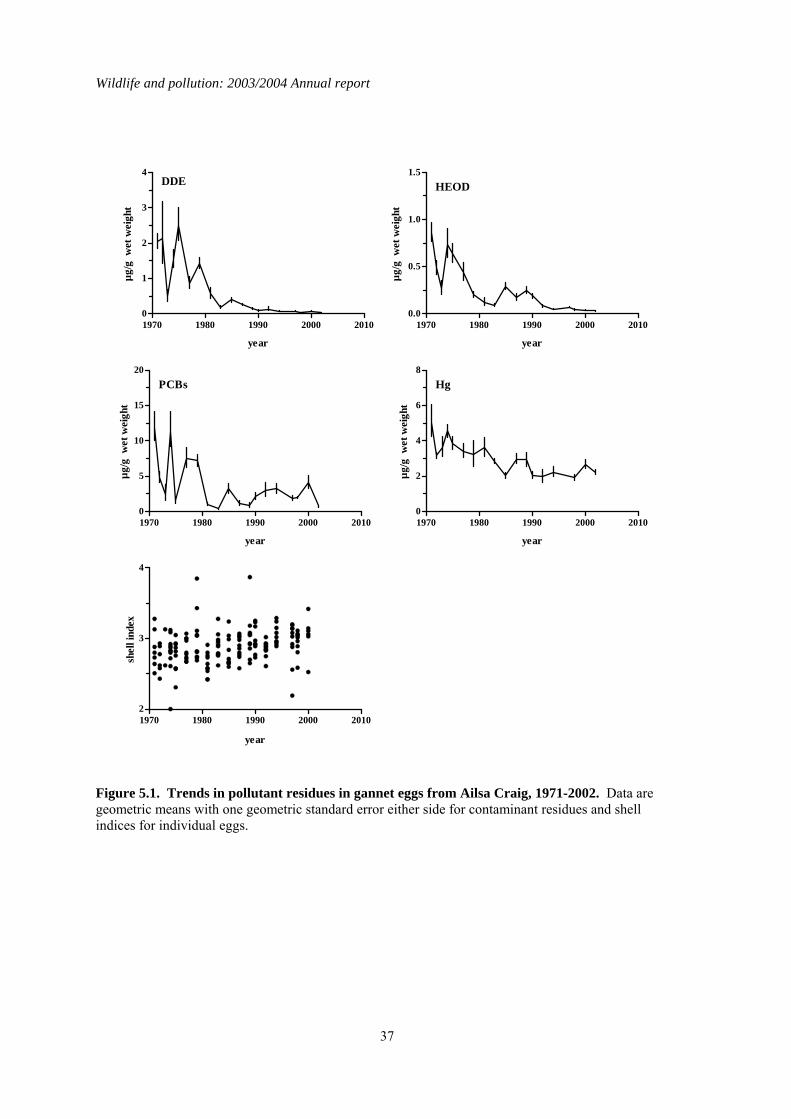
Wildlife and pollution: 2003/2004 Annual report
37
1970 1980 1990 2000 20100
1
2
3
4DDE
year
µg/g
wet
wei
ght
1970 1980 1990 2000 20100.0
0.5
1.0
1.5HEOD
year
µg/g
wet
wei
ght
1970 1980 1990 2000 20100
5
10
15
20PCBs
year
µg/g
wet
wei
ght
1970 1980 1990 2000 20100
2
4
6
8Hg
year
µg/g
wet
wei
ght
1970 1980 1990 2000 20102
3
4
year
shel
l ind
ex
Figure 5.1. Trends in pollutant residues in gannet eggs from Ailsa Craig, 1971-2002. Data are geometric means with one geometric standard error either side for contaminant residues and shell indices for individual eggs.
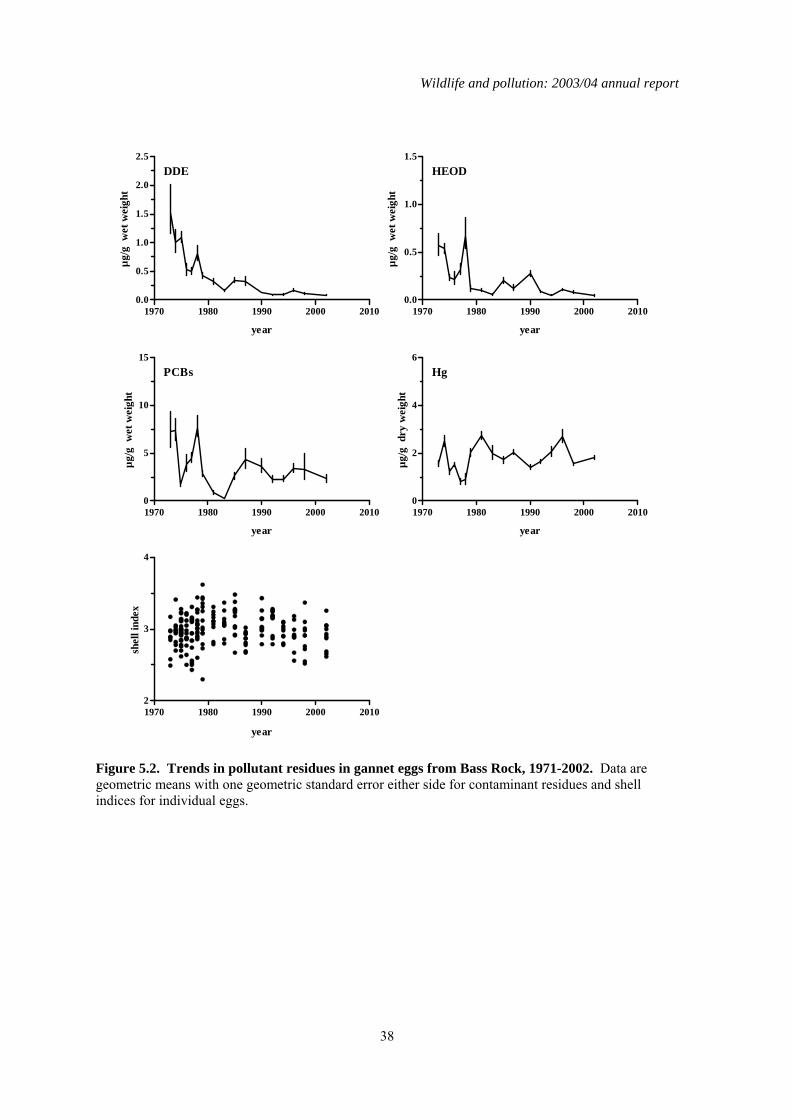
Wildlife and pollution: 2003/04 annual report
38
1970 1980 1990 2000 20100.0
0.5
1.0
1.5
2.0
2.5DDE
year
µg/g
wet
wei
ght
1970 1980 1990 2000 20100.0
0.5
1.0
1.5HEOD
year
µg/g
wet
wei
ght
1970 1980 1990 2000 20100
5
10
15PCBs
year
µg/g
wet
wei
ght
1970 1980 1990 2000 20100
2
4
6Hg
year
µg/g
dry
wei
ght
1970 1980 1990 2000 20102
3
4
year
shel
l ind
ex
Figure 5.2. Trends in pollutant residues in gannet eggs from Bass Rock, 1971-2002. Data are geometric means with one geometric standard error either side for contaminant residues and shell indices for individual eggs.
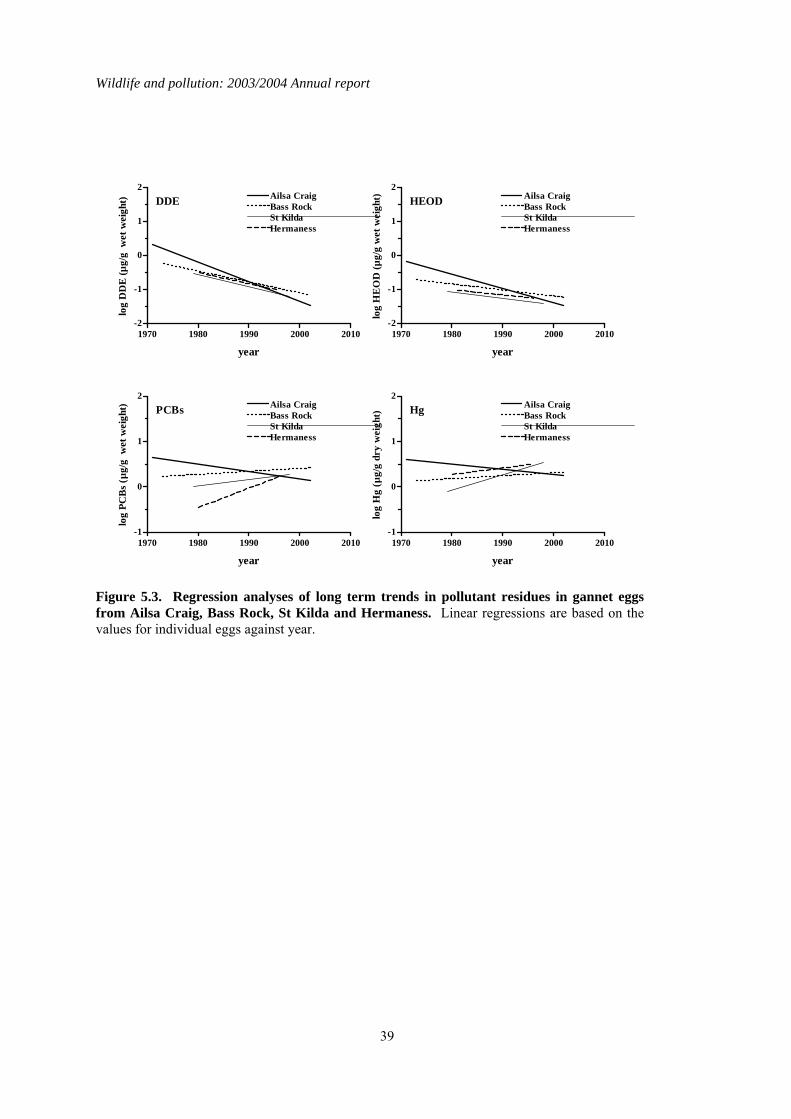
Wildlife and pollution: 2003/2004 Annual report
39
1970 1980 1990 2000 2010-2
-1
0
1
2DDE Ailsa Craig
Bass RockSt KildaHermaness
year
log
DD
E (µ
g/g
wet
wei
ght)
1970 1980 1990 2000 2010-2
-1
0
1
2HEOD Ailsa Craig
Bass RockSt KildaHermaness
year
log
HE
OD
(µg/
g w
et w
eigh
t)
1970 1980 1990 2000 2010-1
0
1
2PCBs Ailsa Craig
Bass RockSt KildaHermaness
year
log
PCB
s (µg
/g w
et w
eigh
t)
1970 1980 1990 2000 2010-1
0
1
2Hg Ailsa Craig
Bass RockSt KildaHermaness
year
log
Hg
(µg/
g dr
y w
eigh
t)
Figure 5.3. Regression analyses of long term trends in pollutant residues in gannet eggs from Ailsa Craig, Bass Rock, St Kilda and Hermaness. Linear regressions are based on the values for individual eggs against year.
Wildlife and pollution: 2003/04 annual report
40
6 Organochlorines and mercury in white-tailed eagle (Haliaeetus albicilla) eggs
6.1 Introduction White-tailed eagles were reintroduced to western Scotland between 1976 and 1985. They have had lower breeding success than individuals in some populations in continental Europe, although productivity has been similar to that of birds in Iceland. The relatively poor breeding success of the Scottish population is due to the number of total nest failures, and a few pairs persistently fail to rear young. One potential cause of breeding failure may be exposure to contaminants which the birds could acquire particularly from the marine component (various fish and seabirds) of their diet. Some of the Scottish white-tailed eagles nest on inaccessible sea cliffs. This makes collection of samples difficult. No failed eggs were collected in 2003 and a total of ten eggs have been obtained and analysed during the course of this monitoring scheme.
6.2 Analysis of long-term data In a recent review of DDE and PCB mediated effects on the reproduction of white-tailed eagles in Sweden, Helander et al. (2002) suggested that lipid DDE concentrations in eggs of 30-50 μg/g and 100-120 μg/g were the lowest observed effect levels (LOELs) for eggshell thickness and productivity, respectively; complete reproductive failure was associated with a DDE concentration of 900 μg/g. However, there was considerable variation in individual productivity over a wide range of residue burdens. The first effects on productivity from PCBs appeared to occur at lipid concentrations of about 300 μg/g, but this may have been a result of co-variation with DDE residues. Because of the strong association between PCB and DDE, firm conclusions about effects levels for PCBs could not be drawn. Of the ten eggs from Scottish white-tailed eagles that have been analysed to date, four had lipid DDE concentrations above the LOEL for eggshell thickness, and two of them exceeded the LOEL for productivity (Table 6.1). Six eggs also had total PCB lipid concentrations greater than 300 μg/g, and all but two had PCB residues of between 8 and 25 µg/g wet wt, the range associated with decreased hatching success in various avian species (Hoffman et al. 1996). Although it is not certain that DDE or PCBs were a contributory cause of reproductive failure in white-tailed eagles from Scotland, the residues in some eggs were of a magnitude that might have been expected to have adverse effects. It is clearly important to analyse further eggs that become available.
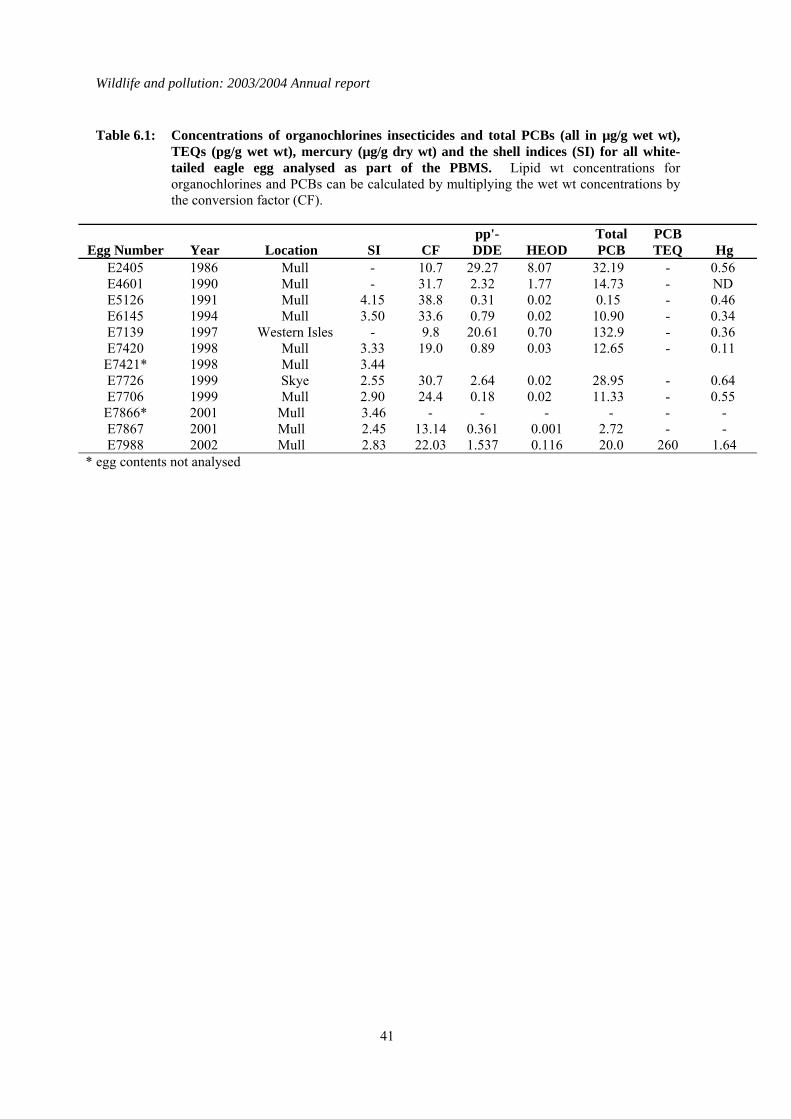
Wildlife and pollution: 2003/2004 Annual report
41
Table 6.1: Concentrations of organochlorines insecticides and total PCBs (all in µg/g wet wt),
TEQs (pg/g wet wt), mercury (µg/g dry wt) and the shell indices (SI) for all white-tailed eagle egg analysed as part of the PBMS. Lipid wt concentrations for organochlorines and PCBs can be calculated by multiplying the wet wt concentrations by the conversion factor (CF).
Egg Number Year Location SI CF pp'-DDE HEOD
Total PCB
PCB TEQ Hg
E2405 1986 Mull - 10.7 29.27 8.07 32.19 - 0.56 E4601 1990 Mull - 31.7 2.32 1.77 14.73 - ND E5126 1991 Mull 4.15 38.8 0.31 0.02 0.15 - 0.46 E6145 1994 Mull 3.50 33.6 0.79 0.02 10.90 - 0.34 E7139 1997 Western Isles - 9.8 20.61 0.70 132.9 - 0.36 E7420 1998 Mull 3.33 19.0 0.89 0.03 12.65 - 0.11
E7421* 1998 Mull 3.44 E7726 1999 Skye 2.55 30.7 2.64 0.02 28.95 - 0.64 E7706 1999 Mull 2.90 24.4 0.18 0.02 11.33 - 0.55
E7866* 2001 Mull 3.46 - - - - - - E7867 2001 Mull 2.45 13.14 0.361 0.001 2.72 - - E7988 2002 Mull 2.83 22.03 1.537 0.116 20.0 260 1.64
* egg contents not analysed
Wildlife and pollution: 2003/04 annual report
42
7 Second generation anticoagulant rodenticides (SGARs) in barn owls (Tyto alba), kestrels (Falco tinnunculus) and red kites (Milvus milvus).
7.1 Introduction The aim of this work is to monitor the exposure of certain predatory bird species to second-generation anticoagulant rodenticides (SGARs). The compounds of interest are difenacoum, bromadiolone, brodifacoum and flocoumafen and the species monitored are the barn owl and kestrel. The carcasses were supplied by members of the public and included birds that had died from various causes, mainly accidents. The PBMS has monitored SGAR residues in barn owls since 1983 and the findings from barn owls analysed in previous years have been reported by Newton et al. (1990, 1999) and long-term trends were last reviewed in this report series by Shore et al., (2005b). This is the second year in which the PBMS has routinely monitored kestrels for SGARs. Kestrels have been incorporated into the scheme because a study of birds that died between 1997 and 2000 indicated that a very high proportion (24/36 individuals) of the sample) had detectable concentrations of one or more SGAR in the liver (Shore et al., 2001b). The results of the analysis of the livers of 88 barn owls and 40 kestrels that were sent in to CEH in 2003 are reported in Table 7.1 and 7.2, respectively. No red kites were submitted to the scheme in 2003.
7.2 Methods Analysis of rodenticides in liver tissue was carried out using the general technique outlined by Hunter (1985) and described in detail by (Shore et al., 2006). Livers from barn owls, kestrels and kites were analysed together and in random order.
7.3 Results of analyses of birds received in 2003 Of the 88 barn owls received in 2003, one died in 2000, three died in 2001, twelve died in 2002 and there was no information on year of death provided with four others. Of the 68 birds known to have died in 2003, 41 (60.3%) contained detectable levels of one or more SGARs. This proportion was higher than that for owls received in 2002 (19/45 = 42.2%), although it was not quite significantly higher (Fisher’s Exact test; P=0.083). Overall, the data for the 2003 birds showed a marked increase in the proportion of birds with one or more SGARs present in their liver compared with observed in previous years. This observation is inconsistent with the trend reported for earlier years that suggested a leveling off in the proportion of birds exposed at about 40% (Newton et al., 1999b). It is possible therefore that the number of birds exposed to SGARs is continuing to rise over time rather than leveling off, although the apparent increase in 2003 may be the result of random inter-year variation. Difenacoum, bromadiolone, brodifacoum and flocoumafen occurred in 30 (44.1% of the sample), 18 (26.5%), 7 (10.7%) and none of the barn owls that died in 2003, respectively. The predominance of
Wildlife and pollution: 2003/2004 Annual report
43
difenacoum and bromadiolone and low levels of brodifacoum (indoor use only) is consistent with findings in barn owls in previous years. A number of the barn owls had residue levels considered to be in the potentially lethal range. This range has variously been described as > 0.1 µg/g wet wt (Newton et al., 1998) and > 0.2 µg/g wet wt (Newton et al., 1999b) and is so classed on the basis of two sets of observations. These are that almost all owls diagnosed at post-mortem of having died from rodenticide poisoning (because they had characteristic signs of haemorrhaging from such organs as the heart, lungs, liver, brain and/or subcutaneous areas) had liver residues >0.1 µg/g wet wt, and, secondly, that owls that had been experimentally poisoned had residues of the range 0.2-1.72 µg/g wet wt (Newton et al., 1999b for review). Of the barn owls that died in 2003, eight (11.8% of the sample) had liver residues (summed values for all four SGARS that were monitored) greater than 0.1 µg/g wet wt; the liver residue in three (4.4% of the sample) exceeded 0.2 µg/g wet wt. The proportion of owls that died in 2003 and that had residues > 0.1 µg/g wet wt was slightly lower than that observed in the previous five years (15.7%) but it is possible that this may simply be due to random inter-year variation. Post-mortem examination did not reveal signs of haemorrhaging consistent with rodenticide poisoning in any of the eight owls with SGAR residues of > 0.1 µg/g wet wt and the attributed causes of death were road traffic accidents (three birds), starvation (three birds) and collision (two birds). Of the 40 kestrels received in 2003, 39 were known to have been found that year. There was no information on the year of death of the other bird. In total, 33 of the 39 kestrels (84.6 % of the sample) contained detectable concentrations of one or more SGAR; this was higher than the proportion (57.1%) in the sample of 14 kestrels received in 2002 (Shore et al., in press). The difference between barn owls and kestrels in the proportions of birds that contained detectable liver residues of one or more SGAR (84.6% vs 57.1 %) was not statistically significant (Fisher’s Exact test, P > 0.05), but the trend of higher frequency of detection in kestrels than barn owls was also found in birds that died in 2002 and in birds that died in earlier years (Shore et al., 2001b). Difenacoum and bromadiolone were detected most frequently in kestrels and occurred in 29 (74.4% of the sample) and 16 (41.0%) birds, respectively. Brodifacoum and flocoumafen were detected in 6 (15.4 %) and no birds respectively. Over a third of the kestrels tested had more than one detectable SGAR concentration in their liver. Eight kestrels contained detectable concentrations of difenacoum and bromadiolone, one bird contained residues of bromadiolone and brodifacoum, and four birds contained residues of difenacoum, bromadiolone and brodifacoum. Six kestrels had sum liver SGAR residues of between 0.1 and 0.2 µg/g wet wt and eleven other birds had residues >0.2 µg/g wet wt. Of these 17 kestrels, review of the circumstances in which the bird was found, the results of the post-mortem examination and the chemical residue data suggested that SGARs may possibly have contributed to the death of four birds. Three had signs of haemorrhaging and sum SGAR liver concentrations of between 0.23 and 0.837 µg/g wet wt. However, the injuries in two of the birds were also consistent with death from collision and the other bird was in a starved state. The fourth kestrel had no signs of haemorrhaging and the cause of death was unknown; its sum SGAR liver concentration was 0.528 µg/g wet wt. Therefore, it is equivocal whether SGARs were a contributory factor in the death of these birds.
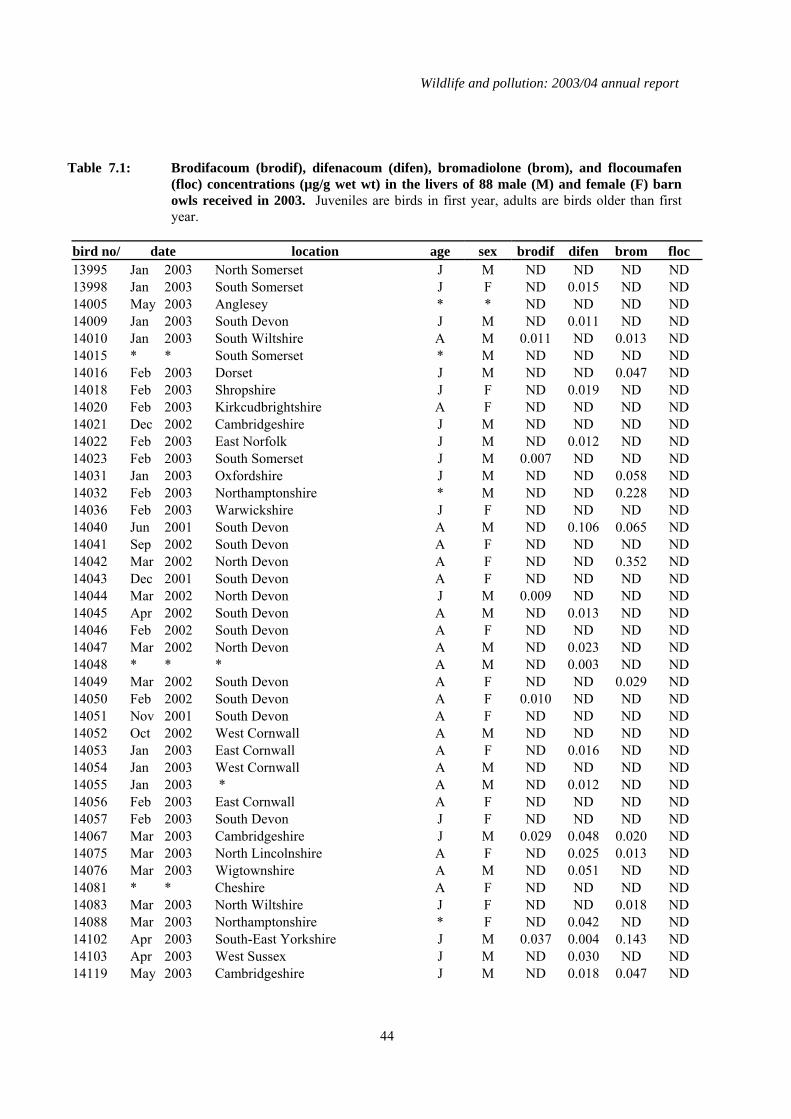
Wildlife and pollution: 2003/04 annual report
44
Table 7.1: Brodifacoum (brodif), difenacoum (difen), bromadiolone (brom), and flocoumafen (floc) concentrations (µg/g wet wt) in the livers of 88 male (M) and female (F) barn owls received in 2003. Juveniles are birds in first year, adults are birds older than first year.
bird no/ date location age sex brodif difen brom floc 13995 Jan 2003 North Somerset J M ND ND ND ND 13998 Jan 2003 South Somerset J F ND 0.015 ND ND 14005 May 2003 Anglesey * * ND ND ND ND 14009 Jan 2003 South Devon J M ND 0.011 ND ND 14010 Jan 2003 South Wiltshire A M 0.011 ND 0.013 ND 14015 * * South Somerset * M ND ND ND ND 14016 Feb 2003 Dorset J M ND ND 0.047 ND 14018 Feb 2003 Shropshire J F ND 0.019 ND ND 14020 Feb 2003 Kirkcudbrightshire A F ND ND ND ND 14021 Dec 2002 Cambridgeshire J M ND ND ND ND 14022 Feb 2003 East Norfolk J M ND 0.012 ND ND 14023 Feb 2003 South Somerset J M 0.007 ND ND ND 14031 Jan 2003 Oxfordshire J M ND ND 0.058 ND 14032 Feb 2003 Northamptonshire * M ND ND 0.228 ND 14036 Feb 2003 Warwickshire J F ND ND ND ND 14040 Jun 2001 South Devon A M ND 0.106 0.065 ND 14041 Sep 2002 South Devon A F ND ND ND ND 14042 Mar 2002 North Devon A F ND ND 0.352 ND 14043 Dec 2001 South Devon A F ND ND ND ND 14044 Mar 2002 North Devon J M 0.009 ND ND ND 14045 Apr 2002 South Devon A M ND 0.013 ND ND 14046 Feb 2002 South Devon A F ND ND ND ND 14047 Mar 2002 North Devon A M ND 0.023 ND ND 14048 * * * A M ND 0.003 ND ND 14049 Mar 2002 South Devon A F ND ND 0.029 ND 14050 Feb 2002 South Devon A F 0.010 ND ND ND 14051 Nov 2001 South Devon A F ND ND ND ND 14052 Oct 2002 West Cornwall A M ND ND ND ND 14053 Jan 2003 East Cornwall A F ND 0.016 ND ND 14054 Jan 2003 West Cornwall A M ND ND ND ND 14055 Jan 2003 * A M ND 0.012 ND ND 14056 Feb 2003 East Cornwall A F ND ND ND ND 14057 Feb 2003 South Devon J F ND ND ND ND 14067 Mar 2003 Cambridgeshire J M 0.029 0.048 0.020 ND 14075 Mar 2003 North Lincolnshire A F ND 0.025 0.013 ND 14076 Mar 2003 Wigtownshire A M ND 0.051 ND ND 14081 * * Cheshire A F ND ND ND ND 14083 Mar 2003 North Wiltshire J F ND ND 0.018 ND 14088 Mar 2003 Northamptonshire * F ND 0.042 ND ND 14102 Apr 2003 South-East Yorkshire J M 0.037 0.004 0.143 ND 14103 Apr 2003 West Sussex J M ND 0.030 ND ND 14119 May 2003 Cambridgeshire J M ND 0.018 0.047 ND
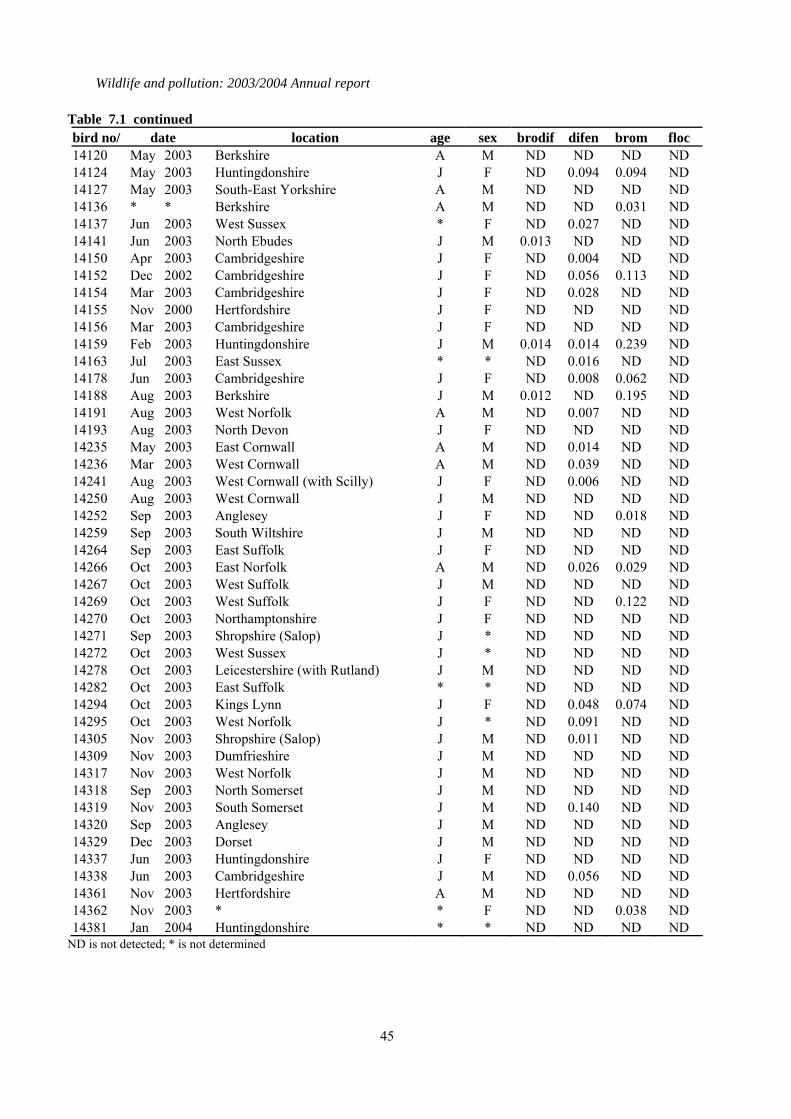
Wildlife and pollution: 2003/2004 Annual report
45
Table 7.1 continued bird no/ date location age sex brodif difen brom floc 14120 May 2003 Berkshire A M ND ND ND ND 14124 May 2003 Huntingdonshire J F ND 0.094 0.094 ND 14127 May 2003 South-East Yorkshire A M ND ND ND ND 14136 * * Berkshire A M ND ND 0.031 ND 14137 Jun 2003 West Sussex * F ND 0.027 ND ND 14141 Jun 2003 North Ebudes J M 0.013 ND ND ND 14150 Apr 2003 Cambridgeshire J F ND 0.004 ND ND 14152 Dec 2002 Cambridgeshire J F ND 0.056 0.113 ND 14154 Mar 2003 Cambridgeshire J F ND 0.028 ND ND 14155 Nov 2000 Hertfordshire J F ND ND ND ND 14156 Mar 2003 Cambridgeshire J F ND ND ND ND 14159 Feb 2003 Huntingdonshire J M 0.014 0.014 0.239 ND 14163 Jul 2003 East Sussex * * ND 0.016 ND ND 14178 Jun 2003 Cambridgeshire J F ND 0.008 0.062 ND 14188 Aug 2003 Berkshire J M 0.012 ND 0.195 ND 14191 Aug 2003 West Norfolk A M ND 0.007 ND ND 14193 Aug 2003 North Devon J F ND ND ND ND 14235 May 2003 East Cornwall A M ND 0.014 ND ND 14236 Mar 2003 West Cornwall A M ND 0.039 ND ND 14241 Aug 2003 West Cornwall (with Scilly) J F ND 0.006 ND ND 14250 Aug 2003 West Cornwall J M ND ND ND ND 14252 Sep 2003 Anglesey J F ND ND 0.018 ND 14259 Sep 2003 South Wiltshire J M ND ND ND ND 14264 Sep 2003 East Suffolk J F ND ND ND ND 14266 Oct 2003 East Norfolk A M ND 0.026 0.029 ND 14267 Oct 2003 West Suffolk J M ND ND ND ND 14269 Oct 2003 West Suffolk J F ND ND 0.122 ND 14270 Oct 2003 Northamptonshire J F ND ND ND ND 14271 Sep 2003 Shropshire (Salop) J * ND ND ND ND 14272 Oct 2003 West Sussex J * ND ND ND ND 14278 Oct 2003 Leicestershire (with Rutland) J M ND ND ND ND 14282 Oct 2003 East Suffolk * * ND ND ND ND 14294 Oct 2003 Kings Lynn J F ND 0.048 0.074 ND 14295 Oct 2003 West Norfolk J * ND 0.091 ND ND 14305 Nov 2003 Shropshire (Salop) J M ND 0.011 ND ND 14309 Nov 2003 Dumfrieshire J M ND ND ND ND 14317 Nov 2003 West Norfolk J M ND ND ND ND 14318 Sep 2003 North Somerset J M ND ND ND ND 14319 Nov 2003 South Somerset J M ND 0.140 ND ND 14320 Sep 2003 Anglesey J M ND ND ND ND 14329 Dec 2003 Dorset J M ND ND ND ND 14337 Jun 2003 Huntingdonshire J F ND ND ND ND 14338 Jun 2003 Cambridgeshire J M ND 0.056 ND ND 14361 Nov 2003 Hertfordshire A M ND ND ND ND 14362 Nov 2003 * * F ND ND 0.038 ND 14381 Jan 2004 Huntingdonshire * * ND ND ND ND
ND is not detected; * is not determined
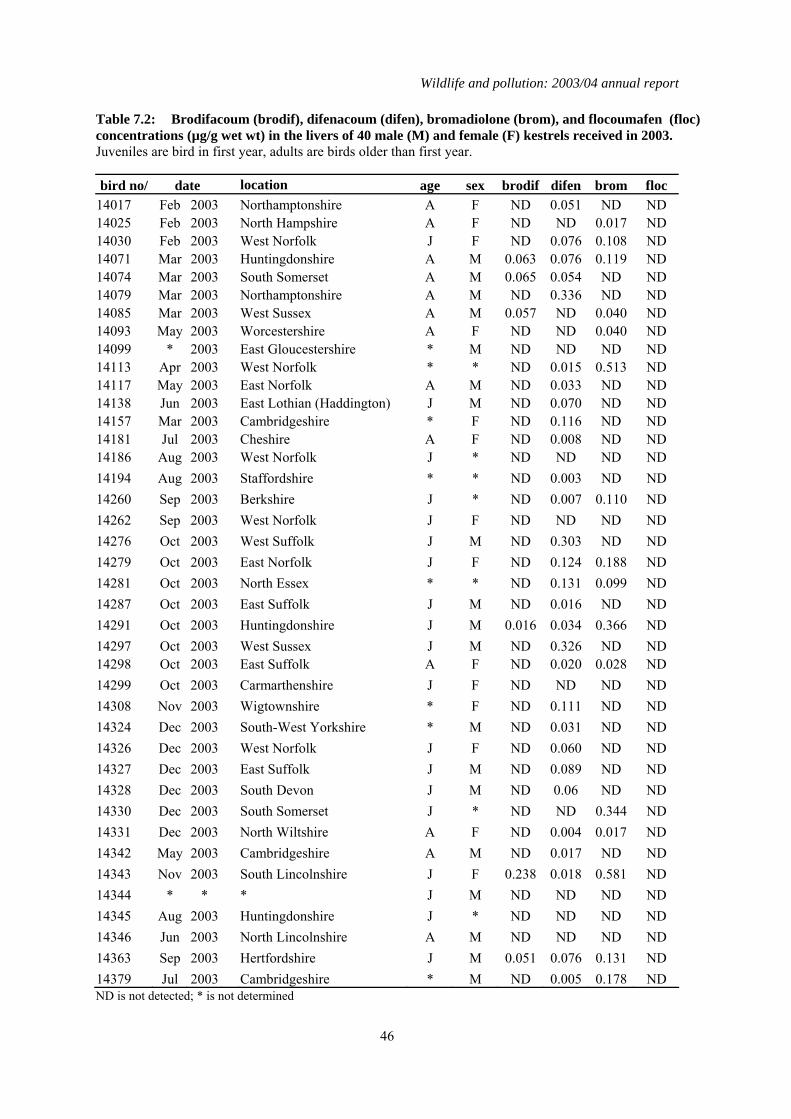
Wildlife and pollution: 2003/04 annual report
46
Table 7.2: Brodifacoum (brodif), difenacoum (difen), bromadiolone (brom), and flocoumafen (floc) concentrations (µg/g wet wt) in the livers of 40 male (M) and female (F) kestrels received in 2003. Juveniles are bird in first year, adults are birds older than first year. bird no/ date location age sex brodif difen brom floc
14017 Feb 2003 Northamptonshire A F ND 0.051 ND ND 14025 Feb 2003 North Hampshire A F ND ND 0.017 ND 14030 Feb 2003 West Norfolk J F ND 0.076 0.108 ND 14071 Mar 2003 Huntingdonshire A M 0.063 0.076 0.119 ND 14074 Mar 2003 South Somerset A M 0.065 0.054 ND ND 14079 Mar 2003 Northamptonshire A M ND 0.336 ND ND 14085 Mar 2003 West Sussex A M 0.057 ND 0.040 ND 14093 May 2003 Worcestershire A F ND ND 0.040 ND 14099 * 2003 East Gloucestershire * M ND ND ND ND 14113 Apr 2003 West Norfolk * * ND 0.015 0.513 ND 14117 May 2003 East Norfolk A M ND 0.033 ND ND 14138 Jun 2003 East Lothian (Haddington) J M ND 0.070 ND ND 14157 Mar 2003 Cambridgeshire * F ND 0.116 ND ND 14181 Jul 2003 Cheshire A F ND 0.008 ND ND 14186 Aug 2003 West Norfolk J * ND ND ND ND 14194 Aug 2003 Staffordshire * * ND 0.003 ND ND 14260 Sep 2003 Berkshire J * ND 0.007 0.110 ND 14262 Sep 2003 West Norfolk J F ND ND ND ND 14276 Oct 2003 West Suffolk J M ND 0.303 ND ND 14279 Oct 2003 East Norfolk J F ND 0.124 0.188 ND 14281 Oct 2003 North Essex * * ND 0.131 0.099 ND 14287 Oct 2003 East Suffolk J M ND 0.016 ND ND 14291 Oct 2003 Huntingdonshire J M 0.016 0.034 0.366 ND 14297 Oct 2003 West Sussex J M ND 0.326 ND ND 14298 Oct 2003 East Suffolk A F ND 0.020 0.028 ND 14299 Oct 2003 Carmarthenshire J F ND ND ND ND 14308 Nov 2003 Wigtownshire * F ND 0.111 ND ND 14324 Dec 2003 South-West Yorkshire * M ND 0.031 ND ND 14326 Dec 2003 West Norfolk J F ND 0.060 ND ND 14327 Dec 2003 East Suffolk J M ND 0.089 ND ND 14328 Dec 2003 South Devon J M ND 0.06 ND ND 14330 Dec 2003 South Somerset J * ND ND 0.344 ND 14331 Dec 2003 North Wiltshire A F ND 0.004 0.017 ND 14342 May 2003 Cambridgeshire A M ND 0.017 ND ND 14343 Nov 2003 South Lincolnshire J F 0.238 0.018 0.581 ND 14344 * * * J M ND ND ND ND 14345 Aug 2003 Huntingdonshire J * ND ND ND ND 14346 Jun 2003 North Lincolnshire A M ND ND ND ND 14363 Sep 2003 Hertfordshire J M 0.051 0.076 0.131 ND 14379 Jul 2003 Cambridgeshire * M ND 0.005 0.178 ND ND is not detected; * is not determined

Wildlife and pollution: 2003/2004 Annual report
47
8 Comparison of toxic equivalents by chemical and CALUX measurements
8.1 Introduction There are large numbers of different persistent organic pollutants (POPs) that are widely distributed in the environment and bioaccumulated by wild vertebrates. Examples include the complex mixtures of chemicals that comprise the polychlorinated dibenzo-p-dioxins(PCDDs) and furans (PCDFs), PCBs, polychlorinated terphenyls and naphthalenes (PCTs and PCNs), and polycyclic aromatic hydrocarbons (PAHs). Most are potentially toxic to vertebrates, and effects include reproductive impairment (disruption of hormone status, embryotoxicity, teratogenicity), hepatotoxicity, immunotoxicity and neurotoxicity. Many of these effects are mediated through a common mode of action that involves the binding of the parent chemicals or their metabolites to the aryl-hydrocarbon (Ah) receptor (Denison & HeathPagliuso, 1998; Harper et al., 2006). As different POPs can have similar toxic impacts when effects are mediated via the Ah receptor, simultaneous exposure to multiple POPs can potentially result in additive toxicity. The amount of toxicity associated with each individual compound will depend on the severity of exposure and the potency of the chemical. The toxicities of some of the most potent and environmentally prevalent compounds known to act via the Ah receptor have been compared and quantified in the form of Toxic Equivalency Factors (TEFs). These are order of magnitude estimates of the toxicity of each compound relative to that of 2, 3,7, 8 -tetrachlorodibenzo-p-dioxin (TCDD), the most potent dioxin congener that acts via the Ah receptor (Ahlborg et al., 1992; Van den Berg et al., 1998; van den Berg et al., 2006). The TEF value is used in conjunction with data on the concentration of a compound to calculate its Toxic Equivalent (TEQ) concentration; the TEQ is the product of the TEF and the concentration of the compound. In tissues where there are detectable concentrations of multiple POPs, the TEQ for each compound can be calculated and the overall (additive) toxicity expressed as the sum of the various TEQ concentrations. The monitoring of POPs conducted by the PBMS has focused primarily on PCBs, although recent pilot studies have also examined eggs for PAHs (Shore et al., in press). Certain PCB congeners (non ortho-substituted and some mono-ortho substituted congeners) have a planar conformation like that of 2,3,7,8-TCDD and so exert similar toxic effects through the Ah receptor; they are often termed planar or co-planar congeners. Recently, the PBMS has started to report the TEQ concentrations associated with these co-planar congeners, thereby providing better information on likely effects of PCBs in raptors and their eggs (Shore et al., in press; also this report). However, the TEQ concentrations reported by the PBMS only relate to coplanar PCB congeners, as other POPs that act through the Ah receptor are not currently quantified. It is therefore possible that total TEQ concentrations, which are the result of assimilation of other POPs as well as PCBs, are underestimated. The objective of the present study was to compare TEQ concentrations in PBMS samples (as calculated from normal chemical monitoring of PCB coplanar congeners) with total TEQ concentrations which arise from the presence of all chemicals that act through the Ah receptor. This wider ranging measure of TEQs was obtained using a chemically-activated luciferase gene expression (CALUX) cell bioassay.
Wildlife and pollution: 2003/04 annual report
48
8.2 Methods A total of 48 liver samples (16 sparrowhawk, 16 kestrel, 16 heron) and the contents of 44 eggs (16 peregrine falcon, 16 gannet, 14 merlin eggs) were selected from the PBMS frozen tissue and egg archive. Each sample was homogenised with acid washed sand, dried with anhydrous sodium sulphate and cold extracted into 50 ml of a hexane:acetone mixture (50%/50%). The extract was split into two equal 25 ml aliquots, one for gravimetric determination of lipid content, the other for determination of TEQ concentrations by chemical analysis of PCBs and by CALUX assay. The second aliquot was evaporated to dryness. The lipid was re-dissolved in 1ml of hexane, cleaned up on a 0.8g 5% deactivated alumina column and the column was eluted with 5ml of hexane. A 2 ml aliquot of the cleaned-up extract was transferred to a conical gas chromatography vial and evaporated to dryness at 60oC under ECD grade nitrogen. This was transported to the Wageningen University for analysis by the CALUX assay. The remainder of the reconstituted extract was analysed chemically for PCBs using gas chromatography with electron capture detection (GC-ECD), as described by Wienburg & Shore (2004) and is done routinely in the long-term PBMS monitoring. Quality control samples were run in conjunction with the liver and eggs samples and included an analytical blank, a sample of ‘clean’ chicken liver/egg and spiked chicken liver /egg that was spiked with a 35 different PCB congeners. The toxic equivalent concentration for each measured coplanar PCB congener was calculated by multiplying the chemically-determined concentration by the appropriate TEF; concentration data were not recovery corrected. The TEQs for the different coplanar PCBs present in the sample were added together to give a sum PCB-TEQ concentration, expressed in pg PCB-TEQ/g lipid. This is the chemically determined TEQ concentration that is now reported as part of the PBMS. The CALUX assay is based on rat hepatoma cells (H4IIE) transfected with a stable plasmid which carries the luciferase gene of fireflies (Photinus pyralis) as a reporter gene. In the presence of dioxin-like compounds, the transfected cells produce the enzyme luciferase which reacts with added luciferine and fluoresces. The quantity of light produced is measured (using a luminometer) and a TCDD-standard curve used to convert the measured light production into a (TCDD-equivalent) TEQ concentration. This value is based on the total amount of dioxin-like compound. The dried extracts transported to Wageningen University were initially re-dissolved in 100 µl of 1:1 acetone and hexane in their vials. The contents were mixed for one minute, after which 15 or 20 µl aliquots of DMSO were added to each egg or liver sample, respectively. The acetone/hexane was then evaporated from each sample under gentle flow of nitrogen gas. The CALUX assay was performed as described by Murk et al., (1998) using in-vitro cultivated H4IIE-luc cells plated on a 96-well Packard ViewPlates. Cells were grown on the plates for 24 hours until a confluent layer was reached. Sample dilutions were prepared in culture medium. Cells were exposed to the sample dilutions for 24 hours (0.4 % of DMSO). After cell lysis, the cells were stored at –80 0C until measurement. Bio-luminescence was measured using a Luminoskan RS (Thermo Life Science), equipped with two internal injectors to inject the luciferine containing FlashMix, and the NaOH for signal quenching. All samples were corrected for the solvent DMSO signal. TEQs values measured by the CALUX assay (subsequently referred to as CALUX-TEQs) are reported on a pg TCDD/g lipid basis. Summary data for sum PCB-TEQ and CALUX-TEQs concentrations are presented as medians and inter-quartile ranges, and differences between species were analysed by non-parametric Kruskall-Wallis test and post-hoc Dunn’s multiple comparison tests. This was because of the non-normal distribution of data. The relationships between the sum PCB-TEQ and CALUX-TEQs concentrations in samples were determined using linear regressions on log-transformed data; the residuals of the analyses were all normally-distributed.

Wildlife and pollution: 2003/2004 Annual report
49
8.3 Results Overall, the CALUX assay and chemical determination gave broadly similar results for TEQ concentrations in eggs. Both methods of analysis indicated that there were significant differences between species (Kruskal-Wallis statistic Kw ≥ 20.96, P<0.001 in both cases) and that the TEQ concentrations in gannet or merlin eggs were significantly higher than in peregrine falcon eggs (Figure 8.1). In contrast to the results for eggs, there was much poorer general correspondence between the CALUX –TEQ and PCB-TEQ concentrations for sparrowhawk, kestrel and heron livers (Figure 8.1). The CALUX assay indicated that median TEQ concentrations were highest in sparrowhawks and lowest in kestrels and the variation between species was statistically significant (Kw = 8.65, P<0.02), although the only significant difference detected in post-hoc tests was between sparrowhawks and kestrels (Figure 8.1). While chemical analysis of liver PCB-TEQs also suggested that there were significant differences between species (Kw = 10.54, P<0.005), PCB-TEQ concentrations did not vary between kestrels and sparrowhawks but both were significantly lower than concentrations in herons (Figure 8.1).
gannet merlin peregrine0
50
100
150
200
******
gannet merlin peregrine0
50
100
150
200
*****
kestrel sparrowhawk heron0
100
200
300
400 **
kestrel sparrowhawk heron0
100
200
300
400*
*
Med
ian
( ± IQ
R) T
EQ (p
g/g
lipid
)
CALUX-TEQ PCB-TEQ
Figure 8.1. Median (±) inter-quartile range (IQR) concentrations in (pg/g lipid) gannet, merlin and peregrine falcon eggs and in kestrel, sparrowhawk and heron livers as determined by CALUX assay (left hand graphs) and by chemical measurement of planar PCB congeners (right hand graphs). The significance of differences between groups as determined by post-hoc Dunn’s multiple comparison tests are indicated by: * P<0.05, ** P<0.01, *** P<0.001. When CALUX and chemically determined PCB-TEQ concentrations in eggs were compared for each species separately, the relationship between the two measures was always statistically significant; PCB-TEQs could be used to predict CALUX-TEQ concentrations (Figure 8.2). CALUX-TEQ and PCB-TEQ concentrations were broadly similar in magnitude in gannet and merlin eggs, except in a small number of eggs with low PCB-TEQ concentrations. In contrast, PCB-TEQs in peregrine falcon eggs tended to be lower than corresponding CALUX-TEQs. This difference between peregrines and the other species
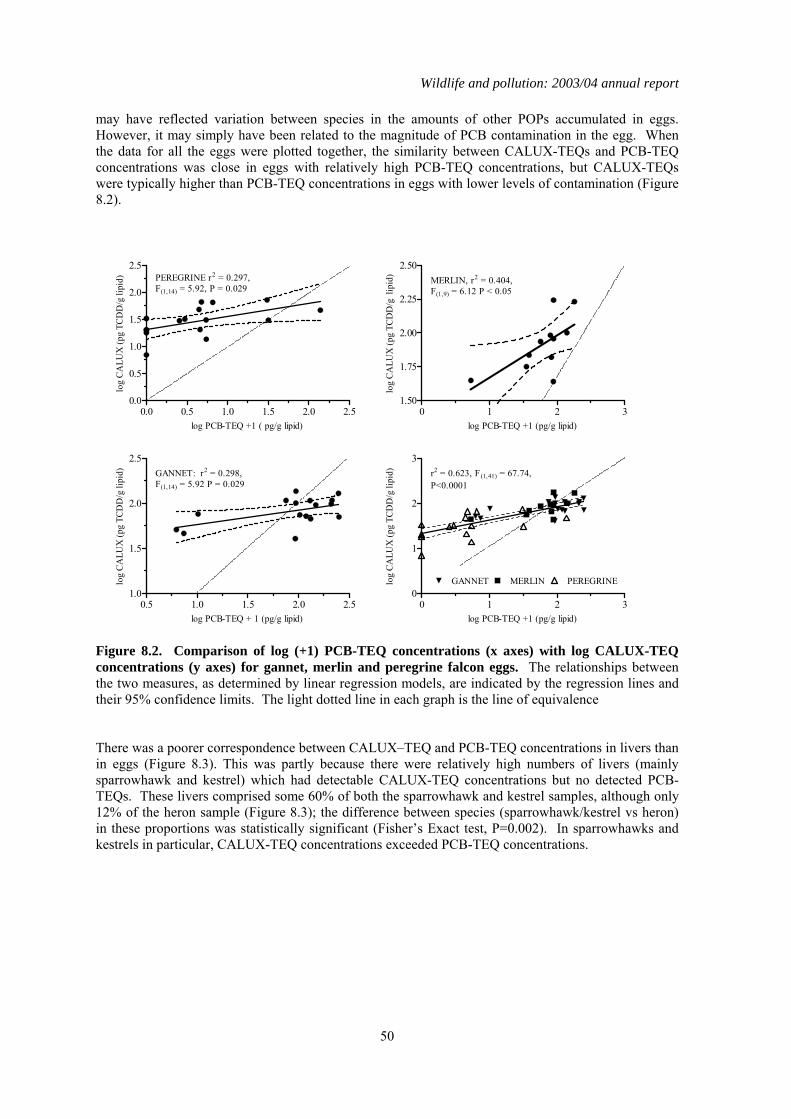
Wildlife and pollution: 2003/04 annual report
50
may have reflected variation between species in the amounts of other POPs accumulated in eggs. However, it may simply have been related to the magnitude of PCB contamination in the egg. When the data for all the eggs were plotted together, the similarity between CALUX-TEQs and PCB-TEQ concentrations was close in eggs with relatively high PCB-TEQ concentrations, but CALUX-TEQs were typically higher than PCB-TEQ concentrations in eggs with lower levels of contamination (Figure 8.2).
0.0 0.5 1.0 1.5 2.0 2.50.0
0.5
1.0
1.5
2.0
2.5PEREGRINE r2 = 0.297,F(1,14) = 5.92, P = 0.029
log PCB-TEQ +1 ( pg/g lipid)
log
CA
LUX
(pg
TCD
D/g
lipi
d)
0 1 2 31.50
1.75
2.00
2.25
2.50MERLIN, r2 = 0.404,F(1,9) = 6.12 P < 0.05
log PCB-TEQ +1 (pg/g lipid)
log
CALU
X (p
g TC
DD
/g l
ipid
)
0.5 1.0 1.5 2.0 2.51.0
1.5
2.0
2.5GANNET: r2 = 0.298,F(1,14) = 5.92 P = 0.029
log PCB-TEQ + 1 (pg/g lipid)
log
CA
LUX
(pg
TCD
D/g
lipi
d)
0 1 2 30
1
2
3r2 = 0.623, F(1,41) = 67.74,P<0.0001
MERLIN PEREGRINEGANNET
log PCB-TEQ +1 (pg/g lipid)
log
CA
LUX
(pg
TCD
D/g
lipi
d)
Figure 8.2. Comparison of log (+1) PCB-TEQ concentrations (x axes) with log CALUX-TEQ concentrations (y axes) for gannet, merlin and peregrine falcon eggs. The relationships between the two measures, as determined by linear regression models, are indicated by the regression lines and their 95% confidence limits. The light dotted line in each graph is the line of equivalence There was a poorer correspondence between CALUX–TEQ and PCB-TEQ concentrations in livers than in eggs (Figure 8.3). This was partly because there were relatively high numbers of livers (mainly sparrowhawk and kestrel) which had detectable CALUX-TEQ concentrations but no detected PCB-TEQs. These livers comprised some 60% of both the sparrowhawk and kestrel samples, although only 12% of the heron sample (Figure 8.3); the difference between species (sparrowhawk/kestrel vs heron) in these proportions was statistically significant (Fisher’s Exact test, P=0.002). In sparrowhawks and kestrels in particular, CALUX-TEQ concentrations exceeded PCB-TEQ concentrations.
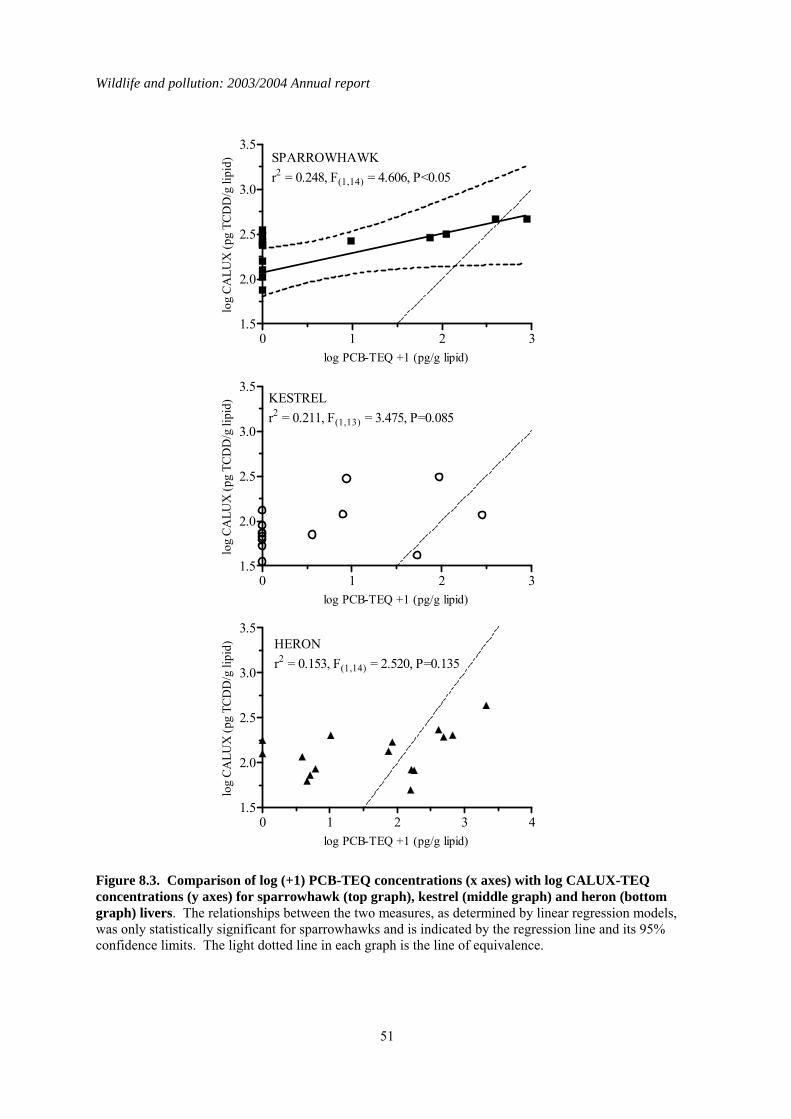
Wildlife and pollution: 2003/2004 Annual report
51
0 1 2 31.5
2.0
2.5
3.0
3.5SPARROWHAWKr2 = 0.248, F(1,14) = 4.606, P<0.05
log PCB-TEQ +1 (pg/g lipid)
log
CALU
X (p
g TC
DD
/g li
pid)
0 1 2 31.5
2.0
2.5
3.0
3.5KESTRELr2 = 0.211, F(1,13) = 3.475, P=0.085
log PCB-TEQ +1 (pg/g lipid)
log
CALU
X (p
g TC
DD
/g li
pid)
0 1 2 3 41.5
2.0
2.5
3.0
3.5HERONr2 = 0.153, F(1,14) = 2.520, P=0.135
log PCB-TEQ +1 (pg/g lipid)
log
CALU
X (p
g TC
DD
/g li
pid)
Figure 8.3. Comparison of log (+1) PCB-TEQ concentrations (x axes) with log CALUX-TEQ concentrations (y axes) for sparrowhawk (top graph), kestrel (middle graph) and heron (bottom graph) livers. The relationships between the two measures, as determined by linear regression models, was only statistically significant for sparrowhawks and is indicated by the regression line and its 95% confidence limits. The light dotted line in each graph is the line of equivalence.
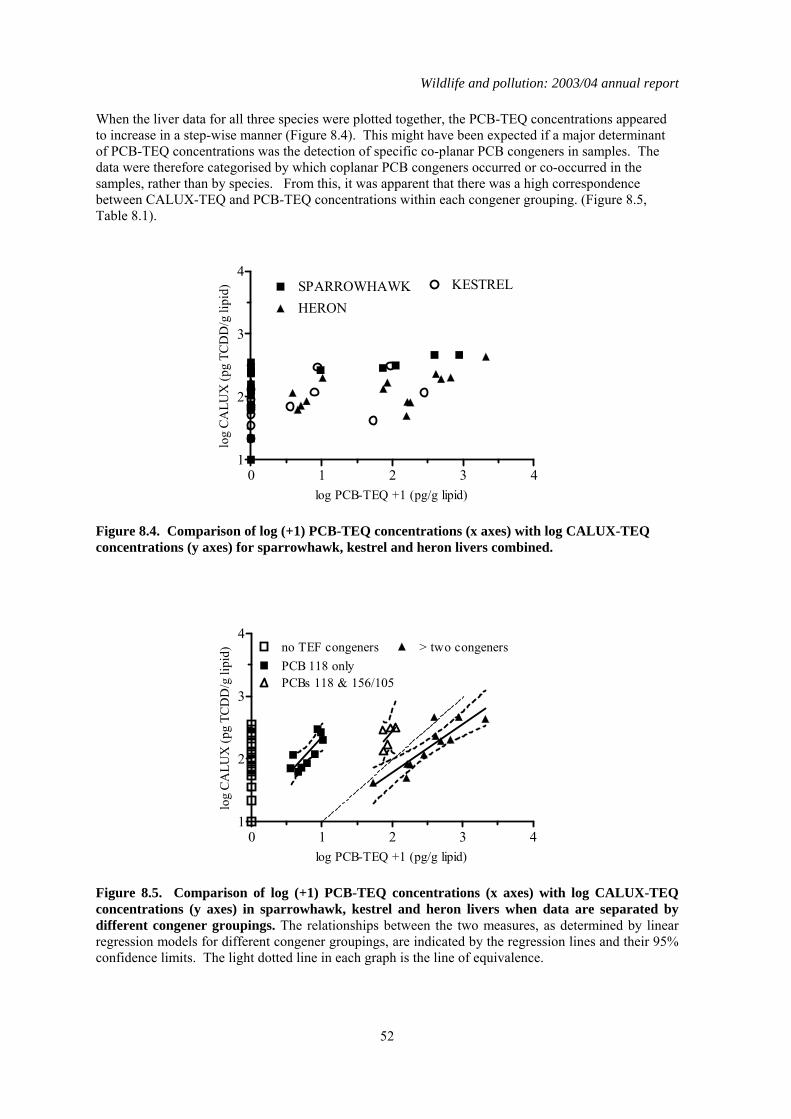
Wildlife and pollution: 2003/04 annual report
52
When the liver data for all three species were plotted together, the PCB-TEQ concentrations appeared to increase in a step-wise manner (Figure 8.4). This might have been expected if a major determinant of PCB-TEQ concentrations was the detection of specific co-planar PCB congeners in samples. The data were therefore categorised by which coplanar PCB congeners occurred or co-occurred in the samples, rather than by species. From this, it was apparent that there was a high correspondence between CALUX-TEQ and PCB-TEQ concentrations within each congener grouping. (Figure 8.5, Table 8.1).
0 1 2 3 41
2
3
4SPARROWHAWK KESTREL
HERON
log PCB-TEQ +1 (pg/g lipid)
log
CALU
X (p
g TC
DD
/g li
pid)
Figure 8.4. Comparison of log (+1) PCB-TEQ concentrations (x axes) with log CALUX-TEQ concentrations (y axes) for sparrowhawk, kestrel and heron livers combined.
0 1 2 3 41
2
3
4
PCB 118 onlyPCBs 118 & 156/105
> two congenersno TEF congeners
log PCB-TEQ +1 (pg/g lipid)
log
CALU
X (p
g TC
DD
/g li
pid)
Figure 8.5. Comparison of log (+1) PCB-TEQ concentrations (x axes) with log CALUX-TEQ concentrations (y axes) in sparrowhawk, kestrel and heron livers when data are separated by different congener groupings. The relationships between the two measures, as determined by linear regression models for different congener groupings, are indicated by the regression lines and their 95% confidence limits. The light dotted line in each graph is the line of equivalence.
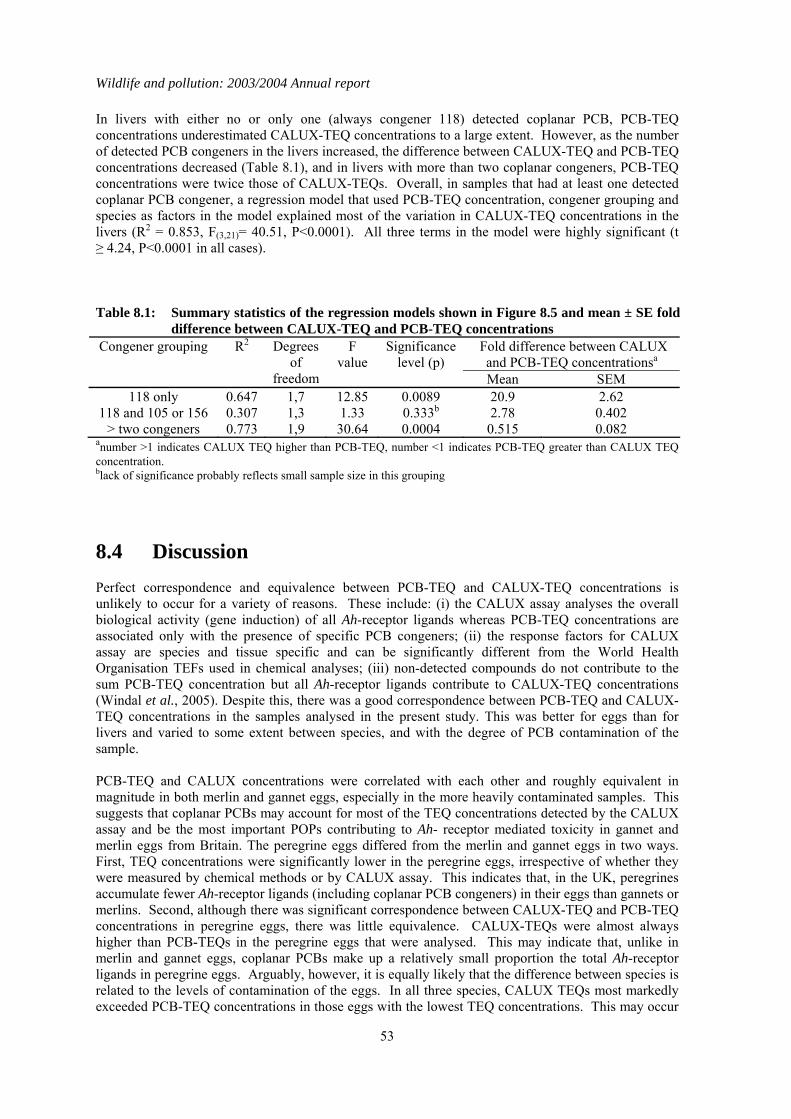
Wildlife and pollution: 2003/2004 Annual report
53
In livers with either no or only one (always congener 118) detected coplanar PCB, PCB-TEQ concentrations underestimated CALUX-TEQ concentrations to a large extent. However, as the number of detected PCB congeners in the livers increased, the difference between CALUX-TEQ and PCB-TEQ concentrations decreased (Table 8.1), and in livers with more than two coplanar congeners, PCB-TEQ concentrations were twice those of CALUX-TEQs. Overall, in samples that had at least one detected coplanar PCB congener, a regression model that used PCB-TEQ concentration, congener grouping and species as factors in the model explained most of the variation in CALUX-TEQ concentrations in the livers (R2 = 0.853, F(3,21)= 40.51, P<0.0001). All three terms in the model were highly significant (t ≥ 4.24, P<0.0001 in all cases). Table 8.1: Summary statistics of the regression models shown in Figure 8.5 and mean ± SE fold
difference between CALUX-TEQ and PCB-TEQ concentrations Fold difference between CALUX
and PCB-TEQ concentrationsa Congener grouping R2 Degrees
of freedom
F value
Significance level (p)
Mean SEM 118 only 0.647 1,7 12.85 0.0089 20.9 2.62
118 and 105 or 156 0.307 1,3 1.33 0.333b 2.78 0.402 > two congeners 0.773 1,9 30.64 0.0004 0.515 0.082
anumber >1 indicates CALUX TEQ higher than PCB-TEQ, number <1 indicates PCB-TEQ greater than CALUX TEQ concentration. black of significance probably reflects small sample size in this grouping
8.4 Discussion Perfect correspondence and equivalence between PCB-TEQ and CALUX-TEQ concentrations is unlikely to occur for a variety of reasons. These include: (i) the CALUX assay analyses the overall biological activity (gene induction) of all Ah-receptor ligands whereas PCB-TEQ concentrations are associated only with the presence of specific PCB congeners; (ii) the response factors for CALUX assay are species and tissue specific and can be significantly different from the World Health Organisation TEFs used in chemical analyses; (iii) non-detected compounds do not contribute to the sum PCB-TEQ concentration but all Ah-receptor ligands contribute to CALUX-TEQ concentrations (Windal et al., 2005). Despite this, there was a good correspondence between PCB-TEQ and CALUX-TEQ concentrations in the samples analysed in the present study. This was better for eggs than for livers and varied to some extent between species, and with the degree of PCB contamination of the sample. PCB-TEQ and CALUX concentrations were correlated with each other and roughly equivalent in magnitude in both merlin and gannet eggs, especially in the more heavily contaminated samples. This suggests that coplanar PCBs may account for most of the TEQ concentrations detected by the CALUX assay and be the most important POPs contributing to Ah- receptor mediated toxicity in gannet and merlin eggs from Britain. The peregrine eggs differed from the merlin and gannet eggs in two ways. First, TEQ concentrations were significantly lower in the peregrine eggs, irrespective of whether they were measured by chemical methods or by CALUX assay. This indicates that, in the UK, peregrines accumulate fewer Ah-receptor ligands (including coplanar PCB congeners) in their eggs than gannets or merlins. Second, although there was significant correspondence between CALUX-TEQ and PCB-TEQ concentrations in peregrine eggs, there was little equivalence. CALUX-TEQs were almost always higher than PCB-TEQs in the peregrine eggs that were analysed. This may indicate that, unlike in merlin and gannet eggs, coplanar PCBs make up a relatively small proportion the total Ah-receptor ligands in peregrine eggs. Arguably, however, it is equally likely that the difference between species is related to the levels of contamination of the eggs. In all three species, CALUX TEQs most markedly exceeded PCB-TEQ concentrations in those eggs with the lowest TEQ concentrations. This may occur
Wildlife and pollution: 2003/04 annual report
54
because non-PCB compounds account for the CALUX-TEQ concentrations in these eggs or, more likely, because some coplanar PCB concentrations are present and contribute to the CALUX-TEQ but are only present at concentrations below the chemical limits of detection. It would therefore be expected that equivalence between CALUX-TEQ and PCB-TEQ concentrations would be poorer in peregrine than gannet or merlin eggs because contaminant concentrations were relatively low in the peregrine eggs. Whatever the cause, the plot for all the species combined in Figure 8.2 suggests that overall TEQ concentrations, when measured by chemical determination of PCB-TEQs, may on average be underestimated in peregrine falcon, gannet and merlin eggs that have log TEQ concentrations of less than approximately 1.9, equivalent to 80 pg/g lipid. Assuming a lipid to wet wt conversion factor of 16.1 (the average for merlin eggs in Table 3.1 in this report), this lipid concentration corresponds to a wet wt TEQ concentration of approximately 5 pg/g. Given that the No Observable Effect Concentrations (NOECs) for TEQs in eggs range between 1.5 and 200 pg TEQ/g wet wt and that the LOECs range between 10 and 2200 pg/g wet wt (AMAP, 1998), it might be argued that underestimates of what are, in any case, low TEQ concentrations is not toxicologically important. Accurate estimation of total TEQ concentrations in eggs above 10 pg/g wet wt can be considered important, however, as adverse effects might be expected to be associated with such levels of contamination. Approximately half of both the merlin and the gannet eggs, but none of the sparrowhawk eggs, had CALUX-TEQ concentrations > 10 pg/g wet wt CALUX-TEQs and the PCB-TEQ concentrations in these eggs were of a similar magnitude to the CALUX-TEQs. The results of the present study therefore suggest that, in merlin and gannet eggs from the UK, TEQ concentrations can occur at toxicologically significant concentrations and that PCB coplanar congeners are likely to be the main Ah-receptor ligands contributing to this toxicity. The pattern of the relationships between CALUX-TEQ and PCB-TEQ concentrations in the livers that were analysed suggest that total TEQ concentrations, as measured by CALUX assay, are likely to be underestimated by chemical determination of PCB-TEQs. This was particularly true for sparrowhawks and kestrels. Why the correspondence between PCB-TEQ and CALUX-TEQ concentrations was poorer in livers than eggs is uncertain, but may indicate greater assimilation of non-PCB Ah-receptor ligands in the liver compared with that in eggs, and possibly greater metabolism of parent compounds. The resultant metabolites would not be quantified chemically under current PBMS monitoring but might still cause gene induction via the Ah-receptor. However, as with eggs, CALUX-TEQs in liver were most markedly underestimated in samples with low levels of coplanar PCBs. This, together with the step-wise increase in PCB-TEQs with increasing detection of different congeners, also suggests that PCB-TEQs may be lower than CALUX-TEQ concentrations in some samples because coplanar PCB congeners are present but at concentrations below the chemical limits of detection. Even though liver PCB-TEQs were generally lower than CALUX-TEQs in many livers, when there were detectable, they could be used to predict CALUX-TEQ concentrations with considerable accuracy. However, these predictions were species-specific and so cannot be directly extrapolated to other species. Furthermore, it was not possible to predict CALUX-TEQ concentrations in livers that had no detectable PCB-TEQ concentrations; CALUX TEQ concentrations in such samples could be as high as those in livers with multiple coplanar PCBs. The difference between herons and either sparrowhawks or kestrels in the proportion of samples that had detectable CALUX-TEQs but no detectable PCB-TEQ concentrations suggest that there may be differences between species, or possibly more generally between trophic pathways, in the contribution that non-PCBs make to the total TEQ concentration. As when considering eggs, it is pertinent to determine whether measurement of liver PCB-TEQs rather than CALUX-TEQ concentrations is likely to significantly underestimate the potential Ah-receptor toxicity in raptors in Britain. Sparrowhawks had higher CALUX-TEQs than kestrels or herons and the median and maximum CALUX-TEQ concentration in the sparrowhawk livers analysed in the present study were 0.252 ng/g lipid and 0.467 ng/g lipid (252 and 467 pg/g lipid), respectively. These were some 100 and 50 fold lower than the LOEL (25 ng/g lipid) for induction of cytochrome P450 enzymes and reduction in plasma thyroxine levels in common tern chicks (Bosveld et al., 2000). Thus, although

Wildlife and pollution: 2003/2004 Annual report
55
current PBMS monitoring of PCB-TEQs is likely to underestimate liver CALUX-TEQ concentrations in sparrowhawks, kestrels and herons in Britain, it is unlikely to result in an underestimation of toxicity. In conclusion, chemically determined PCB-TEQ concentrations were lower than CALUX-TEQ concentrations in merlin, peregrine falcon and gannet eggs that had relatively low levels of contamination, and in sparrowhawk, kestrel and heron livers that contained less than two detectable coplanar PCBs. In eggs and livers with relatively high levels of coplanar PCBs, PCB-TEQ concentrations were either similar to or exceeded CALUX-TEQ concentrations, suggesting that PCBs comprise most of the Ah-receptor mediated toxicity in these samples. Chemical determination of PCB-TEQs appears likely, therefore, to underestimate total TEQ concentrations (as measured by CALUX assay) in eggs and birds contaminated at low (but not high) levels. This will not cause a significant underestimation of likely toxicity. Overall, chemical and CALUX measurements suggest that TEQ concentrations in the livers of sparrowhawks, kestrels and herons and in the eggs of peregrines from Britain are not at toxicologically significant concentrations, but TEQ concentrations in merlin and gannet eggs can occur at levels that have been associated with adverse effects in other species.
Wildlife and pollution: 2003/04 annual report
56
9 The effect of nutritional state on liver contaminant concentrations
9.1 Introduction In a recent study, Wienburg & Shore (2004) observed that body condition, age, and sex all affected the magnitude of liver PCB concentrations in sparrowhawks and kestrels collected through the PBMS during the 1990s. Body condition was by far the most important factor and explained up to 40% of the variation in liver PCB concentrations. The effect of body condition on liver residues is likely to be due to remobilisation of PCBs from fat as starving birds utilise their fat stores. The result is that there is an inverse relationship between liver PCB residues and the amount of fat stored by the bird. This effect of starvation on liver contaminant concentrations is also likely to occur for organochlorine (OC) pesticides because they too are lipophilic, but would not be expected to have a major influence of inorganic and non-lipophilic compounds such as heavy metals. To date, nutritional status has not been taken into account in any of the PBMS analyses conducted on the long-term declines in OC insecticides and PCBs (see section 2 of this report). Potential variation between years in the proportions of birds that were starving is therefore likely to have introduced considerable variation into the long-term dataset and may mask long-term changes in liver concentrations or the rate of those changes. The aim of this study was to determine whether taking nutritional state into account affected the detection of long-term changes in liver concentrations of three lipophilic compounds (DDE, HEOD and PCBs) and one non-lipophilic compound (total mercury) measured by the PBMS in sparrowhawks, kestrels and herons.
9.2 Methods Sparrowhawk and kestrel carcasses were collected as part of the PBMS over the last 35 years. A post-mortem examination was conducted on all of the carcasses and age, sex, and cause of death were determined. Body condition was also assessed since 1992. This was done by visual inspection and recorded using a nominal scoring system (fat depots assigned a score between 0 and 5), as described by Wienburg & Shore (2004).
Chemical analysis of the livers from each bird was carried out during or in the year following the post-mortem examination. Organochlorine insecticide and total PCB residues were determined using gas chromatography with electron capture detection. Residues were extracted by cold solvent extraction using a 50: 50 mixture of hexane: acetone and subsequently cleaned up using alumina column chromatography to remove interferences. Total mercury determinations were carried out by cold vapour atomic absorption spetrophotometry following nitric acid digestion of the tissues, as described by Shore et al. (2001a). To ensure analytical consistency over time, liver samples were spiked with known concentrations of each analyte. These spiked livers were analysed alongside the unknown livers to determine the recovery of each analyte, and % recovery ranged from 70% to 110% (Newton et al., 1992; Wienburg & Shore, 2004). Latterly (1992 onwards) an ‘in house’ reference tissue has been analysed to ensure consistency in the organochlorine pesticide analysis and only those results falling within a predetermined 95% confidence interval were accepted. To allow comparisons to be made with analytical data from earlier years, the limits of detection for all compounds analysed were taken as 0.01µg/g wet weight.

Wildlife and pollution: 2003/2004 Annual report
57
As with any long term monitoring program there have been minor methodological and instrumental changes over time. Full method and quality assurance details covering the span of the PBMS program are given in Newton et al., (1982), Newton & Galbraith (1991) and Wienburg & Shore (2004). Organochlorine and PCB concentrations are all expressed as µg/g wet wt and mercury concentrations on a dry weight basis (µg/g dry wt). Residue data were not normally distributed and all statistical analyses were carried out on log10 transformed data. Regression analysis of trends in liver concentrations over time used the geometric mean concentration for each year and typically the analyses were weighted, the weighting being the number of birds analysed in the year.
9.3 Results A total of 1944 sparrowhawks, 1283 kestrels and 701 herons were analysed for organochlorine insecticides and PCBs s between 1963 and 2003 (Table 9.1). Table 9.1: Numbers of sparrowhawks, kestrels and herons collected during each decade of the
PBMS that died from starvation (starved) or from other causes (non-starved) Year sparrowhawk kestrel heron
Starved Non -Starve
d
Total Starved Non -Starve
d
Total Starved Non -Starved
Total
1964-1973 6 93 99 88 147 235 22 121 143 1974-1983 88 338 426 181 256 437 65 120 185 1984-1993 236 597 833 260 220 480 96 202 298 1994-2003 156 430 586 63 68 131 29 46 75
The significance of trends in liver concentration over time was first analysed by weighted linear regression using the whole data set for each species. The analysis (Table 9.2, and left hand plots in Figures 9.1 to 9.4) indicated that there were significant declines in liver concentrations of DDE and HEOD in all three species. Total PCBs declined significantly over time in herons but not in sparrowhawks or kestrels. Liver mercury concentrations declined significantly in both kestrels and herons. Although there was also a marked decline in liver mercury in sparrowhawks, this did not achieve significance in the statistical model because of the apparent rise in liver concentrations in recent years (Figure 9.4). To determine how nutritional state might affect detection of changes over time in liver contaminant concentrations, birds were then allocated to one of two groups: birds that had died through starvation (starved birds) and birds that had died from causes other than starvation (non-starved birds). Starved birds by definition had no or, at most, trace amounts of visible fat deposits. Non-starved birds were those that had not died as a direct result of starvation but this did not preclude them from having any particular nutritional state; actual fat scores in individuals were only recorded from 1992. Geometric mean liver concentrations of each contaminant were calculated for starved and non-starved birds in each year and then analysed using a general linear model that used year as a covariate, nutritional state as a factor, and their interaction term. In all cases, data for different species were analysed separately. The changes in liver concentrations over time in starved and non-starved birds are shown in the right hand plots of Figures 9.1 through to 9.4 for DDE, HEOD, PCBs and mercury respectively, and the outputs from the GLMs are given in Table 9.3.
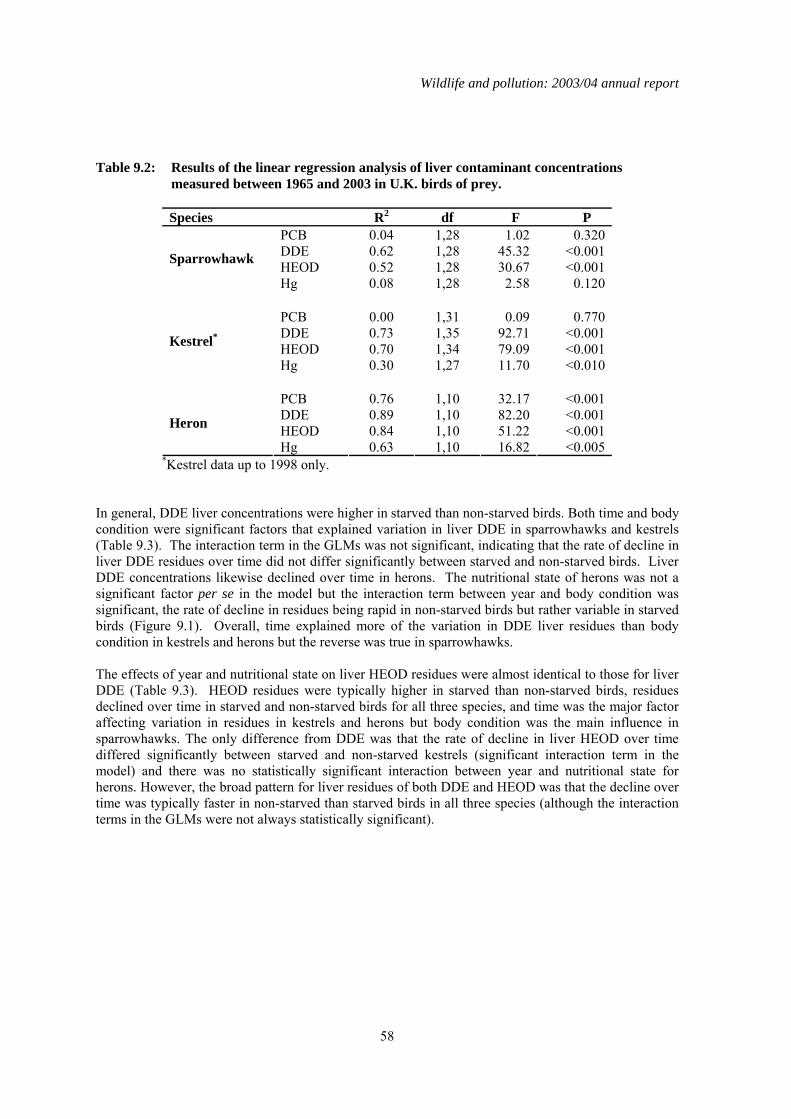
Wildlife and pollution: 2003/04 annual report
58
Table 9.2: Results of the linear regression analysis of liver contaminant concentrations
measured between 1965 and 2003 in U.K. birds of prey.
Species R2 df F P PCB 0.04 1,28 1.02 0.320 DDE 0.62 1,28 45.32 <0.001 HEOD 0.52 1,28 30.67 <0.001 Sparrowhawk
Hg 0.08 1,28 2.58 0.120
PCB 0.00 1,31 0.09 0.770 DDE 0.73 1,35 92.71 <0.001 HEOD 0.70 1,34 79.09 <0.001 Kestrel*
Hg 0.30 1,27 11.70 <0.010
PCB 0.76 1,10 32.17 <0.001 DDE 0.89 1,10 82.20 <0.001 HEOD 0.84 1,10 51.22 <0.001 Heron
Hg 0.63 1,10 16.82 <0.005 *Kestrel data up to 1998 only. In general, DDE liver concentrations were higher in starved than non-starved birds. Both time and body condition were significant factors that explained variation in liver DDE in sparrowhawks and kestrels (Table 9.3). The interaction term in the GLMs was not significant, indicating that the rate of decline in liver DDE residues over time did not differ significantly between starved and non-starved birds. Liver DDE concentrations likewise declined over time in herons. The nutritional state of herons was not a significant factor per se in the model but the interaction term between year and body condition was significant, the rate of decline in residues being rapid in non-starved birds but rather variable in starved birds (Figure 9.1). Overall, time explained more of the variation in DDE liver residues than body condition in kestrels and herons but the reverse was true in sparrowhawks. The effects of year and nutritional state on liver HEOD residues were almost identical to those for liver DDE (Table 9.3). HEOD residues were typically higher in starved than non-starved birds, residues declined over time in starved and non-starved birds for all three species, and time was the major factor affecting variation in residues in kestrels and herons but body condition was the main influence in sparrowhawks. The only difference from DDE was that the rate of decline in liver HEOD over time differed significantly between starved and non-starved kestrels (significant interaction term in the model) and there was no statistically significant interaction between year and nutritional state for herons. However, the broad pattern for liver residues of both DDE and HEOD was that the decline over time was typically faster in non-starved than starved birds in all three species (although the interaction terms in the GLMs were not always statistically significant).
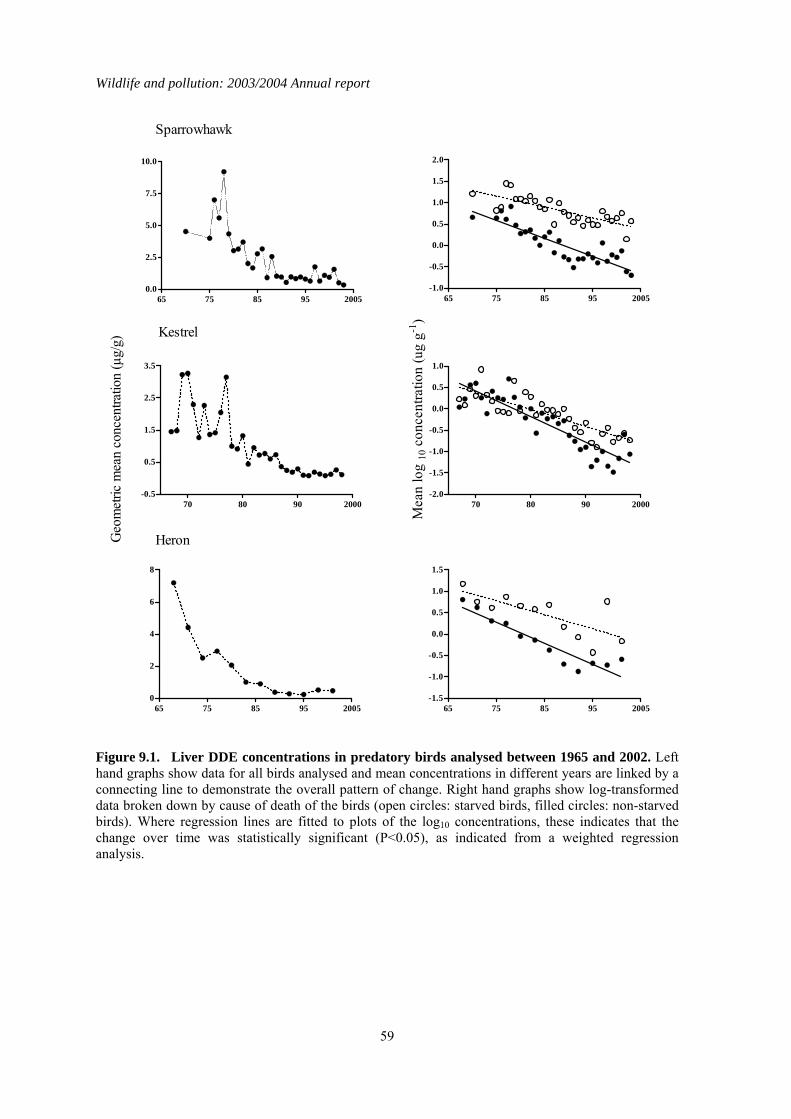
Wildlife and pollution: 2003/2004 Annual report
59
65 75 85 95 20050.0
2.5
5.0
7.5
10.0
65 75 85 95 2005-1.0
-0.5
0.0
0.5
1.0
1.5
2.0
70 80 90 2000-0.5
0.5
1.5
2.5
3.5
70 80 90 2000-2.0
-1.5
-1.0
-0.5
0.0
0.5
1.0
65 75 85 95 20050
2
4
6
8
65 75 85 95 2005-1.5
-1.0
-0.5
0.0
0.5
1.0
1.5
Sparrowhawk
Kestrel
HeronGeo
met
ric m
ean
conc
entra
tion
(µg/
g)
Mea
n lo
g10
con
cent
ratio
n (u
g g-1
)
Figure 9.1. Liver DDE concentrations in predatory birds analysed between 1965 and 2002. Left hand graphs show data for all birds analysed and mean concentrations in different years are linked by a connecting line to demonstrate the overall pattern of change. Right hand graphs show log-transformed data broken down by cause of death of the birds (open circles: starved birds, filled circles: non-starved birds). Where regression lines are fitted to plots of the log10 concentrations, these indicates that the change over time was statistically significant (P<0.05), as indicated from a weighted regression analysis.
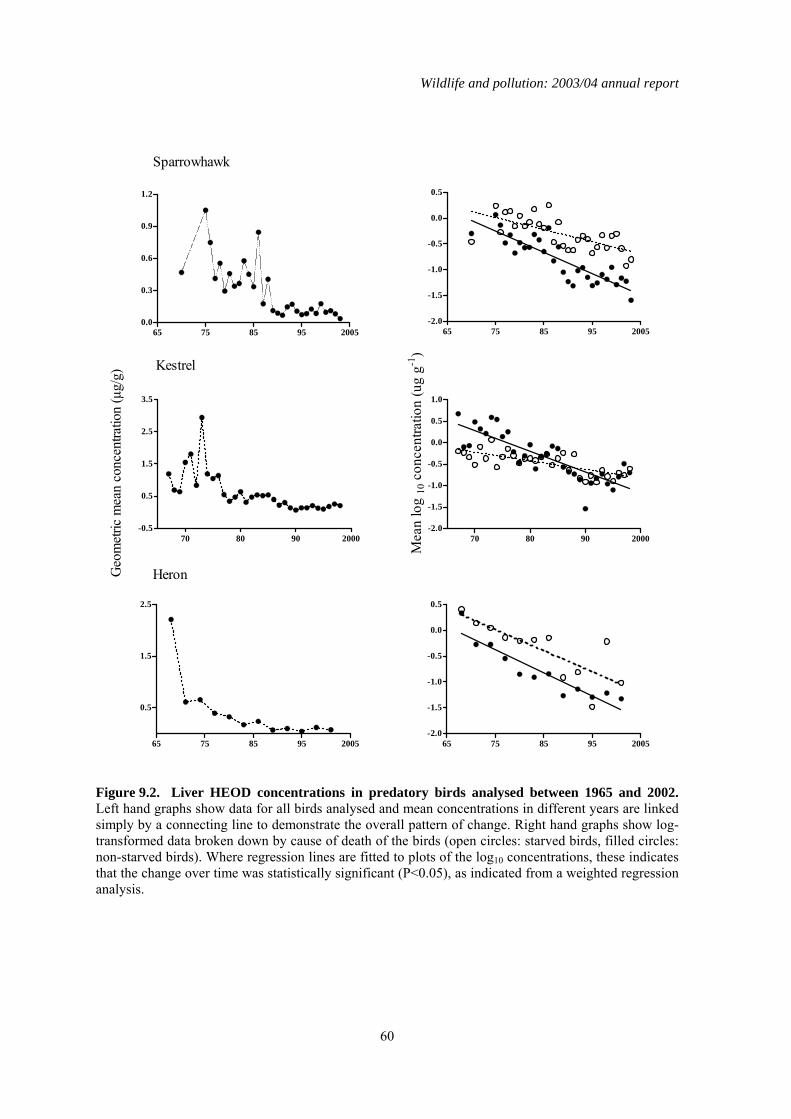
Wildlife and pollution: 2003/04 annual report
60
65 75 85 95 20050.0
0.3
0.6
0.9
1.2
65 75 85 95 2005-2.0
-1.5
-1.0
-0.5
0.0
0.5
70 80 90 2000-0.5
0.5
1.5
2.5
3.5
70 80 90 2000-2.0
-1.5
-1.0
-0.5
0.0
0.5
1.0
65 75 85 95 2005
0.5
1.5
2.5
65 75 85 95 2005-2.0
-1.5
-1.0
-0.5
0.0
0.5
Sparrowhawk
Kestrel
HeronGeo
met
ric m
ean
conc
entra
tion
(µg/
g)
Mea
n lo
g10
con
cent
ratio
n (u
g g-1
)
Figure 9.2. Liver HEOD concentrations in predatory birds analysed between 1965 and 2002. Left hand graphs show data for all birds analysed and mean concentrations in different years are linked simply by a connecting line to demonstrate the overall pattern of change. Right hand graphs show log-transformed data broken down by cause of death of the birds (open circles: starved birds, filled circles: non-starved birds). Where regression lines are fitted to plots of the log10 concentrations, these indicates that the change over time was statistically significant (P<0.05), as indicated from a weighted regression analysis.
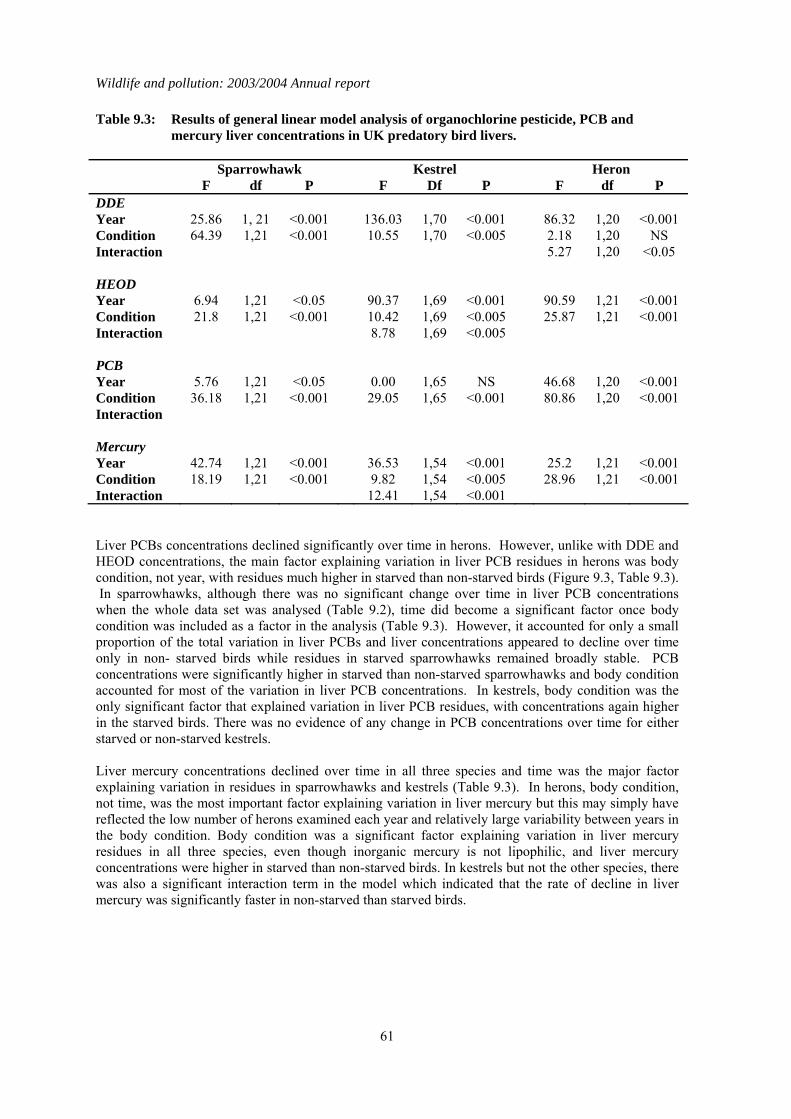
Wildlife and pollution: 2003/2004 Annual report
61
Table 9.3: Results of general linear model analysis of organochlorine pesticide, PCB and mercury liver concentrations in UK predatory bird livers.
Sparrowhawk Kestrel Heron F df P F Df P F df P DDE Year 25.86 1, 21 <0.001 136.03 1,70 <0.001 86.32 1,20 <0.001 Condition 64.39 1,21 <0.001 10.55 1,70 <0.005 2.18 1,20 NS Interaction 5.27 1,20 <0.05 HEOD Year 6.94 1,21 <0.05 90.37 1,69 <0.001 90.59 1,21 <0.001 Condition 21.8 1,21 <0.001 10.42 1,69 <0.005 25.87 1,21 <0.001 Interaction 8.78 1,69 <0.005 PCB Year 5.76 1,21 <0.05 0.00 1,65 NS 46.68 1,20 <0.001 Condition 36.18 1,21 <0.001 29.05 1,65 <0.001 80.86 1,20 <0.001 Interaction Mercury Year 42.74 1,21 <0.001 36.53 1,54 <0.001 25.2 1,21 <0.001 Condition 18.19 1,21 <0.001 9.82 1,54 <0.005 28.96 1,21 <0.001 Interaction 12.41 1,54 <0.001 Liver PCBs concentrations declined significantly over time in herons. However, unlike with DDE and HEOD concentrations, the main factor explaining variation in liver PCB residues in herons was body condition, not year, with residues much higher in starved than non-starved birds (Figure 9.3, Table 9.3). In sparrowhawks, although there was no significant change over time in liver PCB concentrations when the whole data set was analysed (Table 9.2), time did become a significant factor once body condition was included as a factor in the analysis (Table 9.3). However, it accounted for only a small proportion of the total variation in liver PCBs and liver concentrations appeared to decline over time only in non- starved birds while residues in starved sparrowhawks remained broadly stable. PCB concentrations were significantly higher in starved than non-starved sparrowhawks and body condition accounted for most of the variation in liver PCB concentrations. In kestrels, body condition was the only significant factor that explained variation in liver PCB residues, with concentrations again higher in the starved birds. There was no evidence of any change in PCB concentrations over time for either starved or non-starved kestrels. Liver mercury concentrations declined over time in all three species and time was the major factor explaining variation in residues in sparrowhawks and kestrels (Table 9.3). In herons, body condition, not time, was the most important factor explaining variation in liver mercury but this may simply have reflected the low number of herons examined each year and relatively large variability between years in the body condition. Body condition was a significant factor explaining variation in liver mercury residues in all three species, even though inorganic mercury is not lipophilic, and liver mercury concentrations were higher in starved than non-starved birds. In kestrels but not the other species, there was also a significant interaction term in the model which indicated that the rate of decline in liver mercury was significantly faster in non-starved than starved birds.
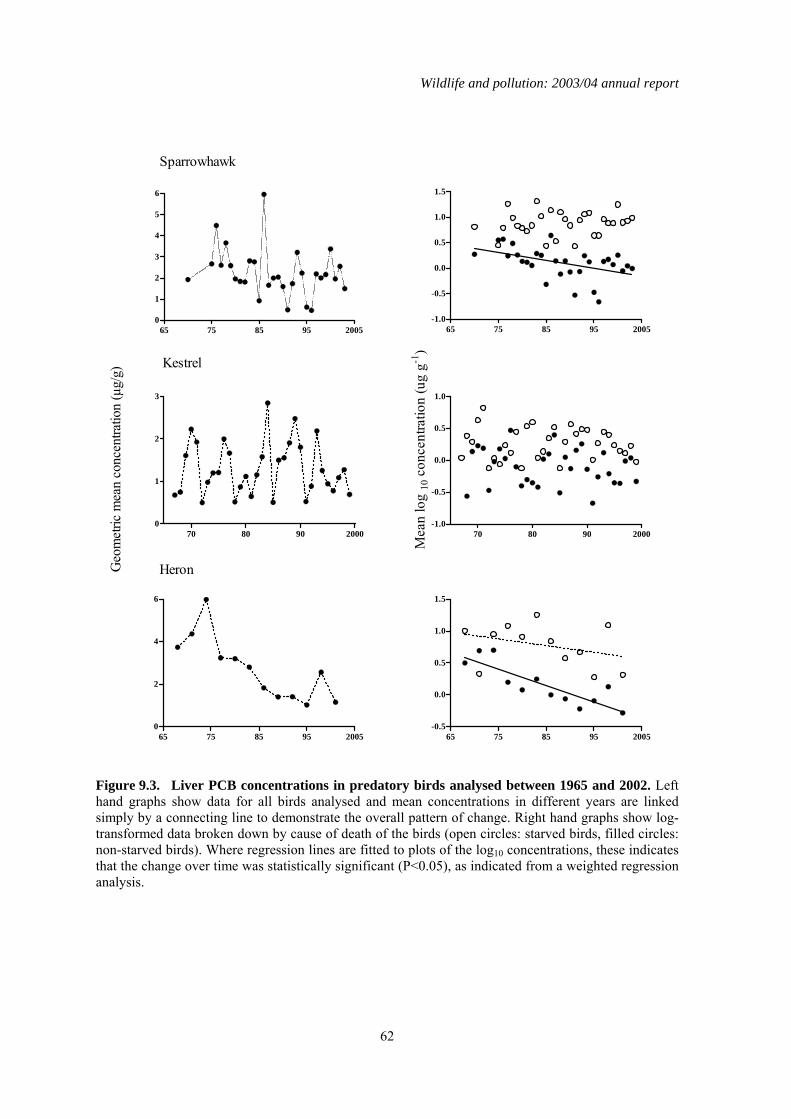
Wildlife and pollution: 2003/04 annual report
62
65 75 85 95 20050
1
2
3
4
5
6
65 75 85 95 2005-1.0
-0.5
0.0
0.5
1.0
1.5
70 80 90 20000
1
2
3
70 80 90 2000-1.0
-0.5
0.0
0.5
1.0
65 75 85 95 20050
2
4
6
65 75 85 95 2005-0.5
0.0
0.5
1.0
1.5
Sparrowhawk
Kestrel
HeronGeo
met
ric m
ean
conc
entra
tion
(µg/
g)
Mea
n lo
g10
con
cent
ratio
n (u
g g-1
)
Figure 9.3. Liver PCB concentrations in predatory birds analysed between 1965 and 2002. Left hand graphs show data for all birds analysed and mean concentrations in different years are linked simply by a connecting line to demonstrate the overall pattern of change. Right hand graphs show log-transformed data broken down by cause of death of the birds (open circles: starved birds, filled circles: non-starved birds). Where regression lines are fitted to plots of the log10 concentrations, these indicates that the change over time was statistically significant (P<0.05), as indicated from a weighted regression analysis.
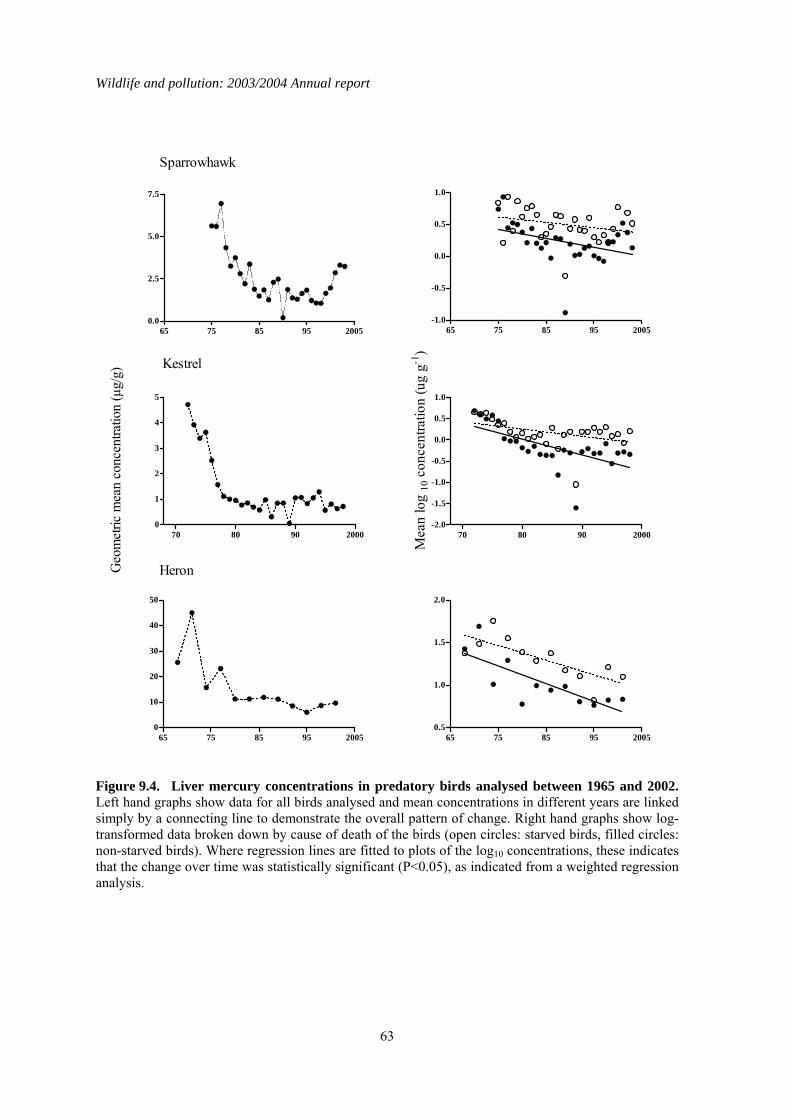
Wildlife and pollution: 2003/2004 Annual report
63
65 75 85 95 20050.0
2.5
5.0
7.5
65 75 85 95 2005-1.0
-0.5
0.0
0.5
1.0
70 80 90 20000
1
2
3
4
5
70 80 90 2000-2.0
-1.5
-1.0
-0.5
0.0
0.5
1.0
65 75 85 95 20050
10
20
30
40
50
65 75 85 95 20050.5
1.0
1.5
2.0
Sparrowhawk
Kestrel
HeronGeo
met
ric m
ean
conc
entra
tion
(µg/
g)
Mea
n lo
g10
con
cent
ratio
n (u
g g-1
)
Figure 9.4. Liver mercury concentrations in predatory birds analysed between 1965 and 2002. Left hand graphs show data for all birds analysed and mean concentrations in different years are linked simply by a connecting line to demonstrate the overall pattern of change. Right hand graphs show log-transformed data broken down by cause of death of the birds (open circles: starved birds, filled circles: non-starved birds). Where regression lines are fitted to plots of the log10 concentrations, these indicates that the change over time was statistically significant (P<0.05), as indicated from a weighted regression analysis.
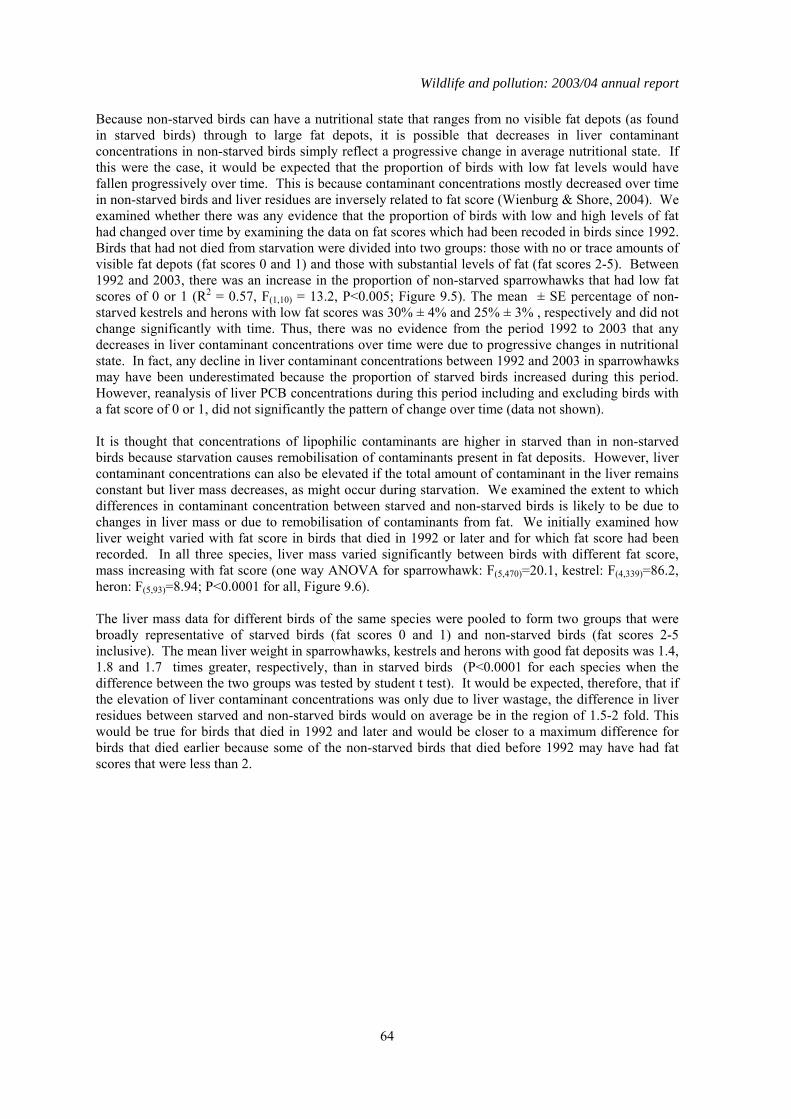
Wildlife and pollution: 2003/04 annual report
64
Because non-starved birds can have a nutritional state that ranges from no visible fat depots (as found in starved birds) through to large fat depots, it is possible that decreases in liver contaminant concentrations in non-starved birds simply reflect a progressive change in average nutritional state. If this were the case, it would be expected that the proportion of birds with low fat levels would have fallen progressively over time. This is because contaminant concentrations mostly decreased over time in non-starved birds and liver residues are inversely related to fat score (Wienburg & Shore, 2004). We examined whether there was any evidence that the proportion of birds with low and high levels of fat had changed over time by examining the data on fat scores which had been recoded in birds since 1992. Birds that had not died from starvation were divided into two groups: those with no or trace amounts of visible fat depots (fat scores 0 and 1) and those with substantial levels of fat (fat scores 2-5). Between 1992 and 2003, there was an increase in the proportion of non-starved sparrowhawks that had low fat scores of 0 or 1 (R2 = 0.57, F(1,10) = 13.2, P<0.005; Figure 9.5). The mean ± SE percentage of non-starved kestrels and herons with low fat scores was 30% ± 4% and 25% ± 3% , respectively and did not change significantly with time. Thus, there was no evidence from the period 1992 to 2003 that any decreases in liver contaminant concentrations over time were due to progressive changes in nutritional state. In fact, any decline in liver contaminant concentrations between 1992 and 2003 in sparrowhawks may have been underestimated because the proportion of starved birds increased during this period. However, reanalysis of liver PCB concentrations during this period including and excluding birds with a fat score of 0 or 1, did not significantly the pattern of change over time (data not shown). It is thought that concentrations of lipophilic contaminants are higher in starved than in non-starved birds because starvation causes remobilisation of contaminants present in fat deposits. However, liver contaminant concentrations can also be elevated if the total amount of contaminant in the liver remains constant but liver mass decreases, as might occur during starvation. We examined the extent to which differences in contaminant concentration between starved and non-starved birds is likely to be due to changes in liver mass or due to remobilisation of contaminants from fat. We initially examined how liver weight varied with fat score in birds that died in 1992 or later and for which fat score had been recorded. In all three species, liver mass varied significantly between birds with different fat score, mass increasing with fat score (one way ANOVA for sparrowhawk: F(5,470)=20.1, kestrel: F(4,339)=86.2, heron: F(5,93)=8.94; P<0.0001 for all, Figure 9.6). The liver mass data for different birds of the same species were pooled to form two groups that were broadly representative of starved birds (fat scores 0 and 1) and non-starved birds (fat scores 2-5 inclusive). The mean liver weight in sparrowhawks, kestrels and herons with good fat deposits was 1.4, 1.8 and 1.7 times greater, respectively, than in starved birds (P<0.0001 for each species when the difference between the two groups was tested by student t test). It would be expected, therefore, that if the elevation of liver contaminant concentrations was only due to liver wastage, the difference in liver residues between starved and non-starved birds would on average be in the region of 1.5-2 fold. This would be true for birds that died in 1992 and later and would be closer to a maximum difference for birds that died earlier because some of the non-starved birds that died before 1992 may have had fat scores that were less than 2.
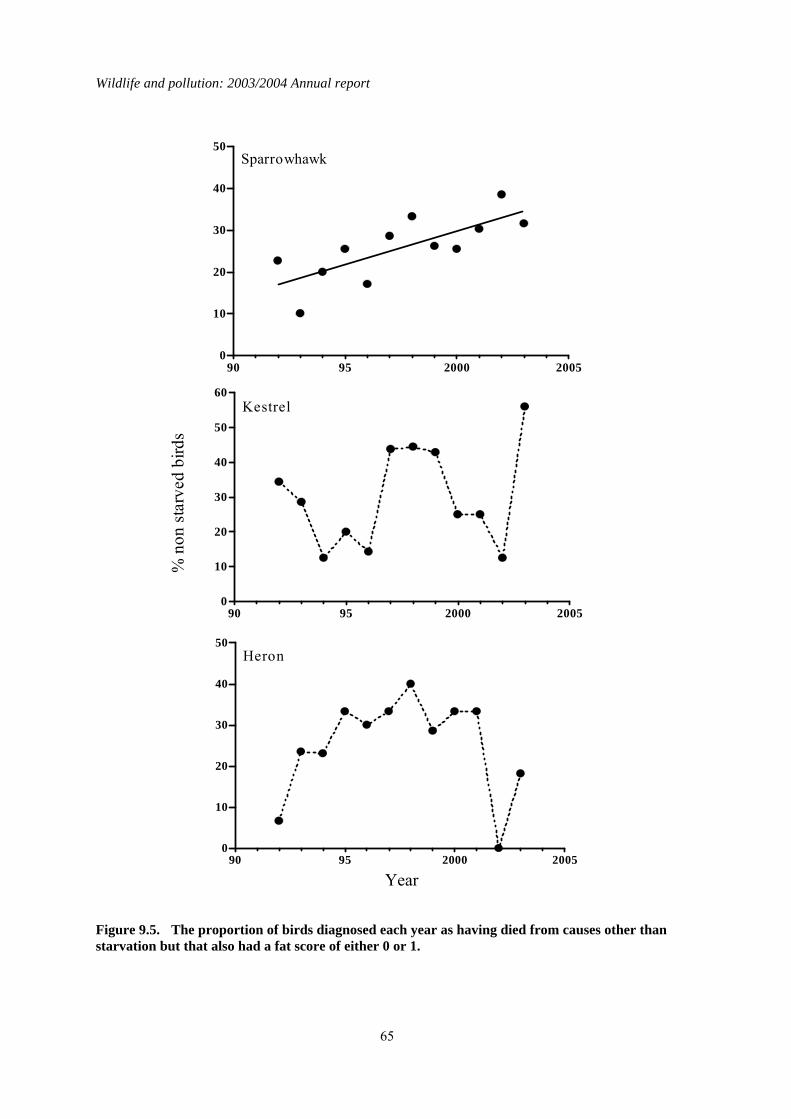
Wildlife and pollution: 2003/2004 Annual report
65
90 95 2000 20050
10
20
30
40
50
90 95 2000 20050
10
20
30
40
50
60
90 95 2000 20050
10
20
30
40
50
% n
on s
tarv
ed b
irds
Year
Sparrowhawk
Kestrel
Heron
Figure 9.5. The proportion of birds diagnosed each year as having died from causes other than starvation but that also had a fat score of either 0 or 1.

Wildlife and pollution: 2003/04 annual report
66
Fat 0 Fat 1 Fat 2 Fat 3 Fat 4 Fat 5 0&1 2-50
2
4
6
8
10
12
14
Fat 0 Fat 1 Fat 2 Fat 3 Fat 4 0&1 2-50
2
4
6
8
10
12
Fat 0 Fat 1 Fat 2 Fat 3 Fat 4 Fat 5 0&1 2-50
10
20
30
40
50
60
Live
r Wei
ght (
g)
Fat Score
Sparrowhawk
Kestrel
Heron
Figure 9.6. Mean ± SE liver weights of sparrowhawks, kestrels and herons with different fat scores.
Wildlife and pollution: 2003/2004 Annual report
67
We then plotted the ratio of mean contaminant concentration in starved birds to mean contaminant in non-starved birds (birds separated by cause of death, not fat score) by year across for the whole of the long-term contaminant data. The concentration ratios of all of the highly lipid soluble compounds increased over time in sparrowhawks; PCB and DDE concentration ratios were in the range of 1-19 and HEOD was in the range 0.7–10 (Figure 9.7). The high concentration ratios in later years were much larger than the differences that would have been predicted if the elevation in liver residues was only the result of liver wastage, and so provides evidence that sparrowhawks do indeed remobilise lipophilic compounds as they starve. In kestrels, DDE and HEOD concentration ratios increased as occurred in sparrowhawks, and achieved higher values than would have been predicted from liver wastage alone. However, PCB concentration ratios in kestrels were constant with a mean (± SE) value of 3.0 ± 0.4, fairly similar to that which would be predicted from loss of liver mass alone. Therefore, there is relatively little evidence from these data that kestrels accumulate large PCB concentrations in fat. Concentration ratios in herons did not vary over time, but mean (± SE) concentration ratios were 5.4 ± 0.9, 6.7 ± 2.3 and 3.4 ± 0.7 for PCBs, DDE and HEOD respectively, suggesting that, as with sparrowhawks, lipophilic compounds are accumulated in and remobilized from fat. Analysis of mercury concentration ratios over time (Figure 9.8) revealed a slight increase in mercury concentration ratios in kestrels between the 1970s and 2003 (R2=0.21, F(1,28)=7.01, p<0.05) but not in other species. The mean concentration ratio in each species was 2.2 and this is consistent with the concept that differences in liver mercury concentrations between starved and non-starved birds are solely due to loss of liver mass occurring during starvation.
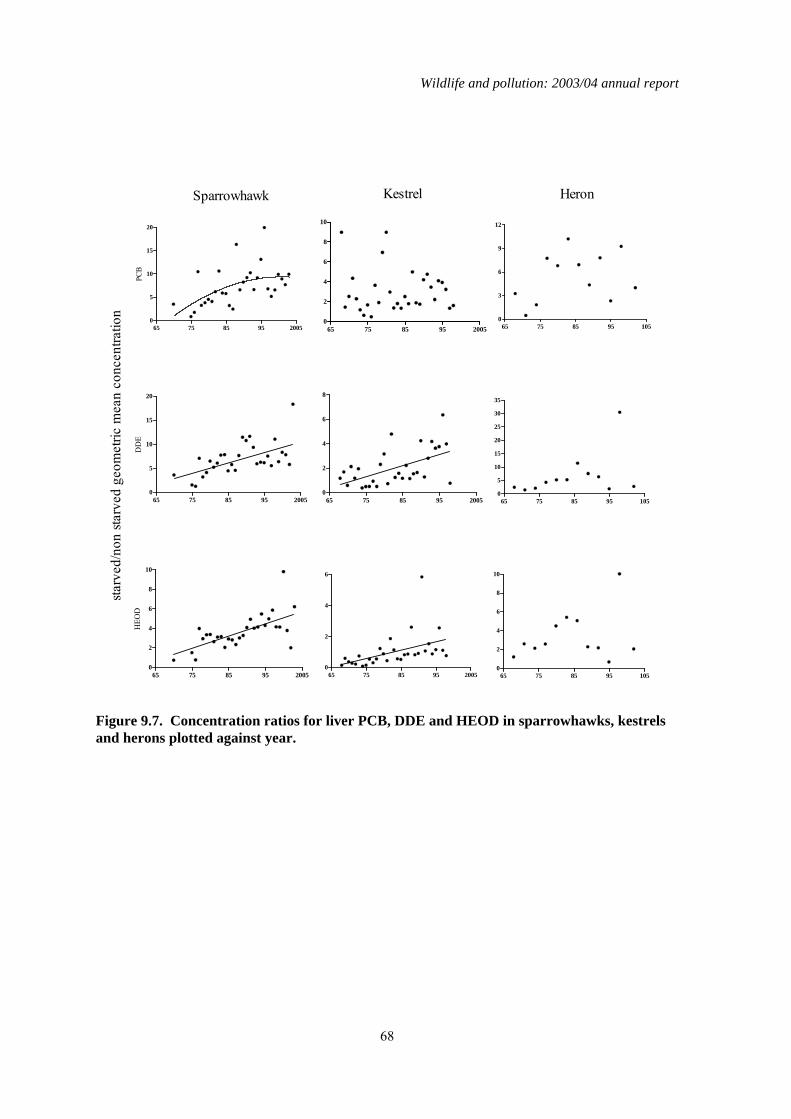
Wildlife and pollution: 2003/04 annual report
68
65 75 85 95 20050
5
10
15
20
PCB
65 75 85 95 20050
2
4
6
8
10
65 75 85 95 1050
3
6
9
12
65 75 85 95 20050
5
10
15
20
DD
E
65 75 85 95 20050
2
4
6
8
65 75 85 95 1050
5
10
15
20
25
30
35
65 75 85 95 20050
2
4
6
8
10
HEO
D
65 75 85 95 20050
2
4
6
65 75 85 95 1050
2
4
6
8
10
Sparrowhawk Kestrel Heron
starv
ed/n
on st
arve
d ge
omet
ric m
ean
conc
entra
tion
Figure 9.7. Concentration ratios for liver PCB, DDE and HEOD in sparrowhawks, kestrels and herons plotted against year.

Wildlife and pollution: 2003/2004 Annual report
69
65 75 85 95 20050
1
2
3
4
65 75 85 95 20050
2
4
6
8
10
65 75 85 95 20050
1
2
3
4
5
6
star
ved/
non
star
ved
geom
etric
mea
n co
ncen
tratio
n µg
/g w
w
Year
Sparrowhawk
Kestrel
Heron
Figure 9.8. Concentration ratios of liver mercury concentrations in sparrowhawks, kestrels and herons plotted against year.
Wildlife and pollution: 2003/04 annual report
70
9.4 Discussion In terms of overall trends over time, the decrease in liver concentrations of DDE and HEOD and mercury detected in both starved and non-starved birds reflect the trends reported by Newton & Wyllie (1992), Newton et al. (1992) and in the current report, even though that analysis did not take nutritional state of the bird into account. The declines reflect the large-scale reduction in the exposure of predatory birds following the restrictions placed on the agricultural use of these compounds in the UK and elsewhere. The rates of decline in DDE and HEOD concentrations over the monitoring period were typically greater in non-starved than starved birds. This would be expected for lipophilic compounds. Liver residues in non-starved birds are likely to be in some form of equilibrium with the levels of contaminant ingested in prey, and with the amount of contaminant stored elsewhere in the body (including fat). Thus, changes in liver residues over time in non-starved birds should broadly reflect changes in exposure, and thus changes in environmental concentrations. In contrast, starved birds deplete their fat depots and remobilised lipophilic compounds accumulated in fat. This, together with liver wastage, elevates liver contaminant concentrations. The extent to which liver concentrations would be increased would be likely to depend, at least in part, on how much contaminant had been accumulated in fat and this, in turn, is likely to be influenced by other factors, including age, sex and breeding history (Wienburg & Shore, 2004). Thus, liver residues in starved birds are, in part, likely to reflect long-term assimilation of lipophilic compounds rather than current exposure, and, compared with non-starved birds, changes over time may not be so closely linked with changes in environmental concentrations. It was notable that often there was little difference in liver HEOD and DDE concentrations between starved and non-starved birds in the earlier years in which monitoring was conducted. This may have been because birds suffered high levels of exposure during this time period and liver tissues in heavily exposed individuals, such as those which were fatally poisoned, may have been saturated, or close to saturation, with DDE or HEOD, irrespective of whether birds had starved. However, liver mercury residues were also somewhat similar in starved and non-starved birds in the 1960s. As our analysis gave no indication that mercury is accumulated in or remobilized from fat in predatory birds, it would be expected that declines over time in liver mercury concentrations would occur at the same rate in starved and non-starved birds, although absolute liver concentrations would differ because of liver wastage. The most likely explanation of why residues were similar in the 1960s would be that the proportion of non-starved birds that had some degree of liver wastage (perhaps due to onset of starvation or other causes) may have been somewhat higher in the early years of monitoring than in subsequent years. Thus, liver residues of mercury and other compounds would have been elevated (through liver wastage) in non-starved birds and the difference in residue magnitude between the starved and non-starved groups would have been lower than in later years. The implication of this for the long-term monitoring is that the early rates of decline in liver contaminant concentrations may have been somewhat overestimated because the monitoring data did not take nutritional state into account. Despite restrictions on the production and use of PCBs imposed during the 1970s, the long-term monitoring has only detected a decline in liver PCB residues in herons, not in sparrowhawks or kestrels. However, once nutritional state was taken into account, a decline in liver PCB concentrations was apparent in non-starved sparrowhawks. Thus, failure to take nutritional state of the bird into account can mask changes in environmental concentrations. This masking of true environmental trends may even apply when only considering non-starved birds, as the proportion of non-starved sparrowhawks with low fat scores has increased in recent years. Thus we may have underestimated the rate of decline in liver PCB concentrations in non-starved sparrowhawks in recent years. The use of a more subtle, and continuously variable, measure of body far is needed to take the effect of condition on liver residue more fully into account.
Wildlife and pollution: 2003/2004 Annual report
71
Perhaps the most surprising finding of this study was that, even when body condition was taken into account, there was no evidence that liver PCB concentrations have declined in kestrels, and there was also no evidence that kestrels accumulate significant amounts of PCBs in body fat. Kestrels have significantly lower OC and PCB levels than either sparrowhawks or herons (Newton et al., 1992; Wienburg & Shore, 2004) and Walker et al. (1987) demonstrated that kestrels have higher hepatic P450 activity than sparrowhawks, and so are better able to metabolise PCBs. Thus, it is possible that kestrels eliminate much of their ingested PCB burden and variation in liver residues between birds may largely reflect individual variation in detoxification capacity. If this is the case, this would mean that kestrels may not be a suitable species for monitoring environmental trends in PCBs, and possibly in other lipophilic organic contaminants. In conclusion, this study has demonstrated that inter-year variation in the proportion of birds in different nutritional states can obscure and/or delay the detection of changes in exposure to environmental contaminants. This was most apparent in the PBMS data for sparrowhawks, in which declines in liver PCB concentrations over time were only apparent once nutritional state was taken into account. Starvation was found to increase liver contaminant concentrations partly through remobilisation of residues from fat (and possibly other body tissues), although this was a relatively minor effect in kestrels for compounds such as PCBs. Starvation also increased liver contaminant concentrations because it was associated with liver wastage, which alone can elevate liver concentrations by two-three fold. Because of the physiological impacts of starvation, it is clearly important to take body condition into account when conducting long-term monitoring of liver contaminant concentrations in birds and other biota. This can be done by incorporating a measure of nutritional state as a factor in the data analysis and is necessary when monitoring inorganic as well as organic compounds because of the effects of liver wastage. Alternatively, data for animals in poor nutritional condition can be excluded from analysis when the aim is specifically to determine changes in environmental exposure, although such exclusion is likely to lead to an overall loss of information. Furthermore, examination of data for animals in poor nutritional state is important because starved individuals may be most at risk of suffering organ toxicity as they experience the highest internal doses of the contaminant.
Wildlife and pollution: 2003/04 annual report
72
10 Contaminant levels in sprats and sandeels from the North Sea
10.1 Introduction The breeding season in 2004 was the worst on record for many species of seabirds in the North Sea (Mavor et al., 2005). The situation appeared particularly critical for the common guillemot (hereafter guillemot) Uria aalge with many chicks dying, apparently of starvation, before they left the colony. One of the most obvious differences in the feeding behaviour of guillemots in 2004 compared with earlier years was that adults predominantly fed their chicks on sprats (Sprattus sprattus) rather than lesser sandeels (Ammodytes marinus). Despite this, preliminary calculations of the energy intake of guillemot chicks at CEH’s long term study site on the Isle of May off the southeast coast of Scotland did not differ from the long term average. These calculations were based on the observed frequency with which chicks were fed combined with prey energy values that were derived from previously published species-specific relationships between total energy value and fish length. Thus, observations on feeding rate did not support the hypothesis that food availability was the main cause for the poor reproductive performance. Two possible causes for the observed reproductive failure were that some or all of the prey eaten by chicks was of poor nutritional quality (ie, sprats or sandeels or both species contained less nutritional value than measured in previous years) and/or contained high levels of contaminants that adversely affected growth. To investigate these hypotheses, sprats and sandeels collected from seabirds on the Isle of May in 2004 were analysed for nutrients and contaminants. The analysis of the nutrient content of guillemot prey formed part of a study that was separate from the Wildlife & Pollution contract. The results from that study are reported elsewhere (Wanless et al., 2005), and essentially demonstrated that nutrient levels in both sprats and sandeels were significantly lower than expected based on analysis of fish from earlier years. The analysis of fish for organochlorines, mercury, and for zinc (a key essential element for growth in chicks) was conducted as part of the current Wildlife & Pollution contract and the results are reported here. The aims of this component of work was therefore to quantify contaminant and zinc (Zn) levels in the two main prey species fed to the chicks and assess whether excessive (contaminant) or low Zn concentrations may have adversely affect growth in guillemots.
10.2 Methods Fish brought in to feed young guillemots and Atlantic puffins (Fratercula arctica) on the Isle of May were collected and taken to the laboratory where they were measured (total length from tip of the snout to the end of the tail) and frozen for subsequent analysis. Prey items carried back to the colony lose mass due to dehydration (Montevecchi & Piatt, 1987) and so pollutant concentrations are expressed on a lipid weight (organic contaminants) or dry weight (metals) basis. Chemical analysis for organochlorines and mercury employed the same methods used to measure these contaminants in bird tissues and eggs. Zinc concentrations were measured in acid-digested samples using flame atomic absorption spectrophotometry.
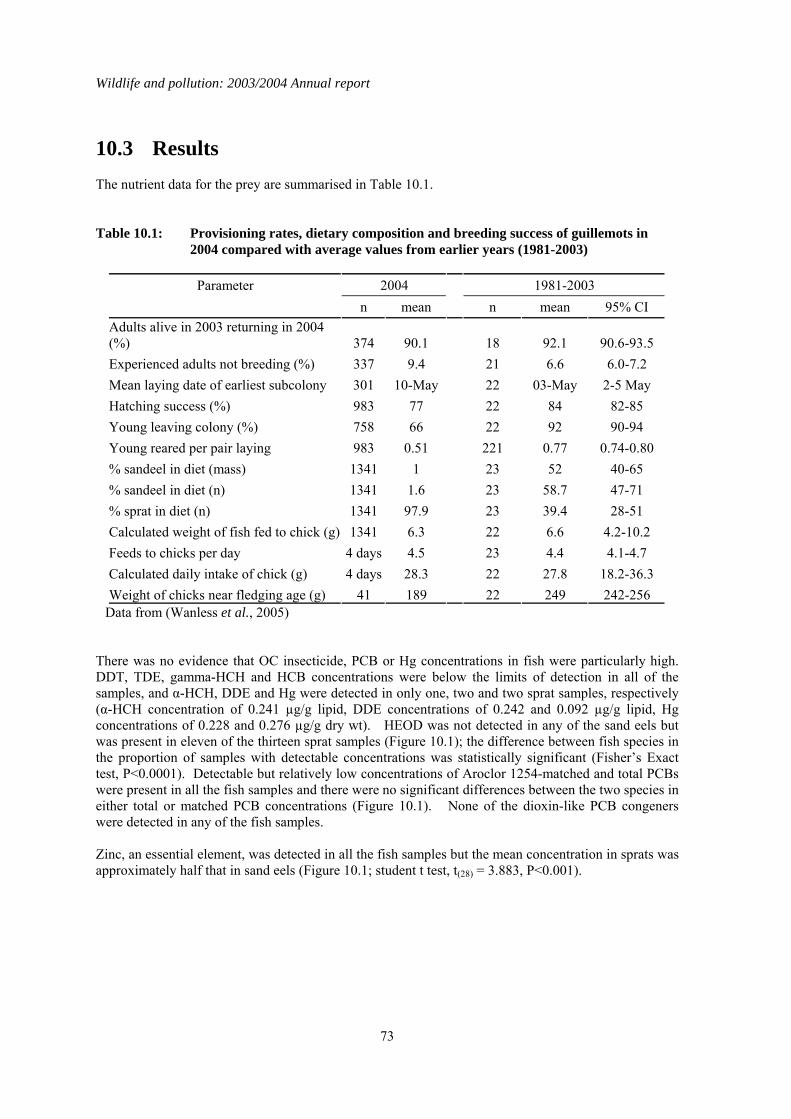
Wildlife and pollution: 2003/2004 Annual report
73
10.3 Results The nutrient data for the prey are summarised in Table 10.1. Table 10.1: Provisioning rates, dietary composition and breeding success of guillemots in
2004 compared with average values from earlier years (1981-2003)
Parameter 2004 1981-2003 n mean n mean 95% CI
Adults alive in 2003 returning in 2004 (%) 374 90.1 18 92.1 90.6-93.5 Experienced adults not breeding (%) 337 9.4 21 6.6 6.0-7.2 Mean laying date of earliest subcolony 301 10-May 22 03-May 2-5 May Hatching success (%) 983 77 22 84 82-85 Young leaving colony (%) 758 66 22 92 90-94 Young reared per pair laying 983 0.51 221 0.77 0.74-0.80 % sandeel in diet (mass) 1341 1 23 52 40-65 % sandeel in diet (n) 1341 1.6 23 58.7 47-71 % sprat in diet (n) 1341 97.9 23 39.4 28-51 Calculated weight of fish fed to chick (g) 1341 6.3 22 6.6 4.2-10.2 Feeds to chicks per day 4 days 4.5 23 4.4 4.1-4.7 Calculated daily intake of chick (g) 4 days 28.3 22 27.8 18.2-36.3 Weight of chicks near fledging age (g) 41 189 22 249 242-256
Data from (Wanless et al., 2005) There was no evidence that OC insecticide, PCB or Hg concentrations in fish were particularly high. DDT, TDE, gamma-HCH and HCB concentrations were below the limits of detection in all of the samples, and α-HCH, DDE and Hg were detected in only one, two and two sprat samples, respectively (α-HCH concentration of 0.241 µg/g lipid, DDE concentrations of 0.242 and 0.092 µg/g lipid, Hg concentrations of 0.228 and 0.276 µg/g dry wt). HEOD was not detected in any of the sand eels but was present in eleven of the thirteen sprat samples (Figure 10.1); the difference between fish species in the proportion of samples with detectable concentrations was statistically significant (Fisher’s Exact test, P<0.0001). Detectable but relatively low concentrations of Aroclor 1254-matched and total PCBs were present in all the fish samples and there were no significant differences between the two species in either total or matched PCB concentrations (Figure 10.1). None of the dioxin-like PCB congeners were detected in any of the fish samples. Zinc, an essential element, was detected in all the fish samples but the mean concentration in sprats was approximately half that in sand eels (Figure 10.1; student t test, t(28) = 3.883, P<0.001).
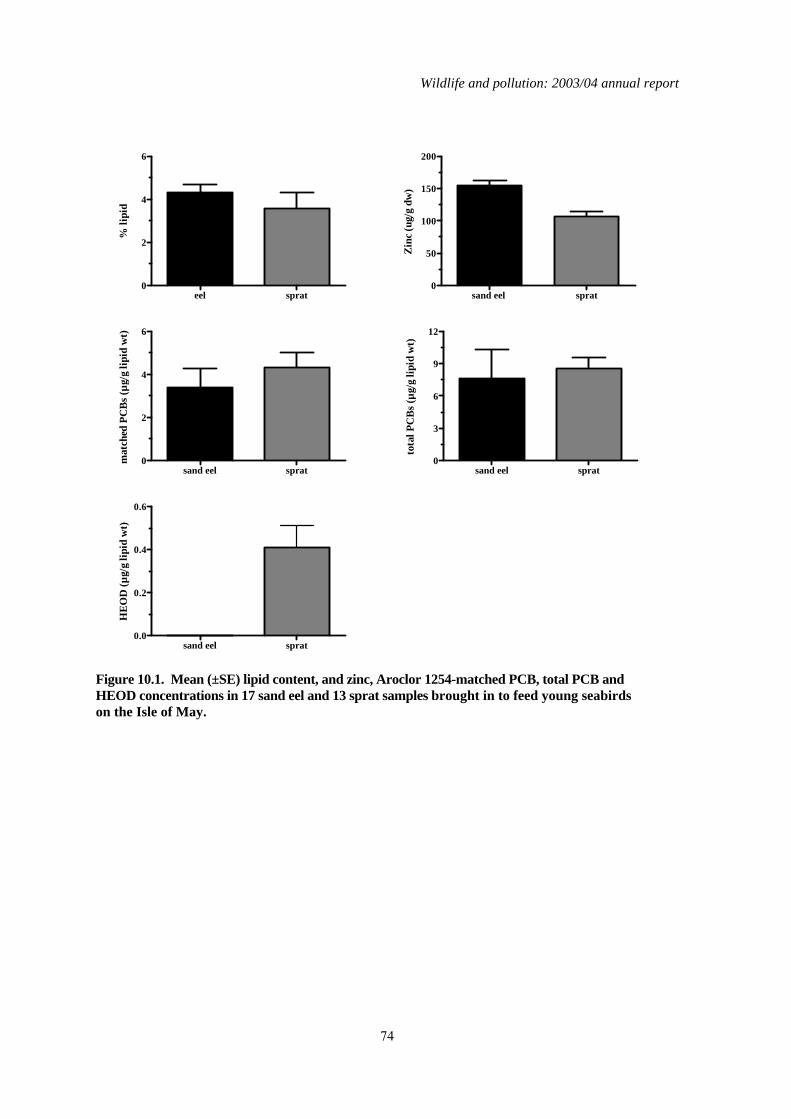
Wildlife and pollution: 2003/04 annual report
74
eel sprat0
2
4
6
% li
pid
sand eel sprat0
50
100
150
200
Zin
c (ug
/g d
w)
sand eel sprat0
2
4
6
mat
ched
PC
Bs (
µg/g
lipi
d w
t)
sand eel sprat0
3
6
9
12
tota
l PC
Bs (
µg/g
lipi
d w
t)
sand eel sprat0.0
0.2
0.4
0.6
HEO
D (µ
g/g
lipid
wt)
Figure 10.1. Mean (±SE) lipid content, and zinc, Aroclor 1254-matched PCB, total PCB and HEOD concentrations in 17 sand eel and 13 sprat samples brought in to feed young seabirds on the Isle of May.

Wildlife and pollution: 2003/2004 Annual report
75
10.4 Discussion The major differences between the sand eels and sprats in terms of their contaminant and trace element concentrations was that sprats had significantly more HEOD and less zinc than sprats. There were no significant differences between the fish species in the other contaminants that were determined in the study. The dietary switch by guillemots and other seabirds from sand eels to sprats would have been expected to increase their daily intake of HEOD. However, this is unlikely to have had a significant toxicological impact. Review of chronic intake studies conducted in a variety of avian species (WHO, 1989) suggests that a HEOD concentration of 1.6 mg/kg diet is the lowest observed effect concentration (LOEC) for reproductive endpoints. This was associated with reduced eggshell thickness in mallard ducks (Anas platyrhynchos) fed the contaminated diet for 16 months. Lower dietary concentrations (0.5 mg/kg diet) given to barn owls for two years had no effect on reproductive success. The mean and maximum wet weight HEOD concentrations measured in sprats were 0.01 µg/g and 0.02 µg/g respectively, more than 100 and 50 fold lower than the LOEC described for mallards. The only other contaminants detected in most of the fish samples were PCBs. The lack of any significant difference between sprats and sandeels in total or matched PCBs suggests that the PCB intake of guillemot chicks should not be affected by dietary switches between sprats and sandeels. Furthermore, mean wet weight concentrations of Aroclor 1254-matched PCB were approximately 0.1 µg/g but adverse effects in birds tend to be associated with dietary concentrations greater than 20 µg/g wet weight (Hoffman et al., 1996). Thus PCB concentrations in sprats and eels are probably at least 200 fold below concentrations likely to cause significant harm to the birds. In terms of essential nutrients, the switch from sand eels to sprats as major prey would also have been expected to result in a reduced intake of zinc by seabird chicks. Deficiencies in dietary zinc intake can affect growth rate, body weight, bone, skin and feather development. Experimental studies on chickens and turkeys suggest that dietary concentrations of between approximately 20 and 30 mg Zn/kg diet are needed for optimum development, although this can vary with diet composition and vary between species (Dewar & Downie, 1984; Emmert & Baker, 1995). The mean wet weight concentrations for zinc in the sandeels and sprats analysed in the present study were 42.7 µg/g and 28.3 µg/g, respectively. The diet that seabird chicks were fed on the Isle of May therefore had average zinc concentrations that would be expected to be adequate for poultry chicks, even when the diet was almost exclusively comprised of sprats. Thus, although the dietary zinc requirements for guillemot chicks are not known, there is no strong evidence to support the idea that chicks fed on sprats were likely to be suffering from significant zinc deficiency. In conclusion, although sprats appeared to be poorer diet than sand eels in that they contained higher levels of HEOD and less Zn, there is no clear evidence that the Zn or contaminant concentrations in sprats were likely to account for the poor breeding success of guillemots in 2004. It would appear from the wider nutrient analysis of the fish (Wanless et al., 2005) that both the sand eels and the sprats collected in 2004 had significantly lower energy value than expected and poor food quality appeared to be the proximate cause of the seabird breeding failure. The reasons for the poor fish condition in 2004 in the region of the North Sea around the Isle of May are uncertain.

Wildlife and pollution: 2003/04 annual report
76
11 References
Ahlborg, U.G., Brouwer, A., Fingerhut, M.A., Jacobson, J.L., Jacobson, S.W., Kennedy, S.W., Kettrup, A.A.F., Koeman, J.H., Poiger, H., Rappe, C., Safe, C.H., Seegal, R.F., Tuomisto, J. & van den Berg, M. (1992). Impact of polychlorinated dibenzo-p-dioxins, dibenzofurans and biphenyls on human and environmental health, with special emphasis on the toxic equivalency factor concept. European Journal of Pharmacology 228: 179-199.
Ahlborg, U.G., Becking, G.C., Birnbaum, L.S., Brouwer, A., Derks, H.J.G.M., Feeley, M., Golor, G., Hanberg, A., Larsen, J.C., Liem, A.k.D., Safe, S.H., Schlatter, C., Wærn, F., Younes, M. & Yrjänheikki, E. (1994). Toxic equivalency factors for dioxin-like PCBs. Chemosphere 28: 1049-1067.
AMAP (1998). AMAP asssessment report: arctic pollution issues. Arctic monitoring and assessment programme (AMAP), Oslo, Norway.
Ballschmiter, K. & Zell, M. (1980). Analysis of polychlorinated biphenyls (PCB) by glass capillary gas chromatography. Fesnius Zeitschrift für Analtische Chemie 302: 20-31.
Blus, L.J. (1996). DDT, DDD and DDE in birds. In Environmental contaminants in wildlife: interpreting tissue concentrations. (ed: Beyer, WN, Heinz, GH & Redmon-Norwood, AW), CRC Lewis Publishers, Boca Raton, pp. 49-71.
Bosveld, A.T.C., Nieboer, R., de Bont, A., Mennen, J., Murk, A.J., Feyk, L.A., Giesy, J.P. & van den Berg, M. (2000). Biochemical and developmental effects of dietary exposure to polychlorinated biphenyls 126 and 153 in common tern chicks (Sterna hirundo). Environmental Toxicology and Chemistry 19: 719-730.
Chapdelaine, G., Laporte, P. & Nettleship, D.N. (1987). Population, productivity and DDT contamination trends of northern gannets (Sula bassanus) at Bonaventure Island, Quebec, 1967-1984. Canadian Journal of Zoology 65: 2922-2926.
Coady, K.K., Jones, P.D. & John, P. (2001). 2,3,7,8-tetrachlorodibenzo-p-dioxin equivalents in tissue samples from three species in the Denver, Colorado, USA, metropolitan area. Environmental Toxicology and Chemistry 20: 2433-2442.
Cooke, A.S. (1973). Shell thinning in avian eggs by environmental pollutants. Environmental Pollution 4: 85-152.
Denison, M.S. & HeathPagliuso, S. (1998). The Ah receptor: A regulator of the biochemical and toxicological actions of structurally diverse chemicals. Bulletin of Environmental Contamination and Toxicology 61: 557-568.
Dennis, R.H., Ellis, P.M., Broad, R.A. & Langslow, D.R. (1984). The status of the golden eagle in Britain. British Birds 77: 592-607.
Dewar, W.A. & Downie, J.N. (1984). The zinc requirements of broiler chicks and turkey poults fed on purified diets. British Journal of Nutrition 51: 467-477.
Elliott, J.E., Norstrom, R.J. & Keith, J.A. (1988). Organochlorines and eggshell thinning in northern gannets (Sula bassanus) from Eastern Canada, 1968-1984. Environmental Pollution 52: 81-102.
Emmert, J.L. & Baker, D.H. (1995). Zinc stores in chickens delay the onset of zinc deficiency symptoms. Poultry Science 74: 1011-1021.
Fimreite, N., Brevik, E.M. & Torp, R. (1982). Mercury and organochlorines in eggs from a Norwegian gannet colony. Bulletin of Environmental Contamination and Toxicology 28: 58-60.
Harper, P.A., Riddick, D.S. & Okey, A.B. (2006). Regulating the regulator: Factors that control levels and activity of the aryl hydrocarbon receptor. Biochemical Pharmacology 72: 267-279.
Hoffman, D.J., Rice, C.P. & Kubiak, T.J. (1996). PCBs and dioxins in birds. In Environmental contaminants in wildlife: interpreting tissue concentrations. (ed: Beyer, WN, Heinz, GH & Redmon-Norwood, AW), CRC Lewis Publishers, Boca Raton, pp. 165-207.
Hoffman, D.J., Rattner, B.A., Scheunert, I. & Korte, F. (2001). Environmental contaminants. In The ecotoxicology of wild mammals. (ed: Shore, RF & Rattner, BA), John Wiley & Sons, Chichester, pp. 1-48.
Wildlife and pollution: 2003/2004 Annual report
77
Hunter, K. (1985). High-performance liquid chromatographic strategies for the determination and confirmation of anticoagulent rodenticide residues in animal tissues. Journal of Chromatography 321: 255-272.
Kannan, K., Kumar, K.S., Nakata, H., Falandysz, J., Oehme, G. & Masunaga, S. (2003). Polychlorinated biphenyls, dihenzo-p-dioxins, dihenzofurans, and p,p '-DDE in livers of white-tailed sea eagles from eastern Germany, 1979-1998. Environmental Science & Technology 37: 1249-1255.
Lockie, J.D., Ratcliffe, D.A. & Balharry, R. (1969). Breeding success and dieldrin contamination of golden eagles in western Scotland. Journal of Applied Ecology 6: 381-389.
Mavor, R.A., Parsons, M., Heubeck, M. & Schmitt, S. (2005). Seabird numbers and breeding success in Britain and Ireland, 2004. (UK Nature Conservation No.28). Joint Nature Conservation Committee, Peterborough,
Montevecchi, W.A. & Piatt, J.F. (1987). Dehydration of seabird prey during transport to the colony: effects of wet weight on energy densities. Canadian Journal of Zoology 65: 2822-2824.
Murk, A.J., Leonards, P.E.G., van Hattum, B., Luit, R., van der Weiden, M.E.J. & Smit, M. (1998). Application of biomarkers for exposure and effect of polyhalogenated aromatic hydrocarbons in naturally exposed European otters (Lutra lutra). Environmental Toxicology and Pharmacology 6: 91-102.
Newton, I., Bogan, J., Meek, E. & Little, B. (1982). Organochlorine compounds and shell-thinning in British merlins Falco columbarius. Ibis 124: 328-335.
Newton, I. (1986). The Sparrowhawk. T. & A.D Poyser, Calton. Newton, I. (1988). Determination of critical pollutant levels in wild populations, with examples from
organochlorine insecticides in birds of prey. Environmental Pollution 55: 29-40. Newton, I. & Haas, M.B. (1988). Pollutants in merlin eggs and their effects on breeding. British Birds
81: 258-269. Newton, I., Haas, M.B. & Freestone, P. (1990). Trends in organochlorine and mercury levels in gannet
eggs. Environmental Pollution 63: 1-12. Newton, I. & Galbraith, E.A. (1991). Organochlorines and mercury in the eggs of golden eagles Aquila
chrysaetos from Scotland. Ibis 133: 115-120. Newton, I. & Wyllie, I. (1992). Recovery of a Sparrowhawk population in relation to declining
pesticide contamination. Journal of Applied Ecology 29: 476-484. Newton, I., Wyllie, I. & Asher, A. (1992). Mortality from the pesticides aldrin and dieldrin in British
sparrowhawks and kestrels. Ecotoxicology 1: 31-44. Newton, I., Wyllie, I. & Asher, A. (1993). Long-term trends in organochlorine and mercury residues in
some predatory birds in Britain. Environmental Pollution 79: 143-151. Newton, I., Dale, L., Finnie, J.K., Freestone, P., Wright, J., Wyatt, C. & Wyllie, I. (1998). Wildlife and
Pollution: 1997/98. Annual Report. JNCC Report No. 285, Joint Nature Conservation Committee, Peterborough, UK, pp. 61.
Newton, I., Dale, L. & Little, B. (1999a). Trends in organochlorine and mercurial compounds in the eggs of British merlins Falco columbarius. Bird Study 46: 356-362.
Newton, I., Shore, R.F., Wyllie, I., Birks, J.D.S. & Dale, L. (1999b). Empirical evidence of side-effects of rodenticides on some predatory birds and mammals. In Advances in vertebrate pest management. (ed: Cowan, DP & Feare, CJ), Filander Verlag, Fürth, pp. 347-367.
Peakall, D.B. (1996). Dieldrin and other cyclodiene pesticides in wildlife. In Environmental contaminants in wildlife: interpreting tissue concentrations. (ed: Beyer, WN, Heinz, GH & Redmon-Norwood, AW), CRC Lewis Publishers, Boca Raton, pp. 73-97.
Ratcliffe, P.R. (1980). The peregrine falcon. Poyser, Calton. Senthilkumar, K., Iseki, N., Hayama, S., Nakanishi, J. & Masunaga, S. (2002). Polychlorinated
dibenzo-p-dioxins, dibenzofurans, and dioxin- like polychlorinated biphenyls in livers of birds from Japan. Archives of Environmental Contamination and Toxicology 42: 244-255.
Wildlife and pollution: 2003/04 annual report
78
Shore, R.F., Casulli, A., Bologov, V., Wienburg, C.L., Afsar, A., Toyne, P. & Dell'Omo, G. (2001a). Organochlorine pesticide, polychlorinated biphenyl and heavy metal concentrations in wolves (Canis lupus L. 1758) from north-west Russia. Science of the Total Environment 280: 45-54.
Shore, R.F., Malcolm, H.M., Horne, J.A., Turner, S. & Wienburg, C.L. (2001b). Rodenticide residues in the kestrel Falco tinnunculus. Centre for Ecology & Hydrology Contract Report to English Nature, English Nature, Peterborough, UK, pp. 17.
Shore, R.F., Malcolm, H.M., Wienburg, C.L., Turk, A., Walker, L.A. & Horne, J.A. (2005a). Wildlife and pollution: 2000/01 Annual report. JNCC Report, No. 351. Joint Nature Conservation Committee, Peterborough, UK, pp. 49.
Shore, R.F., Malcolm, H.M., Wienburg, C.L., Turk, A., Walker, L.A. & Horne, J.A. (2005b). Wildlife and pollution: 2001/02 Annual report. JNCC Report, No. 352. Joint Nature Conservation Committee, Peterborough, UK, pp. 26.
Shore, R.F., Malcolm, H.M., McLennan, D., Turk, A., Walker, L.A., Wienburg, C.L. & A., B. (2006). Did Foot and Mouth Disease control operations affect rodenticide exposure in raptors? Journal of Wildlife Management 70: 588-593.
Shore, R.F., Malcolm, H.M., Turk, A., Walker, L.A., Wienburg, C.L., Wright, J.A., Broughton, R.K. & Wadsworth, R.A. (in press). Wildlife and pollution: 2002/03 Annual report. JNCC report number 390 . Joint Nature Conservation Committee, Peterborough, UK,
Thompson, D.R. (1996). Mercury in birds and terrestrial mammals. In Environmental contaminants in wildlife: interpreting tissue concentrations. (ed: Beyer, WN, Heinz, GH & Redmon-Norwood, AW), CRC Lewis Publishers, Boca Raton, pp. 341-356.
Van den Berg, M., Birnbaum, L., Bosveld, A.T.C., Brunstrom, B., Cook, P., Feeley, M., Giesy, J.P., Hanberg, A., Hasegawa, R., Kennedy, S.W., Kubiak, T., Larsen, J.C., van Leeuwen, F.X.R., Liem, A.K.D., Nolt, C., Peterson, R.E., Poellinger, L., Safe, S., Schrenk, D., Tillitt, D., Tysklind, M., Younes, M., Waern, F. & Zacharewski, T. (1998). Toxic equivalency factors (TEFs) for PCBs, PCDDs, PCDFs for humans and wildlife. Environmental Health Perspectives 106: 775-792. http://ehpnet771.niehs.nih.gov/docs/1998/1106p1775-1792vandenberg/abstract.html.
van den Berg, M., Birnbaum, L.S., Denison, M., De Vito, M., Farland, W., Feeley, M., Fiedler, H., Hakansson, H., Hanberg, A., Haws, L., Rose, M., Safe, S., Schrenk, D., Tohyama, C., Tritscher, A., Tuomisto, J., Tysklind, M., Walker, N. & Peterson, R.E. (2006). The 2005 World Health Organization Re-evaluation of Human and Mammalian Toxic Equivalency Factors for Dioxins and Dioxin-like Compounds. Toxicological Sciences in press.
Walker, C.H., Newton, I., Hallam, S.D. & Ronis, M.J.J. (1987). Activities and toxicological significance of hepatic-microsomal enzymes of the kestrel (Falco tinnunculus) and sparrowhawk (Accipiter nisus). Comparative Biochemistry and Physiology C-Pharmacology Toxicology & Endocrinology 86: 379-382.
Wanless, S., Harris, M.P., Redman, P. & Speakman, J.R. (2005). Low energy values of fish as a probable cause of a major seabird breeding failure in the North Sea. Marine Ecology-Progress Series 294: 1-8.
WHO (1989). Environmental Health Criteria 91: Aldrin and dieldrin. WHO, Geneva, pp. 335. Wiemeyer, S.N. (1996). Other organochlorine pesticides in birds. In Environmental contaminants in
wildlife: interpreting tissue concentrations. (ed: Beyer, WN, Heinz, GH & Redmon-Norwood, AW), CRC Lewis Publishers, Boca Raton, pp. 99-115.
Wienburg, C.L. & Shore, R.F. (2004). Factors influencing PCB concentrations in the livers of predatory birds in Britain. Environmental Pollution 132: 41-50.
Windal, I., Denison, M.S., Birnbaum, L.S., Van Wouwe, N., Baeyens, W. & Goeyens, L. (2005). Chemically-activated luciferase gene expression (CALUX) cell bioassay analysis for the estimation of dioxin like activity: critical parameters of the CALUX procedure that impact assay results. Environmental Science & Technology 39: 7359-7364.
Wildlife and pollution: 2003/2004 Annual report
79
12 Appendix
In the following tables, PCB congeners are identified using the nomenclature of (Ballschmiter & Zell, 1980) and the Toxic Equivalency Factors (TEFs) are from Ahlborg et al. (1994) and Van den Berg et al. (1998). Toxic Equivalent (TEQ) concentrations for individual congeners are calculated as the product of the congener concentration and the congener-specific TEF value. Non-detected values for specific congeners are assigned a concentration value of zero when calculating the TEQ; sum TEQ concentrations are the sum of the congener specific concentrations. Lipid wt concentrations for PCB congeners and TEQs can be calculated by multiplying the wet wt concentrations by the conversion factor (CF).
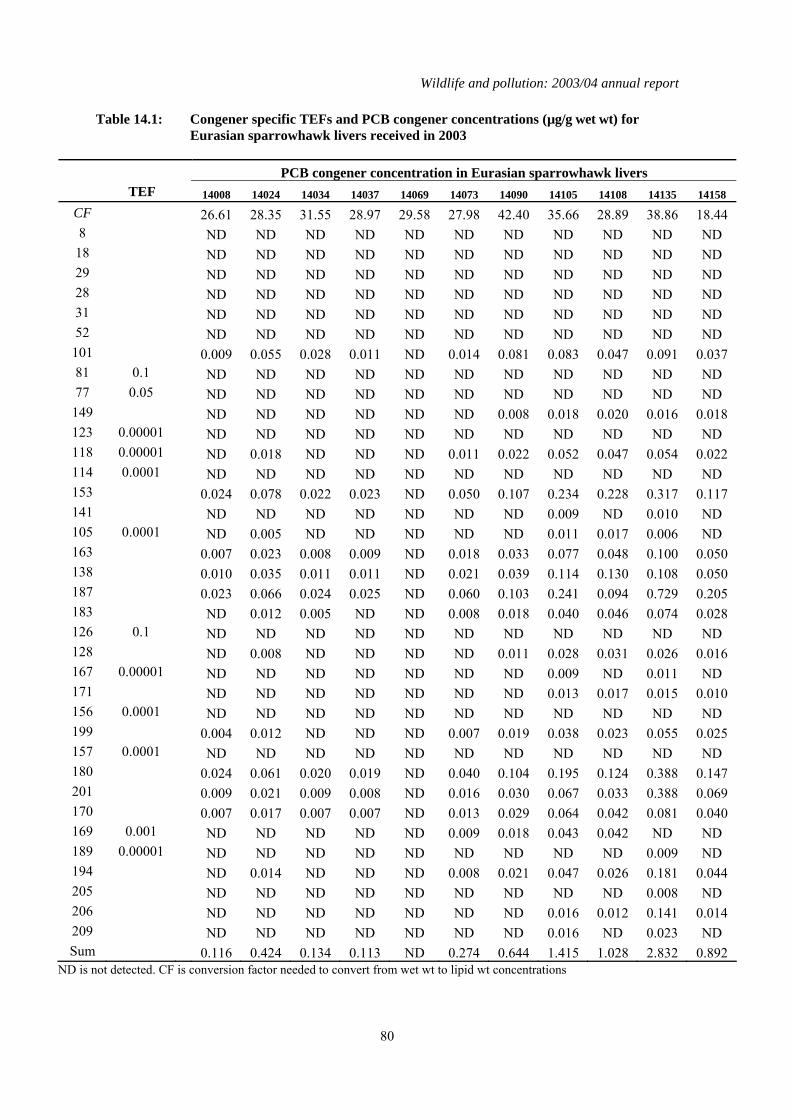
Wildlife and pollution: 2003/04 annual report
80
Table 14.1: Congener specific TEFs and PCB congener concentrations (µg/g wet wt) for Eurasian sparrowhawk livers received in 2003
PCB congener concentration in Eurasian sparrowhawk livers TEF 14008 14024 14034 14037 14069 14073 14090 14105 14108 14135 14158
CF 26.61 28.35 31.55 28.97 29.58 27.98 42.40 35.66 28.89 38.86 18.44 8 ND ND ND ND ND ND ND ND ND ND ND
18 ND ND ND ND ND ND ND ND ND ND ND 29 ND ND ND ND ND ND ND ND ND ND ND 28 ND ND ND ND ND ND ND ND ND ND ND 31 ND ND ND ND ND ND ND ND ND ND ND 52 ND ND ND ND ND ND ND ND ND ND ND
101 0.009 0.055 0.028 0.011 ND 0.014 0.081 0.083 0.047 0.091 0.037 81 0.1 ND ND ND ND ND ND ND ND ND ND ND 77 0.05 ND ND ND ND ND ND ND ND ND ND ND
149 ND ND ND ND ND ND 0.008 0.018 0.020 0.016 0.018 123 0.00001 ND ND ND ND ND ND ND ND ND ND ND 118 0.00001 ND 0.018 ND ND ND 0.011 0.022 0.052 0.047 0.054 0.022 114 0.0001 ND ND ND ND ND ND ND ND ND ND ND 153 0.024 0.078 0.022 0.023 ND 0.050 0.107 0.234 0.228 0.317 0.117 141 ND ND ND ND ND ND ND 0.009 ND 0.010 ND 105 0.0001 ND 0.005 ND ND ND ND ND 0.011 0.017 0.006 ND 163 0.007 0.023 0.008 0.009 ND 0.018 0.033 0.077 0.048 0.100 0.050 138 0.010 0.035 0.011 0.011 ND 0.021 0.039 0.114 0.130 0.108 0.050 187 0.023 0.066 0.024 0.025 ND 0.060 0.103 0.241 0.094 0.729 0.205 183 ND 0.012 0.005 ND ND 0.008 0.018 0.040 0.046 0.074 0.028 126 0.1 ND ND ND ND ND ND ND ND ND ND ND 128 ND 0.008 ND ND ND ND 0.011 0.028 0.031 0.026 0.016 167 0.00001 ND ND ND ND ND ND ND 0.009 ND 0.011 ND 171 ND ND ND ND ND ND ND 0.013 0.017 0.015 0.010 156 0.0001 ND ND ND ND ND ND ND ND ND ND ND 199 0.004 0.012 ND ND ND 0.007 0.019 0.038 0.023 0.055 0.025 157 0.0001 ND ND ND ND ND ND ND ND ND ND ND 180 0.024 0.061 0.020 0.019 ND 0.040 0.104 0.195 0.124 0.388 0.147 201 0.009 0.021 0.009 0.008 ND 0.016 0.030 0.067 0.033 0.388 0.069 170 0.007 0.017 0.007 0.007 ND 0.013 0.029 0.064 0.042 0.081 0.040 169 0.001 ND ND ND ND ND 0.009 0.018 0.043 0.042 ND ND 189 0.00001 ND ND ND ND ND ND ND ND ND 0.009 ND 194 ND 0.014 ND ND ND 0.008 0.021 0.047 0.026 0.181 0.044 205 ND ND ND ND ND ND ND ND ND 0.008 ND 206 ND ND ND ND ND ND ND 0.016 0.012 0.141 0.014 209 ND ND ND ND ND ND ND 0.016 ND 0.023 ND Sum 0.116 0.424 0.134 0.113 ND 0.274 0.644 1.415 1.028 2.832 0.892
ND is not detected. CF is conversion factor needed to convert from wet wt to lipid wt concentrations
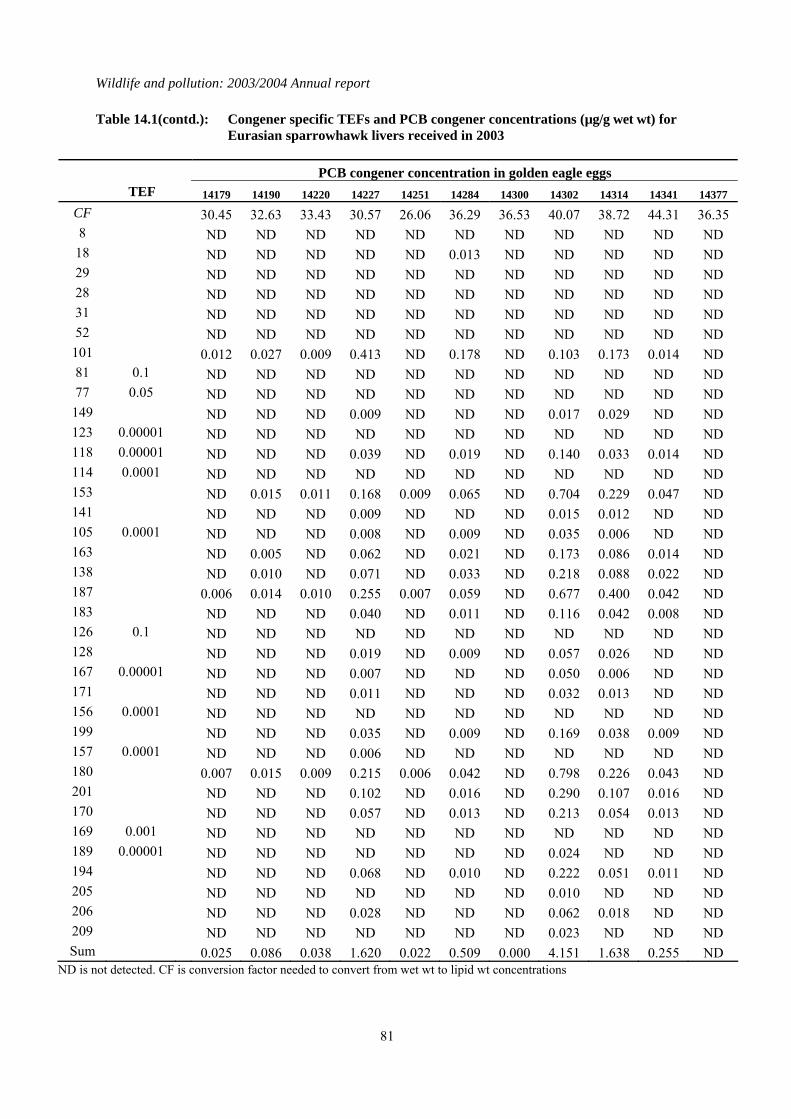
Wildlife and pollution: 2003/2004 Annual report
81
Table 14.1(contd.): Congener specific TEFs and PCB congener concentrations (µg/g wet wt) for Eurasian sparrowhawk livers received in 2003
PCB congener concentration in golden eagle eggs TEF 14179 14190 14220 14227 14251 14284 14300 14302 14314 14341 14377
CF 30.45 32.63 33.43 30.57 26.06 36.29 36.53 40.07 38.72 44.31 36.35 8 ND ND ND ND ND ND ND ND ND ND ND
18 ND ND ND ND ND 0.013 ND ND ND ND ND 29 ND ND ND ND ND ND ND ND ND ND ND 28 ND ND ND ND ND ND ND ND ND ND ND 31 ND ND ND ND ND ND ND ND ND ND ND 52 ND ND ND ND ND ND ND ND ND ND ND
101 0.012 0.027 0.009 0.413 ND 0.178 ND 0.103 0.173 0.014 ND 81 0.1 ND ND ND ND ND ND ND ND ND ND ND 77 0.05 ND ND ND ND ND ND ND ND ND ND ND
149 ND ND ND 0.009 ND ND ND 0.017 0.029 ND ND 123 0.00001 ND ND ND ND ND ND ND ND ND ND ND 118 0.00001 ND ND ND 0.039 ND 0.019 ND 0.140 0.033 0.014 ND 114 0.0001 ND ND ND ND ND ND ND ND ND ND ND 153 ND 0.015 0.011 0.168 0.009 0.065 ND 0.704 0.229 0.047 ND 141 ND ND ND 0.009 ND ND ND 0.015 0.012 ND ND 105 0.0001 ND ND ND 0.008 ND 0.009 ND 0.035 0.006 ND ND 163 ND 0.005 ND 0.062 ND 0.021 ND 0.173 0.086 0.014 ND 138 ND 0.010 ND 0.071 ND 0.033 ND 0.218 0.088 0.022 ND 187 0.006 0.014 0.010 0.255 0.007 0.059 ND 0.677 0.400 0.042 ND 183 ND ND ND 0.040 ND 0.011 ND 0.116 0.042 0.008 ND 126 0.1 ND ND ND ND ND ND ND ND ND ND ND 128 ND ND ND 0.019 ND 0.009 ND 0.057 0.026 ND ND 167 0.00001 ND ND ND 0.007 ND ND ND 0.050 0.006 ND ND 171 ND ND ND 0.011 ND ND ND 0.032 0.013 ND ND 156 0.0001 ND ND ND ND ND ND ND ND ND ND ND 199 ND ND ND 0.035 ND 0.009 ND 0.169 0.038 0.009 ND 157 0.0001 ND ND ND 0.006 ND ND ND ND ND ND ND 180 0.007 0.015 0.009 0.215 0.006 0.042 ND 0.798 0.226 0.043 ND 201 ND ND ND 0.102 ND 0.016 ND 0.290 0.107 0.016 ND 170 ND ND ND 0.057 ND 0.013 ND 0.213 0.054 0.013 ND 169 0.001 ND ND ND ND ND ND ND ND ND ND ND 189 0.00001 ND ND ND ND ND ND ND 0.024 ND ND ND 194 ND ND ND 0.068 ND 0.010 ND 0.222 0.051 0.011 ND 205 ND ND ND ND ND ND ND 0.010 ND ND ND 206 ND ND ND 0.028 ND ND ND 0.062 0.018 ND ND 209 ND ND ND ND ND ND ND 0.023 ND ND ND Sum 0.025 0.086 0.038 1.620 0.022 0.509 0.000 4.151 1.638 0.255 ND
ND is not detected. CF is conversion factor needed to convert from wet wt to lipid wt concentrations
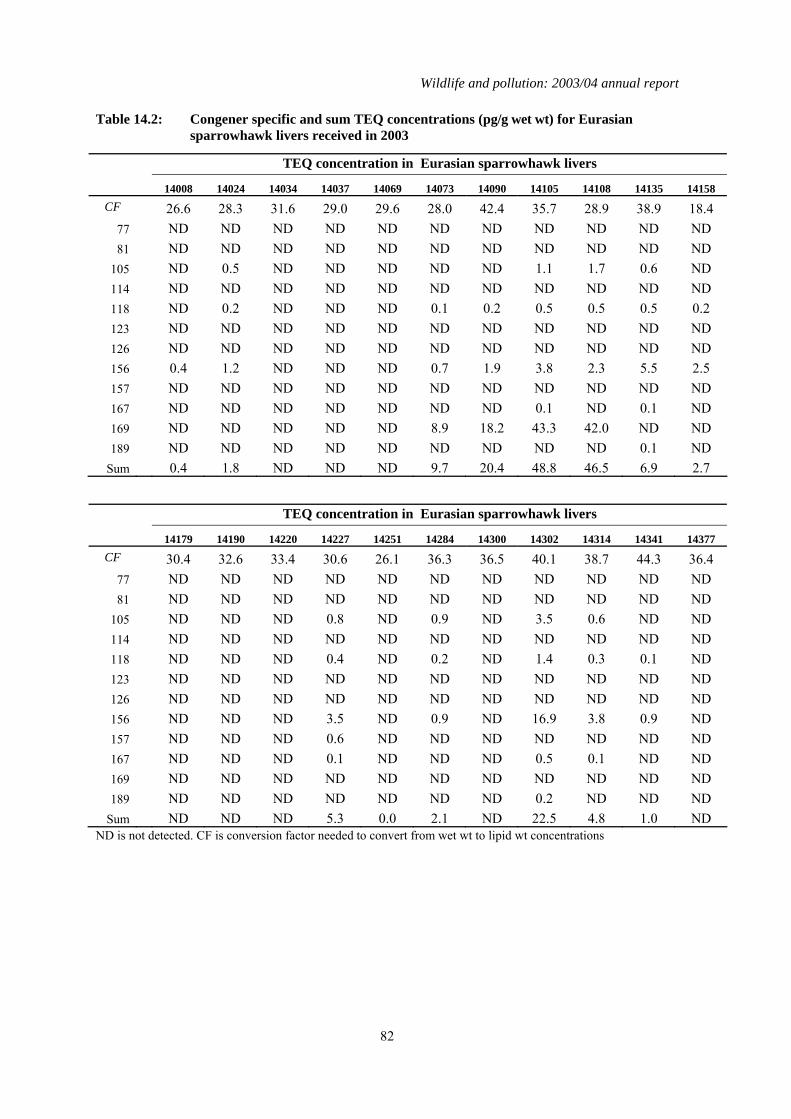
Wildlife and pollution: 2003/04 annual report
82
Table 14.2: Congener specific and sum TEQ concentrations (pg/g wet wt) for Eurasian sparrowhawk livers received in 2003
ND is not detected. CF is conversion factor needed to convert from wet wt to lipid wt concentrations
TEQ concentration in Eurasian sparrowhawk livers 14008 14024 14034 14037 14069 14073 14090 14105 14108 14135 14158
CF 26.6 28.3 31.6 29.0 29.6 28.0 42.4 35.7 28.9 38.9 18.4 77 ND ND ND ND ND ND ND ND ND ND ND 81 ND ND ND ND ND ND ND ND ND ND ND
105 ND 0.5 ND ND ND ND ND 1.1 1.7 0.6 ND 114 ND ND ND ND ND ND ND ND ND ND ND 118 ND 0.2 ND ND ND 0.1 0.2 0.5 0.5 0.5 0.2 123 ND ND ND ND ND ND ND ND ND ND ND 126 ND ND ND ND ND ND ND ND ND ND ND 156 0.4 1.2 ND ND ND 0.7 1.9 3.8 2.3 5.5 2.5 157 ND ND ND ND ND ND ND ND ND ND ND 167 ND ND ND ND ND ND ND 0.1 ND 0.1 ND 169 ND ND ND ND ND 8.9 18.2 43.3 42.0 ND ND 189 ND ND ND ND ND ND ND ND ND 0.1 ND
Sum 0.4 1.8 ND ND ND 9.7 20.4 48.8 46.5 6.9 2.7
TEQ concentration in Eurasian sparrowhawk livers 14179 14190 14220 14227 14251 14284 14300 14302 14314 14341 14377
CF 30.4 32.6 33.4 30.6 26.1 36.3 36.5 40.1 38.7 44.3 36.4 77 ND ND ND ND ND ND ND ND ND ND ND 81 ND ND ND ND ND ND ND ND ND ND ND
105 ND ND ND 0.8 ND 0.9 ND 3.5 0.6 ND ND 114 ND ND ND ND ND ND ND ND ND ND ND 118 ND ND ND 0.4 ND 0.2 ND 1.4 0.3 0.1 ND 123 ND ND ND ND ND ND ND ND ND ND ND 126 ND ND ND ND ND ND ND ND ND ND ND 156 ND ND ND 3.5 ND 0.9 ND 16.9 3.8 0.9 ND 157 ND ND ND 0.6 ND ND ND ND ND ND ND 167 ND ND ND 0.1 ND ND ND 0.5 0.1 ND ND 169 ND ND ND ND ND ND ND ND ND ND ND 189 ND ND ND ND ND ND ND 0.2 ND ND ND
Sum ND ND ND 5.3 0.0 2.1 ND 22.5 4.8 1.0 ND
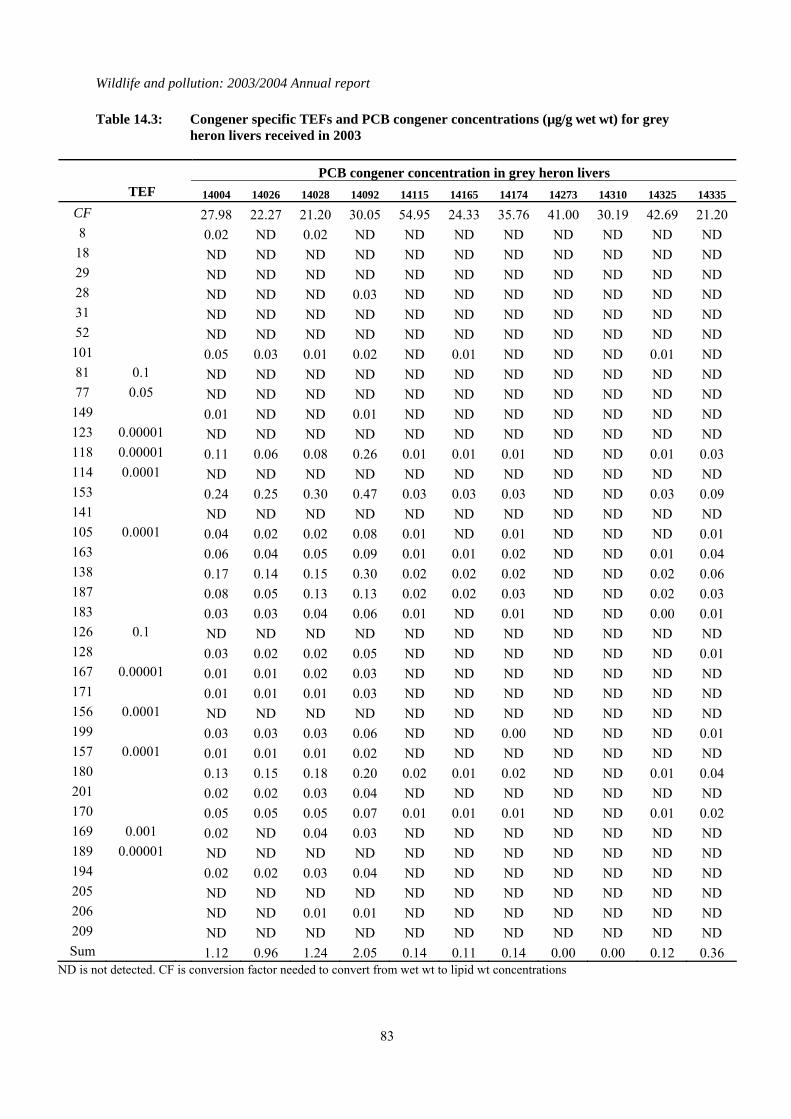
Wildlife and pollution: 2003/2004 Annual report
83
Table 14.3: Congener specific TEFs and PCB congener concentrations (µg/g wet wt) for grey heron livers received in 2003
PCB congener concentration in grey heron livers TEF 14004 14026 14028 14092 14115 14165 14174 14273 14310 14325 14335
CF 27.98 22.27 21.20 30.05 54.95 24.33 35.76 41.00 30.19 42.69 21.20 8 0.02 ND 0.02 ND ND ND ND ND ND ND ND
18 ND ND ND ND ND ND ND ND ND ND ND 29 ND ND ND ND ND ND ND ND ND ND ND 28 ND ND ND 0.03 ND ND ND ND ND ND ND 31 ND ND ND ND ND ND ND ND ND ND ND 52 ND ND ND ND ND ND ND ND ND ND ND
101 0.05 0.03 0.01 0.02 ND 0.01 ND ND ND 0.01 ND 81 0.1 ND ND ND ND ND ND ND ND ND ND ND 77 0.05 ND ND ND ND ND ND ND ND ND ND ND
149 0.01 ND ND 0.01 ND ND ND ND ND ND ND 123 0.00001 ND ND ND ND ND ND ND ND ND ND ND 118 0.00001 0.11 0.06 0.08 0.26 0.01 0.01 0.01 ND ND 0.01 0.03 114 0.0001 ND ND ND ND ND ND ND ND ND ND ND 153 0.24 0.25 0.30 0.47 0.03 0.03 0.03 ND ND 0.03 0.09 141 ND ND ND ND ND ND ND ND ND ND ND 105 0.0001 0.04 0.02 0.02 0.08 0.01 ND 0.01 ND ND ND 0.01 163 0.06 0.04 0.05 0.09 0.01 0.01 0.02 ND ND 0.01 0.04 138 0.17 0.14 0.15 0.30 0.02 0.02 0.02 ND ND 0.02 0.06 187 0.08 0.05 0.13 0.13 0.02 0.02 0.03 ND ND 0.02 0.03 183 0.03 0.03 0.04 0.06 0.01 ND 0.01 ND ND 0.00 0.01 126 0.1 ND ND ND ND ND ND ND ND ND ND ND 128 0.03 0.02 0.02 0.05 ND ND ND ND ND ND 0.01 167 0.00001 0.01 0.01 0.02 0.03 ND ND ND ND ND ND ND 171 0.01 0.01 0.01 0.03 ND ND ND ND ND ND ND 156 0.0001 ND ND ND ND ND ND ND ND ND ND ND 199 0.03 0.03 0.03 0.06 ND ND 0.00 ND ND ND 0.01 157 0.0001 0.01 0.01 0.01 0.02 ND ND ND ND ND ND ND 180 0.13 0.15 0.18 0.20 0.02 0.01 0.02 ND ND 0.01 0.04 201 0.02 0.02 0.03 0.04 ND ND ND ND ND ND ND 170 0.05 0.05 0.05 0.07 0.01 0.01 0.01 ND ND 0.01 0.02 169 0.001 0.02 ND 0.04 0.03 ND ND ND ND ND ND ND 189 0.00001 ND ND ND ND ND ND ND ND ND ND ND 194 0.02 0.02 0.03 0.04 ND ND ND ND ND ND ND 205 ND ND ND ND ND ND ND ND ND ND ND 206 ND ND 0.01 0.01 ND ND ND ND ND ND ND 209 ND ND ND ND ND ND ND ND ND ND ND Sum 1.12 0.96 1.24 2.05 0.14 0.11 0.14 0.00 0.00 0.12 0.36
ND is not detected. CF is conversion factor needed to convert from wet wt to lipid wt concentrations

Wildlife and pollution: 2003/04 annual report
84
Table 14.4: Congener specific and sum TEQ concentrations (pg/g wet wt) for grey heron livers received in 2003
ND is not detected. CF is conversion factor needed to convert from wet wt to lipid wt concentrations
TEQ concentration in grey heron livers 14004 14026 14028 14092 14115 14165 14174 14273 14310 14325 14335
CF 28.0 22.3 21.2 30.0 55.0 24.3 35.8 41.0 30.2 42.7 21.2 77 ND ND ND ND ND ND ND ND ND ND ND 81 ND ND ND ND ND ND ND ND ND ND ND
105 3.7 2.1 1.7 7.7 0.5 ND 0.6 ND ND ND 0.8 114 ND ND ND ND ND ND ND ND ND ND ND 118 1.1 0.6 0.8 2.6 0.1 0.1 0.1 ND ND 0.1 0.3 123 ND ND ND ND ND ND ND ND ND ND ND 126 ND ND ND ND ND ND ND ND ND ND ND 156 3.1 2.9 3.1 6.2 ND ND 0.4 ND ND ND 1.1 157 1.2 0.6 1.1 1.6 ND ND ND ND ND ND ND 167 0.1 0.1 0.2 0.3 ND ND ND ND ND ND ND 169 18.5 ND 39.7 34.3 ND ND ND ND ND ND ND 189 ND ND ND ND ND ND ND ND ND ND ND
Sum 27.6 6.3 46.5 52.6 0.7 0.1 1.2 ND ND 0.1 2.2
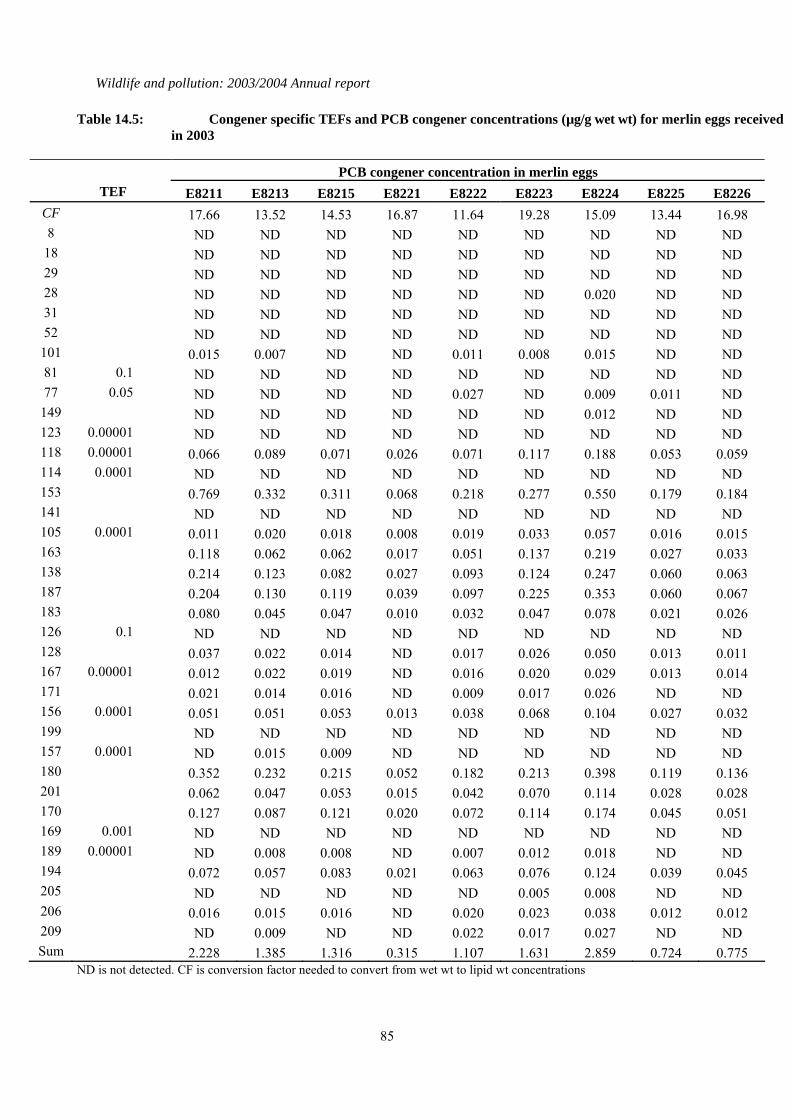
Wildlife and pollution: 2003/2004 Annual report
85
Table 14.5: Congener specific TEFs and PCB congener concentrations (µg/g wet wt) for merlin eggs received in 2003
PCB congener concentration in merlin eggs
TEF E8211 E8213 E8215 E8221 E8222 E8223 E8224 E8225 E8226 CF 17.66 13.52 14.53 16.87 11.64 19.28 15.09 13.44 16.98 8 ND ND ND ND ND ND ND ND ND
18 ND ND ND ND ND ND ND ND ND 29 ND ND ND ND ND ND ND ND ND 28 ND ND ND ND ND ND 0.020 ND ND 31 ND ND ND ND ND ND ND ND ND 52 ND ND ND ND ND ND ND ND ND
101 0.015 0.007 ND ND 0.011 0.008 0.015 ND ND 81 0.1 ND ND ND ND ND ND ND ND ND 77 0.05 ND ND ND ND 0.027 ND 0.009 0.011 ND
149 ND ND ND ND ND ND 0.012 ND ND 123 0.00001 ND ND ND ND ND ND ND ND ND 118 0.00001 0.066 0.089 0.071 0.026 0.071 0.117 0.188 0.053 0.059 114 0.0001 ND ND ND ND ND ND ND ND ND 153 0.769 0.332 0.311 0.068 0.218 0.277 0.550 0.179 0.184 141 ND ND ND ND ND ND ND ND ND 105 0.0001 0.011 0.020 0.018 0.008 0.019 0.033 0.057 0.016 0.015 163 0.118 0.062 0.062 0.017 0.051 0.137 0.219 0.027 0.033 138 0.214 0.123 0.082 0.027 0.093 0.124 0.247 0.060 0.063 187 0.204 0.130 0.119 0.039 0.097 0.225 0.353 0.060 0.067 183 0.080 0.045 0.047 0.010 0.032 0.047 0.078 0.021 0.026 126 0.1 ND ND ND ND ND ND ND ND ND 128 0.037 0.022 0.014 ND 0.017 0.026 0.050 0.013 0.011 167 0.00001 0.012 0.022 0.019 ND 0.016 0.020 0.029 0.013 0.014 171 0.021 0.014 0.016 ND 0.009 0.017 0.026 ND ND 156 0.0001 0.051 0.051 0.053 0.013 0.038 0.068 0.104 0.027 0.032 199 ND ND ND ND ND ND ND ND ND 157 0.0001 ND 0.015 0.009 ND ND ND ND ND ND 180 0.352 0.232 0.215 0.052 0.182 0.213 0.398 0.119 0.136 201 0.062 0.047 0.053 0.015 0.042 0.070 0.114 0.028 0.028 170 0.127 0.087 0.121 0.020 0.072 0.114 0.174 0.045 0.051 169 0.001 ND ND ND ND ND ND ND ND ND 189 0.00001 ND 0.008 0.008 ND 0.007 0.012 0.018 ND ND 194 0.072 0.057 0.083 0.021 0.063 0.076 0.124 0.039 0.045 205 ND ND ND ND ND 0.005 0.008 ND ND 206 0.016 0.015 0.016 ND 0.020 0.023 0.038 0.012 0.012 209 ND 0.009 ND ND 0.022 0.017 0.027 ND ND Sum 2.228 1.385 1.316 0.315 1.107 1.631 2.859 0.724 0.775
ND is not detected. CF is conversion factor needed to convert from wet wt to lipid wt concentrations

Wildlife and pollution: 2003/04 annual report
86
Table 14.5 (contd.): Congener specific TEFs and PCB congener concentrations (µg/g wet wt) for merlin eggs received in 2003
PCB congener concentration in merlin eggs
TEF E8227 E8228 E8230 E8231 E8232 E8233 E8234 E8143 E8144 CF 21.47 15.63 13.47 16.52 20.83 10.41 19.55 13.87 16.47 8 ND ND ND ND ND ND ND ND ND
18 ND ND ND ND ND ND ND ND ND 29 ND ND ND ND ND ND ND ND ND 28 ND ND ND ND ND ND ND ND ND 31 ND ND ND ND ND ND ND ND ND 52 ND ND ND ND ND ND ND ND ND
101 0.009 0.018 0.007 0.016 0.018 0.012 ND 0.029 0.010 81 0.1 ND ND ND ND ND ND ND ND ND 77 0.05 ND ND ND ND ND ND ND ND ND
149 0.009 ND ND ND ND 0.007 ND ND ND 123 0.00001 ND ND ND ND ND ND ND ND ND 118 0.00001 0.068 0.053 0.064 0.079 0.079 0.082 0.055 0.060 0.040 114 0.0001 ND ND ND ND ND ND ND ND ND 153 0.303 0.168 0.205 0.302 0.288 0.309 0.195 0.233 0.161 141 ND ND ND ND ND ND ND ND ND 105 0.0001 0.015 0.012 0.015 0.019 0.019 0.018 0.013 0.014 0.009 163 ND 0.032 0.036 0.041 0.045 ND 0.035 0.036 0.036 138 0.116 0.080 0.080 0.106 0.111 0.112 0.068 0.091 0.056 187 0.167 0.062 0.078 0.104 0.093 0.169 0.087 0.120 0.090 183 0.049 0.023 0.028 0.041 0.032 0.044 0.029 0.036 0.020 126 0.1 ND ND ND ND ND ND ND ND ND 128 0.020 0.014 0.015 0.018 0.016 0.024 0.011 0.015 0.009 167 0.00001 0.014 0.010 0.014 0.023 0.017 0.019 0.014 0.013 0.010 171 0.013 0.008 ND 0.011 ND 0.013 0.009 0.008 ND 156 0.0001 0.044 0.025 0.034 0.049 0.040 0.048 0.032 0.029 0.024 199 0.005 ND ND 0.006 ND ND ND ND ND 157 0.0001 0.008 ND ND ND ND ND ND ND ND 180 0.225 0.130 0.139 0.245 0.162 0.228 0.141 0.229 0.087 201 0.054 0.027 0.039 0.064 0.034 0.062 0.040 0.100 0.031 170 0.076 0.047 0.055 0.090 0.067 0.075 0.050 0.050 0.035 169 0.001 ND ND ND ND ND ND ND ND ND 189 0.00001 0.007 ND ND 0.011 0.007 0.008 ND ND ND 194 0.056 0.036 ND 0.098 0.045 0.072 0.056 0.148 0.033 205 ND ND ND 0.005 ND ND ND ND ND 206 0.014 0.012 ND 0.031 0.012 0.023 0.017 0.124 0.010 209 ND 0.010 ND 0.017 0.008 0.012 ND 0.012 ND Sum 1.274 0.766 0.810 1.375 1.094 1.336 0.853 1.347 0.661
ND is not detected. CF is conversion factor needed to convert from wet wt to lipid wt concentrations

Wildlife and pollution: 2003/2004 Annual report
87
Table 14.5 (contd.): Congener specific TEFs and PCB congener concentrations (µg/g wet wt) for merlin eggs received in 2003
PCB congener concentration in merlin eggs TEF E8145 E8146 E8149 E8150 E8139 E8140 E8142
CF 16.16 13.44 15.84 18.72 16.76 14.25 20.28 8 ND ND ND ND ND ND ND
18 ND ND ND ND ND ND ND 29 ND ND ND ND ND ND ND 28 ND ND ND ND ND ND ND 31 ND ND ND ND ND ND ND 52 ND ND ND ND ND ND ND
101 ND 0.009 ND ND ND 0.009 0.008 81 0.1 ND ND ND ND ND ND ND 77 0.05 ND ND ND ND ND ND ND
149 ND ND ND ND ND ND ND 123 0.00001 ND ND ND ND ND ND ND 118 0.00001 0.051 0.104 0.096 0.049 0.064 0.071 0.065 114 0.0001 ND ND ND ND ND ND ND 153 0.160 0.377 0.415 0.161 0.201 0.242 0.248 141 ND ND ND ND ND ND ND 105 0.0001 0.011 0.027 0.024 0.011 0.017 0.016 0.015 163 0.033 0.064 0.061 0.032 0.037 0.044 0.057 138 0.072 0.132 0.118 0.069 0.084 0.090 0.095 187 0.070 0.138 0.127 0.074 0.071 0.095 0.095 183 0.022 0.046 0.044 0.028 0.024 0.029 0.030 126 0.1 ND ND ND ND ND ND ND 128 0.011 0.023 0.020 0.011 0.015 0.015 0.018 167 0.00001 0.013 0.026 0.027 0.012 0.011 0.015 0.014 171 ND 0.013 0.014 0.008 0.008 0.009 0.010 156 0.0001 0.028 0.055 0.057 0.029 0.031 0.034 0.034 199 ND 0.005 0.007 ND ND ND ND 157 0.0001 ND ND 0.020 ND ND ND ND 180 0.107 0.240 0.245 0.151 0.112 0.143 0.149 201 0.034 0.065 0.055 0.039 0.024 0.037 0.035 170 0.040 0.083 0.093 0.050 0.047 0.052 0.062 169 0.001 ND ND ND ND ND ND ND 189 0.00001 ND 0.009 0.011 0.006 ND ND ND 194 0.041 0.077 0.079 0.055 0.031 0.041 0.041 205 ND 0.004 0.005 ND ND ND ND 206 0.016 0.025 0.023 0.018 0.008 0.011 0.012 209 0.009 0.010 0.015 0.010 ND ND 0.011 Sum 0.718 1.531 1.556 0.812 0.784 0.954 1.000
ND is not detected. CF is conversion factor needed to convert from wet wt to lipid wt concentrations
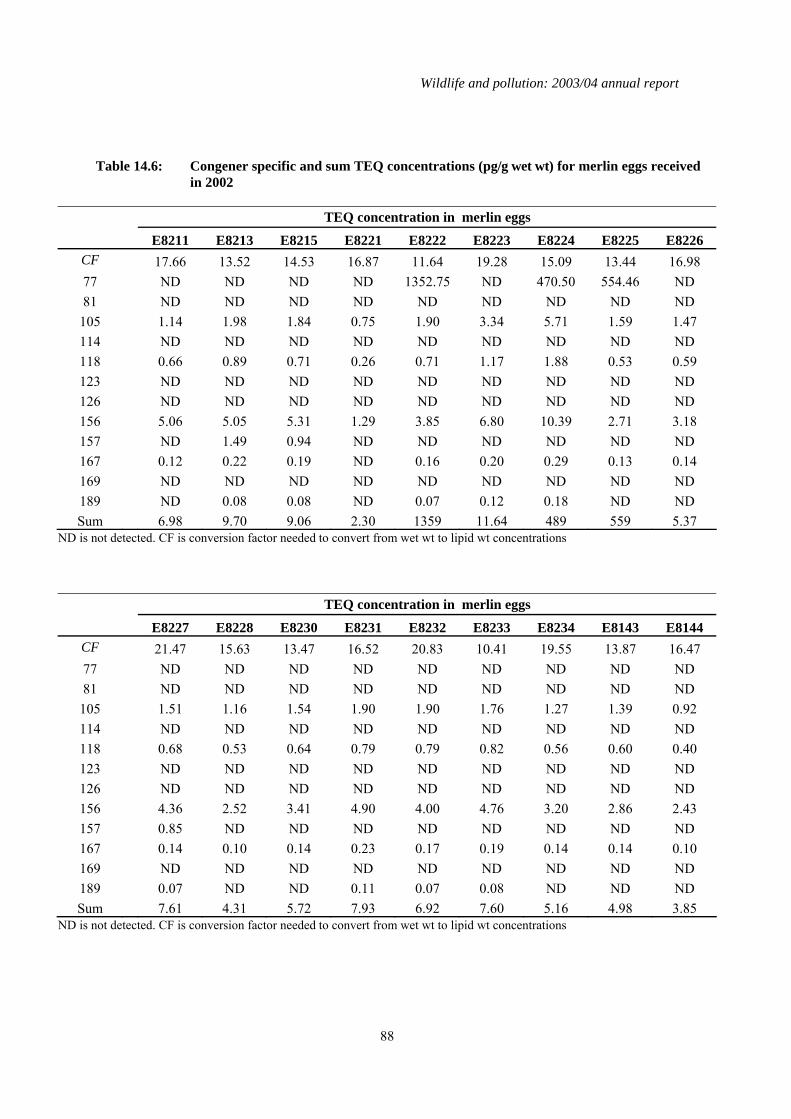
Wildlife and pollution: 2003/04 annual report
88
Table 14.6: Congener specific and sum TEQ concentrations (pg/g wet wt) for merlin eggs received
in 2002
TEQ concentration in merlin eggs E8211 E8213 E8215 E8221 E8222 E8223 E8224 E8225 E8226
CF 17.66 13.52 14.53 16.87 11.64 19.28 15.09 13.44 16.98 77 ND ND ND ND 1352.75 ND 470.50 554.46 ND 81 ND ND ND ND ND ND ND ND ND
105 1.14 1.98 1.84 0.75 1.90 3.34 5.71 1.59 1.47 114 ND ND ND ND ND ND ND ND ND 118 0.66 0.89 0.71 0.26 0.71 1.17 1.88 0.53 0.59 123 ND ND ND ND ND ND ND ND ND 126 ND ND ND ND ND ND ND ND ND 156 5.06 5.05 5.31 1.29 3.85 6.80 10.39 2.71 3.18 157 ND 1.49 0.94 ND ND ND ND ND ND 167 0.12 0.22 0.19 ND 0.16 0.20 0.29 0.13 0.14 169 ND ND ND ND ND ND ND ND ND 189 ND 0.08 0.08 ND 0.07 0.12 0.18 ND ND Sum 6.98 9.70 9.06 2.30 1359 11.64 489 559 5.37
ND is not detected. CF is conversion factor needed to convert from wet wt to lipid wt concentrations
TEQ concentration in merlin eggs E8227 E8228 E8230 E8231 E8232 E8233 E8234 E8143 E8144
CF 21.47 15.63 13.47 16.52 20.83 10.41 19.55 13.87 16.47 77 ND ND ND ND ND ND ND ND ND 81 ND ND ND ND ND ND ND ND ND
105 1.51 1.16 1.54 1.90 1.90 1.76 1.27 1.39 0.92 114 ND ND ND ND ND ND ND ND ND 118 0.68 0.53 0.64 0.79 0.79 0.82 0.56 0.60 0.40 123 ND ND ND ND ND ND ND ND ND 126 ND ND ND ND ND ND ND ND ND 156 4.36 2.52 3.41 4.90 4.00 4.76 3.20 2.86 2.43 157 0.85 ND ND ND ND ND ND ND ND 167 0.14 0.10 0.14 0.23 0.17 0.19 0.14 0.14 0.10 169 ND ND ND ND ND ND ND ND ND 189 0.07 ND ND 0.11 0.07 0.08 ND ND ND Sum 7.61 4.31 5.72 7.93 6.92 7.60 5.16 4.98 3.85
ND is not detected. CF is conversion factor needed to convert from wet wt to lipid wt concentrations
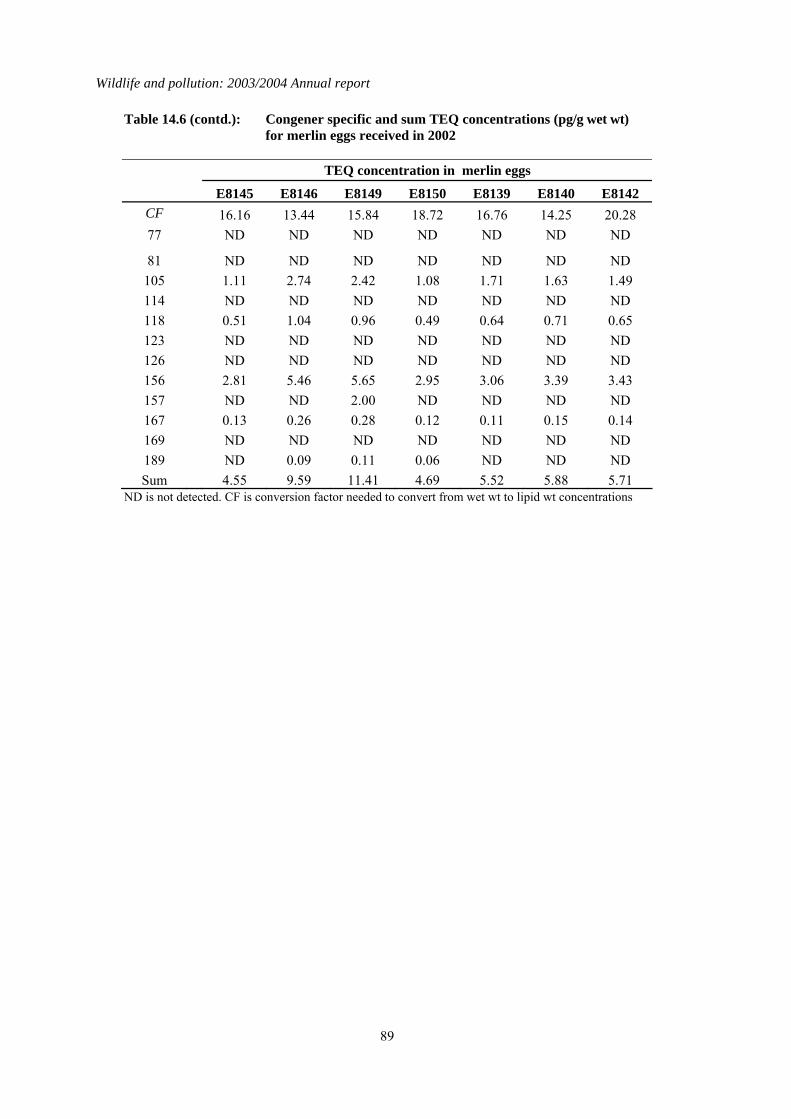
Wildlife and pollution: 2003/2004 Annual report
89
Table 14.6 (contd.): Congener specific and sum TEQ concentrations (pg/g wet wt) for merlin eggs received in 2002
TEQ concentration in merlin eggs E8145 E8146 E8149 E8150 E8139 E8140 E8142
CF 16.16 13.44 15.84 18.72 16.76 14.25 20.28 77 ND ND ND ND ND ND ND
81
ND ND ND ND ND ND ND 105 1.11 2.74 2.42 1.08 1.71 1.63 1.49 114 ND ND ND ND ND ND ND 118 0.51 1.04 0.96 0.49 0.64 0.71 0.65 123 ND ND ND ND ND ND ND 126 ND ND ND ND ND ND ND 156 2.81 5.46 5.65 2.95 3.06 3.39 3.43 157 ND ND 2.00 ND ND ND ND 167 0.13 0.26 0.28 0.12 0.11 0.15 0.14 169 ND ND ND ND ND ND ND 189 ND 0.09 0.11 0.06 ND ND ND Sum 4.55 9.59 11.41 4.69 5.52 5.88 5.71
ND is not detected. CF is conversion factor needed to convert from wet wt to lipid wt concentrations
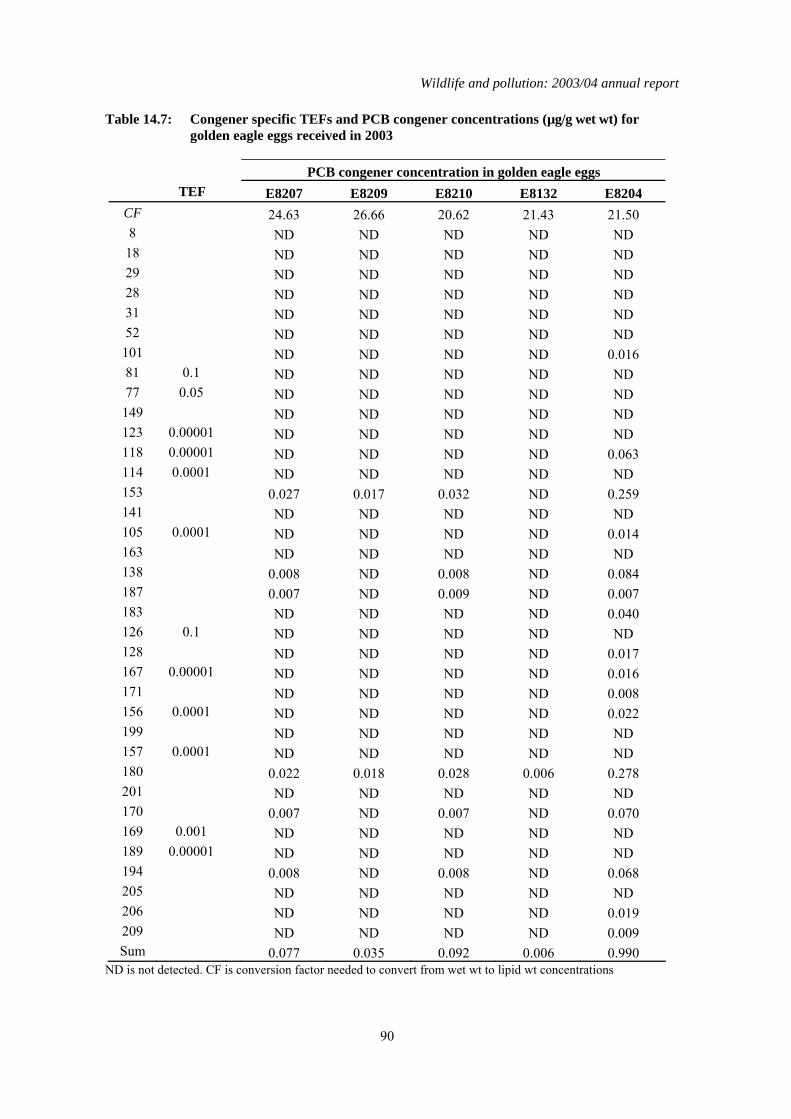
Wildlife and pollution: 2003/04 annual report
90
Table 14.7: Congener specific TEFs and PCB congener concentrations (µg/g wet wt) for golden eagle eggs received in 2003
PCB congener concentration in golden eagle eggs
TEF E8207 E8209 E8210 E8132 E8204 CF 24.63 26.66 20.62 21.43 21.50 8 ND ND ND ND ND
18 ND ND ND ND ND 29 ND ND ND ND ND 28 ND ND ND ND ND 31 ND ND ND ND ND 52 ND ND ND ND ND
101 ND ND ND ND 0.016 81 0.1 ND ND ND ND ND 77 0.05 ND ND ND ND ND
149 ND ND ND ND ND 123 0.00001 ND ND ND ND ND 118 0.00001 ND ND ND ND 0.063 114 0.0001 ND ND ND ND ND 153 0.027 0.017 0.032 ND 0.259 141 ND ND ND ND ND 105 0.0001 ND ND ND ND 0.014 163 ND ND ND ND ND 138 0.008 ND 0.008 ND 0.084 187 0.007 ND 0.009 ND 0.007 183 ND ND ND ND 0.040 126 0.1 ND ND ND ND ND 128 ND ND ND ND 0.017 167 0.00001 ND ND ND ND 0.016 171 ND ND ND ND 0.008 156 0.0001 ND ND ND ND 0.022 199 ND ND ND ND ND 157 0.0001 ND ND ND ND ND 180 0.022 0.018 0.028 0.006 0.278 201 ND ND ND ND ND 170 0.007 ND 0.007 ND 0.070 169 0.001 ND ND ND ND ND 189 0.00001 ND ND ND ND ND 194 0.008 ND 0.008 ND 0.068 205 ND ND ND ND ND 206 ND ND ND ND 0.019 209 ND ND ND ND 0.009 Sum 0.077 0.035 0.092 0.006 0.990
ND is not detected. CF is conversion factor needed to convert from wet wt to lipid wt concentrations
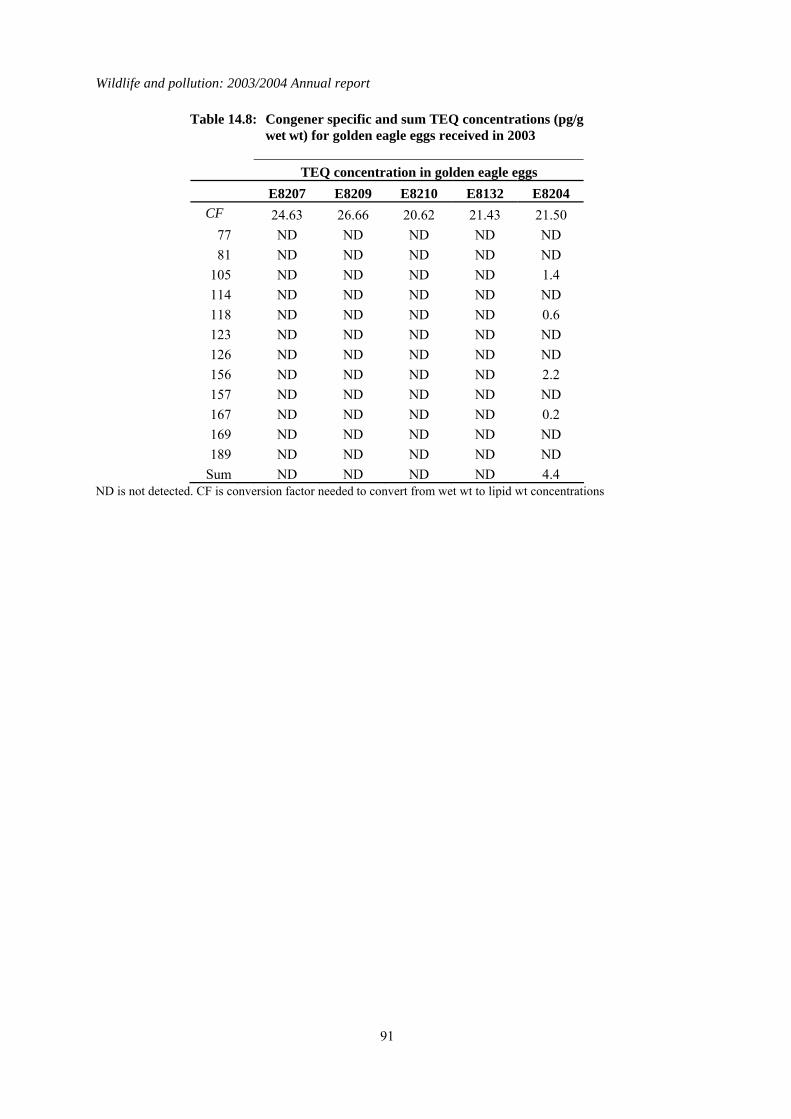
Wildlife and pollution: 2003/2004 Annual report
91
Table 14.8: Congener specific and sum TEQ concentrations (pg/g wet wt) for golden eagle eggs received in 2003
TEQ concentration in golden eagle eggs E8207 E8209 E8210 E8132 E8204
CF 24.63 26.66 20.62 21.43 21.50 77 ND ND ND ND ND 81 ND ND ND ND ND
105 ND ND ND ND 1.4 114 ND ND ND ND ND 118 ND ND ND ND 0.6 123 ND ND ND ND ND 126 ND ND ND ND ND 156 ND ND ND ND 2.2 157 ND ND ND ND ND 167 ND ND ND ND 0.2 169 ND ND ND ND ND 189 ND ND ND ND ND
Sum ND ND ND ND 4.4 ND is not detected. CF is conversion factor needed to convert from wet wt to lipid wt concentrations