Embed Size (px)
Citation preview
WILBUR SMITH
ASSOCIATES ENGINEERS • PLANNERS
9800 RICHMOND AVE., SUITE 400 • HOUSTON, TX 77042-4521 • (713) 785-0080 • FAX (713) 785-8797
ACCRA, GHANA • ALBANY, NY • ANAHEIM, CA • ATLANTA, GA • BALTIMORE, MD • BANGKOK, THAILAND • CHARLESTON, SC • CHICAGO, IL • CLEVELAND, OH COLUMBIA, SC • COLUMBUS, OH • DALLAS, TX • DES MOINES, IA • FALLS CHURCH, VA • HONOLULU, HI • HONG KONG • HOUSTON, TX • KUWAIT • KNOXVILLE, TN LEXINGTON, KY • LONDON, ENGLAND • MILWAUKEE, WI • NEW HAVEN, CT • ORLANDO, FL • PHILADELPHIA, PA • PITTSBURGH, PA • RALEIGH, NC RICHMOND, VA • SALT LAKE CITY, UTAH • SAN FRANCISCO, CA • SAN JOSE, CA • TALLAHASSEE, FL • TAMPA, FL • TORONTO, CANADA • WASHINGTON, DC
EMPLOYEE-OWNED COMPANY
December 22, 2000 Mr. Austan S. Librach, P.E., AICP, Department Head Planning, Environmental & Conservation Services Department City of Austin P. O. Box 1088 Austin, TX 78767 RE: Austin Comprehensive Downtown Parking Study Dear Mr. Librach: We are pleased to submit the enclosed DRAFT FINAL REPORT entitled: Downtown Austin Comprehensive Parking Study. This document was prepared in accordance with our Professional Services Agreement dated November 2, 1999. Review comments received from the City Boards and Commissions, Parking Task Force, City Staff, and other reviewers are incorporated in revisions to the Draft Report. The Draft Final Report text and figures are being provided in .PDF format for e-mail distribution to reviewers. If you have any questions, please contact me. We appreciate the opportunity to provide professional services to the City of Austin for this important project. Respectfully submitted, DRAFT WILBUR SMITH ASSOCIATES Enclosure Librach 101800
ChaSt
C
R
ChaC
O
H
P
Se
W
E
M
P
P
A
R
St
ChaY
Y
P
Im
T
ChaP
O
O
T
DRAFDowntown Austin Comprehensive Parking Study
Table of Contents
pter 1 - Introduction udy Purpose and Objectives ............................................................................................................. 1-1
itizen Participation and Community Involvement ........................................................................ 1-1
elated Studies ....................................................................................................................................... 1-5
pter 2 - Parking Inventory and Utilization Survey urb Parking and Loading Zones ....................................................................................................... 2-1
ff-Street Parking ................................................................................................................................. 2-1
istorical Trends in Parking Supply ................................................................................................... 2-3
arking Utilization .................................................................................................................................. 2-4
asonal Variation in Parking Demands ............................................................................................ 2-7
eekend Parking Accumulation for Entertainment District .......................................................... 2-8
xisting Land Use .................................................................................................................................. 2-8
ajor Generators of Parking Demand .............................................................................................. 2-9
arking Characteristics .......................................................................................................................... 2-9
arking Enforcement ............................................................................................................................. 2-12
djudication of Parking Citations ....................................................................................................... 2-13
esidential Parking Permit Program ................................................................................................... 2-14
ate-Owned Parking Facilities ............................................................................................................ 2-15
pter 3 - Parking Supply and Demand Analysis ear 2000 Parking Demands ............................................................................................................... 3-2
ear 2000 Parking Supply/Demand Analysis .................................................................................... 3-3
rojected Year 2005 Parking Supply/Demand Analysis .................................................................. 3-4
pact of Future Development Projects on Parking Needs .......................................................... 3-5
ransit vs. Parking ................................................................................................................................. 3-6
pter 4 - Downtown Parking Management Program arking Management Recommendations .......................................................................................... 4-1
n-Street Parking Recommendations................................................................................................. 4-2
ff-Street Parking Development ......................................................................................................... 4-4
Downtown Austin Comprehensive Parking Study – DRAFT 12/22/00 Table of Contents
Wilbur Smith Associates • Urban Design Group • José E. Martínez & Associates
Off-Street Parking Recommendations ................................................................................................ 4-5
Parking and Transit Coordination Recommendations .................................................................... 4-7
Parking Pricing Recommendations ..................................................................................................... 4-9
Public Information, Marketing and Technology Recommendations ............................................ 4-11
Parking Enforcement and Adjudication Recommendations .......................................................... 4-12
Residential Parking Permit Program Recommendations ................................................................. 4-13
Chapter 5 - South Congress Avenue Corridor Parking Study South Congress Parking Inventory ..................................................................................................... 5-1
South Congress Parking Accumulation .............................................................................................. 5-2
South Congress Year 2000 Parking Demands .................................................................................. 5-5
South Congress Year 2000 Parking Supply/Demand Analysis ...................................................... 5-5
Parking Management and Implementation Strategies ..................................................................... 5-5
Parking Improvement Recommendations ......................................................................................... 5-6
Chapter 6 - East 11th and East 12th Streets Corridor Parking Study East 11th/12th Streets Parking Inventory ........................................................................................... 6-1
East 11th/12th Streets Parking Accumulation .................................................................................... 6-2
East 11th/12th Streets Year 2000 Parking Demands ........................................................................ 6-3
East 11th/12th Streets Year 2000 Parking Supply/Demand Analysis ............................................ 6-4
East 11th/12th Streets Year 2005 Parking Supply/Demand Analysis ............................................ 6-4
Parking Management and Implementation Strategies ..................................................................... 6-4
Parking Improvement Recommendations ......................................................................................... 6-5
Appendices Appendix A – Summaries of Related Studies ................................................................................... A-1
Appendix B – Parking Inventory by Block ....................................................................................... B-1
Appendix C – Parking Utilization Survey Data ................................................................................ C-1
Downtown Austin Comprehensive Parking Study – DRAFT 12/22/00 Table of Contents
Wilbur Smith Associates • Urban Design Group • José E. Martínez & Associates
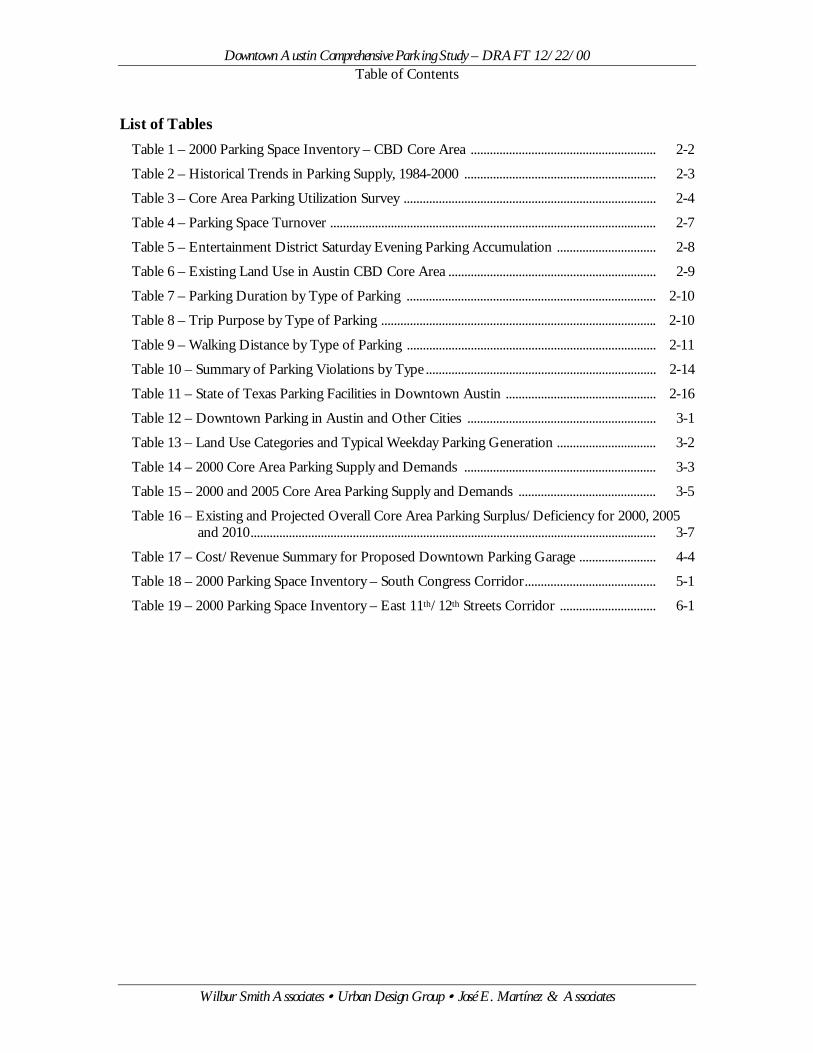
List of Tables Table 1 – 2000 Parking Space Inventory – CBD Core Area .......................................................... 2-2
Table 2 – Historical Trends in Parking Supply, 1984-2000 ............................................................ 2-3
Table 3 – Core Area Parking Utilization Survey ............................................................................... 2-4
Table 4 – Parking Space Turnover ...................................................................................................... 2-7
Table 5 – Entertainment District Saturday Evening Parking Accumulation ............................... 2-8
Table 6 – Existing Land Use in Austin CBD Core Area ................................................................. 2-9
Table 7 – Parking Duration by Type of Parking .............................................................................. 2-10
Table 8 – Trip Purpose by Type of Parking ...................................................................................... 2-10
Table 9 – Walking Distance by Type of Parking .............................................................................. 2-11
Table 10 – Summary of Parking Violations by Type ........................................................................ 2-14
Table 11 – State of Texas Parking Facilities in Downtown Austin ............................................... 2-16
Table 12 – Downtown Parking in Austin and Other Cities ........................................................... 3-1
Table 13 – Land Use Categories and Typical Weekday Parking Generation ............................... 3-2
Table 14 – 2000 Core Area Parking Supply and Demands ............................................................ 3-3
Table 15 – 2000 and 2005 Core Area Parking Supply and Demands ........................................... 3-5
Table 16 – Existing and Projected Overall Core Area Parking Surplus/Deficiency for 2000, 2005 and 2010............................................................................................................................... 3-7
Table 17 – Cost/Revenue Summary for Proposed Downtown Parking Garage ........................ 4-4
Table 18 – 2000 Parking Space Inventory – South Congress Corridor......................................... 5-1
Table 19 – 2000 Parking Space Inventory – East 11th/12th Streets Corridor .............................. 6-1
Downtown Austin Comprehensive Parking Study – DRAFT 12/22/00 Table of Contents
Wilbur Smith Associates • Urban Design Group • José E. Martínez & Associates
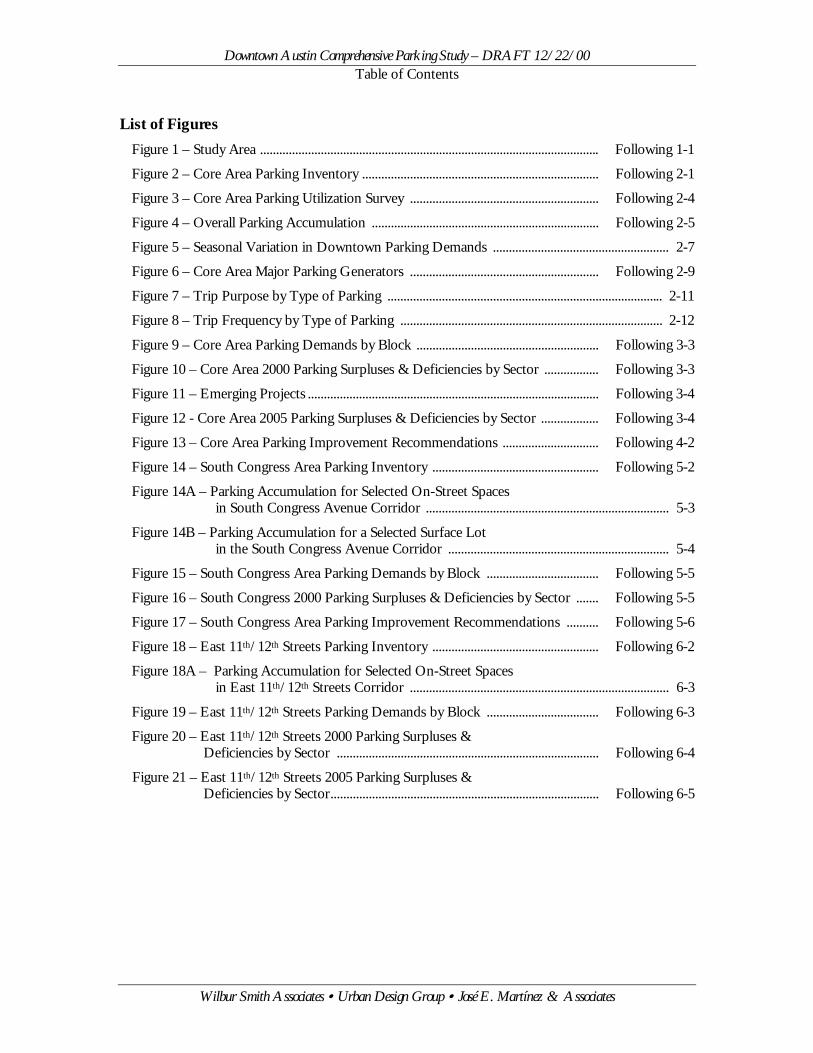
List of Figures Figure 1 – Study Area .......................................................................................................... Following 1-1
Figure 2 – Core Area Parking Inventory .......................................................................... Following 2-1
Figure 3 – Core Area Parking Utilization Survey ........................................................... Following 2-4
Figure 4 – Overall Parking Accumulation ....................................................................... Following 2-5
Figure 5 – Seasonal Variation in Downtown Parking Demands ....................................................... 2-7
Figure 6 – Core Area Major Parking Generators ........................................................... Following 2-9
Figure 7 – Trip Purpose by Type of Parking ...................................................................................... 2-11
Figure 8 – Trip Frequency by Type of Parking .................................................................................. 2-12
Figure 9 – Core Area Parking Demands by Block ......................................................... Following 3-3
Figure 10 – Core Area 2000 Parking Surpluses & Deficiencies by Sector ................. Following 3-3
Figure 11 – Emerging Projects ........................................................................................... Following 3-4
Figure 12 - Core Area 2005 Parking Surpluses & Deficiencies by Sector .................. Following 3-4
Figure 13 – Core Area Parking Improvement Recommendations .............................. Following 4-2
Figure 14 – South Congress Area Parking Inventory .................................................... Following 5-2
Figure 14A – Parking Accumulation for Selected On-Street Spaces in South Congress Avenue Corridor ............................................................................ 5-3
Figure 14B – Parking Accumulation for a Selected Surface Lot in the South Congress Avenue Corridor ..................................................................... 5-4
Figure 15 – South Congress Area Parking Demands by Block ................................... Following 5-5
Figure 16 – South Congress 2000 Parking Surpluses & Deficiencies by Sector ....... Following 5-5
Figure 17 – South Congress Area Parking Improvement Recommendations .......... Following 5-6
Figure 18 – East 11th/12th Streets Parking Inventory .................................................... Following 6-2
Figure 18A – Parking Accumulation for Selected On-Street Spaces in East 11th/12th Streets Corridor ................................................................................. 6-3
Figure 19 – East 11th/12th Streets Parking Demands by Block ................................... Following 6-3
Figure 20 – East 11th/12th Streets 2000 Parking Surpluses & Deficiencies by Sector .................................................................................. Following 6-4
Figure 21 – East 11th/12th Streets 2005 Parking Surpluses & Deficiencies by Sector.................................................................................... Following 6-5
AuseduquaStatmodvisitdiffbetwof Adowman
StuThecurrfor wayE. 1antithe Cap
ThebusAveThe
CitFroreprTheIH-a puthre
An by tconSouneiginduFor200
To Tas
T
DRAFDowntown Austin Comprehensive Parking Study – DRAFT 12/06/00 1-1
Chapter 1 Introduction
tin, Texas is a dynamic and thriving community with a vibrant economy based upon government, cation, technology, manufacturing, health care, tourism, and a place of residence that offers a lity lifestyle to over 1,100,000 individuals in the greater Austin area. Along with the heritage of e Capitol and The University of Texas at Austin, the city is faced with many of the problems of ern-day living, including parking problems. The shortage of downtown parking for workers, ors and residents is deemed a high priority problem evidenced by the increasing cost of parking, iculty in finding convenient spaces close to downtown destinations, and conflicting demands
een short-term parking for shoppers and long-term parking for workers. During 1999, the City ustin through the Mayor’s Mobility Task Force and other sources determined the need to review ntown parking supply and demand and to develop a comprehensive parking study and parking agement plan for the Austin downtown area.
dy Purpose and Objectives City of Austin initiated this study of parking problems in downtown Austin to address the ent and future parking needs in central Austin and recommend a parking management program implementation by the City and other agencies. The study is expected to help the City plan for s to alleviate current and future parking problems in the downtown, South Congress and 1th/E. 12th Street areas. Development projections for downtown will enable the City to cipate future parking and public transit needs. Travis County joined with the City in undertaking study, which included a parking study for the County Courthouse complex in downtown Austin. ital Metro also cooperated in the parking study.
parking study included an extensive citizen participation program to reach property owners, inesses and residents in the study area, which includes Downtown Austin, the South Congress nue corridor from Town Lake to Oltorf, and the E. 11th/E. 12th Street corridors east of IH-35. study area is shown in Figure 1.
izen Participation and Community Involvement m the outset of this parking study, the City wanted to involve the different citizen groups esenting the three distinct areas to be studied since the parking issues are different in each area. areas include downtown Austin, the westernmost sections of E. 11th and E. 12th Streets east of 35, and South Congress Avenue from Town Lake to Oltorf Street. The consultant team designed blic involvement process that would provide ample and different types of opportunities for these e communities to participate in the process.
advisory Parking Study Task Force comprised of representatives from all three areas was created he Planning, Environment and Conservation Services Department with the assistance of the sultant team. Key stakeholder groups participated including the Downtown Austin Alliance, the th Congress Avenue Merchants Association, the Austin Revitalization Authority, and hborhood associations from each of the three areas. Finally, representatives from the parking stry participated as well. (See Appendix A for the membership of the Parking Study Task
ce.) The Parking Study Task Force met four times (December 1999, March, May, and October 0) to review the consultant’s work and provide feedback and/or review comments.
gain additional input from individuals and groups not already represented on the Parking Study k Force, the consultants held four focus groups. A focus group in each of the three areas was
Downtown Austin Comprehensive Parking Study – DRAFT 12/22/00 Chapter 1 – Introduction
Wilbur Smith Associates • Urban Design Group • José E. Martínez & Associates 1-2
held the last week of January 2000. The E. 11th/E 12th Streets and South Congress Avenue focus groups were held in the evening while the downtown focus group was held in the morning. These times were selected with the knowledge of times of day that these different areas prefer for such meetings. The fourth focus group’s participants were all representatives of the high technology companies in downtown Austin, and it was held in the afternoon of a workday in April 2000 in downtown Austin. This focus group expanded the consultant’s understanding of the parking needs of this unique group of companies in downtown Austin.
To provide the general public opportunities to participate, three public meetings were held in the evenings in January, April and October 2000. The draft study report was presented at a joint briefing for the Planning, Design, Downtown, and Urban Transportation Commissions in November 2000. The Planning, Environment and Conservation Services Department audio recorded the Parking Task Force meetings and produced summary notes. Notes were taken at all of the other meetings, and the input was used in drafting the recommendations found in this report.
Parking Task Force Meetings - This advisory group heard the consultant’s presentations at each of its four meetings. The consultant presented the scope of work for the study, clarified the members’ understanding of that scope and set the schedule for the study period at the first meeting. The second and third meetings focused on the Task Force’s review and comment of the consultant’s work to date, and summary reports of the other public participation events held between the Parking Task Force meetings. The final meeting allowed the consultants to present the draft study findings, corollary conclusions and recommendations. The Task Force comments and recommendations were considered in preparing the final study report.
Focus Group Meetings - Brief summaries of the four Focus Group meetings are provided here as a quick review of the type and range of commentaries received. The full synopses of these and all other meetings are available from the City of Austin’s Planning, Environmental and Conservation Services Department.
! E. 11th/E. 12th Streets— January 25, 2000. The issues identified by the participants ranged from their interest for sufficient parking for potential tenants in this area proposed for a major redevelopment to ensure their businesses success, to what entity would pay for this parking. Because this area is surrounded by low-density residential neighborhoods, the participants strongly emphasized that the parking be compatible with the neighborhoods. The participants requested analysis of a public transit system that would enable downtown workers to shop and dine in this district as well as provide better transit to downtown.
! South Congress Avenue— January 24, 2000. A significant issue in this area is the South Congress Avenue merchants’ belief that the angled parking along the retail district from Academy to Live Oak is of paramount importance to the success of their businesses. They made it clear that they will not accept any option that will reduce the number of parking spaces in front of their storefronts. In addition, the consensus is that traffic speed on the Avenue is too fast, that street lights are needed to provide safe access across the Avenue, and that the parking spaces on the east side of the Avenue along this retail district should be configured for angled parking. The consensus was also that the future parking solution, as the business climate continues to improve in this retail district, is off-street parking on the west side of the Avenue. Their reaction was positive to retail buildings with enclosed parking as in the case of Jefferson Square at the intersection of Jefferson and W. 38th in west Austin.
! Downtown— January 25, 2000. In general, the consensus was that there is insufficient parking for both employees and customers in downtown, in particular during the lunch and
Downtown Austin Comprehensive Parking Study – DRAFT 12/22/00 Chapter 1 – Introduction
Wilbur Smith Associates • Urban Design Group • José E. Martínez & Associates 1-3
evening dinner hours. The loss of parking at Capital Metro’s Park-and-Ride at Town Lake Park and on-street parking was lamented. As new office, residential and commercial developments are started in downtown, the former surface parking lots are being closed and former parking tenants are being forced to find other options. Still, some attendees felt that downtown does not have a parking problem; it is a matter of people’s unwillingness to walk from parking areas or use alternative transportation. More suitable remote parking sites were requested since there is now more acceptance of remote parking and shuttles, as was the request to make transit “cool” and convenient, via better marketing, amenities at transit stops to convince “normal” people they can use transit. Some felt that by providing more parking, the supply would attract new demand and undercut transit efforts. Attendees recommended cooperative arrangements before new parking structures are considered (value of mixed use development). Any potential new parking structures should be municipal because a private operator would be concerned about liability and guarantees for evening use would be needed. It was understood that the real parking “problem” is a geographic mismatch of parking supply to parking demand. A new garage in each quadrant of downtown would equalize the mismatch, and would attract development around them. The need for an “ecosystem” approach – addressing parking, transit, access and mobility simultaneously and a parking database to identify complimentary activities was noted. Also recommended were more street lighting and better sidewalks to draw parkers to under-used areas given increased business activity and more evening traffic. Travis County’s court studies have shown that people are happy with the remote jury empanelment arrangement, which is unusual since they are away from a secure court area. One attendee stated that it is possible to provide too much parking, thereby discouraging carpooling.
! High Tech— April 25, 2000. Some of the downtown high tech firms’ square footage per person ratio is as high as 150 square feet/person, yet parking is made available at about one space per 750 s.f. of office space. High tech businesses operate on a 24/7 timeframe and with a high density in terms of persons/area of office space. Downtown surface lots have gone away from monthly contracts to daily and hourly use because this arrangement yields more revenue for the lot owners/managers, but employees using these parking lots find it expensive and inconvenient. As high tech employees are very mobile, it was mentioned that some potential employees have expressed the preference to work at suburban high tech firms that have parking available for all employees. One representative stated that the conventional office parking ratio of 1 space per 333 s.f. of office space is not sufficient for high tech businesses. Intel and CSC will dedicate their daytime parking for employees only, but will allow public parking after hours. While the attendees saw that the new development will increase Capital Metro ridership, they did not see that increase coming from their employees. Capital Metro routes and schedules do not satisfy the high tech employees that need the service on a 24/7 basis. A representative illustrated the daytime vs. evening parking dilemma by stating that their employees, some of whom start the work at mid-day, have to leave their work stations at 5:30 p.m. to go move their cars from parking lots because their monthly contract is for daytime use only. Otherwise, their cars are towed. If these companies cannot guarantee their employees parking, these companies may eventually, sooner than later, move out of downtown in preference to suburban sites where ample parking is available. The downtown lifestyle is only one of the attractions to locate in downtown. The attendees stated that telecommuting is not a likely partial parking solution for the high tech firms because their type of work is highly collaborative and requires close working relationships. If Capital Metro transit service had better routes and schedules it would increase its ridership. Satellite parking by Capital Metro that is secure, well lit, and with some retail at the ground level would be used by the high tech employees if it would be operable until late at night. The general conclusion of this meeting was that the high tech firms in
Downtown Austin Comprehensive Parking Study – DRAFT 12/22/00 Chapter 1 – Introduction
Wilbur Smith Associates • Urban Design Group • José E. Martínez & Associates 1-4
downtown Austin are experiencing urgent need for additional parking. The firms asked for the City and Capital Metro’s immediate attention to the downtown-parking dilemma. They mentioned that their presence at this focus group was an indication of their solidarity and unison in expressing their frustration about the downtown-parking dilemma.
Public Forum Meetings— January, April and October 2000 - In general, the commentaries obtained from the Public Forums were similar to those made at the Parking Task Force and Focus Group meetings, but they were significant in that they afforded those Austinites not able to participate in the former groups their opportunity to be heard. Residents from the three areas attended these public meetings and made commentaries like the following.
The neighborhood to the west of downtown, OWANA, is not averse to some structured parking in that area. Parking was perceived as an essential economic development element that must be addressed in order to preserve the downtown entertainment and cultural experience as well as the economic vitality of the heart of the community.
Others indicated that the City’s parking requirement of new construction needs to be removed; the City must “grow up,” like larger metropolitan areas have had to do. Mixed-use development with multi-user parking facilities was strongly recommended. And these developments, it was recommended, could be facilitated through public incentives.
Board/Commissions Meeting— November 2000 - Members of the Planning Commission, Design Commission, Downtown Commission, and Urban Transportation Commission were invited to review and discuss the draft parking study report. Attendees discussed the need to better understand the relationship between parking and the use of transit. They expressed the sentiment that Austinites do not want more parking garages in downtown. Attendees stated that they do not support increasing the Land Development Code’s parking requirements in downtown. Downtown parking should be balanced with remote parking garages served by shuttle service and a pedestrian friendly downtown streetscape.
Members of the Design Commission recommended that parking garages be designed with pedestrian-oriented uses at ground level along the street frontages, and so that they are capable of being converted to other land uses, such as using horizontal floor plates with high ceilings or the ability to remove alternate floor plates.
It was stated that the City’s parking standards require downtown residential developers to provide more parking spaces in downtown residential projects than are considered to be needed, which makes it difficult for to build more affordable housing. It was suggested that the parking standards for downtown should be eliminated.
One attendee stated that longer durations for on-street parking meters are needed around the County Courthouse, as many trips extend longer than the current two or three hour meter time limits. Others recommended that Capital Metro should serve downtown during the evening hours, and not just during the daytime. It was also recommended that the quality of transit service must be improved to provide a higher level of service to those who cannot or choose not to afford the cost of parking downtown.
Results of Citizen Participation and Public Involvement - The citizen participation activities included in the parking study demonstrated the various types of opportunities to solicit and gain the public’s input in public studies of significant importance. By soliciting the input from an ongoing
Downtown Austin Comprehensive Parking Study – DRAFT 12/22/00 Chapter 1 – Introduction
Wilbur Smith Associates • Urban Design Group • José E. Martínez & Associates 1-5
advisory group that worked closely with the City and consultants, the community was informed of the purpose and direction of the study. Through the focus groups, other individuals and organizations not included in the Parking Task Group were afforded a three-hour opportunity to provide detailed input. In the case of the high technology focus group in downtown, a particular industry provided a list of parking issues and recommended solutions to those issues. Via the Public Forum, other segments of the public participated who otherwise would not have. The presentation to the City’s Planning, Design, Downtown and Urban Transportation Commissions permitted these advisory groups to formulate recommendations to the City Council.
Related Studies At the outset of the study, previous parking and transportation studies related to the Downtown Parking Study were provided by the City of Austin and reviewed to identify downtown parking conditions and community issues. Brief written summaries were prepared for the following related studies and are provided in Appendix B at the back of this report.
• Downtown Access and Mobility Plan, Austin, Texas
Wilbur Smith Associates (Ongoing)
• Downtown Great Streets Master Plan, Austin, Texas Black & Vernooy Architects + Kinney Associates Joint Venture (Ongoing)
• CBD Parking Management Study: Austin, Texas
Wilbur Smith Associates (July 1985)
• Austin Convention Center Traffic Impact Analysis Wilbur Smith Associates (September 1989)
• Solutions to Downtown Parking:
A Healthy Environment, A Healthy Bottom Line Downtown Austin Alliance
• Austin Metropolitan Area 2020 Transportation Plan
Capital Area Metropolitan Planning Organization (December 1994, Amended February 1999)
• Downtown Parking Inventory
Downtown Austin Alliance Issue Paper No. 1, Christine Rapalje (August 1994)
• Greenways and Trails: A Vision for Greater Austin Austin Metropolitan Trails Council (1996)
• New Visions of East Austin: Central East Austin Master Plan and
East 11th & 12th Streets Community Redevelopment Plan
Downtown Austin Comprehensive Parking Study – DRAFT 12/22/00 Chapter 1 – Introduction
Wilbur Smith Associates • Urban Design Group • José E. Martínez & Associates 1-6
Austin Revitalization Authority Crane Urban Design Team (January 1999)
• Downtown Regulatory and Infrastructure Issues Downtown Austin Alliance Issue Paper No. 5, Shelly Branch, Editor (August 1995)
• South Congress Improvement Project: Enhancement Guidelines
Capital Metropolitan Transportation Authority The Avenue Team (January 1999)
Other related studies and documents were also subsequently provided by the City during the course of the study, including the draft Old West Austin Neighborhood Plan and draft Downtown Austin Design Guidelines. These additional studies and other documents were also considered in development of the parking study findings and recommendations.
A cexisinvemetothe
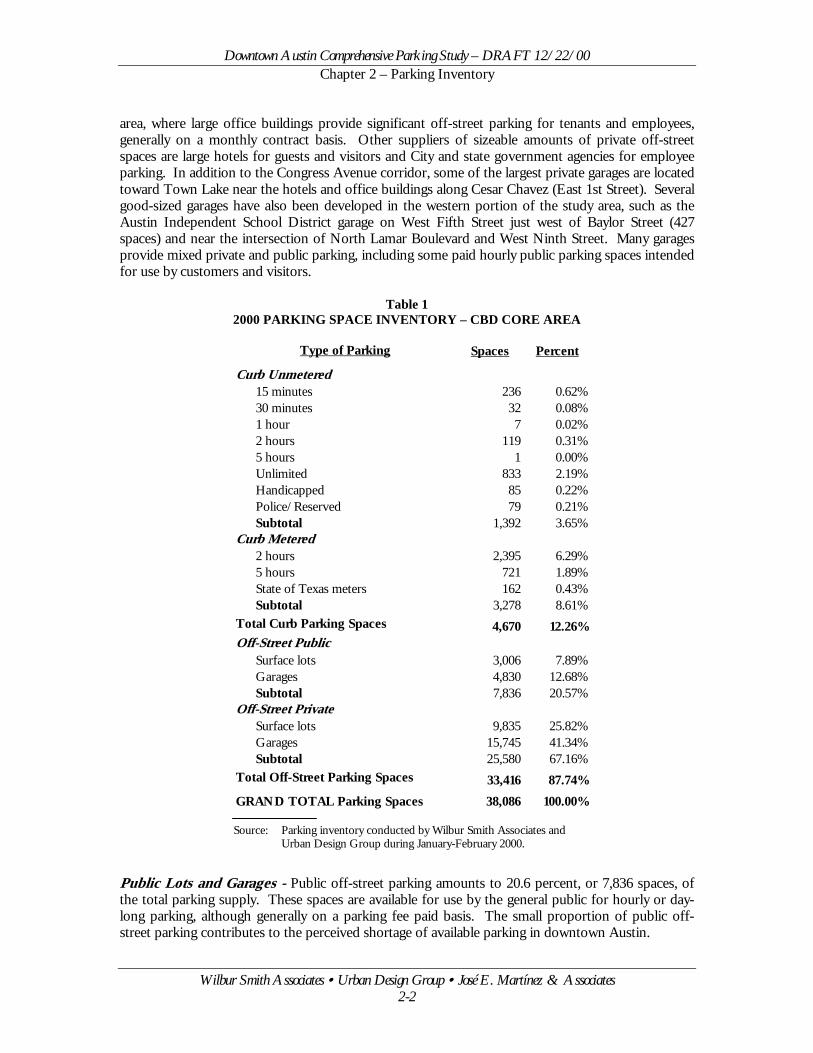
Theof 383 cTabotherang
Theuniqshoparkblocfor amofromthe
CurCurin thcurbparkalsoof tdow
On-totazonare bus
OffTheshospac“puusedfor
Privappspac
T
DRAFDowntown Austin Comprehensive Parking Study 2-1
Chapter 2 Parking Inventory and Utilization Survey
omprehensive parking inventory was conducted during January-February 2000 to identify all ting parking spaces within the study area, both in on-street and off-street locations. The ntory results provide information on the location, type of parking (on-street metered and non-ered, off-street lots and garages), type of use (“public” or “private”), use restrictions, cost, and r pertinent factors.
inventory for the Central Business District (CBD) portion of the study area identified a supply 8,086 parking spaces in the 200-block CBD area. This area also included 370 loading zones and urb “spaces” devoted to transit stops. A summary of all parking spaces by type is listed in le 1. A total of 33,416 parking spaces (87.7 percent) are in off-street lots, garages or alleys and r informal parking areas. Another 4,670 spaces (12.3 percent) are located at the curb, within the e typically found in similar size downtown areas.
available parking supply in the study area is shown in Figure 2. Each block is identified by a ue block number for purposes of this study. On-street parking facilities and other curb uses are
wn around the perimeter of each block, with different colors signifying metered and unmetered ing and temporary construction zones. Off-street parking facilities are identified within each k, including surface lots and garages available for general public use as well as facilities restricted private use. Figure 2 also shows the location of loading zones and transit stops, which reduce the unt of on-street parking. State-owned parking facilities in the downtown study area are excluded the inventory due to budgetary constraints. A list of state-owned parking facilities is included at
end of this chapter.
b Parking and Loading Zones b spaces account for 12.3 percent of the 38,086 spaces available for public hourly or daily parking e CBD area. Of the 4,670 curb spaces, 833 spaces have no time restriction posted. Unmetered parking with restricted time limits defined by traffic signs amounts to 395 spaces. Metered curb ing with two-hour or five-hour time limitations amounts to 3,116 spaces. The CBD study area includes 162 metered spaces near state facilities and offices that are under the direct jurisdiction he State of Texas. During the peak hours of business, availability of curb parking in the ntown core area and adjacent sectors is very limited.
street loading zones designated for commercial loading, customer service and passenger loading l 370 zones, not an inordinate number considering the size of the study area. Other loading es located in alleyways or off-street locations are not included in this number. The loading zones concentrated primarily in the downtown core area and in the vicinity of East Sixth Street where iness and commercial activity are highest.
-Street Parking off-street parking facilities in the Austin CBD area, by location, type and number of spaces, are wn in Figure 2 and summarized in Table 1. As of the January 2000 inventory, there were 33,416 es in off-street lots, garages and informal parking areas. The off-street spaces are classified as
blic” and “private” use based on who is able to utilize them. Private parking spaces are owned or by business firms for their customers or employees. Public spaces define parking that is open
use by the general public, either for free or on a fee-paid basis.
ate Lots and Garages - Private off-street parking facilities contain 25,580 spaces or roximately 67 percent of the available parking. These spaces are split between garages (15,745 es) and surface lots (9,835 spaces). The largest private garages are located in the core downtown
Downtown Austin Comprehensive Parking Study – DRAFT 12/22/00 Chapter 2 – Parking Inventory
Wilbur Smith Associates • Urban Design Group • José E. Martínez & Associates 2-2
area, where large office buildings provide significant off-street parking for tenants and employees, generally on a monthly contract basis. Other suppliers of sizeable amounts of private off-street spaces are large hotels for guests and visitors and City and state government agencies for employee parking. In addition to the Congress Avenue corridor, some of the largest private garages are located toward Town Lake near the hotels and office buildings along Cesar Chavez (East 1st Street). Several good-sized garages have also been developed in the western portion of the study area, such as the Austin Independent School District garage on West Fifth Street just west of Baylor Street (427 spaces) and near the intersection of North Lamar Boulevard and West Ninth Street. Many garages provide mixed private and public parking, including some paid hourly public parking spaces intended for use by customers and visitors.
Table 1 2000 PARKING SPACE INVENTORY – CBD CORE AREA
Source: Parking inventory conducted by Wilbur Smith Associates and Urban Design Group during January-February 2000.
Public Lots and Garages - Public off-street parking amounts to 20.6 percent, or 7,836 spaces, of the total parking supply. These spaces are available for use by the general public for hourly or day-long parking, although generally on a parking fee paid basis. The small proportion of public off-street parking contributes to the perceived shortage of available parking in downtown Austin.
Spaces Percent
Curb Unmetered15 minutes 236 0.62%30 minutes 32 0.08%1 hour 7 0.02%2 hours 119 0.31%5 hours 1 0.00%Unlimited 833 2.19%Handicapped 85 0.22%Police/Reserved 79 0.21%Subtotal 1,392 3.65%
Curb Metered2 hours 2,395 6.29%5 hours 721 1.89%State of Texas meters 162 0.43%Subtotal 3,278 8.61%
Total Curb Parking Spaces 4,670 12.26%Off-Street Public
Surface lots 3,006 7.89%Garages 4,830 12.68%Subtotal 7,836 20.57%
Off-Street PrivateSurface lots 9,835 25.82%Garages 15,745 41.34%Subtotal 25,580 67.16%
Total Off-Street Parking Spaces 33,416 87.74%GRAND TOTAL Parking Spaces 38,086 100.00%
Type of Parking
Downtown Austin Comprehensive Parking Study – DRAFT 12/22/00 Chapter 2 – Parking Inventory
Wilbur Smith Associates • Urban Design Group • José E. Martínez & Associates 2-3
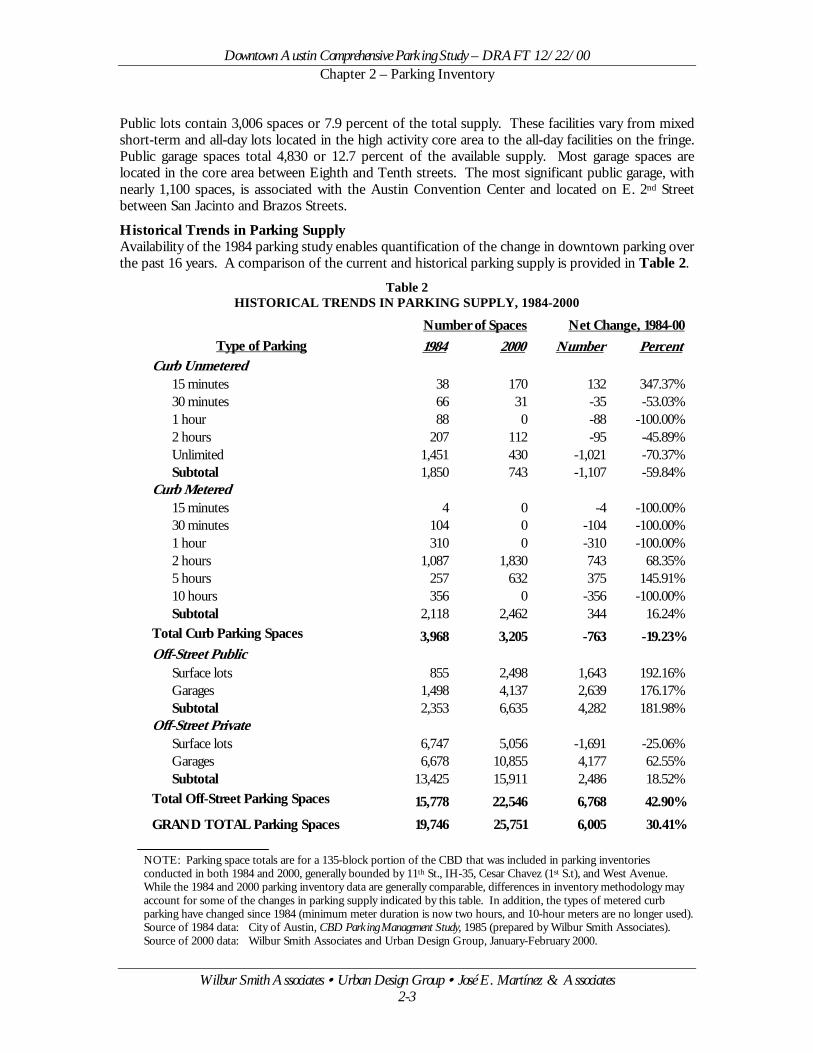
Public lots contain 3,006 spaces or 7.9 percent of the total supply. These facilities vary from mixed short-term and all-day lots located in the high activity core area to the all-day facilities on the fringe. Public garage spaces total 4,830 or 12.7 percent of the available supply. Most garage spaces are located in the core area between Eighth and Tenth streets. The most significant public garage, with nearly 1,100 spaces, is associated with the Austin Convention Center and located on E. 2nd Street between San Jacinto and Brazos Streets.
Historical Trends in Parking Supply Availability of the 1984 parking study enables quantification of the change in downtown parking over the past 16 years. A comparison of the current and historical parking supply is provided in Table 2.
Table 2 HISTORICAL TRENDS IN PARKING SUPPLY, 1984-2000
NOTE: Parking space totals are for a 135-block portion of the CBD that was included in parking inventories conducted in both 1984 and 2000, generally bounded by 11th St., IH-35, Cesar Chavez (1st S.t), and West Avenue. While the 1984 and 2000 parking inventory data are generally comparable, differences in inventory methodology may account for some of the changes in parking supply indicated by this table. In addition, the types of metered curb parking have changed since 1984 (minimum meter duration is now two hours, and 10-hour meters are no longer used). Source of 1984 data: City of Austin, CBD Parking Management Study, 1985 (prepared by Wilbur Smith Associates). Source of 2000 data: Wilbur Smith Associates and Urban Design Group, January-February 2000.
1984 2000 Number PercentCurb Unmetered
15 minutes 38 170 132 347.37%30 minutes 66 31 -35 -53.03%1 hour 88 0 -88 -100.00%2 hours 207 112 -95 -45.89%Unlimited 1,451 430 -1,021 -70.37%Subtotal 1,850 743 -1,107 -59.84%
Curb Metered15 minutes 4 0 -4 -100.00%30 minutes 104 0 -104 -100.00%1 hour 310 0 -310 -100.00%2 hours 1,087 1,830 743 68.35%5 hours 257 632 375 145.91%10 hours 356 0 -356 -100.00%Subtotal 2,118 2,462 344 16.24%
Total Curb Parking Spaces 3,968 3,205 -763 -19.23%Off-Street Public
Surface lots 855 2,498 1,643 192.16%Garages 1,498 4,137 2,639 176.17%Subtotal 2,353 6,635 4,282 181.98%
Off-Street PrivateSurface lots 6,747 5,056 -1,691 -25.06%Garages 6,678 10,855 4,177 62.55%Subtotal 13,425 15,911 2,486 18.52%
Total Off-Street Parking Spaces 15,778 22,546 6,768 42.90%GRAND TOTAL Parking Spaces 19,746 25,751 6,005 30.41%
Type of ParkingNumber of Spaces Net Change, 1984-00
Downtown Austin Comprehensive Parking Study – DRAFT 12/22/00 Chapter 2 – Parking Inventory
Wilbur Smith Associates • Urban Design Group • José E. Martínez & Associates 2-4
The available parking in 2000 is compared to the parking supply in 1984, when a previous parking study was conducted for downtown Austin. Because the 1984 study covered a smaller, 135-block portion of the core area, the direct comparison is between the common area inventoried in both 1984 and 2000. Significantly, the total number of curb parking spaces declined 20 percent while the number of metered curb spaces increased 16 percent. The total number of public parking spaces in off-street lots and garages increased by more than 180 percent, demonstrating significant growth in commercial parking lots. The number of private off-street spaces in garages increased by more than 60 percent while private surface lot spaces declined by 25 percent.
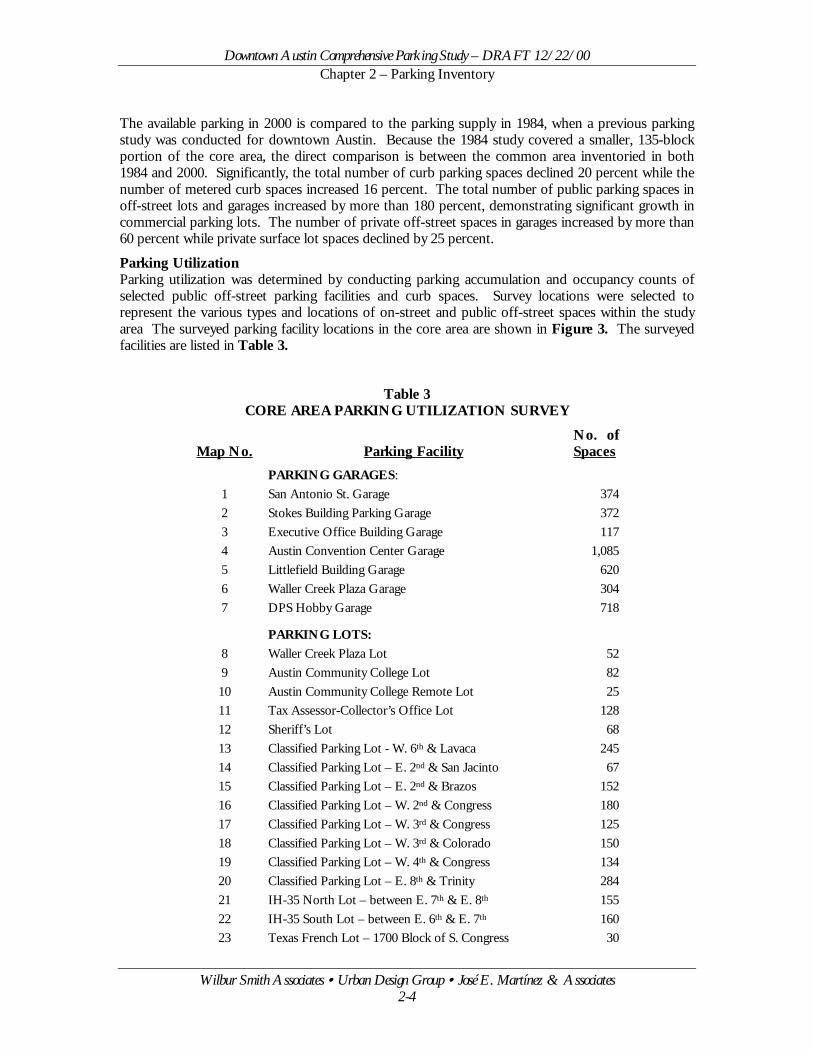
Parking Utilization Parking utilization was determined by conducting parking accumulation and occupancy counts of selected public off-street parking facilities and curb spaces. Survey locations were selected to represent the various types and locations of on-street and public off-street spaces within the study area The surveyed parking facility locations in the core area are shown in Figure 3. The surveyed facilities are listed in Table 3.
Table 3 CORE AREA PARKING UTILIZATION SURVEY
Map No. Parking Facility No. of Spaces
1 2 3 4 5 6 7
PARKING GARAGES: San Antonio St. Garage Stokes Building Parking Garage Executive Office Building Garage Austin Convention Center Garage Littlefield Building Garage Waller Creek Plaza Garage DPS Hobby Garage
374 372 117
1,085 620 304 718
8 9 10 11 12 13 14 15 16 17 18 19 20 21 22 23
PARKING LOTS: Waller Creek Plaza Lot Austin Community College Lot Austin Community College Remote Lot Tax Assessor-Collector’s Office Lot Sheriff’s Lot Classified Parking Lot - W. 6th & Lavaca Classified Parking Lot – E. 2nd & San Jacinto Classified Parking Lot – E. 2nd & Brazos Classified Parking Lot – W. 2nd & Congress Classified Parking Lot – W. 3rd & Congress Classified Parking Lot – W. 3rd & Colorado Classified Parking Lot – W. 4th & Congress Classified Parking Lot – E. 8th & Trinity IH-35 North Lot – between E. 7th & E. 8th IH-35 South Lot – between E. 6th & E. 7th Texas French Lot – 1700 Block of S. Congress
52 82 25
128 68
245 67
152 180 125 150 134 284 155 160 30

Downtown Austin Comprehensive Parking Study – DRAFT 12/22/00 Chapter 2 – Parking Inventory
Wilbur Smith Associates • Urban Design Group • José E. Martínez & Associates 2-5
Table 3 (Continued) CORE AREA PARKING UTILIZATION SURVEY
Map No. Parking Facility No. of Spaces
24 25 26 27 28 29 30 31 32
ON-STREET PARKING: W. 13th St. & San Antonio St. Guadalupe & W. 10th St. Congress between 8th & 10th Streets Congress between 5th & 7th Streets Congress between 2nd & 4th Streets E. 6th St. between San Jacinto & Neches 1500 Block of S. Congress Avenue 1300 Block of S. Congress Avenue E. 11th Street between Curve & LaBranch
33 71 40 30 34 40 21 22 5
SOURCE: Parking utilization Survey conducted by Wilbur Smith Associates and the Urban Design Group in March and April, 2000.
A total of 32 representative parking facilities were surveyed, including 28 curb parking locations and public parking in off-street lots and garages in the core area, as well as 2 curb parking locations and 1 surface lot in the S. Congress study area, and 1 curb parking location in the E. 11th/12th Streets study area.
The utilization counts for the selected facilities were performed by observing the accumulation of parked vehicles at hourly and bi-hourly intervals between 10:00 A.M. and 6:00 P.M. on a typical weekday (Tuesday, Wednesday or Thursday). Turnover counts of entering and exiting vehicles were also conducted at several typical public on-street and public off-street facilities to determine the average parking duration and turnover of spaces. Occupancy of parking spaces at approximate hourly intervals was documented as part of the survey. The results of utilization surveys for the individual facilities are contained in the Appendix.
Parking Accumulation - Parking accumulation refers to the total number of parked vehicles occupying spaces at each hour during a typical day, either in off-street facilities or at on-street curb locations. Based on the representative parking facilities surveyed for this study, overall accumulation patterns from 10:00 A.M. to 6:00 P.M. were extrapolated for on-street curb parking and off-street surface lot and garage parking in the downtown study area. Parking accumulation in the core area is displayed in Figure 4. Accumulation data is useful for analyzing the utilization of parking facilities. Comparison of the accumulation of parked vehicles to the available supply of parking spaces throughout the day indicates the variation in parking occupancy during a typical weekday. It is important to note that the effective capacity of a parking facility or a set of on-street curb spaces is somewhat less than the actual number of existing spaces. Because of turnover and the coming and going of parkers, a certain number of spaces is usually unoccupied and available to those “hunting” for spaces. Otherwise, a fully occupied facility could not accommodate any additional parkers seeking vacant spaces and would become congested with vehicles waiting for parking spaces. Other factors such as improperly parked vehicles taking up more than one space may also reduce the true capacity. Based on typical parking turnover patterns, the effective capacity of on-street spaces is considered to be about 90 percent of the actual total. For off-street lots and garages, the effective capacity is considered to be about 85 percent of the total number of spaces.
Downtown Austin Comprehensive Parking Study – DRAFT 12/22/00 Chapter 2 – Parking Inventory
Wilbur Smith Associates • Urban Design Group • José E. Martínez & Associates 2-6
The peak utilization of on-street parking in downtown Austin occurs in the early afternoon at about 1:00 P.M. on typical weekdays. At this peak time, 87 percent of the total on-street supply of 4,670 curb spaces is occupied by 4,084 vehicles. More importantly, 97 percent of the effective on-street parking supply (4,203 spaces) is occupied at the 1:00 P.M. peak, confirming the frustration experienced by those seeking curb parking at this time. Demand for on-street parking is already high at 10:00 A.M. (94 percent of effective capacity) and remains in this range through noon before climbing to the peak level from noon to 1:00 P.M.. After 1:00 P.M. demand returns to the morning level (93-94 percent) before beginning a steady decline, from 85 percent of effective supply at 4:00 P.M. to 70 percent by 6:00 P.M. (2,968 vehicles).
The accumulation data for off-street surface lots in the CBD study area shows an even tighter supply-demand situation than for on-street spaces. The parking inventory documented 12,841 parking spaces in surface lots in downtown Austin. At an effective capacity of 10,915 spaces, 98 percent of the effective surface lot supply (10,735 spaces) is already occupied at 10:00 A.M. Utilization climbs to 99 percent of effective supply at 11:00 A.M. but then drops backs to 96 percent by 1:00 P.M.. Then peak accumulation in surface lots occurs at 2:00 P.M., when 104 percent of the effective supply is occupied by 11,385 vehicles, which represents 88 percent of the total available supply. Utilization also exceeds the effective supply at 3:00 P.M. (101 percent) before dropping back to 92 percent at 4:00 P.M. From there surface lot utilization decreases to 73 percent at 5:00 P.M. and all the way to 44 percent by 6:00 P.M.
The accumulation pattern for downtown parking garages indicates a significant gap between overall supply and demand for garage spaces, especially when factoring in the Austin Convention Center garage and other large facilities that sometimes have considerable surplus capacity. Peak utilization of garage parking actually occurs at 10:00 A.M.., when 67 percent of the effective supply (17,489 spaces) is occupied by 11,724 vehicles. This level of demand represents 57 percent of the total supply of garage parking (20,575 spaces). Garage utilization drops to 61 percent of effective supply by 1:00 P.M., returns to the 65 percent level at 2:00 and 3:00, and then drops off to 45 percent at 5:00 P.M. and 24 percent by 6:00 P.M. after the afternoon departure of commuters.
Comparison of On-street and Off-Street Parking Accumulation - The separate evaluation of the three major types of parking (on-street, surface lots and garages) illustrates the differing patterns of use and parking accumulation. Demand for on-street parking starts off relatively high (87 percent) and remains so throughout much of the day, with peak utilization (97 percent) occurring at 1:00 P.M. At 6:00 P.M., 70 percent of on-street spaces are still occupied, just as the evening entertainment period is beginning. By comparison, garage utilization is highest at 10:00 A.M. (67 percent), then drops off slightly during the mid-day period before nearly returning to peak usage levels from 2:00-3:00 P.M. (65 percent), after which demand for garage parking falls off rapidly (down to 24 percent by 6:00 P.M., indicating the attractiveness of unused garage capacity for accommodating evening parking demand in appropriate locations). Utilization of surface lots actually exceeds the effective capacity for several hours during the mid-afternoon peak. Demand for surface lot spaces is already at 98 percent by 10:00 A.M. and falls no lower than 96 percent before the 2:00-3:00 P.M. peak. However, after decreasing to 92 percent at 4:00 P.M., surface lot utilization rapidly drops off to 44 percent by 6:00 P.M., which is much closer to the garage accumulation pattern versus the more steady on-street demand throughout the day.
The on-street utilization pattern reflects the more short-term and higher-turnover nature of curb parking, which serves many downtown trips of short duration each day. Off-street lots and garages, and especially “private use” facilities, tend to accommodate specific users, including many who park there for much, if not all, of the daytime hours.
Downtown Austin Comprehensive Parking Study – DRAFT 12/22/00 Chapter 2 – Parking Inventory
Wilbur Smith Associates • Urban Design Group • José E. Martínez & Associates 2-7
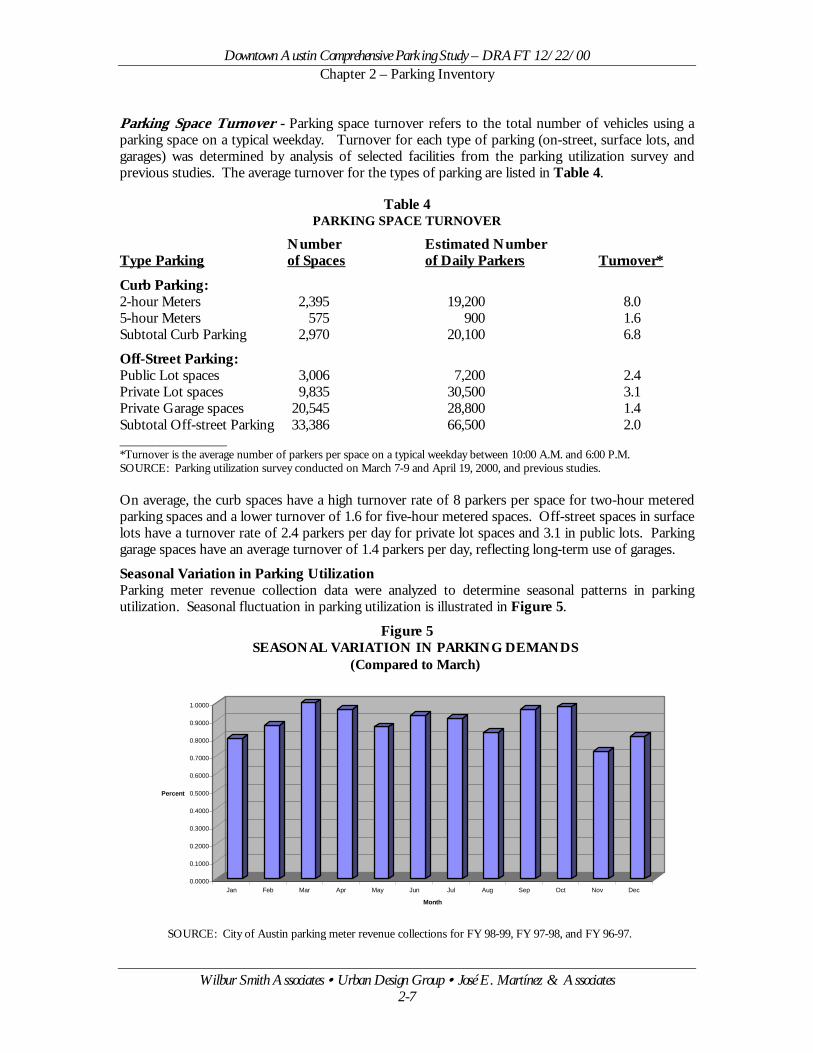
Parking Space Turnover - Parking space turnover refers to the total number of vehicles using a parking space on a typical weekday. Turnover for each type of parking (on-street, surface lots, and garages) was determined by analysis of selected facilities from the parking utilization survey and previous studies. The average turnover for the types of parking are listed in Table 4.
Table 4 PARKING SPACE TURNOVER
Number Estimated Number Type Parking of Spaces of Daily Parkers Turnover* Curb Parking: 2-hour Meters 2,395 19,200 8.0 5-hour Meters 575 900 1.6 Subtotal Curb Parking 2,970 20,100 6.8
Off-Street Parking: Public Lot spaces 3,006 7,200 2.4 Private Lot spaces 9,835 30,500 3.1 Private Garage spaces 20,545 28,800 1.4 Subtotal Off-street Parking 33,386 66,500 2.0 ________________ *Turnover is the average number of parkers per space on a typical weekday between 10:00 A.M. and 6:00 P.M. SOURCE: Parking utilization survey conducted on March 7-9 and April 19, 2000, and previous studies. On average, the curb spaces have a high turnover rate of 8 parkers per space for two-hour metered parking spaces and a lower turnover of 1.6 for five-hour metered spaces. Off-street spaces in surface lots have a turnover rate of 2.4 parkers per day for private lot spaces and 3.1 in public lots. Parking garage spaces have an average turnover of 1.4 parkers per day, reflecting long-term use of garages.
Seasonal Variation in Parking Utilization Parking meter revenue collection data were analyzed to determine seasonal patterns in parking utilization. Seasonal fluctuation in parking utilization is illustrated in Figure 5.
Figure 5
SOURCE: City of Austin parking meter revenue collections for FY 98-99, FY 97-98, and FY 96-97.
0.0000
0.1000
0.2000
0.3000
0.4000
0.5000
0.6000
0.7000
0.8000
0.9000
1.0000
Percent
Jan Feb Mar Apr May Jun Jul Aug Sep Oct Nov Dec
Month
SEASONAL VARIATION IN PARKING DEMANDS (Compared to March)
Downtown Austin Comprehensive Parking Study – DRAFT 12/22/00 Chapter 2 – Parking Inventory
Wilbur Smith Associates • Urban Design Group • José E. Martínez & Associates 2-8
The parking utilization survey was conducted in March-April, which are representative of the high seasonal demands as shown in Figure 5. The winter months of November, December and January exhibit lower demands seasonally, probably due to the impact of holiday periods.
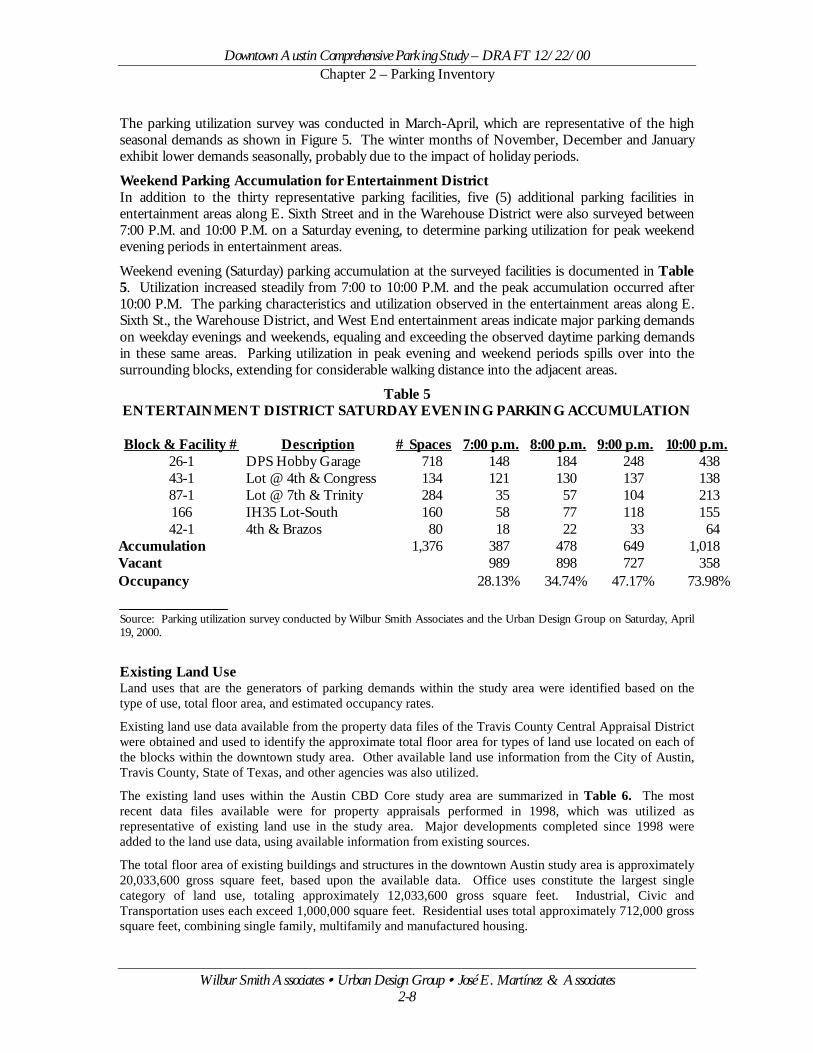
Weekend Parking Accumulation for Entertainment District In addition to the thirty representative parking facilities, five (5) additional parking facilities in entertainment areas along E. Sixth Street and in the Warehouse District were also surveyed between 7:00 P.M. and 10:00 P.M. on a Saturday evening, to determine parking utilization for peak weekend evening periods in entertainment areas.
Weekend evening (Saturday) parking accumulation at the surveyed facilities is documented in Table 5. Utilization increased steadily from 7:00 to 10:00 P.M. and the peak accumulation occurred after 10:00 P.M. The parking characteristics and utilization observed in the entertainment areas along E. Sixth St., the Warehouse District, and West End entertainment areas indicate major parking demands on weekday evenings and weekends, equaling and exceeding the observed daytime parking demands in these same areas. Parking utilization in peak evening and weekend periods spills over into the surrounding blocks, extending for considerable walking distance into the adjacent areas.
Table 5 ENTERTAINMENT DISTRICT SATURDAY EVENING PARKING ACCUMULATION
Block & Facility # Description # Spaces 7:00 p.m. 8:00 p.m. 9:00 p.m. 10:00 p.m.
26-1 DPS Hobby Garage 718 148 184 248 438 43-1 Lot @ 4th & Congress 134 121 130 137 138 87-1 Lot @ 7th & Trinity 284 35 57 104 213 166 IH35 Lot-South 160 58 77 118 155 42-1 4th & Brazos 80 18 22 33 64
Accumulation 1,376 387 478 649 1,018 Vacant 989 898 727 358 Occupancy 28.13% 34.74% 47.17% 73.98%
Source: Parking utilization survey conducted by Wilbur Smith Associates and the Urban Design Group on Saturday, April 19, 2000.
Existing Land Use Land uses that are the generators of parking demands within the study area were identified based on the type of use, total floor area, and estimated occupancy rates.
Existing land use data available from the property data files of the Travis County Central Appraisal District were obtained and used to identify the approximate total floor area for types of land use located on each of the blocks within the downtown study area. Other available land use information from the City of Austin, Travis County, State of Texas, and other agencies was also utilized.
The existing land uses within the Austin CBD Core study area are summarized in Table 6. The most recent data files available were for property appraisals performed in 1998, which was utilized as representative of existing land use in the study area. Major developments completed since 1998 were added to the land use data, using available information from existing sources.
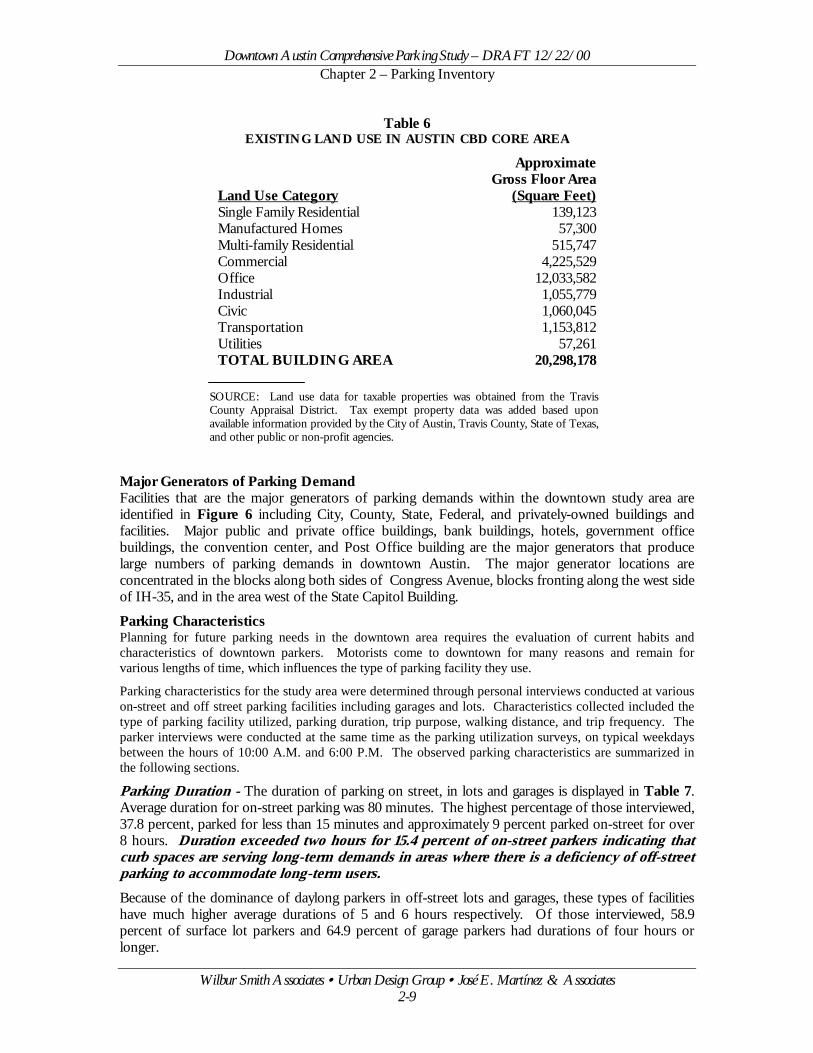
The total floor area of existing buildings and structures in the downtown Austin study area is approximately 20,033,600 gross square feet, based upon the available data. Office uses constitute the largest single category of land use, totaling approximately 12,033,600 gross square feet. Industrial, Civic and Transportation uses each exceed 1,000,000 square feet. Residential uses total approximately 712,000 gross square feet, combining single family, multifamily and manufactured housing.
Downtown Austin Comprehensive Parking Study – DRAFT 12/22/00 Chapter 2 – Parking Inventory
Wilbur Smith Associates • Urban Design Group • José E. Martínez & Associates 2-9
Table 6 EXISTING LAND USE IN AUSTIN CBD CORE AREA
Land Use Category
Approximate Gross Floor Area
(Square Feet) Single Family Residential 139,123 Manufactured Homes 57,300 Multi-family Residential 515,747 Commercial 4,225,529 Office 12,033,582 Industrial 1,055,779 Civic 1,060,045 Transportation 1,153,812 Utilities 57,261 TOTAL BUILDING AREA 20,298,178
SOURCE: Land use data for taxable properties was obtained from the Travis County Appraisal District. Tax exempt property data was added based upon available information provided by the City of Austin, Travis County, State of Texas, and other public or non-profit agencies.
Major Generators of Parking Demand Facilities that are the major generators of parking demands within the downtown study area are identified in Figure 6 including City, County, State, Federal, and privately-owned buildings and facilities. Major public and private office buildings, bank buildings, hotels, government office buildings, the convention center, and Post Office building are the major generators that produce large numbers of parking demands in downtown Austin. The major generator locations are concentrated in the blocks along both sides of Congress Avenue, blocks fronting along the west side of IH-35, and in the area west of the State Capitol Building.
Parking Characteristics Planning for future parking needs in the downtown area requires the evaluation of current habits and characteristics of downtown parkers. Motorists come to downtown for many reasons and remain for various lengths of time, which influences the type of parking facility they use.
Parking characteristics for the study area were determined through personal interviews conducted at various on-street and off street parking facilities including garages and lots. Characteristics collected included the type of parking facility utilized, parking duration, trip purpose, walking distance, and trip frequency. The parker interviews were conducted at the same time as the parking utilization surveys, on typical weekdays between the hours of 10:00 A.M. and 6:00 P.M. The observed parking characteristics are summarized in the following sections.
Parking Duration - The duration of parking on street, in lots and garages is displayed in Table 7. Average duration for on-street parking was 80 minutes. The highest percentage of those interviewed, 37.8 percent, parked for less than 15 minutes and approximately 9 percent parked on-street for over 8 hours. Duration exceeded two hours for 15.4 percent of on-street parkers indicating that curb spaces are serving long-term demands in areas where there is a deficiency of off-street parking to accommodate long-term users. Because of the dominance of daylong parkers in off-street lots and garages, these types of facilities have much higher average durations of 5 and 6 hours respectively. Of those interviewed, 58.9 percent of surface lot parkers and 64.9 percent of garage parkers had durations of four hours or longer.
Downtown Austin Comprehensive Parking Study – DRAFT 12/22/00 Chapter 2 – Parking Inventory
Wilbur Smith Associates • Urban Design Group • José E. Martínez & Associates 2-10
Table 7 PARKING DURATION BY TYPE OF PARKING
Percentage of Parkers By Type of Facility Parking Duration On-Street Lots Garages Total 1 to 15 Minutes 37.8% 0.0% 2.0% 21.4% 16 to 30 Minutes 16.2% 2.0% 1.4% 9.5% 31 to 60 Minutes 17.0% 3.9% 3.4% 10.9% 1 to 2 Hours 13.7% 5.9% 15.5% 13.4% 2 to 3 Hours 2.5% 17.6% 4.1% 4.8% 3 to 4 Hours 1.7% 11.8% 8.8% 5.2% 4 to 5 Hours 0.4% 9.8% 2.0% 2.0% 5 to 6 Hours 0.0% 9.8% 4.7% 2.7% 6 to 7 Hours 0.0% 5.9% 6.1% 2.7% 7 to 8 Hours 2.1% 2.0% 8.1% 4.1% Over 8 Hours 8.7% 31.4% 43.9% 23.2% Total 100.0% 100.0% 100.0% 100.0% Average Duration
1 hr and 20 min
5 hrs and 17 min
6 hrs and 2 min
3 hrs and 23 min
SOURCE: Parking Interview Survey conducted on March 7-9, 2000 and on April
19, 2000. Trip Purpose - Downtown serves as a major employment center, which is reflected by the fact that the largest percentage of parkers in the downtown area, 42.2 percent, are on work trips as displayed in Table 8. Figure 7 graphically displays the percentage of parkers by type of parking and trip purpose.
The majority of parkers whose primary trip purpose is shopping park in on-street spaces while those whose primary purpose is work-related park in off-street lots and garages. Shopping and business trips comprise 26.7 percent and 18.1 percent of all trips respectively. Shopping as a trip purpose has increased significantly since 1984, when it represented only 2 percent of trip purposes. Shopping is the trip purpose for 45 percent of on-street parkers. Work trips comprise 17 percent of on-street parking trip purposes and 77-80 percent of off-street parking trip purposes.
Table 8 TRIP PURPOSE BY TYPE OF PARKING
Percentage of Parkers by Type of Parking
Trip Purpose On Street Lots Garages Total Shopping 45.4% 0.0% 0.0% 26.6% Business 28.4% 9.8% 1.4% 18.1%
Work 17.0% 80.4% 77.0% 42.2% Other 9.2% 9.8% 21.6% 13.1% Total 100.0% 100.0% 100.0% 100.0%
SOURCE: Parking Interview Survey conducted on March 7-9, 2000 and
on April 19, 2000.
Downtown Austin Comprehensive Parking Study – DRAFT 12/22/00 Chapter 2 – Parking Inventory
Wilbur Smith Associates • Urban Design Group • José E. Martínez & Associates 2-11
Figure 7 TRIP PURPOSE BY TYPE OF PARKING
SOURCE: Parking Interview Survey conducted on March 7-9, 2000 and April 19, 2000.
Walking Distance - Average walking distance is related to the duration of the parker’s activity and to the trip purpose. Parkers typically display preference for on-street spaces, turning to off-street parking in lots and garages when they are unable to find a curb space. Walking distances of 200 to 300 feet are considered the average preferred distance.
On average, the majority of all parkers interviewed walked between 200 and 300 feet, equivalent to about one city block. Summarized in Table 9 are the percentage of parkers by type of parking and walking distance. The average walking distance for on-street and surface lot parkers was 309 feet and 395 feet respectively. Average walking distance of 165 feet for garage parkers was considerably lower than the walking distance for the other two types of parking facilities. .
Table 9 WALKING DISTANCE BY TYPE OF PARKING
Percentage of Parkers by Type of Parking Walking Distance On-Street Lots Garages Total
1 to 50 feet 13.3% 31.4% 10.1% 14.2% 51 to 100 feet 9.7% 0.0% 38.3% 17.5% 101 to 200 feet 7.2% 2.0% 28.2% 13.2% 201 to 300 feet 48.4% 33.3% 19.5% 37.8% 301 to 500 feet 5.4% 0.0% 1.3% 3.5% 501 to 700 feet 10.4% 15.7% 2.0% 8.4% 701 to 900 feet 3.6% 9.8% 0.7% 3.3% 901 to 1100 feet 0.0% 0.0% 0.0% 0.0% 1101 to 1500 feet 2.2% 7.8% 0.0% 2.1% over 1500 feet 0.0% 0.0% 0.0% 0.0% Total 100.0% 100.0% 100.0% 100.0% Average Distance 309 feet 395 feet 165 feet 273 feet SOURCE: Interview Survey conducted on March 7-9, 2000 and April 19, 2000.
0.0%
10.0%
20.0%
30.0%
40.0%
50.0%
60.0%
70.0%
80.0%
90.0%
Shopping Business Work Other
On StreetLotsGarages
Downtown Austin Comprehensive Parking Study – DRAFT 12/22/00 Chapter 2 – Parking Inventory
Wilbur Smith Associates • Urban Design Group • José E. Martínez & Associates 2-12
Trip Frequency - Trip frequency data, which reflects how many times parkers made a trip downtown by automobile, is summarized in Figure 8. Approximately 46 percent of all parkers interviewed indicated four or more trips per week. Ninety percent and 71 percent of those motorists in garages and lots indicated 4 or more trips per week, which is probably due to the majority of parkers in lots and garages working in downtown.
Figure 8 TRIP FREQUENCY BY TYPE OF PARKING
SOURCE: Parking Interview Survey conducted on March 7-9, 2000 and on April 19, 2000.
Overall the parking characteristics of the downtown area emphasize the correlation between trip frequency, purpose and duration with the type of facility used. Motorists coming to downtown more frequently and for longer periods of time primarily use off-street parking garages and lots. Those motorists coming to downtown less frequently and for shorter periods of time, for example for shopping, have a tendency to use available on-street parking.
Parking Enforcement The City of Austin employs a team of civilian personnel, numbering 23 persons with nine dedicated vehicles (as of January 2000), to enforce the City’s parking regulations. The Parking Enforcement Section operates out of the City’s Public Works and Transportation Department and is not affiliated with the Austin Police Department. Section personnel, known as “parking enforcement officers,” conduct their duties during two day shifts which cover 18 parking meter “beats.” The beats may vary slightly each day based on available staff, with some beats completed on foot and others from vehicles.
The Parking Enforcement Section makes use of technology to streamline operations and reduce costs. Citation records are downloaded from hand-held field devices and the information is transferred to Municipal Court personnel through the City’s computer network. In return, Municipal Court regularly forwards a “scofflaw” file, which can be uploaded to the handhelds to enable enforcement personnel to identify vehicles with outstanding parking tickets. The electronic system
0.0%
20.0%
40.0%
60.0%
80.0%
100.0%
Less than 1 20.6% 9.8% 2.7% 13.9%
1 - 3 60.6% 19.6% 7.4% 39.7%
4 or more 18.8% 70.6% 89.9% 46.4%
On Street Lots Garages Total

Downtown Austin Comprehensive Parking Study – DRAFT 12/22/00 Chapter 2 – Parking Inventory
Wilbur Smith Associates • Urban Design Group • José E. Martínez & Associates 2-13
also allows issued parking citations and booting activity to be monitored through weekly reports by beat.
Parking Enforcement personnel use the Municipal Court “hot sheets” during their regular beat patrols to locate vehicles with outstanding parking tickets. A “booting team” is notified when a scofflaw vehicle is identified, and the team places a restraining device, known as a wheel “boot,” on the vehicle to prevent its operation until prior parking citations are resolved. A vehicle with outstanding parking citations can be legally parked when a boot is applied, including in a residential driveway, with the owner either at home or away at the time. A sticker is affixed to the vehicle with instructions on necessary steps to resolve prior citations and free the immobilized vehicle. Booted vehicles are then towed by a Municipal Court towing contractor if the outstanding citations have not been resolved by 4:00-5:00 p.m. (i.e., booted vehicles are not left on the street overnight).
The City began its booting program around 1993-94 when parking violations were changed from criminal to civil offenses at Municipal Court. The City currently has about 20 boot devices, and most are placed on vehicles owned by individuals versus commercial vehicles. Despite expectations of a controversial and difficult program, City staff report that the booting approach has gone well overall as a result of effective planning and implementation.
Violations associated with handicapped parking spaces are enforced by the Austin Police Department. Individuals with handicapped parking tags can park in any metered space without paying the meter, and their parked vehicles are not subject to typical time limits on metered spaces. The City does not place parking meters at designated handicapped spaces.
The Parking Enforcement Section has enjoyed relatively stable staffing and City budget support in recent years, adding four new officers approximately four years ago. Better pay has also helped to reduce staff turnover, which rose to as high as 50 percent per year previously. The Public Works and Transportation Department continually trains additional staff for enforcement assignments to avoid a “training lag” when staff must be replaced.
Adjudication of Parking Citations
The City of Austin Municipal Court is the judicial branch of city government and is responsible for adjudicating parking citations issued by enforcement personnel. Parking violations are civil rather than criminal infractions of the law, meaning that individuals are fined for violations but cannot be arrested for the actual violations or for failure to resolve delinquent parking ticket fines. However, as described above, the City of Austin is one of many larger cities that places restraining devices, known as wheel “boots,” on vehicles with outstanding parking tickets. Booted vehicles are also subject to towing at the owner’s expense. Once a vehicle is booted and/or towed, the owner must go to Municipal Court and pay all fines due or request a hearing to retrieve his or her vehicle. All outstanding fines must be resolved since partial payments are not sufficient to cancel a boot or tow order.
Those interested in contesting a parking citation must appear in person at Municipal Court on or before the hearing date shown on the ticket. Recipients of parking citations are also entitled to “instanter hearings,” in which the alleged violator can walk into Municipal Court and request a hearing at any time from the moment the citation is issued to the scheduled hearing date.
The City of Austin Municipal Court maintains database records of all parking citations issued. A sample of violations from roughly a five-month period during the City’s Fiscal Year 2000 (September 1999-January 2000) were reviewed to identify the types of parking violations addressed by the City’s enforcement program. Of the 65,536 violations documented during this five-month period, more than half were for expired parking meters (36,781, or 56 percent). The next most common violation
Downtown Austin Comprehensive Parking Study – DRAFT 12/22/00 Chapter 2 – Parking Inventory
Wilbur Smith Associates • Urban Design Group • José E. Martínez & Associates 2-14
was for vehicles illegally parked in tow away zones (18,588, or 28.4 percent). The remaining 15.5 percent of citations was distributed over 38 other categories of parking violations recognized by the Municipal Court, as presented in Table 10.
Table 10
SUMMARY OF PARKING VIOLATIONS BY TYPE
Source: City of Austin Municipal Court. Based on data for parking citations issued from September 1, 1999, through January 20, 2000.
Residential Parking Permit Program The Residential Permit Parking Program(1) was established by the City of Austin in 1996 to address neighborhood concerns about the increased use of on-street parking in residential neighborhoods by non-resident vehicles from adjacent businesses and downtown office buildings. The purpose of the Residential Permit Parking Program is to limit the overflow or spillover commuter or non-resident parking on designated residential streets. The Residential Parking Permit Program authorizes the City Traffic Engineer to designate residential parking permit (RPP) zones. Within a RPP zone, signs
1 City of Austin Guidelines for the Residential Permit Parking Program, Transportation Division,
Department of Public Works and Transportation, June 1999.
Blocking Driveway 280 0.427%Time Zone 249 0.380%Blocking Handicapped Access Ramp 209 0.319%Blocking Alley 181 0.276%Over 18 Inches from Curb 169 0.258%Public Park 168 0.256%Parked Facing Traffic 150 0.229%Blocking Crosswalk 141 0.215%Passenger Zone 119 0.182%Extending Time Beyond Limit 107 0.163%Within 20 Feet of a Crosswalk 106 0.162%Commercial Service Zone (Over 30 Minutes) 101 0.154%Not Within Lines (Meter Zone) 74 0.113%Customer Service Zone 48 0.073%Permit (Orange Hood on Meter) 31 0.047%Reserved (Municipal Court) 20 0.031%Within an Intersection 15 0.023%Permit Parking (Non-Meter Area) 9 0.014%Parallel Only 8 0.012%Taxi Stand 7 0.011%Bus Stop 6 0.009%Obstructing Traffic Next to Construction 6 0.009%Loading Zone 4 0.006%Over Stall Line (Unmetered) 4 0.006%Mexican Consulate Passenger & Load Zone 3 0.005%Within 30 Feet of a Yield Sign 2 0.003%Yellow Flag Meter 1 0.002%
65,536 100.00%TOTAL
Downtown Austin Comprehensive Parking Study – DRAFT 12/22/00 Chapter 2 – Parking Inventory
Wilbur Smith Associates • Urban Design Group • José E. Martínez & Associates 2-15
are posted to designate curbside parking for use only by vehicles with a valid RPP permit during certain periods. Only vehicles displaying a valid permit are allowed to park in the zone during the reserved time period (example: M-F, 7:00 A.M. to 7:00 P.M. A Residential Parking Permit does NOT guarantee or assign residents a parking place. It allows residents the right to park IF they find a parking space. Residents who live in a designated RPP zone may purchase permits from the Neighborhood Association. Residents may purchase a Residential Parking Permit package for $25 the first year and $15 for annual renewals. The RPP package includes two resident sticker permits and two visitor hang-tags. Additional visitor permits for events requiring more than two visitor permits may be obtained from the Neighborhood Association by requesting them at least two weeks in advance of the event. Businesses located in a RPP zone may purchase up to two sticker permits for $25 and up to two additional sticker permits for $12.50 each. Emergency vehicles and properly identified delivery, utility and service vehicles are exempt from the RPP regulations. Any vehicle parked in an RPP zone during the restricted hours that does not display a valid permit will be issued a parking citation, with a fine of $20 per offense.
To qualify for designation as a RPP Zone, an area must comply with the following requirements, criteria and procedures: ! The residents identify the problem area and the time periods when the parking problem
occurs. ! The Transportation Division of the Department of Public Works and Transportation
conducts a preliminary review to determine the extent of the parking conflict and the likely boundaries of the RPP zone. One block is the smallest street segment normally considered for RPP designation.
! A petition must be submitted to the Transportation Division supporting the RPP zone designation. The petition must be circulated among all households in the proposed area and signatures in favor of the designation must be provided by at least two-thirds of the households within the proposed area.
! The Transportation Division performs a parking survey which must verify that at least 75 percent of the available on-street parking spaces are occupied during peak parking hours of any two days during a two-week period.
! The Neighborhood Association holds a public neighborhood meeting to discuss the proposal and the Neighborhood Association must endorse the residents’ request for the RPP zone designation and designate a representative who is responsible for notifying residents about the RPP zone, administering the RPP permits, and communicating resident concerns to City staff.
! The Neighborhood Associations begins selling RPP permits and the City installs the RPP signs and begins enforcing the RPP parking regulations in the zone approximately one week after installation.
State-Owned Parking Facilities State of Texas parking facilities (State-owned or leased parking facilities serving State office buildings and used by State employees) were excluded from the parking space inventory and utilization survey. Budgetary constraints did not permit the level of work necessary to address the additional number of parking facilities.
Information on State parking facilities was obtained from the Texas Department of Public Safety. State parking facilities located within the study area are listed in Table 11. A total of 31 state facilities provide 8,243 spaces in the core area. During business hours on weekdays, these facilities are largely
Downtown Austin Comprehensive Parking Study – DRAFT 12/22/00 Chapter 2 – Parking Inventory
Wilbur Smith Associates • Urban Design Group • José E. Martínez & Associates 2-16
restricted for use by State employees, officials and visitors. Many of the facilities are open to public use in non-business hours, an example of shared parking which should be encouraged and utilized to a greater extent to accommodate daytime and evening parking demands where practical.
Table 11
Surface StructureState-only
Use Public Use Surface StructureState-only
UseLot 19 1800 Colorado Out of service No 90 yesLot 7 1800 Congress SFA,WBT,ERS,LBJ Yes 279 YesLot 12 1800 San Jacinto ERS, GSC Yes 187 Yes
Garage R 1700 San Jacinto Out of service No 1,800 YesLot 3 1600 Congress SFA,WBT,LBJ Yes 168 Yes
Lot 2w 1600 Congress WBT,LBJ yes 123 YesGarage Q 1600 San Jacinto Out of service No 758 YesGarage G 300 E 17th GSC,LBJ Yes 242 YesGarage B 1500 San Jacinto GSC,LBJ,WBT,SFA Yes 727 Yes
Lot 22 1500 San Jacinto GSC,LBJ,WBT,SFA Yes 49 YesGarage P 200 E 16th Robert Johnson Bld. No 600 Yes
Lot 11 1500 Congress House of Rep, DPS Yes 137 YesLot 8 1500 Colorado House of Rep Yes 133 Yes
Garage J 1500 Guadalupe Clements Yes 864 YesGarage E 1600 Colorado SFA,WBT,LBJ,Clements Yes 1,427 YesGarage A 1400 San Jacinto All complex buildings Yes 854 614 240
Work Force Garage 1400 Brazos Work Force No 250 YesGarage C 200 W 14th Supreme Court Yes 45 YesGarage M 200 W 14th Daniels No 54 Yes
Lot 6 1300 San Jacinto Houston Yes 69 YesLot 18 1300 San Jacinto Houston, Senate Print Yes 59 Yes
Garage F 1300 San Jacinto Senate, House, Gov. Office Yes 454 YesVisitors Garage 1200 San Jacinto Capitol No 512 Yes
Lot 25 1100 Colorado House Yes 49 YesLot 14 1000 Colorado EOT, Greer, Mansion Yes 131 YesLot 27 1000 Congress Rusk, Greer Yes 43 Yes
Garage K 1000 Brazos Rusk, Greer No 259 YesLot 15 900 Colorado EOT 55 Yes
Garage N 300 San Antonio Hobby Yes 718 YesStarr Garage 107 W6th Starr No 267 Yes
Parking Spaces Sub-Total 1,482 6,761 240 90 3,070Total Parking Spaces
SFA= Stephen F. Austin ERS= Employee Retirement SystemWBT= William B. Travis GSC= General Service CommissionLBJ= Lyndon B. Johnson EOT= Ernest O. Thompson
SOURCE: State of Texas General Services Administration.
3,1608,243
STATE OF TEXAS PARKING FACILITIES IN DOWNTOWN AUSTIN
Existing Total No. of Spaces and Use During Business Hours
Proposed Total No. of Spaces and UsBusiness HoursPublic Use
Allowed After Business Hours?
State Buildings Served By Parking FacilityStreet AddressParking Facility Name
A kdemare basethesDisPubthrofactpark
DowTabratiostreNewempresp
___1 IncSOU
T
DRAFDowntown Austin Comprehensive Parking Study 3-1
Chapter 3 Parking Supply and Demand Analysis
ey purpose of the Austin Downtown Parking Study is to quantify the magnitude of parking space ands and needs in the study area for the current year 2000 and upcoming years. Parking needs generated by the daytime population of workers and visitors in a downtown area and will vary d upon the proportion of trips made by automobile and the available parking supply to meet e demands. Transit system use helps to offset parking demand, especially in Central Business tricts, and transit ridership is affected by the convenience, reliability and cost of the service. lic parking policies and management techniques also influence the supply-demand situation ugh adjustments to parking costs, location, hours of availability, violation penalties, and other ors to meet certain objectives. For this discussion, parking demand is defined as the number of ers with destinations in a specific block.
ntown parking in selected cities, including Austin, is compared to downtown employment in le 12. The number of downtown employees per off-street parking space is presented as the of workers to long-term parking spaces for each city. With a ratio of 1.6 employees per off-
et space, Austin has fewer employees per long-term parking space than Dallas, Houston, and Orleans, but more than San Antonio. Cities with high transit ridership have a higher ratio of loyees to parking spaces. Toronto and Seattle have 5.2 and 3.1 employees per parking space, ectively.
Table 12 DOWNTOWN PARKING IN AUSTIN AND OTHER CITIES
Curb Off-Street CBD Employees Per City Spaces Spaces Employment Off-Street Space San Antonio, TX 1,665 45,500 48,000 1.0 Austin, TX 4,670 41,659 1 65,000 1.6
Dallas, TX 1,200 68,000 158,350 2.0
Houston, TX 4,200 79,000 160,000 2.0
New Orleans, LA 4,300 48,000 100,000 2.1
Pittsburg, PA 600 40,000 80,000 2.2
Denver, CO 1,300 39,000 110,000 2.8
Seattle, WA 5,600 40,000 125,000 3.1
Toronto, Ontario -- 36,000 185,000 5.2
_____________ ludes State parking facilities. RCE: Data collected from various studies and conversations with city representatives. Date of
reference for data varies among the individual cities.
Downtown Austin Comprehensive Parking Study – DRAFT 12/22/00 Chapter 3 – Parking Supply and Demand Analysis
Wilbur Smith Associates • Urban Design Group • José E. Martínez & Associates 3-2
Year 2000 Parking Demands Year 2000 parking demands were estimated based upon existing land use information including type of use and gross floor area, as represented by parcel data obtained from the Travis County Central Appraisal District. The land use categories and typical weekday parking generation for various uses are shown in Table 13.
Table 13
LAND USE CATEGORIES AND TYPICAL WEEKDAY PARKING GENERATION
Land Use Category Uses Included
Typical Weekday Parking Generation
Parking Generation Used For Estimating Mid-Day Demands
Single-family Single family detached, Attached , Two-family housing
0.20 to 2.00 spaces per unit 0.75 spaces per unit
Multi-family Three/fourplex, Apartment/Condo, Group Quarters, Retirement Housing
0.24 to 1.90 spaces per unit for low/mid-rise apartments, 0.30 to 3.40 spaces per unit for high-rise apartments, 0.20 to 1.61 spaces per unit for residential condominium, 0.11 to 0.48 spaces per unit for retirement community
0.75 spaces per unit
Commercial Retail & General Merchandise, Apparel & Accessories, Furniture & Home furnishings, Grocery & Food Sales, Eating & Drinking, Auto Related, Entertainment, Personal Services, Lodging, Building Services
1.2 to 6.17 spaces per 1000 square feet GLA for shopping centers, 6.25 to 25.83 spaces per 1,000 square feet GLA for restaurants, 0.26 to 1.32 spaces per room for convention hotel
2.5 spaces per 1000 gross square feet
Office Administrative Offices, Financial Services, Medical Offices, Research & Development
0.50 to 3.00 spaces per 1,000 gross square feet for general office, 2.29 to 7.42 spaces per 1,000 gross square feet for banks
2.5 spaces per 1000 gross square feet
Industrial Manufacturing, Warehousing, Equipment Sales & Service, Recycling & Scrap
0.67 to 3.48 spaces per 1,000 gross square feet
1.0 spaces per 1,000 gross square feet
Civic Semi-institutional Housing, Hospital, Government Services, Educational, Meeting & assembly, Cemetery
0.74 to 2.96 spaces per bed for hospital, 0.16 to 0.22 spaces per student for senior high school, 0.82 spaces per student for technical college
2.5 spaces per 1,000 gross square feet
Source: Institute of Transportation Engineers PARKING GENERATION, (2nd Edition).
The parking demands of parkers using both curb spaces and off-street facilities were combined to determine the total parking demands for each block. This analysis was completed on a block-by-block basis, then combined at a sector level, and finally for the overall Downtown Austin core area. An average building occupancy rate of 95 percent was used based upon available information for downtown Austin. Transit mode share for downtown trips was estimated at 8 percent based upon discussions with Capital Metro. In downtown Austin peak parking demands generally occur at
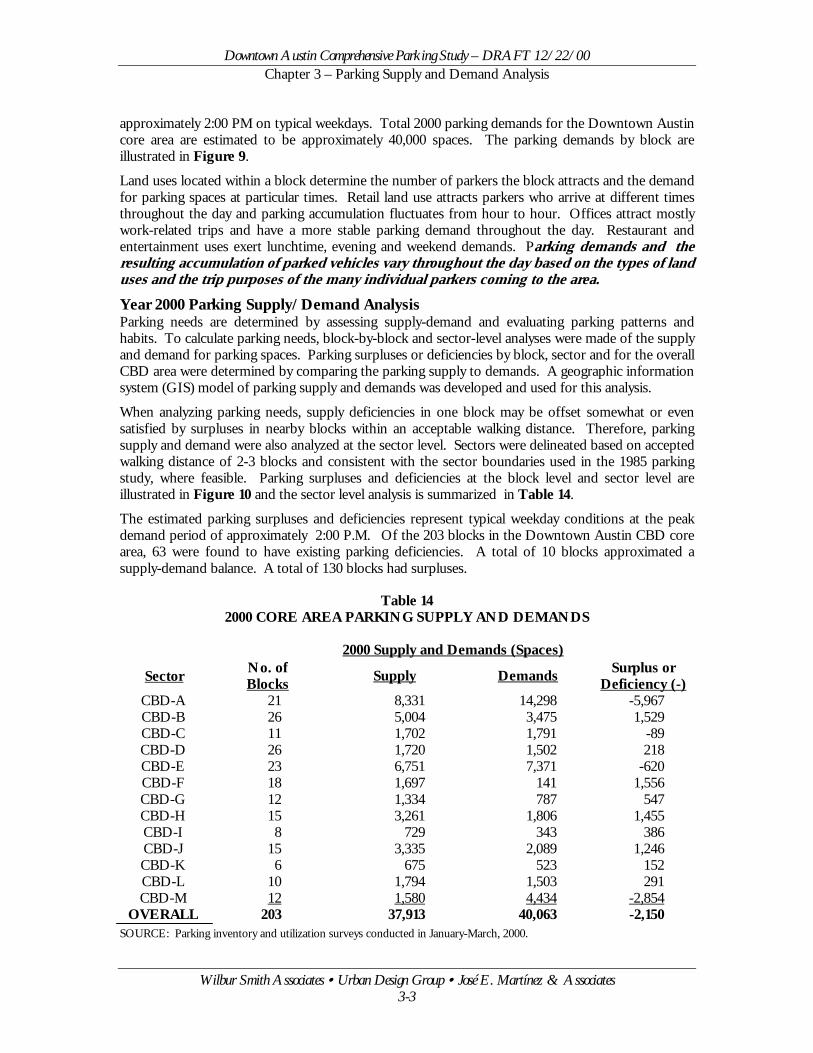
Downtown Austin Comprehensive Parking Study – DRAFT 12/22/00 Chapter 3 – Parking Supply and Demand Analysis
Wilbur Smith Associates • Urban Design Group • José E. Martínez & Associates 3-3
approximately 2:00 PM on typical weekdays. Total 2000 parking demands for the Downtown Austin core area are estimated to be approximately 40,000 spaces. The parking demands by block are illustrated in Figure 9.
Land uses located within a block determine the number of parkers the block attracts and the demand for parking spaces at particular times. Retail land use attracts parkers who arrive at different times throughout the day and parking accumulation fluctuates from hour to hour. Offices attract mostly work-related trips and have a more stable parking demand throughout the day. Restaurant and entertainment uses exert lunchtime, evening and weekend demands. Parking demands and the resulting accumulation of parked vehicles vary throughout the day based on the types of land uses and the trip purposes of the many individual parkers coming to the area. Year 2000 Parking Supply/Demand Analysis Parking needs are determined by assessing supply-demand and evaluating parking patterns and habits. To calculate parking needs, block-by-block and sector-level analyses were made of the supply and demand for parking spaces. Parking surpluses or deficiencies by block, sector and for the overall CBD area were determined by comparing the parking supply to demands. A geographic information system (GIS) model of parking supply and demands was developed and used for this analysis.
When analyzing parking needs, supply deficiencies in one block may be offset somewhat or even satisfied by surpluses in nearby blocks within an acceptable walking distance. Therefore, parking supply and demand were also analyzed at the sector level. Sectors were delineated based on accepted walking distance of 2-3 blocks and consistent with the sector boundaries used in the 1985 parking study, where feasible. Parking surpluses and deficiencies at the block level and sector level are illustrated in Figure 10 and the sector level analysis is summarized in Table 14.
The estimated parking surpluses and deficiencies represent typical weekday conditions at the peak demand period of approximately 2:00 P.M. Of the 203 blocks in the Downtown Austin CBD core area, 63 were found to have existing parking deficiencies. A total of 10 blocks approximated a supply-demand balance. A total of 130 blocks had surpluses.
Table 14 2000 CORE AREA PARKING SUPPLY AND DEMANDS
2000 Supply and Demands (Spaces)
Sector No. of Blocks Supply Demands Surplus or
Deficiency (-) CBD-A 21 8,331 14,298 -5,967 CBD-B 26 5,004 3,475 1,529 CBD-C 11 1,702 1,791 -89 CBD-D 26 1,720 1,502 218 CBD-E 23 6,751 7,371 -620 CBD-F 18 1,697 141 1,556 CBD-G 12 1,334 787 547 CBD-H 15 3,261 1,806 1,455 CBD-I 8 729 343 386 CBD-J 15 3,335 2,089 1,246 CBD-K 6 675 523 152 CBD-L 10 1,794 1,503 291 CBD-M 12 1,580 4,434 -2,854
OVERALL 203 37,913 40,063 -2,150 SOURCE: Parking inventory and utilization surveys conducted in January-March, 2000.
Downtown Austin Comprehensive Parking Study – DRAFT 12/22/00 Chapter 3 – Parking Supply and Demand Analysis
Wilbur Smith Associates • Urban Design Group • José E. Martínez & Associates 3-4
On an area-wide basis, an overall surplus of parking is typically found in the downtown area of most cities. The high level of parking demands in the Austin CBD core area results in an overall deficiency of more than 2,000 spaces. The year 2000 parking surpluses and deficiencies indicate an overall deficiency of 2,150 spaces within the CBD Core area. Four of the 13 sectors in the CBD Core area were found to have current deficiencies, leaving the available parking supply 9,530 spaces short of estimated demands in these sectors. The sector deficiencies are located in the central portions of downtown Austin along both sides of Congress Avenue extending at least three blocks to the east and west, along Guadalupe north of E. 15th St., and along E. 6th St. The largest deficiency occurs in the upper Congress Avenue sector, which is also the portion of the study area with the greatest parking demand as it includes the core of downtown Austin. The less intensively developed sectors has a combined parking surplus of 7,380 spaces.
The magnitude of the existing parking needs is apparent when the practical capacity of the available parking supply is taken into consideration. The existing parking need in Downtown Austin is approximately 7,800 spaces. The practical capacity of public parking facilities is typically considered to be 80-90 percent of the available number of spaces, allowing for turnover and motorists finding an available space without inordinate delay. The utilization surveys conducted in downtown Austin indicated a peak utilization of approximately 80 percent of total supply. The practical capacity of parking in downtown Austin is considered to be approximately 85 percent of the total number of available spaces. Therefore, the overall practical capacity is approximately 32,200 spaces or about 7,800 spaces less than the overall parking demands for 40,000 spaces during peak periods on typical weekdays. The magnitude of parking needs is represented by the difference between the peak parking demands and the available supply (parking deficiency), taking into consideration the practical capacity of the parking supply. Projected Year 2005 Parking Supply/Demand Analysis The City of Austin provided information on planned and ongoing development projects that will impact the future parking supply and demands. Future changes in downtown parking supply and demands were analyzed based upon the Emerging Projects Data Base maintained by the City of Austin Redevelopment Services. The Emerging Projects list includes major projects that are underway or planned and expected to be completed within a short-term period of 1 to 5 years. The Emerging Projects considered in the projected 2005 parking supply/demand analysis are shown in Figure 11.
Available project information about proposed changes in land use and parking supply was analyzed to identify planned changes that will effect the future parking supply and demands. The existing land use and parking data were updated to reflect the proposed changes in type of land use, gross floor area, and available parking supply for each of the effected blocks. Parking supply and demands were subtracted where existing uses will be displaced by new development and added based upon available information for planned projects. The parking supply/demand analysis was recalculated to estimate the impact on parking space surpluses and deficiencies for blocks and sectors. Generation rates typical of new development were used to estimate the parking demands for planned projects.
It is important to note that the projected changes in parking surpluses and deficiencies do not necessarily represent the future conditions that will occur in the next five years. Development plans for individual projects included in the emerging projects data may change and other changes may occur that could significantly alter the estimated future parking needs. The purpose of analyzing the projected 2005 parking needs is to estimate the impact of the planned and proposed downtown developments that are currently known.
Based on the Emerging Projects information, the projected year 2005 parking situation in downtown Austin is shown in Table 15 and illustrated by Figure 12. A total of 72 blocks are projected to have
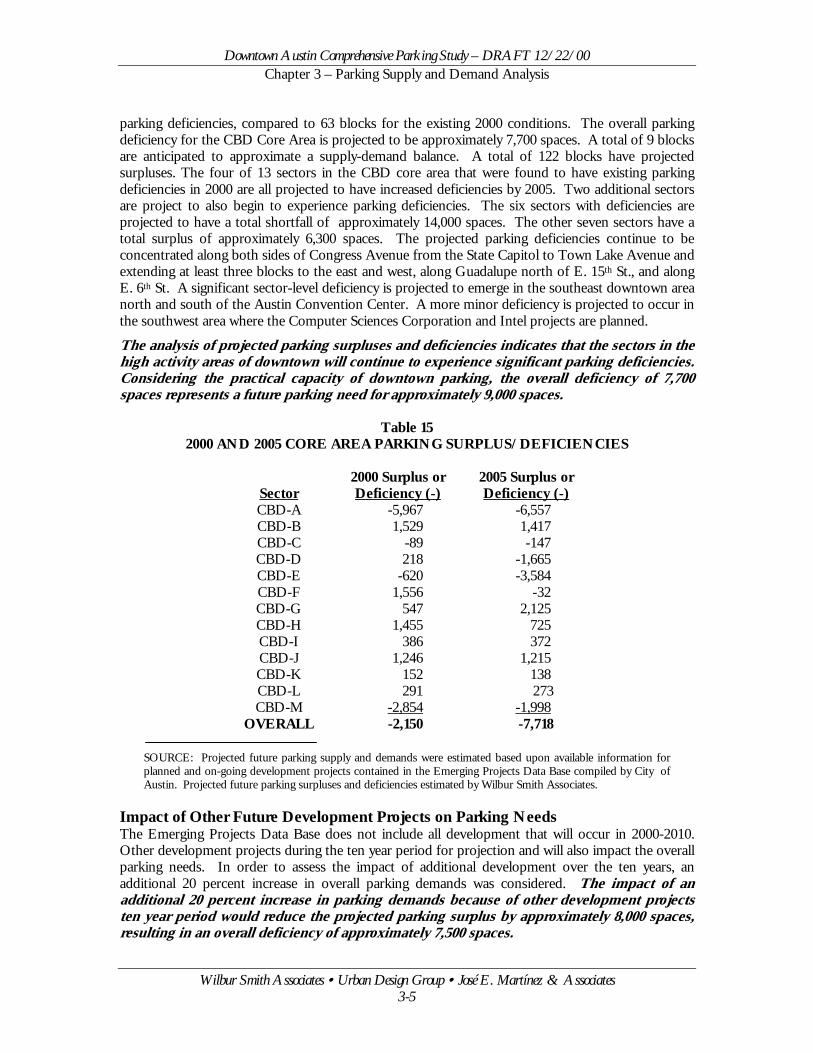
Downtown Austin Comprehensive Parking Study – DRAFT 12/22/00 Chapter 3 – Parking Supply and Demand Analysis
Wilbur Smith Associates • Urban Design Group • José E. Martínez & Associates 3-5
parking deficiencies, compared to 63 blocks for the existing 2000 conditions. The overall parking deficiency for the CBD Core Area is projected to be approximately 7,700 spaces. A total of 9 blocks are anticipated to approximate a supply-demand balance. A total of 122 blocks have projected surpluses. The four of 13 sectors in the CBD core area that were found to have existing parking deficiencies in 2000 are all projected to have increased deficiencies by 2005. Two additional sectors are project to also begin to experience parking deficiencies. The six sectors with deficiencies are projected to have a total shortfall of approximately 14,000 spaces. The other seven sectors have a total surplus of approximately 6,300 spaces. The projected parking deficiencies continue to be concentrated along both sides of Congress Avenue from the State Capitol to Town Lake Avenue and extending at least three blocks to the east and west, along Guadalupe north of E. 15th St., and along E. 6th St. A significant sector-level deficiency is projected to emerge in the southeast downtown area north and south of the Austin Convention Center. A more minor deficiency is projected to occur in the southwest area where the Computer Sciences Corporation and Intel projects are planned.
The analysis of projected parking surpluses and deficiencies indicates that the sectors in the high activity areas of downtown will continue to experience significant parking deficiencies. Considering the practical capacity of downtown parking, the overall deficiency of 7,700 spaces represents a future parking need for approximately 9,000 spaces.
Table 15 2000 AND 2005 CORE AREA PARKING SURPLUS/DEFICIENCIES
Sector 2000 Surplus or Deficiency (-)
2005 Surplus or Deficiency (-)
CBD-A -5,967 -6,557 CBD-B 1,529 1,417 CBD-C -89 -147 CBD-D 218 -1,665 CBD-E -620 -3,584 CBD-F 1,556 -32 CBD-G 547 2,125 CBD-H 1,455 725 CBD-I 386 372 CBD-J 1,246 1,215 CBD-K 152 138 CBD-L 291 273 CBD-M -2,854 -1,998
OVERALL -2,150 -7,718
SOURCE: Projected future parking supply and demands were estimated based upon available information for planned and on-going development projects contained in the Emerging Projects Data Base compiled by City of Austin. Projected future parking surpluses and deficiencies estimated by Wilbur Smith Associates.
Impact of Other Future Development Projects on Parking Needs The Emerging Projects Data Base does not include all development that will occur in 2000-2010. Other development projects during the ten year period for projection and will also impact the overall parking needs. In order to assess the impact of additional development over the ten years, an additional 20 percent increase in overall parking demands was considered. The impact of an additional 20 percent increase in parking demands because of other development projects ten year period would reduce the projected parking surplus by approximately 8,000 spaces, resulting in an overall deficiency of approximately 7,500 spaces.
Downtown Austin Comprehensive Parking Study – DRAFT 12/22/00 Chapter 3 – Parking Supply and Demand Analysis
Wilbur Smith Associates • Urban Design Group • José E. Martínez & Associates 3-6
Transit vs. Parking Transit system use helps to offset parking demand, especially in the Central Business District. Transit ridership is affected by the convenience, reliability and cost of the service, compared to the convenience, reliability and cost of the automobile and other travel modes. The impact of improved transit service on parking demands is typically envisioned as a function of the number of total person trips terminating in an area, the percentage of all persons using transit, and the average vehicle occupancy.
Reduction of parking demands is anticipated when transit improvements are implemented to improve service and increase ridership. Continued growth in the utilization of public transportation will slow the growth or reduce the use of automobiles, increase average vehicle occupancy (number of persons per vehicle), and slow or reduce the growth in downtown parking demands. The relationship of transit ridership and parking demand generation in the study area was analyzed based upon existing and planned transit service characteristics, improvements and ridership forecasts provided by Capital Metro. Impacts of proposed and potential Capital Metro transit improvements were analyzed to estimate their impact on parking demands and needs in the downtown Austin study area.
To assess the impact of future improvements in transit service on the parking situation in downtown Austin, the transit mode share for downtown commuter trips was increased to represent the improved transit service and growth in transit ridership. A 20 percent mode share for transit serving downtown trips was added to the parking supply/demand analysis, representing an increase in transit ridership of approximately 12 percent for the estimated share of downtown trips currently served by transit. This significant increase in transit utilization is feasible within approximately five to ten years through a continuation of Capital Metro’s transit development efforts including combinations of the following potential transit service improvements:
− High Occupancy Vehicle (HOV) lanes on freeway routes to/from downtown;
− Improved bus service including new/expanded routes and schedule improvements serving downtown;
− Express bus service for downtown destinations with Park-and-Ride facilities in remote locations;
− Exclusive bus lanes on major downtown streets such as Guadalupe and Lavaca or San Jacinto and Trinity;
− Downtown intermodal terminal and community area transit centers;
− Improved downtown circulator service including fringe parking development; and,
− Light Rail Transit such as Capital Metro’s proposed starter segment.
Improved mode share for transit is considered in this analysis to demonstrate the beneficial impact of improvement in transit service and ridership increases on downtown parking supply and demands. Further transit service studies and planning are needed to assess and design the necessary improvements for effecting the desired improvements in transit service and patronage.
Potential future improvements in transit service would significantly relieve the current and future parking needs in downtown Austin. The existing year 2000 deficiency is approximately -2,150 downtown parking spaces. As shown previously, the parking impact of emerging development projects expected to be completed by the year 2005 is projected to increase the overall downtown parking deficiency to approximately -7,718 spaces. However, if transit ridership were simultaneously increased to serve 20 percent or more of downtown commuter trips, there would be a significant
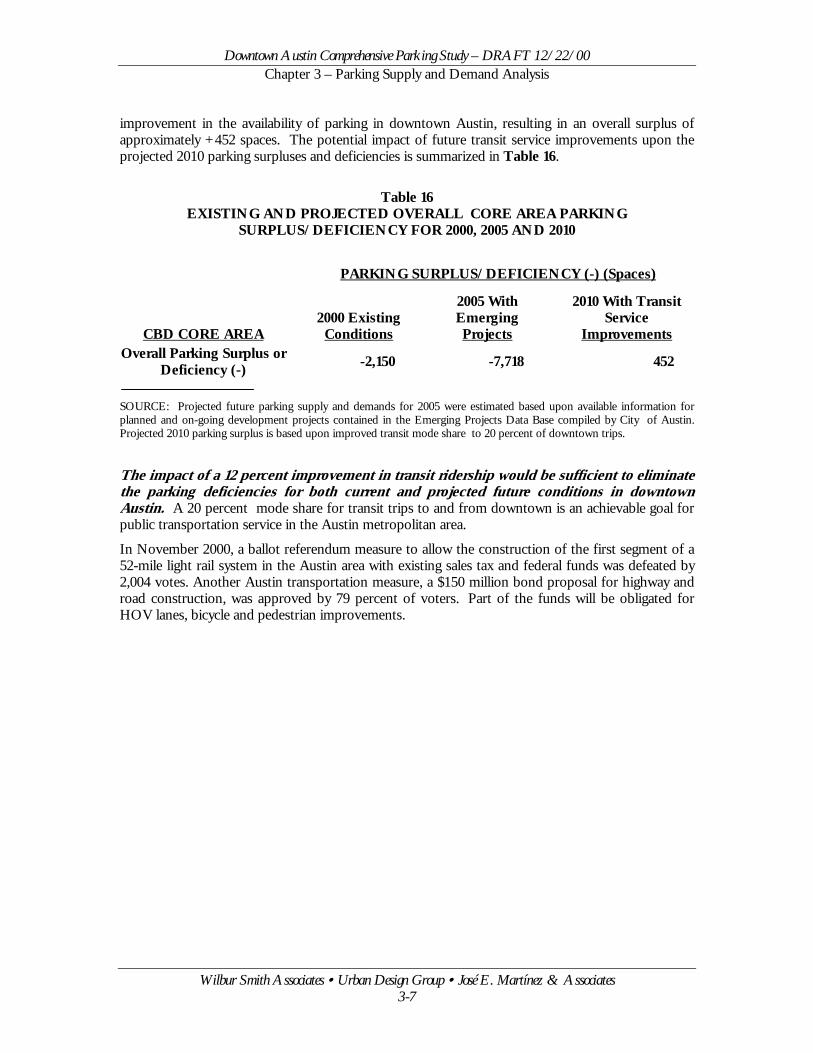
Downtown Austin Comprehensive Parking Study – DRAFT 12/22/00 Chapter 3 – Parking Supply and Demand Analysis
Wilbur Smith Associates • Urban Design Group • José E. Martínez & Associates 3-7
improvement in the availability of parking in downtown Austin, resulting in an overall surplus of approximately +452 spaces. The potential impact of future transit service improvements upon the projected 2010 parking surpluses and deficiencies is summarized in Table 16.
Table 16
EXISTING AND PROJECTED OVERALL CORE AREA PARKING SURPLUS/DEFICIENCY FOR 2000, 2005 AND 2010
PARKING SURPLUS/DEFICIENCY (-) (Spaces)
CBD CORE AREA 2000 Existing
Conditions
2005 With Emerging Projects
2010 With Transit Service
Improvements Overall Parking Surplus or
Deficiency (-) -2,150 -7,718 452
SOURCE: Projected future parking supply and demands for 2005 were estimated based upon available information for planned and on-going development projects contained in the Emerging Projects Data Base compiled by City of Austin. Projected 2010 parking surplus is based upon improved transit mode share to 20 percent of downtown trips. The impact of a 12 percent improvement in transit ridership would be sufficient to eliminate the parking deficiencies for both current and projected future conditions in downtown Austin. A 20 percent mode share for transit trips to and from downtown is an achievable goal for public transportation service in the Austin metropolitan area.
In November 2000, a ballot referendum measure to allow the construction of the first segment of a 52-mile light rail system in the Austin area with existing sales tax and federal funds was defeated by 2,004 votes. Another Austin transportation measure, a $150 million bond proposal for highway and road construction, was approved by 79 percent of voters. Part of the funds will be obligated for HOV lanes, bicycle and pedestrian improvements.
Chapter 4
Parkneedoptioparkavailimprmanfor p
ManwhicrecoBaltiD.C.progand potedow
ParkParkparkfaciliimprarea
The
DRAFTDowntown Austin Comprehensive Parking Study 4-1
Downtown Parking Management Program
ing management and implementation strategies were identified and evaluated to address parking s in the downtown Austin CBD core area. Potential parking management strategies include ns such as changing the available parking supply of on-street and off-street spaces through
ing development or changing parking requirements; increasing the effective utilization of able parking spaces through pricing strategies and parking regulations and enforcement; and oving the use of public parking through public information, marketing and technology. Parking agement programs implemented in other cities with similar operating conditions were evaluated otential application and effectiveness in meeting parking needs for downtown Austin.
y communities have developed a wide variety of parking management strategies and tactics h have experienced varying degrees of successful implementation. Other jurisdictions gnized in the parking industry for their successful parking management programs include more; Boston; Montgomery County, Maryland; Portland; San Francisco; Seattle; Washington, ; and others. Texas communities besides Austin that have undertaken parking management rams include Dallas, Houston, San Antonio, Fort Worth, Galveston, and Lubbock. Programs tactics that have been successfully utilized in other communities were considered for their ntial application in developing the parking management program recommendations for ntown Austin.
ing Management Recommendations ing management includes both structural and non-structural improvement options. Structural ing improvements include the development or improvement of curb and off-street parking ties. Non-structural parking management recommendations include strategies and programs for oving utilization of available parking. Existing urban design guidelines for the downtown Austin were considered in development of the recommended parking management program.
recommended parking management measures are described in the following seven categories:
! On-Street Parking Supply;
! Off-Street Parking Supply;
! Parking and Transit Coordination;
! Parking Pricing;
! Public Information, Marketing and Technology;
! Enforcement and Adjudication; and,
! Residential Parking Permit Program.
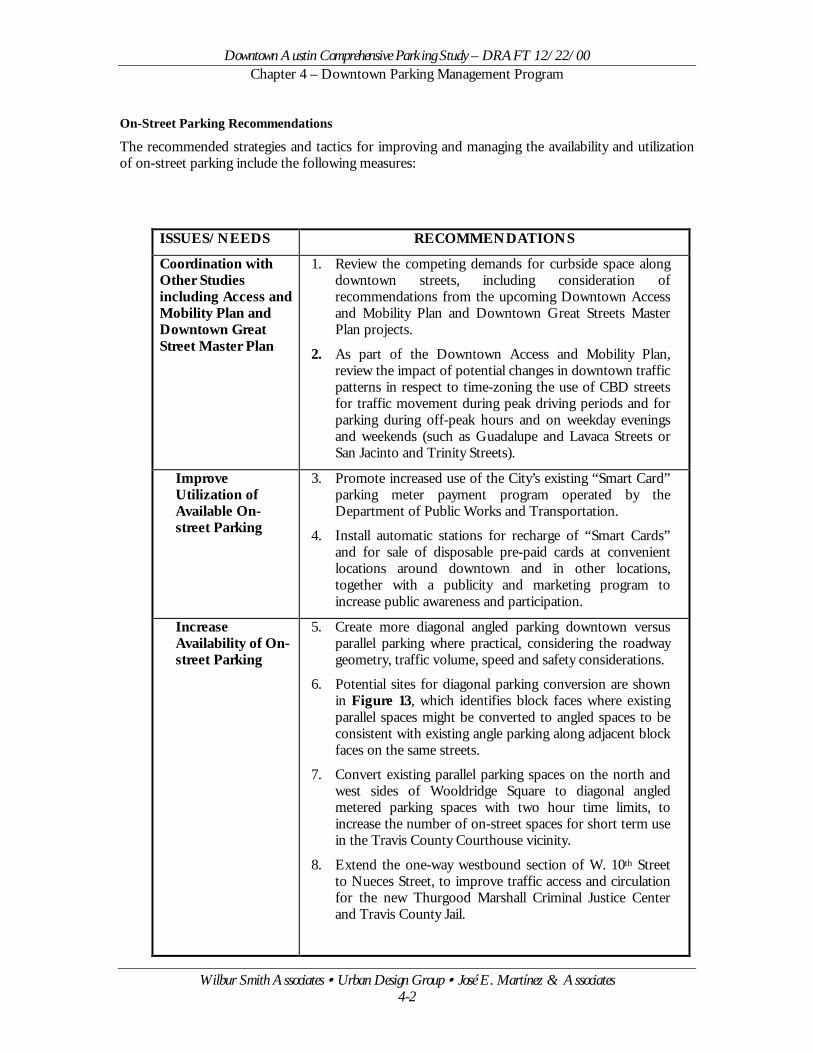
Downtown Austin Comprehensive Parking Study – DRAFT 12/22/00 Chapter 4 – Downtown Parking Management Program
Wilbur Smith Associates • Urban Design Group • José E. Martínez & Associates 4-2
On-Street Parking Recommendations
The recommended strategies and tactics for improving and managing the availability and utilization of on-street parking include the following measures:
ISSUES/NEEDS RECOMMENDATIONS
Coordination with Other Studies including Access and Mobility Plan and Downtown Great Street Master Plan
1. Review the competing demands for curbside space along downtown streets, including consideration of recommendations from the upcoming Downtown Access and Mobility Plan and Downtown Great Streets Master Plan projects.
2. As part of the Downtown Access and Mobility Plan, review the impact of potential changes in downtown traffic patterns in respect to time-zoning the use of CBD streets for traffic movement during peak driving periods and for parking during off-peak hours and on weekday evenings and weekends (such as Guadalupe and Lavaca Streets or San Jacinto and Trinity Streets).
Improve Utilization of Available On-street Parking
3. Promote increased use of the City’s existing “Smart Card” parking meter payment program operated by the Department of Public Works and Transportation.
4. Install automatic stations for recharge of “Smart Cards” and for sale of disposable pre-paid cards at convenient locations around downtown and in other locations, together with a publicity and marketing program to increase public awareness and participation.
Increase Availability of On-street Parking
5. Create more diagonal angled parking downtown versus parallel parking where practical, considering the roadway geometry, traffic volume, speed and safety considerations.
6. Potential sites for diagonal parking conversion are shown in Figure 13, which identifies block faces where existing parallel spaces might be converted to angled spaces to be consistent with existing angle parking along adjacent block faces on the same streets.
7. Convert existing parallel parking spaces on the north and west sides of Wooldridge Square to diagonal angled metered parking spaces with two hour time limits, to increase the number of on-street spaces for short term use in the Travis County Courthouse vicinity.
8. Extend the one-way westbound section of W. 10th Street to Nueces Street, to improve traffic access and circulation for the new Thurgood Marshall Criminal Justice Center and Travis County Jail.
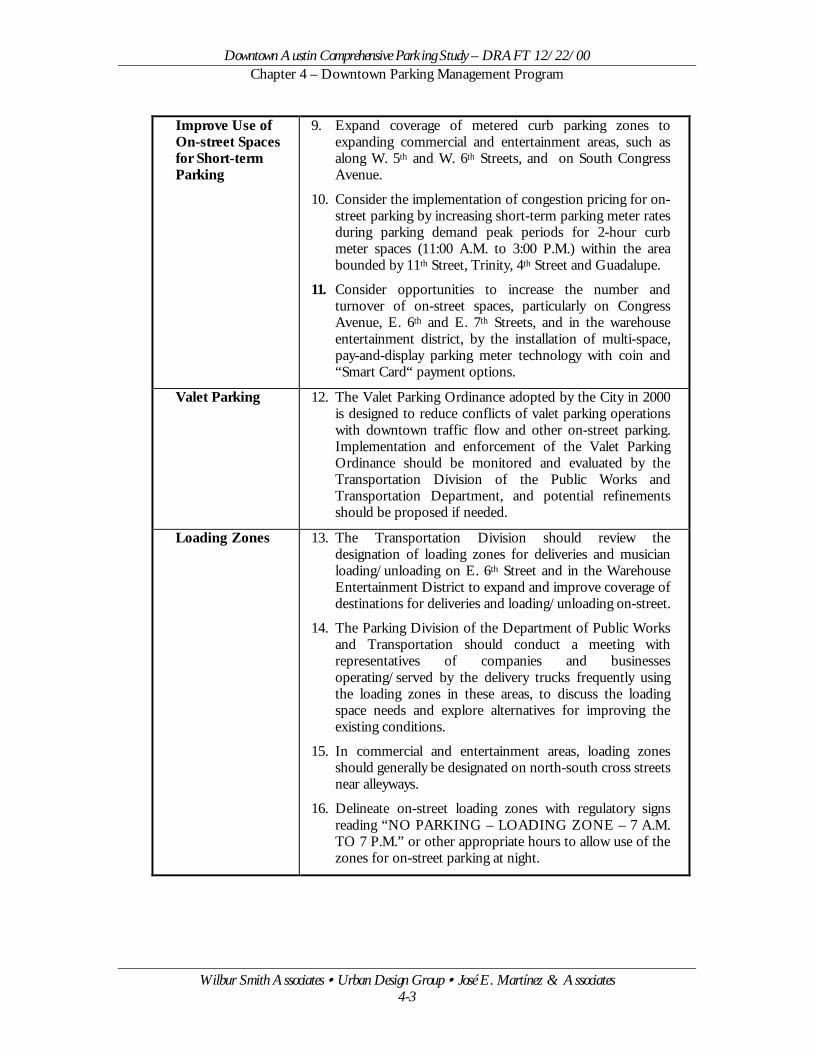
Downtown Austin Comprehensive Parking Study – DRAFT 12/22/00 Chapter 4 – Downtown Parking Management Program
Wilbur Smith Associates • Urban Design Group • José E. Martínez & Associates 4-3
Improve Use of On-street Spaces for Short-term Parking
9. Expand coverage of metered curb parking zones to expanding commercial and entertainment areas, such as along W. 5th and W. 6th Streets, and on South Congress Avenue.
10. Consider the implementation of congestion pricing for on-street parking by increasing short-term parking meter rates during parking demand peak periods for 2-hour curb meter spaces (11:00 A.M. to 3:00 P.M.) within the area bounded by 11th Street, Trinity, 4th Street and Guadalupe.
11. Consider opportunities to increase the number and turnover of on-street spaces, particularly on Congress Avenue, E. 6th and E. 7th Streets, and in the warehouse entertainment district, by the installation of multi-space, pay-and-display parking meter technology with coin and “Smart Card“ payment options.
Valet Parking 12. The Valet Parking Ordinance adopted by the City in 2000 is designed to reduce conflicts of valet parking operations with downtown traffic flow and other on-street parking. Implementation and enforcement of the Valet Parking Ordinance should be monitored and evaluated by the Transportation Division of the Public Works and Transportation Department, and potential refinements should be proposed if needed.
Loading Zones 13. The Transportation Division should review the designation of loading zones for deliveries and musician loading/unloading on E. 6th Street and in the Warehouse Entertainment District to expand and improve coverage of destinations for deliveries and loading/unloading on-street.
14. The Parking Division of the Department of Public Works and Transportation should conduct a meeting with representatives of companies and businesses operating/served by the delivery trucks frequently using the loading zones in these areas, to discuss the loading space needs and explore alternatives for improving the existing conditions.
15. In commercial and entertainment areas, loading zones should generally be designated on north-south cross streets near alleyways.
16. Delineate on-street loading zones with regulatory signs reading “NO PARKING – LOADING ZONE – 7 A.M. TO 7 P.M.” or other appropriate hours to allow use of the zones for on-street parking at night.
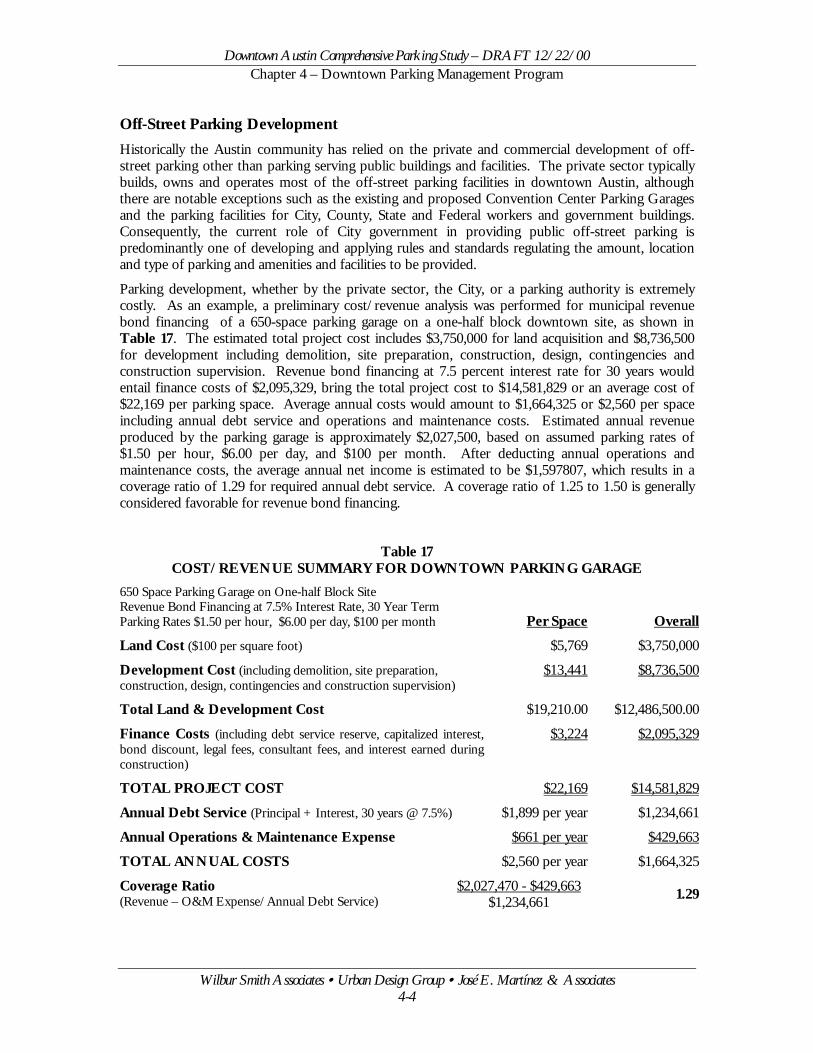
Downtown Austin Comprehensive Parking Study – DRAFT 12/22/00 Chapter 4 – Downtown Parking Management Program
Wilbur Smith Associates • Urban Design Group • José E. Martínez & Associates 4-4
Off-Street Parking Development Historically the Austin community has relied on the private and commercial development of off-street parking other than parking serving public buildings and facilities. The private sector typically builds, owns and operates most of the off-street parking facilities in downtown Austin, although there are notable exceptions such as the existing and proposed Convention Center Parking Garages and the parking facilities for City, County, State and Federal workers and government buildings. Consequently, the current role of City government in providing public off-street parking is predominantly one of developing and applying rules and standards regulating the amount, location and type of parking and amenities and facilities to be provided.
Parking development, whether by the private sector, the City, or a parking authority is extremely costly. As an example, a preliminary cost/revenue analysis was performed for municipal revenue bond financing of a 650-space parking garage on a one-half block downtown site, as shown in Table 17. The estimated total project cost includes $3,750,000 for land acquisition and $8,736,500 for development including demolition, site preparation, construction, design, contingencies and construction supervision. Revenue bond financing at 7.5 percent interest rate for 30 years would entail finance costs of $2,095,329, bring the total project cost to $14,581,829 or an average cost of $22,169 per parking space. Average annual costs would amount to $1,664,325 or $2,560 per space including annual debt service and operations and maintenance costs. Estimated annual revenue produced by the parking garage is approximately $2,027,500, based on assumed parking rates of $1.50 per hour, $6.00 per day, and $100 per month. After deducting annual operations and maintenance costs, the average annual net income is estimated to be $1,597807, which results in a coverage ratio of 1.29 for required annual debt service. A coverage ratio of 1.25 to 1.50 is generally considered favorable for revenue bond financing.
Table 17 COST/REVENUE SUMMARY FOR DOWNTOWN PARKING GARAGE
650 Space Parking Garage on One-half Block Site Revenue Bond Financing at 7.5% Interest Rate, 30 Year Term Parking Rates $1.50 per hour, $6.00 per day, $100 per month Per Space OverallLand Cost ($100 per square foot) $5,769 $3,750,000
Development Cost (including demolition, site preparation, construction, design, contingencies and construction supervision)
$13,441 $8,736,500
Total Land & Development Cost $19,210.00 $12,486,500.00
Finance Costs (including debt service reserve, capitalized interest, bond discount, legal fees, consultant fees, and interest earned during construction)
$3,224 $2,095,329
TOTAL PROJECT COST $22,169 $14,581,829
Annual Debt Service (Principal + Interest, 30 years @ 7.5%) $1,899 per year $1,234,661
Annual Operations & Maintenance Expense $661 per year $429,663
TOTAL ANNUAL COSTS $2,560 per year $1,664,325
Coverage Ratio (Revenue – O&M Expense/Annual Debt Service)
$2,027,470 - $429,663 $1,234,661 1.29
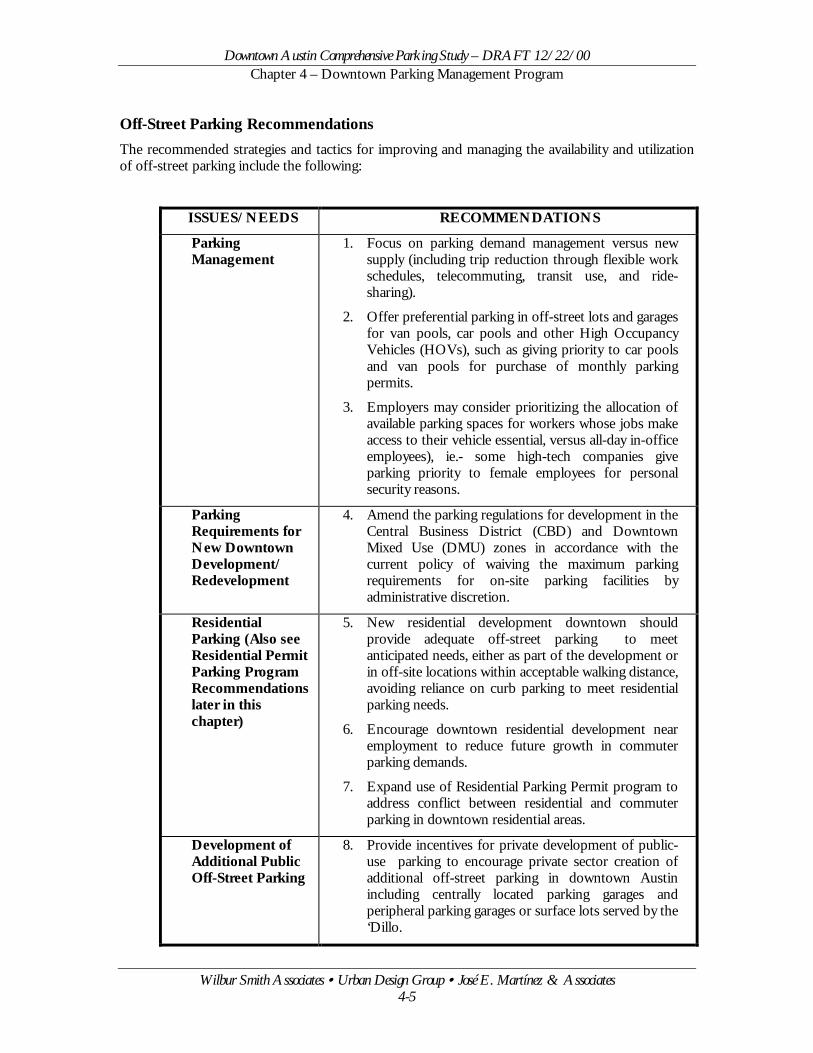
Downtown Austin Comprehensive Parking Study – DRAFT 12/22/00 Chapter 4 – Downtown Parking Management Program
Wilbur Smith Associates • Urban Design Group • José E. Martínez & Associates 4-5
Off-Street Parking Recommendations
The recommended strategies and tactics for improving and managing the availability and utilization of off-street parking include the following:
ISSUES/NEEDS RECOMMENDATIONS
Parking Management
1. Focus on parking demand management versus new supply (including trip reduction through flexible work schedules, telecommuting, transit use, and ride-sharing).
2. Offer preferential parking in off-street lots and garages for van pools, car pools and other High Occupancy Vehicles (HOVs), such as giving priority to car pools and van pools for purchase of monthly parking permits.
3. Employers may consider prioritizing the allocation of available parking spaces for workers whose jobs make access to their vehicle essential, versus all-day in-office employees), ie.- some high-tech companies give parking priority to female employees for personal security reasons.
Parking Requirements for New Downtown Development/ Redevelopment
4. Amend the parking regulations for development in the Central Business District (CBD) and Downtown Mixed Use (DMU) zones in accordance with the current policy of waiving the maximum parking requirements for on-site parking facilities by administrative discretion.
Residential Parking (Also see Residential Permit Parking Program Recommendationslater in this chapter)
5. New residential development downtown should provide adequate off-street parking to meet anticipated needs, either as part of the development or in off-site locations within acceptable walking distance, avoiding reliance on curb parking to meet residential parking needs.
6. Encourage downtown residential development near employment to reduce future growth in commuter parking demands.
7. Expand use of Residential Parking Permit program to address conflict between residential and commuter parking in downtown residential areas.
Development of Additional Public Off-Street Parking
8. Provide incentives for private development of public-use parking to encourage private sector creation of additional off-street parking in downtown Austin including centrally located parking garages and peripheral parking garages or surface lots served by the ‘Dillo.
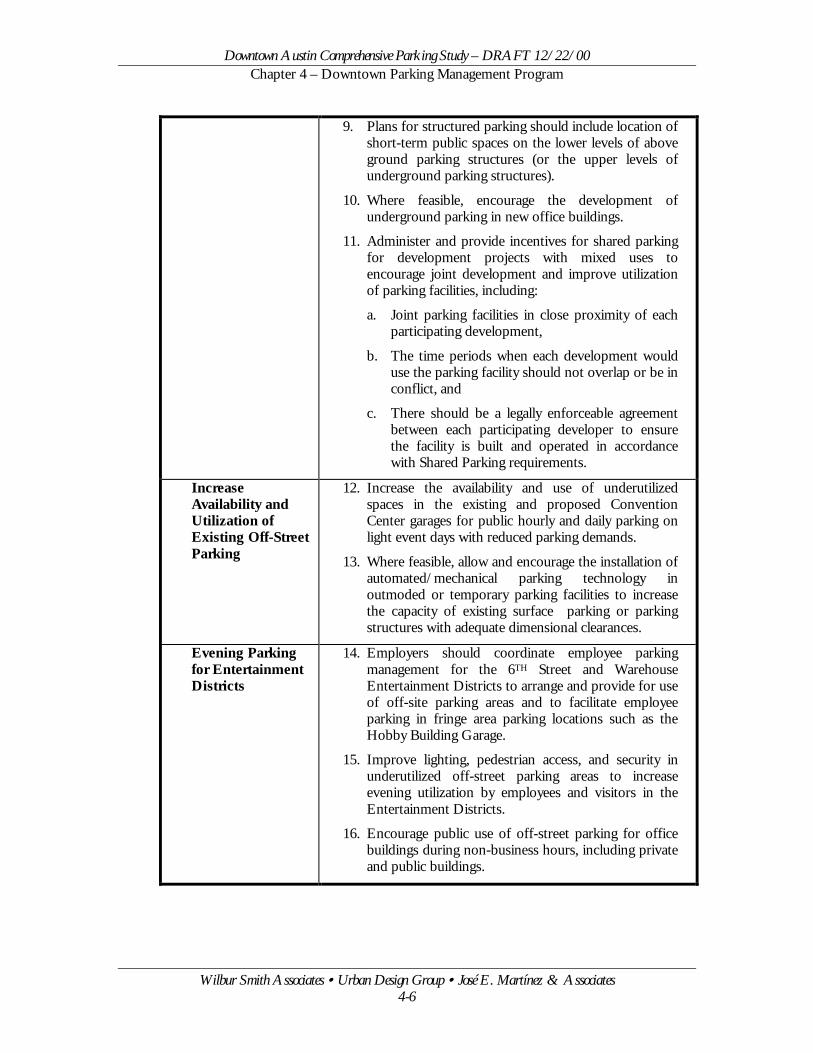
Downtown Austin Comprehensive Parking Study – DRAFT 12/22/00 Chapter 4 – Downtown Parking Management Program
Wilbur Smith Associates • Urban Design Group • José E. Martínez & Associates 4-6
9. Plans for structured parking should include location of short-term public spaces on the lower levels of above ground parking structures (or the upper levels of underground parking structures).
10. Where feasible, encourage the development of underground parking in new office buildings.
11. Administer and provide incentives for shared parking for development projects with mixed uses to encourage joint development and improve utilization of parking facilities, including:
a. Joint parking facilities in close proximity of each participating development,
b. The time periods when each development would use the parking facility should not overlap or be in conflict, and
c. There should be a legally enforceable agreement between each participating developer to ensure the facility is built and operated in accordance with Shared Parking requirements.
Increase Availability and Utilization of Existing Off-Street Parking
12. Increase the availability and use of underutilized spaces in the existing and proposed Convention Center garages for public hourly and daily parking on light event days with reduced parking demands.
13. Where feasible, allow and encourage the installation of automated/mechanical parking technology in outmoded or temporary parking facilities to increase the capacity of existing surface parking or parking structures with adequate dimensional clearances.
Evening Parking for Entertainment Districts
14. Employers should coordinate employee parking management for the 6TH Street and Warehouse Entertainment Districts to arrange and provide for use of off-site parking areas and to facilitate employee parking in fringe area parking locations such as the Hobby Building Garage.
15. Improve lighting, pedestrian access, and security in underutilized off-street parking areas to increase evening utilization by employees and visitors in the Entertainment Districts.
16. Encourage public use of off-street parking for office buildings during non-business hours, including private and public buildings.
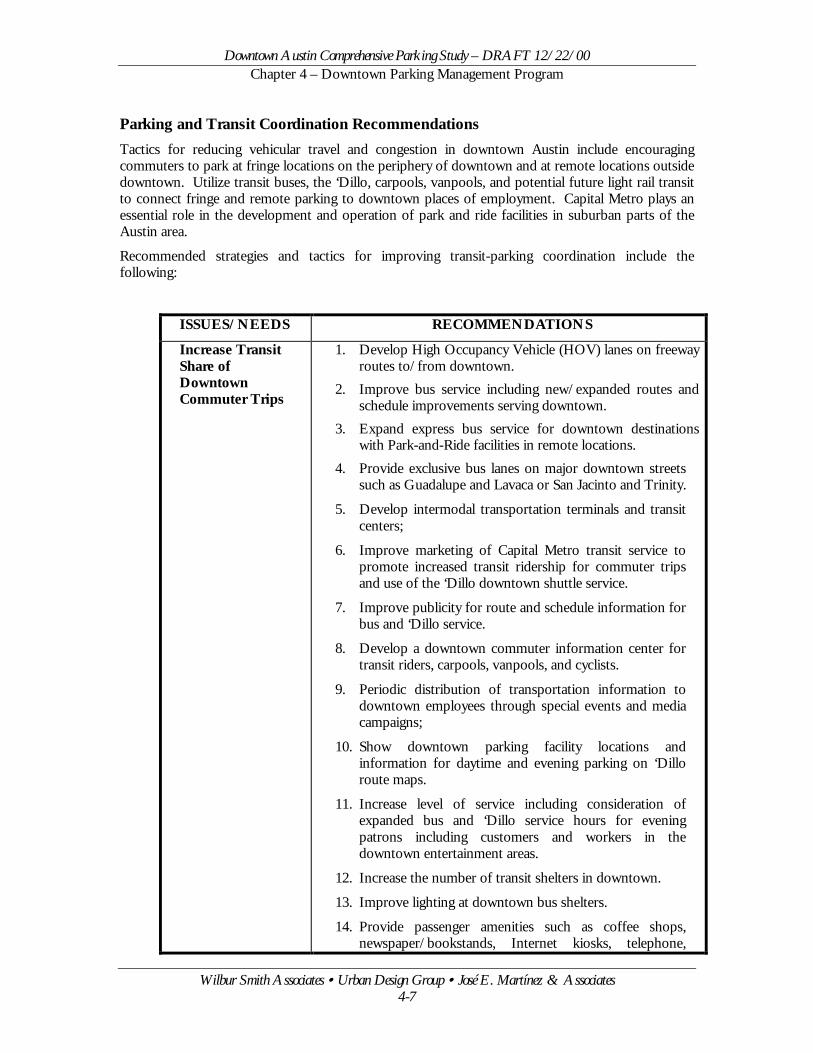
Downtown Austin Comprehensive Parking Study – DRAFT 12/22/00 Chapter 4 – Downtown Parking Management Program
Wilbur Smith Associates • Urban Design Group • José E. Martínez & Associates 4-7
Parking and Transit Coordination Recommendations Tactics for reducing vehicular travel and congestion in downtown Austin include encouraging commuters to park at fringe locations on the periphery of downtown and at remote locations outside downtown. Utilize transit buses, the ‘Dillo, carpools, vanpools, and potential future light rail transit to connect fringe and remote parking to downtown places of employment. Capital Metro plays an essential role in the development and operation of park and ride facilities in suburban parts of the Austin area.
Recommended strategies and tactics for improving transit-parking coordination include the following:
ISSUES/NEEDS RECOMMENDATIONS
Increase Transit Share of Downtown Commuter Trips
1. Develop High Occupancy Vehicle (HOV) lanes on freeway routes to/from downtown.
2. Improve bus service including new/expanded routes and schedule improvements serving downtown.
3. Expand express bus service for downtown destinations with Park-and-Ride facilities in remote locations.
4. Provide exclusive bus lanes on major downtown streets such as Guadalupe and Lavaca or San Jacinto and Trinity.
5. Develop intermodal transportation terminals and transit centers;
6. Improve marketing of Capital Metro transit service to promote increased transit ridership for commuter trips and use of the ‘Dillo downtown shuttle service.
7. Improve publicity for route and schedule information for bus and ‘Dillo service.
8. Develop a downtown commuter information center for transit riders, carpools, vanpools, and cyclists.
9. Periodic distribution of transportation information to downtown employees through special events and media campaigns;
10. Show downtown parking facility locations and information for daytime and evening parking on ‘Dillo route maps.
11. Increase level of service including consideration of expanded bus and ‘Dillo service hours for evening patrons including customers and workers in the downtown entertainment areas.
12. Increase the number of transit shelters in downtown.
13. Improve lighting at downtown bus shelters.
14. Provide passenger amenities such as coffee shops, newspaper/bookstands, Internet kiosks, telephone,
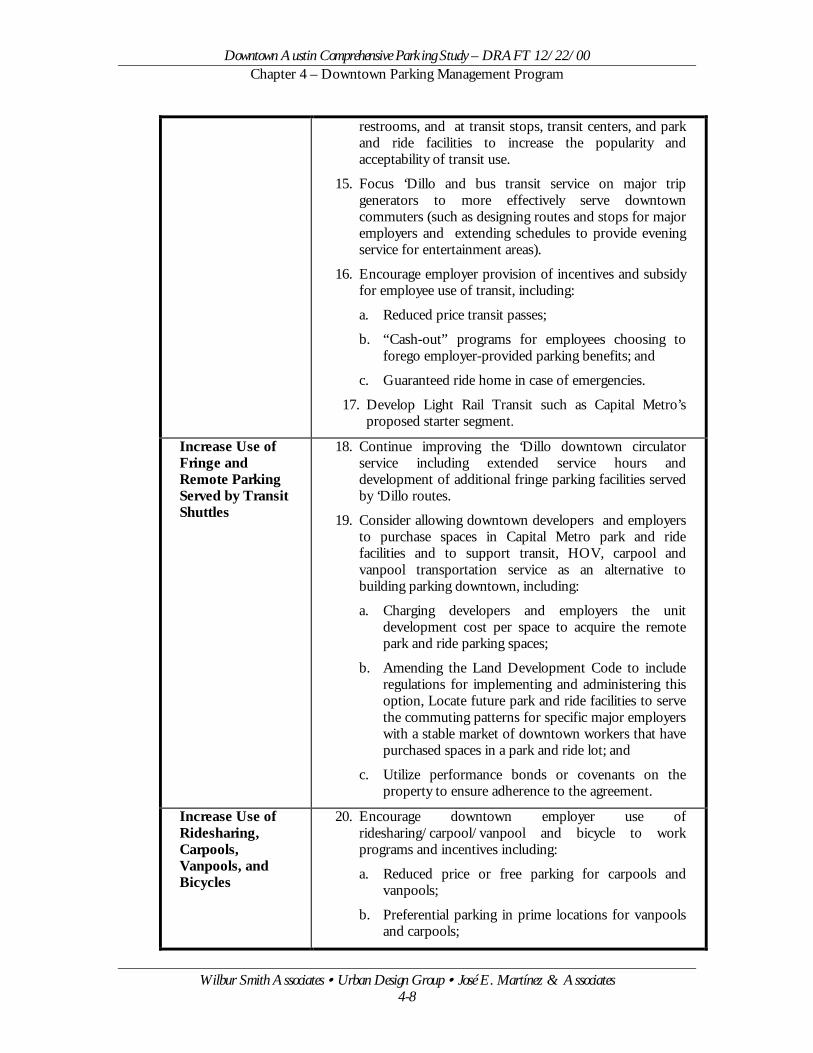
Downtown Austin Comprehensive Parking Study – DRAFT 12/22/00 Chapter 4 – Downtown Parking Management Program
Wilbur Smith Associates • Urban Design Group • José E. Martínez & Associates 4-8
restrooms, and at transit stops, transit centers, and park and ride facilities to increase the popularity and acceptability of transit use.
15. Focus ‘Dillo and bus transit service on major trip generators to more effectively serve downtown commuters (such as designing routes and stops for major employers and extending schedules to provide evening service for entertainment areas).
16. Encourage employer provision of incentives and subsidy for employee use of transit, including:
a. Reduced price transit passes;
b. “Cash-out” programs for employees choosing to forego employer-provided parking benefits; and
c. Guaranteed ride home in case of emergencies.
17. Develop Light Rail Transit such as Capital Metro’s proposed starter segment.
Increase Use of Fringe and Remote Parking Served by Transit Shuttles
18. Continue improving the ‘Dillo downtown circulator service including extended service hours and development of additional fringe parking facilities served by ‘Dillo routes.
19. Consider allowing downtown developers and employers to purchase spaces in Capital Metro park and ride facilities and to support transit, HOV, carpool and vanpool transportation service as an alternative to building parking downtown, including:
a. Charging developers and employers the unit development cost per space to acquire the remote park and ride parking spaces;
b. Amending the Land Development Code to include regulations for implementing and administering this option, Locate future park and ride facilities to serve the commuting patterns for specific major employers with a stable market of downtown workers that have purchased spaces in a park and ride lot; and
c. Utilize performance bonds or covenants on the property to ensure adherence to the agreement.
Increase Use of Ridesharing, Carpools, Vanpools, and Bicycles
20. Encourage downtown employer use of ridesharing/carpool/vanpool and bicycle to work programs and incentives including:
a. Reduced price or free parking for carpools and vanpools;
b. Preferential parking in prime locations for vanpools and carpools;
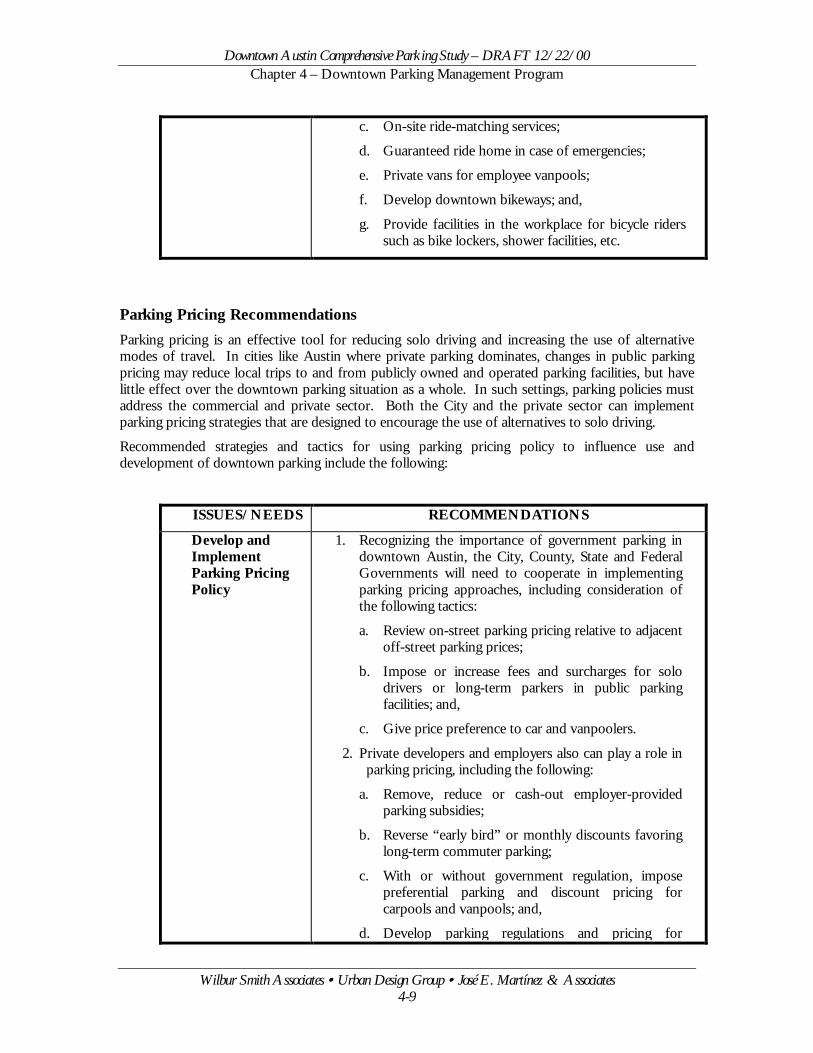
Downtown Austin Comprehensive Parking Study – DRAFT 12/22/00 Chapter 4 – Downtown Parking Management Program
Wilbur Smith Associates • Urban Design Group • José E. Martínez & Associates 4-9
c. On-site ride-matching services;
d. Guaranteed ride home in case of emergencies;
e. Private vans for employee vanpools;
f. Develop downtown bikeways; and,
g. Provide facilities in the workplace for bicycle riders such as bike lockers, shower facilities, etc.
Parking Pricing Recommendations Parking pricing is an effective tool for reducing solo driving and increasing the use of alternative modes of travel. In cities like Austin where private parking dominates, changes in public parking pricing may reduce local trips to and from publicly owned and operated parking facilities, but have little effect over the downtown parking situation as a whole. In such settings, parking policies must address the commercial and private sector. Both the City and the private sector can implement parking pricing strategies that are designed to encourage the use of alternatives to solo driving.
Recommended strategies and tactics for using parking pricing policy to influence use and development of downtown parking include the following:
ISSUES/NEEDS RECOMMENDATIONS
Develop and Implement Parking Pricing Policy
1. Recognizing the importance of government parking in downtown Austin, the City, County, State and Federal Governments will need to cooperate in implementing parking pricing approaches, including consideration of the following tactics:
a. Review on-street parking pricing relative to adjacent off-street parking prices;
b. Impose or increase fees and surcharges for solo drivers or long-term parkers in public parking facilities; and,
c. Give price preference to car and vanpoolers.
2. Private developers and employers also can play a role in parking pricing, including the following:
a. Remove, reduce or cash-out employer-provided parking subsidies;
b. Reverse “early bird” or monthly discounts favoring long-term commuter parking;
c. With or without government regulation, impose preferential parking and discount pricing for carpools and vanpools; and,
d. Develop parking regulations and pricing for
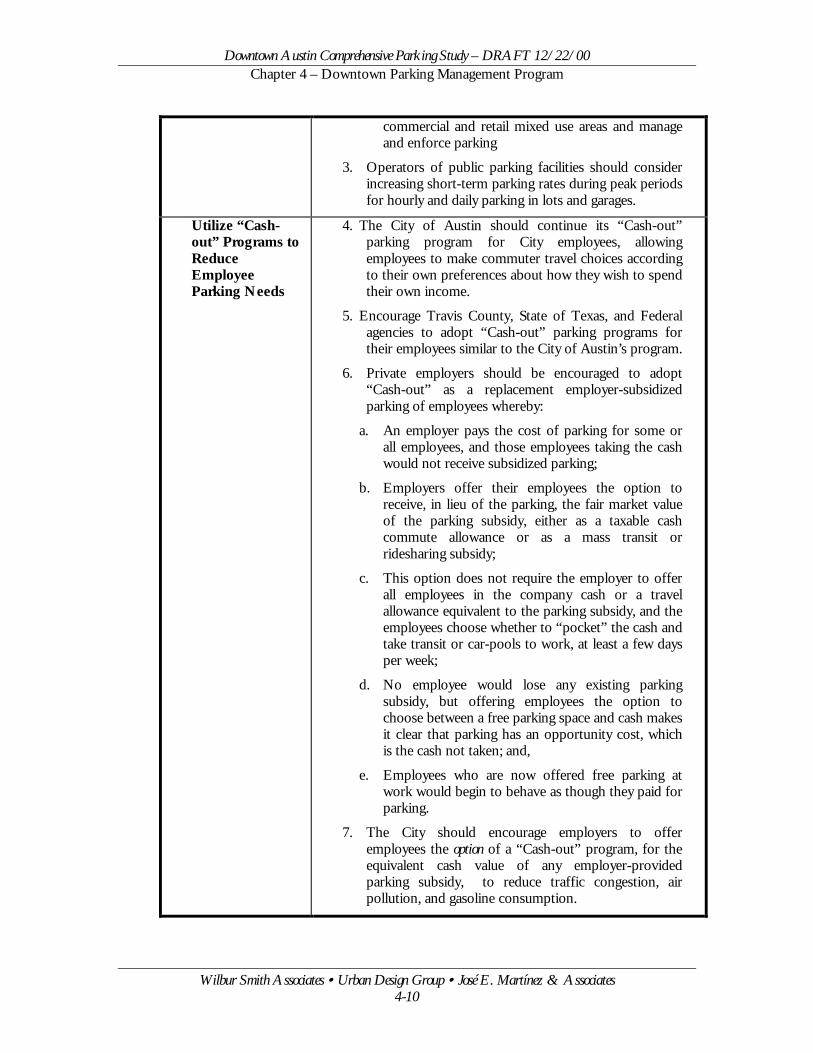
Downtown Austin Comprehensive Parking Study – DRAFT 12/22/00 Chapter 4 – Downtown Parking Management Program
Wilbur Smith Associates • Urban Design Group • José E. Martínez & Associates 4-10
commercial and retail mixed use areas and manage and enforce parking
3. Operators of public parking facilities should consider increasing short-term parking rates during peak periods for hourly and daily parking in lots and garages.
Utilize “Cash-out” Programs to Reduce Employee Parking Needs
4. The City of Austin should continue its “Cash-out” parking program for City employees, allowing employees to make commuter travel choices according to their own preferences about how they wish to spend their own income.
5. Encourage Travis County, State of Texas, and Federal agencies to adopt “Cash-out” parking programs for their employees similar to the City of Austin’s program.
6. Private employers should be encouraged to adopt “Cash-out” as a replacement employer-subsidized parking of employees whereby:
a. An employer pays the cost of parking for some or all employees, and those employees taking the cash would not receive subsidized parking;
b. Employers offer their employees the option to receive, in lieu of the parking, the fair market value of the parking subsidy, either as a taxable cash commute allowance or as a mass transit or ridesharing subsidy;
c. This option does not require the employer to offer all employees in the company cash or a travel allowance equivalent to the parking subsidy, and the employees choose whether to “pocket” the cash and take transit or car-pools to work, at least a few days per week;
d. No employee would lose any existing parking subsidy, but offering employees the option to choose between a free parking space and cash makes it clear that parking has an opportunity cost, which is the cash not taken; and,
e. Employees who are now offered free parking at work would begin to behave as though they paid for parking.
7. The City should encourage employers to offer employees the option of a “Cash-out” program, for the equivalent cash value of any employer-provided parking subsidy, to reduce traffic congestion, air pollution, and gasoline consumption.
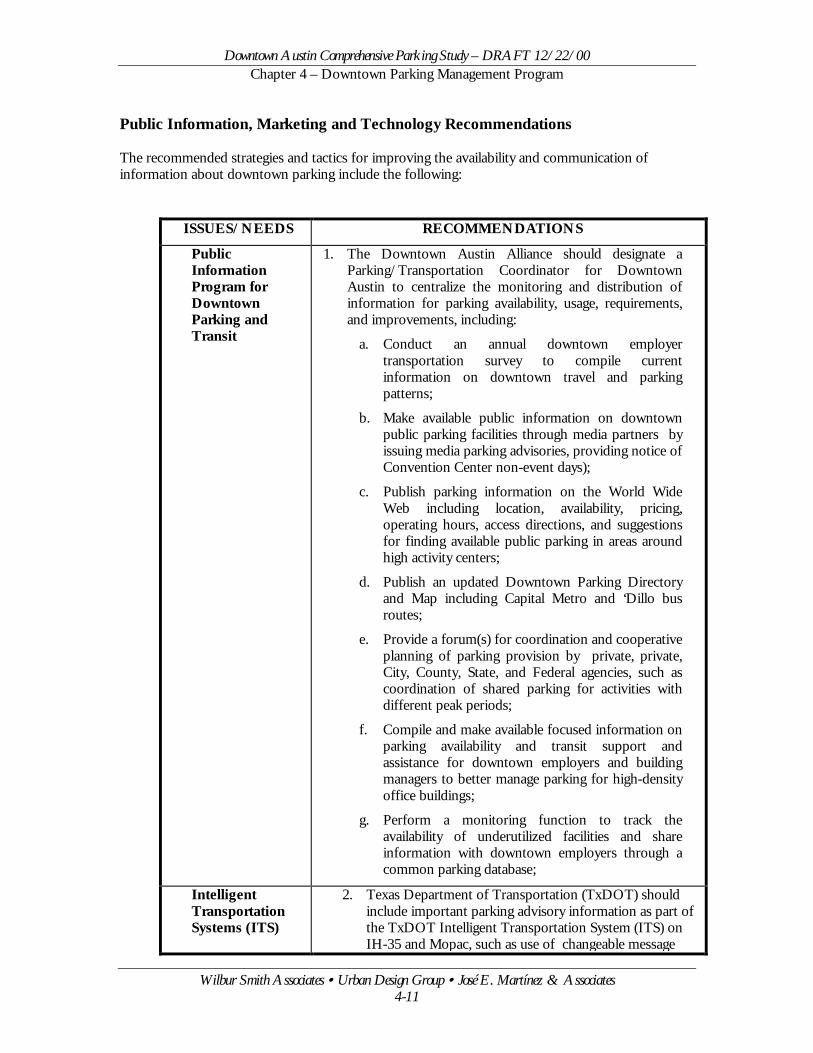
Downtown Austin Comprehensive Parking Study – DRAFT 12/22/00 Chapter 4 – Downtown Parking Management Program
Wilbur Smith Associates • Urban Design Group • José E. Martínez & Associates 4-11
Public Information, Marketing and Technology Recommendations The recommended strategies and tactics for improving the availability and communication of information about downtown parking include the following:
ISSUES/NEEDS RECOMMENDATIONS
Public Information Program for Downtown Parking and Transit
1. The Downtown Austin Alliance should designate a Parking/Transportation Coordinator for Downtown Austin to centralize the monitoring and distribution of information for parking availability, usage, requirements, and improvements, including:
a. Conduct an annual downtown employer transportation survey to compile current information on downtown travel and parking patterns;
b. Make available public information on downtown public parking facilities through media partners by issuing media parking advisories, providing notice of Convention Center non-event days);
c. Publish parking information on the World Wide Web including location, availability, pricing, operating hours, access directions, and suggestions for finding available public parking in areas around high activity centers;
d. Publish an updated Downtown Parking Directory and Map including Capital Metro and ‘Dillo bus routes;
e. Provide a forum(s) for coordination and cooperative planning of parking provision by private, private, City, County, State, and Federal agencies, such as coordination of shared parking for activities with different peak periods;
f. Compile and make available focused information on parking availability and transit support and assistance for downtown employers and building managers to better manage parking for high-density office buildings;
g. Perform a monitoring function to track the availability of underutilized facilities and share information with downtown employers through a common parking database;
Intelligent Transportation Systems (ITS)
2. Texas Department of Transportation (TxDOT) should include important parking advisory information as part of the TxDOT Intelligent Transportation System (ITS) on IH-35 and Mopac, such as use of changeable message
Downtown Austin Comprehensive Parking Study – DRAFT 12/22/00 Chapter 4 – Downtown Parking Management Program
Wilbur Smith Associates • Urban Design Group • José E. Martínez & Associates 4-12
signs and HAR (Highway Activated Radio) for advising motorists destined to Downtown to make use of the Convention Center Garages on light event days;
3. The City and the Downtown Austin Alliance should jointly develop and implement a Downtown Wayfinding System to improve the existing parking signage identification program initiated by the Downtown Austin Alliance. A wayfinding system for parking facilities should be designed to guide patrons safely and efficiently to available parking near their destinations and then back to the roadway system. A downtown parking wayfinding system should include: a. Installation of real-time electronic information signs
on streets in the CBD, to direct drivers to available parking spaces (involving all operators);
b. Include a cognitive mapping image representing the information needed to determine location within the downtown setting, recognize their parking destinations within that setting, and guide them from their location to the destinations;
c. Signage should be provided at or shortly before decision points to convey a legible and readable message to parkers for directions as they move through downtown and into and out of parking facilities, conveying information to users in a quick and easy to read format; and,
d. Coordination with broadcast and Internet media for reporting and responding to user queries about parking availability and locations within downtown Austin.
Parking Enforcement and Adjudication Recommendations Parking regulations are necessary to maintain efficient and functional parking system operation and service. Effective enforcement and adjudication of municipal parking regulations is important to the economic health and vitality of the city by encouraging orderly utilization of the available parking supply.
Recommendations for parking enforcement and adjudication include the following:
ISSUES/NEEDS RECOMMENDATIONS
Enforcement 1. Maintain the current level of parking enforcement activity to continue a satisfactory level of public compliance with parking regulations. Continue the policy of allowing a five-minute grace period beyond the allotted parking time before a red violation indicator appears and the vehicle is subject to citation by enforcement personnel.
Downtown Austin Comprehensive Parking Study – DRAFT 12/22/00 Chapter 4 – Downtown Parking Management Program
Wilbur Smith Associates • Urban Design Group • José E. Martínez & Associates 4-13
Loading Zones 2. Focus enforcement on loading zones and double parking of delivery vehicles in the E. Sixth Street and Warehouse entertainment area. The Parking Division of the Department of Public Works and Transportation should conduct a meeting with representatives of companies and businesses operating/served by the delivery trucks frequently using the loading zones in these areas, to discuss the loading space needs and explore alternatives for improving the existing conditions.
Evening Parking Enforcement
3. Consider extending the operating hours for parking meters and enforcement to remain in effect as late as 11:00 p.m. in areas with considerable evening activity (compared to the normal meter coverage of 8:30 a.m. - 5:30 p.m.).
Residential Parking Permit Program Recommendations Some citizens participating in the parking study expressed concerns about the Residential Parking Permit (RPP) program including the perception that businesses located in a proposed Residential Parking Permit zone must be included in signatures for the petition in favor of the RPP zone, about the level of difficulty encountered in obtaining designation of a proposed RPP zone, and that the smallest street segment normally considered for designation of an RPP zone is one block. The RPP program guidelines state that the petition is to be circulated among all households within the proposed area and a household is defined as a residence with a separate mailing address, phone number and /or utility bill. Two-thirds of the households must sign in favor of the RPP zone. The guidelines do not require that businesses must be included in signatures on the petition. The guidelines give the City Traffic Engineer discretion to designate a zone smaller than one block in special circumstances where warranted. The procedures and criteria for designation of RPP zones are designed to ensure an orderly process including due consideration of the interests of downtown neighborhood residents and businesses. The Residential Parking Permit program does NOT guarantee or assign residents a parking place. It allows residents the right to park IF they find a parking space. The City does not to provide or assign on-street parking for use by individual downtown property owners, workers or residents. Many residential uses in Downtown Austin are located in mixed residential and commercial areas that include metered and un-metered curb parking spaces which are subject to two-hour or five-hour parking time limitations. The RPP program should be expanded as metered parking zones are expanded and conflicts increase between residential and business parking demands. Analysis of the City’s existing Residential Parking Permit program identified the following considerations and recommendations:
ISSUES/NEEDS RECOMMENDATIONS
Expansion of RPP Zone Designations
1. The City Traffic Engineer should meet with downtown neighborhood associations to clarify understanding of RPP guidelines and procedures for zone designation and implementation.
Downtown Austin Comprehensive Parking Study – DRAFT 12/22/00 Chapter 4 – Downtown Parking Management Program
Wilbur Smith Associates • Urban Design Group • José E. Martínez & Associates 4-14
2. Where conditions warrant designation of a RPP zone smaller than one block, the City Traffic Engineer should make a technical evaluation and utilize appropriate discretion in determining zone boundaries.
3. Residential and non-residential property owners and occupants with insufficient off-street parking should be encouraged to arrange use of off-street parking in off-site locations as an alternative to on-street parking.
Amendment of Residential Parking Permit Program
4. The City should consider amending the Residential Parking Permit program to allow residents of designated residential parking permit areas to exceed the posted parking time limit and to not pay the meter for on-street parking. Therefore, the RPP permits would allow residents of a designated RPP zone to park free for longer than the posted time limit in that zone when they can find an on-street space. Other vehicles without RPP permits would be able to park provided they comply with the posted time limit and pay the meter. Enforcement of the posted time limits will maintain the intended short-term use of on-street parking and discourage day-long commuter parking.
5. Permits should allow residents to park on-street only in their designated RPP zone. The area would be identified by a zone number which is displayed on the permit and on the RPP parking signs in that zone. If no number appears on the RPP sign or a different number than the number on the permit, the permit does not apply to that street.
6. RPP permits should not allow vehicles to be parked more than 72 hours on-street.
7. RPP permits do not exempt permit holders from any other parking restrictions other than the time restriction and meter payment in the designated RPP zone.
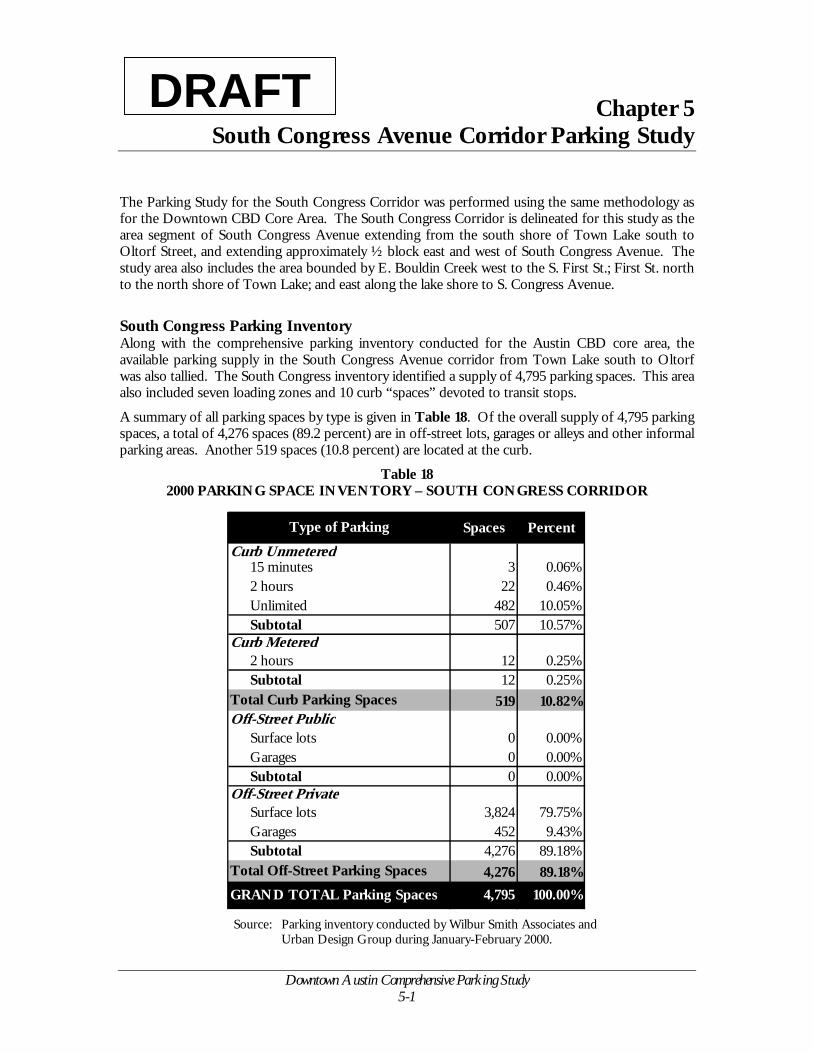
Chapter 5
Thefor areaOltostudto th
SouAloavaiwasalso
A suspacpark
T
DRAFDowntown Austin Comprehensive Parking Study 5-1
South Congress Avenue Corridor Parking Study
Parking Study for the South Congress Corridor was performed using the same methodology as the Downtown CBD Core Area. The South Congress Corridor is delineated for this study as the segment of South Congress Avenue extending from the south shore of Town Lake south to rf Street, and extending approximately ½ block east and west of South Congress Avenue. The y area also includes the area bounded by E. Bouldin Creek west to the S. First St.; First St. north e north shore of Town Lake; and east along the lake shore to S. Congress Avenue.
th Congress Parking Inventory ng with the comprehensive parking inventory conducted for the Austin CBD core area, the lable parking supply in the South Congress Avenue corridor from Town Lake south to Oltorf also tallied. The South Congress inventory identified a supply of 4,795 parking spaces. This area included seven loading zones and 10 curb “spaces” devoted to transit stops.
mmary of all parking spaces by type is given in Table 18. Of the overall supply of 4,795 parking es, a total of 4,276 spaces (89.2 percent) are in off-street lots, garages or alleys and other informal ing areas. Another 519 spaces (10.8 percent) are located at the curb.
Table 18 2000 PARKING SPACE INVENTORY – SOUTH CONGRESS CORRIDOR
Source: Parking inventory conducted by Wilbur Smith Associates and Urban Design Group during January-February 2000.
Spaces PercentCurb Unmetered
15 minutes 3 0.06%2 hours 22 0.46%Unlimited 482 10.05%Subtotal 507 10.57%
Curb Metered2 hours 12 0.25%Subtotal 12 0.25%
Total Curb Parking Spaces 519 10.82%Off-Street Public
Surface lots 0 0.00%Garages 0 0.00%Subtotal 0 0.00%
Off-Street PrivateSurface lots 3,824 79.75%Garages 452 9.43%Subtotal 4,276 89.18%
Total Off-Street Parking Spaces 4,276 89.18%GRAND TOTAL Parking Spaces 4,795 100.00%
Type of Parking

Downtown Austin Comprehensive Parking Study – DRAFT 12/22/00 Chapter 5 – South Congress Avenue Corridor Parking Study
Wilbur Smith Associates • Urban Design Group • José E. Martínez & Associates 5-2
The available parking supply in the study area is shown in Figure 14. Each block within the study area is identified by a unique block number. The on-street parking facilities and other curb uses are shown around the perimeter of each block, with different colors signifying metered and unmetered parking and temporary construction zones. The off-street parking facilities are identified within the interior of each block, including surface lots and multilevel garages available for general public use as well as facilities restricted for private use. The inventory also shows the location of loading zones and transit stops, which reduce the amount of on-street parking.
Curb Parking and Loading Zones - Curb spaces account for 10.8 percent of the 4,795 spaces available for public hourly or daily parking in the South Congress corridor. Of the 519 curb spaces, 482 spaces have no time restriction posted. Unmetered curb parking with restricted time limits defined by traffic signs amount to 25 spaces, most of which have a two-hour limit except for three 15-minute spaces. Metered curb parking with a two-hour time limit amounts to 12 spaces (with no five-hour meters as in the CBD area). On-street loading zones designated for commercial loading, customer service and passenger loading total seven zones. Other loading zones located in alleyways or off-street locations are not included in this number.
Off-Street Parking - The off-street parking facilities in the South Congress area, by location, type and number of spaces, are also shown in the inventory. As of the 2000 inventory, there were 4,276 spaces in off-street locations. The off-street spaces are classified as “public” and “private” based on who is able to utilize them. Private parking spaces are owned or used by business firms for their customers or employees. Public spaces define parking that is open for use by the general public. Significantly, the entire off-street parking supply in the South Congress corridor is in private lots and garages, with no public parking facilities.
Private Lots and Garages - Private off-street parking facilities contain 4,276 spaces or 89.2 percent of the available parking in the South Congress Avenue corridor. These spaces are split between garages (452 spaces) and surface lots (3,824 spaces). Garages account for only about 10 percent of the private parking supply, typical of the parking conditions found in small downtown areas.
South Congress Parking Accumulation Parking accumulation refers to the total number of parked vehicles occupying spaces at each hour during a typical day, either in off-street facilities or at on-street curb locations. Accumulation data is useful for analyzing the utilization of parking facilities. Comparison of the accumulation of parked vehicles to the available supply of parking spaces throughout the day indicates the variation in parking occupancy during a typical weekday.
It is important to note that the effective capacity of a parking facility or a set of on-street curb spaces is somewhat less than the actual number of existing spaces. Because of turnover and the coming and going of parkers, a certain number of spaces is usually unoccupied and available to those “hunting” for spaces. Otherwise, a fully occupied facility could not accommodate any additional parkers seeking vacant spaces and would become congested with vehicles waiting for parking spaces. Other factors such as improperly parked vehicles taking up more than one space may also reduce the true capacity. Based on typical parking turnover patterns, the effective capacity of on-street spaces is considered to be about 90 percent of the actual total. For off-street lots and garages, the effective capacity is considered to be about 85 percent of the total number of spaces.
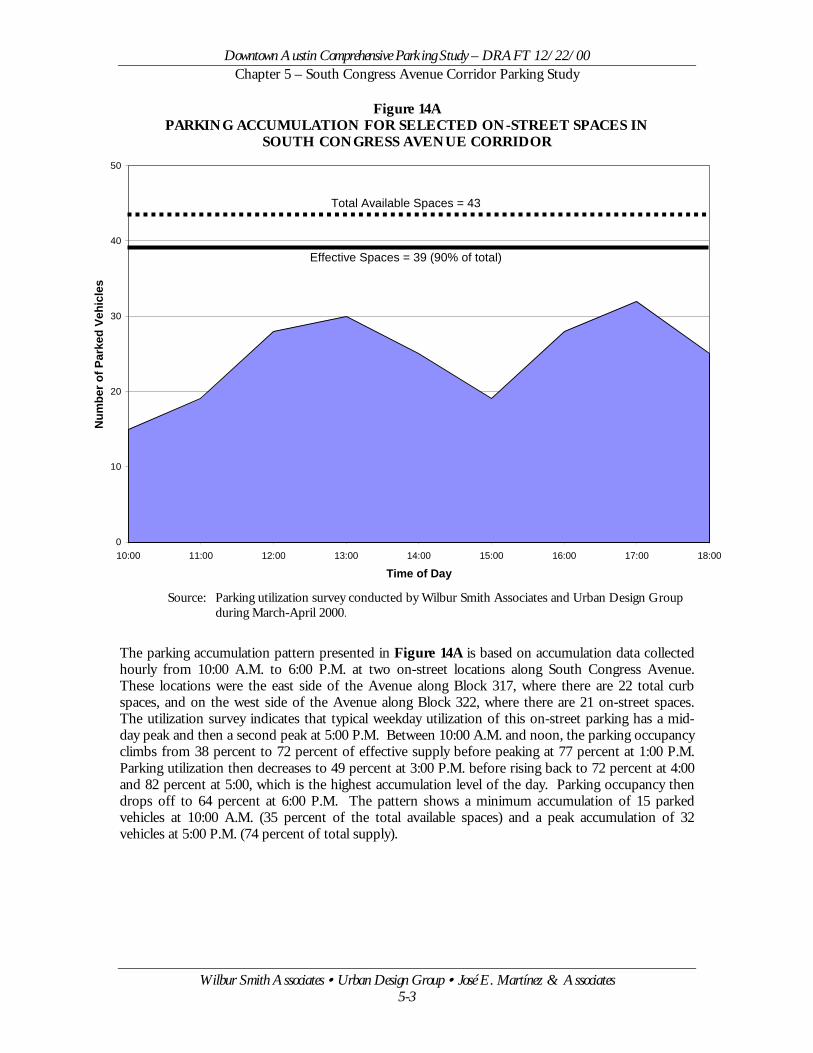
Downtown Austin Comprehensive Parking Study – DRAFT 12/22/00 Chapter 5 – South Congress Avenue Corridor Parking Study
Wilbur Smith Associates • Urban Design Group • José E. Martínez & Associates 5-3
Figure 14A PARKING ACCUMULATION FOR SELECTED ON-STREET SPACES IN
SOUTH CONGRESS AVENUE CORRIDOR
Source: Parking utilization survey conducted by Wilbur Smith Associates and Urban Design Group during March-April 2000.
The parking accumulation pattern presented in Figure 14A is based on accumulation data collected hourly from 10:00 A.M. to 6:00 P.M. at two on-street locations along South Congress Avenue. These locations were the east side of the Avenue along Block 317, where there are 22 total curb spaces, and on the west side of the Avenue along Block 322, where there are 21 on-street spaces. The utilization survey indicates that typical weekday utilization of this on-street parking has a mid-day peak and then a second peak at 5:00 P.M. Between 10:00 A.M. and noon, the parking occupancy climbs from 38 percent to 72 percent of effective supply before peaking at 77 percent at 1:00 P.M. Parking utilization then decreases to 49 percent at 3:00 P.M. before rising back to 72 percent at 4:00 and 82 percent at 5:00, which is the highest accumulation level of the day. Parking occupancy then drops off to 64 percent at 6:00 P.M. The pattern shows a minimum accumulation of 15 parked vehicles at 10:00 A.M. (35 percent of the total available spaces) and a peak accumulation of 32 vehicles at 5:00 P.M. (74 percent of total supply).
0
10
20
30
40
50
10:00 11:00 12:00 13:00 14:00 15:00 16:00 17:00 18:00
Time of Day
Num
ber o
f Par
ked
Vehi
cles
Effective Spaces = 39 (90% of total)
Total Available Spaces = 43
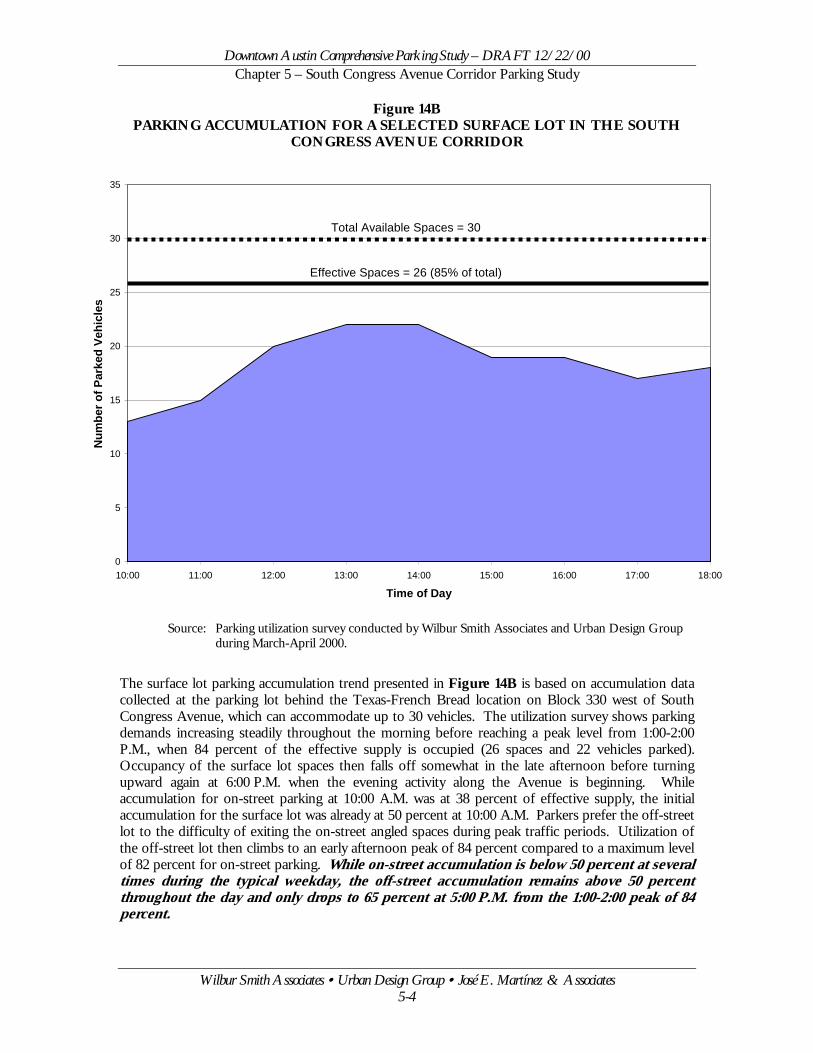
Downtown Austin Comprehensive Parking Study – DRAFT 12/22/00 Chapter 5 – South Congress Avenue Corridor Parking Study
Wilbur Smith Associates • Urban Design Group • José E. Martínez & Associates 5-4
Figure 14B PARKING ACCUMULATION FOR A SELECTED SURFACE LOT IN THE SOUTH
CONGRESS AVENUE CORRIDOR
Source: Parking utilization survey conducted by Wilbur Smith Associates and Urban Design Group during March-April 2000.
The surface lot parking accumulation trend presented in Figure 14B is based on accumulation data collected at the parking lot behind the Texas-French Bread location on Block 330 west of South Congress Avenue, which can accommodate up to 30 vehicles. The utilization survey shows parking demands increasing steadily throughout the morning before reaching a peak level from 1:00-2:00 P.M., when 84 percent of the effective supply is occupied (26 spaces and 22 vehicles parked). Occupancy of the surface lot spaces then falls off somewhat in the late afternoon before turning upward again at 6:00 P.M. when the evening activity along the Avenue is beginning. While accumulation for on-street parking at 10:00 A.M. was at 38 percent of effective supply, the initial accumulation for the surface lot was already at 50 percent at 10:00 A.M. Parkers prefer the off-street lot to the difficulty of exiting the on-street angled spaces during peak traffic periods. Utilization of the off-street lot then climbs to an early afternoon peak of 84 percent compared to a maximum level of 82 percent for on-street parking. While on-street accumulation is below 50 percent at several times during the typical weekday, the off-street accumulation remains above 50 percent throughout the day and only drops to 65 percent at 5:00 P.M. from the 1:00-2:00 peak of 84 percent.
0
5
10
15
20
25
30
35
10:00 11:00 12:00 13:00 14:00 15:00 16:00 17:00 18:00
Time of Day
Num
ber o
f Par
ked
Vehi
cles
Effective Spaces = 26 (85% of total)
Total Available Spaces = 30
Downtown Austin Comprehensive Parking Study – DRAFT 12/22/00 Chapter 5 – South Congress Avenue Corridor Parking Study
Wilbur Smith Associates • Urban Design Group • José E. Martínez & Associates 5-5
The surveyed locations in the South Congress Avenue corridor had peak accumulations on typical weekdays in the low to mid 80 percent range and are generally accommodated by the available parking. The accumulation patterns presented in Figures 14A and 14B are considered representative of general on-street and off-street parking occupancy trends on a typical weekday in the South Congress Avenue corridor. Unlike the CBD situation, where parking accumulation periodically approaches and/or exceeds the effective supply for both on-street and surface lot parking, the South Congress corridor exhibited a well-functioning parking system during typical weekdays. Deficiencies may occur in specific areas and observations indicate that the evening demands are significantly greater for portions of the South Congress study area where entertainment venues and restaurants and eating/drinking establishments are concentrated, including the Continental Club, Guero’s, Sol y La Luna, Vespaio, and Shaggy’s.
South Congress Year 2000 Parking Demands The parking demands by block for the South Congress study area are illustrated in Figure 15. Total year 2000 parking demands for a typical weekday amount to 4,481 spaces. The highest demands are concentrated in the north portion of the study area (blocks 304-311) where the general office, restaurant, hotel and other high activity uses are concentrated along Barton Springs Road and Riverside Drive.
The various generators located within a block determine the number of parkers the block will attract and the demand for parking spaces at particular times. The retail generators along the Avenue are frequented by parkers who arrive at different times throughout the day, meaning that parking accumulation will fluctuate substantially from hour to hour. Generators such as restaurants, eating and drinking establishments and entertainment venues attract mostly lunchtime and evening trips and have a low level of parking demands at other times of the day. The accumulation of parked vehicles within each block in the study area varies throughout the day based on the types of parking generators and the trip purposes of the many individual parkers coming to each area. Niteclubs and restaurants attract significant parking demands in the evenings and on weekends. Tuesday, Friday and Saturday evenings are the peak nights for entertainment activity. When evening parking demands exceed the available supply, parking spills over into adjacent residential neighborhoods and coincides with the timing of peak residential demands. South Congress Year 2000 Parking Supply/Demand Analysis Parking needs were determined by assessing the supply-demand situation and evaluating parking patterns and habits. To calculate existing parking needs, block-by-block and sector-level analyses were made of the supply and demand for parking spaces. Parking surpluses or deficiencies by block, sector and for the South Congress study area were determined by comparing the inventoried parking supply to the estimated year 2000 parking demands. A geographic information system (GIS) model of parking supply and demands was developed and used for this analysis.
When analyzing parking needs, supply deficiencies in one block may be offset somewhat or even satisfied by surpluses in nearby blocks within an acceptable maximum walking distance, typically 2-3 blocks. Therefore, parking supply and demand were also analyzed at the sector level. The South Congress study area was subdivided into three sectors including the area north of Riverside Drive, a middle sector between Riverside and Annie, and a south sector from Annie to Oltorf. The year 2000 parking surpluses and deficiencies at the block level and sector level are illustrated in Figure 16. Year 2005 demands were examined based upon the Emerging Projects Data Base, which identifies one development project in the South Congress study area. Parking demands and needs are not appreciably changed by the available development information.
Downtown Austin Comprehensive Parking Study – DRAFT 12/22/00 Chapter 5 – South Congress Avenue Corridor Parking Study
Wilbur Smith Associates • Urban Design Group • José E. Martínez & Associates 5-6
Parking Management and Implementation Strategies The South Congress Avenue corridor has an overall parking surplus on typical weekdays, but with localized deficiencies in high-demand locations and during evening peak periods, which leads to frustrations for visitors, business owners and residents seeking parking at particular destinations. As stated in the Enhancement Guidelines report for the South Congress Improvement Project, the heart of the South Congress Avenue corridor is an “eclectic zone” that, except for the relatively wide cross section of the Avenue, in many ways resembles “a small town Texas ‘Main Street’ with older mercantile buildings located at the front property line served by on-street, angle-in parking.” Community representatives expressed strong interest in preserving this Main Street atmosphere, partly by maintaining and even expanding on-street angle parking along the Avenue. The potential for a light rail transit line in the corridor raised serious concerns about the potential loss of on-street parking due to right-of-way limitations. Small, incremental improvements in off-street surface lot parking supply will be the primary physical option versus costly and potentially intrusive structural parking solutions. Joint parking arrangements for rear and side parking areas should be included in new development and redevelopment to promote opportunities for shared parking among adjacent businesses and mixed-use properties.
Parking Improvement Recommendations Parking improvement recommendations for the South Congress study area were developed based upon the results of the parking needs analysis and the issues and alternatives that were identified by participants in the parking study process, which included businesses, residents and property owners as well as others with interests in the South Congress corridor. The parking improvement recommendations are grouped into the following four categories:
! On-Street Parking Strategies;
! Off-Street Parking Strategies;
! Transit Strategy; and,
! Parking Management Strategies.
The parking improvement recommendations are illustrated in Figure 17 and described in the following sections.
On-Street Parking Strategies
Increase angle parking along the Avenue – Create additional angle parking spaces – and convert existing parallel spaces to angle parking – in appropriate locations where such parking will support a strong small business environment and a more pedestrian-friendly setting for visitors and customers. Recommended locations for consideration of potential angle parking are shown in Figure 17.
Adjust angle of on-street parking – “Flatten” the angle of existing curb parking in appropriate locations (for example, from existing 60 degree angle to a 45-degree angle), allowing parkers to leave the traffic lane with a better view of the space they are entering and ensuring departing parkers a better view of passing traffic as they back out of parking spaces onto the Avenue.
Create more angled parking on West Live Oak/Bartlett Street – Rework the on-street parking arrangement within the exceptionally wide right-of-way on W. Live Oak/Bartlett Street just west of South Congress Avenue to create two bays of angled parking. This would provide additional parking
Downtown Austin Comprehensive Parking Study – DRAFT 12/22/00 Chapter 5 – South Congress Avenue Corridor Parking Study
Wilbur Smith Associates • Urban Design Group • José E. Martínez & Associates 5-7
supply within convenient walking distance of nearby businesses and transit stops. Capital Metro may be able to participate in this improvement as a park and ride area for the ‘Dillo shuttle.
Increase short-term parking – Assign more existing spaces or create new spaces as two-hour maximum parking spaces for short-duration visits to particular destinations in the corridor. Potential locations are shown in Figure 17. The effectiveness of this approach will depend on regular enforcement.
Expand meter coverage – Install additional two-hour meters or on-street pay-and-display parking in high-demand locations within the corridor to promote parking turnover, influence parking behavior by placing a cost on parking, and to track parking activity. Parking meter revenue generated in the corridor could also be dedicated to future parking improvements in the area. Potential locations are shown in Figure 17.
Off-Street Parking Strategies
Convert additional land to surface parking – Monitor opportunities for the City or private partners to acquire properties placed on the market that would be appropriate for conversion to surface parking, within the first ½ block and primarily on the west side of the Avenue. Such parcels would need adequate area to accommodate a workable parking and circulation layout while also meeting landscaping and screening requirements adjacent to residential properties. Shared parking and off-site parking opportunities should be considered for major parking generators along the Avenue. Landscape screening and buffers separating residential properties should be incorporated.
Explore all partnership options with Congress Avenue Baptist Church – While it is understandable that Congress Avenue Baptist Church is protective of the vacant block it owns along the Avenue, this block is at the heart of the commercial corridor and offers one of the few opportunities for a significant parking solution in this vicinity. Discussions with church representatives indicate the Church will utilize the property for future expansion. The City and/or other parties should continue to explore potential initiatives in partnership with the Church that would provide for the Church’s long-term space and expansion needs while also providing new temporary parking capacity for public use, possibly with retail shops, public services or other amenities incorporated into the design. The property might at least accommodate interim parking arrangements until the block is developed.
Develop a coordinated parking plan for alleys and rear areas – Determine ways to maximize use of available space behind buildings and along alleyways by exploring utilization options and formalizing current informal arrangements and agreements between property and business owners. This could include more formal marking of parking spaces and areas and associated signage to indicate reserved versus public-use spaces. South Congress Avenue merchants, property owners and neighborhoods interests should be closely involved in these planning and implementation efforts. It was also suggested that those involved in planning parking solutions for the South Congress area look to existing parking arrangements and successful strategies used along the Guadalupe “Drag” near the University of Texas campus, where parking is at an even greater premium both on street and in many small surface lots at the rear of blocks.
Develop joint parking areas – Encourage joint parking arrangements for rear and side parking areas in new development and redevelopment, to promote opportunities for provision of shared parking among adjacent businesses and mixed use properties.
Downtown Austin Comprehensive Parking Study – DRAFT 12/22/00 Chapter 5 – South Congress Avenue Corridor Parking Study
Wilbur Smith Associates • Urban Design Group • José E. Martínez & Associates 5-8
Transit Strategy Make the South Congress ‘Dillo circulator successful – Work with Capital Metro to increase ridership and promote awareness of the South Congress ‘Dillo circulator whereby people can visit various destinations along the Avenue without having to move their vehicles or reach the area entirely through transit service from Downtown or other locations. In the future, consider extending ‘Dillo hours to serve visitors to the area for evening entertainment activities and reduce spillover parking in the adjacent residential neighborhoods. The evening ‘Dillo could circulate along the Avenue, traveling between the One Texas Center garage at the north end of the corridor and the large surface lot at the south end of the corridor near East Oltorf. Extending ‘Dillo operation into the evening hours will likely require public or private subsidies, as will necessary sanitation and possibly security at the north and south parking locations.
Parking Management Strategies Increase parking visibility – Implement uniform, attractive directional signage and better striping of on-street spaces to make parkers more aware of their on- and off-street parking options. Parking signs should feature a unique identity for the South Congress Avenue corridor.
Create a more pedestrian-friendly setting – Building on the desired Main Street theme and extending the “Great Streets” philosophy from downtown, a variety of physical and streetscape improvements should be implemented in the South Congress Avenue corridor to improve pedestrian safety and visibility and to encourage walking and longer visits to the corridor. The Enhancement Guidelines report for the South Congress Improvement Project outlines typical design elements and traffic calming measures, including:
! “bulb-outs” at intersections and appropriate mid-block crossings to narrow the pavement width and reduce the crossing distance for pedestrians;
! high-profile pedestrian crosswalks across the Avenue, using pavers or other distinctive materials or colors;
! a potential mid-street esplanade, which also serves as a refuge for pedestrians while crossing a busy street; and,
! using distinctive paving material or colors along the roadway edge, such as brick pavers within the on-street parking zone, to visually narrow the roadway and encourage slower speeds.
Gateway treatments at the north and south ends of the corridor’s core area, such as from Nellie/Academy to Live Oak, would alert motorists to the distinctive area they are entering. Community representatives also suggested lower speed limits and adjusted signal timing to slow traffic through the area. They also recognize the need for sidewalk improvements to ensure safe, shaded and well-lit walkways along the Avenue.
Designate a South Congress parking/transportation coordinator – A single individual is needed to focus on parking issues and improvements, through a private or non-profit arrangement as a function of the neighborhood associations or business coallition. This person would monitor parking utilization patterns, identify surpluses and building vacancies, and link those in need of parking with others with possible solutions.
Coordinate business owner/employee parking – Avenue merchants and business owners should continue to communicate about their parking needs and share common ideas and solutions to ensure maximum convenient parking supply for South Congress visitors and customers. Shop owners and employees should park in locations that will leave the prime curb and off-street spaces close to their businesses for use by customers and patrons.
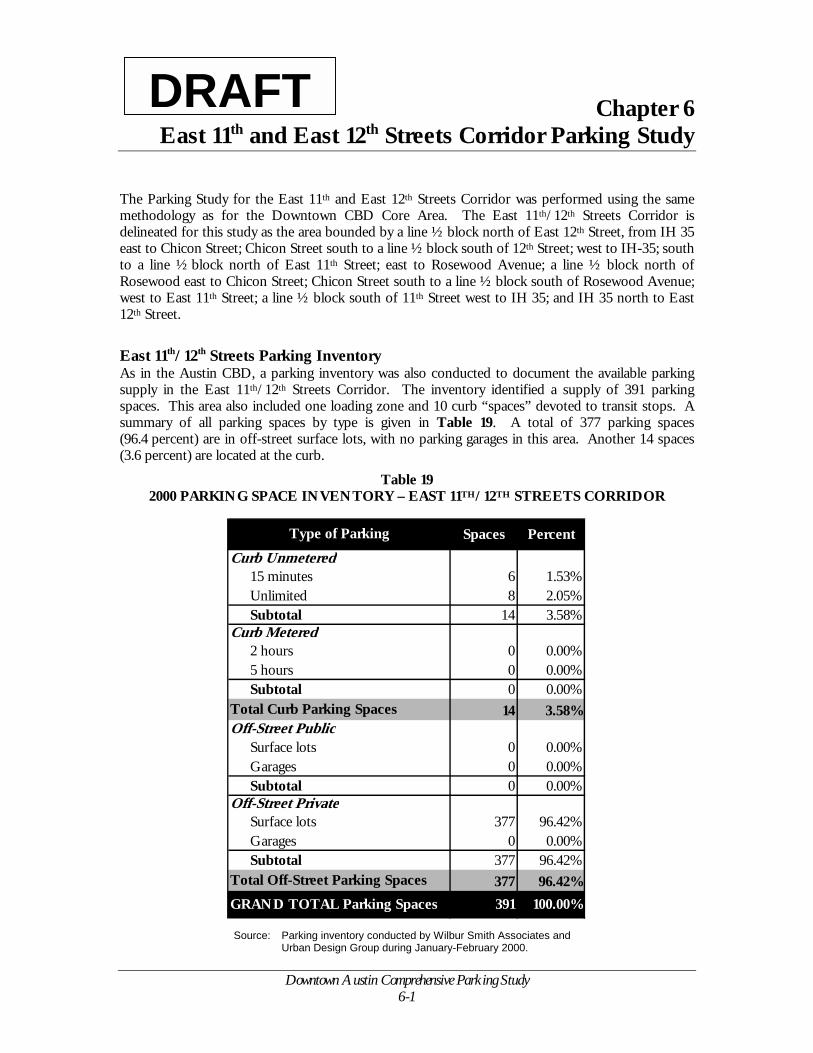
Themetdelieastto aRoswes12th
EasAs supspacsum(96.(3.6
T
DRAFDowntown Austin Comprehensive Parking Study 6-1
Chapter 6 East 11th and East 12th Streets Corridor Parking Study
Parking Study for the East 11th and East 12th Streets Corridor was performed using the same hodology as for the Downtown CBD Core Area. The East 11th/12th Streets Corridor is neated for this study as the area bounded by a line ½ block north of East 12th Street, from IH 35 to Chicon Street; Chicon Street south to a line ½ block south of 12th Street; west to IH-35; south line ½ block north of East 11th Street; east to Rosewood Avenue; a line ½ block north of ewood east to Chicon Street; Chicon Street south to a line ½ block south of Rosewood Avenue; t to East 11th Street; a line ½ block south of 11th Street west to IH 35; and IH 35 north to East Street.
t 11th/12th Streets Parking Inventory in the Austin CBD, a parking inventory was also conducted to document the available parking ply in the East 11th/12th Streets Corridor. The inventory identified a supply of 391 parking es. This area also included one loading zone and 10 curb “spaces” devoted to transit stops. A mary of all parking spaces by type is given in Table 19. A total of 377 parking spaces 4 percent) are in off-street surface lots, with no parking garages in this area. Another 14 spaces percent) are located at the curb.
Table 19 2000 PARKING SPACE INVENTORY – EAST 11TH/12TH STREETS CORRIDOR
Source: Parking inventory conducted by Wilbur Smith Associates and Urban Design Group during January-February 2000.
Spaces PercentCurb Unmetered
15 minutes 6 1.53%Unlimited 8 2.05%Subtotal 14 3.58%
Curb Metered2 hours 0 0.00%5 hours 0 0.00%Subtotal 0 0.00%
Total Curb Parking Spaces 14 3.58%Off-Street Public
Surface lots 0 0.00%Garages 0 0.00%Subtotal 0 0.00%
Off-Street PrivateSurface lots 377 96.42%Garages 0 0.00%Subtotal 377 96.42%
Total Off-Street Parking Spaces 377 96.42%GRAND TOTAL Parking Spaces 391 100.00%
Type of Parking
Downtown Austin Comprehensive Parking Study – DRAFT 12/22/00 Chapter 6 – East 11th and East 12th Streets Corridor Parking Study
Wilbur Smith Associates • Urban Design Group • José E. Martínez & Associates 6-2
The available parking supply in the study area is shown in Figure 18. Each block within the study area is identified by a unique block number based upon the original Austin townsite plat map. The on-street parking facilities and other curb uses are shown around the perimeter of each block, with different colors signifying metered and unmetered parking and temporary construction zones. The off-street parking facilities are identified within the interior of each block. Figure 17 also shows the location of loading zones and transit stops, which reduce the amount of on-street parking.
Curb Parking and Loading Zones Curb spaces account for 3.6 percent of the 391 spaces available for public hourly or daily parking in the East 11th and East 12th Street area. Of the 14 curb spaces, eight spaces have no time restriction posted. Unmetered curb parking with restricted time limits defined by traffic signs amount to six spaces, all of which have a 15-minute limit (with no 30-minute, one-hour, or two-hour signed spaces as in the CBD area). No parking meters are currently installed in the East 11th and East 12th Street area.
The area includes only one on-street loading zone. Other loading zones located in alleyways or off-street locations are not included in the inventory.
Off-Street Parking The off-street parking facilities in the East 11th and East 12th Street area, by location, type and number of spaces, are also shown in the inventory. As of the 2000 inventory, there were 377 spaces in off-street locations. Off-street spaces are classified as “public” and “private” based on who is able to utilize them. Private parking spaces are owned or used by business firms for their customers or employees. Public spaces define parking that is open for use by the general public. Significantly, the entire off-street parking supply in the corridor is in private versus public parking facilities. In addition, all of the private spaces are in surface lots since there are currently no garages in the area.
East 11th/12th Streets Parking Accumulation Parking accumulation refers to the total number of parked vehicles occupying spaces at each hour during a typical day, either in off-street facilities or at on-street curb locations. Accumulation data is useful for analyzing the utilization of parking facilities. Comparison of the accumulation of parked vehicles to the available supply of parking spaces throughout the day indicates the variation in parking occupancy during a typical weekday.
It is important to note that the effective capacity of a parking facility or a set of on-street curb spaces is somewhat less than the actual number of existing spaces. Because of turnover and the coming and going of parkers, a certain number of spaces is usually unoccupied and available to those “hunting” for spaces. Otherwise, a fully occupied facility could not accommodate any additional parkers seeking vacant spaces and would become congested with vehicles waiting for parking spaces. Other factors such as improperly parked vehicles taking up more than one space may also reduce the true capacity. Based on typical parking turnover patterns, the effective capacity of on-street spaces is considered to be about 90 percent of the actual total. For off-street lots and garages, the effective capacity is considered to be about 85 percent of the total number of spaces.
The parking accumulation pattern presented in Figure 18A is based on accumulation data collected hourly from 10:00 A.M. to 6:00 P.M. at an on-street parking location along East 11th Street. The surveyed location was along the north side of East 11th between Branch and Curve (Block 418). There are actually no formal, striped on-street parking spaces along this block but vehicles are parked along the curb at this location, where there is room for approximately five or six parallel parked
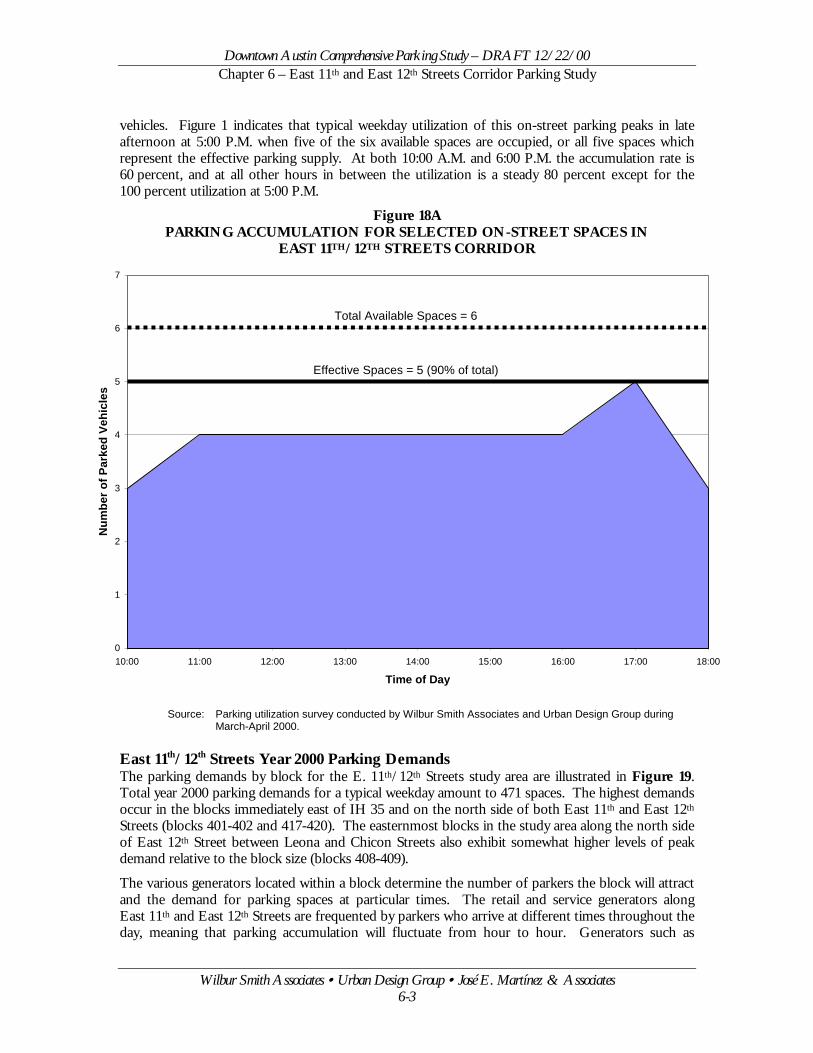
Downtown Austin Comprehensive Parking Study – DRAFT 12/22/00 Chapter 6 – East 11th and East 12th Streets Corridor Parking Study
Wilbur Smith Associates • Urban Design Group • José E. Martínez & Associates 6-3
vehicles. Figure 1 indicates that typical weekday utilization of this on-street parking peaks in late afternoon at 5:00 P.M. when five of the six available spaces are occupied, or all five spaces which represent the effective parking supply. At both 10:00 A.M. and 6:00 P.M. the accumulation rate is 60 percent, and at all other hours in between the utilization is a steady 80 percent except for the 100 percent utilization at 5:00 P.M.
Figure 18A PARKING ACCUMULATION FOR SELECTED ON-STREET SPACES IN
EAST 11TH/12TH STREETS CORRIDOR
Source: Parking utilization survey conducted by Wilbur Smith Associates and Urban Design Group during March-April 2000.
East 11th/12th Streets Year 2000 Parking Demands The parking demands by block for the E. 11th/12th Streets study area are illustrated in Figure 19. Total year 2000 parking demands for a typical weekday amount to 471 spaces. The highest demands occur in the blocks immediately east of IH 35 and on the north side of both East 11th and East 12th Streets (blocks 401-402 and 417-420). The easternmost blocks in the study area along the north side of East 12th Street between Leona and Chicon Streets also exhibit somewhat higher levels of peak demand relative to the block size (blocks 408-409).
The various generators located within a block determine the number of parkers the block will attract and the demand for parking spaces at particular times. The retail and service generators along East 11th and East 12th Streets are frequented by parkers who arrive at different times throughout the day, meaning that parking accumulation will fluctuate from hour to hour. Generators such as
0
1
2
3
4
5
6
7
10:00 11:00 12:00 13:00 14:00 15:00 16:00 17:00 18:00
Time of Day
Num
ber o
f Par
ked
Vehi
cles
Effective Spaces = 5 (90% of total)
Total Available Spaces = 6
Downtown Austin Comprehensive Parking Study – DRAFT 12/22/00 Chapter 6 – East 11th and East 12th Streets Corridor Parking Study
Wilbur Smith Associates • Urban Design Group • José E. Martínez & Associates 6-4
restaurants, eating and drinking establishments and entertainment venues attract mostly lunchtime and evening trips and have a low level of parking demands at other times of the day. When evening parking demands exceed the available supply, parking spills over into adjacent residential neighborhoods and coincides with the timing of peak residential demands. For the East 11th/12th Streets area, it was also pointed out that vehicles are sometimes parked on vacant lots on busy Saturday evenings. The accumulation of parked vehicles within each block in the study area varies throughout the day based on the types of parking generators and the trip purposes of the many individual parkers coming to each area.
East 11th/12th Streets Year 2000 Parking Supply/Demand Analysis Parking needs were determined by assessing the supply-demand situation and evaluating parking patterns and habits. To calculate existing parking needs, block-by-block and sector-level analyses were made of the supply and demand for parking spaces. Parking surpluses or deficiencies by block, sector and for the East 11th/12th Streets study area were determined by comparing the inventoried parking supply to the estimated year 2000 parking demands. A geographic information system (GIS) model of parking supply and demands was developed and used for this analysis.
When analyzing parking needs, supply deficiencies in one block may be offset somewhat or even satisfied by surpluses in nearby blocks within an acceptable walking distance. Therefore, parking supply and demand were also analyzed at the sector level. The East 11th/12th Streets study area was subdivided into two sectors to separate East 11th Street and East 12th Street. The year 2000 parking surpluses and deficiencies at the block level and sector level are illustrated in Figure 20. East 11th Street has an deficiency of 190 parking spaces, due to the lack of on-street or off-street parking in this sector. Existing land uses rely on parking in adjacent blocks to meet their parking demands.
East 12th Street displays an overall parking surplus of 27 spaces, indicating that the existing parking supply and demands are fairly well in balance. Individual blocks have either surpluses or deficiencies but balance each other out across the sector.
East 11th/12th Streets Year 2005 Parking Supply/Demand Analysis Planned changes in land use and parking were projected for the year 2005 based upon the development plans identified in the East 11th & 12th Streets Community Redevelopment Plan. Land use changes and parking included in the Community Redevelopment Plan were added to each block and the projected future parking supply and demands were calculated. The redevelopment plan generally proposes mixed commercial/residential and office/residential uses with surface parking located on the rear portion of the blocks. The projected 2005 parking surpluses and deficiencies by block and by sector are shown in Figure 21.
East 11th Street is projected to have an increased parking deficiency of 495 spaces. East 12th Street has a projected deficiency of 214 spaces. The projected deficiencies are concentrated in the two to three blocks located east of Interstate Highway 35.
Parking Management and Implementation Strategies The Year 2000 data indicate that the East 11th/12th Streets Corridor already has a modest overall parking deficiency on typical weekdays. Off-street single-family residential parking was not identified in the parking inventory, likely accounts for the majority of identified parking needs, and does not represent a significant problem. The immediate concern is the potential for more significant parking
Downtown Austin Comprehensive Parking Study – DRAFT 12/22/00 Chapter 6 – East 11th and East 12th Streets Corridor Parking Study
Wilbur Smith Associates • Urban Design Group • José E. Martínez & Associates 6-5
deficiencies over time as the reinvestment activity anticipated in the redevelopment plan for this area begins to occur – or that parking limitations could stifle redevelopment interest.
The key challenges related to parking in the East 11th/12th Streets Corridor include:
! The potential for major redevelopment activity and associated parking demands.
! The need for adequate and convenient parking to convince businesses to invest and locate in the area (especially service businesses where many vehicles stop in for short-duration visits).
! Limitations to on-street parking, including narrow streets and neighborhood opposition to additional on-street parking (residents prefer only transit stops along the primary streets and limited parking on side streets).
! Potential for shared, off-site parking on a surface lot or possible structured parking located near the junction of the two corridors at the east side of IH-35.
! Obstacles to development of significant off-street parking facilities, including financial feasibility and development limitations (few sizable parcels for surface lots, neighborhood opposition and Capitol view restrictions on height and bulk, and limited lot depths that make it difficult to accommodate potential development plus off-street parking feasibly).
! Security concerns/perceptions and resulting limitations on acceptable walking distance.
Parking Improvement Recommendations Parking improvement recommendations for the East 11th/12th Streets study area were developed based upon the results of the parking needs analysis and the issues and alternatives that were identified by participants in the parking study process, which included businesses, residents and property owners as well as others with interests in the corridor. The parking improvement recommendations are grouped into the following four categories:
! On-Street Parking Strategies;
! Off-Street Parking Strategies;
! Transit Strategy; and,
! Parking Management Strategies.
The parking improvement recommendations are described in the following sections.
On-Street Parking Strategies
Increase short-term parking – Create more on-street parking in key locations acceptable to the surrounding neighborhoods and where appropriate along East 11th and 12th Streets given roadway width limitations, bicycle lane and transit stop conflicts, and overall safety considerations.
Increase parking enforcement – Intensify enforcement efforts to combat illegal parking activities and ensure greater turnover in spaces with designated time limits near service businesses and other popular destinations.
Off-Street Parking Strategies
Convert additional land to surface parking – Monitor opportunities for the City, private partners, or the Redevelopment Authority to acquire properties placed on the market that would be appropriate
Downtown Austin Comprehensive Parking Study – DRAFT 12/22/00 Chapter 6 – East 11th and East 12th Streets Corridor Parking Study
Wilbur Smith Associates • Urban Design Group • José E. Martínez & Associates 6-6
for conversion to surface parking, primarily within the first block or two on either side of East 11th and East 12th Streets. Such parcels would need adequate area to accommodate a workable parking and circulation layout while also meeting landscaping and screening requirements adjacent to residential properties.
Encourage joint parking arrangements – As envisioned in the area redevelopment plan, encourage rear and side parking areas in new development and redevelopment, particularly to promote opportunities for shared parking among adjacent businesses and mixed-use properties.
Potential remote parking development – It was suggested that vacant properties in the corridor could be attractive for potential development as remote surface lots for overflow parking related to University of Texas football games and other special events, especially as the University continues to expand the capacity of Darrell K. Royal-Memorial Stadium in coming years. While significant parking lot construction of this sort is likely not the desired long-term development path for the East 11th/12th Streets area, remote lots could serve local parking needs and/or downtown park-and-ride service when not dedicated to University use.
Transit Strategy While some who provided input to the Parking Study indicated that ‘Dillo service might not be desired for the East 11th/12th Streets area, others did indicate a need for some type of circulator shuttle to enable visitors to reach various destinations in the corridor without relying on their vehicles and to encourage use of potential new surface lots that might not be convenient to all locations along East 11th and East 12th Streets.
Parking Management Strategies In the project discussions for the East 11th/12th Streets area, it was noted that surface lots should serve as an interim parking solution while working toward potential structural solutions over time as redevelopment activity takes hold, especially given the financial obstacles involved. Public financing options have apparently been considered for this area before (tax increment financing, improvement district, etc.) and would likely be needed, once feasible, to undertake substantial parking improvements. As outlined in the area redevelopment plan, it was also pointed out that clustered versus scattered development is desired to encourage joint parking provision and a more walkable setting.
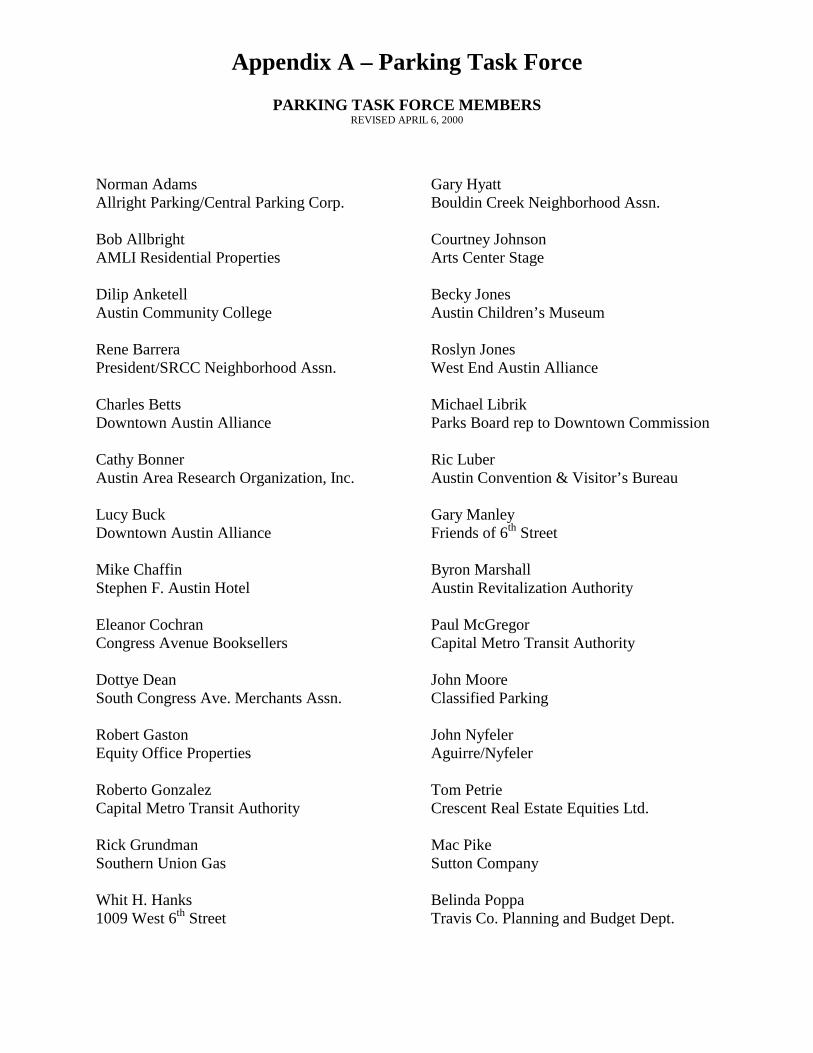
Appendix A – Parking Task Force
PARKING TASK FORCE MEMBERS REVISED APRIL 6, 2000
Norman Adams Allright Parking/Central Parking Corp. Bob Allbright AMLI Residential Properties Dilip Anketell Austin Community College Rene Barrera President/SRCC Neighborhood Assn. Charles Betts Downtown Austin Alliance Cathy Bonner Austin Area Research Organization, Inc. Lucy Buck Downtown Austin Alliance Mike Chaffin Stephen F. Austin Hotel Eleanor Cochran Congress Avenue Booksellers Dottye Dean South Congress Ave. Merchants Assn. Robert Gaston Equity Office Properties Roberto Gonzalez Capital Metro Transit Authority Rick Grundman Southern Union Gas Whit H. Hanks 1009 West 6th Street
Gary Hyatt Bouldin Creek Neighborhood Assn. Courtney Johnson Arts Center Stage Becky Jones Austin Children’s Museum Roslyn Jones West End Austin Alliance Michael Librik Parks Board rep to Downtown Commission Ric Luber Austin Convention & Visitor’s Bureau Gary Manley Friends of 6th Street Byron Marshall Austin Revitalization Authority Paul McGregor Capital Metro Transit Authority John Moore Classified Parking John Nyfeler Aguirre/Nyfeler Tom Petrie Crescent Real Estate Equities Ltd. Mac Pike Sutton Company Belinda Poppa Travis Co. Planning and Budget Dept.

Parking Task Force Members Appendix A – Parking Task Force
Wilbur Smith Associates A-2
Margaret Quadlander Bouldin Creek Neighborhood Assn. Mark Stine Old West Austin Neighborhood Association Lynn Raridon East 6th St. Community Chris Riley Downtown Austin Neighborhood Association Beverly Silas Southwestern Bell Carl Tepper UTC rep to Downtown Commission
Jeff Trigger Driskill Hotel Brenda Warner Real Estate Council of Austin/TBG Partners Bruce Willinzek Warehouse District/Entertainment Bob Woody East 6th St. Community Assn. Old Pecan St. Café Joneth Wyatt UTC rep to Downtown Commission Will Wynn CIVITAS Investments, Inc.
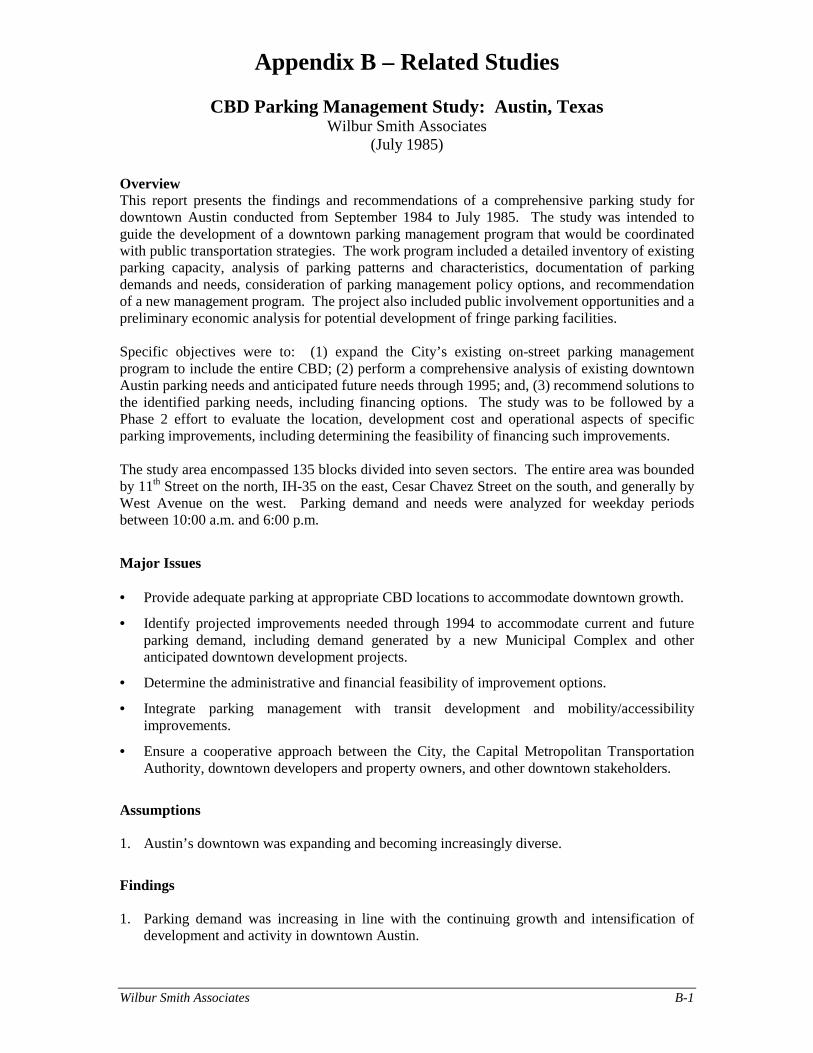
Appendix B – Related Studies
Wilbur Smith Associates B-1
CBD Parking Management Study: Austin, Texas Wilbur Smith Associates
(July 1985) Overview This report presents the findings and recommendations of a comprehensive parking study for downtown Austin conducted from September 1984 to July 1985. The study was intended to guide the development of a downtown parking management program that would be coordinated with public transportation strategies. The work program included a detailed inventory of existing parking capacity, analysis of parking patterns and characteristics, documentation of parking demands and needs, consideration of parking management policy options, and recommendation of a new management program. The project also included public involvement opportunities and a preliminary economic analysis for potential development of fringe parking facilities. Specific objectives were to: (1) expand the City’s existing on-street parking management program to include the entire CBD; (2) perform a comprehensive analysis of existing downtown Austin parking needs and anticipated future needs through 1995; and, (3) recommend solutions to the identified parking needs, including financing options. The study was to be followed by a Phase 2 effort to evaluate the location, development cost and operational aspects of specific parking improvements, including determining the feasibility of financing such improvements. The study area encompassed 135 blocks divided into seven sectors. The entire area was bounded by 11th Street on the north, IH-35 on the east, Cesar Chavez Street on the south, and generally by West Avenue on the west. Parking demand and needs were analyzed for weekday periods between 10:00 a.m. and 6:00 p.m. Major Issues • Provide adequate parking at appropriate CBD locations to accommodate downtown growth.
• Identify projected improvements needed through 1994 to accommodate current and future parking demand, including demand generated by a new Municipal Complex and other anticipated downtown development projects.
• Determine the administrative and financial feasibility of improvement options.
• Integrate parking management with transit development and mobility/accessibility improvements.
• Ensure a cooperative approach between the City, the Capital Metropolitan Transportation Authority, downtown developers and property owners, and other downtown stakeholders.
Assumptions 1. Austin’s downtown was expanding and becoming increasingly diverse.
Findings 1. Parking demand was increasing in line with the continuing growth and intensification of
development and activity in downtown Austin.
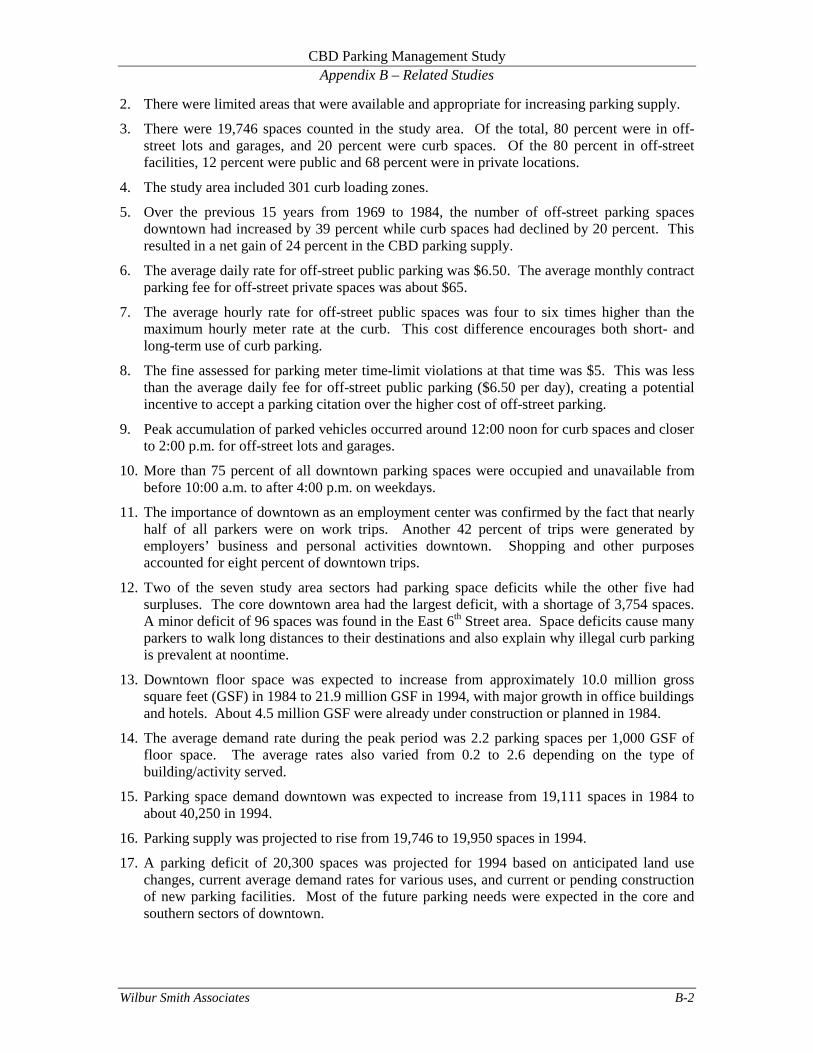
CBD Parking Management Study Appendix B – Related Studies
Wilbur Smith Associates B-2
2. There were limited areas that were available and appropriate for increasing parking supply.
3. There were 19,746 spaces counted in the study area. Of the total, 80 percent were in off-street lots and garages, and 20 percent were curb spaces. Of the 80 percent in off-street facilities, 12 percent were public and 68 percent were in private locations.
4. The study area included 301 curb loading zones.
5. Over the previous 15 years from 1969 to 1984, the number of off-street parking spaces downtown had increased by 39 percent while curb spaces had declined by 20 percent. This resulted in a net gain of 24 percent in the CBD parking supply.
6. The average daily rate for off-street public parking was $6.50. The average monthly contract parking fee for off-street private spaces was about $65.
7. The average hourly rate for off-street public spaces was four to six times higher than the maximum hourly meter rate at the curb. This cost difference encourages both short- and long-term use of curb parking.
8. The fine assessed for parking meter time-limit violations at that time was $5. This was less than the average daily fee for off-street public parking ($6.50 per day), creating a potential incentive to accept a parking citation over the higher cost of off-street parking.
9. Peak accumulation of parked vehicles occurred around 12:00 noon for curb spaces and closer to 2:00 p.m. for off-street lots and garages.
10. More than 75 percent of all downtown parking spaces were occupied and unavailable from before 10:00 a.m. to after 4:00 p.m. on weekdays.
11. The importance of downtown as an employment center was confirmed by the fact that nearly half of all parkers were on work trips. Another 42 percent of trips were generated by employers’ business and personal activities downtown. Shopping and other purposes accounted for eight percent of downtown trips.
12. Two of the seven study area sectors had parking space deficits while the other five had surpluses. The core downtown area had the largest deficit, with a shortage of 3,754 spaces. A minor deficit of 96 spaces was found in the East 6th Street area. Space deficits cause many parkers to walk long distances to their destinations and also explain why illegal curb parking is prevalent at noontime.
13. Downtown floor space was expected to increase from approximately 10.0 million gross square feet (GSF) in 1984 to 21.9 million GSF in 1994, with major growth in office buildings and hotels. About 4.5 million GSF were already under construction or planned in 1984.
14. The average demand rate during the peak period was 2.2 parking spaces per 1,000 GSF of floor space. The average rates also varied from 0.2 to 2.6 depending on the type of building/activity served.
15. Parking space demand downtown was expected to increase from 19,111 spaces in 1984 to about 40,250 in 1994.
16. Parking supply was projected to rise from 19,746 to 19,950 spaces in 1994.
17. A parking deficit of 20,300 spaces was projected for 1994 based on anticipated land use changes, current average demand rates for various uses, and current or pending construction of new parking facilities. Most of the future parking needs were expected in the core and southern sectors of downtown.
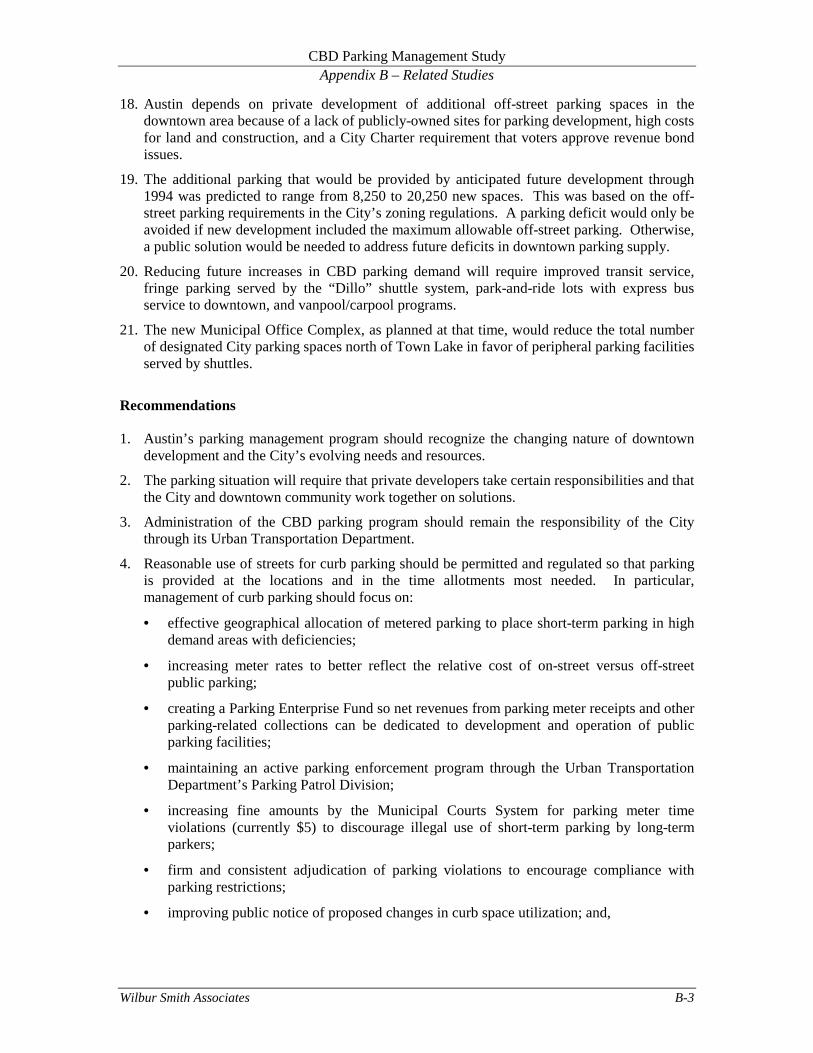
CBD Parking Management Study Appendix B – Related Studies
Wilbur Smith Associates B-3
18. Austin depends on private development of additional off-street parking spaces in the downtown area because of a lack of publicly-owned sites for parking development, high costs for land and construction, and a City Charter requirement that voters approve revenue bond issues.
19. The additional parking that would be provided by anticipated future development through 1994 was predicted to range from 8,250 to 20,250 new spaces. This was based on the off-street parking requirements in the City’s zoning regulations. A parking deficit would only be avoided if new development included the maximum allowable off-street parking. Otherwise, a public solution would be needed to address future deficits in downtown parking supply.
20. Reducing future increases in CBD parking demand will require improved transit service, fringe parking served by the “Dillo” shuttle system, park-and-ride lots with express bus service to downtown, and vanpool/carpool programs.
21. The new Municipal Office Complex, as planned at that time, would reduce the total number of designated City parking spaces north of Town Lake in favor of peripheral parking facilities served by shuttles.
Recommendations 1. Austin’s parking management program should recognize the changing nature of downtown
development and the City’s evolving needs and resources.
2. The parking situation will require that private developers take certain responsibilities and that the City and downtown community work together on solutions.
3. Administration of the CBD parking program should remain the responsibility of the City through its Urban Transportation Department.
4. Reasonable use of streets for curb parking should be permitted and regulated so that parking is provided at the locations and in the time allotments most needed. In particular, management of curb parking should focus on:
• effective geographical allocation of metered parking to place short-term parking in high demand areas with deficiencies;
• increasing meter rates to better reflect the relative cost of on-street versus off-street public parking;
• creating a Parking Enterprise Fund so net revenues from parking meter receipts and other parking-related collections can be dedicated to development and operation of public parking facilities;
• maintaining an active parking enforcement program through the Urban Transportation Department’s Parking Patrol Division;
• increasing fine amounts by the Municipal Courts System for parking meter time violations (currently $5) to discourage illegal use of short-term parking by long-term parkers;
• firm and consistent adjudication of parking violations to encourage compliance with parking restrictions;
• improving public notice of proposed changes in curb space utilization; and,
CBD Parking Management Study Appendix B – Related Studies
Wilbur Smith Associates B-4
• temporary installation of on-street angle parking in selected areas (and conversion of parallel parking to angle parking) to provide some additional capacity (but should be avoided as a permanent measure because it can contribute to traffic delays and accidents).
5. Plans for off-street parking improvements should focus on:
• more active participation by the private parking industry in CDB parking development and operations;
• providing sufficient parking in downtown development projects to meet newly-generated short-term parking needs and also help to satisfy longer-term demands (aim for 50-60 percent provision of needed parking spaces versus the current 20-60 percent range in the City’s zoning regulations);
• encouraging developers to include design elements or otherwise support transit and public parking development, especially when they provide less off-street parking than the maximum allowed under the City’s reduced and more flexible downtown parking standards (options include supporting vanpooling and ride-sharing, reserved parking spaces for vanpools/carpools, encouraging employees to park at remote lots and use shuttle service, providing employees discount transit passes, or making cash contributions to the City’s Parking Development Fund as a fee in lieu of additional parking construction);
• encouraging smaller garages tied to specific development projects versus large, complex parking structures, giving priority to staged development of larger (500-750 space) garages, and minimizing development costs by avoiding difficult sites, complex designs and elaborate architectural treatments;
• building new parking structures within convenient walking distances of the activities they serve (generally within 500 feet for short-term parking and 1,000 feet for long-term), with an appropriate mix of full-size and compact-size parking stalls, and with adequate traffic access design to accommodate peak period vehicle ingress and egress;
• providing for commercial use of ground-level floor space in parking structures, where practical; and,
• convincing owners of existing surface lots and garages with only full-size spaces to restripe their facilities to include a mix of compact-size spaces, which would increase their parking capacity and receipts.
6. Plans for public parking development should focus on:
• developing peripheral and remote (park-and-ride) parking facilities served by transit (“Dillo” shuttles and express buses) – along with overall transit service improvements – as the primary short-term solution and a lesser long-term solution for meeting additional downtown parking demand;
• developing parking specifically to serve the planned new Municipal Office Complex and proposed Civic Center;
• maintaining sufficient parking at Palmer Auditorium, no matter what changes may occur at that site, to continue and expand the “Dillo” shuttle service from the fringe parking area south of Town Lake (particularly to serve the new Municipal Office Complex); and,
• exploring options for incorporating more on-site parking into the proposed Municipal Office Complex to reduce the projected parking deficit in the CBD’s south sector.
CBD Parking Management Study Appendix B – Related Studies
Wilbur Smith Associates B-5
7. Financing arrangements for public parking development should focus on:
• using revenue bonds as the preferred method, with anticipated parking receipts as the basis for securing this financing (and recognizing that additional revenue sources and alternative financing methods might be needed to cover total development costs);
• pooling parking meter receipts and all other parking-related revenues into a single enterprise fund and increasing the City’s revenues through rate adjustments, continued intensified enforcement, and effective adjudication of parking violations;
• dedicating monies from the single enterprise fund to cover the costs of parking enforcement, operations, and debt service for future facility development;
• treating all curb and off-street public parking as a system that encompasses planning, development, operation, maintenance and enforcement activities, and combining various funding sources and methods in the same way to improve the financial feasibility of parking projects; and,
• ensuring public awareness and understanding of parking development needs and the importance of user-based financing since the City Charter requires voter approval of revenue bond issues.
8. The Austin City Council should establish a downtown parking authority according to procedures established by recently-adopted state enabling legislation since an authority could more effectively undertake the financing and development of needed public parking facilities.
Austin Convention Center Traffic Impact Analysis Appendix B – Related Studies
Wilbur Smith Associates B-6
Austin Convention Center Traffic Impact Analysis Wilbur Smith Associates
September 1989 Overview This study estimated the traffic to be generated by Austin’s proposed Convention Center, evaluated site access, and determined the adequacy of the existing and planned roadway system in the area to accommodate this traffic. Based on this analysis, recommendations were provided to improve traffic operations and site access. The traffic impact analysis focused on the existing roadway system of East Cesar Chavez (East 1st) and East 2nd Streets between I-35 and South Congress Avenue. The impact analyses were conducted in two parts to correspond to the two development phases of the new facility (through 1992 and then 1997). Parking was not a major focus of the study but was a consideration or side issue in certain elements of the report. The report focused largely on traffic circulation and access issues by analyzing existing roadways in the area, daily traffic volumes for 1988 and peak-hour volumes, current traffic operations (including turning movements and existing traffic controls), and bus routes through the area. The study also considered planned roadway improvements that would improve traffic circulation and access in the Convention Center vicinity. The report notes that adjacent parking is one of the factors that effect roadway and intersection capacity. Vehicle trip generation for the new Convention Center was estimated based on anticipated daily attendance at three types of events: (1) a local public show, (2) a state convention/trade show, and (3) a national convention/trade show. The local public show was selected as the “study event” for traffic impact analysis since this type involves the highest trip generation both in daily and peak-hour trips. Estimates of the directional distribution of approaching/departing traffic were partly based on the location of the Convention Center’s event parking. Total estimated future traffic volumes for 1992 and 1997 were calculated based on projected P.M. peak hour background traffic plus new traffic to be generated by the Convention Center. Major Issues • Provide adequate and convenient parking (curbside and structured) for visitors and employees
at the new Convention Center.
• Provide pick-up/drop-off areas and transit options to enable non-vehicular access to the new facility.
• Maintain adequate roadway and intersection capacity to accommodate projected traffic increases (in both background and Center-related traffic), with on-street parking being one factor that can affect capacity.
• Provide for off-street truck loading/unloading activity.
Assumptions 1. Assumed a six-block development site in the southeast portion of the CBD, bounded by East
Cesar Chavez, Trinity, East 4th and Red River streets. Phase 1 would be on the four blocks south of East 3rd Street.

Austin Convention Center Traffic Impact Analysis Appendix B – Related Studies
Wilbur Smith Associates B-7
2. Assumed a Phase 1 Convention Center development program of 130,000 square feet of floor area, with an additional 100,000 square feet being added in Phase 2. The conceptual site plan also called for passenger drop-off/pick-up areas on East Cesar Chavezt and Trinity streets for automobiles and on the south side of 3rd Street for buses and taxis.
3. Assumed that Convention Center parking demand would be met in the immediate area surrounding the site and that the Congress Center Parking Garage would handle most, if not all, of this demand.
4. Assumed that the Convention Center would host 32 events in 1992 and 45 events in 1997, and concurrent events were considered a rare possibility.
5. Assumed that the weekday P.M. peak period was the critical time for trip generation and traffic impact analysis.
6. Assumed that 10 percent of attendees would use transit, the average number of persons per vehicle would be 2.5 persons, and 20 percent of event attendance would occur in the afternoon peak hour.
7. Assumed that background traffic volumes in the area (from existing plus new development) would increase by one percent per year through Phase 1 (1992), reflecting slow recovery in traffic growth following Austin’s 1980s economic recession, and two percent annual growth through Phase 2 development (1997).
Findings 1. The City and the Capital Metropolitan Transportation Authority were pursuing an agreement
with the owners of the Congress Center Parking Garage to provide Convention Center parking and also develop an adjacent transit terminal. The existing parking structure was located one block west of the site with access from East 2nd, San Jacinto and Brazos streets.
2. Parallel curb parking was allowed at the time on both sides of East 2nd Street, San Jacinto Street, Trinity Street, Neches Street, and Brazos Street, which also bordered the west side of the Congress Center Parking Garage.
3. A planned conversion of the East Cesar Chavez/2nd Street one-way couplet to two-way operation (later implemented in August 1989) would result in one travel lane in each direction on each street and curb parking along both sides of the streets.
4. Calculated a total daily attendance of 4,050 people for a local public show (with events lasting an average of four days), resulting in 2,920 new daily vehicle trips and 580 trips during the P.M. peak hour due to the new facility. By Phase 2 in 1997, the numbers would be 3,170 vehicle trips per day and 630 trips during the P.M. peak hour.
5. Peak truck and service vehicle traffic would occur primarily during the “move-in” and “move-out” days before and after an event. Also, peak truck traffic would tend to occur at different times than peak traffic periods on area roadways. The Convention Center site plan included an off-street truck loading area, indicating that on-street parking should not be affected by any significant curbside truck loading/unloading.
6. Transit ridership by Convention Center patrons could be significant for non-local events that provide shuttle bus service to and from area hotels. Ridership on the “Dillo” trolley service was also expected to increase due to local and non-local events. Flexibility in bus and “Dillo” routes and schedules would allow for adjustments to accommodate greater transit demand during larger events. The Convention Center plan included transit loading/unloading space at one point during Phase 1 (East 3rd Street) and an additional point after Phase 2 (East
Austin Convention Center Traffic Impact Analysis Appendix B – Related Studies
Wilbur Smith Associates B-8
4th Street). A potential transit terminal adjacent to the Congress Center Parking Garage, one block from the Convention Center, would provide transit access for local service plus event-related charter buses.
7. Area traffic increases between 1992 and 1997 would be due primarily to growth in background traffic rather than new traffic generated by the Convention Center.
Recommendations No recommendations related to parking issues.

Solutions to Downtown Parking Appendix B – Related Studies
Wilbur Smith Associates B-9
Solutions to Downtown Parking: A Healthy Environment, A Healthy Bottom Line
Downtown Austin Alliance (Undated)
Overview This pamphlet advocates various actions to change commuter “driving patterns” in the face of strong projected traffic growth in the Austin region. The Alliance notes that increasing traffic volume and congestion will only add to the perception of a parking shortage in Downtown Austin. The pamphlet is intended to assist businesses to develop solutions to current and future parking problems, noting that such actions can benefit businesses and individuals financially while also easing traffic problems. The Alliance’s underlying goal is to maintain Downtown Austin as one of the nation’s most economically viable downtowns. The pamphlet provides mini case studies on downtown employers who have developed creative parking solutions. In addition to the Downtown Austin Alliance, the pamphlet also refers businesses and individuals to several other sources for more information: Capital Metro, the City of Austin Bicycle and Pedestrian Coordinator (locations of bike racks and suggested bike routes), and the Austin Transportation Study Commute Solutions. Major Issues • Convince businesses and their employees to consider alternate commuting options that will
reduce traffic congestion and downtown parking demand.
• Demonstrate the business and personal financial benefits of certain commuting options (through government-provided incentives and reduced costs).
• Provide convenient and affordable options to persuade employees to change their habits.
Assumptions 1. Traffic volume in the five-county region will more than double by 2020 if current driving
patterns continue. However, road capacity will only increase 32 percent from 1990 to 2020.
2. Nearly 60,000 employees commute to and from Downtown Austin every day.
3. A 1997 Austin Transportation Study survey of 1,200 commuters determined that 81 percent drive alone to work. Only eight percent reported riding a bus, and two percent carpooled (compared to 40 percent of downtown workers using mass transit in Portland). Ninety percent said their employers offered no subsidy for Capital Metro bus passes, and 82 percent said that car and van pools do not receive preferential parking. Sixty-three percent of those who drive alone said they would join a carpool – and 31 percent said they would ride the bus – if their employers changed policy and provided financial incentives.
4. Cites data from the American Automobile Association comparing the typical monthly cost of a bus pass ($10), a van pool ($25), a small-car commute ($89.46), a medium-car commute ($102.69) and a large-car commute ($127.05). AAA also estimates that a person commuting 10 miles each way every day alone in a mid-size sedan spends more than $200 per month, not including any parking fees.
Solutions to Downtown Parking Appendix B – Related Studies
Wilbur Smith Associates B-10
5. The Austin area could approach air quality non-attainment status in the near future, with all the associated regulatory restrictions and penalties affecting businesses and individuals.
Findings 1. Parking consistently tops public opinion surveys as downtown’s biggest drawback.
2. Austin businesses that subsidize employee parking pay anywhere from $40 to $120 per month per employee, which can be cost prohibitive.
3. Two of Austin’s most popular commuting alternatives – van pools and Capital Metro bus passes – can be tax deductible for both the employer and employee. Under the 1993 Commuter Transit Benefit of the federal Comprehensive National Energy Strategy law, employees can receive up to $65 per month to use toward van pool or bus pass expenses. This amount may be deducted as a business expense and does not count as taxable income for the employee.
4. Capital Metro van pools cost $25 per person per month, with maintenance, insurance and roadside service provided by the Authority. The “Downtown Database” can match an employee with others who work in the same building or block (by calling 477-RIDE).
5. Monthly Capital Metro bus passes cost $10 for regular routes and $17 for express routes, and the passes may be purchased at various convenient locations, including the CMTA Customer Service Center at 106 East 8th Street.
6. All Capital Metro bus rides are free on ozone action days in Austin.
7. All Capital Metro buses have bike racks to encourage people to ride bicycles to bus stops.
8. Capital Metro has six “Teleride Zones” in which people can catch a van near their home and be transported to a designated bus stop. The zones extend as far south as San Leanna and north to Leander/Cedar Park.
9. The City of Austin Bicycle and Pedestrian Coordinator can provide free bike racks.
10. A lack of communication is one reason that more commuters do not use the transportation alternatives readily available to them.
11. Employers and building owners/managers can have a great impact by changing their parking policies and creating tangible incentives to induce commuters to stop driving alone. AIM Management provides a $50 monthly stipend to most employees rather than paying for parking (and employees can make money by using low-cost options). AIM also reserves preferred indoor parking for van pools. Dazel Corporation coordinates car pooling among its employees through address matching. Dazel also places its out-of-town visitors in downtown hotels and provides them “Dillo” schedules (and highlights downtown’s night life). The City of Austin, as one of downtown’s largest employers, subsidizes most or all of the cost of Capital Metro van pools and bus passes for its employees. The Downtown Austin Alliance offers its employees $45 per month instead of using free parking.
12. Because downtown Austin is the region’s largest and densest employment center, commuting adjustments by just a small percentage of downtown employees would have immediate benefits for all of Central Texas as well as downtown Austin in terms of thousands of fewer vehicles, shorter commute times, cleaner air, more parking for visitors and clients/customers, more convenient parking spaces for car pools and van pools, and added convenience and safety for downtown pedestrians. This size and density also provides opportunities for change through car and van pools and the many bus routes to and through downtown.

Solutions to Downtown Parking Appendix B – Related Studies
Wilbur Smith Associates B-11
Recommendations 1. Businesses should explore various ways to encourage their employees to consider other
commuting options that will reduce vehicle trips, especially single-occupancy trips, and parking demand.
2. Businesses should support and employees should consider several low-cost, convenient transportation options: “Dillo” routes (free rides, connections to park-and-ride lots near downtown*), car pools (can be coordinated by employers or employees using Capital Metro’s “Downtown Database”), and walking/bicycling (also provides regular cardiovascular exercise).
3. Businesses can support alternate commuting options by making changing rooms and showers available to employees who walk or bicycle and by offering a seasonal change in dress code.
4. Businesses should educate their employees on the financial and other costs of driving alone to work (wear and tear of stop-and-go driving, gasoline expense, car depreciation with high mileage, insurance costs, lost time and stress of traffic congestion) and the savings from other alternatives.
* “Dillo” service from Palmer Auditorium has been discontinued since the publication of this pamphlet.
Austin Metropolitan Area 2020 Transportation Plan - Executive Summary Appendix B – Related Studies
Wilbur Smith Associates B-12
Austin Metropolitan Area 2020 Transportation Plan Executive Summary
Capital Area Metropolitan Planning Organization (formerly the Austin Transportation Study) December 1994 (amended February 1999)
Overview The updated Austin Metropolitan Area Transportation Plan is a planning guide for transportation projects and policies through the year 2020. It encompasses all issues and modes of transportation, including roadways, freight, congestion/demand management, transit, bicycles, trails, and pedestrians. The plan is financially constrained, meaning that all the transportation projects included in this plan have been matched with appropriate funding sources. Major Issues • Reducing the amount of single-occupant vehicles, especially during peak traffic periods.
• Encouraging changes in travel behavior through transportation alternatives and programs, and also influencing land use trends.
Assumptions 1. To maintain personal mobility, need to reduce the amount of single-occupant vehicles and
increase transit ridership, ridesharing, bicycling, and walking.
2. Need to lengthen the AM and PM peak travel periods to distribute vehicle trips and traffic over a longer time frame.
3. The Austin Transportation Study made a policy commitment to not destroy inner city neighborhoods by widening roadways, so the priority is on increasing person-carrying capacity instead of vehicle capacity.
4. The automobile transportation system involves four basic resources, two of which are plentiful and relatively inexpensive (cars and gas) and two that are in short supply (roadway capacity and air quality). Changes in travel behavior are imperative to the well being of Austin’s population.
Findings 1. The planning and implementation process includes five primary elements: public
transportation, congestion/demand management, bicycles/pedestrians/trails, roadways, and freight movement. All of these are interdependent and interrelated.
2. The following is a condensed Austin Transportation Study statement on public transportation: “We envision a multimodal transportation system which provides ease of mobility throughout the Austin metropolitan area ... contributes to clean air and water ... the health and economic environment … and effective traffic programs, particularly those aimed at reducing single-occupancy vehicle travel and peak hour congestion …”
3. Congestion/Demand Management – The purpose of this element is to increase vehicular occupancy, reduce vehicle trips, and improve mobility and safety.
Austin Metropolitan Area 2020 Transportation Plan - Executive Summary Appendix B – Related Studies
Wilbur Smith Associates B-13
4. Bicycles/Pedestrians/Trails – Bicycling and walking must be compatible with other modes of travel. A policy to be implemented is to design all roadways so they do not legally prohibit advanced bicyclists (as designed by the Federal Highway Administration guide).
5. Roadways – Factors used to evaluate the proposed roadway network included the impact of freight traffic, impacts to neighborhoods, environmental impacts, fiscal constraints, and increasing levels of congestion. As an alternative to widening the major freeway facilities, high-occupancy vehicle (HOV) facilities will be recommended for many of the routes.
6. Freight movement – Efficiency of freight movement is critical, especially where freight transporters and passenger vehicles use the same corridor. Recommended policies reflect these issues.
Recommendations The reduction of single-occupancy travel will greatly assist in the present and projected downtown parking situation.

Downtown Parking Inventory Appendix B – Related Studies
Wilbur Smith Associates B-14
Downtown Parking Inventory Christine Rapalje
Downtown Austin Alliance Issue Paper No. 1
(August 1994) Overview This brief report presents the results of a block-by-block inventory of off-street parking in Austin’s Downtown Public Improvement District (156 blocks in all, not tied to any official block numbering system). The District encompasses much of the core downtown area within a boundary roughly from I-35 west to San Antonio Street and from Town Lake north to Martin Luther King Boulevard (including some partial blocks on the western edge). Several major properties near Congress Avenue on the south side of Town Lake were also inventoried, including the Hyatt Regency and Embassy Suites hotels and the Austin-American Statesman site. The survey was conducted from June to August 1994 in the hours between 8:00 a.m. and 1:00 p.m. Information was also collected from various property management firms, parking companies, and the Texas Department of Public Safety for state parking facilities. The author notes that this report does not answer the question of how much parking is sufficient for downtown. Instead, it provides insights on potential ways to improve the overall parking situation based on information compiled on the name, location, size (number of regular and handicapped spaces), fees (monthly, daily, hourly), policies (public-use availability), operations (hours), and key contacts for existing facilities. On-street parking regulated by municipal meters and signs was not included in the inventory, but on-street spaces reserved for specific businesses or tenants were counted. The inventory spreadsheet also includes field notes on each parking facility. Major Issues • Need to determine if the perceived “shortage” of downtown parking is due to inadequate
supply or to other factors such as restrictions on public use or prohibitive parking fees.
• Need strategies for better managing the available parking supply if location, cost or use restrictions are causing a major imbalance between demand and supply. However, some solutions may be difficult since so much of the parking supply is in private ownership and dedicated for specific users.
• Need to consider daytime versus nightime parking needs and supply and management options.
Assumptions This inventory report does not include any stated assumptions.
Findings 1. There is a widely held perception among downtown workers and visitors that downtown
Austin lacks adequate parking.
Downtown Parking Inventory Appendix B – Related Studies
Wilbur Smith Associates B-15
2. The inventory counted 38,062 parking spaces in all. Approximately 29 percent of these spaces were in restricted garages affiliated with specific buildings or businesses. State government parking accounted for another 29 percent of the total and is scattered among various lots, garages and small areas outside building entrances. About 14 percent of the parking space total was in garages which offer public parking. Commercial lots operated by Classified, Allright or Central Parking represented approximately seven percent of the parking supply. Parking for City and County buildings was another five percent of the total. All other types of off-street parking accounted for the final 16 percent of the total and were mostly for limited use, including alley parking and lot spaces designated for employees, tenants or customers.
3. Survey observations indicated that most parking facilities were, in fact, full or nearly full during business hours.
4. Many parking contractors indicated that their facilities were at or near capacity, with some having a waiting list for monthly parking permits.
5. The strong demand for monthly parking appeared to be affecting the supply of spaces available on an hourly or daily basis.
6. In garages and lots which accommodate visitor/public parking in addition to their monthly/contract parking, the availability of public spaces was often limited by the extent of monthly use.
7. Some parking facilities affiliated with a particular building limit non-contract parking only to visitors and clients to that destination. It is sometimes difficult to enforce such a policy, but formal restrictions usually are effective in limiting daily or hourly use by outsiders.
8. While some private facilities are at capacity during the day, they are closed in the evening when downtown Austin is busy with nighttime entertainment activities. The availability of some facilities to after-hours visitors is often ambiguous because some garages are unlocked but do not formally offer their space for public use. Certain facilities post notices of a 24-hour towing policy, and some tow regularly while others rarely follow through. Some that generally do not tow nonetheless do not advertise any public availability. Security considerations are a key reason for reluctance by facility owners/operators.
9. The State has a specific policy of making its parking facilities available for public use after hours (between 6:00 p.m. and 7:00 a.m. on weekdays and at all times on weekends and holidays). However, not all facilities are included for security reasons (under or attached to buildings or on the Capitol grounds) or because spaces are always reserved for certain officials. Texas Employment Commission facilities also fall outside of standard State parking policies because of federal funding conditions. Based on these restrictions, approximately 70 percent of the inventoried State facilities – or nearly 7,600 spaces – were available for free public use after hours. However, many of these areas were not clearly labeled as such. Only persons native to or familiar with Austin may be aware that they can use these areas. The report includes a list of State parking facilities that are open for public use after hours. The Department of Public Safety noted that facilities near the Capitol are more intensively used by state officials and staff during legislative sessions.
10. Rate information indicated considerable variation in the cost of downtown parking. Garages for new office buildings in the central Congress Avenue corridor were typically the most expensive, with monthly rates around $75 for unreserved spaces, $125 for reserved, and a daily rate of about $8. Rates were generally lower in less centrally located facilities, with monthly rates around $60. Lot parking is less expensive than garage parking and also varies by location within downtown. Monthly rates at commercial lots in the central downtown area
Downtown Parking Inventory Appendix B – Related Studies
Wilbur Smith Associates B-16
were typically in the $50 to $60 range while lots on the periphery were as low as $20. Daily rates at the lots ranged from about $3.50 at Congress Avenue to about $1 in the outer areas. In addition, parking rates appeared to change regularly and could have fluctuated even during the three-month study period.
11. The downtown area actually has more parking spaces reserved for handicapped persons than those counted in the inventory because some facilities make special space assignments for disabled clients in addition to their spaces which are already clearly marked for handicapped use. Some facility managers also could not provide an exact count for their site. In addition, the inventory reflects the number of special permits issued by the State of Texas for its disabled employees versus a number of designated spaces.
Recommendations 1. Downtown parking capacity might be more efficiently used by clarifying any formal policies
or restrictions for potential users.
2. More parking supply could be made available after hours if currently restricted facilities were opened to evening visitors to downtown. This would require negotiation with facility owners/managers regarding security concerns and parking rates. The potential for additional parking revenue should also be emphasized.

Greenways and Trails: A Vision for Greater Austin Appendix B – Related Studies
Wilbur Smith Associates B-17
Greenways and Trails: A Vision for Greater Austin Austin Metropolitan Trails Council
(1996) Overview This pamphlet highlights how trails provide numerous benefits to the areas in which they are located. For example, they provide opportunities for non-motorized travel between home and employment, shopping areas, cultural sites, and schools. Trails also provide a safer manner of travel for pedestrians and bicyclists than thoroughfares and streets. The pamphlet lists the goals of the Austin Metropolitan Trails Council (AMTC), actions an individual or organization can take to help attain the goals, the key benefits of trails, and a brief description of the major trails that are most likely to be implemented in the greater Austin area. Major Issues • Improve conditions for all types of non-motorized travel.
• Provide safe and continuous routes by linking existing and new trails.
• Provide an aesthetic environment and means for people to traverse their neighborhood.
• Select multi-purpose corridors (i.e., ones that provide habitat protection, flood protection, open space conservation, etc.).
• Assess needs and implement trail projects based on public priorities.
• Identify sources for funding.
Assumptions 1. Transportation – Trails provide direct routes for bicyclists and pedestrians and, in conjunction
with other modes of transportation, have the potential to reduce traffic congestion, noise pollution, and the need to build additional parking lots.
2. Recreation – Trails are located adjacent to a variety of aesthetically pleasing environs and provide opportunities for people to hike, bike, and bird watch.
3. Education – Trails connect people to historic places, educational centers, wildlife refuges, archaeological sites, and nature preserves.
4. Economic Benefits – Trails increase the value of properties adjacent to them.
5. Resource Conservation – Trails protect both flora and fauna by preservation, provide open and green spaces, and reduce the impact of flooding by providing a buffer to development.
6. Community – Trails provide an avenue for people to interact with one another.
Recommendations No recommendations specifically related to downtown parking issues.
New Visions of East Austin Appendix B – Related Studies
Wilbur Smith Associates B-18
New Visions of East Austin: Central East Austin Master Plan and
East 11th & 12th Streets Community Redevelopment Plan Austin Revitalization Authority
Prepared by: Crane Urban Design Team January 1999
Overview This three-year study represents the combined input of community workshops, surveys, a visioning process, and detailed planning analysis. Numerous community work sessions were held with local residents, business and property owners, governmental interest representatives, etc. and the resulting product is this plan for Central East Austin to guide its decision/policy making for economic, social and cultural decisions. The study area is bounded by Martin Luther King on the north, Singleton and Northwestern on the east, East 7th on the south, and I-35 on the west. It is located directly east of the Downtown CBD, University of Texas, and the State Capitol. The study area is divided into eleven subareas which are predominately residential in character with the exception of the East 11th and 12th Streets Corridors, which have been designated by the City of Austin as formal Urban Redevelopment Areas. This report focuses on plans for both the entire study area (the Central East Austin Master Plan – CEAMP) as well as the redevelopment areas (Community Redevelopment Program – CRP) located within the CEAMP. Major Issues • The CEAMP’s primary focus is on eliminating blight (e.g., vacant land, deteriorated or
dilapidated buildings, tax delinquency) while trying to maintain the historic nature of the neighborhoods.
• Within the CEAMP’s boundaries, 24% of the total parcels of land are vacant; 43% of all parcels with buildings are categorized as dilapidated, deteriorated, or substandard; and 15% are found to have unpaid taxes of more than $100.
• The CRP’s major focus is to restore the different land uses along the East 11th and 12th Street corridors. East 11th Street is envisioned as a visitor attraction with entertainment and music that will also attract local residents. East 12th Street is projected as a combination of uses that include office, retail, and residential which mainly serve the immediate community.
• Within the CRP’s boundaries, 40% of the total parcels of land are vacant; 27% of all parcels are classified as dilapidated, deteriorated, or substandard; 45% of the parcels have buildings that are either dilapidated, deteriorated, or substandard; and 15% have unpaid taxes for a year or more. The local tax debt is $100,700, while the fair market value of the delinquent parcels is approximately $698,000.
Assumptions 1. Implementation of the CRP will be between the Central East Austin community, the City of
Austin, and private sector lenders, investors, and institutions and will be headed by the Austin Revitalization Authority.
2. Redevelopment actions need to occur simultaneously in both the East 11th and 12th Street areas and the surrounding support areas (CEAMP’s boundaries).
New Visions of East Austin Appendix B – Related Studies
Wilbur Smith Associates B-19
3. For success, efforts for both of these areas must be supported by private investment.
4. Create a link to the CBD and State Capitol – what occurs in the CBD will affect what will occur in Central East Austin.
5. Properties along the I-35 Frontage Road (between 7th and 12th Streets) offer opportunities for higher density mixed uses that could include multi-family housing, retail, and businesses.
6. Additional open spaces and public park areas (both active and passive) are needed within the study area.
Findings 1. Policy and program recommendations are categorized by housing development assistance,
economic development assistance, urban blight remediation, historic conservation, and capital improvement program budgeting. These include tax-free mortgage revenue bond financing for mixed income housing, revenue allocation bond financing and private sector small business programs for economic development, and creating a preservation fund and permitting incentives for historic properties.
2. Blight remediation programs include a code enforcement program, rehabilitation and demolition program and an approach to eliminating tax delinquent properties. Community based programs such as “clean-and-green” and “paint-up/fix-up” for blight removal are also included.
3. Land use programs will preserve the majority of the CEAMP’s area as single-family residential, and the east-west corridors need to have mixed use development (retail, office, and limited housing). Pedestrian improvements such as sidewalks and streetscape improvements need to be implemented, in particular along I-35 to provide access into the adjacent CBD.
4. Efforts should be made to extend the “Dillo” shuttle to include the East 11th and 12th Street corridors which will help link the commercial establishments with the CBD.
5. Relocate I-35 so it is at-grade which will remove both the physical and psychological barrier between East Central Austin and the CBD.
6. Need to employ private investment incentives and controls for both areas. Even though there are considerable deficiencies in both areas, the existing characteristics of buildings, land uses, infrastructure, and public services are basically sound and capable of supporting community wide improvement strategies.
7. The major redevelopment areas are on East 11th and East 12th Streets, and along the I-35 frontage sites to the north and south of East 11th Street.
8. The residential revitalization action plan has a price tag of approximately $60 million, and the non-residential revitalization action plan costs approximately $58 million.
Recommendations For residential parking, it was suggested that it should be behind the house with access from side streets or alleys. Garages facing towards the street are discouraged. In non-residential areas, parking lots, decks, and building service areas should be located behind the businesses with access from side streets or alleys. These areas should be adequately lit without disturbing residential areas, and they should be screened/landscaped to provide a buffer between the sidewalk, parking area, and residential use.
New Visions of East Austin Appendix B – Related Studies
Wilbur Smith Associates B-20
For the redevelopment areas, community or shared parking is encouraged and should be orchestrated through parking management plans. If a parking garage is required, it should be consistent with the appearance of other buildings and not be directly accessed from 11th or 12th Streets.
Downtown Regulatory and Infrastructure Issues Appendix B – Related Studies
Wilbur Smith Associates B-21
Downtown Regulatory and Infrastructure Issues Shelly Branch, Editor
Downtown Austin Alliance Issue Paper No. 5
(August 1995) Overview This report presents regulatory and infrastructure issues in three major categories: (1) parking in Austin; (2) streamlining the development review process; and, (3) Austin’s Warehouse District. This summary focuses on the first category. Downtown Austin has a critical shortage of parking spaces, especially during the daytime hours. For those who need parking longer than metered parking will provide, they must rely on their employer or the business that they are visiting or find an off-street facility. This, in turn, limits new development potential in downtown as well as revitalization efforts. To address the parking shortage in Austin the focus must be on either supply (increasing the efficiency and availability of parking spaces) or demand (reducing the number of people requiring parking). This report outlines alternatives that are comprehensive and would reduce both the supply required and the demand to be satisfied. If the single-occupancy vehicle remains predominant, then additional parking spaces will be needed. To delay the construction of new parking, alternatives to automobile transportation such as light rail, shared parking, and a viable transit system should be studied. Major Issues • The massive regulatory framework required for parking management.
• The increasing demand for parking by suburban commuters and the prohibitive cost of accommodating that demand.
• Meeting parking requirements without ruining Austin’s landscape.
• Controversy over the single-occupancy vehicle being the primary form of transportation.
• Because of the shortage of public parking, consumers will avoid downtown and instead go to malls and strip centers where there is an abundance of parking. Parking facilities are imperative for an area’s success – “People think parking lots are not very important, but the first impression and the final memory are created there” (Gallagher 1991). Austin has over 1.5 million visitors annually, and the frustration of parking could lead to an adverse economic impact.
Assumptions 1. Incentive for making changes to Austin’s downtown parking will more than likely stem from
the economic vitality of the City rather than from Clean Air mandates that other cities have experienced.
2. Developers prefer properties outside the CBD because the construction of parking spaces is more affordable.
Downtown Regulatory and Infrastructure Issues Appendix B – Related Studies
Wilbur Smith Associates B-22
Findings 1. The regulatory framework is the primary force affecting the parking situation in Austin. The
three major components – local property taxation and downtown land development, parking requirements for structures, and design requirements – affect the ability to provide adequate downtown parking.
2. Property taxes are based on the appraised value of the land plus the value of any improvements. The property tax for an empty downtown lot is based on the value of the land, not the value if it was developed as zoned. Developers buy the land and, while waiting for market improvements, utilize the land as a parking area which will generate income. This tax method acts as a disincentive to developing downtown parcels. These parking facilities are not long-term or planned as part of any long-term solution, and downtown property needs to be developed to generate ad valorem taxes for the local governments as well as maintaining downtown’s economic vitality.
3. Due to the high cost of land in the CBD, parking requirements for downtown Austin are lower than in the suburban or rural areas. The minimum parking requirement in the CBD is 20% of what is required outside the CBD, and the maximum number of spaces allowed is 60% of what is permitted outside the CBD. These limits are set to keep the CBD from being overrun with parking areas and to encourage other means of mobility.
4. Design requirements for parking facilities still reflect “old school” thinking that parking is the same as any infrastructure component. Parking lots in downtown Austin are rarely screened from public view, and the garages can be viewed as concrete monoliths. Standards should be applied to soften the appearance of these facilities.
5. A downtown parking inventory was conducted by the DAA in 1994. Refer to the summary paper “Downtown Parking Inventory” by Christine Rapalje (Issue Paper No. 1) for the findings.
6. Nationwide, the preference for an automobile has increased and the average number of people sharing a vehicle has decreased.
Recommendations 1. The current design of parking facilities tarnishes the image of downtown Austin. They
occupy developable land and disrupt the activities of the CBD. As now required by code, all parking lots should have shrubs and trees planted around the perimeter to lessen the visual impact for both pedestrians and drivers. Parking structures that face a primary pedestrian corridor should have retail in at least half of the ground-level area. The materials used to construct the garage should blend in with the rest of the adjacent structures.
2. Austin could conduct a study to determine to what extent it would be practical to reduce downtown parking requirements.
3. The enforcement of on-street metering should be monitored carefully. One prevalent complaint from citizens and surveys is that short-term meters are used by single vehicles all day long. Parking should be restricted to two-hour limits within the CBD and five-hour limits on the fringe at a uniform rate of $0.75/hour. Electronic meters should eventually be phased in.
4. Consider public investment in downtown parking – either the City or another legal authority could invest and in return have the power to establish a coordinated system of parking

Downtown Regulatory and Infrastructure Issues Appendix B – Related Studies
Wilbur Smith Associates B-23
facilities; design, construct and own or lease parking facilities; exercise the power of eminent domain; and, borrow money for these goals. Downtown businesses could distribute handouts to consumers that show the locations of these parking facilities.
5. Experiment with shared parking, which is defined as “a parking space that can be used to serve two or more individual land uses without conflict or encroachment.” An example is to provide office parking from 8:00 a.m. to 5:00 p.m. and then let retail establishments use the parking area after this time. This capitalizes on the existing parking capacity. This strategy is most effective in mixed-use developments.
6. The “Dillo” shuttle service should have more destinations in downtown Austin. More destinations could help overcome the attitude that bus service is a social service rather than a transportation service.
7. Other alternatives include the promotion of downtown residential development and the adoption of urban guidelines that promote other transportation modes.
South Congress Improvement Project: Enhancement Guidelines Appendix B – Related Studies
Wilbur Smith Associates B-24
South Congress Improvement Project: Enhancement Guidelines Sponsored by the Capital Metropolitan Transportation Authority
Produced by The Avenue Team January 1999
Overview This study examines the South Congress Avenue corridor and provides recommendations on how to prepare for the impacts of current and future revitalization efforts. The project limits are from Town Lake south to Ben White Boulevard, and one-half block east and west of the corridor. The length of the corridor is approximately 2.7 miles. South Congress Avenue is one of the most historic streets in Austin and the second most heavily traveled public transportation corridor in the city. Current revitalization efforts from the small businesses have created a great deal of pedestrian activity, particularly in the northern portion of the corridor. In order to prepare for this renewed activity and the population projections of the city, area stakeholders formed the South Congress Improvement Project in 1995. In 1998, the Capital Metropolitan Transportation Authority (Capital Metro) hired a consultant team (The Avenue Team) to determine the overall vision for this corridor. This report provides guidelines for development and redevelopment, and areas where development and redevelopment could possible occur. Major Issues • Workshops were conducted with the community and the following were the primary issues
identified: crime and personal safety; transportation (both public and private modes); streetscapes and the pedestrian environment; neighborhood associations and plans; land use, zoning and new development; history and future visions; business improvement, retention, and recruitment; and community resources and facilities. A separate report was generated in July 1998 entitled “Development & Implementation of Community Input Process” which elaborated on these concerns.
• Funding sources (both private and public) were examined and those that were considered plausible were tagged with a particular recommendation. A report titled “Identification of Funding Sources and Strategies” was produced in July 1998 which lists the funding sources, monies available, types of fundable projects, etc. In summary, funds need to come from a variety of sources including federal, regional, and local governments, and from foundations to private development.
• Need to prepare for the future development in the corridor and simultaneously preserve the charm and traits of the existing corridor.
Assumptions 1. The South Congress Avenue corridor is divided into two segments – the northern and
southern segments. The northern segment starts at Live Oak Avenue (which is the old southern city limit) and continues north to Town Lake, and the southern segment extends from Live Oak Avenue south to Ben White Boulevard.
2. The northern segment is very pedestrian oriented and very little has changed since the 1930s. Businesses in that area consist of antique stores, galleries, art shops, restaurants, and bakeries. This section represents the “Main Street” characteristics that are part of the attraction of the corridor.
South Congress Improvement Project: Enhancement Guidelines Appendix B – Related Studies
Wilbur Smith Associates B-25
3. The southern segment consists of automobile related businesses, small motels, a few restaurants, and large vacant tracts of land. This area is in the process of having roadway improvement projects from Oltorf Street to Ben White Boulevard. These segments are further broken down into six nodes which have their own distinct character.
4. South Congress Avenue has the greatest potential of any street in Austin, or even in Texas, to achieve the status of being a “great street”. A “great street” is considered to have a pleasing physical environment; in particular for this corridor, the recommendations suggest that it should provide people the ability to experience a “punctuated promenade” which is a pleasurable stroll in conjunction with nodes of interest. It is recommended that transit stops be located at these nodes.
5. The guidelines suggest more pedestrian-oriented uses along the street and to have off-street parking behind the buildings.
Findings 1. The following are the issues and recommendations of providing information pertaining to the
historical nature of the corridor: A) except in connection to the Capitol, the history of this road and its buildings are basically unknown – recommends illustrating the historical nature of the corridor with physical items describing its history at the six nodes; B) South Congress Avenue provides the best remaining unobstructed view of the State Capitol Building – recommends making sure planned improvements do not interfere with this view; C) historic character of the Avenue is being destroyed – need to encourage owners of potential City of Austin landmarks to apply for and receive landmark status; D) present the corridor’s historical development as a commercial and residential corridor – need to apply for the National Register of Historic Places “Multiple Property Nomination” for both commercial and residential development, and initiate a program that historians and artisans could implement that would illustrate the historical development of the corridor; E) many of the historic structures have been modified beyond recognition over the years – encourage façade restoration to reveal the qualities of the original work where possible; F) to remain economically viable, some of the historically significant structures need to accommodate new uses and growth – design improvements and infill structures be used to complement the existing historic corridor; G) many of the older buildings are being enhanced in an unusual manner which continues to contribute to the eclectic nature of the corridor – allow the owners and encourage local artists to continue their designs on the buildings, also designate advocates from the South Hill Alliance to promote restoration and renovation that is of particular interest to the goals.
2. The following are the primary issues and recommendations pertaining to the neighborhoods and communities of the corridor: A) prostitution and related problems as well as deteriorated surroundings are some of the major community nuisances – all citizens need to report crime and destroying of property; B) community facilities need to be expanded by an extended branch library, the redevelopment of the old Austin Theatre, improved post offices and more greenbelt trails and parks – need to assign project liaisons from the future South Congress Alliance to each current and future project.
3. The following is the primary issue and recommendations pertaining to the land use and zoning of the corridor: A) future development in conjunction with the proposed light rail on South Congress could cause compatibility problems with commercial and neighborhood interests – need to establish “overlay redevelopment corridors and nodes” that apply land use
South Congress Improvement Project: Enhancement Guidelines Appendix B – Related Studies
Wilbur Smith Associates B-26
and transportation planning principles to the individual conditions and coordinate this with Capital Metro’s transit service planning efforts.
4. The following are the primary issues and recommendations pertaining to the transportation and streetscape of the corridor: A) pedestrian and bicycle modes – despite efforts to encourage pedestrian activity, much of South Congress presents a hazardous environment for this activity – need to develop this area into a “great street” which emphasizes and encourages pedestrian movements and in the short term implement cost effective improvements, and in the long term plan on solutions that could include light rail service; B) the improvements to South Congress done by TxDOT in the summer of 1999 have not provided for transit and pedestrian improvements – work with the City of Austin for improving the short term projects and plan for a transit system in the long term.
5. The following is the primary issue and recommendations pertaining to the redevelopment strategies of the corridor: A) there are a varied group of members in the South Congress corridor – economic development should be coordinated with these multi-faceted groups; and, need to establish an umbrella organization to coordinate this effort.
Recommendations Parking is recommended to be located behind the buildings to favor a more pleasurable motorist and pedestrian experience; where it is located on the street the spaces are recommended to be at 30 degree angles or to have parallel parking.
APPENDIX C:
Parking Utilization Survey Data

Facility No.Facility NameLocationDateDay of Week
374299
Hour Beginning
Cars Entering
Cars Exiting
Total Occupancy
Check Count (All
Levels)Adjusted
Occupancy10:00 29911:00 10 12 29712:00 16 49 26413:00 41 26 279 24914:00 41 22 29815:00 36 35 29916:00 17 50 266 26117:00 4 79 19118:00 0 102 89
634641.24
Total No. of Parked Cars During DayTurnover (Parkers Per Space)
TuesdayTotal No. of SpacesNo. of Cars Parked at Start
No. of Cars Parked at End
107-1
Travis Co. San Antonio St. Garage - All LevelsW. 10th St. @ San Antonio St.7-Mar-00
10:0
0
12:0
0
14:0
0
16:0
0
18:0
0
0
100
200
300
400
No. of Parked Vehicles
Time of Day
Travis Co. San Antonio St. Garage Accumulation
Cars EnteringCars ExitingTotal Occupancy
Capacity 374 Spaces
Facility No.Facility NameLocationDateDay of Week
372299
Hour Beginning
Cars Entering
Cars Exiting
Total Occupancy
Check Count
Adjusted Occupancy
10:00 29911:00 13 10 30212:00 8 50 260 25613:00 33 45 24814:00 62 23 28715:00 28 21 294 30116:00 22 35 28117:00 4 110 17518:00 7 87 95
1014761.28
Total No. of Parked Cars During DayTurnover (Parkers Per Space)
134-2
TuesdayTotal No. of SpacesNo. of Cars Parked at Start
No. of Cars Parked at End
Travis Co. Admininistration Bldg. (Stokes Bldg.) GarageW. 12th St. @ Guadalupe St.7-Mar-00
10:0
0
12:0
0
14:0
0
16:0
0
18:0
0
0
100
200
300
400
No. of Parked Vehicles
Time of Day
Travis Co. Admin. Bldg. (Stokes Bldg.) Garage Accumulation
Cars EnteringCars ExitingTotal Occupancy
Capacity 372 Spaces
Facility No.Facility NameLocationDateDay of Week
117110
Hour Beginning
Cars Entering
Cars Exiting
Total Occupancy
Check Count
Adjusted Occupancy
10:00 11011:00 8812:00 88 13:00 8814:00 9515:00 97 16:00 9317:00 5018:00 39
39
Total No. of Parked Cars During DayTurnover (Parkers Per Space)
TuesdayTotal No. of SpacesNo. of Cars Parked at Start
No. of Cars Parked at End
150-3
Travis Co. Executive Office Building GarageW. 12th St. @ San Antonio7-Mar-00
10:0
0
13
:00
16
:00
020406080
100120
Number of Parked Vehicles
Time of Day
Travis Co. Executive Office Bldg. Garage Accumulation
Total Occupancy
Capacity 117 Spaces

Facility No.Facility NameLocationDateDay of Week
1,085291
Hour Beginning
Cars Entering
Cars Exiting
Total Occupancy
Check Count
Adjusted Occupancy
10:00 29111:00 18 12 29712:00 25 57 265 25613:00 56 48 27314:00 48 37 28415:00 35 30 289 30116:00 13 31 27117:00 14 94 19118:00 3 123 71
1015030.46
Total No. of Parked Cars During DayTurnover (Parkers Per Space)
7-2
WednesdayTotal No. of SpacesNo. of Cars Parked at Start
No. of Cars Parked at End
Austin Convention Center GarageE. 2nd and Brazos8-Mar-00
10:0
0
12:0
0
14:0
0
16:0
0
18:0
0
-100100300500700900
1100
No. of Parked Vehicles
Time of Day
Austin Convention Center Garage Accumulation
Cars EnteringCars ExitingTotal Occupancy
Capacity1,085 Spaces
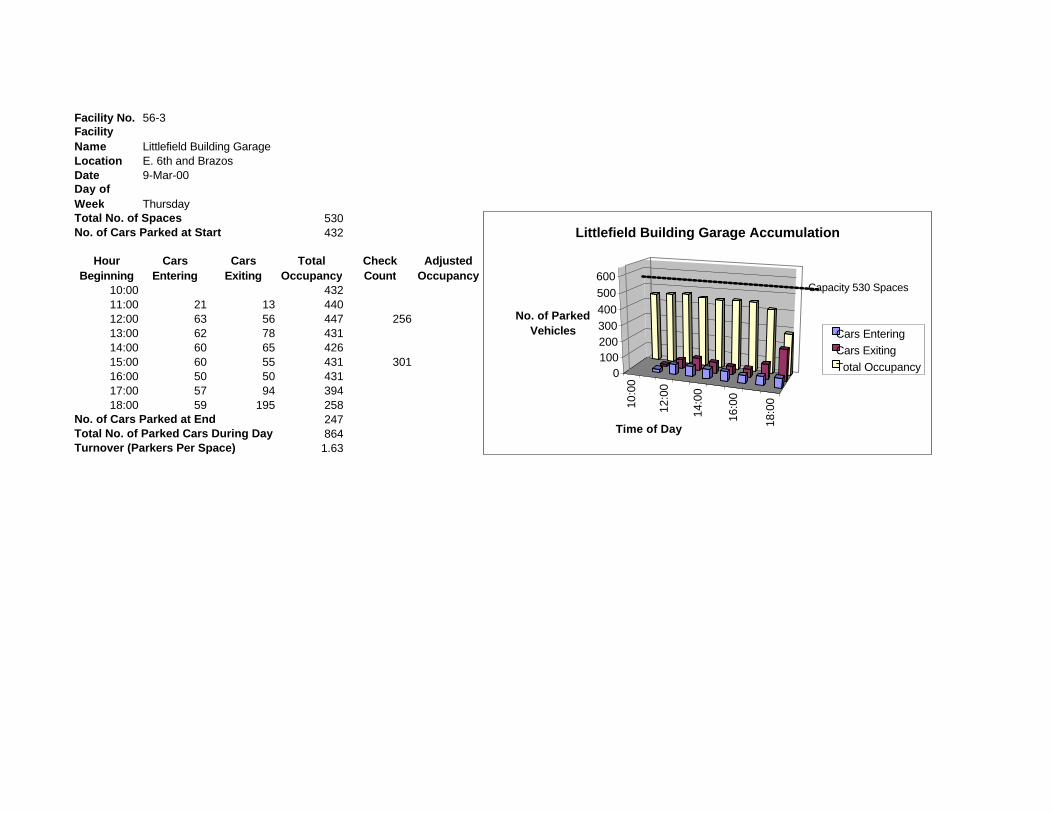
Facility No.Facility NameLocationDateDay of Week
530432
Hour Beginning
Cars Entering
Cars Exiting
Total Occupancy
Check Count
Adjusted Occupancy
10:00 43211:00 21 13 44012:00 63 56 447 25613:00 62 78 43114:00 60 65 42615:00 60 55 431 30116:00 50 50 43117:00 57 94 39418:00 59 195 258
2478641.63
Total No. of Parked Cars During DayTurnover (Parkers Per Space)
56-3
ThursdayTotal No. of SpacesNo. of Cars Parked at Start
No. of Cars Parked at End
Littlefield Building GarageE. 6th and Brazos9-Mar-00
10:0
0
12:0
0
14:0
0
16:0
0
18:0
0
0100200300400500600
No. of Parked Vehicles
Time of Day
Littlefield Building Garage Accumulation
Cars EnteringCars ExitingTotal Occupancy
Capacity 530 Spaces
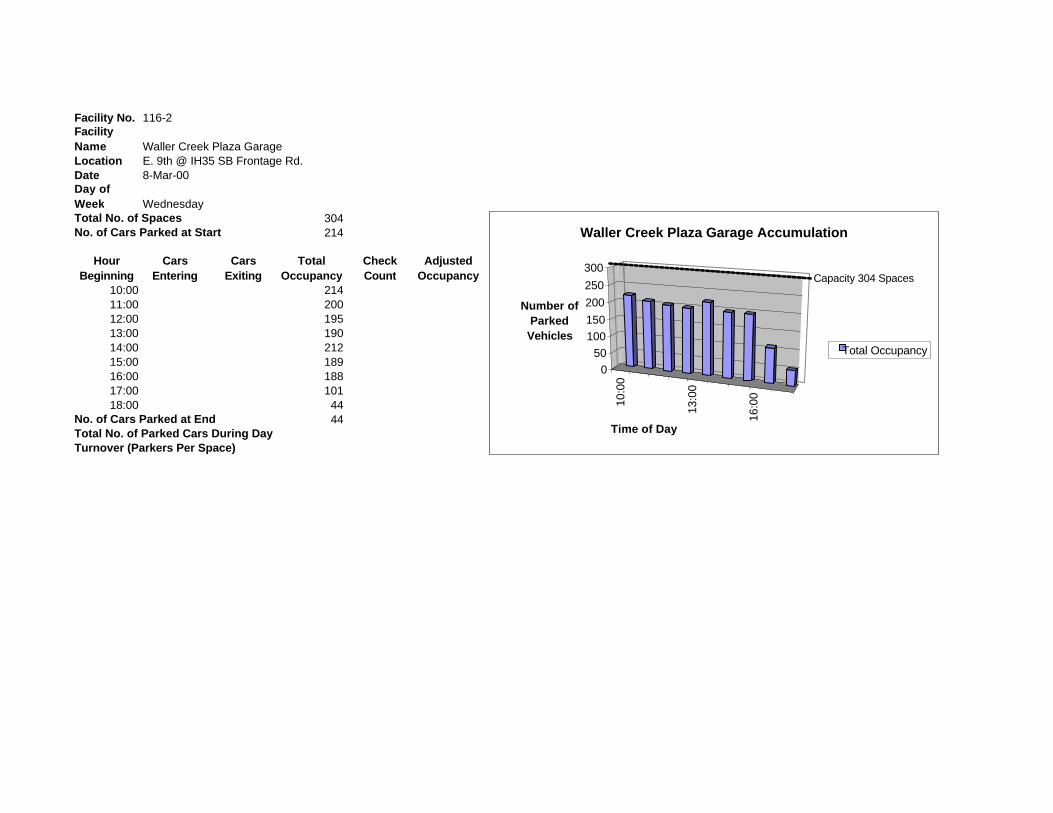
Facility No.Facility NameLocationDateDay of Week
304214
Hour Beginning
Cars Entering
Cars Exiting
Total Occupancy
Check Count
Adjusted Occupancy
10:00 21411:00 20012:00 195 13:00 19014:00 21215:00 189 16:00 18817:00 10118:00 44
44
116-2
Waller Creek Plaza GarageE. 9th @ IH35 SB Frontage Rd.8-Mar-00
Total No. of Parked Cars During DayTurnover (Parkers Per Space)
WednesdayTotal No. of SpacesNo. of Cars Parked at Start
No. of Cars Parked at End
10:0
0
13
:00
16
:00
050
100150200250300
Number of Parked Vehicles
Time of Day
Waller Creek Plaza Garage Accumulation
Total Occupancy
Capacity 304 Spaces
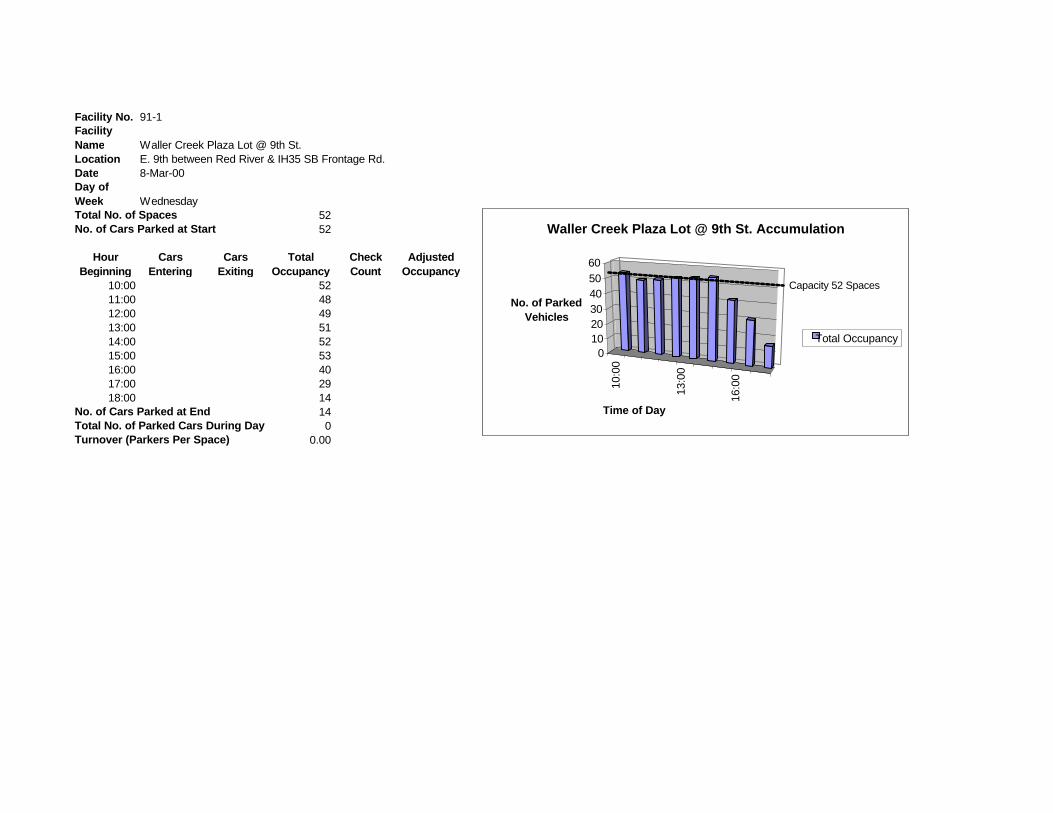
Facility No.Facility NameLocationDateDay of Week
5252
Hour Beginning
Cars Entering
Cars Exiting
Total Occupancy
Check Count
Adjusted Occupancy
10:00 5211:00 4812:00 49 13:00 5114:00 5215:00 53 16:00 4017:00 2918:00 14
140
0.00
91-1
Waller Creek Plaza Lot @ 9th St.E. 9th between Red River & IH35 SB Frontage Rd.8-Mar-00
Total No. of Parked Cars During DayTurnover (Parkers Per Space)
WednesdayTotal No. of SpacesNo. of Cars Parked at Start
No. of Cars Parked at End
10:0
0
13
:00
16
:00
0102030405060
No. of Parked Vehicles
Time of Day
Waller Creek Plaza Lot @ 9th St. Accumulation
Total Occupancy
Capacity 52 Spaces
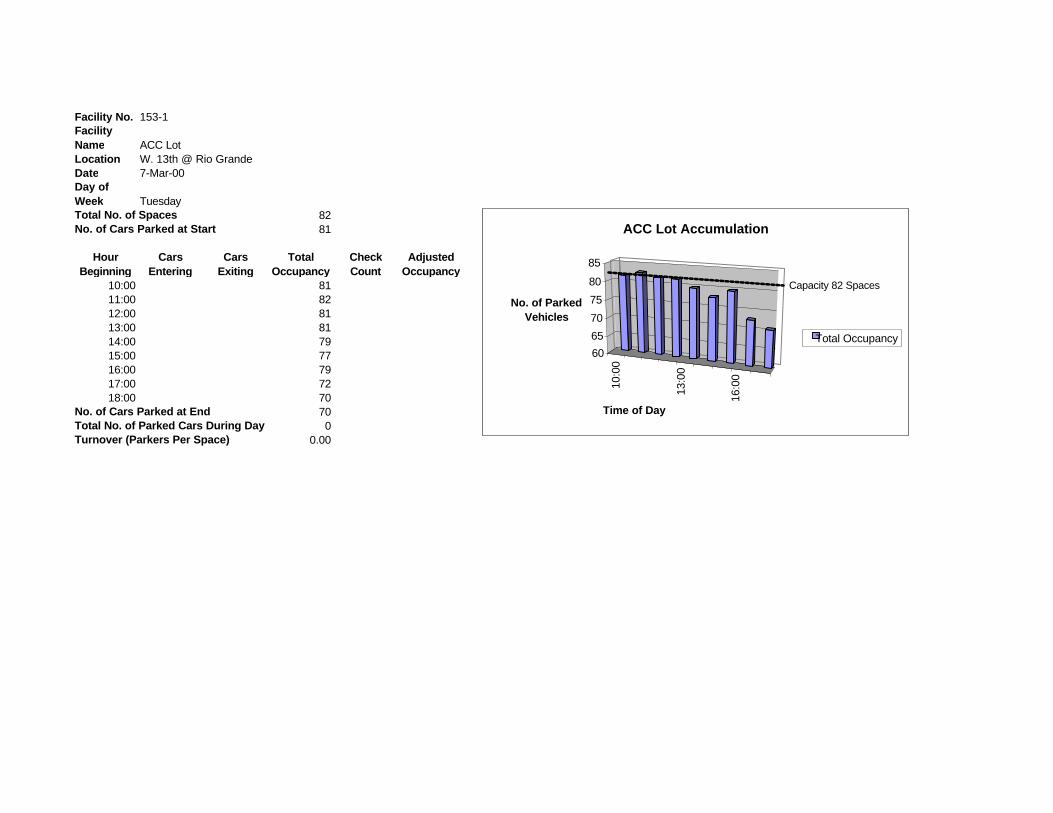
Facility No.Facility NameLocationDateDay of Week
8281
Hour Beginning
Cars Entering
Cars Exiting
Total Occupancy
Check Count
Adjusted Occupancy
10:00 8111:00 8212:00 81 13:00 8114:00 7915:00 77 16:00 7917:00 7218:00 70
700
0.00Total No. of Parked Cars During DayTurnover (Parkers Per Space)
TuesdayTotal No. of SpacesNo. of Cars Parked at Start
No. of Cars Parked at End
153-1
ACC LotW. 13th @ Rio Grande7-Mar-00
10:0
0
13
:00
16
:00
606570758085
No. of Parked Vehicles
Time of Day
ACC Lot Accumulation
Total Occupancy
Capacity 82 Spaces
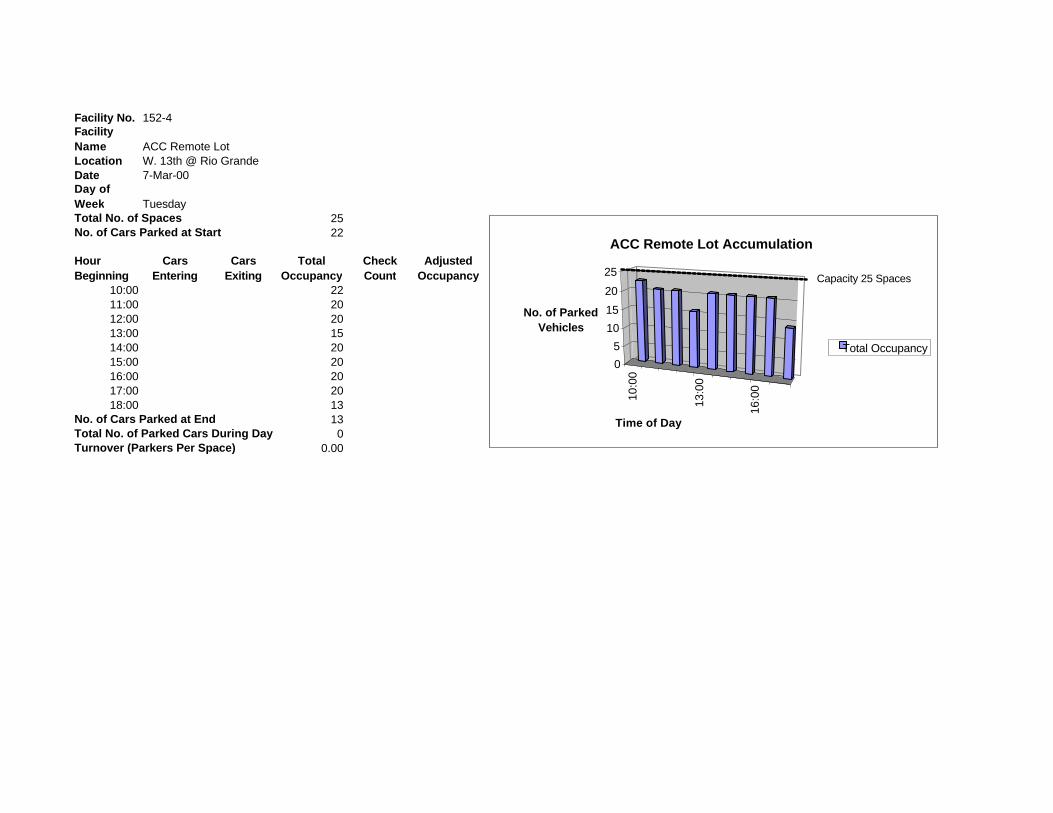
Facility No.Facility NameLocationDateDay of Week
2522
Hour Beginning
Cars Entering
Cars Exiting
Total Occupancy
Check Count
Adjusted Occupancy
10:00 2211:00 2012:00 20 13:00 1514:00 2015:00 20 16:00 2017:00 2018:00 13
130
0.00Total No. of Parked Cars During DayTurnover (Parkers Per Space)
TuesdayTotal No. of SpacesNo. of Cars Parked at Start
No. of Cars Parked at End
152-4
ACC Remote LotW. 13th @ Rio Grande7-Mar-00
10:0
0
13
:00
16
:00
05
10152025
No. of Parked Vehicles
Time of Day
ACC Remote Lot Accumulation
Total Occupancy
Capacity 25 Spaces
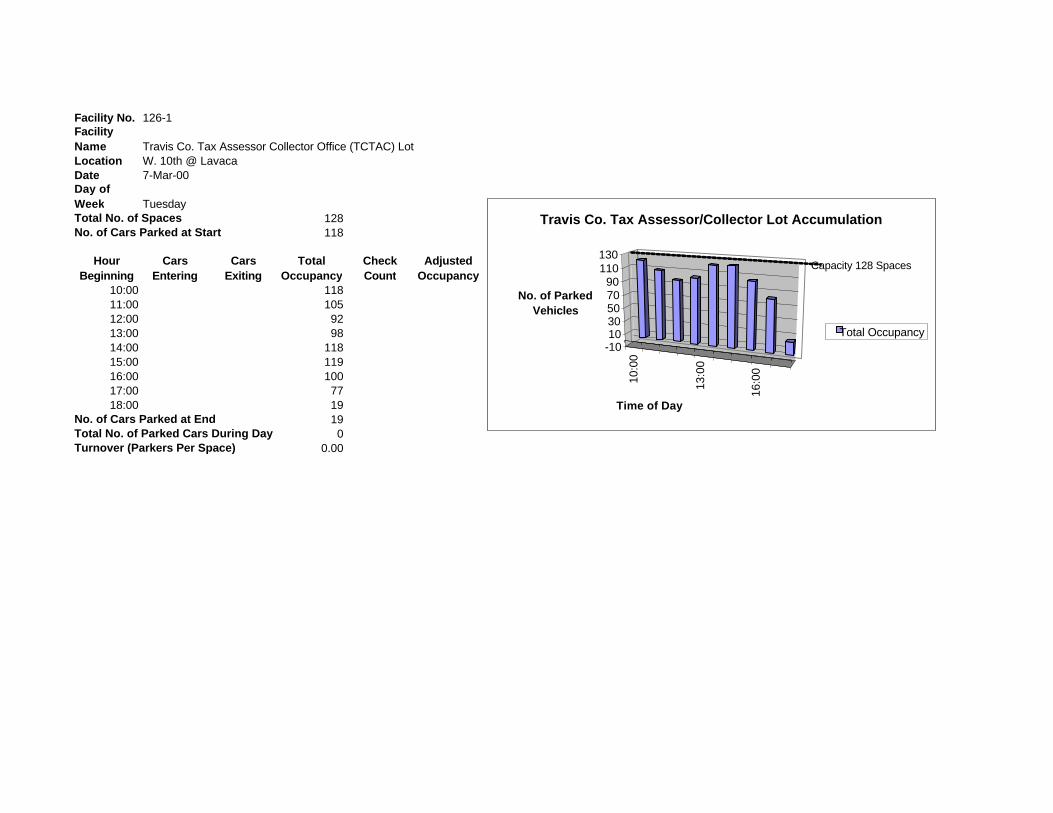
Facility No.Facility NameLocationDateDay of Week
128118
Hour Beginning
Cars Entering
Cars Exiting
Total Occupancy
Check Count
Adjusted Occupancy
10:00 11811:00 10512:00 92 13:00 9814:00 11815:00 119 16:00 10017:00 7718:00 19
190
0.00
126-1
Travis Co. Tax Assessor Collector Office (TCTAC) LotW. 10th @ Lavaca7-Mar-00
Total No. of Parked Cars During DayTurnover (Parkers Per Space)
TuesdayTotal No. of SpacesNo. of Cars Parked at Start
No. of Cars Parked at End
10:0
0
13
:00
16
:00
-101030507090
110130
No. of Parked Vehicles
Time of Day
Travis Co. Tax Assessor/Collector Lot Accumulation
Total Occupancy
Capacity 128 Spaces

Facility No.Facility NameLocationDateDay of Week
6854
Hour Beginning
Cars Entering
Cars Exiting
Total Occupancy
Check Count
Adjusted Occupancy
10:00 5411:00 5712:00 53 13:00 5014:00 5415:00 55 16:00 5317:00 3918:00 9
90
0.00
108-3
Travis Co. Sheriff's Dept. Parking LotW. 10th @ Guadalupe7-Mar-00
Total No. of Parked Cars During DayTurnover (Parkers Per Space)
TuesdayTotal No. of SpacesNo. of Cars Parked at Start
No. of Cars Parked at End
10:0
0
13
:00
16
:00
010203040506070
No. of Parked Vehicles
Time of Day
Travis Co. Sheriff's Lot Accumulation
Total Occupancy
Capacity 68 Spaces

Facility No.Facility NameLocationDateDay of Week
245194
Hour Beginning
Cars Entering
Cars Exiting
Total Occupancy
Check Count
Adjusted Occupancy
10:00 14 9 19911:00 12 12 19912:00 12 10 201 20813:00 11 8 20414:00 8 3 20915:00 5 9 205 21416:00 7 19 19317:00 2 41 15418:00 99
99265
1.08
72-1
Classified Lot 6th & LavacaW. 6th & Lavaca8-Mar-00
Total No. of Parked Cars During DayTurnover (Parkers Per Space)
WednesdayTotal No. of SpacesNo. of Cars Parked at Start
No. of Cars Parked at End
9 1410
:00
8 1113
:00
19 716
:00
050
100150200250
No. of Parked Vehicles
Time of Day
Classified Lot W. 6th & Lavaca Accumulation
Total Occupancy
Capacity 245 Spaces

Facility No.Facility NameLocationDateDay of Week
6741
Hour Beginning
Cars Entering
Cars Exiting
Total Occupancy
Check Count
Adjusted Occupancy
10:00 4111:00 4412:00 46 13:00 4714:00 4615:00 41 16:00 4417:00 4218:00 14
14
Total No. of Parked Cars During DayTurnover (Parkers Per Space)
WednesdayTotal No. of SpacesNo. of Cars Parked at Start
No. of Cars Parked at End
17-3
Classified Lot E. 2nd & San JacintoE. 2nd & San Jacinto8-Mar-00
10:0
011
:00
12:0
013
:00
14:0
015
:00
16:0
0
17:0
0
18:0
0
010203040506070
No. of Parked Vehicles
Time of Day
Classified Lot E. 2nd & San Jacinto Accumulation
Total Occupancy
Capacity 67 Spaces
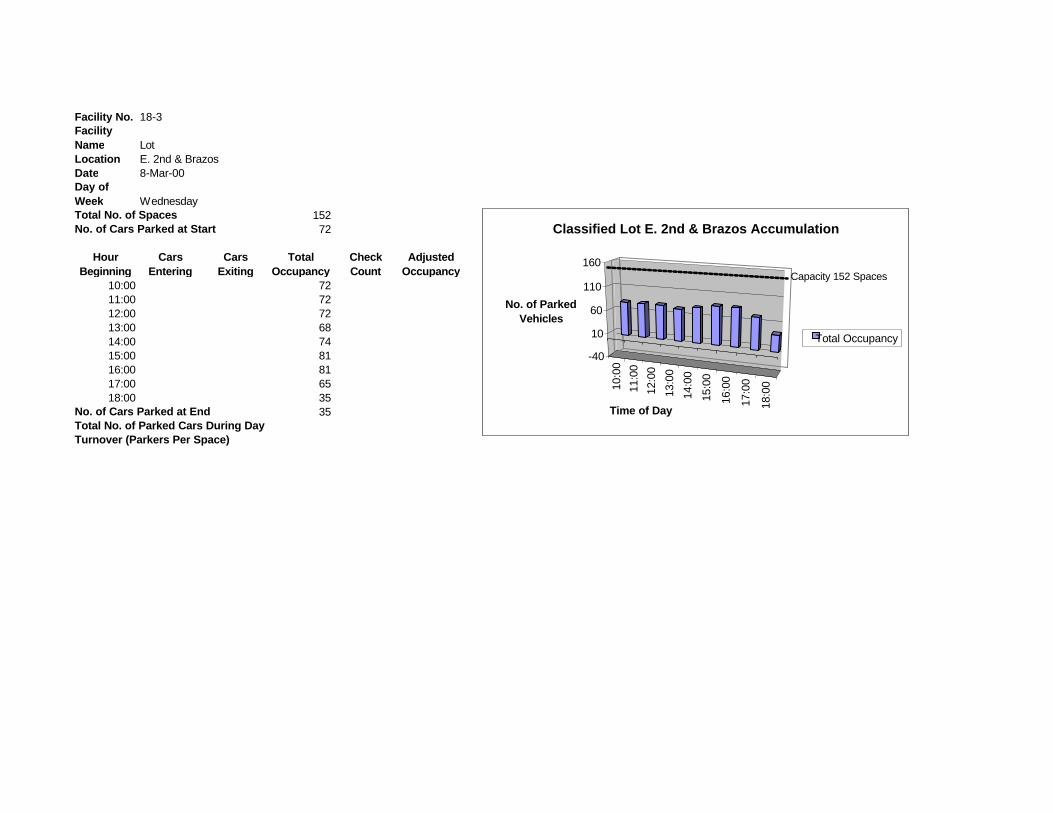
Facility No.Facility NameLocationDateDay of Week
15272
Hour Beginning
Cars Entering
Cars Exiting
Total Occupancy
Check Count
Adjusted Occupancy
10:00 7211:00 7212:00 72 13:00 6814:00 7415:00 81 16:00 8117:00 6518:00 35
35
18-3
LotE. 2nd & Brazos8-Mar-00
Total No. of Parked Cars During DayTurnover (Parkers Per Space)
WednesdayTotal No. of SpacesNo. of Cars Parked at Start
No. of Cars Parked at End
10:0
011
:00
12:0
013
:00
14:0
015
:00
16:0
0
17:0
0
18:0
0
-40
10
60
110
160
No. of Parked Vehicles
Time of Day
Classified Lot E. 2nd & Brazos Accumulation
Total Occupancy
Capacity 152 Spaces

Facility No.Facility NameLocationDateDay of Week
180159
Hour Beginning
Cars Entering
Cars Exiting
Total Occupancy
Check Count
Adjusted Occupancy
10:00 15911:00 17112:00 180 13:00 15314:00 17115:00 172 16:00 16417:00 13018:00 83
83
Total No. of Parked Cars During DayTurnover (Parkers Per Space)
WednesdayTotal No. of SpacesNo. of Cars Parked at Start
No. of Cars Parked at End
19-1
Classified Lot W. 2nd & CongressW. 2nd & Congress8-Mar-00
10:0
011
:00
12:0
013
:00
14:0
015
:00
16:0
0
17:0
0
18:0
0
0
50
100
150
No. of Parked Vehicles
Time of Day
Classified Lot W. 2nd & Congress Accumulation
Total Occupancy
Capacity 180 Spaces

Facility No.Facility NameLocationDateDay of Week
125108
Hour Beginning
Cars Entering
Cars Exiting
Total Occupancy
Check Count
Adjusted Occupancy
10:00 10811:00 12012:00 125 13:00 12114:00 12215:00 119 16:00 11817:00 10218:00 92
92
29-1
Classified Lot W. 3rd & CongressW. 3rd & Congress8-Mar-00
Total No. of Parked Cars During DayTurnover (Parkers Per Space)
WednesdayTotal No. of SpacesNo. of Cars Parked at Start
No. of Cars Parked at End
10:0
011
:00
12:0
013
:00
14:0
015
:00
16:0
0
17:0
0
18:0
0
020406080
100120
No. of Parked Vehicles
Time of Day
Classified Lot W. 3rd & Congress Accumulation
Total Occupancy
Capacity 125 Spaces
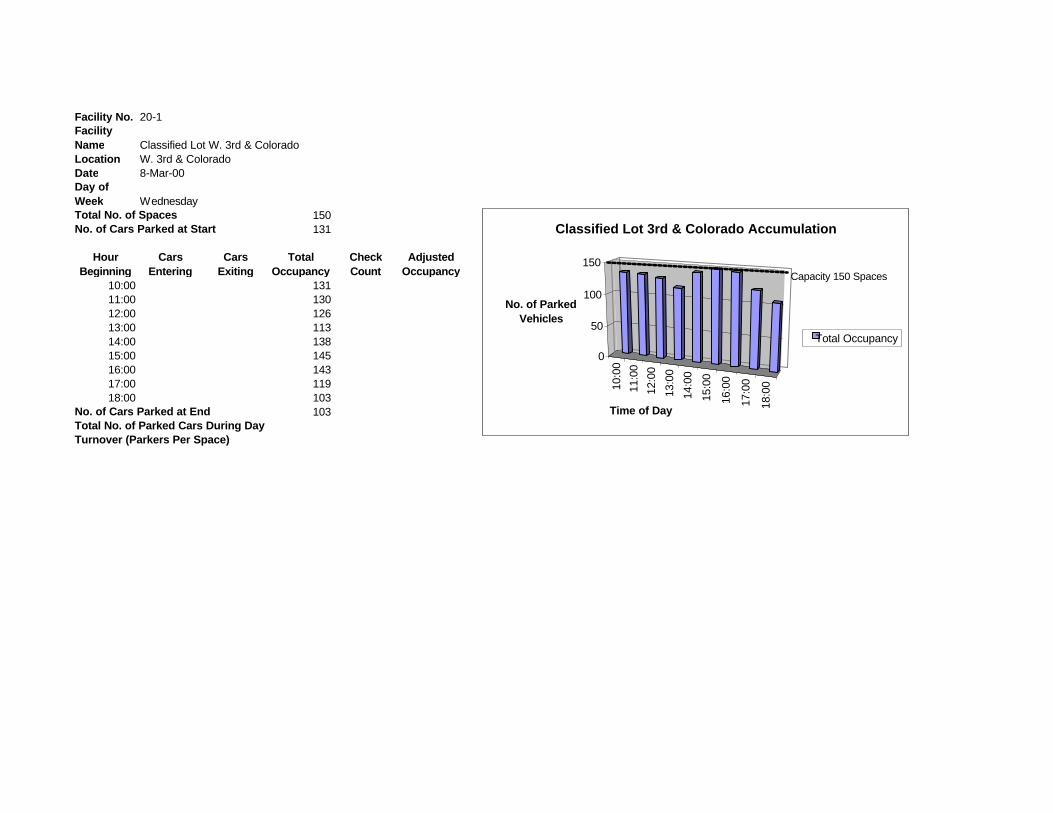
Facility No.Facility NameLocation DateDay of Week
150131
Hour Beginning
Cars Entering
Cars Exiting
Total Occupancy
Check Count
Adjusted Occupancy
10:00 13111:00 13012:00 126 13:00 11314:00 13815:00 145 16:00 14317:00 11918:00 103
103
20-1
Classified Lot W. 3rd & ColoradoW. 3rd & Colorado8-Mar-00
Total No. of Parked Cars During DayTurnover (Parkers Per Space)
WednesdayTotal No. of SpacesNo. of Cars Parked at Start
No. of Cars Parked at End
10:0
011
:00
12:0
013
:00
14:0
015
:00
16:0
0
17:0
0
18:0
0
0
50
100
150
No. of Parked Vehicles
Time of Day
Classified Lot 3rd & Colorado Accumulation
Total Occupancy
Capacity 150 Spaces

Facility No.Facility NameLocationDateDay of Week
134125
Hour Beginning
Cars Entering
Cars Exiting
Total Occupancy
Check Count
Adjusted Occupancy
10:00 12511:00 12512:00 117 13:00 12514:00 13415:00 128 16:00 11817:00 9018:00 74
74
Total No. of Parked Cars During DayTurnover (Parkers Per Space)
WednesdayTotal No. of SpacesNo. of Cars Parked at Start
No. of Cars Parked at End
43-1
Classified Lot W. 4th & CongressW. 4th & Congress8-Mar-00
10:0
011
:00
12:0
013
:00
14:0
015
:00
16:0
0
17:0
0
18:0
0
0
50
100
150
No. of Parked Vehicles
Time of Day
Classified Lot W. 4th & Congress Accumulation
Total Occupancy
Capacity 134 Spaces

Facility No.Facility NameLocationDateDay of Week
284270
Hour Beginning
Cars Entering
Cars Exiting
Total Occupancy
Check Count
Adjusted Occupancy
10:00 27011:00 27412:00 270 13:00 27214:00 25915:00 266 16:00 24617:00 17618:00 73
73
87-1
Classified Lot E. 8th & TrinityE. 8th & Trinity8-Mar-00
Total No. of Parked Cars During DayTurnover (Parkers Per Space)
WednesdayTotal No. of SpacesNo. of Cars Parked at Start
No. of Cars Parked at End
10:0
011
:00
12:0
013
:00
14:0
015
:00
16:0
0
17:0
0
18:0
0
050
100150200250
No. of Parked Vehicles
Time of Day
Classified Lot E. 8th & Trinity Accumulation
Total Occupancy
Capacity 284 Spaces

Facility No.Facility NameLocationDateDay of Week
155153
Hour Beginning
Cars Entering
Cars Exiting
Total Occupancy
Check Count
Adjusted Occupancy
10:00 15311:00 15712:00 157 13:00 15714:00 15915:00 150 16:00 9317:00 6218:00 21
21
300-1
IH-35 North LotIH-35 Right-of-Way between E. 7th and E. 8th Streets8-Mar-00
Total No. of Parked Cars During DayTurnover (Parkers Per Space)
WednesdayTotal No. of SpacesNo. of Cars Parked at Start
No. of Cars Parked at End
10:0
011
:00
12:0
013
:00
14:0
015
:00
16:0
0
17:0
0
18:0
0
0
50
100
150
No. of Parked Vehicles
Time of Day
IH-35 North Lot Accumulation
Total Occupancy
Capacity 155 Spaces

Facility No.Facility NameLocationDateDay of Week
3013
Hour Beginning
Cars Entering
Cars Exiting
Total Occupancy
Check Count
Adjusted Occupancy
10:00 1311:00 1512:00 20 13:00 2214:00 2215:00 19 16:00 1917:00 1718:00 18
18
Total No. of Parked Cars During DayTurnover (Parkers Per Space)
WednesdayTotal No. of SpacesNo. of Cars Parked at Start
No. of Cars Parked at End
330-2
Texas French Lot, 1700 S. CongressLot behind Tx French in 1700 block of S. Congress Ave.19-Apr-00
10:0
0
12:0
0
14:0
0
16:0
0
18:0
0
05
1015202530
No. of Parked Vehicles
Time of Day
Texas French Lot, 1700 S. Congress Parking Accumulation
Total Occupancy
Capacity 30 Spaces

Facility No.Facility NameLocationDateDay of Week
3331
Hour Beginning
Cars Entering
Cars Exiting
Total Occupancy
Check Count
Adjusted Occupancy
10:00 3111:00 2512:00 23 13:00 2214:00 1215:00 15 16:00 1117:00 1618:00 27
270
0.00Total No. of Parked Cars During DayTurnover (Parkers Per Space)
TuesdayTotal No. of SpacesNo. of Cars Parked at Start
No. of Cars Parked at End
150, 151, 155
W. 13th St/San Antonio On-street 7-Mar-00
10:0
0
13
:00
16
:00
05
101520253035
No. of Parked Vehicles
Time of Day
W. 13th St./San Antonio On-street Accumulation
Total Occupancy
Capacity 33 Spaces

Facility No.Facility NameLocationDateDay of Week
7167
Hour Beginning
Cars Entering
Cars Exiting
Total Occupancy
Check Count
Adjusted Occupancy
10:00 6711:00 7112:00 61 13:00 6714:00 6815:00 71 16:00 5917:00 4118:00 9
90
0.00
Guadalupe/W. 10th St. 7-Mar-00
Total No. of Parked Cars During DayTurnover (Parkers Per Space)
TuesdayTotal No. of SpacesNo. of Cars Parked at Start
No. of Cars Parked at End
10:0
0
13
:00
16
:00
0
20
40
60
80
No. of Parked Vehicles
Time of Day
Guadalupe/W. 10th On-street Accumulation
Total Occupancy
Capacity 71 Spaces

Facility No.Facility NameLocationDateDay of Week
4037
Hour Beginning
Cars Entering
Cars Exiting
Total Occupancy
Check Count
Adjusted Occupancy
10:00 3711:00 4012:00 40 13:00 3914:00 3815:00 40 16:00 3917:00 3318:00 34
340
0.00
Congress/8th-10th 7-Mar-00
Total No. of Parked Cars During DayTurnover (Parkers Per Space)
TuesdayTotal No. of SpacesNo. of Cars Parked at Start
No. of Cars Parked at End
10:0
0
13
:00
16
:00
0
10
20
30
40
No. of Parked Vehicles
Time of Day
Congress/8th-10th On-street Accumulation
Total Occupancy
Capacity 40 Spaces

Facility No.Facility NameLocationDateDay of Week
3028
Hour Beginning
Cars Entering
Cars Exiting
Total Occupancy
Check Count
Adjusted Occupancy
10:00 2811:00 2512:00 26 13:00 2714:00 3215:00 30 16:00 2617:00 2918:00 27
270
0.00Total No. of Parked Cars During DayTurnover (Parkers Per Space)
WednesdayTotal No. of SpacesNo. of Cars Parked at Start
No. of Cars Parked at End
Congress/5th to 7th St. On-Street 8-Mar-00
10:0
0
13
:00
16
:00
22
24
26
28
30
No. of Parked Vehicles
Time of Day
Congress/5th-7th On-Street Accumulation
Total Occupancy
Capacity 30 Spaces

Facility No.Facility NameLocationDateDay of Week
3422
Hour Beginning
Cars Entering
Cars Exiting
Total Occupancy
Check Count
Adjusted Occupancy
10:00 2211:00 1912:00 29 13:00 2714:00 2515:00 17 16:00 1817:00 2418:00 24
240
0.00Total No. of Parked Cars During DayTurnover (Parkers Per Space)
TuesdayTotal No. of SpacesNo. of Cars Parked at Start
No. of Cars Parked at End
Congress/2nd-4th Streets 7-Mar-00
10:0
0
13
:00
16
:00
05
101520253035
No. of Parked Vehicles
Time of Day
Congress/2nd-4th Sts. Accumulation
Total Occupancy
Capacity 34 Spaces
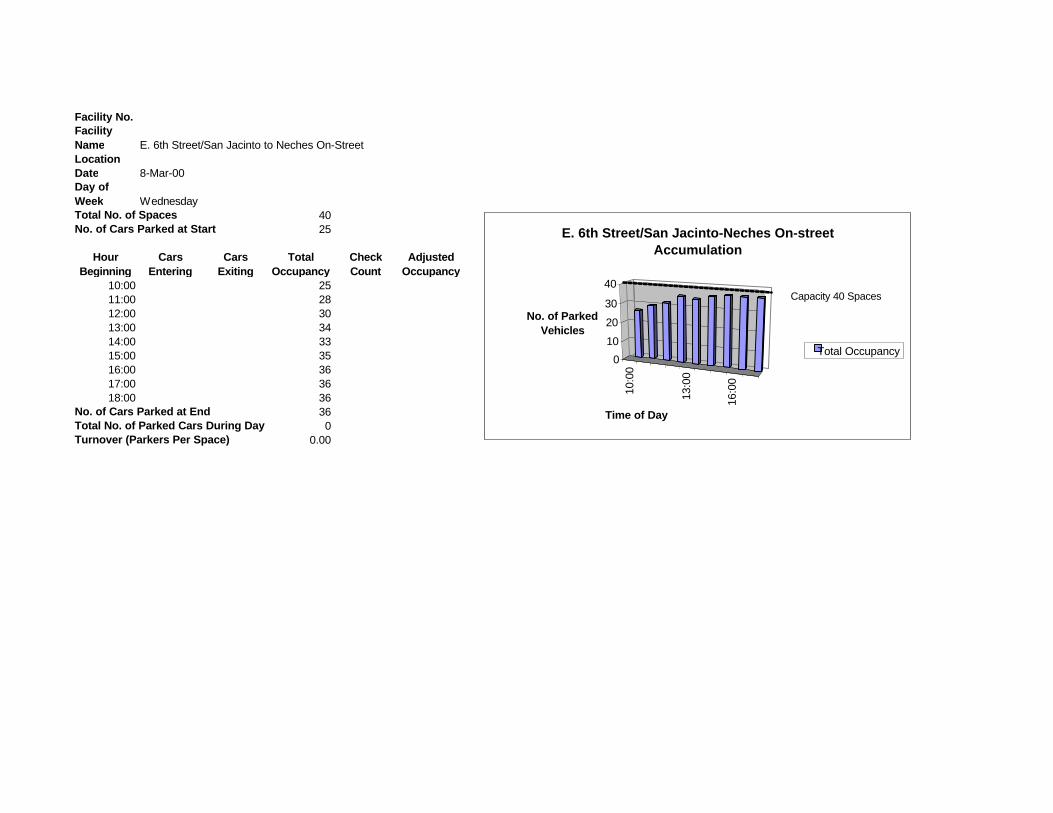
Facility No.Facility NameLocationDateDay of Week
4025
Hour Beginning
Cars Entering
Cars Exiting
Total Occupancy
Check Count
Adjusted Occupancy
10:00 2511:00 2812:00 30 13:00 3414:00 3315:00 35 16:00 3617:00 3618:00 36
360
0.00
E. 6th Street/San Jacinto to Neches On-Street 8-Mar-00
Total No. of Parked Cars During DayTurnover (Parkers Per Space)
WednesdayTotal No. of SpacesNo. of Cars Parked at Start
No. of Cars Parked at End
10:0
0
13
:00
16
:00
0102030
40
No. of Parked Vehicles
Time of Day
E. 6th Street/San Jacinto-Neches On-street Accumulation
Total Occupancy
Capacity 40 Spaces
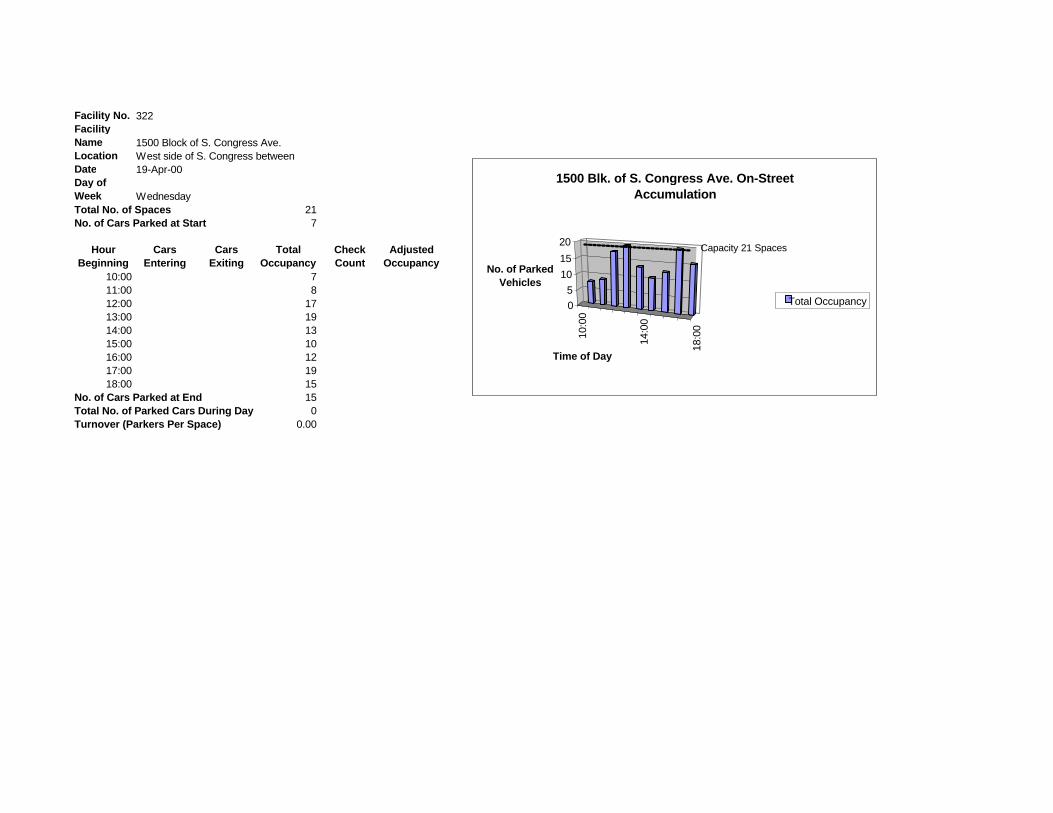
Facility No.Facility NameLocationDateDay of Week
217
Hour Beginning
Cars Entering
Cars Exiting
Total Occupancy
Check Count
Adjusted Occupancy
10:00 711:00 812:00 17 13:00 1914:00 1315:00 10 16:00 1217:00 1918:00 15
150
0.00Total No. of Parked Cars During DayTurnover (Parkers Per Space)
WednesdayTotal No. of SpacesNo. of Cars Parked at Start
No. of Cars Parked at End
322
1500 Block of S. Congress Ave.West side of S. Congress between 19-Apr-00
10:0
0
14
:00
18
:00
05
101520
No. of Parked Vehicles
Time of Day
1500 Blk. of S. Congress Ave. On-Street Accumulation
Total Occupancy
Capacity 21 Spaces

Facility No.Facility NameLocationDateDay of Week
228
Hour Beginning
Cars Entering
Cars Exiting
Total Occupancy
Check Count
Adjusted Occupancy
10:00 811:00 1112:00 11 13:00 1114:00 1215:00 9 16:00 1317:00 1318:00 10
100
0.00Total No. of Parked Cars During DayTurnover (Parkers Per Space)
WednesdayTotal No. of SpacesNo. of Cars Parked at Start
No. of Cars Parked at End
317
1300 Block of S. Congress Ave.East side of Continental Club Block19-Apr-00
10:0
0
13
:00
16
:00
0
5
10
15
20
No. of Parked Vehicles
Time of Day
1300 Block of S. Congress Ave. On-street Accumulation
Total Occupancy
Total Capacity = 22 Spaces
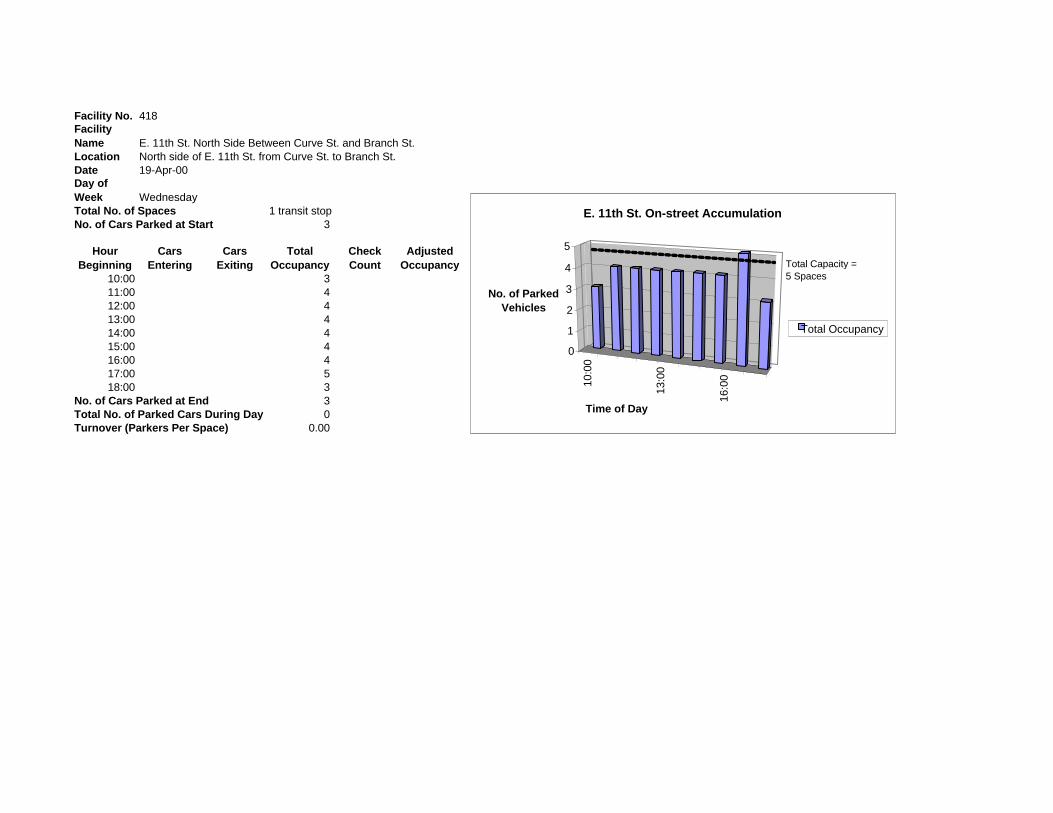
Facility No.Facility NameLocationDateDay of Week
1 transit stop3
Hour Beginning
Cars Entering
Cars Exiting
Total Occupancy
Check Count
Adjusted Occupancy
10:00 311:00 412:00 4 13:00 414:00 415:00 4 16:00 417:00 518:00 3
30
0.00
418
E. 11th St. North Side Between Curve St. and Branch St.North side of E. 11th St. from Curve St. to Branch St.19-Apr-00
Total No. of Parked Cars During DayTurnover (Parkers Per Space)
WednesdayTotal No. of SpacesNo. of Cars Parked at Start
No. of Cars Parked at End
10:0
0
13
:00
16
:00
0
1
2
3
4
5
No. of Parked Vehicles
Time of Day
E. 11th St. On-street Accumulation
Total Occupancy
Total Capacity = 5 Spaces


![Wilbur Smith - [Egiptul Antic] 02 Magul](https://img.pdfslide.us/doc/110x75/55cf9753550346d033910402/wilbur-smith-egiptul-antic-02-magul.jpg)