Embed Size (px)
Citation preview

Gas standards for climate and air quality monitoring
R.I. Wielgosz
2
Outline
• Introduction to Air Quality and Greenhouse Gas Monitoring
• Methods for Gas Standard preparation and verification
• Static Gravimetric Methods (CH4 and NO)
• Dynamic Methods (NO2 and HCHO)
• Spectroscopic Methods including isotopologues (O3 and FTIR)
• Manometric Methods (CO2 and O3 )
3www.bipm.org
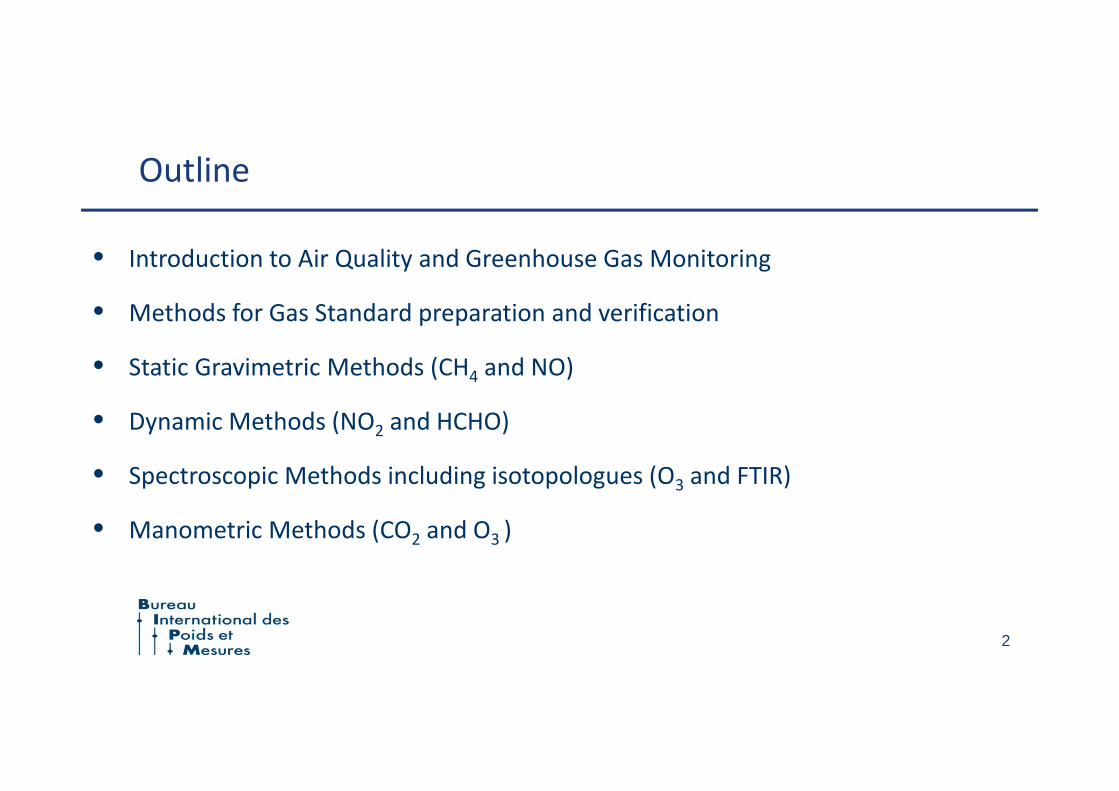
Air Quality and Greenhouse Gases
GASRecent tropospheric
concentration
Carbon dioxide (CO2) 392.6 µmol/mol
Methane (CH4) 1874 nmol/mol
Nitrous oxide (N2O) 324 nmol/mol
Tropospheric ozone (O3) 34 nmol/mol
Halocarbons (0.003 to 0.5)
nmol/mol
Pollutant Concentration Averaging
period
Ozone 60 nmol/mol Maximum
daily 8 hour
mean
Sulphur dioxide (SO2) 120 nmol/mol 1 hour
45 nmol/mol 24 hours
Nitrogen dioxide (NO2) 100 nmol/mol 1 hour
20 nmol/mol 1 year
Carbon monoxide (CO) 8 µmol/mol Maximum
daily 8 hour
mean
Benzene 1.5 nmol/mol 1 year
Fine particles (PM2.5) 25 µg/m3 1 year
PM10 50 µg/m3 24 hours
40 µg/m3 1 year
Lead (Pb) 0.5 µg/m3 1 year
Air
Quality
Greenhouse
Gases
(Limit value concentrations)
Emission gases not included in list

4www.bipm.org
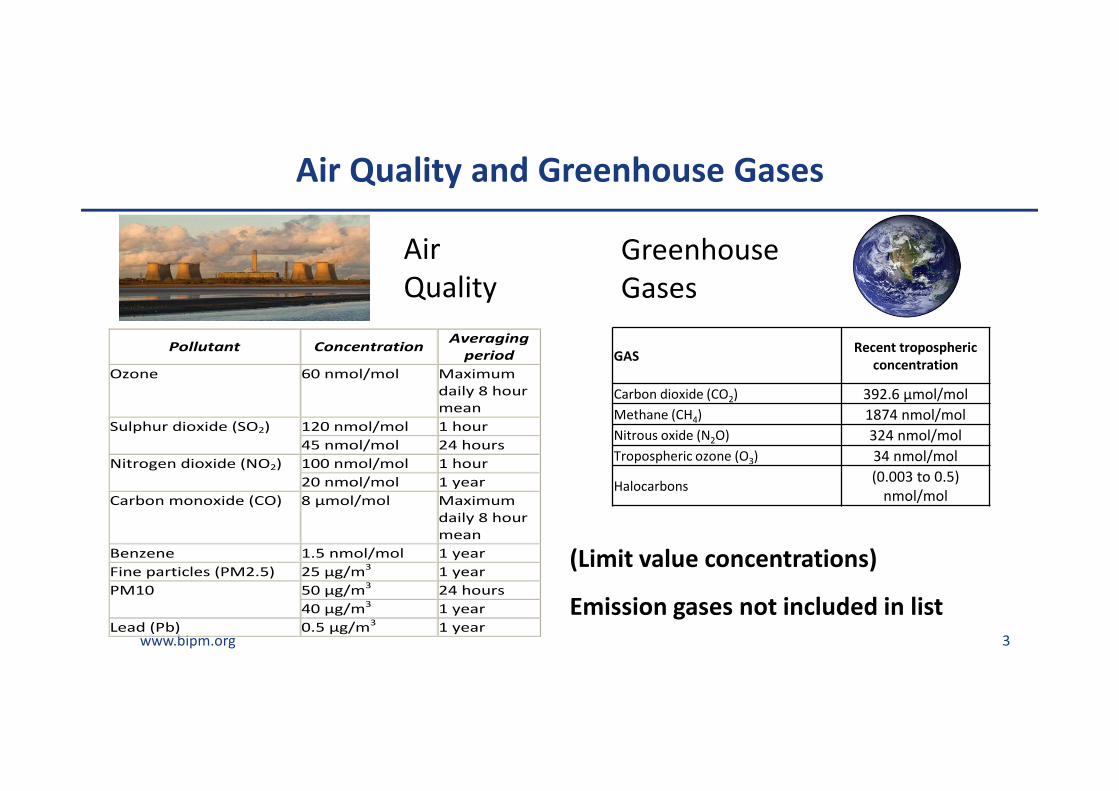
Air Quality Monitoring Networks

The Essential Climate Variables
ECVs are either specific variables or groups of clo sely-related variables:
For details see GCOS, 2010: Implementation plan for the global observing system for climate in support of the UNFCCC (2010 update) GCOS Rep. 138, 186 pp.

www.bipm.org 7www.bipm.org
Greenhouse Gases: A Global View
The network consists of 141, 123 and 49 fixed stations on the ground for CO2, CH4 and N2O respectively. About 13%, 13% and 18% of the stations perform both discrete air sampling in “flasks” and continuous measurements of CO2, CH4 and N2O, respectively.
WMO GAW GHG Network
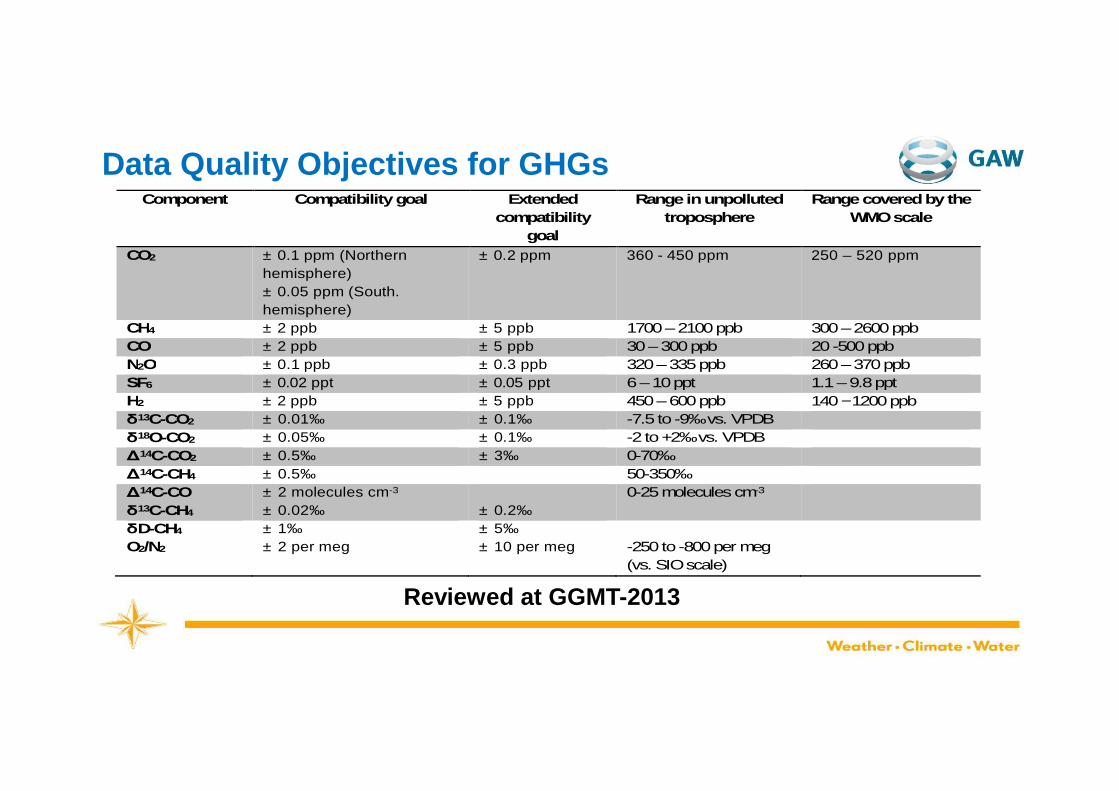
Data Quality Objectives for GHGsComponent Compatibility goal Extended
compatibility goal
Range in unpolluted troposphere
Range covered by the WMO scale
CO2 ± 0.1 ppm (Northern hemisphere) ± 0.05 ppm (South. hemisphere)
± 0.2 ppm 360 - 450 ppm 250 – 520 ppm
CH4 ± 2 ppb ± 5 ppb 1700 – 2100 ppb 300 – 2600 ppb CO ± 2 ppb ± 5 ppb 30 – 300 ppb 20 -500 ppb N2O ± 0.1 ppb ± 0.3 ppb 320 – 335 ppb 260 – 370 ppb SF6 ± 0.02 ppt ± 0.05 ppt 6 – 10 ppt 1.1 – 9.8 ppt H2 ± 2 ppb ± 5 ppb 450 – 600 ppb 140 −1200 ppb δ13C-CO2 ± 0.01‰ ± 0.1‰ -7.5 to -9‰ vs. VPDB δ18O-CO2 ± 0.05‰ ± 0.1‰ -2 to +2‰ vs. VPDB ∆14C-CO2 ± 0.5‰ ± 3‰ 0-70‰ ∆14C-CH4 ± 0.5‰ 50-350‰ ∆14C-CO δ13C-CH4
± 2 molecules cm-3 ± 0.02‰
± 0.2‰
0-25 molecules cm-3
δD-CH4 ± 1‰ ± 5‰ O2/N2 ± 2 per meg ± 10 per meg -250 to -800 per meg
(vs. SIO scale)
Reviewed at GGMT-2013
www.bipm.org 9www.bipm.org
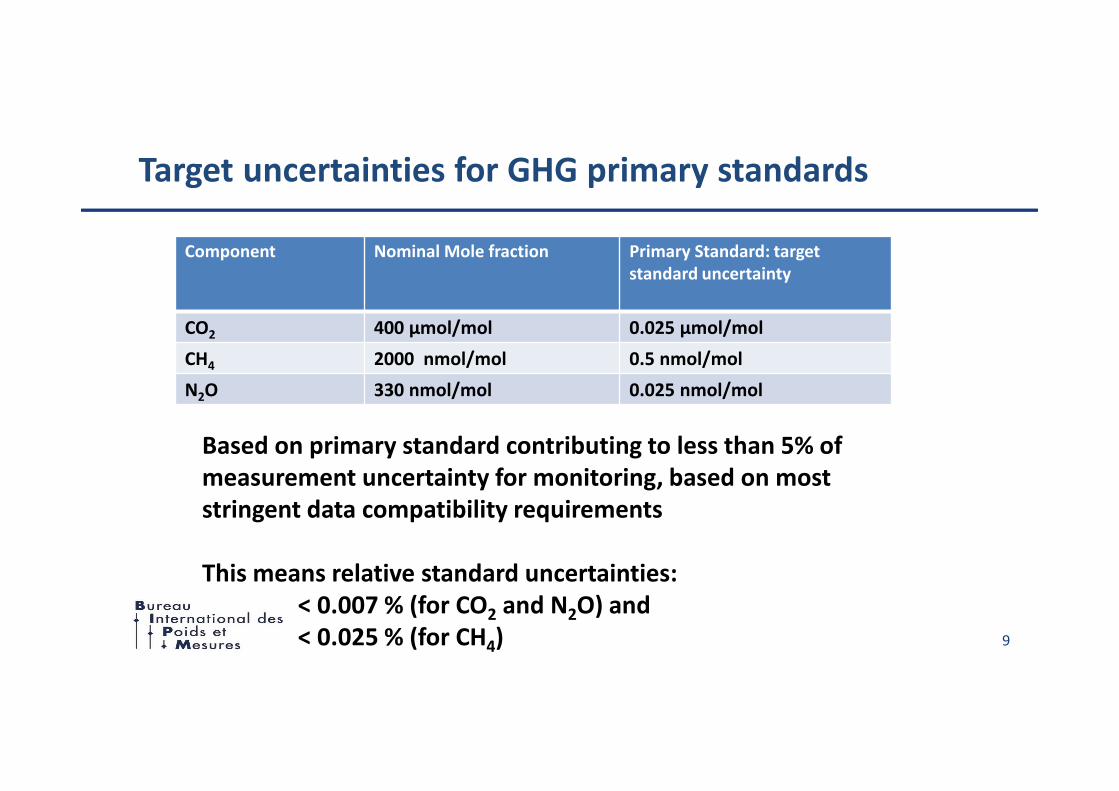
Target uncertainties for GHG primary standards
Component Nominal Mole fraction Primary Standard: target
standard uncertainty
CO2 400 µmol/mol 0.025 µmol/mol
CH4 2000 nmol/mol 0.5 nmol/mol
N2O 330 nmol/mol 0.025 nmol/mol
Based on primary standard contributing to less than 5% of
measurement uncertainty for monitoring, based on most
stringent data compatibility requirements
This means relative standard uncertainties:
< 0.007 % (for CO2 and N2O) and
< 0.025 % (for CH4)

www.bipm.org 10www.bipm.org
Gas Standards in support of Regulation and Research
Automotive
EmissionsAir Quality
Greenhouse
Gases
Increasing technical challenge for standards development
Re
qu
ire
d P
rim
ary
Sta
nd
ard
Un
cert
ain
ty
- Gravimetric Prep.
- Process Gas Analysers
- Nitrogen Matrix
- Dynamic Methods
- FTIR CRDS Analysis
- Impurities
- Stability
- Multicomponent
Matrix
- FTIR CRDS Analysis
- Impurities in Matrix
- Isotope ratios
- Stability
Regulation Research

11www.bipm.org
Methods for Gas Standard Preparation and Value Assignment
Static Gravimetry Dynamic Methods
Spectroscopic Methods Manometric Methods

12www.bipm.org
Gas Standards: International documentary standards
� ISO TC158 Gas Analysis
� ISO 6142 : Gas Analysis – Preparation of
calibration gas mixtures – Gravimetric method
� ISO 6143 : Gas Analysis – Comparison methods
for determining and checking the composition of
calibration gas mixtures

13www.bipm.org
Preparation of Gas Standards (Static)
• Purity Analysis of Gases; Impurity Analysis; purity = 1- ΣxiGC(FID, TCD, ECD, AED, USD, DID, SCD, MSD)
Dedicated Analyzer(H2, O2, Ar, N2 , CH4, CO, CO2, SO2, NOx, H2O, THC, CFCs, PFCs)
FTIR, Gas MS
• Gravimetry, Micro-gravimetry;Top-loading Electronic Balance
(10 kg/1mg, 15 kg/1 mg, 23 kg/1 mg , 1 kg/0.01 mg, 22 g/1 μg)
Substitution Method, Capillary Method

14
Calculation of Mixture Composition (ISO 6142)
�� �
∑��,� ∙ ��
∑ ��,� ∙ ����
���
∑��
∑ ��,� ∙ ����
���
xi is the mole fraction of component i in the resulting mixture
P is the total number of the parent gases
n is the total number of the parent gases
mA is the mass of the parent gas A measured by weighing
Mi is the molar mass of component I
xi,A is the mole fraction i in the parent gas A

15
① Draft shiled
② Manual controller
(LCD touch screen)
③ Computer
④ Balance display(LCD)
⑤ Humidity & Temp.
Transmitter
⑥ Barometer
①①①①
②②②②③③③③
④④④④
⑤⑤⑤⑤ ⑥⑥⑥⑥
Automatic Gas Cylinder Weighing System (KRISS)
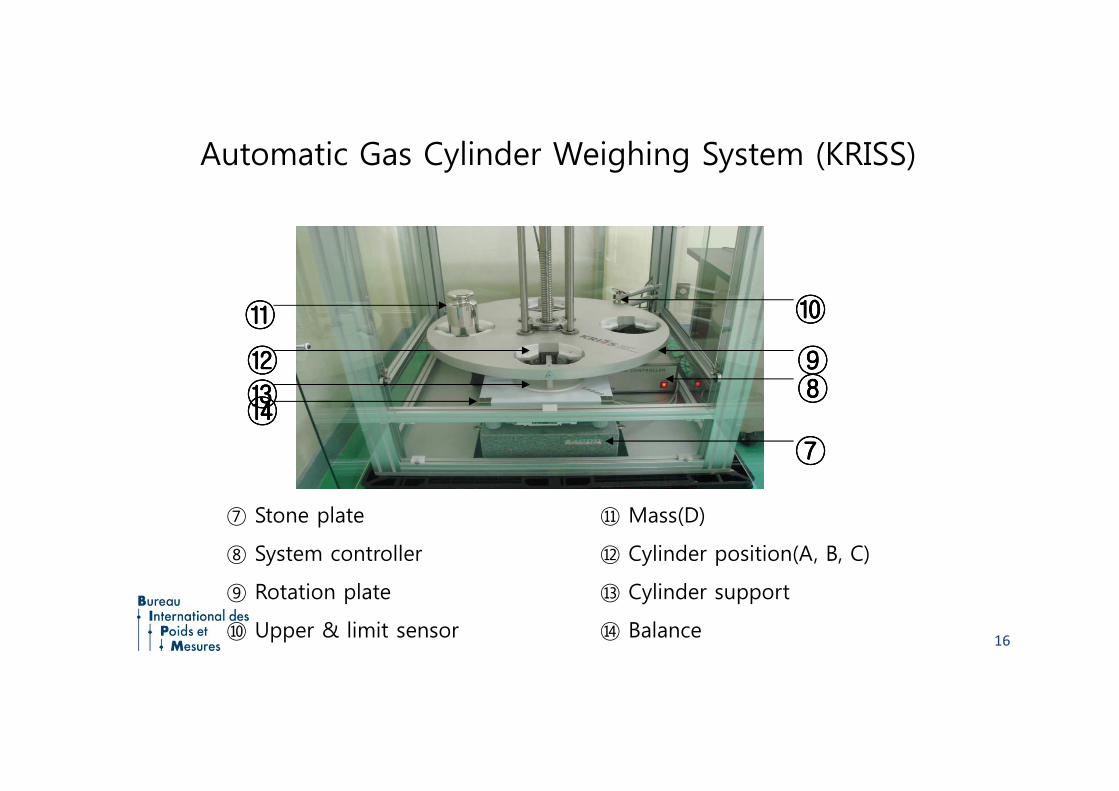
16
⑦⑦⑦⑦
⑧⑧⑧⑧⑨⑨⑨⑨
⑩⑩⑩⑩⑪⑪⑪⑪
⑫⑫⑫⑫⑬⑬⑬⑬⑭⑭⑭⑭
⑦ Stone plate
⑧ System controller
⑨ Rotation plate
⑩ Upper & limit sensor
⑪ Mass(D)
⑫ Cylinder position(A, B, C)
⑬ Cylinder support
⑭ Balance
Automatic Gas Cylinder Weighing System (KRISS)

17www.bipm.org
Equivalence of standards produced by Static Gravimetry (NO in N2)
-7.000
-6.000
-5.000
-4.000
-3.000
-2.000
-1.000
0.000
1.000
2.000
3.000
KRIS
S (M
1)
KRIS
S (M
15)
CSIR
-NM
L (M
2)
CSIR
-NM
L (M
16)
CERI (
M3)
CERI (
M14
)
VALC
RM
1 (M
4)
VALC
RM
2 (M
11)
VALC
RM
3 (M
17)
LNE (M
5)
LNE (M
19)
SM
U (M
6)
SM
U (M
18)
CENAM
(M
7)
CENAM
(M
20)
VNIIM
(M
8)
VNIIM
(M
22)
NIS
T (M
9)
NIS
T (M
24)
NM
IA (M
10)
NM
IA (M
23)
IPQ
(M
12)
IPQ
(M
25)
NM
i-VSL
(M13
)
NM
i-VSL
(M21
)
NPL
NIS
T
NM
i-VSL
BNM
-LNE
KRIS
S
NRLM
*
NRCCRM
VNIIM
OM
H
BNM
-LNE
NPL
VNIIM
NM
i-VSL
GUM
CEM
METAS
CHM
I
FM
I
IPQ
Laboratory (cylinder)
D/
µmol
/mol
CCQM-P73 (LIMAS 11UV analysis) CCQM-K1.c EUROMET-K1.c
CCQM-P73 Nitrogen Monoxide: 50 µmol/molnominal mole fraction
N2O Mole fraction determined by FTIR analysis
0.000
0.100
0.200
0.300
0.400
0.500
0.600
0.700
0.800
0.900
KRIS
S (M
1)
CSIR
-NM
L (M
2)
CERI (
M3)
VALC
RM
1 (M
4)
LNE (M
5)
SM
U (M
6)
CENAM
(M
7)
VNIIM
(M
8)
NIS
T (M
9)
NM
IA (M
10)
VALC
RM
2 (M
11)
IPQ
(M
12)
NM
i-VSL
(M13
)
CERI (
M14
)
KRIS
S (M
15)
CSIR
-NM
L (M
16)
VALC
RM
3 (M
17)
SM
U (M
18)
LNE (M
19)
CENAM
(M
20)
NM
i-VSL
(M21
)
VNIIM
(M
22)
NM
IA (M
23)
NIS
T (M
24)
IPQ
(M
25)
xN
2O / µµ µµ
mol
/mol
N2O measured by FTIR at the BIPM

18www.bipm.org
Equivalence of standards produced by Static Gravimetry (CH4 in Air)
Trace CH4 mole fractions in balance gas as reported
by participating laboratories in CCQM-K82
Accurate measurements of CH4 in
balance gas at 1 nmol/mol levels
with u(x) < 0.1 nmol/molrequired
Methane in air nominal mole fraction 2000 nmol/mol
19
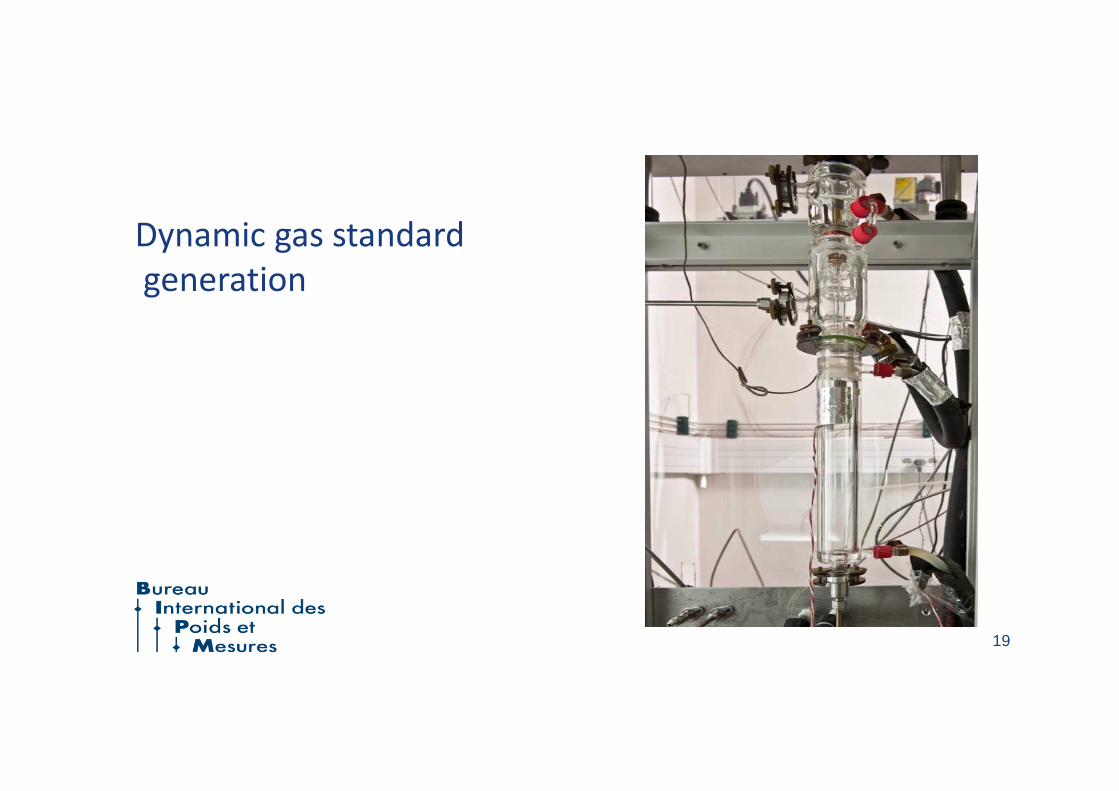
Dynamic gas standard
generation

20www.bipm.org
Magnetic Suspension Balance
Magnetic Suspension Balance:
• Mass load 20 g
• Resolution 2 μg
• Stability over 3 days ~ 0.5 μg
Measurement of the mass of the permeation
tube emitting the analyte
Deduction of the permeation rate qm / (ng min-1)
= mass loss per unit of time
�� ���
��
�� �����
���
And the amount of
substance fraction
Nitrogen Flowqv ~ [50-100] ml min-1
Electromagnet
Permanent Magnet
Measuring load decoupling
Permeation tubeordiffusion cell
Mixing chamber
Thermometer
Air buoyancy free basic load compensation
Magnetic Suspension Balance

Generation of formaldehyde in nitrogen mixtures
Paraformaldehyde
Permeation tube at 110°C
����� �����
������
−���
����
��������� �
3����
�� ���� �
�����
Nitrogen Flowqv ~ [50-100] ml min-1
Electromagnet
Permanent Magnet
Measuring load decoupling
Permeation tubeordiffusion cell
Mixing chamber
Thermometer
Air buoyancy free basic load compensation
Magnetic Suspension Balance
Water content measured by CRDS
with/without permeation tube in the
chamber. Typically 0.5%
Conversion factor measured by FTIR
with/without converter. 100%
conversion with 0.1% uncertainty.
Trioxane
Diffusion cell at 20°C
+ converter at 200°C+ correction for co-emitted water

22www.bipm.org
Choice of source temperature
8 0 9 0 1 0 0 1 1 0 1 2 0
0
5
1 0
1 5
M e a s u r e m e n t s qm
v e r s u s c h a m b e r t e m p e r a t u r e
qm
= qm 0
e x p (- k / T )
w it h qm 0
= 1 .8 2 1 01 9
n g / m in
k = 1 3 5 9 5 K
q m /
(µg
min
-1)
T / °C
Mass loss rate vs. gas chamber temperature
study (paraformaldehyde source)
Chamber temperature to be defined to reach the
target analyte concentration….… and maintained within fixed limits
-0 4 8 1 2
-1 0
0
1 0
∆m /
µg
d a y s
M S B 1 te s ts u s in g a m a s s o f a b o u t 1 5 g
∆ m / µ g = 3 .8 - 0 .4 8 d a y sR e s id u a ls S D = 1 .6 6 µ g
Target noise RSD < 3 µg
With temperature noise < 0.01 K

23www.bipm.org
Mass loss rate analysis
Trioxane diffusion source at 5°C
Low values 1900 ng min-1
Slow drift
Source duration > 1 year
Paraformaldehyde permeation source at 110°C
Large values 7000 ng min-1
Faster drift
Source duration < 4 months
0 2 4 4 8 7 21 9 8 7
1 9 8 8
1 9 8 9
1 9 9 0
1 9 9 1
1 9 9 2
q m /
(ng
min
-1)
h o u rs
N to ta l M e a n S ta n d a rd D e v ia t io n
C o n c a te n a t 2 4 0 1 1 9 8 9 .0 0 5 2 0 .3 1 0 0 8
-1 0 0 4 0 0 9 0 0 1 4 0 0 1 9 0 0 2 4 0 07 0 6 0
7 0 7 0
7 0 8 0
7 0 9 0
7 1 0 0
q m /
(ng
min
-1)
t / m in u te s
m a s s lo s s ra te (n g /m in ) L in e a r F it o f m a s s lo s s ra te
In te rc e p t In te rc e p t S lo p e S lo p e S ta t is t ic sV a lu e S ta n d a rd E rro r V a lu e S ta n d a rd E rro r A d j. R -S q u a re
m a s s lo s s ra te 7 0 9 0 .1 3 4 4 1 0 .0 5 0 2 -0 .0 0 7 1 7 4 .4 6 1 9 7 E -5 0 .9 2 5 3
mqm is almost never constant, even at constant temperature control

24www.bipm.org
0 1 0 0 0 2 0 0 01 0 .7 8
1 0 .7 9
1 0 .8 0 m a s s m e a s u r e m e n ts
m (t ) / g = 1 0 .7 9 8 2 - 6 .5 5 1 0-6
t + 2 .6 4 1 0-1 2
t2
m /
g
t / m in-1 .0 x 1 0 -5
0 .0
1 .0 x 1 0 -5
Choice of statistical analysis
Polynomial fit of mass continuous measurements during a typical analysis period
Trioxane diffusion source
� � � � + ��� + "���#� � � � + ��� + "���#
Mass loss rate
Drift
Mass of the source
Target : RSD < 10 µg in order to obtain typical relative uncertainty < 0.1%

25www.bipm.org
Flow control & measurement
NO2
mass
holding
magnet
suspension
magnet
N2
Oil/water
Bath
Analyte
mass flow
controllers
qv
molbox
Highly concentrated analyte/nitrogen flow
HCHO/N2 80 µmol mol-1
Diluted analyte/nitrogen flow
~ few µmol mol-1
Regular calibration of flow
measurement devices,
in situ,
using same matrix gas,
versus on-site piston prover
=> Typicaly 0.04% relative uncertainty
26www.bipm.org
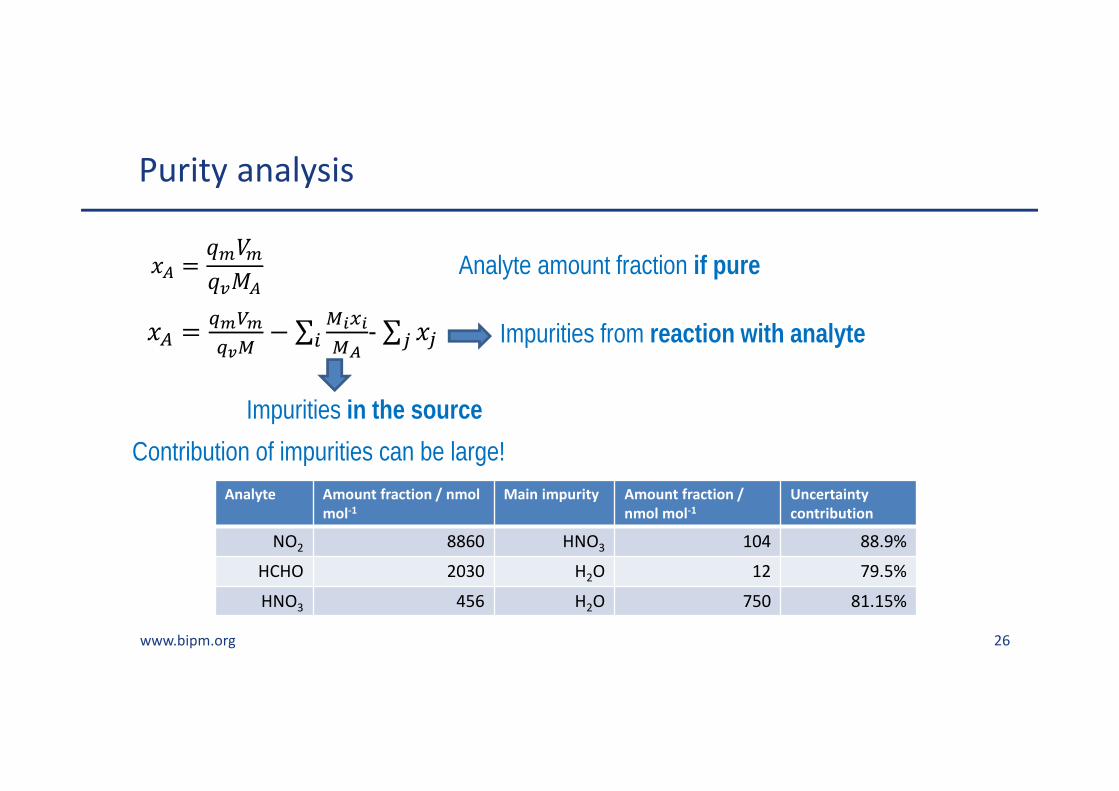
Purity analysis
�� �����
���
�� �$%&%
$'(− ∑
()*)
(+� - ∑ �--
Analyte amount fraction if pure
Impurities in the source
Contribution of impurities can be large!
Analyte Amount fraction / nmol
mol-1
Main impurity Amount fraction /
nmol mol-1
Uncertainty
contribution
NO2 8860 HNO3 104 88.9%
HCHO 2030 H2O 12 79.5%
HNO3 456 H2O 750 81.15%
Impurities from reaction with analyte

27www.bipm.org
Purity analysis by FTIR
Mon Mar 12 13:32:54 2007 (GMT+01:00)
0.002
0.004
0.006
0.008
0.010
0.012
0.014
0.016
0.018
0.020
0.022
0.024
0.026
0.028
0.030
0.032
0.034
0.036
0.038
0.040
Abs
orba
nce
1580 1600 1620 1640 1660 1680 1700
Wavenumbers (cm-1)
x =?
FTIRMeasured spectrum
. . . 21 2290.645159 2.450E-25 7.574E-02.0877.1204 3245.3348 .75 .000000 56 18 Q 3 455 2 2 122 2290.662655 6.192E-24 4.750E-02.0670.0772 2073.5014 .78 .000000 25 5 R 42 455 2 2 123 2290.666003 9.230E-24 4.987E-02.0713.0966 1495.8581 .76 .000000 24 4 P 21e455 2 2 1. . .
. . . 21 2290.645159 2.450E-25 7.574E-02.0877.1204 3245.3348 .75 .000000 56 18 Q 3 455 2 2 122 2290.662655 6.192E-24 4.750E-02.0670.0772 2073.5014 .78 .000000 25 5 R 42 455 2 2 123 2290.666003 9.230E-24 4.987E-02.0713.0966 1495.8581 .76 .000000 24 4 P 21e455 2 2 1. . .
Database of spectroscopic parameters(HITRAN or PNNL or NIST library)
Database of spectroscopic parameters(HITRAN or PNNL or NIST library)
Synthetic calibration – uncertainty driven by database
5-10 %
Gas standard calibration –
uncertainty driven by gravimetry
< 1%
Fourier Transformed InfraRed spectrometer to quantify (infrared actives) impurities
Calibration either with gravimetric standards or using molecular parameters

28www.bipm.org
Water as impurity
FTIR : not appropriate to analyse trace water (large cell, leaks, …)
CRDS : specific analyser, good a trace levels
NO2
mass
N2
molbloc
molbox
BathCRDS analyser
H2O
H2O
H2O
Specific precautions:
• Stainless steel chamber
• Coated tubes
• Dry nitrogen as matrix
• Calibration of water CRDS analyser
~ 5% uncertainty
29www.bipm.org
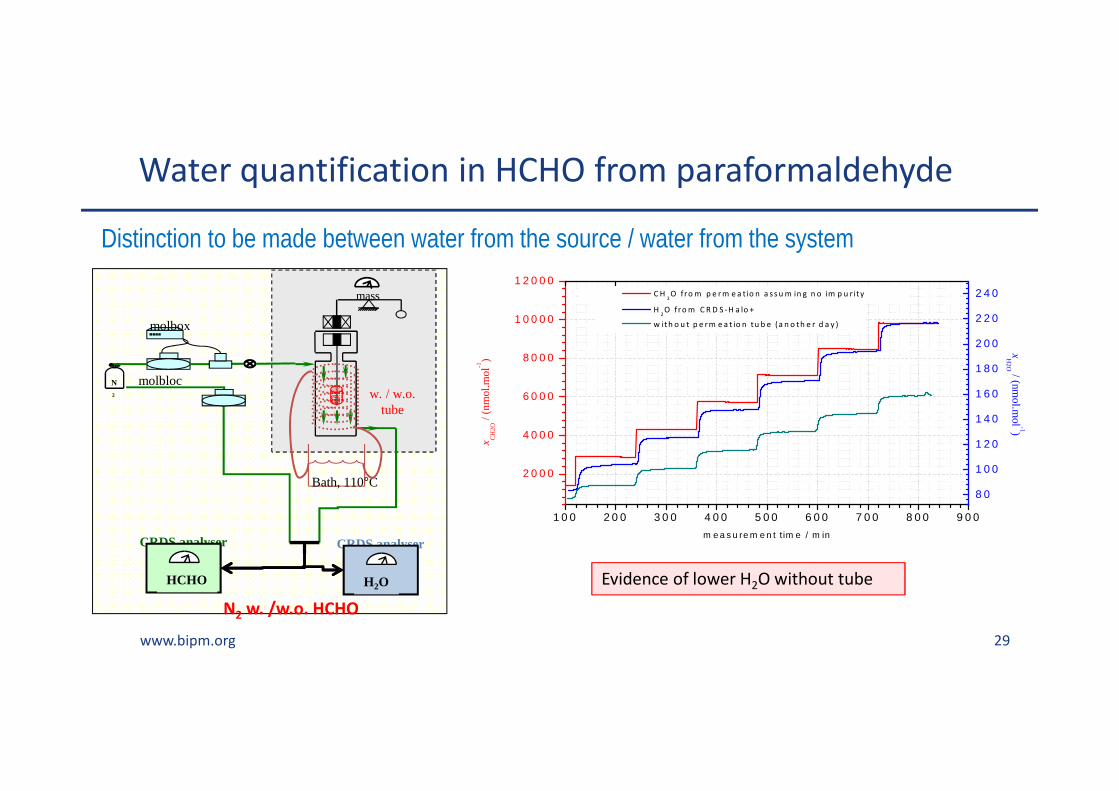
Water quantification in HCHO from paraformaldehyde
NO2
mass
N2
molbloc
molbox
Bath, 110°C
N2 w. /w.o. HCHO
1 0 0 2 0 0 3 0 0 4 0 0 5 0 0 6 0 0 7 0 0 8 0 0 9 0 0
2 0 0 0
4 0 0 0
6 0 0 0
8 0 0 0
1 0 0 0 0
1 2 0 0 0 C H
2O fro m p e r m e a t io n a s s u m in g n o im p u r it y
xH
2O / (nmo
l.mol -1)
x CH
2O /
(n
mol
.mo
l-1)
m e a s u re m e n t t im e / m in
8 0
1 0 0
1 2 0
1 4 0
1 6 0
1 8 0
2 0 0
2 2 0
2 4 0 H
2O fro m C R D S -H a lo +
w ith o u t p e rm e a t io n tu b e (a n o th e r d a y )
CRDS analyser
HCHO
CRDS analyser
H2O
w. / w.o.tube
Distinction to be made between water from the source / water from the system
Evidence of lower H2O without tube
30www.bipm.org
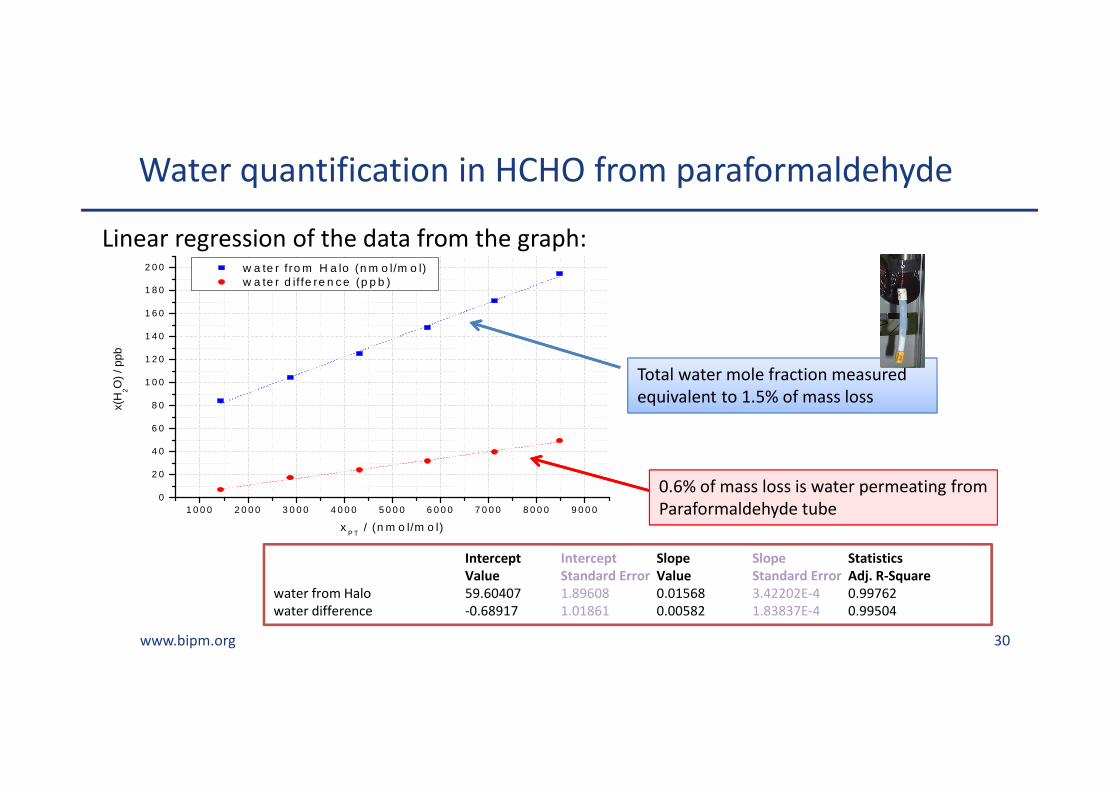
Water quantification in HCHO from paraformaldehyde
Linear regression of the data from the graph:
1 0 0 0 2 0 0 0 3 0 0 0 4 0 0 0 5 0 0 0 6 0 0 0 7 0 0 0 8 0 0 0 9 0 0 00
2 0
4 0
6 0
8 0
1 0 0
1 2 0
1 4 0
1 6 0
1 8 0
2 0 0
x(H
2O)
/ ppb
xP T
/ (n m o l/m o l)
w a te r f ro m H a lo (n m o l/m o l) w a te r d if fe re n c e (p p b )
Intercept Intercept Slope Slope Statistics
Value Standard Error Value Standard Error Adj. R-Square
water from Halo 59.60407 1.89608 0.01568 3.42202E-4 0.99762
water difference -0.68917 1.01861 0.00582 1.83837E-4 0.99504
Total water mole fraction measured
equivalent to 1.5% of mass loss
0.6% of mass loss is water permeating from
Paraformaldehyde tube
31www.bipm.org
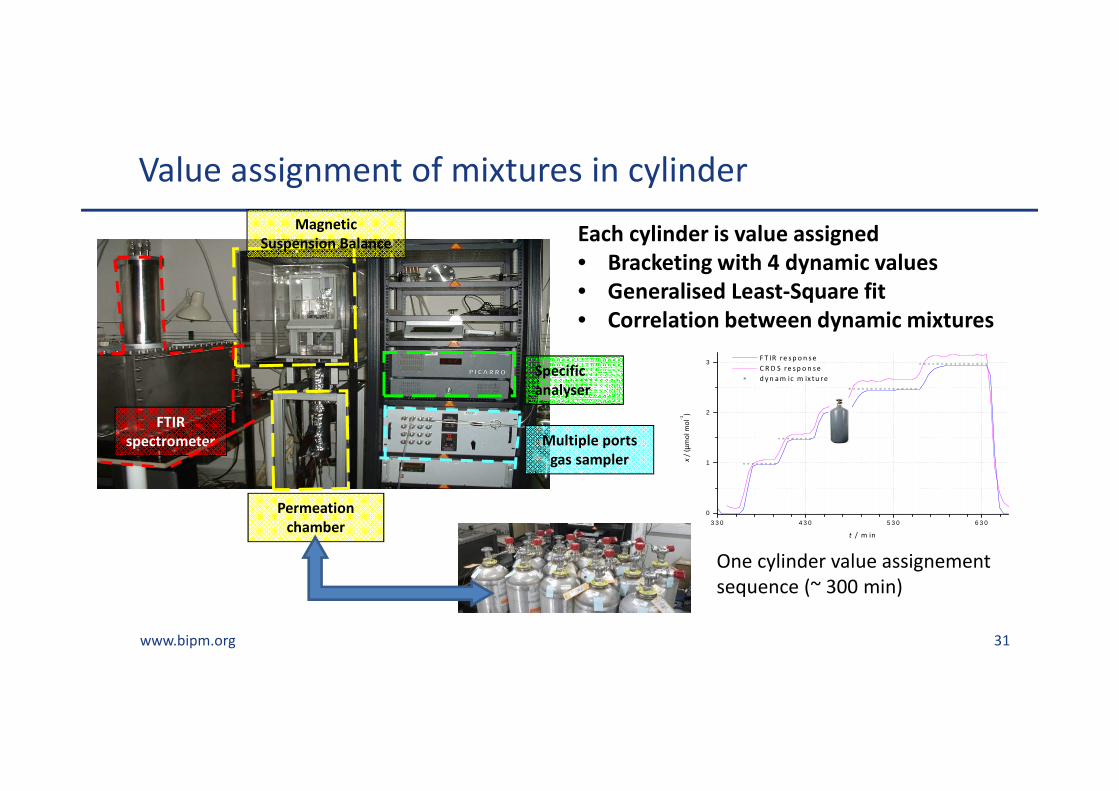
Value assignment of mixtures in cylinder
Magnetic
Suspension Balance
Permeation
chamber
FTIR
spectrometer Multiple ports
gas sampler
Specific
analyser
One cylinder value assignement
sequence (~ 300 min)
Each cylinder is value assigned
• Bracketing with 4 dynamic values
• Generalised Least-Square fit
• Correlation between dynamic mixtures
3 3 0 4 3 0 5 3 0 6 3 0
0
1
2
3 F T IR re s p o n s e
C R D S re s p o n s e
d y n a m ic m ix tu re
x /
(µm
ol
mo
l-1
)
t / m in

32www.bipm.org
Stability of analytical instruments
FTIR and CRDS stability compared on 2 µmol mol-1 of formaldehyde/nitrogen
1 0 0 1 0 1 1 0 2 1 0 3 1 0 4
1 0 -3
1 0 -2
1 0 -1
σ y / (µ
mol
mol
-1)
τ (s )
C R D S , 2 p p m F T IR , 2 p p m
FTIR less noisy due to the choice
of the HCHO absorption band
σ = 2 ppb
σ = 20 ppb

33www.bipm.org
Uncertainty of dynamic calibration gas
Quantity Value unitStandard relative
uncertainty
qm 7000.00 ng min-1 1.21×10⁻³
Vm 22.4037 L mol-1 1.52×10⁻⁵
qv 2.5 L min-1 5.12×10⁻⁴
MHCHO 30.026 g mol-1 6.66×10⁻⁵
xH2O 12.00 nmol mol-1 5.00×10⁻¹
MH2O 18.053 g mol-1 2.77×10⁻⁵
Quantity Value Standard Uncertainty
x(HCHO) 2.082 µmol mol-1 0.005 µmol mol-1
HCHO from paraformaldehyde
• qm(t) modelled by second order polynomial during analysis period
• qV measured by Molbloc calibrated before measurements,
• xH2O measured by CRDS calibrated by NPL, with/without
permeation tube in chamber
Uncertainty calculations performed
with Labview code

34www.bipm.org
Uncertainty of dynamic calibration gas
Quantity Value unitStandard relative
uncertainty
qm 6700.00 ng min-1 9.1×10⁻⁴
Vm 22.4037 L mol-1 1.52×10⁻⁵
qv 2.5 L min-1 5.12×10⁻⁴
M(HCHO)3 90.078 g mol-1 2.22×10⁻⁵
β 1 1.70×10⁻³
Quantity Value Standard Uncertainty
x(HCHO) 2.000 µmol mol-1 0.005 µmol mol-1
HCHO from trioxane
• qm(t) modelled by second order polynomial during analysis period
• qV measured by Molbloc calibrated before measurements,
• β measured by FTIR previously calibrated with trioxane,
with/without trioxane-formaldehyde converter
Uncertainty calculations performed
with Labview code

35www.bipm.org
Gas Standard Value Assignment and Stability Monitoring
Series of measurements
• With paraformaldehyde source first month
• With trioxane source after 30 days
• FTIR as main analytical instrument
• Model linear trend
x0 fitted value at time 0
a1 HCHO loss in µmol mol-1 day-1
t measurement time in days
HCHO mole fraction decrease
� � � � + .��
No impact of switching permeation source

36www.bipm.org
NO2 standard value assignement with dynamic methods
Quantity Value unitStandard relative
uncertainty
qm 8357.30 ng min-1 5.00×10⁻⁴
Vm 22.40037 L mol-1 1.52×10⁻⁵
qv 0.452 L min-1 1.00×10⁻³
MNO2 46.0055 g mol-1 3.04×10⁻⁵
xHNO3 104.00 nmol mol-1 2.02×10⁻¹
MHNO3 63.013 g mol-1 1.86×10⁻⁵
xN2O4 0 µmol mol-1 0.866 nmol/mol
HNO3 quantification by FTIR
referenced to molecular parameters
(HITRAN)
Quantity Value Standard Uncertainty
x(NO2) 8.86 µmol mol-1 0.03 µmol mol-1
37www.bipm.org
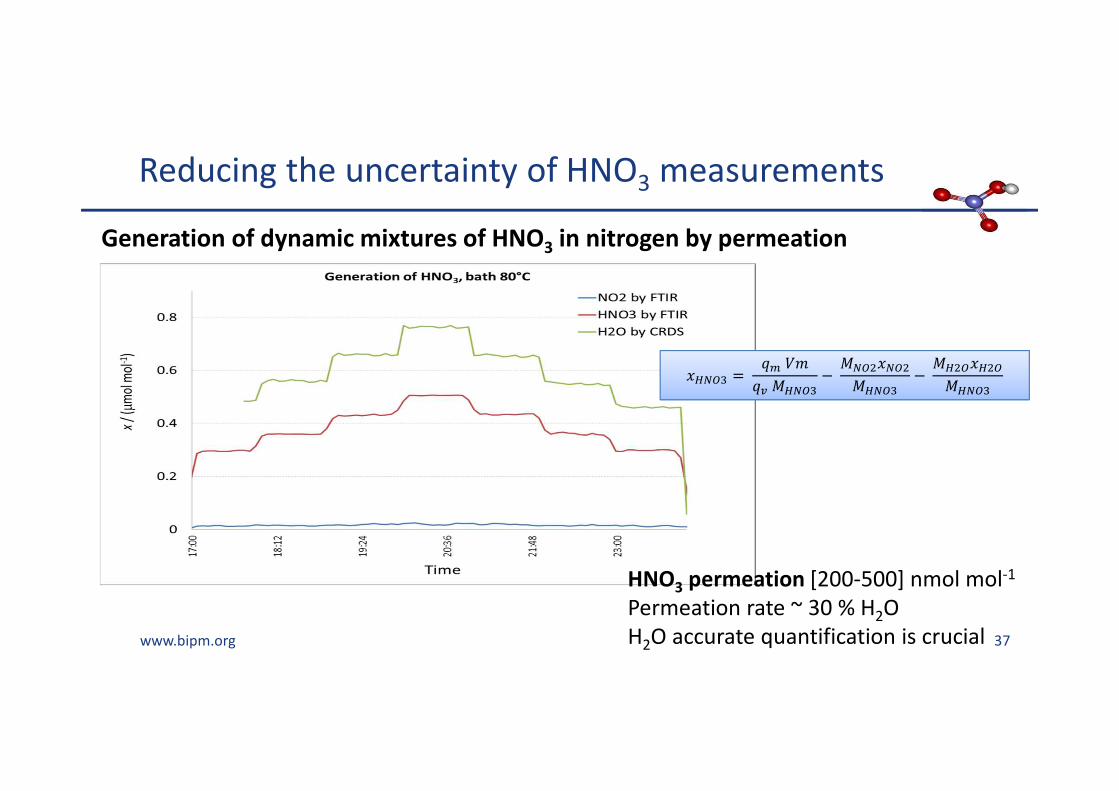
�/012 �����
�� /012
−01#�01#
/012
−/#1�/#1
/012
�/012 �����
�� /012
−01#�01#
/012
−/#1�/#1
/012
HNO3 permeation [200-500] nmol mol-1
Permeation rate ~ 30 % H2O
H2O accurate quantification is crucial
Reducing the uncertainty of HNO3 measurements
Generation of dynamic mixtures of HNO3 in nitrogen by permeation

38
Spectroscopic Methods
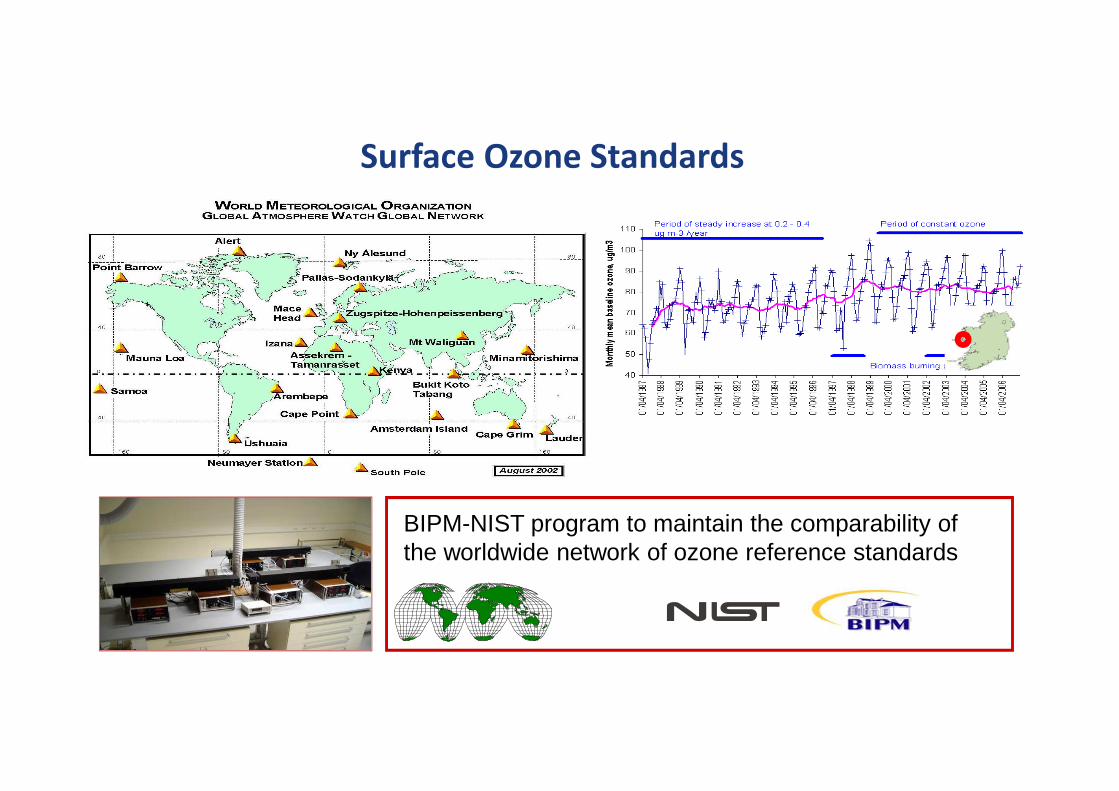
BIPM-NIST program to maintain the comparability of the worldwide network of ozone reference standards
Surface Ozone Standards

40www.bipm.org
Principle of an ozone photometer
Pneumatic module
Pneumatic
valve 1
Pneumatic
valve 2
• Pneumatic module to alternatively direct ozone/air gas
flows in the two gas cells
Measurement Equation:
x /(nmol mol-1) : ozone mole fraction in air P / Pa : Cell pressure T / K : Cell temperatureLopt / m : Light path lengthD : product of transmittances in both cellsα / cm-1 : linear absorption coefficient
std
o p t s td
1ln ( )
2
PTx D
L T Pα−=
O3 / AirSource of
synthetic air
• Ozone generator to produce ozone by photolysis of
oxygen in the range 10 nmol mol-1 to 1000 nmol mol-1
Cell2
UV source Cell1 PD1
PD2Optical bench
Ozone filter exhaust
• Optical bench with light source, optics, gas cells and
detectors to perform absorption measurements

41www.bipm.org
Laser ozone photometer optical setup: Uncertainty budget
Major improvement compared to SRP =
reduced uncertainty on the path length.
Parameter value Standard uncertainty
Relative uncertainty
Temperature T 295 K 0.061 K 2.1×10⁻⁴
Pressure P 1000 mbar 0.64 mbar 6.4×10⁻⁴
Optical length Lopt 893.9 mm 0.4 mm 4.5×10⁻⁴
Product of transmittances D
0.95 1.2×10⁻⁵ 2.6×10⁻⁴
Combined relative uncertainty(without the absorption cross-section)
8.5×10⁻⁴
3 mm diaphragm before/after cells
to help laser alignment
Cells windows not perpendicular to
laser beam
angle 3°
42www.bipm.org
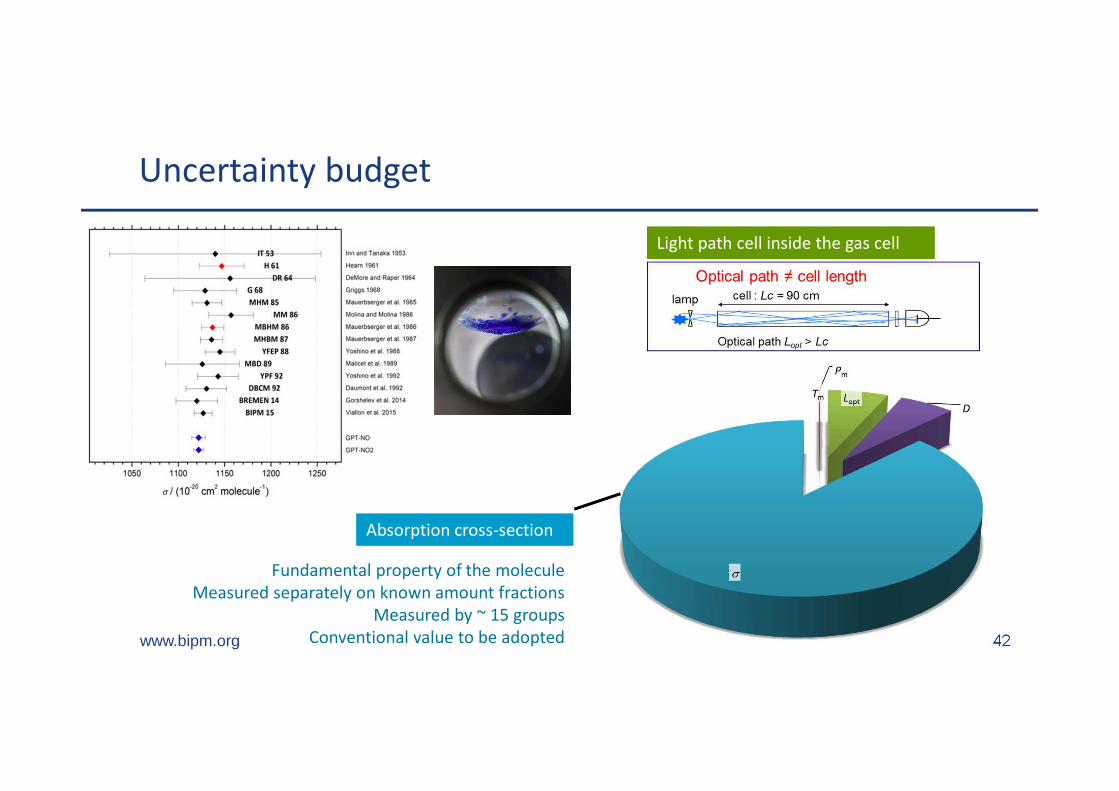
Uncertainty budget
Absorption cross-section Absorption cross-section
Fundamental property of the molecule
Measured separately on known amount fractions
Measured by ~ 15 groups
Conventional value to be adopted
Light path cell inside the gas cellLight path cell inside the gas cell
43
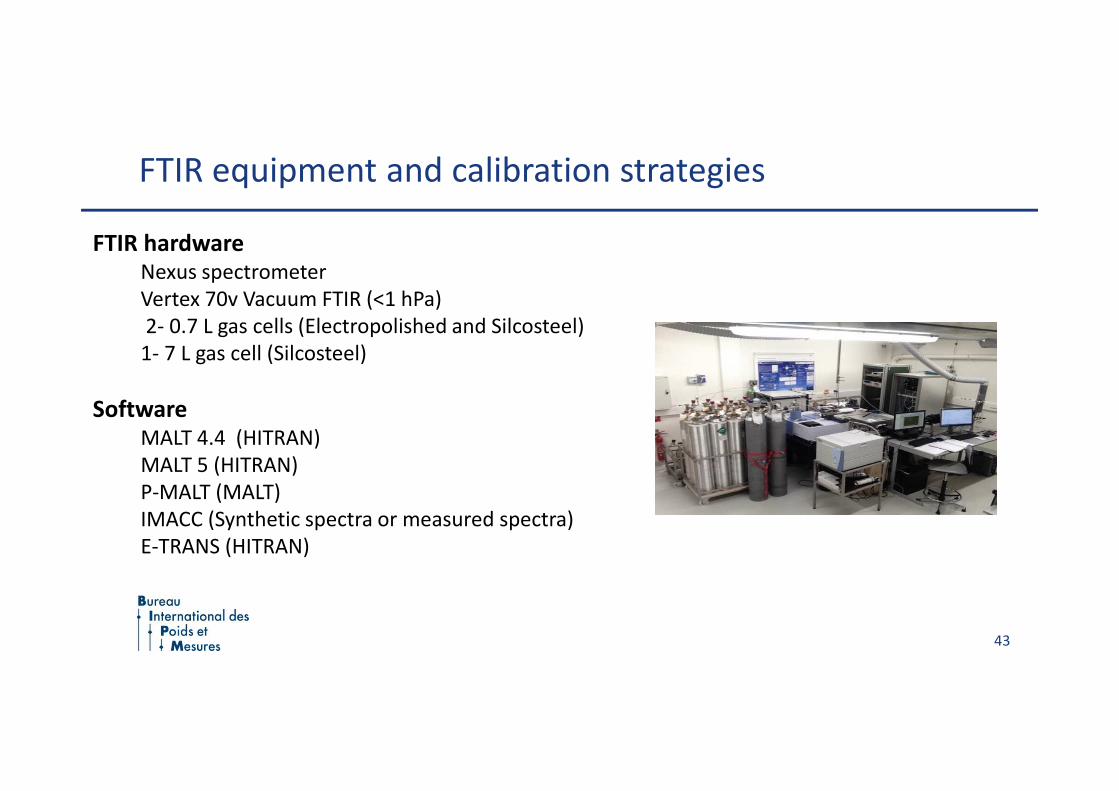
FTIR equipment and calibration strategies
FTIR hardware Nexus spectrometer
Vertex 70v Vacuum FTIR (<1 hPa)
2- 0.7 L gas cells (Electropolished and Silcosteel)
1- 7 L gas cell (Silcosteel)
SoftwareMALT 4.4 (HITRAN)
MALT 5 (HITRAN)
P-MALT (MALT)
IMACC (Synthetic spectra or measured spectra)
E-TRANS (HITRAN)
44
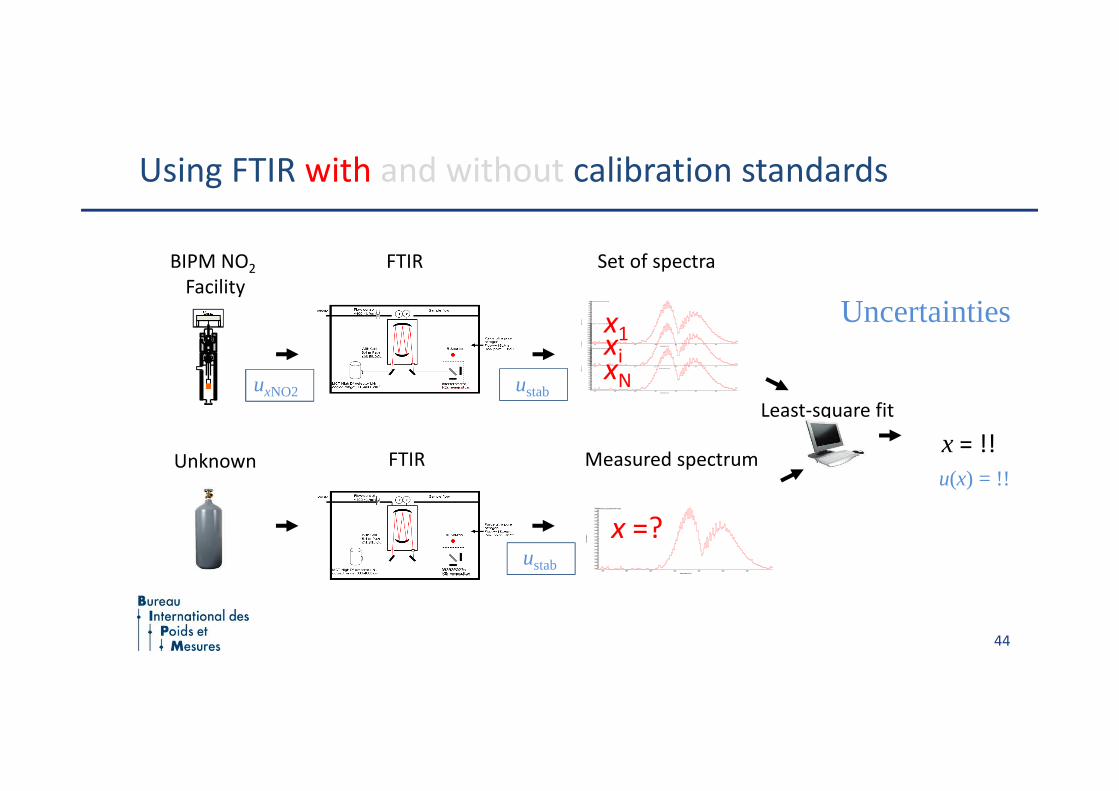
Using FTIR with and without calibration standards
FTIRBIPM NO2
FacilityMon Mar 12 13:32:54 2007 (GMT+01:00)
0.002
0.004
0.006
0.008
0.010
0.012
0.014
0.016
0.018
0.020
0.022
0.024
0.026
0.028
0.030
0.032
0.034
0.036
0.038
0.040
Ab
sorb
an
ce
1580 1600 1620 1640 1660 1680 1700
Wavenumbers (cm-1)
x1Mon Mar 12 13:32:54 2007 (GMT+01:00)
0.002
0.004
0.006
0.008
0.010
0.012
0.014
0.016
0.018
0.020
0.022
0.024
0.026
0.028
0.030
0.032
0.034
0.036
0.038
0.040
Ab
sorb
an
ce
1580 1600 1620 1640 1660 1680 1700
Wavenumbers (cm-1)
xiMon Mar 12 13:32:54 2007 (GMT+01:00)
0.002
0.004
0.006
0.008
0.010
0.012
0.014
0.016
0.018
0.020
0.022
0.024
0.026
0.028
0.030
0.032
0.034
0.036
0.038
0.040
Ab
sorb
an
ce
1580 1600 1620 1640 1660 1680 1700
Wavenumbers (cm-1)
xN
Set of spectra
FTIR
Mon Mar 12 13:32:54 2007 (GMT+01:00)
0.002
0.004
0.006
0.008
0.010
0.012
0.014
0.016
0.018
0.020
0.022
0.024
0.026
0.028
0.030
0.032
0.034
0.036
0.038
0.040
Abs
orba
nce
1580 1600 1620 1640 1660 1680 1700
Wavenumbers (cm-1)
x =?
Measured spectrumUnknown
Least-square fit
x = !!
Uncertainties
ustabuxNO2
ustab
u(x) = !!

45
MALTHITRAN
Database of line strengths
+Spectrometer characteristics
(Lopt, aperture, resolution, …)
Software simulating the spectrometer
response
Mon Mar 12 13:32:54 2007 (GMT+01:00)
0.002
0.004
0.006
0.008
0.010
0.012
0.014
0.016
0.018
0.020
0.022
0.024
0.026
0.028
0.030
0.032
0.034
0.036
0.038
0.040
Ab
sorb
an
ce
1580 1600 1620 1640 1660 1680 1700
Wavenumbers (cm-1)
x1Mon Mar 12 13:32:54 2007 (GMT+01:00)
0.002
0.004
0.006
0.008
0.010
0.012
0.014
0.016
0.018
0.020
0.022
0.024
0.026
0.028
0.030
0.032
0.034
0.036
0.038
0.040
Ab
sorb
an
ce
1580 1600 1620 1640 1660 1680 1700
Wavenumbers (cm-1)
xiMon Mar 12 13:32:54 2007 (GMT+01:00)
0.002
0.004
0.006
0.008
0.010
0.012
0.014
0.016
0.018
0.020
0.022
0.024
0.026
0.028
0.030
0.032
0.034
0.036
0.038
0.040
Ab
sorb
an
ce
1580 1600 1620 1640 1660 1680 1700
Wavenumbers (cm-1)
xNLeast-square fit
x = !!
Mon Mar 12 13:32:54 2007 (GMT+01:00)
0.002
0.004
0.006
0.008
0.010
0.012
0.014
0.016
0.018
0.020
0.022
0.024
0.026
0.028
0.030
0.032
0.034
0.036
0.038
0.040
Abs
orba
nce
1580 1600 1620 1640 1660 1680 1700
Wavenumbers (cm-1)
x =?
FTIR Measured spectrumUnknown
uMALT-CLSuHITRAN
uP1, uPi,…
u(x) = !!
ustab
Uncertainties
Using FTIR with and without calibration standards
Set of spectra

46
Determination of the White-cell’s path length
∗=
r
rrrsss
T
PLCK
Ts
PLC
Use Origin #Cylinder Assigned NO2 mole factionµmol·mol-1
Certified standard uncertainty µmol·mol-1 (%)
Matrix gas
Reference NPL L1000025 99.99 0.8 (0.8) Nitrogen/Oxygen
Sample VSL 680178 11.00 0.22 (1.0) Nitrogen
Barometer (Series 6000) uncertainty uP
=0.04 %.
100 Ω RTD temperature probe placed into the gas cells, with standard uncertainty uT1 = 0.02 K
Pathlength uncertainty Lopt
47
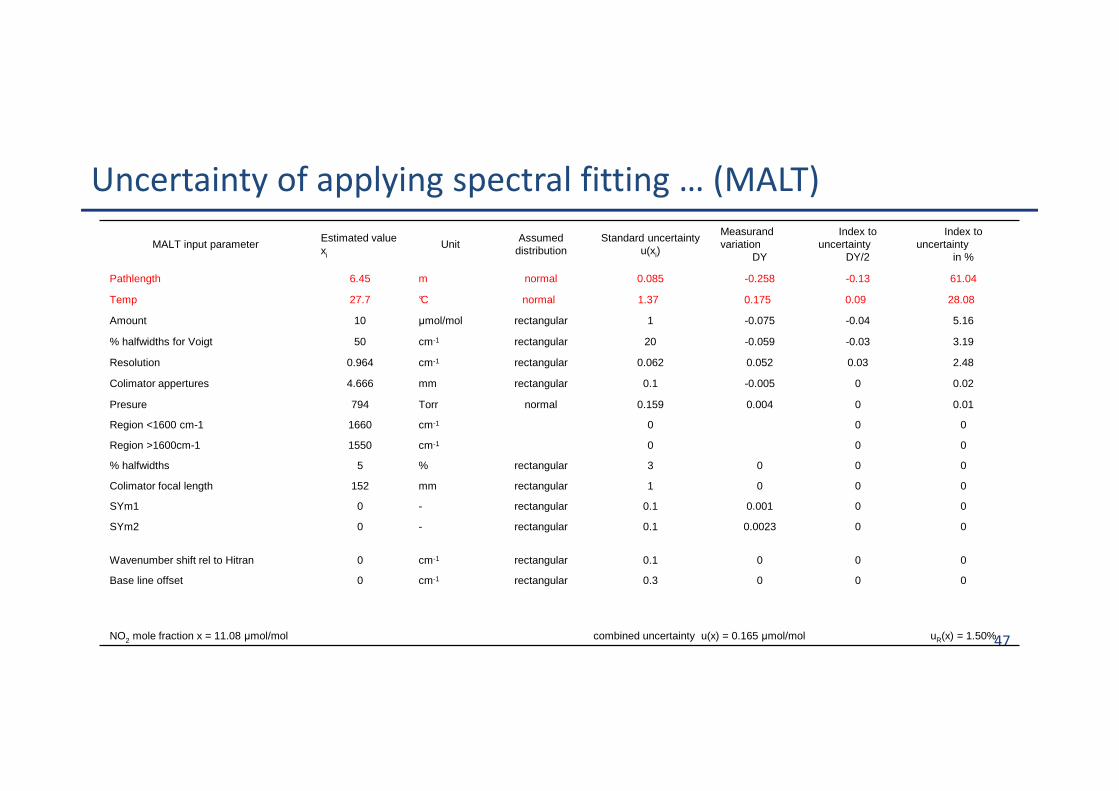
Uncertainty of applying spectral fitting … (MALT)
MALT input parameterEstimated value xi
UnitAssumed
distributionStandard uncertainty
u(xi)
Measurand variation
DY
Index to uncertainty
DY/2
Index touncertainty
in %
Pathlength 6.45 m normal 0.085 -0.258 -0.13 61.04
Temp 27.7 °C normal 1.37 0.175 0.09 28.08
Amount 10 µmol/mol rectangular 1 -0.075 -0.04 5.16
% halfwidths for Voigt 50 cm-1 rectangular 20 -0.059 -0.03 3.19
Resolution 0.964 cm-1 rectangular 0.062 0.052 0.03 2.48
Colimator appertures 4.666 mm rectangular 0.1 -0.005 0 0.02
Presure 794 Torr normal 0.159 0.004 0 0.01
Region <1600 cm-1 1660 cm-1 0 0 0
Region >1600cm-1 1550 cm-1 0 0 0
% halfwidths 5 % rectangular 3 0 0 0
Colimator focal length 152 mm rectangular 1 0 0 0
SYm1 0 - rectangular 0.1 0.001 0 0
SYm2 0 - rectangular 0.1 0.0023 0 0
Wavenumber shift rel to Hitran 0 cm-1 rectangular 0.1 0 0 0
Base line offset 0 cm-1 rectangular 0.3 0 0 0
NO2 mole fraction x = 11.08 µmol/mol combined uncertainty u(x) = 0.165 µmol/mol uR(x) = 1.50%

48
5 6 7 8 9 10 11 12 13 140
0.1
0.2
0.3
0.4
0.5
combined uncertaintystabilityhitranMALT-CLS
NO2 mole fraction / (ppm)
unc
ertainty
/(p
pm)
( ) ( ) ( )2NO
2NO
2NO 222
03.0015.0020.0)( xxxu ++=
Total uncertainty:
{Stab} {MALT-CLS}
{Hitran}
xNO2=10 µmol mol-1
Mode A
(With standards)
Mode B
(Without
standards)
Numerical
equation in
µmol mol-1

49
Measurement of CO2 (and CO2 isotopologues) by FTIR
x’626*10 x’636*300x’628*600x’627*4000
x’626*1 x’636*30x’628*60x’627*400
More intense bands but more overlap of isotopologue signals
Less intense bands Less overlap of isotopologue signals

50
Accurate measurement of CO2 (and CO2 isotopologues) by FTIR
δ�2C �
13C12C
5.�678 −13C12C
5�.9�.:�
13C12C
5�.9�.:�
13C
12CIsotope ratio:

Traceability Chain for δ-scale CO2 isotope ratio measurements
CO2 (pure): δ13C, δ18O
Measurand and Unit- Definition
Reference Materials across scaleRM8562, 8563, 8564
Working Standards in specialistlaboratory (University)
Commercially AvailableStandards
RESULTCO2 in µmol/mol
Phosphoric acid reaction and mass specmeasurement procedure(Peer reviewed literature)
IAEA
Specialty
Gas
Industry
NBS 19, LSVEC (Fix VPBD scale and second
calibration point)
End User
Mass spec measurement procedure(Peer reviewed literarture)
End user Measurement Procedure
Mass spec measurement procedure(Peer reviewed literature)
NIST
University
Laboratory

www.bipm.org 52www.bipm.org
Measuring Carbon isotope ratios in CO2 in Air
IRIS Calibration Sequence
δ13C CO2 measurement
validation

53
Manometric Methods

WMO GAW network is the designated baseline network for CO 2 and CH4
• NOAA/ESRL is the Central Calibration Laboratory for CO2 and CH4 (and other trace gases)
Carbon dioxide

55
Initially well known amount of air, Vair, Tair and Pair.
Extract CO2 from the air by cooling
Expand the CO2 in another (smaller) well known volume, VCO2, TCO2 and PCO2
Manometry: Basic principle
;<=> �?<=>
?@AB�
C
DE
F<=>
F@AB
G@AB
G<=>
C +H@AB G@AB F@AB
DG@AB
C +H<=> G<=> F<=>
DG<=>
DE �E@AB
E<=>

56
System layout: CO2 Manometry
Sample
Oven
Cryotrap
Glass vacuum system
GasAnalyser

57
System overview
Turbopump
RGA
Cryotrap
Glass vacuum system
Oven
Gas distribution manifold

Principle of operation
P3
CO2 MUST NOT BE LOST ON THE MATERIALS USED IN THE SYSTEM
59
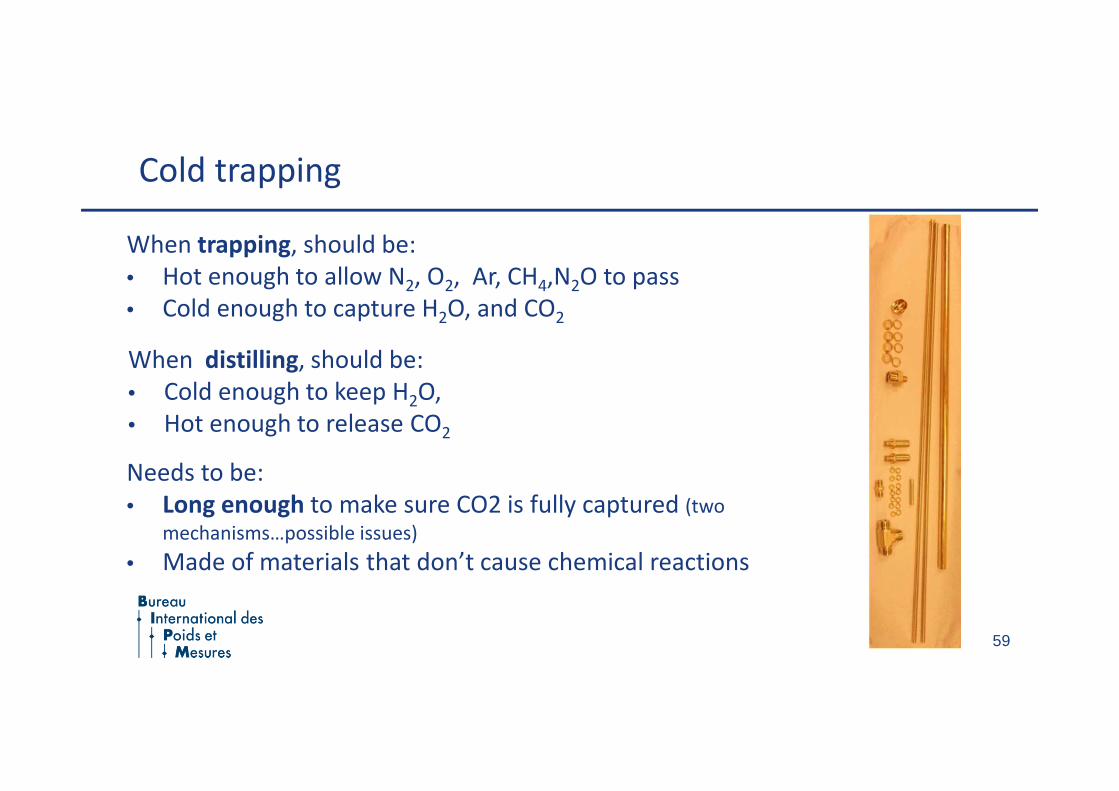
When trapping, should be:
• Hot enough to allow N2, O2, Ar, CH4,N2O to pass
• Cold enough to capture H2O, and CO2
Cold trapping
When distilling, should be:
• Cold enough to keep H2O,
• Hot enough to release CO2
Needs to be:
• Long enough to make sure CO2 is fully captured (two
mechanisms…possible issues)
• Made of materials that don’t cause chemical reactions

60
RGA can diagnose input cold trap
H2O
CO2

61
Temperature: Differences below 0.05°C
Temperature and Pressure Measurement
Comparison against external
reference standard kept at
100 kPa.
Short term stability and
hysteresis are excellent, well
below 1 Pa.
Pressure Measurement at two
distinct levels, 100 kPa and 30 kPa.

62
CO2 Extraction sequence

Manometric System for O3 Cross Section Measurements
AOM Accousto-Optic Modulator;
BS Beam Splitter;
CDG Capacitive Diaphragm Gauge
(Baratron);
CRYO Cryogenic ozone generator;
LT Light Trap;
M Mirror;
RGA Residual Gas Analyser ;
TMP Turbo Molecular Pump;
V Valve;
WM Wavemeter

Ozone generator
Ozone produced by discharges in pure
oxygen
generator = double wall cylinder in glass
generation part inserted in cryostat
controllable cryostat temperature from
74 K and above
20 kV, 50 kHz Liquid ozone trapped at 80 K

Absorption path length measurements by interferometry
Michelson interferometer to deduce Lopt in the cell in which the pressure is varied
( ) a01
2n L F
λ− =
n : index of refraction of air L0 / m : light path length F : number of fringesλa / m : laser wavelength
( )( )
8 2 1 2 1 81 0 8 3 4 2 .5 4 2 4 0 6 1 4 7 (1 3 0 ) 1 5 9 9 8 (3 8 .9 ) 1 1 0 0 .6 0 1 0 .0 0 9 7 21
9 6 0 9 5 .4 3 1 0 .0 0 3 6 6 1
p T pn
T
σ σ− − − −⋅ + − + − + ⋅ −− =
+
Pressure in the cell: 1 bar -> 0.1 mbar
-> F fringes on the photodiode
-> Path length L0
Edlen formula for the air index of refraction at pressure P and temperature T

Absorption path length measurements by interferometry
0 2 4 6 8 1 04 .9 5
4 .9 6
4 .9 7
4 .9 8
4 .9 9
5 .0 0
5 .0 1
path
leng
th (
cm)
M e a s u re m e n t n u m b e r
Lo p t
= 4 .97 8 cm w ith u (Lo p t
) = 0 .0 12 cm Quantity Value Standard Uncertainty
F 42 0.102
T 22.3 °C 0.018 °C
Pa 1003.25 hPa 0.852 Pa
λa 0.632823 µm 3.47×10⁻⁶ µm
λv 0.632991 µm 0.29×10⁻⁶ µm
Lopt 4.979 cm 0.012 cm
Uncertainty budgetMeasurements
OK to be used for cross-section measurements,
provided same laser path in the gas cell
ACSO meeting, Geneva, 3-5 June 2013, 66
UV Laser beam
HeNe beam

Ozone cross-section measurement principle
3
3O 0
1ln ( )O
o p t
T R I
L P N a Iσ =
Light beam
I0 ILopt
(P,T)Sample of pure ozone
Pressure : pressure sensors measure total
pressure PT, not partial pressure PO3 = x(O3) PT
3T 3 0
1ln ( )
(O )Oo p t
T R I
L P x N a Iσ =
⋅
Purity = assessment of impurities
- condensables xC
- non-condensables xNC
30
T
1ln ( )
1 N C C
Oo p t
i i
T R I
L N a IP x x
σ = ⋅ − −
∑ ∑

68www.bipm.org
Comparison of methods

www.bipm.org
Thank you.