Embed Size (px)
Citation preview

ORES Working Paper Series
Number 89
Widows Waiting to Wed?(Re)Marriage and Economic Incentives in Social Security Widow Benefits
Michael J. Brien*Stacy Dickert-Conlin**
David A. Weaver***
Division of Economic Research
January 2001
Social Security AdministrationOffice of Policy
Office of Research, Evaluation, and Statistics
* Economics Department, University of VirginiaRouss Hall 114, Charlottesville, Virginia 22904-4182
** Center for Policy Research, Syracuse University426 Eggers Hall, Syracuse, New York 13244
*** Social Security Administration, Office of Policy9th Floor, ITC Building, 500 E Street, S.W., Washington, DC 20254-0001
Working Papers in this series are preliminary materials circulated for review and comment. Theviews expressed are the authors’ and do not necessarily represent the position of the Social SecurityAdministration. The papers have not been cleared for publication and should not be quoted withoutpermission.

Summary
In this paper we focus on an age restriction for remarriage in the Social Security system todetermine if individuals respond to economic incentives for marriage. Aged widow(er) benefits arepaid by the federal government to persons whose deceased spouses worked in Social Securitycovered employment. A widow(er) is eligible to receive benefits if she or he is at least age 60. If awidow(er) remarries before age 60, she or he forfeits the benefit and, therefore, faces a marriagepenalty. Under current law, there is no penalty if the remarriage occurs at 60 years of age or later.The Social Security rules on remarriage have changed over time. Only since 1979 have widow(er)sbeen allowed to marry at or after age 60 and not face reductions in benefit amounts.
We investigate whether the age-60 remarriage rule affects the timing of marriage and whetherthe elimination of the marriage penalty in 1979 encouraged widows 60 or older to marry. For thisstudy, we primarily use Vital Statistics data from the National Center for Health Statistics.
Our major findings are as follows. In 1979, there was an increase in the marriage rate ofwidows 60 or older. This suggests many widows in this age group chose not to marry until themarriage penalty they faced was removed. Also, in the post-1979 period, there was a drop inmarriage rates immediately prior to age 60 and an increase after this age. We do not observe thispattern in the period before 1979, and we do not observe it for divorced women, who generally arenot subject to the age-60 remarriage rule. These findings suggest the age-60 remarriage rule affectsthe timing of marriage and has the most influence on women who are very close to age 60.

I. Introduction
“Lynn is a 57-year-old widow in love. But she fears that getting married soon, as she and her fiancéplanned, could cost her a fortune because of the rules that govern Social Security. Governmentofficials acknowledge that she’s right. ‘At least she’s smart enough to check it out ahead of time,’says Leslie Walker, a spokeswoman with the Social Security Administration in San Francisco, ‘I justdealt with a couple where she was a teacher and he was a government employee (two groups thatgenerally can’t claim Social Security on their own records). They both thought they could get theirdeceased spouses’ benefits. But because they married before age 60, they get nothing.’”
“Indeed, one of the many things people don’t know about Social Security is how drastically it can beaffected by marital status.” The Los Angeles Times, August 13, 1995. “What Widows Should KnowBefore Remarrying,” by Kathy M. Kristof.
Economic theory suggests that economic incentives play a role in family structure decisions
(Becker 1973, 1974). In support of this theory, there is a growing body of evidence that the implicit
incentives in government programs affect decisions of whether and when to marry, cohabit, or
divorce. Most of this literature focuses on the income tax system or welfare programs like Aid to
Families with Dependent Children (AFDC) and Medicaid.1 None of this literature focuses on the
marriage decisions of the elderly, despite marriage penalties in the Social Security program and the
economically vulnerable status of this group.
Acknowledgments: Dickert-Conlin would like to thank Pilot Projects in Aging Research from the Center forDemography and Economics of Aging, in the Center for Policy Research at Syracuse University, for initial fundingof this project. Doug Wolf and Dan Black provided much encouragement of our work. Aaron Yelowitz providedvery helpful comments. We would also like to thank seminar participants at Cornell University, SyracuseUniversity, the annual meetings of the Population Association of America, the University of Virginia, the Council ofEconomic Advisers, the Society of Government Economists, and the Summer Research Workshop at the Institutefor Research on Poverty. Jim Weed and Sally Curtain from the National Center for Health Statistics/Vital Statisticswere very gracious about answering our data questions. We would also like to thank Amitabh Chandra, MikeConlin, Karen Holden, Joseph Hotz, Amy Shannon, and Lowell Taylor for their very valuable assistance andReagan Baughman for her excellent research assistance.
1 See Alm, Dickert-Conlin, and Whittington (1999) for an overview. In the income tax literature, see Groeneveld,Tuma, and Hannan (1980), Alm and Whittington (1999, 1997, and 1995), Whittington and Alm (1997), Sjoquist andWalker (1995), Gelardi (1996). In the welfare literature, see Moffitt (1998) for a comprehensive survey.

2
In this paper we focus on an age restriction for remarriage to determine if individuals respond
to economic incentives for remarriage. Aged widow(er) benefits are paid by the federal government
to persons whose deceased spouses worked in Social Security covered employment. A widow(er) is
eligible to receive benefits if she or he is at least age 60. If a widow(er) remarries before age 60, she
or he forfeits the benefit and, therefore, faces a marriage penalty. Under current law, there is no
penalty if the remarriage occurs at 60 years of age or later. We investigate whether this rule affects
the marriage behavior of widows. 2 We narrow our focus to widows, rather than widowers, because
the overwhelming percentage of survivor benefits are paid to women (over 98 percent).3 In 1998,
there were 11 million widows in the United States, 1.5 million of whom were close to age 60 (55 to
64 years old) (Lugaila 1998).4
In addition to providing empirical evidence for economic theory, understanding the role that
Social Security plays in determining marital status is relevant for at least three reasons. First, there is
evidence that marriage is positively correlated with health outcomes, life expectancy, and economic
well-being (Waite 1995), yet we do not know if Social Security influences the decision of whether or
not to be married. Because husbands from low-income families tend to die at younger ages, the
widows who are subject to these penalties are most likely to be economically vulnerable. In 1995,
for example, the poverty rate of widows aged 65 or older was 19.2 percent. This is in sharp contrast
to a 4.2 percent poverty rate for elderly married women (U.S. Congress 1998). Second, there are
efficiency losses if Social Security causes women to bypass opportunities to marry simply because of
the penalty implicit in the system.5 Finally, marriage penalties in Social Security raise equity issues.
2 A growing literature finds that taxes are correlated with the timing of events including birth (Dickert-Conlin andChandra 1999), marriage (Alm and Whittington 1997; Gelardi 1996), capital gains realization (Burman andRandolph 1994), and charitable contributions (Randolph 1995).3 See tables 5.A1 and 5.G3 in U.S. Social Security Administration (1999).4 There were only 1.5 million widowers, with 275,000 between the ages of 55 and 64 (Lugaila 1998). Preliminaryanalysis on a sample of men was very noisy given these small sample sizes.5 Other literatures address this efficiency concept, but the marriage literature largely ignores it. For example, there isan implicit subsidy for delaying realization of capital gains in the form of deferred taxation, causing investors to

3
For example, under current law, Social Security benefits may change purely with a change in legal
marital status. If cohabitation is increasingly a substitute for legal marriage among the elderly, it is
not clear that a cohabiting couple should receive different Social Security benefits than a legally
married couple. As another example, the penalty may be inequitable if knowledge of the marriage
penalty implicit in Social Security is not universal.
To examine the question of whether Social Security rules governing remarriage affect
behavior, we examine the rates of remarriage of women around age 60 under current as well as past
Social Security eligibility rules. Our results provide compelling evidence that widows respond to
economic incentives—delaying or forgoing marriage when the costs for such behavior are high. In
Section II we first describe the relevant Social Security laws and present an analysis of the size of the
penalties under current law. Section III reviews the relevant existing literature. Section IV provides
evidence from the National Center for Health Statistics/Vital Statistics (NCHS/VS), the primary data
used in our analysis, that Social Security influences marriage behavior. Section V concludes and
outlines future research.
II. Social Security Remarriage Incentives for Widows
A. Social Security Program Rules
Much of the discussion in this section focuses on widows who are under the age of 60 and
who were married to persons who worked in Social Security covered employment.6 Such people will
potentially be eligible for widow benefits from Social Security when they reach age 60. If an eligible
widow claims benefits at age 60, she will receive a monthly benefit amount equal to 71.5 percent of
bypass more lucrative investments and resulting in efficiency loss (see Auerbach 1992, for example). The story isanalogous for marriage decisions.6 Recipients of Tier I-Railroad Retirement Survivor Benefits are subject to these same rules.

4
the deceased husband’s primary insurance amount (PIA).7 The widow may choose to defer receipt
of benefits until after age 60 and receive a higher monthly benefit. If she defers receipt until the
normal retirement age (NRA), she will receive a monthly amount equal to 100 percent of the
deceased husband’s PIA.8
The current law requires that the widow be unmarried in order to claim widow benefits,
unless the marriage occurred after the widow attained age 60.9 That is, a widow who remarries
before age 60 has no claim to the widow benefits (so long as the remarriage remains intact) and
therefore faces a marriage penalty. However, a widow who remarries after reaching age 60 retains
full claim on these benefits.10
Remarriage at any time makes the widow potentially eligible for spouse benefits on her new
husband’s work record, so marriage is unlikely to leave a woman ineligible for Social Security.
However, spouse benefits may be less generous than widow benefits for two reasons. First, a spouse
benefit cannot be claimed until age 62 (and, then, only if her husband receives a Social Security
benefit). Second, Social Security pays a lower rate for a spouse benefit than a widow benefit. A
spouse benefit claimed at the NRA is equal to 50 percent of her husband’s PIA, rather than 100
percent of her deceased husband’s PIA. Like widow benefits, spouse benefits are actuarially reduced
if claimed before the NRA— at age 62 a spouse receives 37.5 percent of PIA.11 In sum, if a woman
remarries someone with a PIA that is similar to that of her deceased husband, her spouse benefits are
much lower than her widow benefits.
7 The Social Security Administration computes a person’s PIA based on the person’s average earnings in SocialSecurity covered employment.8 For those born before 1940, the NRA for widow(er) benefits is age 65. For later birth cohorts, the NRA isgradually rising to age 67.9 Technically, from a Social Security perspective, a widow attains age 60 “the first moment” of the day before her60th birthday.10 One extreme implication of this law is that a widow could remarry any time before age 60, legally divorce at age59 years and 364 days, and remarry again (the same person) on her 60th birthday without losing eligibility for widowbenefits. We do not have the appropriate data to consider this type of behavior.11 This figure applies to people born before 1938. The figure is lower for later cohorts.

5
An example illustrates the Social Security rules and the potential size of the marriage penalty.
Throughout our example, we assume a 60-year-old woman has a life expectancy of 275 months (22.9
years) and a 62-year-old man has a life expectancy of 210 months (17.5 years) (U.S. Social Security
Administration 1999). Suppose a widow considers marriage to a man two years her senior. She has
never worked but her deceased husband and her prospective husband did, and, based on their lifetime
earnings, both have PIAs of $1,000.12 If the widow waits until she reaches age 60 to marry, she can
collect, at that age, a monthly widow benefit of $715 on her first husband’s record. This will
continue for 210 months (that is, until her second husband dies). At that time, she is older than the
NRA. Therefore, when she files for a widow benefit on the second husband’s record she receives
100 percent of the PIA, or $1,000, for the remaining 65 months of her life (Social Security will not
pay her both widow benefits, only the higher one).
If the widow does not wait until age 60 to marry, she cannot claim the widow benefit on her
first husband’s record. This leaves her ineligible for Social Security benefits for the first 24 months
after attaining age 60. Assume that she files for the spouse benefit from her second husband’s record
at age 62. She then will receive $375 for the next 186 months. When her second husband dies, she
will receive a full widow benefit of $1,000 for the last 65 months of her life. At age 60, the present
discounted value of the widow’s Social Security benefits is approximately $88,000 if she does not
wait to marry, versus $152,000 if she does wait to marry.13 Thus, there are strong incentives to wait
until after age 60 to marry.
12 Obviously, it is not likely the two men would have identical PIAs, but we might expect the first and secondhusband to be from similar socioeconomic backgrounds and thus have roughly similar earnings and PIAs. Theaverage PIA of men retiring in 1998 was about $1,000 (U.S. Social Security Administration 1999).13 This assumes a monthly rate of interest of 0.25 percent. On an annual basis, this is close to the 3 percent real rateof return that the Social Security Trust Funds are projected to earn (Board of Trustees 1999). In this example, weassume a widow receives a fixed dollar amount for a specified period of months. In actuality, Social Securitybenefits and PIAs are adjusted for inflation over time. In the present value calculations, we use the fixed dollaramounts because we use a real rate of interest for the discounting.

6
At this point something should be said about widows who have, themselves, worked in
covered employment. A person who has worked enough in covered employment to be fully insured
is eligible to receive a retired-worker benefit from Social Security as early as age 62.14 The amount
of the retired-worker benefit depends on the PIA from one’s own work record and on the age at
which it is first received. If claimed at the NRA, the benefit equals the PIA, otherwise it is reduced.
Even if a widow is insured for benefits in her own right, her widow benefits can be valuable. For
example, widows may claim survivor benefits as early as age 60, two years before they can claim
their retired-worker benefits. Also, Social Security rules allow a fully insured widow to claim a
reduced widow benefit before the NRA and then switch to a full retired-worker benefit at the NRA
(if it is higher). Thus, even fully insured widows face a marriage penalty because they lose their
claims to these options if they remarry before age 60.
Divorced women who were married for at least 10 years are eligible for spousal benefits on
the records of their former spouses. For divorced women whose ex-husbands are not deceased,
remarriage at any age results in a termination of benefits. However, under some circumstances,
divorced women face marriage incentives similar to widows. A divorced woman who was married
for at least 10 years to a man who worked in covered employment is potentially eligible for a
surviving divorced spouse benefit upon his death. The rules governing surviving divorced spouse
benefits are essentially the same as those that govern widow benefits. Specifically, under current
law, surviving divorced spouses lose eligibility if remarriage occurs before age 60. However,
according to the U.S. Department of Health and Human Services (1985) only a small percentage (17
14 For people born after 1928, 40 “quarters” of work in Social Security covered employment are necessary for fullyinsured status. For those born in or prior to 1928, the number of required quarters is smaller. See U.S. SocialSecurity Administration (1999) for more details.

7
percent) of divorced women entering their retirement years receive surviving divorced spouse
benefits.
The current system reflects a series of law changes, beginning in 1965, that altered the
marriage penalties in Social Security. Before 1965, widows lost eligibility for widow benefits if they
remarried at any time. In July of 1965, legislation passed that allowed widows to remarry after age
60 and keep an amount equal to half of the deceased spouse's PIA. In theory, this reduced the
penalty for remarriage for those who were at least age 60 and increased the incentive to delay
remarriage until age 60. In practice, as long as the deceased and her new husband had similar work
histories, this may not have been a fundamental difference because a widow was always eligible for
half of her new husband's PIA as a spouse beneficiary.
The larger change in the system occurred in December of 1977, allowing widows (but not
surviving divorced spouses) to remarry after age 60 and to still claim a full widow benefit. This law
became effective in January 1979. This further reduced the penalty for remarriage for those at least
age 60 and increased the incentive to delay remarriage until age 60. The final change occurred in
April of 1983 when the legislation passed allowing surviving divorced spouses to remarry after age
60 and still claim a full survivor benefit.15 This was effective beginning with January 1984 benefits.
The series of law changes have benefited a number of individuals. Currently, married
persons represent about 350,000, or 4 percent, of all Social Security aged survivor beneficiaries.16
B. Actual Penalties
In this section, we provide some perspective on how large the actual penalties are likely to be
for widows who remarry before age 60. This is a difficult task because we need complete Social
15 This legislation also allowed a small beneficiary group, disabled widow(er)s and disabled surviving divorcedspouses, aged 50 or older, to remarry without loss of benefits.16 These figures are based on authors’ calculations from the Current Population Survey data and SSA administrativedata.

8
Security information on the widow, her deceased husband, and her current husband. One place these
data are available is Social Security administrative data on child-in-care widow benefit beneficiaries.
Social Security pays benefits to nonaged women who are caring for the minor (or disabled) children
of deceased husbands who worked in covered employment. Because these benefits terminate when
the children are no longer minors (or no longer disabled), they are usually received for a limited time.
However, a former child-in-care widow can reestablish entitlement on her deceased husband’s work
record as early as age 60 as a widow beneficiary, provided she is unmarried or her marriage occurred
after she reached age 60. Thus, a former child-in-care widow faces the remarriage incentives we
have discussed.
To measure marriage penalties in Social Security we use former child-in-care widow
beneficiaries who remarried prior to age 60 and who claimed spouse benefits on the records of new
husbands in the period of January 1997 to June 1998.17 Because these beneficiaries are recently
entitled, our measured penalties approximate the size of the penalties that middle-aged widows
currently face.18 There are about 3,200 women in the analysis group.
With this group, we first simulate each woman’s present discounted value of the future
stream of benefits at the time she reached age 60. We assume a monthly real interest rate of 0.25
percent and use life expectancies provided by SSA’s Office of the Chief Actuary. With regard to
how widows conceptualize lifetime penalties, we believe it is likely that they use expectations about
length of life (as opposed to use of age-specific mortality probabilities). Present discounted values
17 We draw data from Social Security records extracted in July of 1998 and exclude women who were fully insuredin their own right. We only include former child-in-care widows who have not reestablished entitlement on thework records of their deceased husbands. This is the basis for our assertion that these women remarried prior to age60. That is, if they had remarried after age 60, we expect that they would be receiving widow benefits rather thanspouse benefits because widow benefits tend to be higher. Even if spouse benefits were relatively high, we expectthat they would have claimed widow benefits at ages 60 to 62 (ages when spouse benefits cannot be claimed).18 These women are at least 62 years old, in order to file for spousal benefits, so they are from slightly earlier birthcohorts than current middle-aged widows.

9
are in year 2000 dollars.19 If a woman outlives her most recent husband, we mimic the current law
and calculate her widow benefit on the maximum of his or her earlier husband’s record. If she does
not outlive her husband, she will only receive spouse benefits over her life.
Next, we simulate the present discounted value of the future stream of Social Security
benefits, as if people in this group had not remarried before age 60. We assume the woman claims
her widow benefit on the earlier husband’s account at age 60 and switches to a higher benefit at a
later date if one materializes (for example, if she outlives her most recent husband and the widow
benefit on his record is the highest).
Table 1 presents the results of these simulations. The median estimated value of Social
Security benefits for persons in our analysis group is $101,000. If all persons in this group waited to
marry, the median value would be $148,000. For the “typical” person in our group, marriage prior to
age 60 leads to the loss of $42,000 in benefits (this is the median difference between the present
value amount associated with early marriage and the amount associated with delayed marriage). The
median ratio of the present value associated with early marriage to the value associated with delayed
marriage is 0.7. Even at the 75th percentile, a widow who marries early will receive only about 80
percent of the amount she could have received and, at the 25th percentile, a widow will receive less
than 60 percent of the amount she would have received if she had delayed her marriage.
These figures warrant some additional comments. First, we examine women who did
remarry before age 60. If women with relatively low penalties are more likely to remarry, we may
only have women who had low penalties in our analysis group, and therefore, may be understating
19The primary insurance amounts of the current and deceased husbands are for the month of July 1998. For all ofour present value calculations, we first deflate the PIAs to the time the remarried widows turned age 60, using a 3percent annual rate of inflation. This creates real PIAs for the month of July 1998. However, these real values hold(approximately) for any month because, by law, PIAs are adjusted for inflation. We can therefore use our deflatedPIAs to calculate real monthly benefit amounts for any month. To calculate the present discounted value, at age 60,of a monthly benefit amount paid j months after the date the person turns 60, we divide the real monthly benefitamount by (1.0025j). Finally, to put this amount in year 2000 dollars, we adjust for price changes from the date theremarried widow turns age 60 to the year 2000 (assuming a 3 percent annual rate of inflation).

10
the typical penalty.20 Clearly, the calculations refer to the penalties of early marriage versus
postponed marriage and ignore the counterfactual of remaining unmarried. A widow who remarries
before age 60 may have higher lifetime Social Security benefits than a similar widow who never
remarries. Second, these results are for a narrow group of widows. We exclude women who were
fully insured; some of these women may face a lower marriage penalty because, regardless of
marriage, they may receive retired-worker benefits for most of their retirement years. And, we
include only women who were widowed while they had minor (or disabled) children. Also, not all of
the complexities of the Social Security program are reflected in the simulations. Features such as the
earnings test and the widow’s limit are ignored.21 Finally, our estimates use age 60 as a baseline to
do the present value calculations. A widow contemplating marriage prior to age 60 would discount
the streams of income to that point in time. However, there is not a single moment at which a widow
considers marriage, so we picked a fixed age. Discounting to a point in time prior to age 60 would
reduce the dollar amounts, but would not change the distribution of ratios in Table 1.
C. Theoretical Considerations
The standard economic theory of marriage suggests that individuals choose to marry when
the utility associated with being married exceeds the utility when single (Becker 1973, 1974). Each
widow has a financial benefit of waiting until she is 60 years old to remarry, which is the difference
in the present discounted values of the Social Security benefits for marrying later and marrying now.
This benefit is positive unless the probability of the new spouse dying is very high. The cost of
waiting to remarry includes such things as forgone companionship and the inability to share
20 Also, note that child-in-care widow benefits terminate upon marriage, so an early marriage may have also reducedchild-in-care Social Security benefits prior to age 60. Our estimates do not reflect these lost benefits.21 The earnings test suspends benefits when earnings exceed certain thresholds. Because these remarried widows arenot fully insured, it is unlikely they have strong attachments to the labor force and the earnings test is not likely to bean issue. The widow’s limit establishes a cap on widow benefits, if the deceased worker received reduced benefits.Authors’ calculations indicate that only about one-third of widow beneficiaries are affected by the limit.

11
expenses. The benefit and cost vary depending on the age at which the widow is considering
remarriage. Conditional on meeting a potential spouse, the cost of waiting decreases and the benefit
increases as she approaches age 60. She will remarry if the cost of waiting exceeds the benefit.
In our empirical specification, we test the following three hypotheses:
H1: The 1979 law eliminated the penalty for remarriage after age 60, thereby raising thebenefit of waiting for widows under 60 and reducing the cost of remarriage at age 60 orolder. We hypothesize that the 1979 law would decrease the marriage rate for women underage 60 and increase the marriage rate for women aged 60 years or older.
H2: The cost of waiting decreases and the benefit increases as a widow approaches 60,therefore the marriage rate should decrease as widows approach age 60.
H3: Divorced women do not face such high benefits by waiting until age 60; therefore, thesesame patterns should not exist for them.
III. Literature Review
In 1965, a Miami newspaper reporter, Mr. Wyrick, claimed to have uncovered anecdotal
evidence that the Social Security system influenced the marriage behavior of the elderly. He
reported that a large number of elderly couples cohabited (rather than legally marry) to avoid the
penalties in Social Security. Dean (1966) describes the findings in this way:
“...Mr. Wyrick revealed the incredible story of thousands of senior citizens living together ‘insin’ because legal marriage might deprive them of pensions or Social Security. The series ofarticles brought confirmatory reports of similar situations throughout the United States, andpromptly alerted our lawmakers despite their initial consternation. Gerontologists andpsychiatrists ought to be especially aware of the situation, for it created socio-psychiatricproblems which may have sequelae with which we must be prepared to deal.” (p. 935)
This evidence reportedly influenced policymakers enough to lead to the 1965 law change that
lowered the marriage penalty in Social Security. In Mr. Wyrick’s words:
“I wrote my first article on January 10, 1965. Fortunately, Cong. Pepper noticed it and a fewdays later introduced his first bill in Congress; the law was modified last fall and went intoeffect in January of this year.” (Dean 1966, p. 938)

12
Despite the influence of anecdotal evidence on policy and a persistent policy concern for
impoverished widows, there is no rigorous empirical analysis of the influence of Social Security on
remarriage behavior.
However, at least two papers consider whether economic status influences the marriage or
cohabitation decisions of the elderly.22 Smith and others (1991) analyze the remarriage patterns of
widows and widowers using Panel Study of Income Dynamics data. They break the data into two
samples, using age 60 as the division point, which prohibits any insights into how the age-60 rule in
Social Security affects behavior. They restrict their multivariate analysis of widows to widows under
age 60, because there are too few remarriages in the age 60 or older sample. They find no evidence
that economic well-being influences remarriage decisions. However, their measure of economic
well-being—the income-to-needs ratio—does not differentiate between sources of income, such as
Social Security, which might have differential effects on remarriage probabilities.
Chevan (1996) investigates the cohabitation patterns of individuals age 60 or older using
Census data. In comparison to unmarried individuals who are not cohabiting, Chevan finds that
cohabiting is positively correlated with poverty and home ownership. This is some evidence that
economic status affects family structure, but it does not isolate the effect of Social Security.
The lack of formal evidence of a relationship between Social Security and remarriage is even
more surprising given the great deal of attention paid to the possibility that other government policies
influence marriage decisions. Marriage incentives in the welfare and income tax systems receive the
most attention in the literature. This literature considers two related questions: do taxes or transfers
affect the decision of whether or not to be married, and do taxes or transfers affect the timing of
marriage?
22 A large literature attempts to measure the influence of government programs, such as Social Security and Old-AgeAssistance, on the increase in the number of elderly (widows in particular) who live alone. Costa (1999), Costa(1997), and McGarry and Schoeni (2000) are recent examples.

13
The income tax system penalizes marriage for couples with similar incomes (their joint tax
liability is higher as married couples than as unmarried individuals) and subsidizes marriage for
couples with dissimilar incomes. Research on the relationship between income taxes and marriage
decisions suggests that the income tax system has small but significant effects on marriage and
divorce decisions. Alm and Whittington (1995 and 1999) and Whittington and Alm (1997) find that
the larger the tax penalty on marriage, the less likely an individual is to marry and the more likely a
couple is to divorce.23 Dickert-Conlin (1999) finds that, conditional on marriage penalties implicit in
the welfare system, couples with higher marriage tax penalties are more likely to separate.
The categorical eligibility requirement of the welfare system traditionally created large
disincentives for marriage. Moffitt (1998) concludes that a majority of recent studies find a positive
correlation between Aid to Families with Dependent Children (AFDC) and being an unmarried
mother. However, two recent studies (Moffitt 1994; Hoynes 1997) that control for unobserved state
characteristics find little effect of AFDC on single parenthood. Yelowitz (1998) also finds a negative
correlation between Medicaid eligibility and marriage. A smaller literature considers the
inframarginal decisions of whether welfare influences the decision to cohabit or legally marry. Hu
(1998), for example, finds no consistent effect of welfare benefit levels on the likelihood of marriage
relative to cohabitation.
Some authors also consider the possibility that taxes affect the timing of marriage. This
literature is part of a larger literature that suggests taxes have the largest effects on the timing of
economic transactions (Slemrod 1990). Alm and Whittington (1997) use micro data and find that
U.S. couples with high marriage penalties are more likely to delay marriage into the following tax
23 In an earlier literature on the negative income tax (NIT) experiments Groeneveld, Tuma, and Hannan (1980)conclude that participants in the NIT had higher marital dissolution rates than nonparticipants over the duration ofthe experiments. However, Cain and Wissoker (1990) discount these results, suggesting that the design of the NITexperiments and the data collected were inappropriate for making such conclusions.

14
year. This supports work by Sjoquist and Walker (1995) who use aggregate data. Gelardi (1996)
shows that law changes in Canada, England, and Wales also influenced the timing of marriages.
IV. Evidence that Social Security Affects the Decision to Marry
The following sections examine the results of the research and some alternative explanations for
these results.
A. Basic Results
Convincing evidence that the age-60 Social Security rule influences behavior requires a large
data set to ensure sufficient sample sizes within age and marital status categories. To this end, we
use multiple years of VS data. Compiled by the NCHS, the VS data contain annual marriage
certificate data from states in the marriage-registration areas (MRA) between 1968 and 1995.24 The
data for some states come from a random sample of their marriage certificates, while other states
report their complete population of marriage certificates. All of our results use the appropriate
sample weights. In addition to the marriage date, and critical for this analysis, the VS data include
age and previous marital status of the people getting married. Unfortunately, these data lack
information on income and Social Security eligibility. Therefore, our identification strategy for
investigating the effect of the age-60 Social Security rule on marriage is a comparison of marriage
patterns before and after the 1979 law change, which eliminated the marriage penalty if the marriage
occurred after reaching age 60, and a comparison of widows to divorced women. There are many
reasons why the marriage patterns of widows might be different than those of divorced women.
However, we argue that any observed changes in trends for the groups around age 60 and the 1979
law change are due to the Social Security policy.
24 Beginning in 1996, the NCHS only collected aggregate marriage and divorce counts. Arizona, Arkansas, Nevada,New Mexico, North Dakota, Oklahoma, Texas, and Washington were never in the MRA.

15
There are at least three concerns with this identification strategy. First, not all widowed
women face Social Security penalties for remarriage. For example, women who were married to
men who were not fully insured under Social Security will not face penalties for remarriage. This
may not be a major concern because more than 90 percent of men are fully insured under Social
Security (U.S. Social Security Administration 1999). Second, since 1984, women who are divorced
after 10 years of marriage and whose ex-spouses are deceased face similar penalties to widows. As
noted earlier, these divorced women represent a minority of all divorced women entering their
retirement years and we show in our empirical work below that this law change does not appear to
have affected behavior. Both of these potential problems should bias us against finding a behavioral
effect of the policy. One further issue for our comparison group of divorced women is that the pool
of potential spouses for widows and divorced women may be the same. Therefore, any policy that
affects widows’ marriage decisions may also be affecting divorced women’s decisions. It is not
obvious how this contamination might affect our analysis.
For much of our analysis, we create marriage “rates” by previous marital status and age using
VS data as the numerator. We use data from the 36 states that were continuously in the MRA
between 1968 and 1995 and that record previous marital status on their marriage certificate.25 Our
denominator is an estimate of the number of women at risk for marriage in these groups from the
March Current Population Survey (CPS), a nationally representative household survey conducted by
the Census Bureau. We use all 50 states plus the District of Columbia in the denominator because
the CPS does not uniquely identify all states in years prior 1978.26 In addition, a marriage reported to
25 Minnesota entered the MRA in 1971, Iowa ceased reporting previous marital status in 1977, and Colorado enteredthe MRA in 1979. The District of Columbia did not report previous marital status prior to 1971. Michigan, Ohio,and South Carolina belong to the MRA but do not report previous marital status on their marriage certificates.26 Because an analysis of a single year of age can lead to small sample sizes, we benchmarked the 1990 CPS against1990 Census data and found that the results are not qualitatively different.

16
VS may occur in a state where the bride and groom do not reside, so the at risk group is not simply in
the MRA states. While these are not truly rates, they should be highly correlated with the true rates.
H1: The 1979 law eliminated the penalty for remarriage after age 60, thereby raising thebenefit of waiting for widows under 60 and reducing the cost of remarriage at age 60 orolder. We hypothesize that the 1979 law would decrease the marriage rate for women underage 60 and increase the marriage rate for women aged 60 years or older.
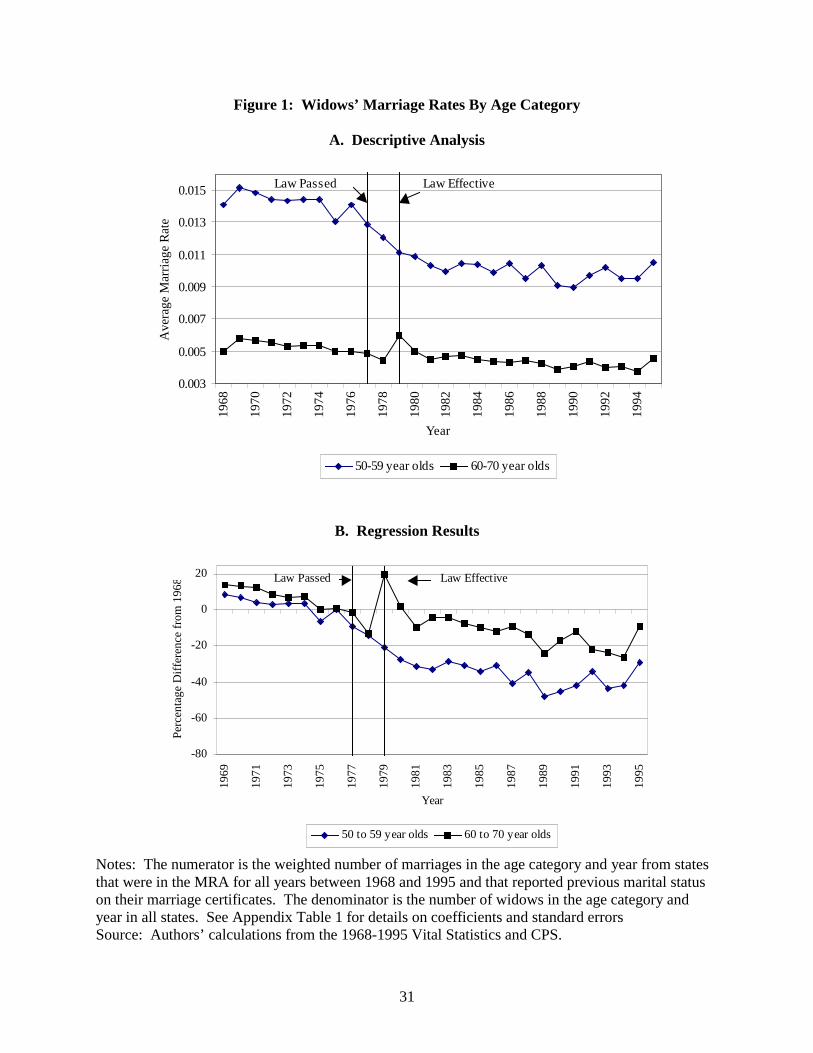
As our first piece of evidence, the top panel of Figure 1 examines the average marriage rates
by year for two age groups of widows (ages 50 to 59 and 60 to 70) between 1968 and 1995. Vertical
lines denote the year in which the current remarriage rule passed into law (December 1977) and
became effective (January 1979). For the 60- to 70-year-olds, we show a decrease in the marriage
rate following the 1977 passage of the law. This suggests that widows age 60 or older delayed
marriages in 1978 in anticipation of the law becoming effective. There is an increase in the marriage
rate of these widows when the law became effective in 1979 implying that many women would have
liked to marry, but did not do so because of the penalty in the Social Security system. Marriage rates
for the widows between the ages of 50 and 59 are declining around the law change, which is the
expected response to the law change. However, this descriptive analysis does not account for other
factors, in particular, an overall decline in marriage rates during this time.
We control for time trends and test the statistical significance of these trends using a
straightforward regression analysis:
( ), ,ln marriage rate ( ) ( *at least age 60 dummy ) ( ) ,
(50,70]where
(1968,1995]
age year age yearyear year age
ageyear
α β γ δ ε′ ′ ′= + + + +
∈�� ∈�
Our dependent variable is the natural log of single-age and year marriage rates for 50 to 70 year old
widows. We regress the log marriage rate on year dummies, omitting 1968; an interaction term
between each year and a dummy for whether the marriage rate is for women at least age 60; and,

17
dummies for each age category, omitting the age-50 category. With 28 years of data and 21 age
groups we have 588 observations.
The bottom panel of Figure 1 shows the regression results of interest. The full regression
results are in Appendix Table 1. First note the downward trend in the marriage rate over these years,
which is consistent with marriage rates for all ages.27 Prior to 1979, we cannot reject the hypothesis
that the percent differences from 1968, the baseline year, are the same for those under age 60 and
those at least age 60 in each year. Beginning in 1979, the year the marriage penalty was removed for
those at least age 60, we can reject the hypothesis that the percent differences from the baseline year
are the same at standard significance levels for virtually all years (the only exception is 1992). In all
cases, the marriage rates for widows under age 60 is further below the baseline year than the rate for
widows who are at least age 60. This is the pattern Hypothesis 1 predicts.
Looking more closely at widows over age 60, we see that in 1977 their marriage rate was 2
percent below the baseline year and in 1978, the year after the law passed, the marriage rate was 13
percent lower than the baseline year. These are statistically different from one another at the 6
percent level [F(1, 513)=3.59], which supports the possibility that widows over age 60 delayed
marriage until their marriage penalty was eliminated. In 1979, the year the law became effective, the
marriage rate was 20 percent higher than the baseline, the largest positive deviation in our sample
period. The 1978 and 1979 effects are statistically different than one another at the 1 percent level
[F(1, 513)=28.64]. The marriage rate was still above the baseline in 1980, but only by 2 percent.
These regression results confirm that the spike in Panel A of Figure 1 is statistically significant.
In the under 60 group, we cannot reject the hypothesis that the coefficient on any 1-year
dummy is statistically different than the coefficient on the year following in any year except 1988.
27 For example, among unmarried women aged 15 to 44, the marriage rate fell from 147.2 marriages per 1,000population in 1968, to 102.6 in 1980 to 83.0 in 1995 (Clarke 1995 and U.S. Census Bureau 1999).

18
This suggests that, on average, the law change did not have significant effects on widows under age
60, but we investigate this further in future regressions.
H3: Divorced women do not face such high benefits of waiting until age 60, therefore thesesame trends should not exist for them.
The marriage rate patterns for divorced women do not exhibit the trends shown for widows.
The top panel of Figure 2 shows that there are slight increases in the marriage rates of divorced
women in 1979. The trends for 60- to 70-year-olds are not as striking as the trends for widows. In a
regression analysis comparable to that above, shown in the bottom panel of Figure 2 and Appendix
Table 1, we find that the deviations from the baseline year are significantly different for divorced
women who are at least age 60 relative to those women who are under age 60 in 1970, 1971, 1975,
1976, 1980, and 1981. Unlike the widows, there is not a clear pattern surrounding the 1979 law
change.
Among divorced women who are at least age 60, the marriage rates in 1977, 1978, and 1979
are 20, 24, and 10 percent below the marriage rate for the baseline year of 1968. These rates are not
statistically different from one another at standard levels. Among divorced women who are under
age 60, the marriage rates decline significantly between 1979 (29 percent below the baseline) and
1980 (47 percent below the baseline) [F(1,513)=3.21]. This hints at the possibility that these
divorced women were substitutes for the widows who were now free to marry without penalty.
As weak support of our earlier claim, there is not a significant change in the marriage rate of
divorced women following the 1984 law change that treated surviving divorced spouses like widows.
We cannot reject the hypothesis that the differences from the baseline for those at least 60 years old
in 1983 (37 percent below baseline), 1984 (35 percent below baseline), and 1985 (48 percent below

19
baseline) are equal. This is clearly not a perfect test, given that we cannot identify how many ex-
spouses of divorced women are deceased.28
H2: The cost of waiting decreases and the benefit increases as a widow approaches 60,therefore the marriage rate should decrease as widows approach age 60.
From the previous analysis, it is clear that the 1979 law change affected the marriage rates of
widows. However, we could not easily separate whether the law decreased marriage rates for those
under age 60 or increased marriage rates for those aged 60 or older. Therefore, we next look at
single-age marriage rates for different birth cohorts of women, using the 1979 law change as our
source of identification. As shown in the top panel of Figure 3, all the time periods after the 1979
law change (including 1979 through 1995) reveal a large relative decline in marriage rates at age 59
and a relative increase in marriage rates at age 60 for widowed women. This same trend did not exist
before 1979. This suggests that widows may delay or avoid marriage if they are very close to being
able to marry without a penalty on their Social Security widow benefits.
We formalize this analysis with a regression similar to the ones above:
( ),ln marriage rate ( ) ( *after 1979 law change dummy) ( ) ,
(50,70]where
(1968,1995]
age year age age year
ageyear
α β γ δ ε′ ′ ′= + + + +
∈�� ∈�
Our dependent variable is the natural log of single-age, marriage rates for widows between the ages
of 50 and 70. Our independent variables include single-year age dummies, with age 50 omitted; and
an interaction between the age dummies and whether the time period is 1979 or later. This allows the
patterns in marriage rates to vary as the widows approach age 60. We also include year dummies to
account for a secular time trend in marriage rates, with the omitted category of 1968.
The results of this regression are in the bottom panel of Figure 3 and Appendix Table 2. In
the pre- and post-1979 law change periods, the trends in marriage rates relative to the baseline age of
28 See Weaver (2000) for a description of reporting errors in marital status.

20
50 years, are statistically the same for all age groups up to and including the 58-year-old widows.
However, in the post-1979 law period, 59-year-old widows are relatively less likely to marry (101
percent below 50-year-olds) than in the pre-1979 law period (86 percent below 50-year-olds).
Conditional on the time trend, all age categories at age 60 years or older are more likely to marry in
the post-1979 law period. These differences are statistically significant and show that the law
decreased the marriage rates of 59-year-olds and increased the marriage rate of women who were at
least age 60. The cost of remarriage at any age above 60 years decreased after the law change, so
this increase for those who were at least age 60 implies that women actually avoided marriage before
the law.
In the post-1979 law change period, the marriage rate at age 58 is 65 percent lower than the
marriage rate at the baseline age, while the marriage rate is 101 percent lower than that at the
baseline age for women at age 59 and back to 67 percent lower than the baseline age at age 60.
Each of these age effects are statistically different than one another at the 1 percent level. These
results strongly suggest that the marriage rate decreases as widows approach age 60. This was not
obvious in the first set of empirical tests because we categorized all under age 60 marriage rates with
a single dummy variable.
The bottom panel of Figure 3 shows a similar but less pronounced pattern in the years before
the 1979 law change became effective. Recall that prior to 1979 there was still some incentive to
wait until age 60 because of the difference between keeping 50 percent of widow benefits for a
marriage after age 60 versus zero widow benefits for a marriage before age 60. The marriage rate at
age 59 is 86 percent below the baseline age of 50, while the marriage rate at age 58 is only 68 percent
below the baseline age. This difference is statistically significant at the 1 percent level [F(1,
520)=9.32]. Unlike the post-law period, the age-59 effect is not statistically different than the age-60
effect (84 percent below the baseline).

21
Figure 4 and Appendix Table 2 show that there are not similar patterns for divorced women.
Repeating the analysis conducted above for widows, shows no statistical or economic differences
between the pre- and post-law periods. In addition, there are no differences between the effects of
the age 58-, 59-, or 60-year-old dummies. In fact, marriage rates decrease monotonically around age
60 in the post-1979 law change period.
Given that there appear to be drops in the marriage rate at age 59 and corresponding rises at
age 60 for widows we further investigate Hypothesis 2 using the trends in marriage counts within 24
months of age 60. This allows us to examine how localized the change in behavior might be. We
use counts in this analysis because no data could give reliable denominators for monthly rates. As
shown in the top panel of Figure 5, during the 1979 to 1995 period the peak number of marriages for
widows in this 24-month range is the month of the woman’s 60th birthday, with especially high
counts in the three months following a woman’s 60th birthday. A sharp decline in the few months
before her 60th birthday precedes this peak. This pattern is similar, but not as pronounced in the
years preceding the 1979 law change.
To test the significance of these patterns, we employ a similar regression approach as our
earlier ones:
( ),ln marriage count ( ) ( *after 1979 law change) ( ) ,
( 24, 24]where
(1968,1995]
month year month month year
monthyear
α δ γ β ε′ ′ ′= + + + +
∈ − +�� ∈�
Our dependent variable is the natural log of the monthly count of marriages, relative to the 60th
birthday. Our independent variables include month dummies, with 24 months before the 60th
birthday omitted; and an interaction between the month dummies and whether the time period is
1979 or later. We also include year dummies to account for the possibility of a time trend in
marriage counts, with the omitted category of 1968. We have 28 years of data and use all months
within 24 months of the 60th birthday, for a total of 1,372 observations.

22
The results of this exercise are shown in the bottom panel of Figure 5 and Appendix Table 3.
Consistent with the previous analysis, for those who remarry in the months before their 60th birthday,
we cannot reject the hypothesis that the percentage difference in marriage rates from the baseline are
the same in the two time periods. However, there are 10 months after age 59 (60th birthday, +1, +2,
+3, +8, +12, +18, +22, +23, +24 months) where the marriage counts are statistically and
economically higher in the post-1979 law period relative to the pre-law period. The trend around the
60th birthday is particularly dramatic. The counts in all months preceding the 60th birthday are the
same or lower than the baseline month (24 months before the 60th birthday). One month before the
60th birthday, the marriage count is 72 percent lower than the baseline month (this is the largest
deviation from the baseline). However, the number of marriages taking place on the 60th birthday is
56 percent higher than the baseline month. These counts are statistically different than one another at
the 1 percent level [F(1, 1248)=76.58]. One, 2, and 3 months following the 60th birthday, the number
of marriages are still 52, 36, and 25 percent higher than the baseline month. This analysis suggests
that the marriage penalty in Social Security has the most influence on women who are very close to
age 60.
Again, the pre-1979 law change period is not as striking. The number of marriages on the
60th birthday is only 17 percent higher than the baseline month and not statistically different than the
baseline. One, two and three months following the 60th birthday, the number of marriages are still
21, 22, and 26 percent lower (not higher, like in the post-1979 law period) than the baseline month.
The same trough before the 60th birthday still exists, with 54 percent fewer marriages in the month
before the 60th birthday relative to the baseline month, and this is statistically different than the spike
at the 60th birthday [F(1, 1248)=4.51].
The top panel of Figure 6 shows with descriptive statistics that this pattern is not the same for
divorced women. In the time period from 1979 to 1995, there is a flat trend in marriage counts in the
months preceding the 60th birthday and a much less pronounced increase at their 60th birthday. There

23
does not appear to be any trend for divorced women in the time period before 1979. The regression
analysis, presented in the bottom panel of Figure 6 and Appendix Table 3, confirm this. Unlike the
widows, the marriage counts on the 60th birthday are below the baseline month before and after the
law change.
B. Alternative Explanations
Overall, the above results suggest a change in remarriage behavior for widows around age 60.
We have attributed this change to remarriage rules embedded in the Social Security system. The fact
that the change in behavior was not as large in the years prior to a significant change in the Social
Security rules and does not seem to be present for divorced women who are not generally covered by
these rules adds credence to our attribution.
One concern, however, is that something other than Social Security drives our results. One
obvious candidate is other pension plans. This possibility is highlighted by McGill and others (1996)
who write: “[T]oday any spouse's benefit in excess of the mandated benefit [authors’ emphasis]
qualified preretirement survivor annuity tends to be an explicitly stated benefit, as described below,
payable to the surviving spouse as long as she or he lives, but sometimes it is subject to termination
in the event of remarriage prior to a stipulated age, such as age 60. The mandatory survivor annuity
may not be terminated upon remarriage (p. 240).” The first thing to note is that this only applies to
benefits in excess of mandatory survivor annuities. Second, an informal survey of employee benefit
specialists and financial planners turned up no evidence that pension plans include this age-60
stipulation.29 Finally, as noted above, the results that show changes in marriage patterns around the
29 An employee of the United Nations Joint Staff Pension Fund acknowledged marriage penalties in their pensionplan: “[F]or over fifty years a provision in our Rules & Regulations called for the discontinuance of benefits to asurviving spouse upon remarriage. A lump sum in the amount of twice the annual rate of the benefit would bepayable to the surviving spouse as a final settlement. Effective 1 April 1999, this provision has been deleted, so thatsurvivors benefits are not discontinued upon remarriage.” However, this penalty was not age specific. One mainreason for the change in policy was the impression that changes in marital status were rarely reported.

24
1979 law change, which did not affect these pension benefits, suggest that it is the Social Security
law that is affecting the behavior.
Many of the federal government pension plans also have age restrictions for remarriage
without penalty. Since 1984, the Civil Service, Foreign Service, and federal retirement systems
suspended survivor benefits if a remarriage occurred before age 55. The suspension of benefits does
not occur if the widow is younger than age 55 and was married for at least 30 years, and benefits are
restored if the remarriage ends because of death, divorce, or annulment. Before 1984, these rules
applied to Civil Service employees for any marriage before age 60.30 Widowed spouses of military
retirees who remarry before age 55 lose their claim to survivor benefits. Their claim will be
reinstated if the marriage ends because of death, divorce, or annulment.31 We do not see any
significant patterns around age 55 or the year 1984, which may be due to the fact that each of these
groups typically include fewer than 5 percent of the labor force (U.S. Census Bureau, Statistical
Abstract, various years).
V. Conclusions and Future Research
Despite economic theory that suggests that economic incentives should influence marriage
decisions, existing literature finds mixed results. Using very large samples of marriages, we find the
Social Security rule that penalizes remarriage before age 60 affects the marriage patterns of widows.
In VS data, we find evidence that in 1979, the year that the penalty for remarriage was reduced for
those at least age 60, the marriage rate for this group increased. There is evidence that the passage of
30 Divorced spouses of federal employees who are awarded a survivor annuity lose the benefit permanently uponremarriage before age 55.31 Divorced spouses receiving survivor benefits lose their claim to widow survivor benefits if they remarry beforeage 55. The benefits would be restored if the second marriage ends in death, divorce or annulment.

25
the law in 1977 caused some women to delay marriage until the law became effective. An
examination of marriage rates by age confirms this story—a delay in marriage at age 59 and an
increase in marriage rates after that age. A clear pattern in the period since 1979 also shows low
marriage counts in the months immediately preceding widows’ 60th birthdays followed by large
increases in the number of marriages on widows’ 60th birthdays.
The existence of the age restriction for remarriage seems intended to ensure a well-targeted
system—one that disallows widows who have another means of support through marriage. The
tradeoff with this goal is the delay or avoidance of marriage.
Over the past 35 years, Congress has eased the Social Security marriage penalties. One
proposal for further reducing the marriage penalty would be to lower the age after which a marriage
is disregarded from age 60 to, say, age 50. This is already the earliest age at which a disabled
widow(er) beneficiary may remarry without loss of benefits. Reducing the marriage penalty is likely
to increase the number of remarriages, and the additional cost to the Social Security system would be
relatively modest. There are only about 200,000 married women, aged 60 or older, who were once
widows and who remarried in their 50s. To provide some perspective, there are currently 8.1 million
persons drawing aged widow(er) benefits from Social Security. Another proposal for reducing the
marriage penalties would be to disregard all marriages, regardless of the ages at which they occurred.
This proposal is of a slightly larger scale—currently, there are about 575,000 married women, aged
60 or older, who were once widows and who remarried prior to age 60.32
32The 200,000 and 575,000 figures are based on tabulations from the 1990 Survey of Income and ProgramParticipation and have been adjusted to reflect growth in the aged female population that has occurred since 1990.

26
The research results raise many additional questions. Our data have only women who marry,
ignoring those individuals who perhaps decline opportunities for remarriage to avoid paying the
penalty. The welfare effects associated with this behavior are more profound than those of women
who simply delay marriage. The previous question raises the issue of what the alternative to
marriage is for widows. If widows who are delaying their marriage to avoid the penalty are
cohabiting with their partner in the meantime, the concerns about well-being may be less well
founded. However, the possibility of cohabitation raises concerns about the equity of the Social
Security marriage penalty. In particular, it is not clear that a couple who cohabit at age 59 should be
treated differently than a couple who marry at age 59. However, the law currently makes this
distinction. Evidence from other research suggests that the cohabitation rate among the elderly is not
large, but more analysis should be done on this topic. A related topic is whether or not the Social
Security Administration can monitor marital status. The current system provides incentives for
people to report that they are unmarried when they are actually married.
Finally, our simulations show that the size of the penalties for early remarriage can be quite
substantial. Nevertheless, many widows do not wait until age 60 to marry. Obviously, there is a
wide range of costs and benefits that influence the marriage decision. One final question for future
research is how large the effects of this law are relative to other determinants of marriage.

27
References
Alm, James, Stacy Dickert-Conlin, and Leslie A. Whittington. 1999. “The Marriage Penalty.”Journal of Economic Perspectives 13(3):193-204.
Alm, James and Leslie A. Whittington. 1995. “Does the Income Tax Affect Marital Decisions?”National Tax Journal 48(4):565-72.
_______. 1997. “Income Taxes and The Timing of Marital Decisions.” Journal of PublicEconomics 64(2):219-40.
_______. 1999. “For Love or Money? The Impact of Income Taxes on Marriage.” Economica 66:297-316.
Auerbach, Alan J. 1992. “On the Design and Reform of Capital-Gains Taxation.” AmericanEconomic Review 82(2):263-67.
Becker, Gary S. 1973. “A Theory of Marriage: Part I.” Journal of Political Economy 81(4): 813-846.
_______. 1974. “A Theory of Marriage: Part II.” Journal of Political Economy 82(2): S11-S26.
Board of Trustees of the Federal Old-Age and Survivors Insurance and Disability Insurance TrustFunds. 1999. Annual Report. Washington, D.C.: Board of Trustees of the Federal Old-Ageand Survivors Insurance and Disability Insurance Trust Funds.
Burman, Leonard E., and William C. Randolph. 1994. “Measuring Permanent Responses to Capital-Gains Tax Changes in Panel Data.” American Economic Review 84(4):794-809.
Cain, Glen G., and Douglas A. Wissoker. 1990. “A Reanalysis of Marital Stability in the Seattle-Denver Income-Maintenance Experiment.” American Journal of Sociology 95(5):1235-69.
Chevan, Albert. 1996. “As Cheaply as One: Cohabitation in the Older Population.” Journal ofMarriage and the Family 58(3):656-67.
Clarke, Sally C. 1995. “Advance Report of Final Marriage Statistics, 1989 and 1990.” Monthly VitalStatistics Report 43(12): Suppl. (July 14). Available athttp://www.cdc.gov/nchs/data/mv43_12s.pdf.
Costa, Dora L. 1997. “Displacing the Family: Union Army Pensions and Elderly LivingArrangements.” Journal of Political Economy 105(6):1269-92.
_______. 1999. “A House of Her Own: Old Age Assistance and the Living Arrangements of OlderNonmarried Women.” Journal of Public Economics 72(1):39-59.
Dean, Stanley R. 1966. “Sin and Senior Citizens.” Journal of the American Geriatrics Society14(9):935-38.

28
Dickert-Conlin, Stacy, and Amitabh Chandra. 1999. “Taxes and the Timing of Births.” Journal ofPolitical Economy 107(1):161-177.
Dickert-Conlin, Stacy. 1999. “Taxes and Transfers: Their Effects on the Decision to End aMarriage.” Journal of Public Economics 73(2): 217-40.
Gelardi, Alexander M.G. 1996. “The Influence of Tax Law Changes on the Timing of Marriages:A Two-Country Analysis.” National Tax Journal 49(1):17-30.
Groeneveld, Lyle P., Nancy Brandon Tuma and Michael T. Hannan. 1980. “The Effects of NegativeIncome Tax Programs on Marital Dissolution.” Journal of Human Resources 15(4):654-74.
Hoynes, Hilary. 1997. “Does Welfare Play Any Role in Female Headship Decisions?” Journal ofPublic Economics 65(2):89-117.
Hu, Wei-Yin. 1998. “Welfare, Marriage, and Cohabitation: Experimental Evidence fromCalifornia.” Working paper, University of California, Los Angeles.
Lugaila, Terry A. “Marital Status and Living Arrangements: March 1998 (Update).” CPS ReportP20-514.
McGarry, Kathleen, and Robert F. Schoeni. 2000. “Social Security, Economic Growth, and the Risein Elderly Widows’ Independence in the Twentieth Century.” Demography 37(2):221-36.
McGill, Dan M., Kyle N. Brown, John J. Haley, and Sylvester J. Schieber. 1996. Fundamentals ofPrivate Pensions. Philadelphia: University of Pennsylvania Press.
Moffitt, Robert. 1994. “Welfare Effects on Female Headship with Area Effects.” Journal of HumanResources 29(2):621-36.
_______. 1998. “The Effect of Welfare on Marriage and Fertility.” Robert A. Moffitt, ed. Welfare,the Family, and Reproductive Behavior: Research Perspectives. Washington, D.C.: NationalAcademy Press, 1998.
Randolph, William C. 1995. “Dynamic Income, Progressive Taxes, and the Timing of CharitableContributions.” Journal of Political Economy 103(4):709-38.
Sjoquist, David L., and Mary Beth Walker. 1995. “The Marriage Tax and the Rate and Timing ofMarriage.” National Tax Journal 48(4):547-58.
Slemrod, Joel. 1990. “The Economic Impact of the Tax Reform Act of 1986.” Joel Slemrod, ed.Do Taxes Matter? The Impact of the Tax Reform Act of 1986. Cambridge, Mass.: MITPress, 1-12.
Smith, Ken R., Cathleen D. Zick, and Greg J. Duncan. 1991. “Remarriage Patterns among RecentWidows and Widowers.” Demography 28(3):361-74.
U.S. Census Bureau. 1999. Statistical Abstract. Available athttp://www.census.gov/prod/www/statistical-abstract-us.html

29
U.S. Congress, Committee on Ways and Means. 1998. 1998 Green Book. Washington, D.C.: U.S.Government Printing Office.
U.S. Department of Health and Human Services, Social Security Administration. 1985. “Womenand Social Security.” Social Security Bulletin 48(2):17-26.
_______. 1993. Women and Social Security: Issues and Options (Unpublished manuscript).Washington, D.C.: Office of Legislation and Congressional Affairs, Social SecurityAdministration.
U.S. Social Security Administration. 1999. Annual Statistical Supplement to the Social SecurityBulletin, 1999. Washington, D.C.: U.S. Government Printing Office.
Waite, Linda J. 1995. “Does Marriage Matter?” Demography 32(4):483-507.
Weaver, David A. 2000. “The Accuracy of Survey-Reported Marital Status: Evidence from SurveyRecords Matched to Social Security Records.” Demography 37(3):395-99.
Whittington, Leslie A., and James Alm. 1997. “’Til Death or Taxes Do Us Part: The Effect ofIncome Taxation on Divorce.” Journal of Human Resources 32(2):388-412.
Yelowitz, Aaron S. 1998. “Will Extending Medicaid to Two-Parent Families Encourage Marriage?”Journal of Human Resources 33(4):833-65.

30
Table 1. Present Discounted Value (PDV) of Social Security Benefits at Age 60,by Age at Remarriage
PDV,RemarriageBefore 60
PDV,Remarriage
After 60
PDV (before 60) MinusPDV (after 60)*
Ratio of PDV (before 60)to PDV (after 60)
25th Percentile 75,000 126,000 -60,000 0.59Median 101,000 148,000 -42,000 0.70
75th Percentile 123,000 168,000 -31,000 0.78Source: Authors’ calculations from Social Security benefit records.*These numbers are the percentile differences, not the differences in the percentiles.
31
Figure 1: Widows’ Marriage Rates By Age Category
A. Descriptive Analysis
0.003
0.005
0.007
0.009
0.011
0.013
0.015
1968
1970
1972
1974
1976
1978
1980
1982
1984
1986
1988
1990
1992
1994
Year
Ave
rage
Mar
riage
Rat
e
50-59 year olds 60-70 year olds
Law Passed Law Effective
B. Regression Results
-80
-60
-40
-20
0
20
1969
1971
1973
1975
1977
1979
1981
1983
1985
1987
1989
1991
1993
1995
Year
Perc
enta
ge D
iffer
ence
from
196
8
50 to 59 year olds 60 to 70 year olds
Law Passed Law Effective
Notes: The numerator is the weighted number of marriages in the age category and year from statesthat were in the MRA for all years between 1968 and 1995 and that reported previous marital statuson their marriage certificates. The denominator is the number of widows in the age category andyear in all states. See Appendix Table 1 for details on coefficients and standard errorsSource: Authors’ calculations from the 1968-1995 Vital Statistics and CPS.

32
Figure 2: Divorced Women’s Marriage Rates By Age Category
A. Descriptive statistics
0.005
0.01
0.015
0.02
0.025
0.03
1968
1970
1972
1974
1976
1978
1980
1982
1984
1986
1988
1990
1992
1994
Year
Ave
rage
Mar
riage
Rat
e
50-59 year olds 60-70 year olds
Law PassedLaw Effective
B. Regression Results
-80
-70-60
-50
-40
-30-20
-10
010
20
1969
1971
1973
1975
1977
1979
1981
1983
1985
1987
1989
1991
1993
1995
Year
Perc
enta
ge D
iffer
ence
from
196
8
50 to 59 year olds 60 to 70 year olds
Law Effective
Law Passed
Notes: The numerator is the weighted number of marriages among divorced women in the agecategory and year from states that were in the MRA for all years between 1968 and 1995 and thatreported previous marital status on their marriage certificates. The denominator is the number ofdivorced women in the age category and year in all states. See Appendix Table 1 for details oncoefficients and standard errors.Source: Authors’ calculations from the 1968-1995 Vital Statistics and CPS.

33
Figure 3: Widows Marriage Rates by Age and Year Category
A. Descriptive Statistics
0.002
0.004
0.006
0.008
0.010.012
0.014
0.016
0.018
0.02
50 52 54 56 58 60 62 64 66 68 70
Age
Ave
rage
Mar
riage
Rat
e
1968-1973 1974-1978 1979-1983 1984-1990 1991-1995
B. Regression Results
-200
-180
-160
-140
-120
-100
-80
-60
-40
-20
0
51 52 53 54 55 56 57 58 59 60 61 62 63 64 65 66 67 68 69 70
Age
Perc
enta
ge D
iffer
ence
from
Age
50
1968-1978 1979-1995
Notes: Numerator is weighted number of marriages among widows in the age category and yearfrom states that were in the MRA for all years between 1968 and 1995 and that reported previousmarital status on their marriage certificates. Denominator is number of widows in the age categoryand year in all states.Source: Authors’ tabulations from VS and CPS data. See Appendix Table 2 for complete regressionresults.

34
Figure 4: Divorced Women’s Marriage Rates by Age and Year Category
A. Descriptive Statistics
0.0020.0070.0120.017
0.0220.0270.0320.037
50 51 52 53 54 55 56 57 58 59 60 61 62 63 64 65 66 67 68 69 70
Age
Ave
rage
Mar
riage
Rat
e
1968-1973 1974-1978 1979-1983 1984-1990 1991-1995
B. Regression Results
-200
-180
-160
-140
-120
-100
-80
-60
-40
-20
0
51 53 55 57 59 61 63 65 67 69
Age
Perc
enta
ge D
iffer
ence
Fro
m A
ge 5
0
1968-1978 1979-1995
Notes: Numerator is weighted number of marriages among divorced women in the age category andyear from states that were in the MRA for all years between 1968 and 1995 and that reportedprevious marital status on their marriage certificates. Denominator is number of divorced women inthe age category and year in all states. See Appendix Table 2 for complete regression results.Source: Authors’ tabulations from VS and CPS data.

35
Figure 5: Widows Marriage Counts Around 60th Birthday
A. Descriptive Statistics
40
60
80
100
120
140
160
180
-24 -18 -12 -6 60thBirthday
6 +12 18 +24
Month Around 60th Birthday
Ave
rage
Mon
thly
Cou
nt
1968-1978 1979-1995
B. Regression Results
-80
-60
-40
-20
0
20
40
60
-23
-20
-17
-14
-11 -8 -5 -2 +1 +4 +7 +10
+13
+16
+19
+22
Months from 60th Birthday
Perc
enta
ge D
iffer
ence
from
-24
mon
ths f
rom
60
th B
irthd
ay
1968-1978 1979-1995
Notes: Weighted number of marriages among widows in the month and year category. These areonly from states that were in the MRA for all years between 1968 and 1995 and that reportedprevious marital status on their marriage certificates. See Appendix Table 3 for statisticalsignificance of individual coefficients.Source: Authors’ calculations from the 1968-1995 Vital Statistics.

36
Figure 6: Divorced Women’s Marriage Counts Around 60th Birthday
A. Descriptive Statistics
40
60
80
100
120
-24 -18 -12 -6 60thBirthday
6 +12 18 +24
Month Around 60th Birthday
Ave
rage
Mon
thly
Cou
nt
1968-1978 1979-1995
B. Regression Results
-100
-80
-60
-40
-20
0
20
-23
-20
-17
-14
-11 -8 -5 -2 +1 +4 +7 +10
+13
+16
+19
+22
Months from 60th Birthday
Perc
enta
ge D
iffer
ence
from
-24
mon
ths f
rom
60
th B
irthd
ay
1968-1978 1979-1995
Notes: Weighted number of marriages among divorced women in the month and year category.These are only from states that were in the MRA for all years between 1968 and 1995 and thatreported previous marital status on their marriage certificates. See Appendix Table 3 for statisticalsignificance of individual coefficients.Source: Authors’ calculations from the 1968-1995 Vital Statistics.

37
Appendix Table 1Ordinary Least Squares of LN(Marriage Rate) on Year, Age and Interaction between Year
and At Least age 60 for Widows and Divorced Women
Widows Divorced WomenDummy Variables Coefficient Standard Error Coefficient Standard ErrorYear=1969 0.084 0.064 -0.189 0.097Year=1970 0.068 0.064 -0.033 0.097Year=1971 0.037 0.064 -0.102 0.097Year=1972 0.031 0.064 -0.028 0.097Year=1973 0.035 0.064 -0.084 0.097Year=1974 0.034 0.064 -0.143 0.097Year=1975 -0.064 0.064 -0.150 0.097Year=1976 0.002 0.064 -0.246 0.097Year=1977 -0.093 0.064 -0.322a 0.097Year=1978 -0.142b 0.064 -0.359a 0.097Year=1979 -0.206a 0.064 -0.295a 0.097Year=1980 -0.273a 0.064 -0.468a 0.097Year=1981 -0.314a 0.064 -0.513a 0.097Year=1982 -0.332a 0.064 -0.483a 0.097Year=1983 -0.289a 0.064 -0.458a 0.097Year=1984 -0.311a 0.064 -0.522a 0.097Year=1985 -0.344a 0.064 -0.501a 0.097Year=1986 -0.309a 0.064 -0.562a 0.097Year=1987 -0.409a 0.064 -0.565a 0.097Year=1988 -0.349a 0.064 -0.496a 0.097Year=1989 -0.481a 0.064 -0.584a 0.097Year=1990 -0.452a 0.064 -0.549a 0.097Year=1991 -0.416a 0.064 -0.616a 0.097Year=1992 -0.339a 0.064 -0.618a 0.097Year=1993 -0.433a 0.064 -0.766a 0.097Year=1994 -0.418a 0.064 -0.595a 0.097Year=1995 -0.291a 0.064 -0.542a 0.097(At Least Age 60)*(Year=1969) 0.053 0.089 0.141 0.134(At Least Age 60)*(Year=1970) 0.065 0.089 0.223c 0.134(At Least Age 60)*(Year=1971) 0.083 0.089 0.299b 0.134(At Least Age 60)*(Year=1972) 0.054 0.089 0.179 0.134(At Least Age 60)*(Year=1973) 0.033 0.089 0.112 0.134(At Least Age 60)*(Year=1974) 0.037 0.089 0.034 0.134(At Least Age 60)*(Year=1975) 0.065 0.089 0.251c 0.134(At Least Age 60)*(Year=1976) 0.003 0.089 0.245c 0.134(At Least Age 60)*(Year=1977) 0.076 0.089 0.125 0.134(At Least Age 60)*(Year=1978) 0.009 0.089 0.124 0.134(At Least Age 60)*(Year=1979) 0.401a 0.089 0.194 0.134Continued next page

38
Appendix Table 1 (Continued)
Widows Divorced WomenDummy Variables Coefficient Standard Error Coefficient Standard Error(At Least Age 60)*(Year=1980) 0.290a 0.089 0.310c 0.134(At Least Age 60)*(Year=1981) 0.216b 0.089 0.259c 0.134(At Least Age 60)*(Year=1982) 0.288a 0.089 0.203 0.134(At Least Age 60)*(Year=1983) 0.246a 0.089 0.091 0.134(At Least Age 60)*(Year=1984) 0.233a 0.089 0.173 0.134(At Least Age 60)*(Year=1985) 0.248a 0.089 0.017 0.134(At Least Age 60)*(Year=1986) 0.187b 0.089 0.147 0.134(At Least Age 60)*(Year=1987) 0.318a 0.089 0.093 0.134(At Least Age 60)*(Year=1988) 0.212b 0.089 0.054 0.134(At Least Age 60)*(Year=1989) 0.240a 0.089 0.196 0.134(At Least Age 60)*(Year=1990) 0.280a 0.089 0.071 0.134(At Least Age 60)*(Year=1991) 0.298a 0.089 -0.001 0.134(At Least Age 60)*(Year=1992) 0.122 0.089 0.133 0.134(At Least Age 60)*(Year=1993) 0.197b 0.089 0.200 0.134(At Least Age 60)*(Year=1994) 0.155c 0.089 0.010 0.134(At Least Age 60)*(Year=1995) 0.197c 0.089 0.035 0.134Age=51 0.030 0.038 -0.115b 0.058Age=52 -0.110a 0.038 -0.162a 0.058Age=53 -0.182a 0.038 -0.345a 0.058Age=54 -0.276a 0.038 -0.389a 0.058Age=55 -0.383a 0.038 -0.486a 0.058Age=56 -0.523a 0.038 -0.562a 0.058Age=57 -0.573a 0.038 -0.697a 0.058Age=58 -0.660a 0.038 -0.769a 0.058Age=59 -0.952a 0.038 -0.915a 0.058Age=60 -0.901a 0.073 -1.141a 0.110Age=61 -1.045a 0.073 -1.158a 0.110Age=62 -1.075a 0.073 -1.216a 0.110Age=63 -1.266a 0.073 -1.282a 0.110Age=64 -1.280a 0.073 -1.470a 0.110Age=65 -1.448a 0.073 -1.566a 0.110Age=66 -1.515a 0.073 -1.550a 0.110Age=67 -1.586a 0.073 -1.791a 0.110Age=68 -1.716a 0.073 -1.766a 0.110Age=69 -1.789a 0.073 -1.838a 0.110Age=70 -1.968a 0.073 -1.897a 0.110Constant -3.953a 0.052 -3.105a 0.079Source: Authors’ tabulations from VS and CPS data.Notes: Omitted categories are year=1968 and age 50 years. a statistically significant at the 1 percentlevel. b statistically significant at the 5 percent level. c statistically significant at the 10 percent level

39
Appendix Table 2Ordinary Least Squares of LN(Marriage Rate) on Age and Interaction between Post-1979
Law change and Year for Widows and Divorced Women
Widows Divorced WomenDummy Variables Coefficient Standard Error Coefficient Standard ErrorAge=51 -0.035 0.060 -0.128 0.093Age=52 -0.116 c 0.060 -0.149 0.093Age=53 -0.250 a 0.060 -0.355a 0.093Age=54 -0.295 a 0.060 -0.436 a 0.093Age=55 -0.405 a 0.060 -0.431 a 0.093Age=56 -0.526 a 0.060 -0.470 a 0.093Age=57 -0.542 a 0.060 -0.649 a 0.093Age=58 -0.676 a 0.060 -0.675 a 0.093Age=59 -0.860 a 0.060 -0.898 a 0.093Age=60 -0.836 a 0.060 -1.045 a 0.093Age=61 -0.962 a 0.060 -0.998 a 0.093Age=62 -1.032 a 0.060 -1.004 a 0.093Age=63 -1.209 a 0.060 -1.044 a 0.093Age=64 -1.238 a 0.060 -1.235 a 0.093Age=65 -1.356 a 0.060 -1.370 a 0.093Age=66 -1.485 a 0.060 -1.363 a 0.093Age=67 -1.557 a 0.060 -1.673 a 0.093Age=68 -1.742 a 0.060 -1.615 a 0.093Age=69 -1.782 a 0.060 -1.653 a 0.093Age=70 -1.995 a 0.060 -1.667 a 0.093(After 1979 Law Change)*(Age=51) 0.107 0.077 0.021 0.119(After 1979 Law Change)*(Age=52) 0.010 0.077 -0.020 0.119(After 1979 Law Change)*(Age=53) 0.113 0.077 0.017 0.119(After 1979 Law Change)*(Age=54) 0.031 0.077 0.077 0.119(After 1979 Law Change)*(Age=55) 0.037 0.077 -0.090 0.119(After 1979 Law Change)*(Age=56) 0.004 0.077 -0.152 0.119(After 1979 Law Change)*(Age=57) -0.052 0.077 -0.080 0.119(After 1979 Law Change)*(Age=58) 0.026 0.077 -0.154 0.119(After 1979 Law Change)*(Age=59) -0.150 c 0.077 -0.028 0.119(After 1979 Law Change)*(Age=60) 0.165 b 0.077 0.072 0.119(After 1979 Law Change)*(Age=61) 0.136 c 0.077 -0.033 0.119(After 1979 Law Change)*(Age=62) 0.200 a 0.077 -0.117 0.119(After 1979 Law Change)*(Age=63) 0.177 b 0.077 -0.160 0.119(After 1979 Law Change)*(Age=64) 0.202 a 0.077 -0.157 0.119(After 1979 Law Change)*(Age=65) 0.119 0.077 -0.092 0.119(After 1979 Law Change)*(Age=66) 0.222 0.077 -0.077 0.119(After 1979 Law Change)*(Age=67) 0.222 a 0.077 0.036 0.119Continued next page

40
Appendix Table 2 (Continued)
Widows Divorced WomenDummy Variables Coefficient Standard Error Coefficient Standard Error(After 1979 Law Change)*(Age=68) 0.222 a 0.077 -0.018 0.119(After 1979 Law Change)*(Age=69) 0.222 a 0.077 -0.074 0.119(After 1979 Law Change)*(Age=70) 0.315 a 0.077 -0.148 0.119Year=1969 0.112 a 0.044 -0.115 0.067Year=1970 0.102 a 0.044 0.084 0.067Year=1971 0.081 c 0.044 0.054 0.067Year=1972 0.059 0.044 0.066 0.067Year=1973 0.053 0.044 -0.025 0.067Year=1974 0.053 0.044 -0.125 0.067Year=1975 -0.030 0.044 -0.019 0.067Year=1976 0.004 0.044 -0.118 0.067Year=1977 -0.053 0.044 -0.257 a 0.067Year=1978 -0.137 0.044 -0.294 a 0.067Year=1979 -0.113 0.069 -0.137 0.106Year=1980 -0.238a 0.069 -0.250 0.106Year=1981 -0.317 a 0.069 -0.321b 0.106Year=1982 -0.298 a 0.069 -0.321 a 0.106Year=1983 -0.277 a 0.069 -0.354 a 0.106Year=1984 -0.306 a 0.069 -0.375 a 0.106Year=1985 -0.331 a 0.069 -0.436 a 0.106Year=1986 -0.328 a 0.069 -0.428 a 0.106Year=1987 -0.359 a 0.069 -0.460 a 0.106Year=1988 -0.355 a 0.069 -0.412 a 0.106Year=1989 -0.472 a 0.069 -0.425 a 0.106Year=1990 -0.422 a 0.069 -0.456 a 0.106Year=1991 -0.377 a 0.069 -0.561 a 0.106Year=1992 -0.392 a 0.069 -0.492 a 0.106Year=1993 -0.447 a 0.069 -0.604 a 0.106Year=1994 -0.454 a 0.069 -0.534 a 0.106Year=1995 -0.305 a 0.069 -0.467 a 0.106Constant -3.968 0.052 -3.212 a 0.079
Source: Authors’ tabulations from VS and CPS data.Notes: Omitted categories are year=1968 and age 50 years. a statistically significant at the 1 percentlevel. b statistically significant at the 5 percent level. c statistically significant at the 10 percent level

41
Appendix Table 3Ordinary Least Squares of LN(Monthly Marriage Count) on Months from 60th birthday,Interaction between Post-1979 Law change and Months from 60th birthday; and Year for
Widows and Divorced Women
Widows Divorced WomenDummy Variables Coefficient Standard
ErrorCoefficient Standard
Error60th birthday –23 months -0.204 0.182 0.060 0.20860th birthday –22 months -0.233 0.182 0.067 0.20860th birthday –21 months -0.153 0.182 -0.068 0.20860th birthday –20 months -0.268 0.182 -0.049 0.20860th birthday –19 months -0.280 0.182 0.083 0.20860th birthday –18 months -0.117 0.182 -0.291 0.20860th birthday –17 months -0.205 0.182 -0.331 0.20860th birthday –16 months -0.216 0.182 0.043 0.20860th birthday –15 months -0.018 0.182 -0.137 0.20860th birthday –14 months -0.174 0.182 -0.088 0.20860th birthday –13 months -0.339 c 0.182 -0.298 0.20860th birthday –12 months 0.022 0.182 -0.085 0.20860th birthday –11 months -0.224 0.182 -0.504 b 0.20860th birthday –10 months -0.196 0.182 -0.471 b 0.20860th birthday –9 months -0.301 c 0.182 -0.786 a 0.20860th birthday –8 months -0.302 c 0.182 -0.581 a 0.20860th birthday –7 months -0.290 0.182 -0.458 b 0.20860th birthday –6 months -0.199 0.182 -0.318 0.20860th birthday –5 months -0.457 b 0.182 -0.612 a 0.20860th birthday –4 months -0.272 0.182 -0.380 c 0.20860th birthday –3 months -0.389 b 0.182 -0.453 b 0.20860th birthday –2 months -0.400 b 0.182 -0.494 b 0.20860th birthday –1 months -0.540 a 0.182 -0.488 b 0.20860th birthday 0.172 0.182 -0.361 c 0.20860th birthday +1 months -0.214 0.182 -0.805 a 0.20860th birthday +2 months -0.223 0.182 -0.359 c 0.20860th birthday +3 months -0.255 0.182 -0.678 a 0.20860th birthday +4 months -0.010 0.182 -0.644 a 0.20860th birthday +5 months -0.318 c 0.182 -0.223 0.20860th birthday +6 months -0.292 0.182 -0.518 b 0.20860th birthday +7 months -0.135 0.182 -0.531 b 0.20860th birthday +8 months -0.285 0.182 -0.732 a 0.20860th birthday +9 months -0.263 0.182 -0.557 a 0.20860th birthday +10 months -0.312 c 0.182 -0.614 a 0.20860th birthday +11 months -0.315 c 0.182 -0.576 a 0.208Continued next page

42
Appendix Table 3 (Continued)Widows Divorced Women
Dummy Variables Coefficient StandardError
Coefficient StandardError
60th birthday +12 months -0.262 0.182 -0.513 b 0.20860th birthday +13 months -0.391 b 0.182 -0.480 b 0.20860th birthday +14 months -0.278 0.182 -0.684 a 0.20860th birthday +15 months -0.290 0.182 -0.420 b 0.20860th birthday +16 months -0.231 0.182 -0.372 c 0.20860th birthday +17 months -0.322 c 0.182 -0.654 a 0.20860th birthday +18 months -0.484 a 0.182 -0.676 a 0.20860th birthday +19 months -0.160 0.182 -0.869 a 0.21960th birthday +20 months -0.212 0.182 -0.614 a 0.20860th birthday +21 months -0.379 b 0.182 -0.822 a 0.20860th birthday +22 months -0.451 b 0.182 -0.499 b 0.20860th birthday +23 months -0.276 0.182 -0.699 a 0.20860th birthday +24 months -0.104 0.182 -0.403 c 0.208(60th bday–23 mos.)*(After 1979 Law ∆) 0.103 0.233 -0.282 0.267(60th bday –22 mos.)*(After 1979 Law ∆) 0.150 0.233 -0.386 0.267(60th bday –21 mos.)*(After 1979 Law ∆) -0.121 0.233 -0.187 0.267(60th bday –20 mos.)*(After 1979 Law ∆) 0.098 0.233 -0.183 0.267(60th bday –19 mos.)*(After 1979 Law ∆) 0.029 0.233 -0.264 0.267(60th bday –18 mos.)*(After 1979 Law ∆) 0.036 0.233 -0.050 0.267(60th bday –17 mos.)*(After 1979 Law ∆) 0.037 0.233 -0.036 0.267(60th bday –16 mos.)*(After 1979 Law ∆) 0.219 0.233 -0.480 c 0.267(60th bday –15 mos.)*(After 1979 Law ∆) -0.036 0.233 -0.185 0.267(60th bday –14 mos.)*(After 1979 Law ∆) 0.014 0.233 -0.375 0.267(60th bday –13 mos.)*(After 1979 Law ∆) 0.143 0.233 -0.153 0.267(60th bday –12 mos.)*(After 1979 Law ∆) -0.188 0.233 -0.167 0.267(60th bday –11 mos.)*(After 1979 Law ∆) -0.120 0.233 0.229 0.267(60th bday –10 mos.)*(After 1979 Law ∆) -0.069 0.233 0.069 0.267(60th bday –9 mos.)*(After 1979 Law ∆) 0.008 0.233 0.449 c 0.267(60th bday –8 mos.)*(After 1979 Law ∆) 0.019 0.233 -0.013 0.267(60th bday –7 mos.)*(After 1979 Law ∆) -0.150 0.233 0.014 0.267(60th bday –6 mos.)*(After 1979 Law ∆) -0.109 0.233 -0.108 0.267(60th bday –5 mos.)*(After 1979 Law ∆) -0.107 0.233 0.207 0.267(60th bday –4 mos.)*(After 1979 Law ∆) -0.018 0.233 -0.234 0.267(60th bday –3 mos.)*(After 1979 Law ∆) 0.146 0.233 -0.069 0.267(60th bday –2 mos.)*(After 1979 Law ∆) -0.229 0.233 -0.187 0.267(60th bday –1 mos.)*(After 1979 Law ∆) -0.181 0.233 -0.200 0.267(60th bday )*(After 1979 Law ∆) 0.386 c 0.233 0.044 0.267(60th bday +1 mos.)*(After 1979 Law ∆) 0.738 a 0.233 0.486 c 0.267Continued next page

43
Appendix Table 3 (Continued)Widows Divorced Women
Dummy Variables Coefficient StandardError
Coefficient StandardError
(60th bday +2 mos.)*(After 1979 Law ∆) 0.579 b 0.233 0.052 0.267(60th bday +3 mos.)*(After 1979 Law ∆) 0.508 b 0.233 0.262 0.267(60th bday +4 mos.)*(After 1979 Law ∆) 0.072 0.233 0.016 0.267(60th bday +5 mos.)*(After 1979 Law ∆) 0.319 0.233 -0.522 b 0.267(60th bday +6 mos.)*(After 1979 Law ∆) 0.107 0.233 -0.103 0.267(60th bday +7 mos.)*(After 1979 Law ∆) 0.160 0.233 -0.021 0.267(60th bday +8 mos.)*(After 1979 Law ∆) 0.403 c 0.233 0.097 0.267(60th bday +9 mos.)*(After 1979 Law ∆) 0.135 0.233 0.180 0.267(60th bday +10 mos.)*(After 1979 Law ∆) 0.361 0.233 -0.121 0.267(60th bday +11 mos.)*(After 1979 Law ∆) 0.274 0.233 -0.069 0.267(60th bday +12 mos.)*(After 1979 Law ∆) 0.508 b 0.233 -0.033 0.267(60th bday +13 mos.)*(After 1979 Law ∆) 0.119 0.233 -0.235 0.267(60th bday +14 mos.)*(After 1979 Law ∆) 0.375 0.233 -0.061 0.267(60th bday +15 mos.)*(After 1979 Law ∆) 0.300 0.233 -0.225 0.268(60th bday +16 mos.)*(After 1979 Law ∆) 0.302 0.233 -0.308 0.267(60th bday +17 mos.)*(After 1979 Law ∆) 0.216 0.233 -0.004 0.267(60th bday +18 mos.)*(After 1979 Law ∆) 0.548 b 0.233 -0.108 0.267(60th bday +19 mos.)*(After 1979 Law ∆) 0.274 0.233 0.238 0.276(60th bday +20 mos.)*(After 1979 Law ∆) 0.208 0.233 -0.210 0.267(60th bday +21 mos.)*(After 1979 Law ∆) 0.303 0.233 0.058 0.267(60th bday +22 mos.)*(After 1979 Law ∆) 0.518 b 0.233 -0.311 0.267(60th bday +23 mos.)*(After 1979 Law ∆) 0.451 c 0.233 -0.097 0.267(60th bday +24 mos.)*(After 1979 Law ∆) 0.461 b 0.233 -0.161 0.267Year=1969 0.196 b 0.086 -0.018 0.098Year=1970 0.171 b 0.086 0.089 0.099Year=1971 0.156 c 0.086 0.088 0.099Year=1972 0.102 0.086 0.317 a 0.098Year=1973 0.216 b 0.086 0.265 a 0.098Year=1974 0.201 b 0.086 0.187 b 0.098Year=1975 0.089 0.086 0.352 a 0.098Year=1976 0.078 0.086 0.342 a 0.098Year=1977 -0.032 0.086 0.425 a 0.098Year=1978 -0.036 0.086 0.316 a 0.098Year=1979 -0.101 0.184 0.490 b 0.211Year=1980 -0.279 0.184 0.554 a 0.211Year=1981 -0.195 0.184 0.585 a 0.211Year=1982 -0.213 0.184 0.649 a 0.211Year=1983 -0.222 0.184 0.698 a 0.211Continued next page

44
Appendix Table 3 (Continued)Widows Divorced Women
Dummy Variables Coefficient StandardError
Coefficient StandardError
Year=1984 -0.328 c 0.184 0.737 a 0.211Year=1985 -0.332 c 0.184 0.630 a 0.211Year=1986 -0.411 b 0.184 0.698 a 0.211Year=1987 -0.507 a 0.184 0.772 a 0.211Year=1988 -0.514 a 0.184 0.757 a 0.211Year=1989 -0.721 a 0.184 0.594 a 0.211Year=1990 -0.672 a 0.184 0.699 a 0.211Year=1991 -0.787 a 0.184 0.525 b 0.211Year=1992 -0.803 a 0.184 0.745 a 0.211Year=1993 -0.903 a 0.184 0.553 a 0.211Year=1994 -1.075 a 0.184 0.735 a 0.211Year=1995 -0.854 a 0.184 0.921 a 0.211Constant 4.905 a 0.141 4.116 a 0.161
Source: Authors’ tabulations from VS data.Notes: Omitted categories are year=1968 and age 50 years. a statistically significant at the 1 percentlevel. b statistically significant at the 5 percent level. c statistically significant at the 10 percent level


![WIDOWS’ AND ORPHANS’ PENSIONS ACT...Widows’ and Orphans’ Pensions CAP. 192 LAWS OF KENYA WIDOWS’ AND ORPHANS’ PENSIONS ACT CHAPTER 192 Revised Edition 2012 [1972] Published](https://img.pdfslide.us/doc/110x75/5e88b415fa14c615883f2f2e/widowsa-and-orphansa-pensions-act-widowsa-and-orphansa-pensions-cap.jpg)