Embed Size (px)
Citation preview
Resource
Widespread Expansion of Protein Interaction
Capabilities by Alternative SplicingGraphical Abstract
Highlights
d Alternative splicing can produce isoforms with vastly
different interaction profiles
d These differences can be as great as those between proteins
encoded by different genes
d Isoform-specific partners exhibit distinct expression and
functional characteristics
Yang et al., 2016, Cell 164, 805–817February 11, 2016 ª2016 Elsevier Inc.http://dx.doi.org/10.1016/j.cell.2016.01.029
Authors
Xinping Yang,
Jasmin Coulombe-Huntington,
Shuli Kang, ..., LiliaM. Iakoucheva, Yu Xia,
Marc Vidal
[email protected] (L.M.I.),[email protected] (Y.X.),[email protected] (M.V.)
In Brief
Alternatively spliced isoforms of proteins
exhibit strikingly different interaction
profiles and thus, in the context of global
interactome networks, appear to behave
as if encoded by distinct genes rather
than as minor variants of each other.
Accession Numbers
KU177872–KU178906
Resource
Widespread Expansion of Protein InteractionCapabilities by Alternative SplicingXinping Yang,1,2,3,4,17 Jasmin Coulombe-Huntington,5,17,19 Shuli Kang,6,17,20 GloriaM. Sheynkman,1,2,3,17 Tong Hao,1,2,3,17
Aaron Richardson,1,2,3 Song Sun,7,8,9,10 Fan Yang,7,8,9 Yun A. Shen,1,2,3 Ryan R. Murray,2,3,21 Kerstin Spirohn,1,2,3
Bridget E. Begg,1,2,3,22 Miquel Duran-Frigola,11 Andrew MacWilliams,2,3,23 Samuel J. Pevzner,2,3,12,13 Quan Zhong,2,3,24
Shelly A. Trigg,2,3,25 Stanley Tam,2,3,26 Lila Ghamsari,2,3,27 Nidhi Sahni,1,2,3 Song Yi,1,2,3 Maria D. Rodriguez,2,3,28
Dawit Balcha,1,2,3 Guihong Tan,7 Michael Costanzo,7 Brenda Andrews,7,8 Charles Boone,7,8 Xianghong J. Zhou,14
Kourosh Salehi-Ashtiani,2,3,29 Benoit Charloteaux,1,2,3,30 Alyce A. Chen,1,2,3 Michael A. Calderwood,1,2,3 Patrick Aloy,11,15
Frederick P. Roth,1,2,7,8,9,16,18 David E. Hill,1,2,3,18 Lilia M. Iakoucheva,6,18,* Yu Xia,2,5,18,* and Marc Vidal1,2,3,18,*1Genomic Analysis of Network Perturbations Center of Excellence in Genomic Science (CEGS), Dana-Farber Cancer Institute, Boston, MA02215, USA2Center for Cancer Systems Biology (CCSB) and Department of Cancer Biology, Dana-Farber Cancer Institute, Boston, MA 02215, USA3Department of Genetics, Harvard Medical School, Boston, MA 02115, USA4Department of Obstetrics and Gynecology, Nanfang Hospital, Southern Medical University, Guangzhou 510515, China5Department of Bioengineering, McGill University, Montreal, QC H3A 0C3, Canada6Department of Psychiatry, University of California, San Diego, La Jolla, CA 92093, USA7Donnelly Centre, University of Toronto, Toronto, ON M5S 3E1, Canada8Department of Molecular Genetics, University of Toronto, Toronto, ON M5S 3E1, Canada9Lunenfeld-Tanenbaum Research Institute, Mt. Sinai Hospital, Toronto, ON M5G 1X5, Canada10Department of Medical Biochemistry and Microbiology, Uppsala University, SE-75123 Uppsala, Sweden11Institute for Research in Biomedicine (IRB Barcelona), The Barcelona Institute of Science and Technology, Barcelona 08028, Catalonia,Spain12Department of Biomedical Engineering, Boston University, Boston, MA 02215, USA13Boston University School of Medicine, Boston, MA 02118, USA14Molecular and Computational Biology Program, Department of Biological Sciences, University of Southern California, Los Angeles, CA90089, USA15Institucio Catalana de Recerca i Estudis Avancats (ICREA), Barcelona 08010, Catalonia, Spain16Canadian Institute for Advanced Research, Toronto, ON M5G 1Z8, Canada17Co-first author18Co-senior author19Present address: Institute for Research in Immunology and Cancer, Universite de Montreal, Montreal, QC H3C 3J7, Canada20Present address: Molecular and Computational Biology Program, Department of Biological Sciences, University of Southern California, LosAngeles, CA 90089, USA21Present address: Biomedicum Helsinki 1, University of Helsinki, Helsinki 00290, Finland22Present address: Department of Biology, Massachusetts Institute of Technology, Cambridge, MA 02139, USA23Present address: Tecan US, Inc., Morrisville, NC 27560, USA24Present address: Department of Biological Sciences, Wright State University, Dayton, OH 45435, USA25Present address: Biological Sciences Department, University of California, San Diego, La Jolla, CA 92093, USA26Present address: Department of Cell Biology, Harvard Medical School, Boston, MA 02115, USA27Present address: Genocea Biosciences, Inc., Cambridge, MA 02140, USA28Present address: Biomedical Sciences and Translational Medicine, Cedars-Sinai Medical Center, Los Angeles, CA 90048, USA29Present address: Division of Science andMath andCenter for Genomics andSystemsBiology (CGSB), NewYork University AbuDhabi, Abu
Dhabi, United Arab Emirates30Present address: Unit of Animal Genomics, GIGA-R and Faculty of Veterinary Medicine, University of Liege, 4000 Liege, Belgium
*Correspondence: *Correspondence: [email protected] (L.M.I.), [email protected] (Y.X.), [email protected] (M.V.)
http://dx.doi.org/10.1016/j.cell.2016.01.029
SUMMARY
While alternative splicing is known to diversify thefunctional characteristics of some genes, the extentto which protein isoforms globally contribute tofunctional complexity on a proteomic scale re-mains unknown. To address this systematically, wecloned full-length open reading frames of alterna-tively spliced transcripts for a large number of humangenes and used protein-protein interaction profiling
to functionally compare hundreds of protein isoformpairs. The majority of isoform pairs share less than50% of their interactions. In the global context ofinteractome network maps, alternative isoformstend to behave like distinct proteins rather thanminorvariants of each other. Interaction partners specificto alternative isoforms tend to be expressed in ahighly tissue-specific manner and belong to distinctfunctional modules. Our strategy, applicable to otherfunctional characteristics, reveals a widespread
Cell 164, 805–817, February 11, 2016 ª2016 Elsevier Inc. 805
expansion of protein interaction capabilities throughalternative splicing and suggests that many alterna-tive ‘‘isoforms’’ are functionally divergent (i.e., ‘‘func-tional alloforms’’).
INTRODUCTION
Humans are more complex than worms or fruit flies, yet they
appear tohave roughly the samenumber ofprotein-codinggenes
(Blencowe, 2006). One way to address this apparent paradox is
to investigate the extent to which functionally different polypep-
tides can be encoded by individual genes in various species.
Eukaryotic genes can encode multiple protein ‘‘forms’’ via
alternative transcription, splicing, 30 end formation, translation,
and post-translational modification. Alternative splicing pro-
duces transcript ‘‘isoforms’’ for most human genes (Pan et al.,
2008; Wang et al., 2008), providing functional diversity at the
level of enzymatic activities and subcellular localizations, as
well as protein-protein, protein-DNA, and protein-ligand physical
interactions (Kelemen et al., 2013). An isoform may exhibit
dominant-negative effects over other isoforms encoded by the
same gene, be up- or downregulated instead of constitutively
active, or even have opposing cellular functions. For example,
two isoforms encoded by the BCL2L1 gene have opposite func-
tions in apoptosis—the longer isoform inhibits the process,
whereas the shorter one promotes it (Schwerk and Schulze-
Osthoff, 2005). In another example, ubiquitous alternative
splicing of D. melanogaster Dscam1 generates thousands of
different polypeptides, each with different binding specificities
to enable self-recognition of neurons (Wojtowicz et al., 2007).
Altogether, several hundred human genes are known to encode
alternatively spliced isoforms with distinct functional character-
istics (Kelemen et al., 2013).
What remains unclear is how widespread this phenomenon is
at the scale of the whole proteome, which is of much higher
complexity than originally anticipated (Tran et al., 2011). As
many as 100,000 distinct isoform transcripts could be produced
from the�20,000 human protein-coding genes (Pan et al., 2008),
collectively leading to perhaps over a million distinct polypep-
tides obtained by post-translational modification of products of
all possible transcript isoforms (Smith and Kelleher, 2013).
How such proteomic complexity relates to global cellular pro-
cesses is essentially unknown. To what extent are pairs of iso-
forms encoded by a common gene functionally different from
each other? How widespread is isoform-specific functional di-
versity in any given species? Howmight such functional diversity
vary between species? What role does this diversity play in evo-
lution? Altogether, the central challenge is to determine the
extent to which two distinct, yet non-mutually exclusive, models
might apply: (1) alternative isoforms tend to mediate similar
functions, i.e., they mostly behave as ‘‘functional isoforms’’;
and (2) alternative isoforms tend to display distinct functions,
i.e., they should mostly be considered as ‘‘functional alloforms’’
(Figure 1A).
So far, investigations into the role of alternative splicing have
focused on the functions alternative protein isoforms can or
cannot perform, relative to their so-called ‘‘reference’’ counter-
806 Cell 164, 805–817, February 11, 2016 ª2016 Elsevier Inc.
part (Buljan et al., 2012; Ellis et al., 2012). To begin addressing
the questions outlined above in a systematic and unbiased
manner, large-scale functional profiling approaches are needed
to quantify the extent to which all isoforms encoded by large
numbers of genes are functionally similar or different from each
other, taking all pairwise combinations of isoforms encoded by
the same gene into consideration. This, in turn, requires novel
methodologies to identify, clone, and exogenously express full-
length open reading frames (ORFs) for all isoforms across a
wide range of genes.
Contemporary attempts at systematically discovering alter-
natively spliced isoforms genome wide have been based on
next-generation sequencing (NGS) methods. For example,
RNA sequencing (RNA-seq) provides relatively deep sampling
(Pan et al., 2008; Wang et al., 2008). However, the short length
of RNA-seq reads has hampered the discovery of contiguous
exon connectivity for full-length alternatively spliced isoforms.
Full-length sequencing of single cDNA molecules, or ‘‘Iso-
seq’’ (Eid et al., 2009), has proven successful in generating
improved models of full-length transcript isoforms (Sharon
et al., 2013). Another strategy captures co-association of
distant alternatively spliced exons by limiting the number of
RNA molecules in the pools used to generate sequencing li-
braries (Tilgner et al., 2015). However, none of the above strate-
gies provide the large-scale physical clone collections needed
to systematically express and study the function of alternative
isoforms.
Here, we apply a new strategy, ‘‘ORF-seq,’’ to discover,
characterize, exogenously express, and functionally investigate
large numbers of alternatively spliced full-length ORFs.
We have applied this strategy to the study of binary protein-
protein interactions (PPIs) and identified widespread interaction
differences due to alternative splicing (Figure 1A). Alternatively
spliced protein isoforms tend to behave like completely
distinct genes in interactome networks rather than minor vari-
ants of each other. Thus, a sizable proportion of alternative
isoforms in the human proteome are ‘‘functional alloforms’’
(Figure 1A).
RESULTS
Comparative Functional Profiling of AlternativeIsoformsTo characterize functional diversity between pairs of alternatively
spliced isoforms encoded by common genes, or to simplify:
‘‘alternative isoforms,’’ across the whole genome, we designed
the following strategy (Figure 1B). First, full-length ORFs corre-
sponding to known and novel isoforms are amplified by reverse
transcription followed by PCR (RT-PCR) using gene-specific
primers. Pools of resulting RT-PCR products are Gateway
cloned (Walhout et al., 2000), and individual ORFs are
sequenced using an NGS-based deep-well approach (Salehi-
Ashtiani et al., 2008). Second, Gateway-cloned full-length iso-
form ORFs are transferred into various expression vectors to
allow systematic functional analyses such as binary protein-pro-
tein and protein-DNA interaction assays or measurement of
enzymatic activities. Large numbers of pairs of alternative iso-
forms can thus be functionally profiled to evaluate the extent to
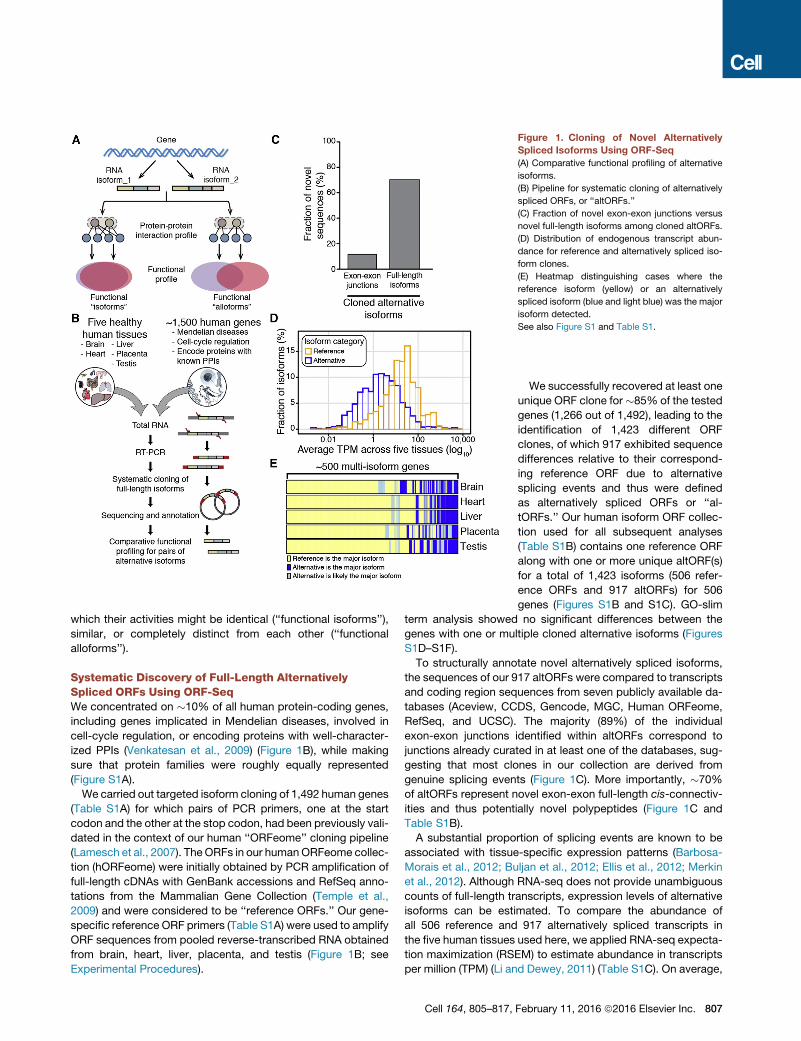
Figure 1. Cloning of Novel Alternatively
Spliced Isoforms Using ORF-Seq
(A) Comparative functional profiling of alternative
isoforms.
(B) Pipeline for systematic cloning of alternatively
spliced ORFs, or ‘‘altORFs.’’
(C) Fraction of novel exon-exon junctions versus
novel full-length isoforms among cloned altORFs.
(D) Distribution of endogenous transcript abun-
dance for reference and alternatively spliced iso-
form clones.
(E) Heatmap distinguishing cases where the
reference isoform (yellow) or an alternatively
spliced isoform (blue and light blue) was the major
isoform detected.
See also Figure S1 and Table S1.
which their activities might be identical (‘‘functional isoforms’’),
similar, or completely distinct from each other (‘‘functional
alloforms’’).
Systematic Discovery of Full-Length AlternativelySpliced ORFs Using ORF-SeqWe concentrated on �10% of all human protein-coding genes,
including genes implicated in Mendelian diseases, involved in
cell-cycle regulation, or encoding proteins with well-character-
ized PPIs (Venkatesan et al., 2009) (Figure 1B), while making
sure that protein families were roughly equally represented
(Figure S1A).
We carried out targeted isoform cloning of 1,492 human genes
(Table S1A) for which pairs of PCR primers, one at the start
codon and the other at the stop codon, had been previously vali-
dated in the context of our human ‘‘ORFeome’’ cloning pipeline
(Lamesch et al., 2007). TheORFs in our humanORFeome collec-
tion (hORFeome) were initially obtained by PCR amplification of
full-length cDNAs with GenBank accessions and RefSeq anno-
tations from the Mammalian Gene Collection (Temple et al.,
2009) and were considered to be ‘‘reference ORFs.’’ Our gene-
specific reference ORF primers (Table S1A) were used to amplify
ORF sequences from pooled reverse-transcribed RNA obtained
from brain, heart, liver, placenta, and testis (Figure 1B; see
Experimental Procedures).
Cell 164, 805–817,
We successfully recovered at least one
unique ORF clone for�85% of the tested
genes (1,266 out of 1,492), leading to the
identification of 1,423 different ORF
clones, of which 917 exhibited sequence
differences relative to their correspond-
ing reference ORF due to alternative
splicing events and thus were defined
as alternatively spliced ORFs or ‘‘al-
tORFs.’’ Our human isoform ORF collec-
tion used for all subsequent analyses
(Table S1B) contains one reference ORF
along with one or more unique altORF(s)
for a total of 1,423 isoforms (506 refer-
ence ORFs and 917 altORFs) for 506
genes (Figures S1B and S1C). GO-slim
term analysis showed no significant differences between the
genes with one or multiple cloned alternative isoforms (Figures
S1D–S1F).
To structurally annotate novel alternatively spliced isoforms,
the sequences of our 917 altORFs were compared to transcripts
and coding region sequences from seven publicly available da-
tabases (Aceview, CCDS, Gencode, MGC, Human ORFeome,
RefSeq, and UCSC). The majority (89%) of the individual
exon-exon junctions identified within altORFs correspond to
junctions already curated in at least one of the databases, sug-
gesting that most clones in our collection are derived from
genuine splicing events (Figure 1C). More importantly, �70%
of altORFs represent novel exon-exon full-length cis-connectiv-
ities and thus potentially novel polypeptides (Figure 1C and
Table S1B).
A substantial proportion of splicing events are known to be
associated with tissue-specific expression patterns (Barbosa-
Morais et al., 2012; Buljan et al., 2012; Ellis et al., 2012; Merkin
et al., 2012). Although RNA-seq does not provide unambiguous
counts of full-length transcripts, expression levels of alternative
isoforms can be estimated. To compare the abundance of
all 506 reference and 917 alternatively spliced transcripts in
the five human tissues used here, we applied RNA-seq expecta-
tion maximization (RSEM) to estimate abundance in transcripts
per million (TPM) (Li and Dewey, 2011) (Table S1C). On average,
February 11, 2016 ª2016 Elsevier Inc. 807
the abundance of the reference transcripts (average TPM = 73.2,
median TPM = 15.1) was higher than that of the alternatively
spliced transcripts (average TPM= 28.2,median TPM= 2.4) (Fig-
ure 1D), likely explaining why these particular forms were
enriched in previous collections. Despite this, we found for
46% of genes (235/506), an alternative transcript is more abun-
dant than its cognate reference transcript in at least one tissue
(Figure 1E). Thus, depending on the tissue or cell-type, alterna-
tively spliced transcripts can be the predominant product of a
gene, thus making the notion of a reference isoform somewhat
arbitrary.
Interaction Profiling of Alternative IsoformsBecause PPIs are inherent to most cellular processes, we initi-
ated our functional studies by comparing interaction profiles of
isoform pairs for 1,035 isoforms consisting of 398 reference
ORFs and 637 altORFs using a stringent binary interaction plat-
form validated by an empirical framework (Dreze et al., 2010;
Venkatesan et al., 2009) (Figure 2A and Table S2A).
First we performed yeast two-hybrid (Y2H) screens in which all
protein isoforms, fused to the Gal4 DNA binding domain (DB),
were tested against proteins encoded by the hORFeome v5.1
collection of �15,000 ORF clones fused to the Gal4 activation
domain (AD) (Dreze et al., 2010; Rolland et al., 2014; Rual
et al., 2005). Following first-pass screening, each protein isoform
was pairwise tested for interaction with the candidate partners
identified not only for itself but also for all first-pass partners of
all other protein isoforms encoded by the same gene, thus mini-
mizing biases due to incomplete sampling sensitivity (Venkate-
san et al., 2009). To generate a final dataset of verified Y2H pairs,
pairs showing a positive result in at least two out of the three pair-
wise tests were subjected to a fourth pairwise retest, and PCR
products amplified from the final positive pairs were sequenced
to confirm the identity of clones encoding each interacting pro-
tein (Figure 2A and Table S2B). Western blots were performed
for all protein isoforms of a subset of randomly picked genes,
demonstrating comparable heterologous protein expression of
all isoforms of the same gene tested by Y2H (Figures 2B and
S2A–S2H). Finally, to validate the overall quality of the PPI data-
set of human protein pairs identified by Y2H, we selected a
representative sample of the isoform-partner interacting and
non-interacting pairs and subjected them to orthogonal valida-
tion in human HEK293T cells using a protein complementation
assay (PCA) (Dreze et al., 2010; Rolland et al., 2014) (Figure 2C;
Table S2C). The isoform-partner positive pairs were recovered at
a rate similar to that seen for pairs from a well-described positive
reference set (PRS) (Venkatesan et al., 2009), while isoform-part-
ner negative pairs validated at a rate similar to that seen for pairs
from a random reference set (RRS) (Figure 2C and Tables S2C
and S2D).
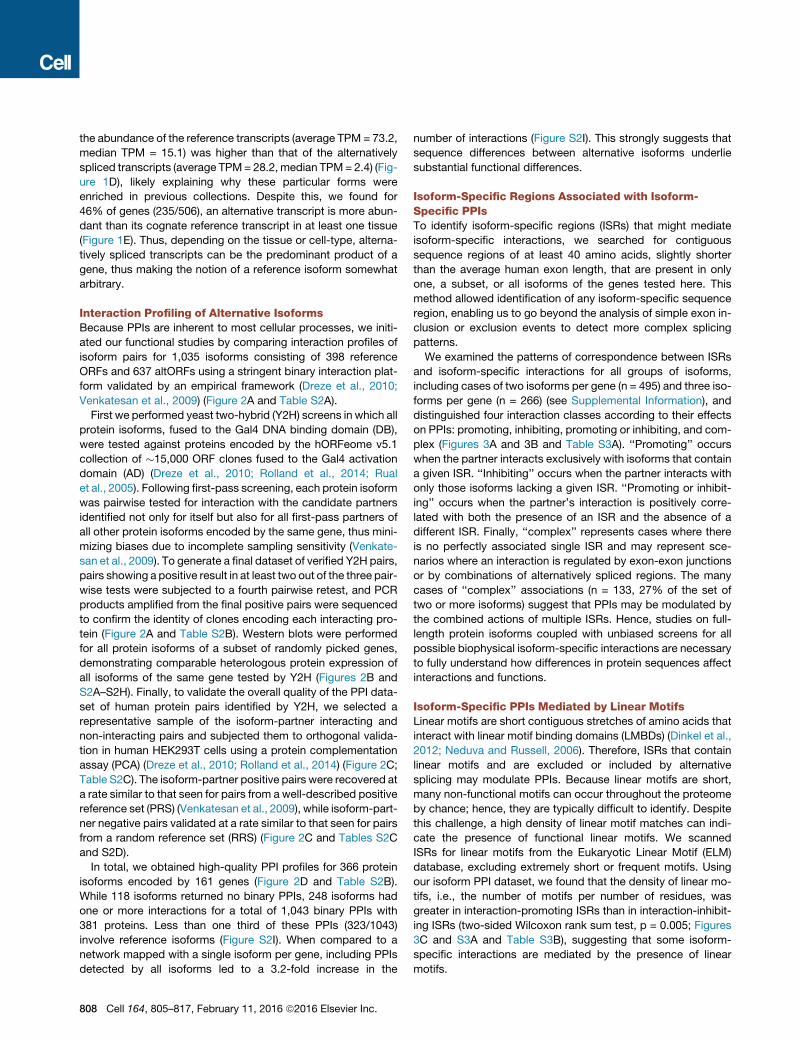
In total, we obtained high-quality PPI profiles for 366 protein
isoforms encoded by 161 genes (Figure 2D and Table S2B).
While 118 isoforms returned no binary PPIs, 248 isoforms had
one or more interactions for a total of 1,043 binary PPIs with
381 proteins. Less than one third of these PPIs (323/1043)
involve reference isoforms (Figure S2I). When compared to a
network mapped with a single isoform per gene, including PPIs
detected by all isoforms led to a 3.2-fold increase in the
808 Cell 164, 805–817, February 11, 2016 ª2016 Elsevier Inc.
number of interactions (Figure S2I). This strongly suggests that
sequence differences between alternative isoforms underlie
substantial functional differences.
Isoform-Specific Regions Associated with Isoform-Specific PPIsTo identify isoform-specific regions (ISRs) that might mediate
isoform-specific interactions, we searched for contiguous
sequence regions of at least 40 amino acids, slightly shorter
than the average human exon length, that are present in only
one, a subset, or all isoforms of the genes tested here. This
method allowed identification of any isoform-specific sequence
region, enabling us to go beyond the analysis of simple exon in-
clusion or exclusion events to detect more complex splicing
patterns.
We examined the patterns of correspondence between ISRs
and isoform-specific interactions for all groups of isoforms,
including cases of two isoforms per gene (n = 495) and three iso-
forms per gene (n = 266) (see Supplemental Information), and
distinguished four interaction classes according to their effects
on PPIs: promoting, inhibiting, promoting or inhibiting, and com-
plex (Figures 3A and 3B and Table S3A). ‘‘Promoting’’ occurs
when the partner interacts exclusively with isoforms that contain
a given ISR. ‘‘Inhibiting’’ occurs when the partner interacts with
only those isoforms lacking a given ISR. ‘‘Promoting or inhibit-
ing’’ occurs when the partner’s interaction is positively corre-
lated with both the presence of an ISR and the absence of a
different ISR. Finally, ‘‘complex’’ represents cases where there
is no perfectly associated single ISR and may represent sce-
narios where an interaction is regulated by exon-exon junctions
or by combinations of alternatively spliced regions. The many
cases of ‘‘complex’’ associations (n = 133, 27% of the set of
two or more isoforms) suggest that PPIs may be modulated by
the combined actions of multiple ISRs. Hence, studies on full-
length protein isoforms coupled with unbiased screens for all
possible biophysical isoform-specific interactions are necessary
to fully understand how differences in protein sequences affect
interactions and functions.
Isoform-Specific PPIs Mediated by Linear MotifsLinear motifs are short contiguous stretches of amino acids that
interact with linear motif binding domains (LMBDs) (Dinkel et al.,
2012; Neduva and Russell, 2006). Therefore, ISRs that contain
linear motifs and are excluded or included by alternative
splicing may modulate PPIs. Because linear motifs are short,
many non-functional motifs can occur throughout the proteome
by chance; hence, they are typically difficult to identify. Despite
this challenge, a high density of linear motif matches can indi-
cate the presence of functional linear motifs. We scanned
ISRs for linear motifs from the Eukaryotic Linear Motif (ELM)
database, excluding extremely short or frequent motifs. Using
our isoform PPI dataset, we found that the density of linear mo-
tifs, i.e., the number of motifs per number of residues, was
greater in interaction-promoting ISRs than in interaction-inhibit-
ing ISRs (two-sided Wilcoxon rank sum test, p = 0.005; Figures
3C and S3A and Table S3B), suggesting that some isoform-
specific interactions are mediated by the presence of linear
motifs.
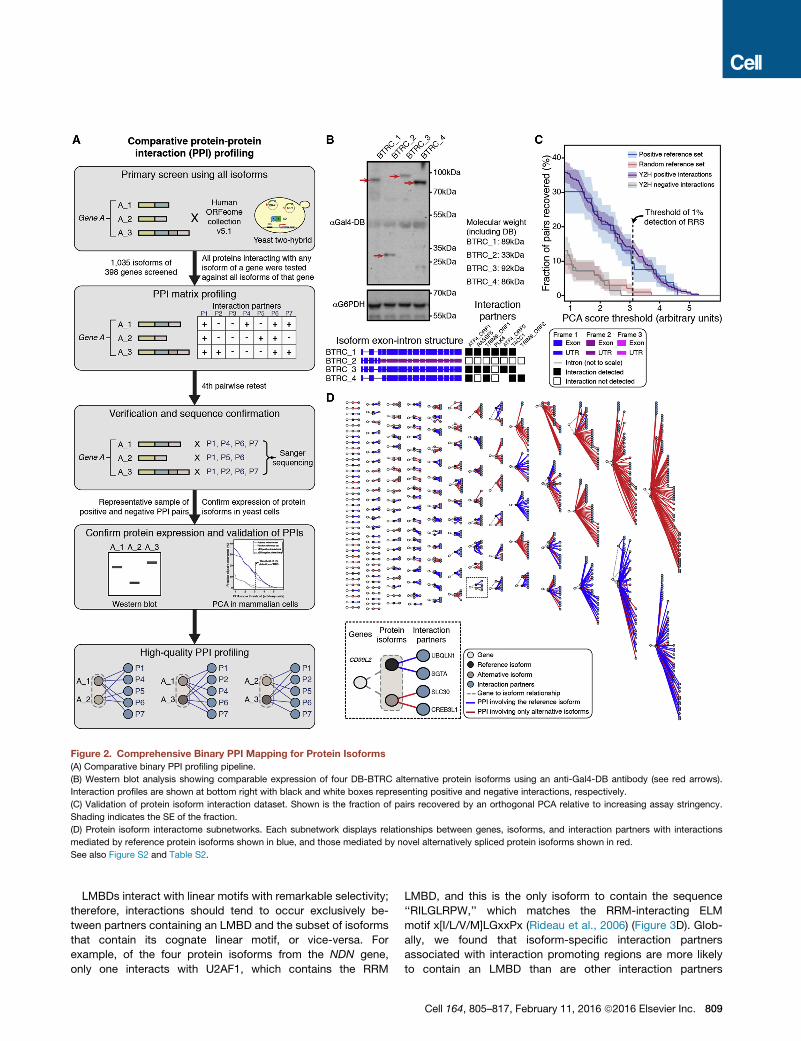
Figure 2. Comprehensive Binary PPI Mapping for Protein Isoforms
(A) Comparative binary PPI profiling pipeline.
(B) Western blot analysis showing comparable expression of four DB-BTRC alternative protein isoforms using an anti-Gal4-DB antibody (see red arrows).
Interaction profiles are shown at bottom right with black and white boxes representing positive and negative interactions, respectively.
(C) Validation of protein isoform interaction dataset. Shown is the fraction of pairs recovered by an orthogonal PCA relative to increasing assay stringency.
Shading indicates the SE of the fraction.
(D) Protein isoform interactome subnetworks. Each subnetwork displays relationships between genes, isoforms, and interaction partners with interactions
mediated by reference protein isoforms shown in blue, and those mediated by novel alternatively spliced protein isoforms shown in red.
See also Figure S2 and Table S2.
LMBDs interact with linear motifs with remarkable selectivity;
therefore, interactions should tend to occur exclusively be-
tween partners containing an LMBD and the subset of isoforms
that contain its cognate linear motif, or vice-versa. For
example, of the four protein isoforms from the NDN gene,
only one interacts with U2AF1, which contains the RRM
LMBD, and this is the only isoform to contain the sequence
‘‘RILGLRPW,’’ which matches the RRM-interacting ELM
motif x[I/L/V/M]LGxxPx (Rideau et al., 2006) (Figure 3D). Glob-
ally, we found that isoform-specific interaction partners
associated with interaction promoting regions are more likely
to contain an LMBD than are other interaction partners
Cell 164, 805–817, February 11, 2016 ª2016 Elsevier Inc. 809
Figure 3. Contiguous Sequence Regions Associated with Isoform-Specific PPIs
(A) Four categories of ISRs according to their effects on interactions (promoting, inhibiting, promoting or inhibiting, or complex).
(B) Fraction of interaction partners classified in each of the four categories for all genes encoding at least two (left) or three (right) isoforms.
(C) Box plot showing the average number of linear motifs per residue in promoting and inhibiting ISRs. p values from two-sided Wilcoxon rank test.
(D) Schematic diagram illustrating interaction modulation potentially explained by differential splicing of linear motifs within exons.
(E) Histogram showing the fraction of interaction partners that contain LMBDs and exhibit isoform-specific interactions associated with promoting regions or not.
p values from two-sided Fisher’s exact test; error bars represent the SE of the fraction, estimated using bootstrapping with 100 resamplings.
(F) Histogram showing the fraction of isoforms with interaction loss where a predicted interaction domain was disrupted by alternative splicing. p values from two-
sided Fisher’s exact test; error bars represent the SE of the fraction, estimated using bootstrapping with 100 resamplings.
(G) Three-dimensional structure of BCL2-xL (gray; PDB code 1g5j) in complex with BAD (blue). The interaction interface is disrupted in the BCL2-xS isoform with
the 30-end of the first exon spliced out (pink). See Figure S3 for more structure examples.
(H) Schematic diagram illustrating the interactionmodulation of protein isoforms of theBCL2L1 gene potentially explained by differential splicing of BCL2 domain.
See also Figure S3 and Table S3.
(two-sided Fisher’s exact test, p = 0.033; Figures 3E and S3B
and Table S3C).
Splicing-Mediated Disruption of Interaction DomainsBinary PPIs are frequently governed by interactions between
globular domains, and many domain-domain interactions
(DDIs) have been predicted based on three-dimensional struc-
tures of protein complexes or other computational approaches
(Finn et al., 2005; Mosca et al., 2014). The alternative inclusion
or exclusion of domains participating in DDIs could modulate
PPIs. To investigate the link between splicing-mediated domain
disruptions and loss of interactions involving such domains, we
810 Cell 164, 805–817, February 11, 2016 ª2016 Elsevier Inc.
searched our dataset for cases where the interacting partner
contains a domain predicted to interact with a domain in one
or more isoforms of the bait protein. We then considered each
pair of isoforms of the gene where the partner protein interacts
with only one of the two isoforms. From these isoform pairs,
we derived two sets: (1) cases in which one isoform lacks at least
50 amino acids (chosen based on the average size of domains
[Jones et al., 1998]) of the predicted interaction domain relative
to the other isoform and (2) cases where one isoform is shorter
than the other by 50 ormore residues, regardless of domain con-
tent. In 87% of cases (52/60) with theR50 residue domain dele-
tion/truncation, the loss or truncation is associated with the
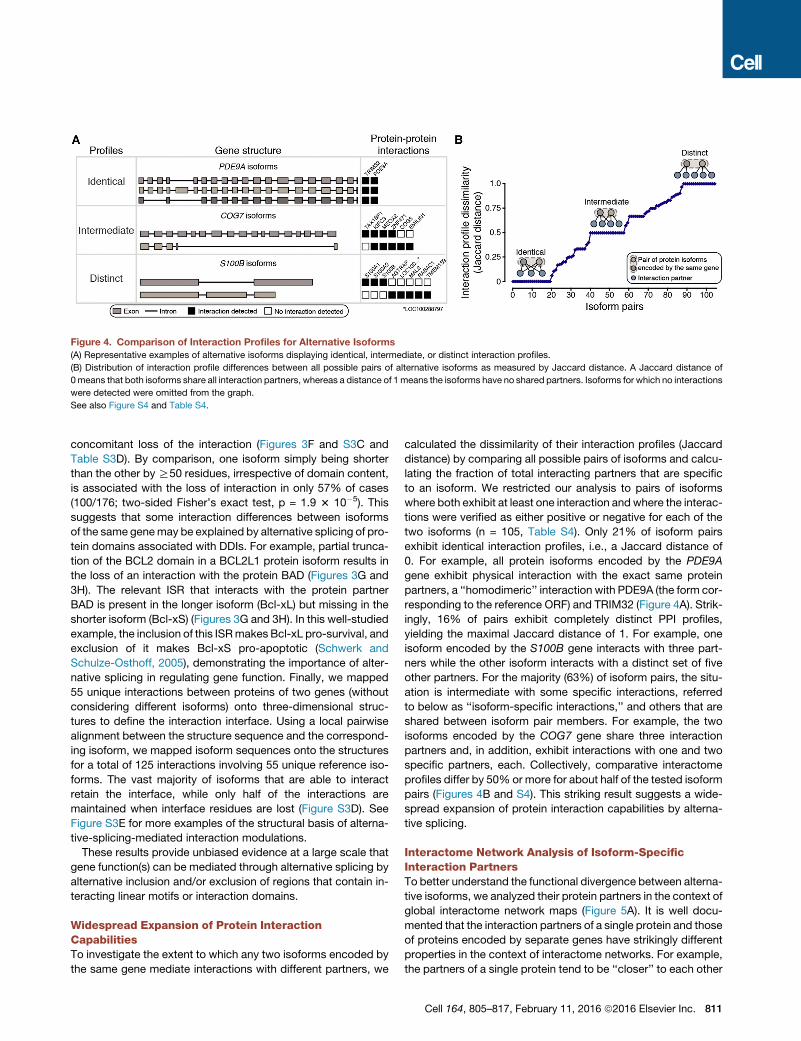
Figure 4. Comparison of Interaction Profiles for Alternative Isoforms
(A) Representative examples of alternative isoforms displaying identical, intermediate, or distinct interaction profiles.
(B) Distribution of interaction profile differences between all possible pairs of alternative isoforms as measured by Jaccard distance. A Jaccard distance of
0means that both isoforms share all interaction partners, whereas a distance of 1means the isoforms have no shared partners. Isoforms for which no interactions
were detected were omitted from the graph.
See also Figure S4 and Table S4.
concomitant loss of the interaction (Figures 3F and S3C and
Table S3D). By comparison, one isoform simply being shorter
than the other by R50 residues, irrespective of domain content,
is associated with the loss of interaction in only 57% of cases
(100/176; two-sided Fisher’s exact test, p = 1.9 3 10�5). This
suggests that some interaction differences between isoforms
of the same genemay be explained by alternative splicing of pro-
tein domains associated with DDIs. For example, partial trunca-
tion of the BCL2 domain in a BCL2L1 protein isoform results in
the loss of an interaction with the protein BAD (Figures 3G and
3H). The relevant ISR that interacts with the protein partner
BAD is present in the longer isoform (Bcl-xL) but missing in the
shorter isoform (Bcl-xS) (Figures 3G and 3H). In this well-studied
example, the inclusion of this ISRmakes Bcl-xL pro-survival, and
exclusion of it makes Bcl-xS pro-apoptotic (Schwerk and
Schulze-Osthoff, 2005), demonstrating the importance of alter-
native splicing in regulating gene function. Finally, we mapped
55 unique interactions between proteins of two genes (without
considering different isoforms) onto three-dimensional struc-
tures to define the interaction interface. Using a local pairwise
alignment between the structure sequence and the correspond-
ing isoform, we mapped isoform sequences onto the structures
for a total of 125 interactions involving 55 unique reference iso-
forms. The vast majority of isoforms that are able to interact
retain the interface, while only half of the interactions are
maintained when interface residues are lost (Figure S3D). See
Figure S3E for more examples of the structural basis of alterna-
tive-splicing-mediated interaction modulations.
These results provide unbiased evidence at a large scale that
gene function(s) can be mediated through alternative splicing by
alternative inclusion and/or exclusion of regions that contain in-
teracting linear motifs or interaction domains.
Widespread Expansion of Protein InteractionCapabilitiesTo investigate the extent to which any two isoforms encoded by
the same gene mediate interactions with different partners, we
calculated the dissimilarity of their interaction profiles (Jaccard
distance) by comparing all possible pairs of isoforms and calcu-
lating the fraction of total interacting partners that are specific
to an isoform. We restricted our analysis to pairs of isoforms
where both exhibit at least one interaction andwhere the interac-
tions were verified as either positive or negative for each of the
two isoforms (n = 105, Table S4). Only 21% of isoform pairs
exhibit identical interaction profiles, i.e., a Jaccard distance of
0. For example, all protein isoforms encoded by the PDE9A
gene exhibit physical interaction with the exact same protein
partners, a ‘‘homodimeric’’ interaction with PDE9A (the form cor-
responding to the reference ORF) and TRIM32 (Figure 4A). Strik-
ingly, 16% of pairs exhibit completely distinct PPI profiles,
yielding the maximal Jaccard distance of 1. For example, one
isoform encoded by the S100B gene interacts with three part-
ners while the other isoform interacts with a distinct set of five
other partners. For the majority (63%) of isoform pairs, the situ-
ation is intermediate with some specific interactions, referred
to below as ‘‘isoform-specific interactions,’’ and others that are
shared between isoform pair members. For example, the two
isoforms encoded by the COG7 gene share three interaction
partners and, in addition, exhibit interactions with one and two
specific partners, each. Collectively, comparative interactome
profiles differ by 50% or more for about half of the tested isoform
pairs (Figures 4B and S4). This striking result suggests a wide-
spread expansion of protein interaction capabilities by alterna-
tive splicing.
Interactome Network Analysis of Isoform-SpecificInteraction PartnersTo better understand the functional divergence between alterna-
tive isoforms, we analyzed their protein partners in the context of
global interactome network maps (Figure 5A). It is well docu-
mented that the interaction partners of a single protein and those
of proteins encoded by separate genes have strikingly different
properties in the context of interactome networks. For example,
the partners of a single protein tend to be ‘‘closer’’ to each other
Cell 164, 805–817, February 11, 2016 ª2016 Elsevier Inc. 811
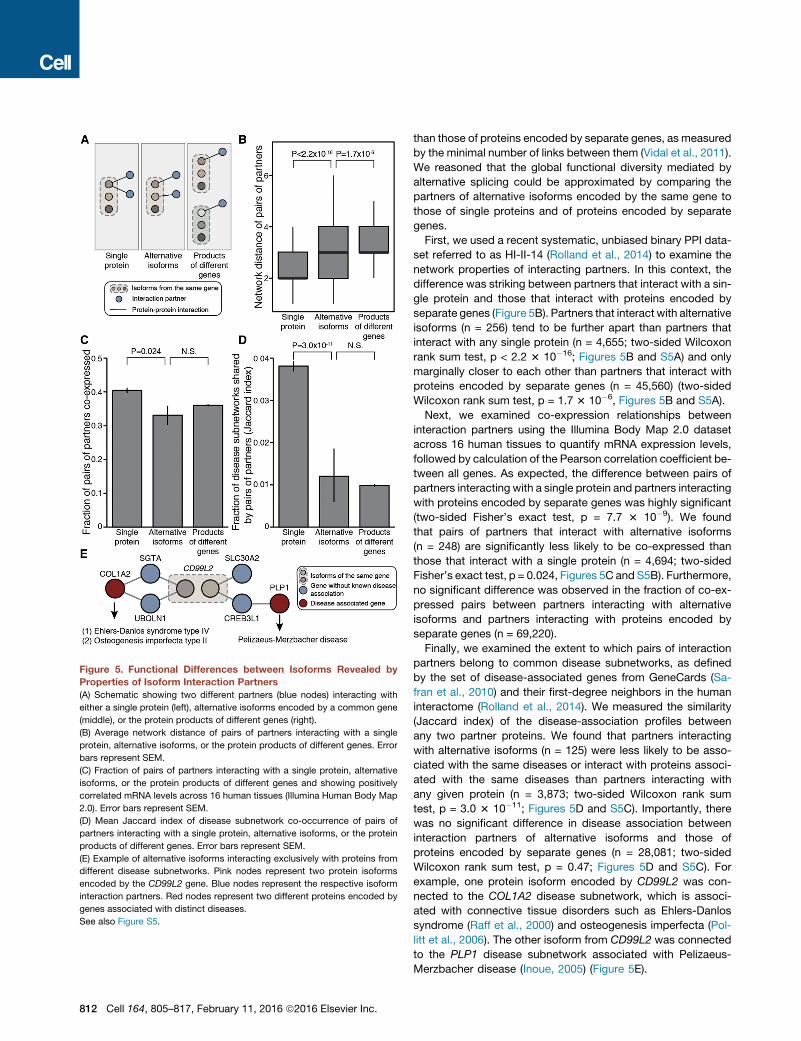
Figure 5. Functional Differences between Isoforms Revealed by
Properties of Isoform Interaction Partners
(A) Schematic showing two different partners (blue nodes) interacting with
either a single protein (left), alternative isoforms encoded by a common gene
(middle), or the protein products of different genes (right).
(B) Average network distance of pairs of partners interacting with a single
protein, alternative isoforms, or the protein products of different genes. Error
bars represent SEM.
(C) Fraction of pairs of partners interacting with a single protein, alternative
isoforms, or the protein products of different genes and showing positively
correlated mRNA levels across 16 human tissues (Illumina Human Body Map
2.0). Error bars represent SEM.
(D) Mean Jaccard index of disease subnetwork co-occurrence of pairs of
partners interacting with a single protein, alternative isoforms, or the protein
products of different genes. Error bars represent SEM.
(E) Example of alternative isoforms interacting exclusively with proteins from
different disease subnetworks. Pink nodes represent two protein isoforms
encoded by the CD99L2 gene. Blue nodes represent the respective isoform
interaction partners. Red nodes represent two different proteins encoded by
genes associated with distinct diseases.
See also Figure S5.
812 Cell 164, 805–817, February 11, 2016 ª2016 Elsevier Inc.
than those of proteins encoded by separate genes, as measured
by the minimal number of links between them (Vidal et al., 2011).
We reasoned that the global functional diversity mediated by
alternative splicing could be approximated by comparing the
partners of alternative isoforms encoded by the same gene to
those of single proteins and of proteins encoded by separate
genes.
First, we used a recent systematic, unbiased binary PPI data-
set referred to as HI-II-14 (Rolland et al., 2014) to examine the
network properties of interacting partners. In this context, the
difference was striking between partners that interact with a sin-
gle protein and those that interact with proteins encoded by
separate genes (Figure 5B). Partners that interact with alternative
isoforms (n = 256) tend to be further apart than partners that
interact with any single protein (n = 4,655; two-sided Wilcoxon
rank sum test, p < 2.2 3 10�16; Figures 5B and S5A) and only
marginally closer to each other than partners that interact with
proteins encoded by separate genes (n = 45,560) (two-sided
Wilcoxon rank sum test, p = 1.7 3 10�6, Figures 5B and S5A).
Next, we examined co-expression relationships between
interaction partners using the Illumina Body Map 2.0 dataset
across 16 human tissues to quantify mRNA expression levels,
followed by calculation of the Pearson correlation coefficient be-
tween all genes. As expected, the difference between pairs of
partners interacting with a single protein and partners interacting
with proteins encoded by separate genes was highly significant
(two-sided Fisher’s exact test, p = 7.7 3 10�9). We found
that pairs of partners that interact with alternative isoforms
(n = 248) are significantly less likely to be co-expressed than
those that interact with a single protein (n = 4,694; two-sided
Fisher’s exact test, p = 0.024, Figures 5C and S5B). Furthermore,
no significant difference was observed in the fraction of co-ex-
pressed pairs between partners interacting with alternative
isoforms and partners interacting with proteins encoded by
separate genes (n = 69,220).
Finally, we examined the extent to which pairs of interaction
partners belong to common disease subnetworks, as defined
by the set of disease-associated genes from GeneCards (Sa-
fran et al., 2010) and their first-degree neighbors in the human
interactome (Rolland et al., 2014). We measured the similarity
(Jaccard index) of the disease-association profiles between
any two partner proteins. We found that partners interacting
with alternative isoforms (n = 125) were less likely to be asso-
ciated with the same diseases or interact with proteins associ-
ated with the same diseases than partners interacting with
any given protein (n = 3,873; two-sided Wilcoxon rank sum
test, p = 3.0 3 10�11; Figures 5D and S5C). Importantly, there
was no significant difference in disease association between
interaction partners of alternative isoforms and those of
proteins encoded by separate genes (n = 28,081; two-sided
Wilcoxon rank sum test, p = 0.47; Figures 5D and S5C). For
example, one protein isoform encoded by CD99L2 was con-
nected to the COL1A2 disease subnetwork, which is associ-
ated with connective tissue disorders such as Ehlers-Danlos
syndrome (Raff et al., 2000) and osteogenesis imperfecta (Pol-
litt et al., 2006). The other isoform from CD99L2 was connected
to the PLP1 disease subnetwork associated with Pelizaeus-
Merzbacher disease (Inoue, 2005) (Figure 5E).
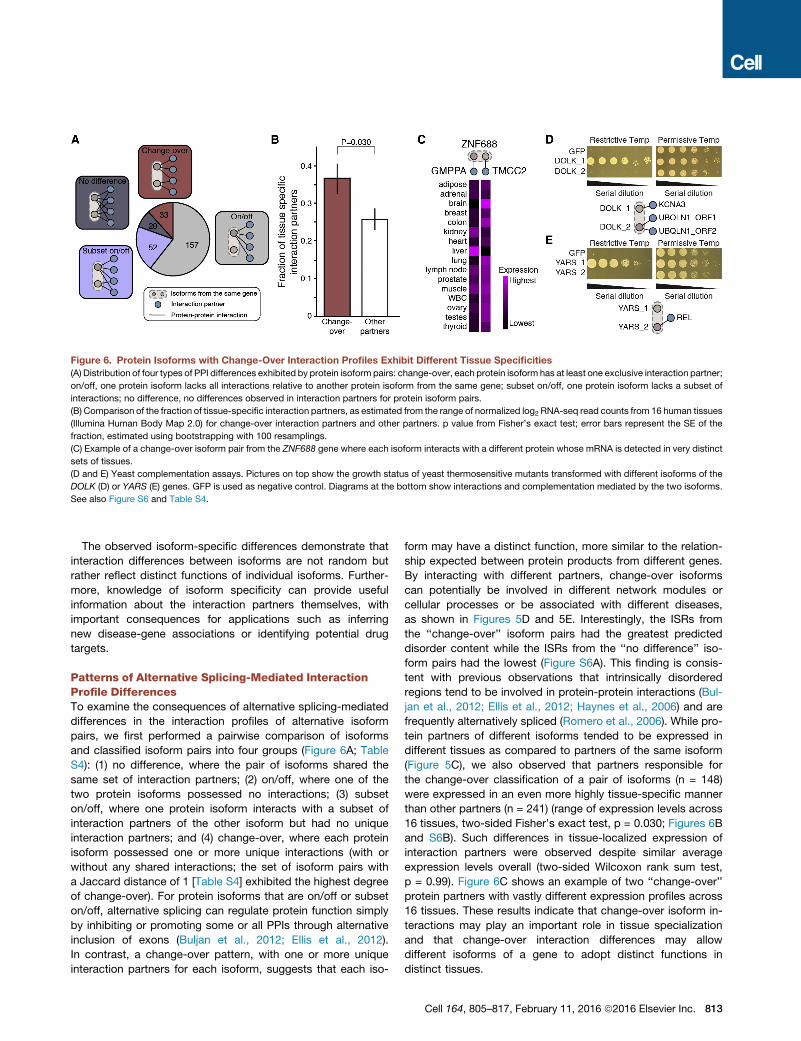
Figure 6. Protein Isoforms with Change-Over Interaction Profiles Exhibit Different Tissue Specificities
(A) Distribution of four types of PPI differences exhibited by protein isoform pairs: change-over, each protein isoform has at least one exclusive interaction partner;
on/off, one protein isoform lacks all interactions relative to another protein isoform from the same gene; subset on/off, one protein isoform lacks a subset of
interactions; no difference, no differences observed in interaction partners for protein isoform pairs.
(B) Comparison of the fraction of tissue-specific interaction partners, as estimated from the range of normalized log2 RNA-seq read counts from 16 human tissues
(Illumina Human Body Map 2.0) for change-over interaction partners and other partners. p value from Fisher’s exact test; error bars represent the SE of the
fraction, estimated using bootstrapping with 100 resamplings.
(C) Example of a change-over isoform pair from the ZNF688 gene where each isoform interacts with a different protein whose mRNA is detected in very distinct
sets of tissues.
(D and E) Yeast complementation assays. Pictures on top show the growth status of yeast thermosensitive mutants transformed with different isoforms of the
DOLK (D) or YARS (E) genes. GFP is used as negative control. Diagrams at the bottom show interactions and complementation mediated by the two isoforms.
See also Figure S6 and Table S4.
The observed isoform-specific differences demonstrate that
interaction differences between isoforms are not random but
rather reflect distinct functions of individual isoforms. Further-
more, knowledge of isoform specificity can provide useful
information about the interaction partners themselves, with
important consequences for applications such as inferring
new disease-gene associations or identifying potential drug
targets.
Patterns of Alternative Splicing-Mediated InteractionProfile DifferencesTo examine the consequences of alternative splicing-mediated
differences in the interaction profiles of alternative isoform
pairs, we first performed a pairwise comparison of isoforms
and classified isoform pairs into four groups (Figure 6A; Table
S4): (1) no difference, where the pair of isoforms shared the
same set of interaction partners; (2) on/off, where one of the
two protein isoforms possessed no interactions; (3) subset
on/off, where one protein isoform interacts with a subset of
interaction partners of the other isoform but had no unique
interaction partners; and (4) change-over, where each protein
isoform possessed one or more unique interactions (with or
without any shared interactions; the set of isoform pairs with
a Jaccard distance of 1 [Table S4] exhibited the highest degree
of change-over). For protein isoforms that are on/off or subset
on/off, alternative splicing can regulate protein function simply
by inhibiting or promoting some or all PPIs through alternative
inclusion of exons (Buljan et al., 2012; Ellis et al., 2012).
In contrast, a change-over pattern, with one or more unique
interaction partners for each isoform, suggests that each iso-
form may have a distinct function, more similar to the relation-
ship expected between protein products from different genes.
By interacting with different partners, change-over isoforms
can potentially be involved in different network modules or
cellular processes or be associated with different diseases,
as shown in Figures 5D and 5E. Interestingly, the ISRs from
the ‘‘change-over’’ isoform pairs had the greatest predicted
disorder content while the ISRs from the ‘‘no difference’’ iso-
form pairs had the lowest (Figure S6A). This finding is consis-
tent with previous observations that intrinsically disordered
regions tend to be involved in protein-protein interactions (Bul-
jan et al., 2012; Ellis et al., 2012; Haynes et al., 2006) and are
frequently alternatively spliced (Romero et al., 2006). While pro-
tein partners of different isoforms tended to be expressed in
different tissues as compared to partners of the same isoform
(Figure 5C), we also observed that partners responsible for
the change-over classification of a pair of isoforms (n = 148)
were expressed in an even more highly tissue-specific manner
than other partners (n = 241) (range of expression levels across
16 tissues, two-sided Fisher’s exact test, p = 0.030; Figures 6B
and S6B). Such differences in tissue-localized expression of
interaction partners were observed despite similar average
expression levels overall (two-sided Wilcoxon rank sum test,
p = 0.99). Figure 6C shows an example of two ‘‘change-over’’
protein partners with vastly different expression profiles across
16 tissues. These results indicate that change-over isoform in-
teractions may play an important role in tissue specialization
and that change-over interaction differences may allow
different isoforms of a gene to adopt distinct functions in
distinct tissues.
Cell 164, 805–817, February 11, 2016 ª2016 Elsevier Inc. 813
To further investigate functional differences between isoforms
exhibiting different PPI profiles, we exploited a cross-species
complementation assay to measure the ability of each isoform
to rescue phenotypic defects of a loss-of-function mutation in
a cognate yeast gene. We found eight cases of described
human-to-yeast complementation relationships (Kachroo et al.,
2015) among 138 genes with at least two isoforms showing
different interaction profiles, altogether corresponding to 19
distinct isoforms. Yeast-based functional complementation
assays were performed for these 19 isoforms. Isoforms of
two genes, DOLK and YARS, showed differential abilities to
rescue the corresponding yeast temperature sensitive mutants,
strongly suggesting the appearance of a genuine functional
divergence between these isoforms during evolution (Figures
6D and 6E).
Concluding RemarksTranscriptomic analyses have highlighted the tremendous po-
tential proteome diversity generated by alternative splicing
(Barbosa-Morais et al., 2012; Pan et al., 2008; Wang et al.,
2008). However, the functional divergence between alternatively
spliced protein isoforms remained unclear on a proteomic scale.
Although systematic functional studies of protein isoforms have
been described for selected groups of genes (Corominas et al.,
2014), most recorded functional annotations and protein interac-
tions are at gene-level resolution.
Systematic cloning of native splice isoforms and proteome-
scale mapping of isoform interactions has enabled us to cap-
ture a wide range of interaction profile differences between
protein isoforms, providing deeper insight into the global influ-
ence of alternative splicing on the interactome. We have es-
tablished that PPI network expansion is a major consequence
of alternative splicing and that different isoforms from the
same gene can give rise to different local features within
interactome networks. We found differences in interaction
profiles for a majority of isoform pairs (Figure 4B), suggesting
widespread functional differences between isoforms encoded
by the same gene. Our analyses of the functional properties
of isoform interaction partners further demonstrate a contin-
uum of functional divergence between isoforms, up to the
extreme degree where two different isoforms encoded by
the same gene appear to functionally behave like two different
proteins (Figure 5). This in turn strongly suggests that the
‘‘functional alloform’’ model of alternative isoforms should
not be excluded and in fact might more accurately reflect
the reality of the whole human proteome than the ‘‘functional
isoform’’ model (Figure 1A).
Global functional divergence between isoforms may explain
how organisms like humans, with vast splicing diversity, can
generate greater network complexity and thus potentially
greater phenotypic complexity from only about 20,000 pro-
tein-coding genes. This functional divergence also suggests
that each protein isoform needs to be studied individually to
understand its unique roles, including contributions to disease
pathogenesis or potential as a drug target. The mapping of
isoform-specific protein interactions can also reveal valuable
information about isoforms of the same gene and their interac-
tion partners. Significant functional divergence between iso-
814 Cell 164, 805–817, February 11, 2016 ª2016 Elsevier Inc.
form pairs as shown in Figure 5E may not be unusual. We
found that a sizeable fraction of isoform pairs interact with
distinct groups of proteins (Figures 4B and 6A), exhibiting an
interaction profile pattern we have termed ‘‘change-over.’’
Each isoform in these ‘‘change-over’’ isoform pairs possesses
unique interaction partners that show localized expression in
specific tissues (Figures 6B and 6C) and tend to be members
of distinct disease modules (Figure 5E). These findings sug-
gest that the change-over pattern of splicing-mediated PPI
networks is a key driver of functional divergence between
isoforms and may contribute to functional specialization of
tissues.
We were able to identify alternatively spliced regions contain-
ing potential interaction determinants that ‘‘promote’’ or
‘‘inhibit’’ interactions (Figures 3A and 3B). Many ‘‘interaction-
promoting’’ regions contain linear motifs, and isoform-specific
interaction partners contain LMBDs (Figures 3C–3E), which is
consistent with previous findings that tissue-specific exons
often contain linear motifs (Buljan et al., 2012; Ellis et al.,
2012; Merkin et al., 2012). Similarly, interaction-promoting re-
gions tend to contain predicted interaction domains based on
known or predicted domain-domain interactions (Figures 3F–
3H). The fact that linear motifs and interaction-associated do-
mains tend to be found in ‘‘interaction promoting’’ regions offers
a mechanistic explanation for the interaction differences be-
tween isoforms.
Alternative splicing is a major mechanism in the production of
diverse protein isoforms with different primary sequence.
Beyond the primary sequence, each protein isoform can be
further processed through post-translational modifications
(PTMs), producing many more distinct polypeptides or ‘‘proteo-
forms’’ (Smith and Kelleher, 2013). In the present study, we
measured each protein isoform’s PPIs in a heterologous expres-
sion system (Y2H) and thus could have missed interactions
modulated by a protein’s PTMs, subcellular location, stability,
and other factors unique to the protein’s endogenous environ-
ment. Although it is beyond the scope of the present study,
PTMs, such as phosphorylation, can lead to differences in pro-
tein-protein interactions or other functional properties. For
example, deep transcriptome sequencing across different tis-
sues and different species reveals that tissue-specific exons
are enriched in phosphorylation sites (Merkin et al., 2012),
suggesting that alternative splicing may be involved in both the
regulation of protein interactions, as well as the modulation of
phosphorylation potential. Therefore, compiling a comprehen-
sive catalog of different proteoforms and subsequently studying
their distinct functions will be necessary for full understanding of
normal cellular biology, as well as disease pathogenesis at the
systems level.
In summary, our results support a central role for alternative
splicing in network organization, function, and cross-tissue
dynamics, demonstrating the importance of an isoform-
resolved global view of interactome networks. They also
support a paradigm in which most genes encode multiple
distinct protein isoforms, each of which potentially yields multi-
ple proteoforms, and where each proteoform possesses a
potentially unique set of functions. Collectively, this process
would generate a vast diversity of ‘‘functional alloforms,’’
contributing to vastly different physiological and developmental
outcomes, disease pathologies, and potentials for therapeutic
development.
EXPERIMENTAL PROCEDURES
See the Supplemental Experimental Procedures for additional details.
Schematic diagrams of isoform exon-intron structures, ORF sequences,
and isoform interaction profiles are available at http://isoform.dfci.harvard.
edu/.
ORF Cloning
ORF cloning and sequencing were carried out as described (Salehi-Ashtiani
et al., 2008).
RNA Abundance
The RNA-Seq Expectation Maximization program (RSEM, v1.1.21) was used
to estimate transcriptional abundances separately for each tissue (Li and
Dewey, 2011).
Binary Interaction Mapping and Validation
Y2H screening was performed as described (Dreze et al., 2010; Rolland et al.,
2014; Rual et al., 2005). All isoforms of the same gene were pairwise tested
against all possible interaction partners of any isoform for the same gene.
PPI validation by a protein complementation assay was performed as
described (Rolland et al., 2014).
Isoform Features
An ISR is defined as the longest contiguous region shared by a subset of iso-
forms. Regions mapping to all isoforms of a gene are considered constitutive
regions. We calculated whether isoform-specific interactions were more likely
to be associated with a potential promoting or inhibiting region than expected
by chance.
Linear motifs and LMBDs: for each interaction partner in our dataset, we
determined the linear motif density in the longest ISR associated with that
partner (Dinkel et al., 2012). To quantify the enrichment of LMBDs in iso-
form partners exhibiting isoform-specific interactions, Pfam-A domains (Finn
et al., 2014)weremapped to all interaction partners usingHmmer 3.0 (e-value =
10�2) (Finn et al., 2011), and each partner was classified as either containing an
LMBD, as annotated in the ELM (Dinkel et al., 2012) or Dilimot (Neduva and
Russell, 2006) databases, or not. Interaction partners were then assigned
either as exhibiting an isoform-specific interaction associated with a promot-
ing ISR, or not.
Domain-domain interactions: Pfam-A domains (Finn et al., 2014) were map-
ped to all isoforms and interaction partners using Hmmer 3.0 (e-value = 10�5)
(Finn et al., 2011). We identified isoform-partner pairs encoding a predicted
DDI from iPfam (Finn et al., 2005), 3Did (Mosca et al., 2014), or Domine (Yell-
aboina et al., 2011).
Structural Analysis of Isoform-Specific Interactions
Interactome3D (Mosca et al., 2013) was queried for PPI pairs. The inter-
action interface is defined as those residues that had a heavy atom at a dis-
tance < 6 A to the binding partner. Local pairwise alignment between the
structure sequence and the corresponding isoform identified interface
residues.
Interactome Network Analysis of Isoform Interaction Partners
The mean shortest path distance in HI-II-14 (Rolland et al., 2014) between any
two proteins that interact with the same single protein, interact with alternative
isoforms, or interact with proteins encoded by separate genes was calculated.
Path lengths involving the tested protein isoformwere excluded. p values were
calculated using the t test.
Reads from the Illumina Body Map 2.0 16-tissue RNA-seq dataset (Illumina
BodyMap 2.0) were mapped to all hORFeome clone sequences, and the log2read count was calculated for each gene for each tissue. Pearson correlation
coefficients were calculated on all pairs of interaction partners after filtering out
genes with a maximal expression below 1/32nd of the upper-quartile gene
expression. The fraction of pairs co-expressed (i.e., having a positive Pearson
correlation coefficient greater than 0.15) was calculated for each of the three
groups of pairwise proteins described above. p values were derived using
Fisher’s exact test.
Disease subnetworks were created by mapping the set of disease associ-
ated genes from GeneCards (Safran et al., 2010) onto HI-II-14 (Rolland et al.,
2014) and retrieving the disease genes and their first degree PPI neighbors.
The mean of the Jaccard index of disease subnetwork co-occurrence for all
protein pairs within each class was then calculated. p values were calculated
using Wilcoxon rank sum test.
Tissue Specificity of Isoform Interaction Partners
We measured the range of normalized log2 expression levels in the Illumina
Body Map 2.0 16-tissue RNA-seq dataset (Illumina BodyMap 2.0) and consid-
ered genes with a range greater than 7 as tissue specific.
Yeast-Based Functional Complementation Assays
Selected ORFs were expressed from low-copy expression vectors in temper-
ature sensitive (ts) yeast strains. The complementation status was determined
by comparing the growth of yeast ts strains at restrictive and permissive
temperatures.
ACCESSION NUMBERS
The GenBank accession numbers for the data reported in this paper are
GenBank: KU177872–KU178906.
SUPPLEMENTAL INFORMATION
Supplemental Information includes Supplemental Experimental Procedures,
six figures, and four tables and can be found with this article online at http://
dx.doi.org/10.1016/j.cell.2016.01.029.
AUTHOR CONTRIBUTIONS
M.V. conceived the project. X.Y., A.R., S.S., F.Y., K.S., B.E.B., R.R.M., A.M.,
Q.Z., S.A.T., S.T., L.G., N.S., S.Y., M.D.R., D.B., G.T., and M.C. performed ex-
periments. J.C.-H., S.K., G.M.S., T.H., M.D.-F., and P.A. performed computa-
tional analysis with contributions from X.Y., Y.A.S., S.J.P., X.J.Z., B.C., F.P.R.,
and Y.X. X.Y., T.H., K.S.-A., B.A., C.B., M.A.C., P.A., F.P.R., D.E.H., L.M.I.,
Y.X., and M.V. designed and/or advised research. X.Y., J.C.-H., S.K.,
G.M.S., B.C., A.A.C., M.A.C., P.A., F.P.R., D.E.H., L.M.I., Y.X., and M.V. wrote
the paper.
ACKNOWLEDGMENTS
We thank B. Blencowe for valuable discussions and critical reading of the
manuscript. This work was supported by NHGRI CEGS grant P50HG004233
(M.V. and F.P.R.); NHGRI grant U01HG001715 (M.V., D.E.H., and F.P.R.);
the Ellison Foundation (M.V.), NCI grant R33CA132073 (M.V.); the Krembil
Foundation (Canada) (F.P.R.); a Canada Excellence Research Chair Award
(F.P.R.); an Ontario Research Fund-Research Excellence Award (F.P.R.);
E.K. Shriver NICHD grant R01HD065288 (L.M.I. and K.S.-A.); NIMH grants
R01MH091350 (L.M.I. and T.H.), R01MH105524 (L.M.I.), and R21MH104766
(L.M.I.); NSF grant CCF-1219007, NSERC grant RGPIN-2014-03892 (Canada),
Canada Foundation for Innovation grant JELF-33732 and Canada Research
Chairs Program (Y.X.); NIH training grant T32CA009361 (G.M.S.); a NSERC
fellowship (Canada) (J.C.-H.); NIGMS grant R01GM105431 (X.J.Z.); and a
Swedish Research Council International Postdoc Grant (S.S.). M.V. is a FRS-
FNRS Chercheur Qualifie Honoraire (Belgium).
Received: May 26, 2015
Revised: October 12, 2015
Accepted: January 20, 2016
Published: February 11, 2016
Cell 164, 805–817, February 11, 2016 ª2016 Elsevier Inc. 815
REFERENCES
Barbosa-Morais, N.L., Irimia, M., Pan, Q., Xiong, H.Y., Gueroussov, S., Lee,
L.J., Slobodeniuc, V., Kutter, C., Watt, S., Colak, R., et al. (2012). The evolu-
tionary landscape of alternative splicing in vertebrate species. Science 338,
1587–1593.
Blencowe, B.J. (2006). Alternative splicing: new insights from global analyses.
Cell 126, 37–47.
Buljan, M., Chalancon, G., Eustermann, S., Wagner, G.P., Fuxreiter, M., Bate-
man, A., and Babu, M.M. (2012). Tissue-specific splicing of disordered seg-
ments that embed binding motifs rewires protein interaction networks. Mol.
Cell 46, 871–883.
Corominas, R., Yang, X., Lin, G.N., Kang, S., Shen, Y., Ghamsari, L., Broly, M.,
Rodriguez, M., Tam, S., Trigg, S.A., et al. (2014). Protein interaction network of
alternatively spliced isoforms from brain links genetic risk factors for autism.
Nat. Commun. 5, 3650.
Dinkel, H., Michael, S., Weatheritt, R.J., Davey, N.E., Van Roey, K., Altenberg,
B., Toedt, G., Uyar, B., Seiler, M., Budd, A., et al. (2012). ELM–the database of
eukaryotic linear motifs. Nucleic Acids Res. 40, D242–D251.
Dreze, M., Monachello, D., Lurin, C., Cusick, M.E., Hill, D.E., Vidal, M., and
Braun, P. (2010). High-quality binary interactomemapping. Methods Enzymol.
470, 281–315.
Eid, J., Fehr, A., Gray, J., Luong, K., Lyle, J., Otto, G., Peluso, P., Rank, D., Bay-
bayan, P., Bettman, B., et al. (2009). Real-time DNA sequencing from single
polymerase molecules. Science 323, 133–138.
Ellis, J.D., Barrios-Rodiles, M., Colak, R., Irimia, M., Kim, T., Calarco, J.A.,
Wang, X., Pan, Q., O’Hanlon, D., Kim, P.M., et al. (2012). Tissue-specific alter-
native splicing remodels protein-protein interaction networks. Mol. Cell 46,
884–892.
Finn, R.D., Marshall, M., and Bateman, A. (2005). iPfam: visualization of pro-
tein-protein interactions in PDB at domain and amino acid resolutions. Bioin-
formatics 21, 410–412.
Finn, R.D., Clements, J., and Eddy, S.R. (2011). HMMER web server: interac-
tive sequence similarity searching. Nucleic Acids Res. 39, W29–W37.
Finn, R.D., Bateman, A., Clements, J., Coggill, P., Eberhardt, R.Y., Eddy, S.R.,
Heger, A., Hetherington, K., Holm, L., Mistry, J., et al. (2014). Pfam: the protein
families database. Nucleic Acids Res. 42, D222–D230.
Haynes, C., Oldfield, C.J., Ji, F., Klitgord, N., Cusick, M.E., Radivojac, P., Uver-
sky, V.N., Vidal, M., and Iakoucheva, L.M. (2006). Intrinsic disorder is a com-
mon feature of hub proteins from four eukaryotic interactomes. PLoS Comput.
Biol. 2, e100.
Inoue, K. (2005). PLP1-related inherited dysmyelinating disorders: Peli-
zaeus-Merzbacher disease and spastic paraplegia type 2. Neurogenetics
6, 1–16.
Jones, S., Stewart, M., Michie, A., Swindells, M.B., Orengo, C., and Thornton,
J.M. (1998). Domain assignment for protein structures using a consensus
approach: characterization and analysis. Protein Sci. 7, 233–242.
Kachroo, A.H., Laurent, J.M., Yellman, C.M., Meyer, A.G., Wilke, C.O., and
Marcotte, E.M. (2015). Evolution. Systematic humanization of yeast genes re-
veals conserved functions and genetic modularity. Science 348, 921–925.
Kelemen, O., Convertini, P., Zhang, Z., Wen, Y., Shen, M., Falaleeva, M., and
Stamm, S. (2013). Function of alternative splicing. Gene 514, 1–30.
Lamesch, P., Li, N., Milstein, S., Fan, C., Hao, T., Szabo, G., Hu, Z., Venkate-
san, K., Bethel, G., Martin, P., et al. (2007). hORFeome v3.1: a resource of hu-
man open reading frames representing over 10,000 human genes. Genomics
89, 307–315.
Li, B., and Dewey, C.N. (2011). RSEM: accurate transcript quantification from
RNA-Seq data with or without a reference genome. BMC Bioinformatics 12,
323.
Merkin, J., Russell, C., Chen, P., and Burge, C.B. (2012). Evolutionary dy-
namics of gene and isoform regulation in Mammalian tissues. Science 338,
1593–1599.
816 Cell 164, 805–817, February 11, 2016 ª2016 Elsevier Inc.
Mosca, R., Ceol, A., and Aloy, P. (2013). Interactome3D: adding structural de-
tails to protein networks. Nat. Methods 10, 47–53.
Mosca, R., Ceol, A., Stein, A., Olivella, R., and Aloy, P. (2014). 3did: a catalog of
domain-based interactions of known three-dimensional structure. Nucleic
Acids Res. 42, D374–D379.
Neduva, V., and Russell, R.B. (2006). DILIMOT: discovery of linear motifs in
proteins. Nucleic Acids Res. 34, W350–W355.
Pan, Q., Shai, O., Lee, L.J., Frey, B.J., and Blencowe, B.J. (2008). Deep
surveying of alternative splicing complexity in the human transcriptome by
high-throughput sequencing. Nat. Genet. 40, 1413–1415.
Pollitt, R., McMahon, R., Nunn, J., Bamford, R., Afifi, A., Bishop, N., and
Dalton, A. (2006). Mutation analysis of COL1A1 and COL1A2 in patients diag-
nosed with osteogenesis imperfecta type I-IV. Hum. Mutat. 27, 716.
Raff, M.L., Craigen, W.J., Smith, L.T., Keene, D.R., and Byers, P.H.
(2000). Partial COL1A2 gene duplication produces features of osteogene-
sis imperfecta and Ehlers-Danlos syndrome type VII. Hum. Genet. 106,
19–28.
Rideau, A.P., Gooding, C., Simpson, P.J., Monie, T.P., Lorenz, M., Huttelma-
ier, S., Singer, R.H., Matthews, S., Curry, S., and Smith, C.W. (2006). A peptide
motif in Raver1mediates splicing repression by interactionwith the PTBRRM2
domain. Nat. Struct. Mol. Biol. 13, 839–848.
Rolland, T., Tasxan, M., Charloteaux, B., Pevzner, S.J., Zhong, Q., Sahni, N., Yi,
S., Lemmens, I., Fontanillo, C., Mosca, R., et al. (2014). A proteome-scale map
of the human interactome network. Cell 159, 1212–1226.
Romero, P.R., Zaidi, S., Fang, Y.Y., Uversky, V.N., Radivojac, P., Oldfield, C.J.,
Cortese, M.S., Sickmeier, M., LeGall, T., Obradovic, Z., and Dunker, A.K.
(2006). Alternative splicing in concert with protein intrinsic disorder enables
increased functional diversity in multicellular organisms. Proc. Natl. Acad.
Sci. USA 103, 8390–8395.
Rual, J.-F., Venkatesan, K., Hao, T., Hirozane-Kishikawa, T., Dricot, A., Li, N.,
Berriz, G.F., Gibbons, F.D., Dreze, M., Ayivi-Guedehoussou, N., et al. (2005).
Towards a proteome-scale map of the human protein-protein interaction
network. Nature 437, 1173–1178.
Safran, M., Dalah, I., Alexander, J., Rosen, N., Iny Stein, T., Shmoish, M., Nativ,
N., Bahir, I., Doniger, T., Krug, H., et al. (2010). GeneCards Version 3: the hu-
man gene integrator. Database (Oxford) 2010, baq020.
Salehi-Ashtiani, K., Yang, X., Derti, A., Tian, W., Hao, T., Lin, C., Makowski, K.,
Shen, L., Murray, R.R., Szeto, D., et al. (2008). Isoform discovery by targeted
cloning, ‘deep-well’ pooling and parallel sequencing. Nat. Methods 5,
597–600.
Schwerk, C., and Schulze-Osthoff, K. (2005). Regulation of apoptosis by alter-
native pre-mRNA splicing. Mol. Cell 19, 1–13.
Sharon, D., Tilgner, H., Grubert, F., and Snyder, M. (2013). A single-molecule
long-read survey of the human transcriptome. Nat. Biotechnol. 31, 1009–
1014.
Smith, L.M., and Kelleher, N.L.; Consortium for Top Down Proteomics (2013).
Proteoform: a single term describing protein complexity. Nat. Methods 10,
186–187.
Temple, G., Gerhard, D.S., Rasooly, R., Feingold, E.A., Good, P.J., Robinson,
C., Mandich, A., Derge, J.G., Lewis, J., Shoaf, D., et al.; MGC Project Team
(2009). The completion of the Mammalian Gene Collection (MGC). Genome
Res. 19, 2324–2333.
Tilgner, H., Jahanbani, F., Blauwkamp, T., Moshrefi, A., Jaeger, E., Chen, F.,
Harel, I., Bustamante, C.D., Rasmussen, M., and Snyder, M.P. (2015).
Comprehensive transcriptome analysis using synthetic long-read sequencing
reveals molecular co-association of distant splicing events. Nat. Biotechnol.
33, 736–742.
Tran, J.C., Zamdborg, L., Ahlf, D.R., Lee, J.E., Catherman, A.D., Durbin, K.R.,
Tipton, J.D., Vellaichamy, A., Kellie, J.F., Li, M., et al. (2011). Mapping intact
protein isoforms in discovery mode using top-down proteomics. Nature 480,
254–258.
Venkatesan, K., Rual, J.-F., Vazquez, A., Stelzl, U., Lemmens, I., Hirozane-
Kishikawa, T., Hao, T., Zenkner, M., Xin, X., Goh, K.I., et al. (2009). An empirical
framework for binary interactome mapping. Nat. Methods 6, 83–90.
Vidal, M., Cusick, M.E., and Barabasi, A.-L. (2011). Interactome networks and
human disease. Cell 144, 986–998.
Walhout, A.J., Temple, G.F., Brasch, M.A., Hartley, J.L., Lorson, M.A., van den
Heuvel, S., and Vidal, M. (2000). GATEWAY recombinational cloning: applica-
tion to the cloning of large numbers of open reading frames or ORFeomes.
Methods Enzymol. 328, 575–592.
Wang, E.T., Sandberg, R., Luo, S., Khrebtukova, I., Zhang, L., Mayr, C., King-
smore, S.F., Schroth, G.P., and Burge, C.B. (2008). Alternative isoform regula-
tion in human tissue transcriptomes. Nature 456, 470–476.
Wojtowicz, W.M., Wu, W., Andre, I., Qian, B., Baker, D., and Zipursky, S.L.
(2007). A vast repertoire of Dscam binding specificities arises frommodular in-
teractions of variable Ig domains. Cell 130, 1134–1145.
Yellaboina, S., Tasneem, A., Zaykin, D.V., Raghavachari, B., and Jothi, R.
(2011). DOMINE: a comprehensive collection of known and predicted
domain-domain interactions. Nucleic Acids Res. 39, D730–D735.
Cell 164, 805–817, February 11, 2016 ª2016 Elsevier Inc. 817
Supplemental Figures
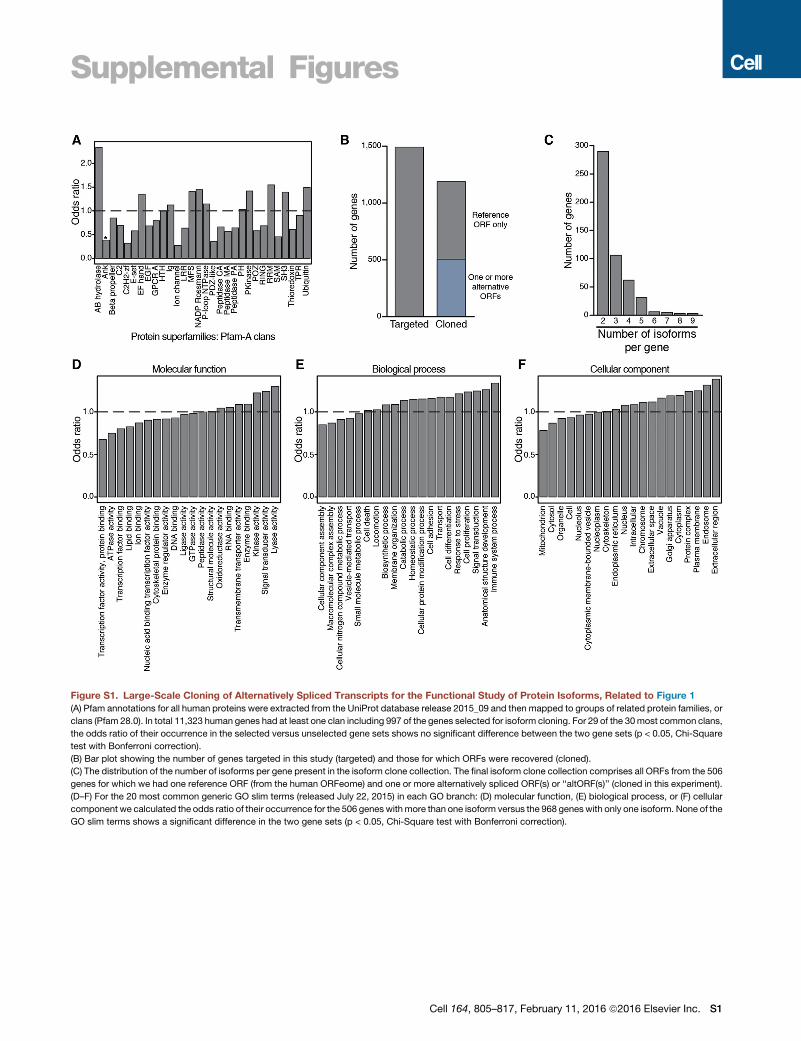
Figure S1. Large-Scale Cloning of Alternatively Spliced Transcripts for the Functional Study of Protein Isoforms, Related to Figure 1
(A) Pfam annotations for all human proteins were extracted from the UniProt database release 2015_09 and then mapped to groups of related protein families, or
clans (Pfam 28.0). In total 11,323 human genes had at least one clan including 997 of the genes selected for isoform cloning. For 29 of the 30most common clans,
the odds ratio of their occurrence in the selected versus unselected gene sets shows no significant difference between the two gene sets (p < 0.05, Chi-Square
test with Bonferroni correction).
(B) Bar plot showing the number of genes targeted in this study (targeted) and those for which ORFs were recovered (cloned).
(C) The distribution of the number of isoforms per gene present in the isoform clone collection. The final isoform clone collection comprises all ORFs from the 506
genes for which we had one reference ORF (from the human ORFeome) and one or more alternatively spliced ORF(s) or ‘‘altORF(s)’’ (cloned in this experiment).
(D–F) For the 20 most common generic GO slim terms (released July 22, 2015) in each GO branch: (D) molecular function, (E) biological process, or (F) cellular
component we calculated the odds ratio of their occurrence for the 506 genes withmore than one isoform versus the 968 geneswith only one isoform. None of the
GO slim terms shows a significant difference in the two gene sets (p < 0.05, Chi-Square test with Bonferroni correction).
Cell 164, 805–817, February 11, 2016 ª2016 Elsevier Inc. S1
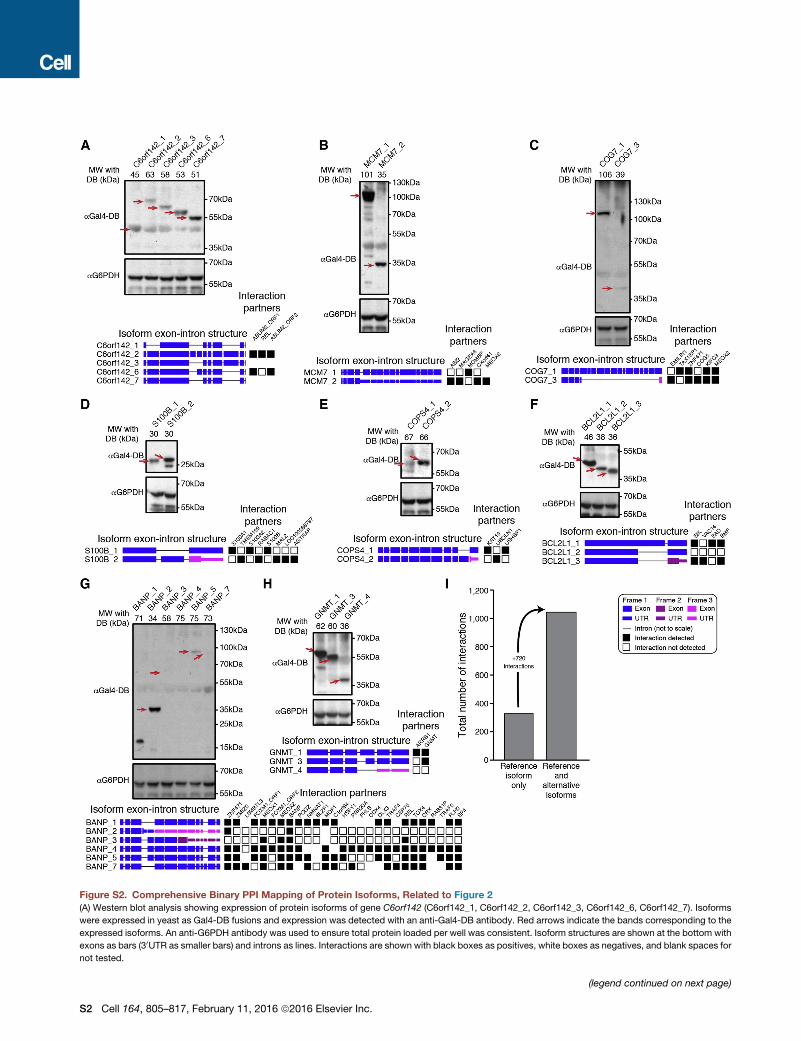
Figure S2. Comprehensive Binary PPI Mapping of Protein Isoforms, Related to Figure 2
(A) Western blot analysis showing expression of protein isoforms of gene C6orf142 (C6orf142_1, C6orf142_2, C6orf142_3, C6orf142_6, C6orf142_7). Isoforms
were expressed in yeast as Gal4-DB fusions and expression was detected with an anti-Gal4-DB antibody. Red arrows indicate the bands corresponding to the
expressed isoforms. An anti-G6PDH antibody was used to ensure total protein loaded per well was consistent. Isoform structures are shown at the bottom with
exons as bars (30UTR as smaller bars) and introns as lines. Interactions are shown with black boxes as positives, white boxes as negatives, and blank spaces for
not tested.
(legend continued on next page)
S2 Cell 164, 805–817, February 11, 2016 ª2016 Elsevier Inc.

(B–H) The same method as described in (A) was used for all Western blot analyses of genes (B) MCM7 (MCM7_1, MCM7_2); (C) COG7 (COG7_1, COG7_3); (D)
S100B (S100B_1, S100B_2); (E) COPS (COPS_1, COPS_2); (F) BCL2L1 (BCL2L1_1, BCL2L1_2, BCL2L1_3); (G) BANP (BANP_1, BANP_2, BANP_3, BANP_4,
BANP_5, BANP_7); (H) GNMT (GNMT_1, GNMT_3, GNMT_4).
(I) Histogram showing the total number of interactions when considering only the reference isoform of a gene compared to the number of interactions for all tested
isoforms of a gene.
Cell 164, 805–817, February 11, 2016 ª2016 Elsevier Inc. S3
(legend on next page)
S4 Cell 164, 805–817, February 11, 2016 ª2016 Elsevier Inc.
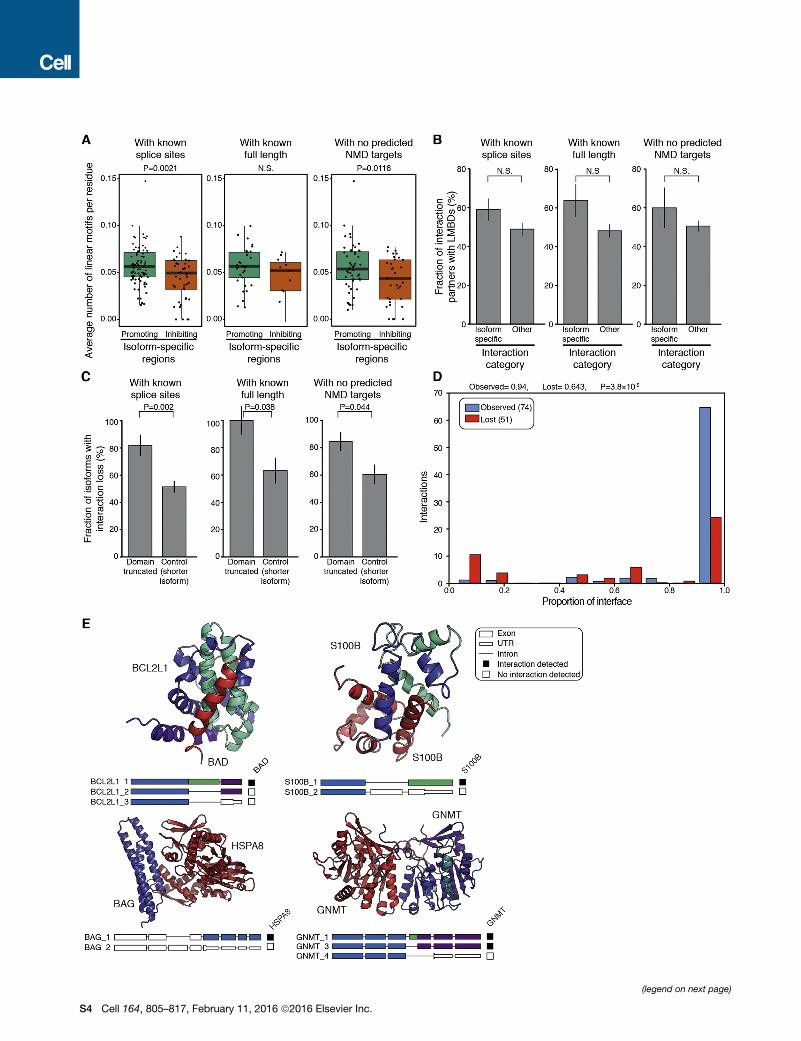
Figure S3. Associations between ISRs and Isoform-Specific Interactions, Related to Figure 3
The results were reproduced using 3 different subsets of isoforms: (1) ‘‘with known splice sites,’’ (2) ‘‘with known full length,’’ and (3) ‘‘with no predicted NMD
targets’’ (see Supplemental Experimental Procedures).
(A) Box plots show the average number of linear motifs per residue in promoting and inhibiting ISRs (two-sidedWilcoxon rank test for P values for three subsets of
the dataset).
(B) Histograms showing the fraction of interaction partners that contained linear motif binding domains (LMBDs) and did or did not exhibit isoform-specific
interactions associated with a promoting ISR (two-sided Fisher’s exact test for P values for three subsets of the dataset). Error bars represent the standard error of
the fraction, estimated using a bootstrapping method with 100 resamplings.
(C) Histograms show the fraction of isoforms with interaction loss where a predicted interaction domain was disrupted by alternative splicing (P values were
calculated using two-sided Fisher’s exact test). Error bars represent the standard error of the fraction, estimated using bootstrapping method with 100
resamplings.
(D) Isoform interactions with respect to the fraction of the conserved interface. Number of observed (blue) or lost (red) interactions with respect to the fraction of
interface residue-residue contacts in the reference sequence that are maintained in the different isoforms (see Supplemental Experimental Procedures).
(E) Structural rationale for the differential interaction patterns observed in protein isoforms. Examples of protein isoforms mapped onto the 3D structure of the
reference protein interacting with some of its partners. The coloring of the 3D structures corresponds to the one shown in the intron/exon structure represen-
tations. White represents the part of the protein that is not present in the crystal structure. White narrow box represents 30UTR. The interaction partners are shown
in red. Black square indicates detected interaction and white square no detected interaction. Upper left subpanel: Crystal structure of the interaction between
BCL2L1_1 (BCL2-Xl) and BAD (PDB 1g5j). Both BCL2L1_2 (BCL2-Xs) and BCL2L1_3 isoforms are missing half of the interaction interface contacts, which may
explain the loss of interaction with BAD. Upper right subpanel: Crystal structure of the S100B_1 homodimer (PDB 3czt). S100B_2 lacks 11 out of the 31 interface
residues, potentially explaining the loss of the interaction with S100B_1. Bottom left subpanel: Crystal structure of the interaction between the C-terminal domain
BAG_1 and HSPA8 (PDB 1hx1). The C-terminal domain of BAG_1, responsible for the interaction with HSPA8, is missing from BAG_2. Bottom right subpanel:
Crystal structure of the GNMT homodimer (PDB 1r74). Although 19 residues are absent in the GNMT_3 isoform, these do not affect the dimerization interface, and
the interaction is maintained. GNMT_4 is missing half of the protein, including 8 interface residues, which may explain the loss of the interaction.
Cell 164, 805–817, February 11, 2016 ª2016 Elsevier Inc. S5
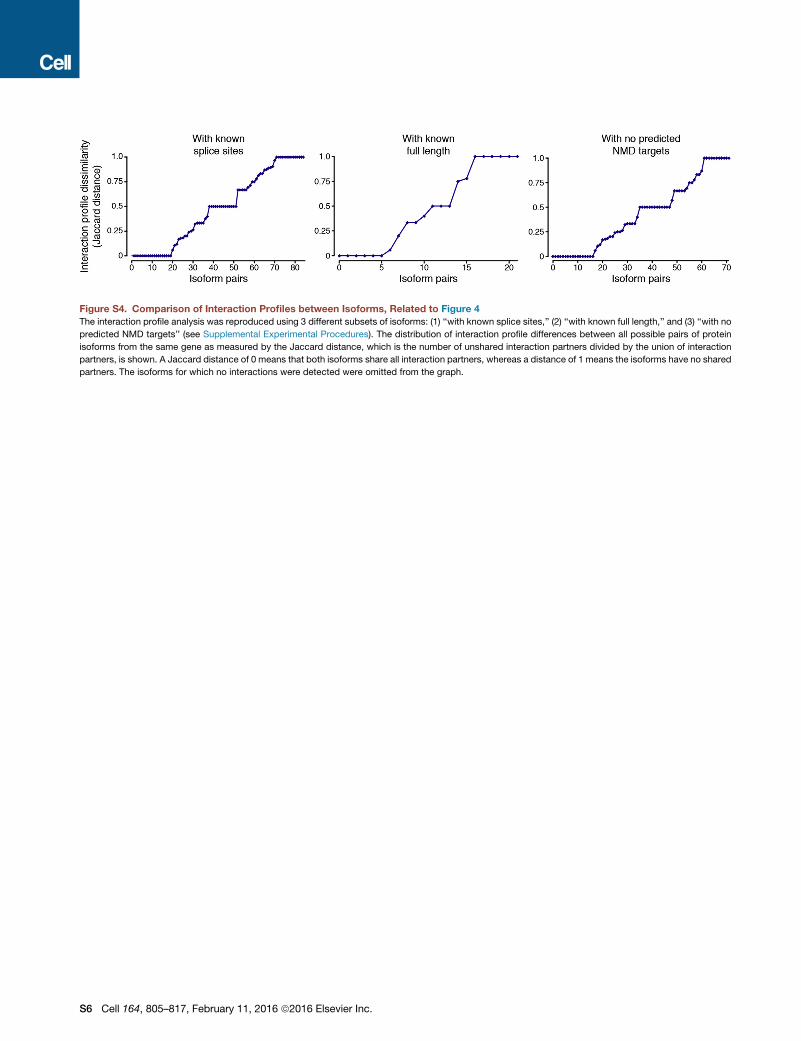
Figure S4. Comparison of Interaction Profiles between Isoforms, Related to Figure 4The interaction profile analysis was reproduced using 3 different subsets of isoforms: (1) ‘‘with known splice sites,’’ (2) ‘‘with known full length,’’ and (3) ‘‘with no
predicted NMD targets’’ (see Supplemental Experimental Procedures). The distribution of interaction profile differences between all possible pairs of protein
isoforms from the same gene as measured by the Jaccard distance, which is the number of unshared interaction partners divided by the union of interaction
partners, is shown. A Jaccard distance of 0 means that both isoforms share all interaction partners, whereas a distance of 1 means the isoforms have no shared
partners. The isoforms for which no interactions were detected were omitted from the graph.
S6 Cell 164, 805–817, February 11, 2016 ª2016 Elsevier Inc.
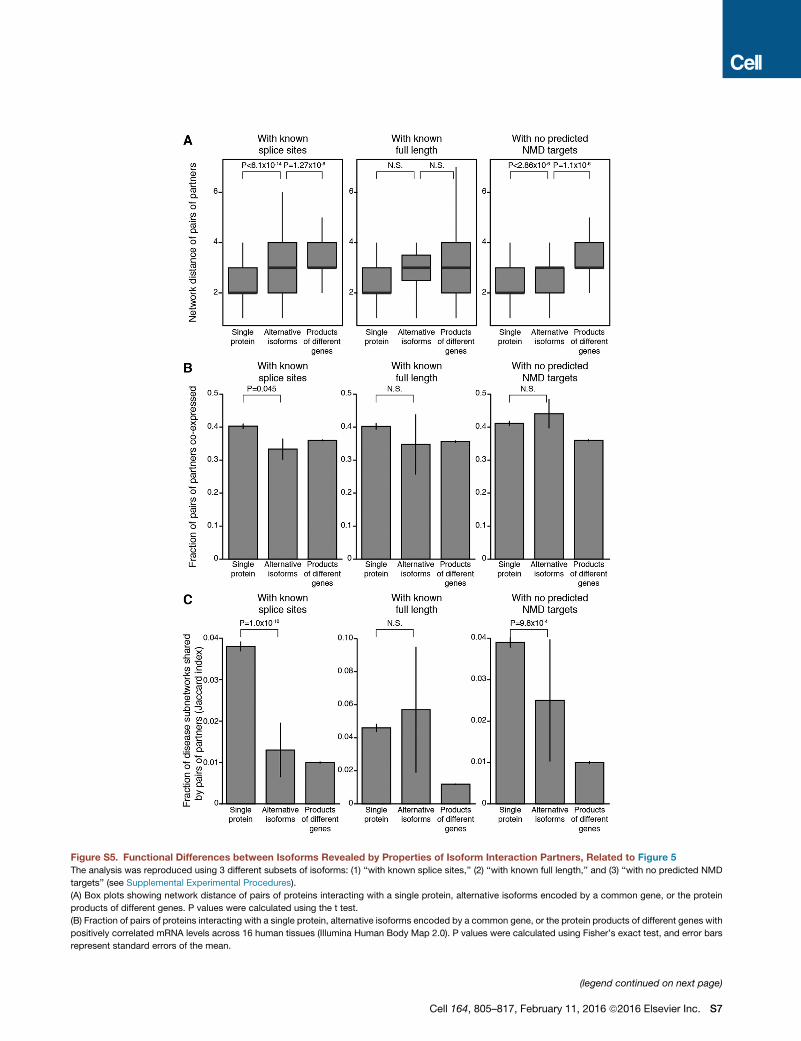
Figure S5. Functional Differences between Isoforms Revealed by Properties of Isoform Interaction Partners, Related to Figure 5
The analysis was reproduced using 3 different subsets of isoforms: (1) ‘‘with known splice sites,’’ (2) ‘‘with known full length,’’ and (3) ‘‘with no predicted NMD
targets’’ (see Supplemental Experimental Procedures).
(A) Box plots showing network distance of pairs of proteins interacting with a single protein, alternative isoforms encoded by a common gene, or the protein
products of different genes. P values were calculated using the t test.
(B) Fraction of pairs of proteins interacting with a single protein, alternative isoforms encoded by a common gene, or the protein products of different genes with
positively correlated mRNA levels across 16 human tissues (Illumina Human Body Map 2.0). P values were calculated using Fisher’s exact test, and error bars
represent standard errors of the mean.
(legend continued on next page)
Cell 164, 805–817, February 11, 2016 ª2016 Elsevier Inc. S7

(C) Mean Jaccard index of disease subnetwork co-occurrence of pairs of proteins interacting with a single protein, alternative isoforms encoded by a common
gene, or the protein products of different genes. Disease subnetworks are defined for each disease as the set of disease-associated genes from GeneCards
(Safran et al., 2010) and their first neighbors in the human interactome, HI-II-14 (Rolland et al., 2014). The Jaccard index is defined as the number of shared
occurrences over the union. P values were calculated using Wilcoxon rank sum test, and error bars represent standard errors of the mean.
S8 Cell 164, 805–817, February 11, 2016 ª2016 Elsevier Inc.
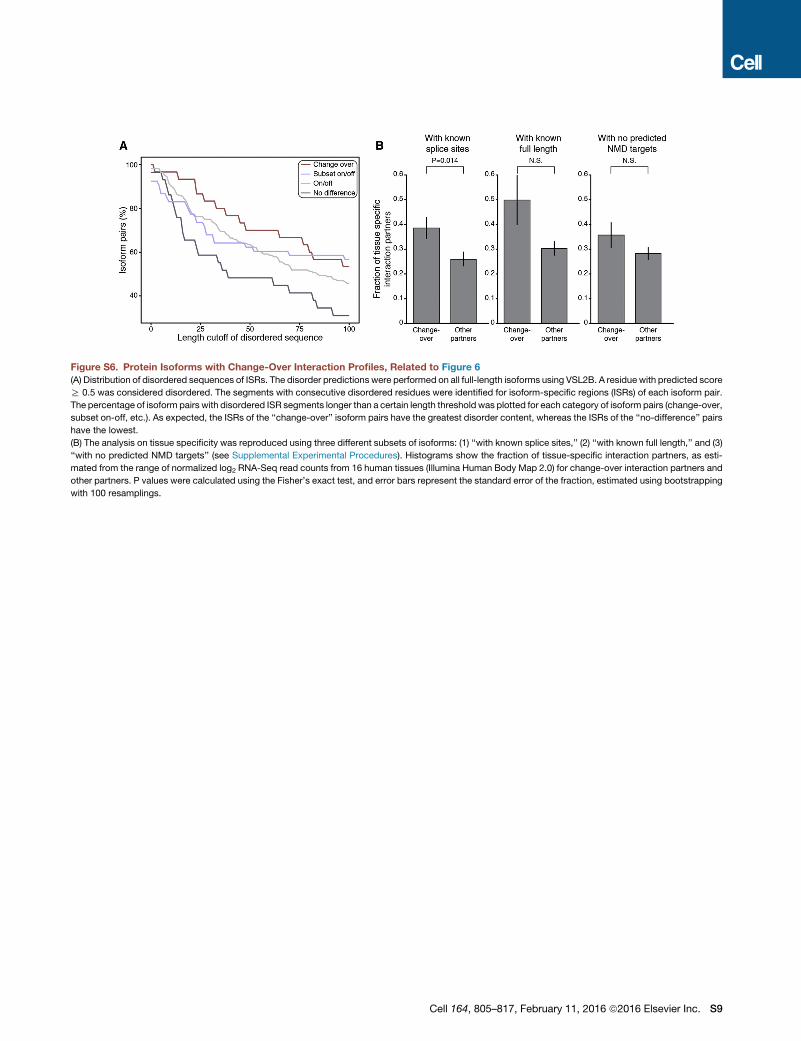
Figure S6. Protein Isoforms with Change-Over Interaction Profiles, Related to Figure 6
(A) Distribution of disordered sequences of ISRs. The disorder predictions were performed on all full-length isoforms using VSL2B. A residue with predicted score
R 0.5 was considered disordered. The segments with consecutive disordered residues were identified for isoform-specific regions (ISRs) of each isoform pair.
The percentage of isoform pairs with disordered ISR segments longer than a certain length threshold was plotted for each category of isoform pairs (change-over,
subset on-off, etc.). As expected, the ISRs of the ‘‘change-over’’ isoform pairs have the greatest disorder content, whereas the ISRs of the ‘‘no-difference’’ pairs
have the lowest.
(B) The analysis on tissue specificity was reproduced using three different subsets of isoforms: (1) ‘‘with known splice sites,’’ (2) ‘‘with known full length,’’ and (3)
‘‘with no predicted NMD targets’’ (see Supplemental Experimental Procedures). Histograms show the fraction of tissue-specific interaction partners, as esti-
mated from the range of normalized log2 RNA-Seq read counts from 16 human tissues (Illumina Human Body Map 2.0) for change-over interaction partners and
other partners. P values were calculated using the Fisher’s exact test, and error bars represent the standard error of the fraction, estimated using bootstrapping
with 100 resamplings.
Cell 164, 805–817, February 11, 2016 ª2016 Elsevier Inc. S9
Cell, Volume 164
Supplemental Information
Widespread Expansion of Protein Interaction
Capabilities by Alternative Splicing
Xinping Yang, Jasmin Coulombe-Huntington, Shuli Kang, Gloria M. Sheynkman, TongHao, Aaron Richardson, Song Sun, Fan Yang, Yun A. Shen, Ryan R. Murray, KerstinSpirohn, Bridget E. Begg, Miquel Duran-Frigola, Andrew MacWilliams, Samuel J.Pevzner, Quan Zhong, Shelly A. Trigg, Stanley Tam, Lila Ghamsari, Nidhi Sahni, SongYi, Maria D. Rodriguez, Dawit Balcha, Guihong Tan, Michael Costanzo, BrendaAndrews, Charles Boone, Xianghong J. Zhou, Kourosh Salehi-Ashtiani, BenoitCharloteaux, Alyce A. Chen, Michael A. Calderwood, Patrick Aloy, Frederick P.Roth, David E. Hill, Lilia M. Iakoucheva, Yu Xia, and Marc Vidal
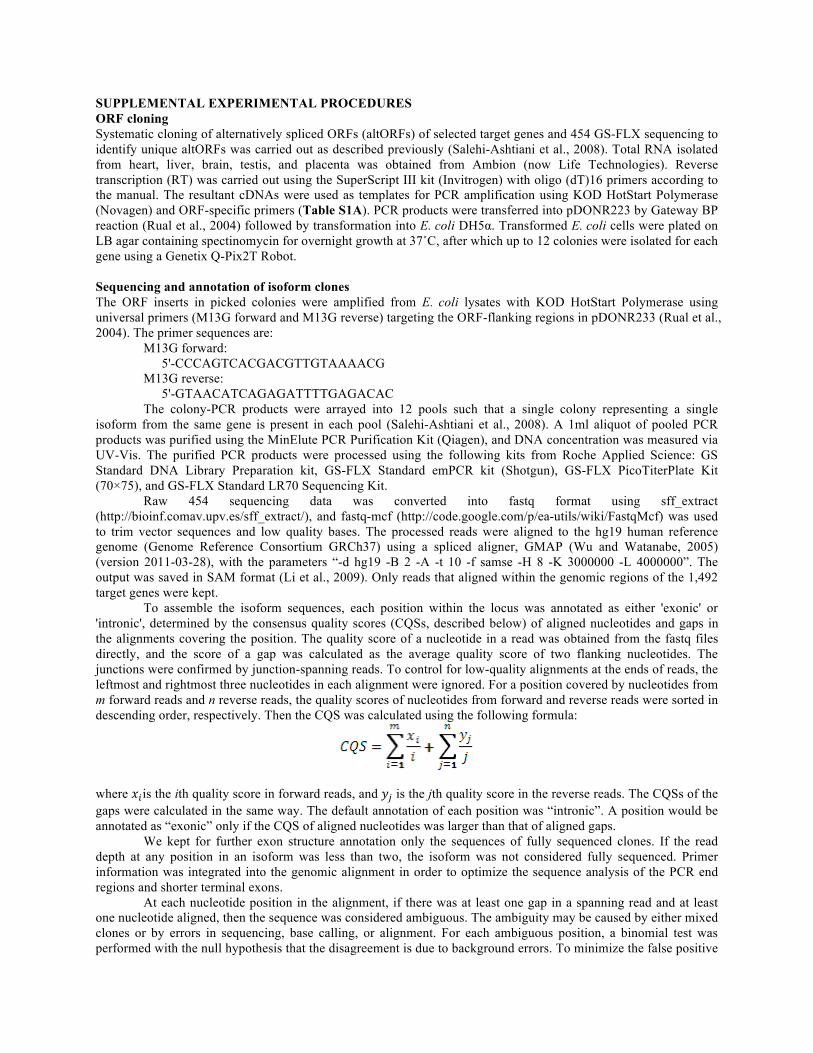
SUPPLEMENTAL EXPERIMENTAL PROCEDURES ORF cloning Systematic cloning of alternatively spliced ORFs (altORFs) of selected target genes and 454 GS-FLX sequencing to identify unique altORFs was carried out as described previously (Salehi-Ashtiani et al., 2008). Total RNA isolated from heart, liver, brain, testis, and placenta was obtained from Ambion (now Life Technologies). Reverse transcription (RT) was carried out using the SuperScript III kit (Invitrogen) with oligo (dT)16 primers according to the manual. The resultant cDNAs were used as templates for PCR amplification using KOD HotStart Polymerase (Novagen) and ORF-specific primers (Table S1A). PCR products were transferred into pDONR223 by Gateway BP reaction (Rual et al., 2004) followed by transformation into E. coli DH5α. Transformed E. coli cells were plated on LB agar containing spectinomycin for overnight growth at 37˚C, after which up to 12 colonies were isolated for each gene using a Genetix Q-Pix2T Robot. Sequencing and annotation of isoform clones The ORF inserts in picked colonies were amplified from E. coli lysates with KOD HotStart Polymerase using universal primers (M13G forward and M13G reverse) targeting the ORF-flanking regions in pDONR233 (Rual et al., 2004). The primer sequences are:
M13G forward: 5'-CCCAGTCACGACGTTGTAAAACG M13G reverse: 5'-GTAACATCAGAGATTTTGAGACAC The colony-PCR products were arrayed into 12 pools such that a single colony representing a single
isoform from the same gene is present in each pool (Salehi-Ashtiani et al., 2008). A 1ml aliquot of pooled PCR products was purified using the MinElute PCR Purification Kit (Qiagen), and DNA concentration was measured via UV-Vis. The purified PCR products were processed using the following kits from Roche Applied Science: GS Standard DNA Library Preparation kit, GS-FLX Standard emPCR kit (Shotgun), GS-FLX PicoTiterPlate Kit (70×75), and GS-FLX Standard LR70 Sequencing Kit.
Raw 454 sequencing data was converted into fastq format using sff_extract (http://bioinf.comav.upv.es/sff_extract/), and fastq-mcf (http://code.google.com/p/ea-utils/wiki/FastqMcf) was used to trim vector sequences and low quality bases. The processed reads were aligned to the hg19 human reference genome (Genome Reference Consortium GRCh37) using a spliced aligner, GMAP (Wu and Watanabe, 2005) (version 2011-03-28), with the parameters “-d hg19 -B 2 -A -t 10 -f samse -H 8 -K 3000000 -L 4000000”. The output was saved in SAM format (Li et al., 2009). Only reads that aligned within the genomic regions of the 1,492 target genes were kept.
To assemble the isoform sequences, each position within the locus was annotated as either 'exonic' or 'intronic', determined by the consensus quality scores (CQSs, described below) of aligned nucleotides and gaps in the alignments covering the position. The quality score of a nucleotide in a read was obtained from the fastq files directly, and the score of a gap was calculated as the average quality score of two flanking nucleotides. The junctions were confirmed by junction-spanning reads. To control for low-quality alignments at the ends of reads, the leftmost and rightmost three nucleotides in each alignment were ignored. For a position covered by nucleotides from m forward reads and n reverse reads, the quality scores of nucleotides from forward and reverse reads were sorted in descending order, respectively. Then the CQS was calculated using the following formula:
where 𝑥!is the ith quality score in forward reads, and 𝑦! is the jth quality score in the reverse reads. The CQSs of the gaps were calculated in the same way. The default annotation of each position was “intronic”. A position would be annotated as “exonic” only if the CQS of aligned nucleotides was larger than that of aligned gaps.
We kept for further exon structure annotation only the sequences of fully sequenced clones. If the read depth at any position in an isoform was less than two, the isoform was not considered fully sequenced. Primer information was integrated into the genomic alignment in order to optimize the sequence analysis of the PCR end regions and shorter terminal exons.
At each nucleotide position in the alignment, if there was at least one gap in a spanning read and at least one nucleotide aligned, then the sequence was considered ambiguous. The ambiguity may be caused by either mixed clones or by errors in sequencing, base calling, or alignment. For each ambiguous position, a binomial test was performed with the null hypothesis that the disagreement is due to background errors. To minimize the false positive
rate in the identification of mixed clones, we assumed a high background error rate of 0.1 in sequencing, base calling or alignment. If the test result was significant (P < 0.05), the observed ambiguity could not be explained by background errors only. When the overall coverage (the total number of both aligned nucleotides and gaps) was low (< 5), the difference was always considered significant. If the results were significant for at least 30 continuous nucleotide positions, we concluded that the ambiguity was due to a mixture of isoforms and the corresponding “clone” was removed from further analysis.
Because the focus of the current work is to study PPIs influenced by splicing events rather than genomic variations such as SNPs or in-frame insertions/deletions, mismatches and short insertions or deletions of less than 30 nucleotides in the read alignments were not considered to be splicing events and were masked in our isoform exon structure annotations. Therefore, multiple clones could be considered the same isoform although the actual sequences at the nucleotide level may be slightly different due to genomic variations. In the case of multiple altORFs encoding the same isoform, only one clone was used for subsequent analysis.
All alternative ORFs with unique exon structures were Sanger-sequenced in both directions. Phred (Ewing et al., 1998) was used to extract sequences from the raw data. Reads with at least 50 nucleotides with non-zero quality scores were aligned using BLAST (bl2seq). Alignments of at least 50 nucleotides with more than 95% identity were integrated into the corresponding contigs of 454 reads by CAP3 (Huang and Madan, 1999) to generate the final consensus sequences.
All isoform structures were compared against the hORFeome and 7 public gene annotation databases: Aceview (2010 release), CCDS (downloaded Sept 2014), Gencode (version 7), hORFeome, MGC (downloaded Sept 2014), RefSeq (downloaded May 2011), and UCSC (downloaded Sept 2014) (Harrow et al., 2012; Karolchik et al., 2014; Pruitt et al., 2014; Pruitt et al., 2009; Temple et al., 2009; Thierry-Mieg and Thierry-Mieg, 2006; Yang et al., 2011). An isoform was considered known if, over its length, it had the exact same junctions as an annotated transcript in any database. Schematic diagrams of isoform exon-intron structures and ORF sequences are available at http://isoform.dfci.harvard.edu/.
RNA abundance For human brain, heart, liver, and testis, RNA-Seq files from the Illumina Body Map 2.0 project (GEO accession: GSE30611) were downloaded in fastq format. For placenta, RNA-Seq files were downloaded from the NCBI’s sequence read archive (SRA) http://www.ncbi.nlm.nih.gov/sra (ERR315336) and converted into fastq format. RefSeq annotated human transcript sequences were downloaded from www.ncbi.nlm.nih.gov/refseq in FASTA format and included ‘NM’ (protein coding) and ‘NR’ (non-coding) transcript entries (date January 18th, 2012; 41,899 entries). In the present study RefSeq transcript sequences corresponding to genes for which there were multiple isoform clones (one reference ORF and one or more altORFs) were removed and replaced with the isoform clone sequences (reference ORF and altORF sequences), thus creating a customized transcript FASTA file containing only cloned reference ORFs and altORFs for RNA-Seq Expectation Maximization (RSEM) analysis (Li and Dewey, 2011). For each of the four adult tissues, the “rsem-calculate-expression” command was run using ~80 million 50 bp RNA-Seq reads and the modified RefSeq annotated transcript file for the input. For placenta, ~33 million, 101 bp RNA-Seq reads were used as the input. Isoform-level estimates of transcriptional abundance are reported as transcripts per million (TPM). For each gene, the major isoform was determined by identifying the most abundant isoform (i.e. isoform with the highest TPM) and the corresponding annotation (reference ORF or altORF). The 95% credibility interval (CI) for the TPM value of the major isoform was compared with the TPM values of all other isoforms of that same gene. The putative major isoform was denoted “the major isoform”, if the lower bound of the 95% CI was higher than the TPM of all other isoforms, or “the likely major isoform”, if there was overlap in the 95% CI with one or more minor isoforms. Binary interaction mapping and validation Y2H screening: Haploid S. cerevisiae strains Y8930 (MATα) and Y8800 (MATa) were used for Y2H as described previously (Dreze et al., 2010; Rolland et al., 2014). The altORFs were transferred from entry clones by Gateway LR reaction into pDEST-DB and subsequently introduced into Y8930 (MATα) as described previously (Dreze et al., 2010). The Human ORFeome v5.1 (hORFeome) collection used as prey in the Y2H assay against isoform baits was previously transferred into pDEST-AD-CYH2 and introduced into Y8800 (MATa) (Rolland et al., 2014).
Before Y2H screening, auto-activation of the Gal1-HIS3 reporter gene in each DB-X strain was detected by growing the DB-X strains on solid SC media lacking leucine and histidine and containing 1mM 3-amino-1,2,4-triazole (SC-Leu-His + 1mM 3AT) at 30°C for 3 days. During both the screening and pairwise testing steps, latent or de novo auto-activation by any DB-X was also identified by growing yeast cells on solid SC-Leu-His + 1mM 3AT + 1µg/ml cycloheximide agar plates as described (Dreze et al., 2010). Any diploid strains showing growth on
SC-Leu-His + 1mM 3AT + 1µg/ml cycloheximide were considered to carry DB-X auto-activators and were removed from consideration.
Individual DB-X yeast strains (haploid Y8930 (MATα) containing altORFs in the pDEST-DB vector) were screened against ~15,000 ORFs (from 13,000 genes) arrayed in mini-libraries containing 188 individual AD-Y strains (haploid Y8800 MATa yeast containing hORFs in the pDEST-AD-CYH2 vector). The DB-X strains were mated with AD-Y strains on YEPD plates overnight at 30°C and then replica plated onto solid SC media lacking leucine, tryptophan, and histidine and containing 1mM 3AT (SC-Leu-Trp-His + 1mM 3AT). Replica plates were incubated at 30°C for 3 days. Yeast colonies were picked into 96-well plates containing SC-Leu-Trp liquid medium and grown for 2 days at 30°C before being spotted onto SC-Leu-Trp agar plates. These plates were incubated for 2 days at 30°C and replica-plated onto (1) SC-Leu-Trp-His + 1mM 3AT to test the activity of the HIS3 reporter gene and (2) SC-Leu-His + 1µg/ml cycloheximide to identify de novo auto-activation of the HIS3 reporter gene by DB-X alone. Phenotypes were scored after 3 days of growth at 30°C. Colonies were picked into 96-well plates containing SC-Leu-Trp media and cultured at 30°C for 24 to 48 hours. Additional candidate PPIs for the reference ORFs were obtained from the HI-II-14 screen (Rolland et al., 2014).
For colonies growing on selective media plates containing SC-Leu-Trp-His + 1mM 3AT but not on plates containing SC-Leu-His + 1mM 3AT +1µg/ml cycloheximide, the DB-X and AD-Y were amplified using colony-PCR of DB-X and AD-Y followed by stitching-PCR to fuse BD-X and AD-Y through a linker region (Yu et al., 2011). Stitched DB-X and AD-Y PCR products arranged as “bait tail-linker-prey tail” were sequenced using the Roche 454FLX next-generation sequencing technology.
Yeast lysates and PCR were performed as described previously (Yu et al., 2011). Briefly, 5µl of yeast cultures were transferred from SC-Leu-Trp plates to 96-well PCR plates containing 20µl lysis buffer (2.5mg/ml Zymolyase 20T (Seikagaku Corporation) in 0.1M sodium phosphate buffer (pH7.4)). The plates were incubated for 1 to 2 hours at 37°C followed by 5 minutes at 95°C. Yeast lysates were then diluted to 100µl with ddH2O, from which 2µl was used as a template in a 30µl PCR reaction with HiFi Taq polymerase (Invitrogen). Two sets of PCR reactions were performed to separately amplify the DB-X and AD-Y ORFs. In order to “stitch” the DB-X and AD-Y colony-PCR products through a linker region, the DB primer was paired with a DB vector primer containing a DB-stitching linker tail, and the AD primer was paired with an AD vector primer containing sequence complementary to the DB stitching linker tail.
The primers used in primary colony-PCR were: DB primer:
5’-GGCTTCAGTGGAGACTGATATGCCTC DB-Stitching primer:
5’-CTCTCAGCTCGGCGGTATCCCCATCAAACCACTTTGTACAAGAAAGTTGG AD primer:
5’-CGCGTTTGGAATCACTACAGGG AD-Stitching primer:
5’-GGATACCGCCGAGCTGAGAGCCATCAAACCACTTTGTACAAGAAAGTTGG Equal volumes of yeast colony lysate-PCR products of DB-X and AD-Y were mixed and diluted 50 fold
from which 2µl was used as a template for stitching PCR with KOD HotStart polymerase (Novagen) using the DB primer and AD primer. The tails of ORF-X and ORF-Y were “stitched” through a linker of 82 bases.
Systematic pairwise testing: To obtain the dataset with the highest possible quality, the growth phenotype of all candidate Y2H interaction pairs from the primary screen was verified by pairwise testing (Dreze et al., 2010; Rual et al., 2005). Pairwise testing was carried out in a matrix format in order to: (1) decompose the gene-level interactions obtained from stitched ISTs into isoform level interactions; (2) systematically test all isoforms of the same gene against all possible interaction partners of any isoform so that interaction profiles of isoforms from the same gene are comparable; and (3) exclude possible growth events on selection media due to physiological adaption or genetic mutation of yeast cells during the screening. Pairwise Y2H tests were performed in triplicate for each gene to generate the complete isoform-interaction partner matrix (all isoforms against all interaction partners of any isoform of that gene), with isoform clones as DBs and hORFeome interaction partners as ADs. Diploid yeast that grew on SC-Leu-Trp-His +1mM 3AT plates but not on SC-Leu-His + 1mM 3AT +1µg/ml cycloheximide plates in at least two out of three colony growth tests were considered positive pairs. Positive pairs were tested a fourth time using the same mating and scoring method, and final positives were picked for colony-PCR followed by Sanger sequencing. Only Sanger sequencing-confirmed pairs were considered to be verified PPIs. Pairs with auto-activation, a no growth phenotype, or that failed sequencing were scored as “NA”. Schematic diagrams of isoform PPIs are available at: http://isoform.dfci.harvard.edu. Detection of protein isoform expression in yeast cells using Western blotting: Yeast cultures of 50ml were grown to mid-log phase and harvested by centrifugation when cultures reached an A600 of 1.0. Pellets were frozen, resuspended in 0.3ml RNP lysis buffer (0.1M HEPES pH 7.4, 100mM NaCl, 0.1% NP-40, 0.1mM PMSF, 1mg/ml each of leupeptin, pepstatin, and aproptinin) and lysed by vortexing at 30Hz for 5 minutes in the presence of 450-600µm acid-washed glass beads. Cell debris was pelleted by centrifugation, and cleared lysates collected into a fresh tube. Protein concentrations were determined by Bradford assay (BioRad 500-0006). Gel electrophoresis was performed by running 50µg total protein lysates on a NuPAGE 4-12% Bis-Tris Mini Gel (Life Technologies NP0323) and blotted overnight onto PVDF membrane (Life Technologies LC2005). Isoform Gal4-DB-fusion proteins were detected with anti-Gal4-DB antibody (Santa Cruz Biotechnology, SC-577). Anti-G6PDH antibody (Sigma #A9521) was used as a loading control. Protein complementation assay (PCA): A subset of positive pairs and negative pairs were selected for validation using PCA (Braun et al., 2009). The corresponding ORFs of the verified protein pairs to be tested were transferred by Gateway LR reaction (Invitrogen) into the pF1N and pF2C vectors, with proteins detected as bait and prey fused to the N-terminus of the F1 and C-terminus of the F2, respectively. After transformation into E. coli and selection of transformants in liquid terrific broth medium containing the appropriate antibiotic selection markers, plasmid DNA was extracted and purified using Qiagen 96 Turbo kits (Qiagen) on a BioRobot 8000 (Qiagen). The two plasmids carrying F1N-X and Y-F2C (where X = bait and Y = prey) were co-transfected into 293T cells using Lipofectamine 2000 (Invitrogen). 30,000 cells were initially seeded in each well of 96-well plates. Transfection was carried out the next day, and fluorescence of positive cells was detected using flow cytometry analysis on the third day.
The log2 of the p2 event (cells with YFP fluorescence) over p1 event (total cells gated) was the final raw reporter value for each protein pair. The threshold was set such that any pair scoring above that threshold is considered “positive”, and the complement of that set is considered “negative”. The recovery rate measured as positive pairs over tested pairs can be viewed as a function of the score threshold. Calculating Jaccard distances for pairs of isoform interaction profiles In order to quantify the distinctness of the interaction profiles of pairs of isoforms, we determined the Jaccard distance for any two isoforms encoded by a common gene. The Jaccard distance is defined as the fraction of unshared interaction partners over the union of all interaction partners. We considered only pairs of isoforms where both possess one or more interaction partners and we only considered interactions that were verified as either positive or negative for each of the two isoforms. Defining isoform-specific regions (ISRs) associated with interaction specific interactions For each isoform-specific interaction partner, we asked whether the capability of each isoform to interact with a partner correlates with the presence or absence of an ISR. To find isoform-specific regions (ISRs), we searched for contiguous sequence regions that were present in only one or a subset of isoforms by sliding a ten amino acid window across all isoforms encoded by a gene and determining to which set of isoforms the window matches perfectly. This identified both ISRs, defined as the widest merged window that maps uniquely to one or the same subset of isoforms, and constitutive regions, defined as sequences found in all isoforms of a gene. We filtered our dataset for all isoform-specific interactions where the interacting partner protein interacted with some but not all
isoforms of the same gene. For each of these isoform-specific interaction partners, we searched for cases in which the presence of an ISR (of at least 40 amino acid residues in length) in an isoform or subset of isoforms was perfectly correlated, either negatively or positively, with the protein interaction being examined.
For those genes where only two isoforms were interrogated, every isoform-specific interaction must necessarily be correlated with an ISR. Therefore, to assess whether an ISR occurs more frequently than expected by chance, we only examined genes with three or more isoforms (n = 266) where it is possible a priori to observe a perfect or imperfect correlation. In 61% of the cases analyzed, we found that isoform-specific interactions could be explained by a single ISR. This is significantly higher than expected by chance (52%) based on a control dataset assembled by randomly shuffling the isoform/partner protein interactions within each gene 10,000 times (1.2–fold, one-sided P = 6.0 x 10⁻⁴). This provides the first systematic experimental evidence for a statistically significant link between the presence of isoform-specific sequences and the ability to mediate particular PPIs.
If a region was perfectly positively correlated with the interaction, the region was deemed “interaction promoting”. If a region was perfectly negatively correlated with the interaction, the region was deemed “interaction inhibiting”. To determine whether isoform-specific interactions were more likely to be associated with a potential promoting or inhibiting region than expected by chance, for cases where a partner interacted with three or more isoforms from the same gene (ISGs), we compared the number of isoform-specific interactions that could be explained by an ISR in our dataset with a randomized control. For the control, the isoforms from the same gene were shuffled 10,000 times, and the number of isoform-specific interactions that was perfectly correlated to an ISR was calculated for each shuffling to create an expected distribution from which the p value was calculated. Identification of linear-motif binding domains (LMBDs) and linear motifs We scanned ISRs for linear motifs from the ELM database, excluding matches shorter than 4 amino acid residues or found at very high frequency (>5% of all identified motifs) (Dinkel et al., 2012). When counting motifs in a region, only matches to linear motifs of different linear-motif binding domains (LMBDs) were allowed to overlap. For each interaction partner in our dataset, we determined the linear motif density in the longest ISR associated with that partner. Each distinct ISR was considered only once, regardless of the number of partner associations, and ISRs that were both promoting and inhibiting with different partners were assigned to both categories.
To quantify the enrichment of LMBDs in isoform-specific interaction partners, Pfam-A domains (Finn et al., 2014) were mapped to all interaction partners using HMMER 3.0 (e-value=10-2) (Finn et al., 2011), and each partner was classified as either containing an LMBD, as annotated in the ELM (Dinkel et al., 2012) or DILIMOT (Neduva and Russell, 2006) databases, or not. Interaction partners were then assigned either as exhibiting isoform-specific interactions associated with a promoting ISR or not. Identification of splice-mediated disruption of potential domain-domain interactions (DDIs) Pfam-A domains (Finn et al., 2014) were mapped to all isoforms and interaction partners using Hmmer 3.0 (e-value = 10-5) (Finn et al., 2011), and isoform-partner pairs encoding a predicted DDI from iPfam (Finn et al., 2005), 3Did (Mosca et al., 2014), or Domine (Yellaboina et al., 2011) were identified. We searched our dataset for isoform-partner pairs containing a predicted DDI and, where possible, determined how often that interaction was lost upon disruption of the domain in another isoform of the same gene. As a control, we started with the same isoform-partner pairs and determined how often an interaction was lost when another isoform of the same gene was shorter by at least 50 amino acids, thus controlling for the observation that shorter isoforms tended to participate in fewer interactions in this dataset. Structural analysis of isoform-specific interactions To obtain structural information for the unveiled interactions, we mapped Entrez Gene IDs to Uniprot accession numbers using the Uniprot ID mapping tool. Protein-protein interactions were submitted to Interactome3D (May 2015) (Mosca et al., 2013). When more than one structure was provided, we selected that with a ‘rank major’ of 1, i.e. we maximized the sequence coverage and prioritized experimental structures.
To map unique interactions between proteins of two genes (i.e. without considering different isoforms) onto three-dimensional structures, we defined the interaction interface as the set of residues that had a heavy atom at a distance < 6 Å from the binding partner for each binary complex. To map isoform sequences onto structures, we performed a local pairwise alignment between the structure sequence and the corresponding isoform and identified the interface residues. Interactome network analysis of isoform interaction partners.
To compare the features of two isoforms from the same gene, we did pairwise comparison of isoform interaction partners for their network distance, co-expression, and disease subnetwork association. Starting with all partner proteins interacting with one or more isoforms, we identified pairs of partners belonging to the following three groups (Figure 5A): i) “single protein”, in which the two partner proteins interact with the same protein isoform; ii) “alternative isoforms”, in which each partner protein of the pair interacts with one or more isoforms of the same gene with which the other protein does not; and iii) “products of different genes”, in which two partner proteins do not interact with any isoforms encoded by the same gene (control). Some pairs of proteins interacting with multiple isoforms from one or more genes may appear in both categories (i) and (ii).
The mean shortest path distance in HI-II-14 (Rolland et al., 2014) between any two proteins that interact with the same single protein, interact with alternative isoforms, or interact with proteins encoded by separate genes was calculated. Paths traversing proteins derived from the same gene as the isoforms were ignored; protein pairs with no connecting path were also ignored.
Using all 75-base-pair runs from the Illumina Body Map 2.0 16-tissue RNA-Seq dataset (Illumina BodyMap 2.0), which we retrieved from the NCBI's Sequence Read Archive (http://www.ncbi.nlm.nih.gov/Traces/sra, study: ERP000546, runs:ERR030888-ERR030903), and the Bowtie alignment tool (Langmead and Salzberg, 2012) with default settings, we mapped reads to all hORFeome clone sequences and calculated the log2 read count for each gene for each tissue. We then normalized expression values for each gene to that of the upper-quartile most highly expressed gene for each tissue, as described by Bullard and colleagues (Bullard et al., 2010), and calculated the Pearson correlation on all pairs of interaction partners after filtering out genes with a maximal expression below 1/32nd of the upper-quartile gene expression, -5 in normalized log2 space. The fraction of pairs co-expressed (i.e. having a positive Pearson correlation coefficient greater than 0.15) was calculated for each of the three groups of pairwise proteins described above.
Disease subnetworks were created for each disease by mapping the set of disease associated genes from GeneCards (Safran et al., 2010) onto an independently-mapped human interactome (Rolland et al., 2014) and retrieving the disease genes and their first degree PPI neighbors. Genes having an isoform screened in this study were omitted from the subnetworks. The mean of the Jaccard index of disease subnetwork co-occurrence for all protein pairs within each class was then calculated.
Tissue-specificity of isoform interaction partners. To estimate the fraction of tissue-specific of interaction partners, we measured the range of normalized log2 expression levels in the Illumina Body Map 2.0 16-tissue RNA-Seq dataset (Illumina BodyMap 2.0) and considered genes with a range greater than 7 as tissue-specific. Using the range of expression levels ensures the analysis is sensitive to differences in a single tissue. We compared the tissue-specificity of partners affected by change-over interaction differences to other interaction partners. Yeast-based functional complementation assays. To further investigate the functionality of the isoforms with different protein interaction profiles, we exploited the yeast-based cross-species complementation assays to measure their ability to rescue phenotypic defects of a loss-of-function mutation in a cognate yeast gene. Among the 138 genes for which the isoforms have different protein interaction profiles, 8 genes showed yeast/human complementation relationships in a recent study (Kachroo et al., 2015). The reference ORFs, altORFs, and a GFP ORF were transferred into pHYCDest-LEU2 (CEN/ARS-based, ADH1 promoter, and LEU2 marker) by Gateway LR reactions followed by transformation into NEB5α competent E. coli cells (New England Biolabs) and selection for ampicillin resistance. After confirmation of ORF identity by Sanger sequencing, plasmids expressing the reference ORFs, altORFs, and GFP were further transformed into the corresponding yeast temperature sensitive (TS) mutants. For yeast TS mutants transformed with expression vectors, cells were grown to saturation in 96-well cell culture plates at room temperature. Each culture was then adjusted to an OD600 of 1.0 and serially diluted to 5-1, 5-2, 5-3, 5-4, and 5-5. These cultures (5µl of each) were then spotted on SC−LEU plates as appropriate to maintain the plasmid and incubated at either 24ºC, 36ºC, or 38ºC. Plates were imaged after two or three days depending on the growth. Results were interpreted by comparing the growth difference between the yeast strains expressing different protein isoforms and the corresponding control strain expressing the GFP gene. Two independent cultures were grown and assayed for each strain. Analysis recapitulated with known isoforms and non-NMD isoforms To control for the possibility that some of our cloned altORFs may not encode stable protein isoforms, we repeated the bioinformatic analyses related to enrichment of linear motifs, domain-domain disruptions, isoform partner network properties, and isoform partner tissue specificity with the following subsets of the isoforms: (1) isoforms for
which all splice-sites are represented in at least one of seven public gene annotation databases (Aceview, CCDS, Gencode, hORFeome, MGC, RefSeq, and UCSC), labeled “with known splice sites”, (2) isoforms which are represented in their full length in at least one of the seven databases, labeled “with known full length”, and (3) isoforms which are predicted not to undergo nonsense-mediated decay, labeled “with no predicted NMD targets”. Isoforms with a premature stop codon more than 55 nucleotides away from the last splicing junction are considered NMD targets. Disordered regions in ISRs. We have applied the VSL2 disorder predictor (Peng et al., 2006) to all four categories of isoform pair PPI profiles from Figure 6A. First, the disorder predictions were run on all full-length isoforms from these datasets. Second, the disordered fragments within isoform-specific regions (ISRs) of each isoform pair were analyzed using various lengths cutoffs. After filtering extremely short ISRs (<10 aa), the longest consecutive disordered region (VSL2 score ≥ 0.5) in the ISRs of each isoform pair has been identified. Finally, the percentage of isoform pairs with disordered ISRs longer than certain length threshold was plotted for each type of isoform pair.
SUPPLEMENTAL REFERENCES Bullard, J.H., Purdom, E., Hansen, K.D., and Dudoit, S. (2010). Evaluation of statistical methods for normalization and differential expression in mRNA-Seq experiments. BMC Bioinformatics 11, 94. Ewing, B., Hillier, L., Wendl, M.C., and Green, P. (1998). Base-calling of automated sequencer traces using phred. I. Accuracy assessment. Genome Res. 8, 175-185. Finn, R.D., Bateman, A., Clements, J., Coggill, P., Eberhardt, R.Y., Eddy, S.R., Heger, A., Hetherington, K., Holm, L., Mistry, J., et al. (2014). Pfam: the protein families database. Nucleic Acids Res. 42, D222-230. Finn, R.D., Clements, J., and Eddy, S.R. (2011). HMMER web server: interactive sequence similarity searching. Nucleic Acids Res. 39, W29-37. Harrow, J., Frankish, A., Gonzalez, J.M., Tapanari, E., Diekhans, M., Kokocinski, F., Aken, B.L., Barrell, D., Zadissa, A., Searle, S., et al. (2012). GENCODE: the reference human genome annotation for The ENCODE Project. Genome Res. 22, 1760-1774. Huang, X., and Madan, A. (1999). CAP3: A DNA sequence assembly program. Genome Res. 9, 868-877. Karolchik, D., Barber, G.P., Casper, J., Clawson, H., Cline, M.S., Diekhans, M., Dreszer, T.R., Fujita, P.A., Guruvadoo, L., Haeussler, M., et al. (2014). The UCSC Genome Browser database: 2014 update. Nucleic Acids Res. 42, D764-770. Langmead, B., and Salzberg, S.L. (2012). Fast gapped-read alignment with Bowtie 2. Nat. Methods 9, 357-359. Li, H., Handsaker, B., Wysoker, A., Fennell, T., Ruan, J., Homer, N., Marth, G., Abecasis, G., and Durbin, R. (2009). The Sequence Alignment/Map format and SAMtools. Bioinformatics 25, 2078-2079. Mosca, R., Ceol, A., and Aloy, P. (2013). Interactome3D: adding structural details to protein networks. Nat. Methods 10, 47-53. Mosca, R., Ceol, A., Stein, A., Olivella, R., and Aloy, P. (2014). 3did: a catalog of domain-based interactions of known three-dimensional structure. Nucleic Acids Res. 42, D374-379. Pruitt, K.D., Brown, G.R., Hiatt, S.M., Thibaud-Nissen, F., Astashyn, A., Ermolaeva, O., Farrell, C.M., Hart, J., Landrum, M.J., McGarvey, K.M., et al. (2014). RefSeq: an update on mammalian reference sequences. Nucleic Acids Res. 42, D756-763. Pruitt, K.D., Harrow, J., Harte, R.A., Wallin, C., Diekhans, M., Maglott, D.R., Searle, S., Farrell, C.M., Loveland, J.E., Ruef, B.J., et al. (2009). The consensus coding sequence (CCDS) project: Identifying a common protein-coding gene set for the human and mouse genomes. Genome Res. 19, 1316-1323. Thierry-Mieg, D., and Thierry-Mieg, J. (2006). AceView: a comprehensive cDNA-supported gene and transcripts annotation. Genome Biol 7 Suppl 1, S12 11-14. Wu, T.D., and Watanabe, C.K. (2005). GMAP: a genomic mapping and alignment program for mRNA and EST sequences. Bioinformatics 21, 1859-1875. Yang, X., Boehm, J.S., Salehi-Ashtiani, K., Hao, T., Shen, Y., Lubonja, R., Thomas, S.R., Alkan, O., Bhimdi, T., Green, T.M., et al. (2011). A public genome-scale lentiviral expression library of human ORFs. Nat. Methods 8, 659-661. Yellaboina, S., Tasneem, A., Zaykin, D.V., Raghavachari, B., and Jothi, R. (2011). DOMINE: a comprehensive collection of known and predicted domain-domain interactions. Nucleic Acids Res. 39, D730-735. Yu, H., Tardivo, L., Tam, S., Weiner, E., Gebreab, F., Fan, C., Svrzikapa, N., Hirozane-Kishikawa, T., Rietman, E., Yang, X., et al. (2011). Next-generation sequencing to generate interactome datasets. Nat. Methods 8, 478-480.