Embed Size (px)
Citation preview

WIDER Working Paper 2021/35
Constraints on the performance and competitiveness of Tanzania’s manufacturing exports
Roseline Misati and Kethi Ngoka*
February 2021
In partnership with

This publication results from Sustainable development solutions for Tanzania – strengthening research to achieve SDGs, a collaborative project between the UONGOZI Institute in Dar es Salaam, Tanzania, and UNU-WIDER in Helsinki, Finland, with a main research objective of informing the development and implementation of policies aiming for economic transformation and sustainable development in Tanzania and the East African region. With financial support provided by the Ministry for Foreign Affairs of Finland, the joint project launched in 2018 with key questions giving the partners a framework for collaboration and the research work to be undertaken. The project focuses on macroeconomic perspectives, domestic resource mobilization, extractives, industrialization, sustainable livelihoods, and gender as a cross-cutting issue. The project provides local stakeholders a platform for research and policy discussions on Tanzania and bridges these discussions to the regional and international development debate.
About UONGOZI Institute
‘Uongozi’ means leadership in Kiswahili, and inspiring and strengthening leadership is the core purpose of our organisation. UONGOZI Institute is dedicated to supporting African leaders to attain sustainable development for their nations and for Africa. This is done through the provision of high-quality executive education (leadership competencies), facilitation of policy dialogues, action-oriented research and technical assistance for public and private institutions.
UONGOZI Institute, 62 Msasani Road, Oyster Bay, PO Box 105753, Dar es Salaam, Tanzania.

* Central Bank of Kenya, Nairobi, Kenya; corresponding author: [email protected]
This study has been prepared within the project Sustainable development solutions for Tanzania – strengthening research to achieve SDGs, funded by the Ministry for Foreign Affairs of Finland.
Copyright © UNU-WIDER 2021
UNU-WIDER employs a fair use policy for reasonable reproduction of UNU-WIDER copyrighted content—such as the reproduction of a table or a figure, and/or text not exceeding 400 words—with due acknowledgement of the original source, without requiring explicit permission from the copyright holder.
Information and requests: [email protected]
ISSN 1798–7237 ISBN 978-92-9256-973-0
https://doi.org/10.35188/UNU-WIDER/2021/973-0
Typescript prepared by Gary Smith.
United Nations University World Institute for Development Economics Research provides economic analysis and policy advice with the aim of promoting sustainable and equitable development. The Institute began operations in 1985 in Helsinki, Finland, as the first research and training centre of the United Nations University. Today it is a unique blend of think tank, research institute, and UN agency—providing a range of services from policy advice to governments as well as freely available original research.
The Institute is funded through income from an endowment fund with additional contributions to its work programme from Finland, Sweden, and the United Kingdom as well as earmarked contributions for specific projects from a variety of donors.
Katajanokanlaituri 6 B, 00160 Helsinki, Finland
The views expressed in this paper are those of the author(s), and do not necessarily reflect the views of the Institute or the United Nations University, nor the programme/project donors.
Abstract: This study sought to examine the main constraints to manufacturing export competitiveness in Tanzania. Using panel data for the period 1997–2018, the study established that supply-side factors dominate demand-side factors in explaining manufacturing export competitiveness. Specifically, the results revealed that foreign direct investment and tariffs have a negative and significant effect on export competitiveness in Tanzania, while infrastructure, total investment, labour productivity, and high institutional quality enhance manufactured exports. The study also showed scope for quality upgrading through technology diffusion as well as deeper integration of Tanzania’s nascent global value chains by building on existing competencies and negotiating deep trade agreements to increase market reach. Accordingly, measures to increase investment in infrastructure, strengthen institutional frameworks, and further develop human capital can boost export competitiveness in Tanzania. In addition, export competitiveness can be enhanced through reduction of tariffs and incentives to use cheaper value-adding intermediate inputs.
Key words: competitiveness, manufactured exports, global value chains, Tanzania
JEL classification: C26, F14, L60
Acknowledgements: We are very grateful to UNU-WIDER and UONGOZI Institute for providing us with a grand opportunity to undertake this study and for overwhelmingly supporting us. We would also like to express our gratitude to all the participants during the conference held in February 2020 for providing us with very insightful comments. In a special way, we sincerely thank Professor Oliver Morrisey, Professor Joseph Semboja, Dr Josephat Kweka, and Dr Maureen Were, who invested a lot of time in this work and provided very useful input and exceptional support that greatly shaped the final version of this paper. Any inadvertent errors and omissions are entirely our own responsibility.

1
1 Introduction
Growth in international trade has been much faster than that of world output, driven by supportive policies, innovation, and changing business models that have brought down the cost of cross-border trade. In the recent past, however, this growth slowed down due to structural and cyclical factors, coupled with the long-lived impacts of the global recession that followed the 2007–08 global financial crisis. Trade elasticities as a share of world output declined to 0.9 per cent from 1.8 per cent in the pre-crisis period, affecting all product groups by different magnitudes (UNCTAD 2015). While the volume of world merchandise trade increased from 1.5 per cent in 2016 to 4.6 per cent in 2017, it is estimated to remain subdued at 2.6 per cent in 2019, down from 3 per cent in 2018. An emerging theme from these episodes of volatility and uncertainty over growth and trade prospects, especially for emerging and developing economies, is the need to rebuild resilience against shocks through diversifying exports of goods and enhancing competitiveness, especially of manufactures, which generate strong positive externalities to the economy.
Tanzania’s Development Vision 2025 seeks to achieve a diversified and semi-industrialized economy with a substantial industrial sector comparable to typical middle-income countries. The strategic interventions contained in the first and second Five Year Development Plans spanning the period 2011/12–2020/21 are geared towards transforming and aligning the country’s production and export structure with global demand and production patterns in order to increase per capita nominal income to US$3,000 by 2025, estimated at US$1,109 in 2019. The interventions entail shifting Tanzania’s production structure to high-value manufactured goods as well as integrating and deepening regional and global value chains (GVCs) to achieve annual real gross domestic product (GDP) growth rates of 8–10 per cent to deliver improved incomes and higher standards of living. The specific measures that have been deployed to date to drive the growth and competitiveness of manufactured exports encompass aspects of infrastructure, innovation, and technology.
Despite the strategic investments made, the share of manufacturing exports to total merchandise exports continued to remain relatively low at 25 per cent in 2016 and 2017. In addition, manufactured exports continued to be of low skill and technology intensity, and hence of limited value to the economy. Medium- and high-technology exports constituted only a small share of manufactured exports, averaging 15.1 per cent between 1997 and 2015, while integration into global and regional value chains that currently constitute a large share of international trade remains limited. As a result, Tanzania’s long-term growth aspirations, which are predicated on the performance and competitiveness of manufactured exports, may not be achieved.
Previous studies in Tanzania provided minimal details on the various dimensions of the manufacturing sector and have been largely qualitative. Moreover, the empirical studies omitted infrastructural and institutional variables (Epaphra 2016; Page 2016; Wangwe et al. 2014; Wondemu and Potts 2016). Kweka et al. (2019) provide a definition and measure of Tanzania’s manufacturing competitiveness, building on the work of Vignes and Smith (2005) and Wignaraja and Taylor (2003). The authors computed and provided the status of competitiveness in Tanzania based on the global competitiveness index (GCI), real exchange rate (RER), unit labour costs, and manufacturing exports competitiveness index. In the empirical analysis, the study focused on determinants of productivity growth in the manufacturing sector using labour productivity and employment measures, but did not empirically investigate the determinants of manufactured export competitiveness based on the four measures. This study therefore seeks to address some of the identified gaps in previous work by assessing the performance and competitiveness of

Tanzania’s manufacturing exports. We focus not only on growth, but also on different performance dimensions, such as technology intensity and participation in GVCs with a view to identifying policies that can unlock the potential of these sectors. We thus focus on the following objectives:
1 Examination of the performance of Tanzania’s manufacturing exports, focusing not only on growth but also on different performance dimensions such as sophistication, firm dynamics, and participation in GVCs.
2 Analysis of the performance of manufactured exports by product, using the harmonized system of goods classification, processing stage, and skill and technology intensity.
3 Identification of the main factors that have impeded the competitiveness of Tanzania’s manufactured exports.
In addressing the first two objectives, the study uses trend and descriptive analysis. This involves assessing the performance of manufacturing exports from different dimensions—that is, trade and industry classification—which gives one a holistic view. We utilize data compiled using the standard international trade classification (SITC) and focus on codes 5 and 6, which is chemicals and manufacturing products at the two-digit level, respectively. SITC codes 5 and 6 are broadly consistent with the industry classification of manufactures.1 In addition, the SITC data permits analysis of skill, technology, and capital intensities, and scale characteristics of manufactured exports. Given the relative importance of GVCs in international trade, we also focused on seven identified GVC sectors. These sectors are also a subset of the manufacturing industry. The study utilizes quantitative methods based on secondary data to tackle the third objective. Panel data methods are used to estimate the quantitative impact of impediments to export performance and competitiveness of Tanzania’s manufactured exports, focusing on export performance and the revealed comparative advantage (RCA) index as the measure of competitiveness while noting that there is no consensus in the literature on the measure of competitiveness and data availability challenges. The quantitative analysis utilizes the SITC and industry classified trade data.
2 Literature review
The theory of international trade has evolved over time, where the earlier schools of thought such as comparative advantage theory and the Heckscher–Ohlin theories assumed perfect competition and constant returns to scale. Modern theories, such as new trade theory (NTT), incorporate possibilities of market imperfections. According to comparative advantage theory, when trade is free, countries will specialize in the production of goods that they produce more efficiently. Similarly, Heckscher (1991) and Ohlin (1933) pointed out differences in factor endowments as a major source of comparative advantage. For instance, capital-abundant countries are net exporters of capital-intensive goods (Asad 1994; Athanasoglou and Bardaka 2010; Ehnts and Trautwein 2012; Neary 2009; Sikander 1999).
The gravity model assumes perfect competition or monopolistic markets structures, where trade flows between two countries are related positively to their incomes and negatively to the distance between them (Hassan 2017; Tinbergen 1962). Modifications to this model include addition of
1 Comprising basic metals, chemicals, refined petroleum products, electrical machinery, fabricated metal products, food, furniture, machinery, medical precision and optical equipment, motor vehicles, office computing equipment, paper, radio, TV communication, rubber and plastics, textiles, tobacco, apparel, wood and wood products.

3
dummy variables to capture common language and common borders, as well as the existence of trade agreements between the two countries (Karamuriro 2015; Mdanat et al. 2018; Mohammad 2010; Muhammad and Xin 2017). Entrenched in micro-foundations, imperfect substitution theory assumes that neither imports nor exports are perfect substitutes for domestic goods. In this case, the export demand function can be derived as the outcome of foreign households’ utility maximization subject to budget constraints. Export demand is a function of world demand, RER, and production capacity (Athanasoglou and Bardaka 2010; Belayneh and Wondaferahu 2013; Jongwanich 2007; Martina et al. 2015).
NTT is founded on imperfect competition and increasing returns to scale, whereby product differentiation in open economies is the most important source of trade between countries with similar economies. Product differentiation reflects past investment in physical, human, and knowledge capital or technical improvements. Trade patterns are outcomes of profitable specialization in a cost structure independent of the country’s attributes such as technology and endowments that are assumed as given in the old trade theory (Asad 1994; Athanasoglou and Bardaka 2010; Ehnts and Trautwein 2012; Neary 2009). Critics of the NTT, notably Asad (1994), contend that this theory implies an activist role for government in trade policies, thereby threatening to undermine the case for trade liberalization. In this case, the NTT is likely to lead to a possibility of foreign retaliation, inefficient government intervention, moral hazard, and capture of trade policy by special interests.
A relatively newer paradigm of international trade is GVCs. Although a comprehensive theoretical framework is yet to be fully developed, GVCs now constitute a large share of international trade. GVCs are characterized by fragmentation of production across countries, specialization by countries with regard to tasks and functions, and networks between suppliers and buyers (De Backer and Miroudot 2013). Due to the specialization and the organized production processes, similarities have been observed between GVCs and the traditional determinants of the comparative advantage theories. Technology transfer and productivity improvements tend to be more intense within a GVC framework (Amador and Cabral 2016; Taglioni and Winkler 2016). This is attributed to the fact that goods produced are typically intended for international markets and entail close networks between buyers and suppliers since they embody requirements for customization. Improvements in export efficiencies coupled with enhanced GVCs promote a country’s export competitiveness.
Trade policy reform and elimination of non-tariff barriers helps in shaping GVCs. In particular, increasing the depth of preferential trade agreements (PTAs) has been shown to have a positive impact on GVCs. Laget et al. (2018) found that deep agreements double trade in parts and components and increase re-exported value-added. Deep agreements internalize cross-border policy spillovers that arise from the unbundling of production processes and embody deeper commitment on behalf of the parties involved to address coordination externalities that may arise from heterogeneous regulations. Deep agreements mainly comprise market access, investment, competition policy, and harmonization of product regulations.
Agbor and Taiwo (2014) provide an assessment of export competitiveness from an exchange rate perspective. Large current account deficits are associated with exchange rate appreciation, which in turn hampers the development of tradables, including manufactured exports. However, critiques of this theory contend that it is not applicable to African countries for two reasons. First, African countries mainly export primary products whose demand is not sensitive to the producer’s exchange rate or to the domestic cost of production, but to world market prices. Second, changes in the RER in small open economies hardly reflect the state of the country’s competitiveness due to their vulnerability to external shocks.

On the empirical front, Martina et al. (2015) analysed export competitiveness of total manufacturing and high-technology manufacturing industries for 27 European Union (EU) countries. The study revealed that a stable macroeconomic environment, production capacity, and domestic demand are essential for better export performance and competitiveness. Nebojsa et al. (2012) also explored the competitiveness of manufacturing industries from Croatia and Slovenia in the EU-15 market. Their study revealed that the quality of exports and labour costs were the main determinants of EU-15 market share in the two countries.
Elhiraika and Mbata (2014) focused on Africa to show that per capita income, infrastructure, human capital, institutional framework, and public investment are the key determinants of export diversification, while Agbor and Taiwo (2014) indicated that the CFA Franc Zone economies are not necessarily less competitive than sub-Saharan countries, as the exchange rate framework suggests. Based on panel data used to analyse disaggregated manufacturing exports, Bogale (2017) concluded that depreciation of the real effective exchange rate improves all types of manufacturing exports in the East Africa region.
Previous studies specific to Tanzania include that of Wondemu and Potts (2016), who analysed the impact of RER changes on export performance in Tanzania and Ethiopia. The analysis from this study showed that while overvaluation is harmful to exports, undervaluation boosts export supply as well as export diversification. Wangwe et al. (2014) conducted a survey on the evolution of the manufacturing sector in Tanzania and categorized the main constraints to industrial growth into five types: technical, financial, administrative, market, and policy challenges.
Page (2016) descriptively analysed performance, prospects, and public policy of industrial development in Tanzania, mainly focusing on special economic zones, micro-, small-, and medium-sized firms, and trade logistics. The analysis revealed a need to strengthen Tanzania’s infrastructure and institutional frameworks to levels that can attract investors to its special economic zones; adopt a more selective approach in strengthening the small and medium enterprises sector, and enhance efforts in improving the efficiency of the port of Dar es Salaam.
Epaphra (2016) examined the determinants of export performance in Tanzania during the period 1966–2015. Real GDP, trade liberalization, and exchange rate were found to positively affect export performance, while official development assistance and inflation negatively affect export performance in Tanzania. The study, however, omitted important factors such as institutional variables and infrastructure that have been identified as constraints to export performance in Tanzania and other sub-Saharan African countries.
3 Characteristics of Tanzania’s manufacturing sector exports
This section reviews the characteristics of Tanzania’s manufactured exports with regard to composition, technology and skill intensity, and GVC participation. The analysis shows that prior to 2018, the composition of manufactured exports was dominated by basic metal industries. The share of fabricated metal products increased to 35.9 between 2002 and 2018, as shown in Figure 1. The share of non-metallic minerals, food and beverages, and chemicals also increased from 2.7, 11.3, and 3.5 per cent in 2009 to 5.2, 12.9, and 14.5 per cent, respectively, in 2018. These trends are indicative of transition in the manufactured export structure towards high-value goods.

5
Figure 1: Composition of manufactured exports
Source: authors’ construction based on World Integrated Trade Solution, World Bank.
3.1 Manufactured exports technology intensity
In the mid-1990s Tanzania’s manufacturing exports comprised mainly primary products, which accounted for 79.9 per cent in 1997 (Figure 2). Notably, the shares of low-technology manufactures (other) and medium-technology manufactures (engineering) were 13.5 per cent and 5.3 per cent, respectively, in 2018, up from less than 1 per cent in 1997.2 While there is some slight technological deepening, technology-intensive manufactures remain at a very low level. The recent dynamics show scope for making inroads into technology-intensive manufactures, especially in the medium-technology category.
Figure 2: Technology intensity of manufactured exports in Tanzania
Source: authors’ construction based on data from UNCTADstat.
2 The technology-intensity analysis of Tanzania’s manufacturing exports is based on the Lall classification . The commodities are classified using the SITC Rev.3, and grouped according to skill, technology, and capital intensities and scale characteristics, as shown in Figure 2.
64.7
7.5
3.5
14.5 35.9
2.7
5.2 9.0
11.3
12.9
10.2
11.2
5.9
0 10 20 30 40 50 60 70 80 90 100
19982000200220042006200820102012201420162018
Basic Metal Industries Manufacture of ChemicalsManufacture of Fabricated Metal Products Manufacture of Non-Metallic MineralsManufacture of Paper and Paper Products Manufacture of Wood and Wood ProductsManufacture of Food, Beverages Other Manufacturing IndustriesTextile, Wearing Apparel and Leather
79.9
37.1 13.5 5.3
0% 10% 20% 30% 40% 50% 60% 70% 80% 90% 100%
199519971999200120032005200720092011201320152017
Primary products Resource-based manufactures: agro-based Resource-based manufactures: other Low technology manufactures: textile, garment and footwear Low technology manufactures: other products Medium technology manufactures: automotive

The share of labour- and resource-intensive manufactures also declined significantly between 1997 and 2018. On the other hand, low-skill technology-intensive manufactures and medium-skill technology-intensive manufactures increased (Figure 3).
Figure 3: Manufactures by skill intensity
Source: authors’ construction based on data from UNCTADstat.
3.2 Global value chains
An assessment of the performance of Tanzania’s manufactured exports according to seven GVC products that are important in driving GVCs shows that the main sector is final apparel and footwear, final textiles, and intermediate apparel and footwear. Exports of final apparel and footwear increased sharply from US$19.4 million in 2013 to US$63.7 million in 2018, as shown in Figure 4.
Figure 4: Gross exports, millions of US dollars
Source: authors’ construction based on World Integrated Trade Solution, World Bank.
Exports of intermediate apparel and footwear increased from US$14.2 million in 2014 to US$24.5 million in 2018. However, exports of final textiles, a key GVC sector, have remained volatile over the recent past. Global market shares between 2002 and 2018 for selected peer countries show marginal growth. Tanzania’s market share in final and intermediate apparel and footwear has improved, as shown in Table 1. Changes in global market shares are not always indicative of an increase in exports, but also depend on global developments.
0% 10% 20% 30% 40% 50% 60% 70% 80% 90% 100%
199519971999200120032005200720092011201320152017
Labour-intensive and resource-intensive manufactures Low-skill and technology-intensive manufactures
Medium-skill and technology-intensive manufactures High-skill and technology-intensive manufactures
19.4
63.7 44.5
14.2 24.5
0
50
100
2002
2003
2004
2005
2006
2007
2008
2009
2010
2011
2012
2013
2014
2015
2016
2017
2018
Final Apparel & Footwear Final ElectronicsFinal Textiles Final Vehicles (Pass+Comm)Intermediate Apparel & Footwear Intermediate VehiclesIntermediate Electronics

7
Table 1: Initial and final market shares for comparator countries
Country Initial and
final year
Final apparel
and f t
Final electronics
Final textiles
Final vehicles
Intermediate apparel and
footwear
Intermediate electronics
Intermediate vehicles
Ghana 2002 0.002 – – – – 0.001 – 2018 0.003 0.001 0.004 0.001 0.011 – 0.001 Kenya 2002 0.066 0.001 0.004 – 0.004 0.001 0.006 2018 0.081 0.002 0.018 0.005 0.002 0.002 0.002 Rwanda 2002 – – –
– – –
2018 0.001 – –
0.001 – – Tanzania 2002 0.001 – – – 0.005 – – 2018 0.011 – 0.031 0.001 0.023 – 0.001 Uganda 2002 0.001 – – – – – – 2018 0.001 – 0.002 – 0.001 – –
Source: authors’ construction based on World Integrated Trade Solution, World Bank.
Focusing on Tanzania’s GVC sectors where global market shares have grown, the analysis shows that the growth in the intermediate apparel and footwear sector reflects various new products compared with over a decade ago. In particular, Tanzania’s global market share of ‘other woven fabrics of polyester staple fibres’ in the GVC chains increased to 1.57 per cent in 2018 (Table 2). The main trading partner for this product is Zimbabwe. There are several dominant competitors in this sector, namely China, Turkey, India, Italy, and Vietnam.
Table 2: Intermediate apparel and footwear: top products by main partners and competitors
Source: authors’ construction based on World Integrated Trade Solution, World Bank.
The increase in Tanzania’s market shares for final textiles is reflected in textiles of cotton, manmade fibres, and other textiles. The main product markets include China and the USA. The African Growth and Opportunities Act (AGOA) of the USA that provides duty-free access has contributed to the growth in textiles. However, there appear to be buyer–supplier linkages with China that have contributed to increased market shares for Tanzania (Table 3). Nevertheless, Tanzania’s GVC participation remains limited despite the marginal increases in textiles, apparel, and footwear.
Products Tanzania’s global market shares
Partners Competitors
2002 2018
Other woven fabrics of polyester staple fibres
1.573 Zimbabwe (1.573) China, Japan
Plain weave
0.607 Kenya (0.605) China, Spain
Measuring less than 714.29 decitex
0.497 China (0.391), Kenya (0.106)
Dyed 0.063 0.363 Kenya (0.363)
Plain weave, weighing not more than 100 g/m2
0.255 Kenya (0.239) Italy, China
Unbleached or bleached
0.024 0.227 Kenya (0.227) China
Other fabrics
0.161 Mozambique (0.161) China, Italy
Bleached
0.157 Kenya (0.157) China, Turkey
Printed
0.102 France (0.088), Burundi (0.008) India, China
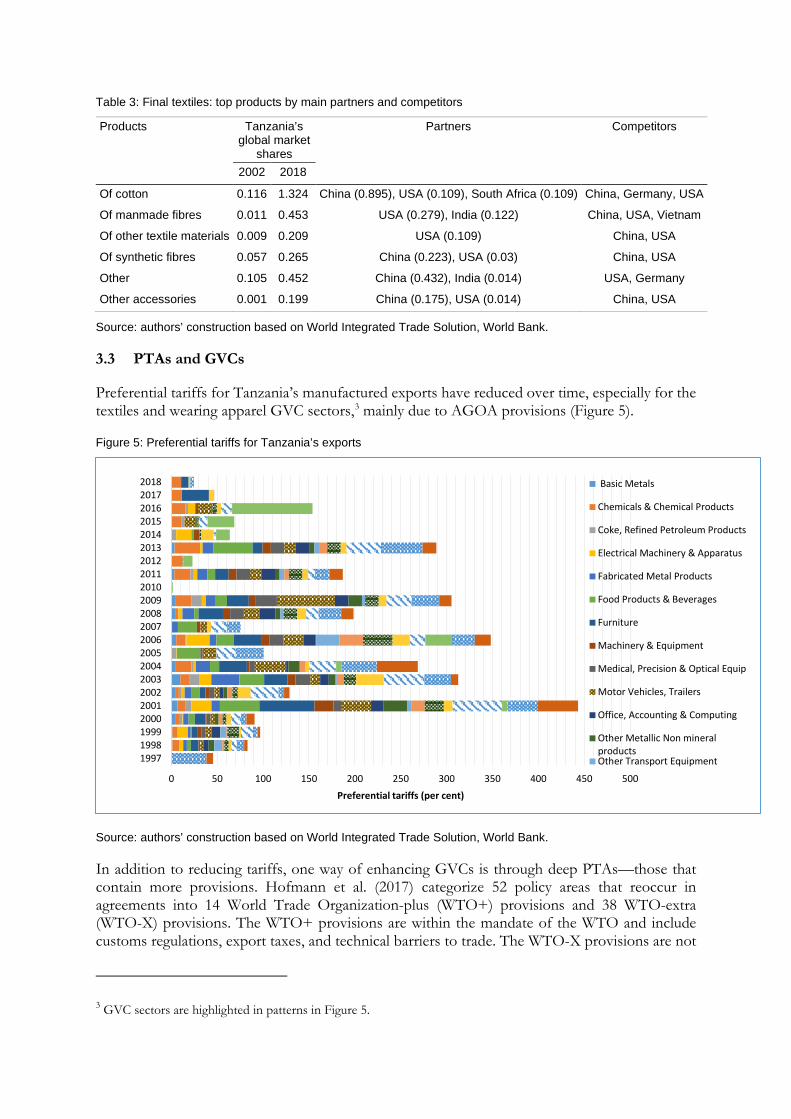
Table 3: Final textiles: top products by main partners and competitors
Products Tanzania’s global market
shares
Partners Competitors
2002 2018
Of cotton 0.116 1.324 China (0.895), USA (0.109), South Africa (0.109) China, Germany, USA
Of manmade fibres 0.011 0.453 USA (0.279), India (0.122) China, USA, Vietnam
Of other textile materials 0.009 0.209 USA (0.109) China, USA
Of synthetic fibres 0.057 0.265 China (0.223), USA (0.03) China, USA
Other 0.105 0.452 China (0.432), India (0.014) USA, Germany
Other accessories 0.001 0.199 China (0.175), USA (0.014) China, USA
Source: authors’ construction based on World Integrated Trade Solution, World Bank.
3.3 PTAs and GVCs
Preferential tariffs for Tanzania’s manufactured exports have reduced over time, especially for the textiles and wearing apparel GVC sectors,3 mainly due to AGOA provisions (Figure 5).
Figure 5: Preferential tariffs for Tanzania’s exports
Source: authors’ construction based on World Integrated Trade Solution, World Bank.
In addition to reducing tariffs, one way of enhancing GVCs is through deep PTAs—those that contain more provisions. Hofmann et al. (2017) categorize 52 policy areas that reoccur in agreements into 14 World Trade Organization-plus (WTO+) provisions and 38 WTO-extra (WTO-X) provisions. The WTO+ provisions are within the mandate of the WTO and include customs regulations, export taxes, and technical barriers to trade. The WTO-X provisions are not
3 GVC sectors are highlighted in patterns in Figure 5.
0 50 100 150 200 250 300 350 400 450 500
1997199819992000200120022003200420052006200720082009201020112012201320142015201620172018
Preferential tariffs (per cent)
Basic Metals
Chemicals & Chemical Products
Coke, Refined Petroleum Products
Electrical Machinery & Apparatus
Fabricated Metal Products
Food Products & Beverages
Furniture
Machinery & Equipment
Medical, Precision & Optical Equip
Motor Vehicles, Trailers
Office, Accounting & Computing
Other Metallic Non mineralproductsOther Transport Equipment

9
within the mandate of the WTO and embody broader policy areas, including market access, investment, competition policy, and harmonization of product regulations.
The number of PTAs covering WTO-X provisions are particularly relevant for the governance of GVCs and affect the decisions of firms to offshore or outsource certain tasks to a developing country. Tanzania’s PTAs are mainly with regional partners and focus on competition policy. In addition, the improvements observed in the number of agreements between 2005 and 2015 (Figure 6) are on account of new members assenting to join the existing blocs and not necessarily a reflection of Tanzania’s efforts to negotiate new trade agreements. In addition, agreements negotiated between developed nations (North–North) and between developed and developing nations (North–South) have been observed to have more provisions. On the other hand, South–South trade agreements (those between developing nations) have been identified as being shallow in content, with a focus on the traditional policy issues that may not be supportive of new dynamics in international trade.
Figure 6: Number of agreements: Tanzania
Note: EAC, East African Community; SADC, Southern African Development Community.
Source: authors’ construction based on the World Bank Deep Trade Agreements Database.
PTAs are an important device for ensuring commitment to creating a reliable business environment, especially in the context of manufacturing exports and GVCs. However, deep trade agreements also tend to restrict policy autonomy; hence, authorities need to find a balance during negotiations.
4 Theoretical framework, variable definition, and data sources
In this section, we describe the standard export competitiveness model and provide the theoretical framework underpinning the variables that affect export competitiveness, consistent with Tanzania’s characteristics and previous studies. We also describe the data sources as well as the justification of the estimation method. No consensus exists in the literature on the definition of competitiveness (Agbor and Taiwo 2014; Muratoglu and Muratoglu 2016; Villarreal and Ahumada 2015). Fagerberg (1988) defines competitiveness as the ability of a country to realize economic policy goals, especially growth in income and employment, without running into balance-of-payments difficulties. Fagerberg (1988) further developed a model of international competitiveness relating market share growth to the ability to compete in terms of price, technology, and capacity. Other authors have provided a consolidated view in the literature on competitiveness based on
0
2
4
6
8
10
12
14
16
18
20
SADC EAC SADC EAC
2005 2015
Num
ber o
f agr
eem
ents
movement of capital
investment
competition policy

firm level, industry level, and country level, while emphasizing the strong interlinkages. Modern trade theories allow for market imperfections and increasing returns to scale (Athanasoglou and Bardaka 2010; Ehnts and Trautwein 2012; Sikander 1999). However, no agreement exists in the literature concerning the role of demand factors, supply factors, and policy factors in export competitiveness (Babatunde 2018; Muhammad et al. 2006).4
In this study, we adopt the definition of competitiveness at a country level; in line with previous studies, we use export performance and the RCA values of manufacturing sector exports as dependent variables.5 Export performance is computed for manufactured exports and chemical exports classified using the SITC Rev.3 nomenclature at the two-digit level and total manufactured exports based on ISIC.6 Since the RCA is available for products at the three-digit level, we use 2018 export weights to aggregate to the two-digit level. The RCA index is defined as the share of Tanzania’s manufactured exports as a share of its total manufactured exports relative to the world manufactured exports as a share of global manufactured exports (Appendix B). This approach is used to compute the RCA index for total manufactured exports classified using the ISIC nomenclature. Trends of the RCA index and export performance show improvements in fabricated metal products, essential oils, textiles, and non-metallic mineral manufactures (Appendix C).
The specification of competitiveness equation is based on a hybrid model that combines both demand and supply factors and other factors that are relevant for developing countries. We thus include RER, foreign demand/income, foreign direct investment (FDI), imported intermediate inputs, tariffs, domestic demand, institutional quality, labour productivity, inflation, and mobile cellular phone subscriptions per 100 people as a proxy for infrastructure (Hassan 2017; Muhammad et al. 2006; Muratoglu and Muratoglu 2016; Olczyk and Kordalska 2017a; Villarreal and Ahumada 2015).
Foreign income measured by weighted average of the GDP of a sample of Tanzania’s foreign markets is included to capture external demand for Tanzania’s manufactured exports. A high level of foreign demand fosters international competitiveness in the manufacturing sector (Buturac et al. 2014). The exchange rate is defined as domestic currency per unit of foreign currency. The RER is defined as the nominal exchange rate multiplied by domestic price as a ratio of foreign price (Bose 2014). A depreciated RER attracts foreign demand and increases a country’s market share, which in turn leads to improvement in external positions (Esteves and Rua 2013). This implies a negative relationship a priori. However, the relationship can also be positive if the import content in manufactured exported goods is high and if the exchange rate is highly volatile.
4 The exchange rate and foreign income are the main demand factors, while examples of supply factors include domestic demand, labour productivity, and infrastructure. 5 We also considered the measuring export competitiveness index (MECI) and global competitiveness index (GCI) in the regression but the data is only available from 2007 and does not fit our data sample covering the period 1997–2018, placing a constraint on the degrees of freedom. Similarly, data constraints also prevented us from using unit labour costs as a measure of competitiveness. As pointed out by Kweka et al. (2019), unit labour costs measure cost competitiveness but the data available from the Annual Survey of Industrial Production and Census of Industrial Production conducted in Tanzania is from 2008–16 and 2013, respectively. However, we conducted correlation tests between GCI and RCA indices as well as export performance measures and provided the results in Appendix E. 6 Total manufactured exports include manufacture of metals, chemicals, wood, food, paper, basic metal industries, fabricated metal products, textiles, wearing apparel, leather and non-metallic minerals, and other manufactured exports, while key manufactured exports exclude food and beverages. Chemical exports comprise chemical products, dying, tanning, and coloring products, medicinal and pharmaceuticals manufactures, essential oils and perfumes, plastic in primary forms, and fertilizers.

11
Domestic demand measured by GDP growth is included to capture the impact of supply-side factors on export competitiveness. This is plausible under the assumption that foreign sales and domestic sales are substitutes, in which case domestic conditions can influence a firm’s willingness or ability to supply exports, implying a negative relationship between domestic demand and export competitiveness. In periods of slackened domestic demand, firms may try to compensate for the decline in domestic sales through increased effort to export and vice versa. At the same time, it can also increase it as some export entrepreneurs do not limit exports if they had made substantial prior investment in entering foreign markets (Boansi et al. 2014; Esteves and Rua 2013; Olczyk and Kordalska 2017a).
High tariffs of importing partners on manufacturing products obstructs export flows as they increase export costs (Araujo and Flaig 2017; Atif et al. 2019; Hassan 2017). Similarly, increased inflation tends to hamper the expansion of exports and to retard their diversification (Lovasy 1962).
Institutions form an important element of the general environment and influence competitiveness by shaping the incentives of economic actors. Weak institutions generally create uncertainty and distort longer-term investment decisions (Biggs 2007; Doan 2019; Stiglitz and Charlton 2006). This study uses an indicator that captures constraints on the executive. Constraints ensure that the country’s policy environment is investment-friendly and that there are no incentives to introduce changes that are risky to the business environment. They also reduce the probability of future changes to policy that are adverse to the institutional environment.
FDI augments domestic capital and facilitates transfer technology and access to new and large foreign markets. At the same time, FDI may lower or replace domestic savings and investment for indigenous exporting firms to the detriment of the host country’s export sector and inhibit the expansion of indigenous firms with exporting potential (Goh et al. 2013; Muratogolu and Muratoglu 2016; Nwanna 1986; Samantha and Haiyun 2018; Zhang 2015). The a-priori sign is thus ambiguous.
We also include imported intermediate inputs and GVC index as the two indicators measuring value addition. Imported intermediate inputs are included to capture the foreign value-added in exports. The literature identifies three channels through which imports or value addition may affect export activity. First, firm internalization is characterized by the existence of sunk costs, and some of them could be common between import and export activities. Second, importing new and more advanced goods relaxes some constraints on the production process, leading to improved firm productivity. Third, trade liberalization may promote the competitiveness of domestic firms through the reduction of input tariffs, leading to lower costs of imported inputs across all firms (Das and Gupta 2019; Turco and Maggioni 2012). The GVC participation index constitutes indirect value-added, domestic value-added, and foreign value-added. Similar to imported intermediate inputs, value addition is embedded in the concept of vertical trade chains. These entail a country specializing in particular stages of the production process, with two or more countries adding value in the production sequence (Olczyk and Kordalska 2017b). A priori, a positive sign is expected between intermediate inputs/GVC index and export competitiveness.
Various indicators have been used to measure infrastructure in previous work, including telephone subscriptions/lines, air transport, mobile cellular subscriptions, railway network, road length, energy/electricity production or access, and access to water resources (Dao 2008; Muratoglu and Muratoglu 2016; Prince 2019; Sahin et al. 2014; Vickers and Pena-Mendez 2015). In this study, we use mobile cellular phone subscriptions per 100 people, access to electricity, air transport, and an index comprising electricity, telephone networks, air transport, internet use, and communication. Consistent data for road and railway transport was not available and was therefore not utilized.

Improved labour productivity is manifested in higher output per unit of labour input or gross value-added per worker. The linkage may be explained through the technology effect and competitive pricing channels. The technology effect manifests itself as an increase in new products or new markets, while the competitive pricing channel is reflected in low unit labour costs for domestic producers. It is assumed that firms that are more productive self-select themselves into foreign markets. A positive sign is expected a priori (Atkinson 2013; Burinskiene 2012; Chalikias 2017; Cieslik et al. 2015; Greenaway and Kneller 2004; Kordalska and Olczyk 2014).
The correlation results for the measuring export competitiveness (MEC) indicator, the GCI, and our competitiveness measures are presented in Appendix D. The MEC indicator is based on the growth of export market share that reflects the geographic structure of the export, product and sectoral structure of the export, and the adjusted market share decomposed by technology, skills, or processing stage. The correlation results are positive but small, attributed to the fact that both MEC indicator and GCI are broader in composition.
We use panel data covering the period 1997–2018 on Tanzania’s exports of chemicals and manufactured goods (Appendix A). The data on total manufactures is obtained from the World Bank’s World Integrated Trade Solution (WITS). Data on intermediate imports and preferential tariffs (weighted average) is also obtained from WITS. Additional data for the same period is retrieved from the World Development Indicators (WDI), specifically for GDP growth, FDI to GDP, mobile cellular subscriptions per 100 people, and consumer price index (CPI). GVC-related indicators are obtained from the UNCTAD-EORA Global Value Chain Database. Institutional quality is measured by a variable on constraints on the executive, obtained from the Polity IV data set. It measures the extent to which constraints on decision-making are institutionalized and how these limitations are imposed by a framework of accountability. The RCA index for chemical and manufactured exports is obtained from the UNCTAD database. Our analysis also includes a variable on productivity, measured by output per employed person, and growth in output per employed person obtained from the 2019 Total Economy Database. For the RER, we derive an index (2005 = 100) on the basis of Tanzania’s annual nominal exchange rate obtained from the IMF’s International Financial Statistics and CPI relative to the US CPI.
4.1 Empirical model and estimation method
The empirical model specified in Equation 1 is aligned to Section 4, where export performance at the manufacturing product level and the RCA index are used separately as dependent variables (Martina et al. 2015; Muhammad and Xin 2017; Muratoglu and Muratoglu 2016; Saboniene 2009). Equation 1 represents the standard export competitiveness equation in the literature, where i and t denote manufacturing product and period, respectively, X represents export performance and export competitiveness, Y represents foreign income, RER signifies the RER, and Control represents other product-specific and macro variables that affect export performance and competitiveness. The term ε t corresponds to the error term (Bieut and Kamila 2016; Martina et al. 2015):
itX = δ δ δ ε+ + +1 2 3 t t it itY RER Control (1)
Consistent with other studies, our analysis includes the following set of variables referred to as Control in Equation 1: institutional quality, foreign demand, GVC index/imported intermediate inputs, domestic demand, inflation, RER, tariff, labour productivity, FDI, and mobile cellular phone subscriptions per 100 people as a proxy for the telecommunications aspect of infrastructure (Hassan 2017; Hossain 2011; Kadir 2016; Lee et al. 2016; Martina et al. 2015; Muhammad et al. 2006; Muratoglu and Muratoglu 2016; Olczyk and Kordalska 2017a; Villarreal and Ahumada 2015).

13
The variables that are common for all products include domestic demand, institutional quality, imported intermediate inputs, GVC, inflation, and infrastructure variables. Export performance, RCA index, and tariffs are product-specific. This specification is consistent with similar previous studies that have both firm-/product-specific and macro variables in the same framework (Agur 2016; Brancati et al. 2018; Mohammed 2018; Nazli and Cihan 2016). The study uses panel data analysis. A Hausman test was conducted to determine the appropriate estimator between fixed and random effects estimators.7 The tests determined that the fixed effects estimator is suitable for this study. The study therefore used a simple fixed effects estimator.
5 Empirical results
The estimation results of the determinants of the performance and competitiveness of manufactured exports are presented in Tables 4 and 5 and Appendix E. Eight models are estimated: four for export performance and four for the competitiveness measure adopted in this study. In particular, the dependent variables for models 1–3 are growth of chemical exports and manufactured exports, and total manufactured exports. Model 4 is re-estimated for total manufactured exports incorporating a GVC index as an explanatory variable instead of imported inputs. Similarly, in models 5–8 we use RCA as the competitiveness measure. The results based on export performance and competitiveness are reported in Tables 4 and 5, respectively.
For robustness purposes, we also estimated the same models but replaced FDI, mobile cellular subscriptions, and tariffs with investment (gross fixed capital formation), electricity access, and a proxy for tariff preferences, respectively. The role of government in promoting export competitiveness is also included in each of the models with alternative measures. These results with alternative measures for selected explanatory variables are reported in Appendix E.
The results show that both supply-side factors and demand-side factors explain export competitiveness. Whereas the coefficient of FDI is negative and significant in nearly all the models presented in Table 4 and 5, the alternate measure of total investment is positive and significant in the results in Appendix E. The results suggest that FDI substitutes rather than complements export performance and is consistent with other previous studies (Chakraborty et al. 2017; Chiara 2013; Ibrahimova 2010). Elhiraika and Mbate (2014) argue that FDI has a negative effect on competitiveness if it is concentrated in the enclave natural resources sector, as is the case in most African countries, including Tanzania. Therefore, the results are attributed to the fact that most of the FDI inflows to Tanzania are predominantly to the mining sector rather than the manufacturing sector considered in this study. The positive and significant effect of total investment as an alternate measure of FDI is significant in five of the reported models, consistent with the argument that investment enlarges capital stock with positive implications for export performance (Appendix E).
The coefficients of mobile subscription in Tables 4 and 5 are positive and significant, underpinning the importance of quality infrastructure in reducing connection costs and boosting international trade.8 Similar results were obtained in previous studies for both developed and developing countries (Limao and Venables 2001; Muratoglu and Muratoglu 2016; Shinyekwa and Ntale 2017).
7 Due to missing data for some years for some of the variables, the study uses unbalanced panel data. 8 In this study, we reported results based on mobile subscription and access to electricity (reported in Appendix E), but we also used air transport and obtained similar results. The results from the infrastructure index were largely inconsistent and therefore not reported here.

The results in Appendix E, with access to electricity as an alternative measure for infrastructure, also indicate a positive and significant coefficient. The coefficient of labour productivity is positive and significant in most of the models presented in Tables 4 and 5, signifying the importance of investment in human capital and research and development and specialized skills in enhancing manufacturing competitiveness in Tanzania. This result corroborates previous studies (Cieslik et al. 2015; Dhiman and Sharma 2019; Huong et al. 2016; Kordalska and Olczyk 2014).
Table 4: Empirical results with export performance
Dependent variable Model 1 Model 2 Model 3 Model 4 Export
performance of key manufactured
goods
Export performance of
chemical exports
Export performance of total manufactured
exports
Export performance of total manufactured exports, with GVC
FDI –0.147 (–5.09)*** –0.073 (–0.87) –0.207 (–2.29)** –0.36 (–1.89)**
Domestic demand 0.003 (0.01) –0.196 (–3.32)***
–0.743 (–3.03)*** –0.059 (–0.22)
Mobile 0.253(1.78)* 0.519 (3.45)*** 0.315 (3.06)*** 0.025 (1.74)*
RER –0.018 (–1.88)* 0.008 (0.51) 0.002 (0.49) –0.005 (–0.67)
Tariff –0.082 (–1.77)* 0.245 (1.52) –0.106 (–3.70)*** 3.15E–06 (0.54)
Imported inputs 7.25E–05 (0.23) 0.0003 (1.87)* 0.0003 (2.73)***
GVC 0.002 (4.41)***
Foreign income –0.111 (–0.87) 0.325 (1.90)** 0.418 (1.51) 3.081 (2.00)**
Institutional –0.845 (–0.79) 0.167 (0.87) 0.884 (2.57)*** –0.165 (–0.53)
CPI –0.053 (–2.79)*** –0.017 (–1.86)* –0.008 (–2.93)*** –0.039 (–3.13)***
Labour 0.002 (3.28)*** 0.081 (2.13)** –0.009 (–0.42) 0.001 (2.17)**
R2 0.85 0.72 0.83 0.82
Note: for all the coefficients, the t-statistics are in parentheses; *, **, *** denote 10, 5, and 1 per cent significance levels, respectively.
Source: authors’ calculations.
The coefficient of institutional quality variable is statistically significant in five of the reported models in Tables 4 and 5. This result suggests that it is important to take deliberate measures to strengthen institutions that ensure adequate incentives for innovation, ease in trade flows, and entrepreneurship. The results from this study are consistent with the results of Alvarez et al. (2018) and Bekele and Mersha (2019).
The results further show that high tariffs and inflation deter export competitiveness as manifested by the highly significant negative coefficient in at least four of the reported models in Tables 4 and 5. This acts as a disincentive to the manufacture of high-productivity non-traditional exports. Karingi et al. (2016) showed that Tanzania exports the highest number of sensitive products with the highest sensitive-product share in the value of exports at 12 per cent, compared to Rwanda and Burundi at 6 per cent and Kenya at 2 per cent.9 High tariff rates reduce competitiveness of industrial firms that rely on imported goods and raise consumer costs. This result is consistent with previous work (Atif et al. 2019; Hassan 2017). High inflation leads to high costs due to high input and production costs, and deters export volume. Similar results were found by Lee et al.
9 Most of the sensitive items are food products that are highly protected, with very high tariffs on grounds of food security, poverty reduction, and protection of vulnerable domestic production.

15
(2016) and Ho and Karim (2013). The results with alternative measures are consistent with these findings.
Table 5: Empirical results with RCA as the measure of competitiveness
Dependent variable Model 5 Model 6 Model 7 Model 8 RCA for key
manufactured exports
RCA for chemical exports
RCA for total manufactured exports
RCA for total manufactured exports,
with GVC FDI –0.157 (–1.82)* –0.112 (–2.34)** –0.341 (–2.86)*** –0.197 (–1.95)** Domestic demand –0.095 (–1.27) –0.928 (–3.00)*** –0.330 (–0.97) –0.504 (–1.67)* Mobile 0.021 (2.50)*** 0.535 (4.05)*** –0.135 (–1.09) 0.042 (2.65)*** RER –0.0001 (–0.18) 0.001 (0.21) –0.015 (–2.66)*** 0.008 (1.01) Tariff –0.059 (–2.47)*** 0.080 (0.99) –0.078 (–2.53)*** 6.71E–06 (1.47) Imported inputs 0.0003 (3.39)*** –0.806 (–1.00) –0.0001 (–2.29)** GVC 0.925 (3.40)*** Foreign income 0.053 (0.86) 0.387 (2.44)*** 0.612 (2.32)** 2.478 (1.90)** Institutional 0.148 (2.02)** 0.149 (1.77)* 0.866 (2.85)*** 0.894 (1.92)** CPI –0.037 (–4.19)*** –0.018 (–5.94)*** –0.001 (–0.58) –0.040 (–2.49)*** Labour 0.001 (2.71)*** 0.070 (2.54)*** –0.013 (–0.72) –0.015 (–0.83) R2 0.76 0.77 0.78 0.75
Note: for all the coefficients, the t-statistics are in parentheses; *, **, *** denote 10, 5, and 1 per cent significance levels, respectively.
Source: authors’ calculations.
The foreign income coefficient bears the expected positive sign in five of the reported models in Tables 4 and 5. This implies that growth dynamics in Tanzania’s key five trading partners (Zambia, Democratic Republic of Congo, Kenya, Rwanda, and the USA), constituting over 66 per cent of total trade, are critical for its export competitiveness. The skewed nature of Tanzania’s export market makes it highly vulnerable to the business cycles of these five economies and signifies the need to diversify export destinations and expand manufactured exports so as to boost its competitiveness. Similar results were found by Rahmaddi and Ichihashi (2012) and Hossain (2011). The coefficient of the RER is negative and significant in five of the reported models, consistent with the theory that exchange rate depreciation increases export competitiveness. The findings are consistent with the results in Appendix E.
The coefficients of intermediate inputs and GVC are positive and significant in most of the reported models, irrespective of Tanzania’s relatively low share of intermediate inputs from the neighbouring countries, at 21 per cent compared to Kenya at 44 per cent and Uganda at 22 per cent (Karingi et al. 2016). In the last column of Tables 4 and 5, as well as Appendix E, we consider the same variables but replace imported intermediate inputs with a broader measure of value-added—the GVC index. The coefficient of GVC is positive and significant, signalling the possibility of backward and forward linkages in manufactured products in Tanzania. This result would be a pointer towards the need to encourage measures to facilitate import content in Tanzania as a way to enhance competitiveness.
6 Conclusions and policy implications
The manufacturing sector in Tanzania has been growing in the recent past, but with a less diversified export structure, concentration in food products, textiles, wearing apparel, and leather, chemicals, and basic metal industries and fabricated metal products. The growth is, however, far

below the targets set for the sector in the Tanzanian Integrated Industrial Development Strategy 2025. Previous analysis highlights a number of constraints to export manufacturing competitiveness without providing quantitative evidence of the key determinants of manufacturing export competitiveness in Tanzania.
This study sought to analyse the characteristics of Tanzania’s manufacturing exports in terms of skill and technology intensity. Manufactured exports are mainly low-technology intense coupled with low and medium skill levels. Measures aimed at deepening the technology intensity of manufactured exports are beneficial for tapping into international markets.
This study also sought to analyse the extent of Tanzania’s GVC engagement and to investigate determinants of export performance and competitiveness. Tanzania’s GVC participation remains limited, with notable increases in textiles, apparel, and footwear. The study also shows that manufactured exports benefit from GVCs, signalling the need to enhance reforms that encourage use of intermediate and value-adding imports and deliberate policies that can facilitate integration into GVCs while safeguarding the domestic value-added component. This requires negotiation of deep PTAs with diverse regions that attract investment in areas such as electronics and vehicles while also deepening already-existing GVCs in textiles and apparel. The content of the PTAs should be geared towards scaling up technology intensity of manufactures while leveraging the available low- and medium-skill labour.
To understand Tanzania’s export competitiveness, the study used fixed effects models on panel data covering the period 1997–2018. Different models for export performance and competitiveness based on RCA indicators of competitiveness on selected manufactured exports, chemical exports, and total manufactured exports were estimated. Alternative measures of some independent variables—mainly infrastructure, investment, and tariffs—were also used in separate regressions. The results showed that although both demand and supply factors determine export competitiveness in Tanzania, supply factors are more dominant. Specifically, the findings indicated that FDI, tariffs, and inflation have a negative effect on export competitiveness while total investment, labour productivity, infrastructure, and institutions are critical in enhancing manufacturing exports competitiveness in Tanzania. There is thus a need to understand the drivers of FDI inflows to Tanzania in addition to devising policies to minimize tariffs. The positive significance of the infrastructural indicators calls for deliberate, well-targeted investment in infrastructural facilities, including roads, communications, and regular electricity. The results also seem to suggest the need to continue enhancing human capacity, given the positive significance of labour productivity in this study, as well as continued strengthening of the institutional framework.
References
Agbor, J., and O. Taiwo (2014). ‘The Fundamental Determinants of Competitiveness in African Countries’. Working Paper 463. Cape Town: Economic Research Southern Africa.
Agur, I. (2016). ‘Products and Provinces: A Disaggregated Panel Analysis of Canada’s Manufacturing Exports’. Working Paper 16/193. Washington, DC: IMF https://doi.org/10.5089/9781475541335.001
Alvarez, I.C., J. Barbero, A. Rodríguez-Pose, and José L. Zofío (2018). ‘Does Institutional Quality Matter for Trade? Institutional Conditions in a Sectoral Trade Framework’. World Development, 103: 72–87. https://doi.org/10.1016/j.worlddev.2017.10.010
Amador, J., and S. Cabral (2016). ‘Global Value Chains: A Survey of Drivers and Measures’. Journal of Economic Surveys, 30(2): 278–301. https://doi.org/10.1111/joes.12097

17
Araujo, S., and D. Flaig (2017). ‘Trade Restrictions in Brazil: Who Pays the Price’. Journal of Economic Integration, 32(2): 283–323. https://doi.org/10.11130/jei.2017.32.2.283
Asad, A. (1994). ‘The New Trade Theory and Its Relevance for Developing Countries’. Policy Research Working Paper 1274. Washington, DC: World Bank.
Athanasoglou, P., and I. Bardaka (2010). ‘New Trade Theory, Non-Price Competitiveness and Export Performance’. Economic Modelling, 27(1): 217–28. https://doi.org/10.1016/j.econmod.2009.09.002
Atif, R., H. Mahmood, L. Haiyun, and H. Maoet (2019). ‘Determinants and Efficiency of Pakistan’s Chemical Products’ Exports: An Application of Stochastic Frontier Gravity Model’. PLoS One. https://doi.org/10.1371/journal.pone.0217210
Atkinson, D. (2013). ‘Competitiveness, Innovation and Productivity: Clearing Up the Confusion’. Available at http://www2.itif.org/2013-competitiveness-innovation-productivity-clearing-up-confusion.pdf (accessed 8 February 2021).
Babatunde, M. (2018). ‘Determinants of Export Performance in Developing Countries: A Survey of the Evidence’. In S. Bankole and A. Adewuyi (eds), Contemporary Issues in Trade Negotiation, Finance and Development. Ibadan: Department of Economics, University of Ibadan.
Bekele, W., and F. Mersha (2019). ‘A Dynamic Panel Gravity Model Application on the Determinant Factors of Ethiopia’s Coffee Export Performance’. Annals of Data Science, 6(4): 787–806. https://doi.org/10.1007/s40745-019-00198-4
Belayneh, A., and D. Wondaferahu (2013). ‘Determinants of Export Performance in Ethiopia: Var Model Analysis’. National Monthly Refereed Journal of Research In Commerce & Management, 2(5): 94–109.
Bieut, B., and K. Kamila (2016). ‘Competitiveness and Export Performance of CEE Countries’. NBP Working Paper 248. Warsaw: Polish Economic Institute. https://doi.org/10.2139/ssrn.2845772
Biggs, T. (2007). ‘Assessing Export Supply Constraints: Methodology, Data, Measurement’. Available at: http://aercafrica.org/wp-content/uploads/2018/07/2BiggsT_Assessing.pdf.
Boansi, D., B. Lokonon, and J. Appah (2014). ‘Determinants of Agricultural Export Trade: Case of Fresh Pineapple Exports from Ghana’. British Journal of Economics, Management and Trade, 4(11): 1736–54. https://doi.org/10.9734/BJEMT/2014/10773
Bogale, F. (2017). ‘Real Exchange Rate and Manufacturing Export Competitiveness in Eastern Africa’. Journal of Economic Integration, 32(4): 891–912. https://doi.org/10.11130/jei.2017.32.4.891
Bose, D. (2014). ‘Real Exchange Rate and International Competitiveness: Concepts, Measurement and Trends in New Zealand’. Presented at the NZAE Conference, 2–4 July, New Zealand.
Brancati, E., R. Brancati, D. Guarascio, A. Maresca, M. Romagnoli, and A. Zanfei (2018). ‘Firm-Level Drivers of Export Performance & External Competitiveness in Italy’. Discussion Paper 087. Brussels: European Commission.
Burinskiene, A. (2012). ‘The Theoretical Linkage between Trade and Productivity’. In B. Katalinic (ed.), DAAAM International Scientific Book 12. Vienna: DAAAM International. https://doi.org/10.2507/daaam.scibook.2012.25
Buturac, G., Z. Lovrincevic, and D. Mikulic (2014). ‘Export Competitiveness of Croatian Textile Industries: CMS Analysis and Importance for the Economy’. Tekstil ve Konfeksiyon, 24(2): 158–68.
Chakraborty, D., J. Mukherjee, and J. Lee (2017). ‘FDI Inflows Influence Merchandise Exports? Causality Analysis for India over 1991–2016’. Global Economy Journal, 17(3): 1–10. https://doi.org/10.1515/gej-2017-0020
Chalikias, J. (2017). ‘The Manufacturing Sector of Greece before and During the Financial Crisis’. International Journal of Economics and Business Administration, 5(1): 3–17. https://doi.org/10.35808/ijeba/116
Chiara, F. (2013). ‘Exports and FDI Motivations: Empirical Evidence from U.S. Foreign Subsidiaries’. International Business Review, 22(1): 47–62. https://doi.org/10.1016/j.ibusrev.2012.02.002

Cieslik, A., A. Michałek, J.J. Michałek, and J. Mycielski (2015). ‘Determinants of Export Performance: Comparison of Central Europe and Baltic Firms’. Finance an Uver/Czech Journal of Economics and Finance, 65(3): 211–29.
Dao, M. (2008). ‘The Determinants of Infrastructure Development in Developing Countries’. Journal for Studies in Economics and Econometrics, 32(3): 43–54.
Das, D., and N. Gupta (2019). ‘Climbing Up India’s Manufacturing Export Ladder: How Competitive Are Intermediate Goods’. Working Paper 371. New Delhi: Indian Council for Research on International Economic Relations.
De Backer, K., and S. Miroudot (2013). ‘Mapping Global Value Chains’. Trade Policy Paper 159. Paris: OECD.
Dhiman, R., and M. Sharma (2019). ‘Relation Between Labor Productivity and Export Competitiveness of Indian Textile Industry: Co-integration and Causality Approach’. Vision: The Journal of Business Perspective, 23(1): 22–30. https://doi.org/10.1177/0972262918821230
Doan, H. (2019). ‘Trade, Institutional Quality and Income: Empirical Evidence for Sub-Saharan Africa’. Economies, 7(48): 1–23. https://doi.org/10.3390/economies7020048
Ehnts, D., and H. Trautwein (2012). ‘From New Trade Theory to New Economic Geography: A Space Odyssey’. Oeconomia, 2(1): 35–66. https://doi.org/10.4000/oeconomia.1616
Elhiraika, B., and M. Mbate (2014). ‘Assessing the Determinants of Export Drivers in Africa’. Applied Econometrics and International Development, 14(1): 147–62.
Epaphra, M. (2016). ‘Determinants of Export Performance in Tanzania’. Journal of Economics Library, 3(3): 470–87.
Esteves, P., and A. Rua (2013). ‘Is There a Role for Domestic Demand on Export Performance’. Working Paper 1594. Frankfurt: European Central Bank.
Fagerberg, J. (1988). ‘International Competitiveness’. The Economic Journal, 98(2): 355–74. https://doi.org/10.2307/2233372
Goh, S.K., K.N. Wong, and S.Y. Tham (2013). ‘Trade Linkages of Inward and Outward FDI: Evidence from Malaysia’. Economic Modelling, 35: 224–30. https://doi.org/10.1016/j.econmod.2013.06.035
Greenaway, D., and R. Kneller (2004). ‘Exporting and Productivity in the United Kingdom’. Oxford Review of Economic Policy, 20(3): 358–71. https://doi.org/10.1093/oxrep/grh021
Hassan, T. (2017). ‘An Analysis of Prime Determinants and Constraints of Bangladesh’s Export Market: Stochastic Frontier Gravity Model Approach. World Customs Journal, 11(2): 77–92.
Heckscher, E. (1991). ‘The Effect of Foreign Trade on the Distribution of Income’. In H. Flam and M.J. Flanders (eds), Heckscher–Ohlin Trade Theory. Cambridge, MA: MIT Press. This article originally appeared in Swedish in 1919 in Ekonomisk Tidskerift, 21: 497–512.
Ho, C., and N. Karim (2013). ‘International Trade Competitiveness of Emerging ASEAN5+4 Countries’. Presented at the Asian, Finance and Association Conference, Jiangxi, China.
Hofmann, C., A. Osnago, and Michele Ruta (2017). ‘Horizontal Depth: A New Database on the Content of Preferential Trade Agreements’ Policy Research Working Paper 7981. Washington, DC: World Bank. https://doi.org/10.1596/1813-9450-7981
Hossain, A. (2011). ‘The Foreign Income and Real Exchange Rate Elasticities of Bangladesh Exports’. Pakistan Development Review, 50(2): 119–44. https://doi.org/10.30541/v50i2pp.119-144
Huong, V.V., M. Holmes, T.Q. Tran, and S. Lim (2016). ‘Firm Exporting and Productivity: What If Productivity Is No Longer a Black Box’. Baltic Journal of Economics, 16(2): 95–113. https://doi.org/10.1080/1406099X.2016.1187382
Ibrahimova, U. (2010). ‘The Effect of Inward Foreign Investments on Export Performance of Developing Countries: Evidence from Nine Members of CIS’. MA Theis. Budapest: Central European University Department of Economics,

19
Jongwanich, J. (2007). ‘Determinants of Export Performance in East and Southeast Asia’. Working Paper 106. Mandaluyong: ADB.
Kadir, K. (2016). ‘Determining Factors of Turkey’s Export Performance: An Empirical Analysis’. Procedia Economics and Finance, 38: 446–57. https://doi.org/10.1016/S2212-5671(16)30216-7
Karamuriro, H. (2015). ‘Determinants of Uganda’s Export Performance: A Gravity Model Analysis’. International Journal of Business and Economics Research, 4(2): 45–54. https://doi.org/10.11648/j.ijber.20150402.14
Karingi, S., O. Pesce, and L. Sommer (2016). ‘Regional Opportunities in East Africa’. WIDER Working Paper 2016/160. Helsinki: UNU-WIDER. https://doi.org/10.35188/UNU-WIDER/2016/204-5
Kordalska, A., and M. Olczyk (2014). ‘Impact of the Manufacturing Sector on the Export Competitiveness of the European Countries: A Spatial Panel Analysis’. Comparative Economic Research, 17(4): 105–20. https://doi.org/10.2478/cer-2014-0035
Kweka, J., M. McMillan, N. Gooroochurn, and F. Sooi (2019). ‘A Diagnostic Manufacturing Competitiveness Study: Challenges, Prospects and Policy Options for Tanzania’. Dar es Salaam: REPOA.
Laget, E., A. Osnago, N. Rocha, and M. Ruta (2018). ‘Deep Trade Agreements and Global Value Chains’. Policy Research Working Paper 8491. Washington, DC: World Bank. https://doi.org/10.1596/1813-9450-8491
Lee, S.Y., H. WaiMun, T. Zhengyi, and L.J. Ying (2016). ‘Determinants of Export: Empirical Study in Malaysia’. Journal of International Business and Economics, 4(1): 61–75. https://doi.org/10.15640/jibe.v4n1a6
Limao, N., and T. Venables (2001). ‘Infrastrucutre, Geographical Disadvantage, Transport Costs, and Trade’. World Bank Economic Review, 15(3): 451–79. https://doi.org/10.1093/wber/15.3.451
Lovasy, G. (1962). ‘Inflation and Exports in Primary Producing Countries’. IMF Staff Papers, 9(1): 37–69. https://doi.org/10.2307/3866081
Martina, S., V. Vuckovic, and P. Blanka (2015). ‘Determinants of Manufacturing Industry Exports in European Union Member States: A Panel Data Analysis’. Economic Research, 28(1): 384–87. https://doi.org/10.1080/1331677X.2015.1043781
Mdanat, M.F., T.A. Warrad, L.M. Salhieh, and T.S. Arabiyat (2018). ‘A Gravity Approach to Determinants of Export in a Small Open Economy: Evidence from Jordan’. International Journal of Economics and Financial Issues, 8(2): 40–46.
Mohammad, R. (2010). ‘The Factors Affecting Bangladesh’s Exports: Evidence from the Gravity Model Analysis’. Journal of Developing Areas, 44(1): 229–44. https://doi.org/10.1353/jda.0.0075
Mohammed, A. (2018). ‘Determinants of Export Survival: Case of Ghanaian Manufacturing Firms’. Journal of Quantitative Methods, 2(1): 37–61. https://doi.org/10.29145/2018/jqm/020102
Muhammad, I., and Q. Xin (2017). ‘Determinants of Export Competitiveness: An Empirical Analysis through Revealed Comparative Advantage of External Sector of Pakistan’. Asian Economic and Financial Review, 7(6): 623–33. https://doi.org/10.18488/journal.aefr.2017.76.623.633
Muhammad, M., E. Ahmad, and M. Khawaja (2006). ‘Determinants of Exports in Developing Countries’. Pakistan Development Review, 45(4): 1265–76. https://doi.org/10.30541/v45i4IIpp.1265-1276
Muratoglu, G., and Y. Muratoglu (2016). ‘Determinants of Export Competitiveness: Evidence from OECD Manufacturing’. Journal of Economics and Political Economy, 3(1): 111–18.
Nazli, T., and Y. Cihan (2016). ‘Exports, Real Exchange Rate and External Exposures: Empirical Evidence from Turkish Manufacturing Firms’. Presented at the IFC-ECCBSO-CBRT Conference on Uses of Central Balance Sheet Data Offices Information, Özdere-İzmir, 26 September.

Neary, J. (2009). ‘Putting the “New” into the New Trade Theory: Paul Krugman’s Nobel Memorial Prize in Economics’. Scandinavian Journal of Economics, 111(2): 217–50. https://doi.org/10.1111/j.1467-9442.2009.01562.x
Nebojsa, S., B. Marija, and V. Perica (2012). ‘The Competitiveness of Exports from Manufacturing Industries in Croatia and Slovenia to EU-15 Market: A Dynamic Panel Analysis’. CroEcoSur, 14(1): 69–105.
Nwanna, G. (1986). ‘The Contribution of Foreign Direct Investment to Export: An Empirical Study of 23 LDCs’. EconStor, 21(6): 277–82.
Ohlin, B. (1933). Interregional and International Trade. Cambridge, MA: Harvard University Press.
Olczyk, M., and A. Kordalska (2017a). ‘International Competitiveness of Czech Manufacturing: A Sectoral Approach with Error Correction Model’. Prague Economics Papers, 26(2): 213–26. https://doi.org/10.18267/j.pep.605
Olczyk, M., and A. Kordalska (2017b). ‘Gross Exports Verses Value Added Exports: Determinants and Policy Implications for Manufactured Sectors in Selected CEE Countries’. Eastern European Economics, 55(1): 91–109. https://doi.org/10.1080/00128775.2016.1254564
Page, J. (2016). ‘Industry in Tanzania: Performance, Prospects and Public Policy’. WIDER Working Paper 2016/5. Helsinki: UNU-WIDER. https://doi.org/10.35188/UNU-WIDER/2016/048-5
Prince, F. (2019). ‘The Determinants of Economic Growth: The Role of Infrastructure’. Working Paper 93101. Munich: MPRA.
Rahmaddi, R., and M. Ichihashi (2012). ‘How Do Foreign and Domestic Demand Affect Export Performance: An Econometric Investigation of Indonesia’s Exports’. Modern Economy, 3: 32–42. https://doi.org/10.4236/me.2012.31005
Saboniene, A. (2009). ‘Lithuanian Export Competitiveness: Comparison with Other Baltic Countries’. Engineering Economics, 2: 49–57.
Sahin, O., N. Can, and E. Demirbas (2014). ‘The Effects of Infrastructure Determinants on Economic Growth: European Union Sample’. Eurasian Journal of Business and Economics, 7(13): 11–27.
Samantha, N., and L. Haiyun (2018). ‘Does Inward Foreign Direct Investment Promote Exports: Empirical Evidence from Sri Lanka’. Business and Economic Research, 8(3): 1–18. https://doi.org/10.5296/ber.v8i3.13061
Shinyekwa, I., and A. Ntale (2017). ‘The Role of Economic Infrastructure in Promoting Exports of Manufactured Products: Trade Facilitation and Industrialization in the EAC’. Research Paper 265773. Kampala: Economic Policy Research Centre.
Sikander, R. (1999). ‘What Use Is the Neo-Classical Theory of International Trade?’. Lahore Journal of Economics, 4(1): 89–114.
Stiglitz, J., and A. Charlton (2006). ‘Aid for Trade’. International Journal of Development Issues, 5(2): 1–41. https://doi.org/10.1108/eb045861
Taglioni, D., and D. Winkler (2016). Making Global Value Chains Work for Development: Trade and Development. Washington, DC: World Bank Group. https://doi.org/10.1596/978-1-4648-0157-0
Tinbergen, J. (1962). ‘An Analysis of World Trade Flows’. In J. Tinbergen, Shaping the World Economy. New York: Twentieth Century Fund.
Turco, A., and D. Maggioni (2012). ‘On the Role of Imports in Enhancing Manufacturing Exports’. The World Economy, 36(1): 93–120 https://doi.org/10.1111/twec.12020
UNCTAD (2015). ‘Key Statistics and Trends in International Trade 2015’. Available at: https://unctad.org/en/PublicationsLibrary/ditctab2015d1_en.pdf.
Vickers, B., and B. Pena-Mendez (2015). ‘Mobile Technology and Trade in Sub-Saharan Africa’. The Commonwealth, 123: 1–6.

21
Vignes, L., and K. Smith (2005). ‘Measuring the Competitiveness of the Trinidad and Tobago Economy’. Paper presented at The Caribbean Center for Monetary Studies Conference, Nassau, Bahamas, 1–4 November 2005.
Villarreal, C., and V. Ahumada (2015). ‘Mexico’s Manufacturing Competitiveness in the US Market: A Short-Term Analysis’. Investigacion Economica, 74(292): 91–114. https://doi.org/10.1016/j.inveco.2015.08.004
Wangwe, S., D. Mmari, J. Aikaeli, N. Rutatina, T. Mboghoina, and A. Kinyondo (2014). ‘The Performance of the Manufacturing Sector in Tanzania: Challenges and the Way Forward’. WIDER Working Paper 2014/085. Helsinki: UNU-WIDER. https://doi.org/10.35188/UNU-WIDER/2014/806-3
Wignaraja, G., and A. Taylor. (2003). Benchmarking Competitiveness: A First Look at the Manufacturing Export Competitiveness Index. Competitiveness Strategy in Developing Countries. London: Routledge.
Wondemu, K., and D. Potts (2016). ‘The Impact of Real Exchange Rate Changes on Export Performance in Tanzania and Ethiopia’. Working Paper 240. Abidjan: African Development Bank.
Zhang, K. (2015). ‘What Drives Export Competitiveness? The Role of FDI in Chinese Manufacturing’. Contemporary Economic Policy, 33(3): 499–512. https://doi.org/10.1111/coep.12084

Appendix A
Table A1: Data sources and definitions
Data Data source Definition Resource-based, low-, medium-, and high-technology manufactured exports
UNCTAD Defined as direct research and development intensity using the Lall classification.
Chemical exports UNCTAD Third revision of the SITC nomenclature at the two-digit level.a
Manufactured exports UNCTAD Same as above. Total manufactured exports
WITS ISIC nomenclature. It captures chemicals, food, leather, non-metallic and metals, wood, paper, and other.
RCA index for chemical exports
UNCTAD and authors’ calculations
RCA is available at the three-digit product level. The study used 2018 trade weights (Tanzania’s exports for each of the three-digit level products as a share of each of the respective two-digit product level) to aggregate RCAs at the three-digit to the two-digit product level.
RCA index for manufactured exports
UNCTAD Same as above.
RCA index for total manufactured exports
Authors’ calculations Computed using the formula in Appendix B for manufactured exports (ISIC).
Intermediate imports WITS Values. Preferential tariffs WITS Weighted average. Tanzania’s GDP WDI Real GDP. Foreign GDP WDI Weighted using chemical and manufactured exports to
Tanzania’s major destinations. The weights are applied to real GDPs of the respective countries to get a composite foreign GDP.
FDI WDI Ratio to GDP. Mobile cellular subscriptions per 100 people
WDI Subscriptions to a public mobile telephone service using cellular technology.
GVC index UNCTAD-EORA Global Value Chain Database
The GVC participation index indicates the extent to which a country is involved in a vertically fragmented production process.
GVC by product of interest
WITS Constructed using data on gross exports and imports to compute participation in GVCs across seven product categories grouped in three industries.
Institutional quality Polity IV Database Constraints on the executive and encompasses decision rules.
RER IMF’s International Financial Statistics
Computed as an index (2005 = 100) on the basis of Tanzania’s annual nominal exchange rate, obtained from the and CPI relative to the US CPI.
Labour productivity Total Economy Database
Measured by output per employed person and growth in output per employed person, obtained from the 2019 release of the Total Economy Database.
Note: a the SITC is a statistical classification of the commodities entering external trade. The current international standard is SITC, Rev.3.
Source: authors’ construction.

23
Appendix B: Computation of RCA
RCA is computed as follows:
∑ ∈≥
∑ ∈
1
Ai
Aj
Wi
WJ
Xj PX
Xj PX
where
P is the set of all products (with i ∈ P); AIX is country A’s exports of product i; WIX is the world’s exports of product i;
∑ ∈ AJJ PX is country A’s total exports (of all products j in P); and ∑ ∈ WJJ PX is the world’s total exports (of all products j in P).
Country A is said to have an RCA in a given product i when its ratio of exports of product i to its total exports of all goods exceeds the same ratio for the world as a whole. A country that has an RCA for a given product (RCA > 1) is inferred to be a competitive producer (https://unctadstat.unctad.org/en/RcaRadar.html).

Appendix C
Table C1: Exports performance
Manufactured exports (ISIC) (US$ ’000)
1998 2008 2018 Basic metal industries 41,424 848,411 238,669 Manufacture of chemicals 15,975 192,300 464,440 Manufacture of fabricated metal products 44,225 230,482 1,147,544 Manufacture of non-metallic mineral products 6,324 28,967 166,030 Manufacture of paper and paper products 2,727 30,681 89,556 Manufacture of wood and wood products 3,087 49,141 286,587 Manufacture of food and beverages 36,599 173,359 413,328 Other manufacturing industries 35,520 72,066 359,176 Textile, wearing apparel, and leather 24,748 177,622 29,509
Source: authors’ construction based on WITS.
Table C2: RCA indices
Manufactured exports (ISIC) RCA index
1998 2008 2018 Basic metal industries 0.35 2.81 1.15 Manufacture of chemicals 0.03 0.10 0.16 Manufacture of fabricated metal products 0.59 0.62 2.75 Manufacture of non-metallic mineral products 0.08 0.41 1.61 Manufacture of paper and paper products 0.34 1.54 0.41 Manufacture of wood and wood products 3.72 3.85 16.86 Manufacture of food and beverages 0.08 0.24 1.15 Other manufacturing industries 0.26 4.39 7.33 Textile, wearing apparel, and leather 0.38 0.78 6.77
Source: authors’ calculations based on UNCTADstat.

25
Appendix D
Table D1: Correlations between GCI and RCA indices and export performance measures
GCI K_MAN T_MAN CHEM_EXP RCA_CHEM RCA_K_MAN
GCI 1
K_MAN 0.014879 1
T_MAN 0.022948 –0.2718 1
CHEM_EXP –0.0238 0.416725 –0.29146 1
RCA_CHEM 0.002579 0.062348 –0.06451 0.618629 1
RCA_K_MAN 0.012572 0.780854 0.161522 0.352328 0.148356 1
Note: K_MAN = key manufactured exports; T_MAN = total manufactured exports; Chem_EXP = chemical exports; RCA_CHEM = RCA for chemical exports; RCA_K_MAN = RCA for key manufactured exports.
Source: authors’ calculations based on UNCTADstat.
Table D2: Correlations between MEC indicator and RCA indices and export performance measures
MEC K_MAN T_MAN CHEM_EXP RCA_CHEM RCA_K_MAN
MEC 1
K_MAN 0.07713 1
T_MAN 0.003915 –0.43323 1
CHEM_EXP –0.05712 0.509661 –0.35919 1
RCA_CHEM 0.002987 –0.09723 –0.13624 0.452963 1
RCA_K_MAN 0.078988 0.746413 –0.11447 0.283481 0.00646 1
Note: K_MAN = key manufactured exports; T_MAN = total manufactured exports; Chem_EXP = chemical exports; RCA_CHEM = RCA for chemical exports; RCA_K_MAN = RCA for key manufactured exports.
Source: authors’ calculations based on UNCTADstat.

Appendix E
Table E1: Empirical results on export performance and competitiveness with alternative measures (coefficient)
Independent variables
Dependent variable
Performance of key
manufactured goods
Performance of chemical
exports
RCA for key manufactured
exports
RCA for chemical exports
Performance of
manufactured exports
Performance for total
manufactured exports, with
GVC Investment 0.042
(1.69)* 0.056 (1.62)
0.040 (1.87)*
0.795 (1.73)*
0.061 (3.90)***
0.879 (1.93)**
Domestic demand
–0.423 (–0.90)
–0.710 (–1.57)
–0.966 (–2.75)***
–0.990 (–4.05)***
–0.336 (–1.87)*
–0.366 (–0.86)
Electricity 0.286 (0.36)
–0.038 (–1.50)
0.103 (3.46)***
1.029 (2.84)***
–0.093 (–0.39)
0.087 (2.32)**
RER –0.020 (–2.68)***
–0.019 (–1.69)*
–0.004 (–0.81)
–0.003 (–0.57)
–0.008 (–2.21)**
–0.007 (–0.89)
Tariff 0.001 (1.31)
–0.001 (–1.53)
–0.0001 (–2.00)***
–0.130 (–0.86)
–0.446 (–2.89)***
–0.441 (–2.83)***
Imported inputs
0.0003 (4.40)***
0.0004 (1.66)*
0.0003 (2.60)***
0.0002 (3.65)***
1.907 (3.45)***
GVC 0.004 (4.81)***
Foreign income
0.435 (2.39)***
0.903 (4.29)***
0.123 (0.41)
0.188 (1.28)
0.142 (1.21)
0.461 (2.47)***
Institutional 1.724 (1.75)*
0.421 (2.12)**
–0.070 (–084)
0.547 (2.00)**
0.507 (1.86)*
–0.171 (–0.33)
CPI –0.016 (–2.35)**
–0.041 (–2.39)***
–0.013 (–3.49)***
–0.021 (–2.90)***
–0.008 (–1.40)
–0.013 (–2.85)***
Labour 0.006 (0.24)
0.051 (1.40)
0.036 (1.47)
0.070 (2.99)***
0.039 (2.36)
0.062 (2.56)***
Government 1.66 (1.91)**
2.18 (3.97)***
–0.035 (–0.05)
0.834 (0.97)
0.812 (0.93)
0.209 (0.42)
R2 0.80 0.67 0.76 0.75 0.87 0.88
Note: for all the coefficients, the t-statistics are in parentheses; *, **, *** denote 10, 5, and 1 per cent significance levels, respectively.
Source: authors’ calculations.


![87Sr/86Sr chemostratigraphy of Neoproterozoic …eprints.gla.ac.uk/225/01/Thomas[1].pdfdata to provide wider age constraints on Dalradian sedimentation, focusing in particular on the](https://img.pdfslide.us/doc/110x75/5afda5537f8b9a444f8dc1a1/87sr86sr-chemostratigraphy-of-neoproterozoic-1pdfdata-to-provide-wider-age.jpg)