Embed Size (px)
Citation preview

This paper is part of the Proceedings of the 10th International Conference on Risk Analysis (RISK 2016) www.witconferences.com
M. Junghans, et al., Int. J. of Safety and Security Eng., Vol. 6, No. 2 (2016) 383–393
© 2016 WIT Press, www.witpress.comISSN: 2041-9031 (paper format), ISSN: 2041-904X (online), http://www.witpress.com/journalsDOI: 10.2495/SAFE-V6-N2-383-393
WIDE-AREA BASED TRAFFIC SITUATION DETECTION AT AN UNGATED LEVEL CROSSING
M. JUNGHANS, A. LEICH, K. KOZEMPEL, H. SAUL & S. KNAKE-LANGHORSTInstitute of Transportation Systems, German Aerospace Center (DLR), Berlin, Germany.
ABSTRACTThe automated detection of atypical and critical traffic situations is essentially important to help to understand driver behaviour, to find functional correlations between traffic conflicts and real accidents, and eventually, to prevent, particularly severe accidents. In this paper, a tool chain is introduced that enables fully automated traffic situation detection in wide-area traffic on the basis of a single camera. The tool chain takes into account novel powerful methods for object detection, classification and track-ing on the basis of robust regression with preconditioning. Moreover, the tool chain considers methods for traffic situation detection and classification on the basis of probabilistic approaches and eventually, traffic event recording. The approach was tested at an ungated level crossing in the small town Bien-rode, which is a district of Brunswick, Germany. It is shown that atypical situations, e.g. overtaking, braking, stopping, inadequate speeds, and accelerations, as well as critical situations, e.g. tailgating, can be detected within a range of up to 120 m distance of the camera automatically. The approach enables new ways of analysing traffic areas with regard to traffic safety and performance. The results shown in this paper were obtained in the project OptiSiLK, whose abbreviation means “Optimisation of the safety and the performance at intersections of different traffic modes”. OptiSiLK was funded by the Ministry for Science and Culture of the State of Lower Saxony (MWK).Keywords: atypical and critical traffic situations, surrogate safety measures, wide-area traffic detection.
1 INTRODUCTIONUnderstanding driver behaviour in unusual or critical traffic situations and accidents are the most urgent tasks to achieve the EU’s goal of “halving the number of fatalities until 2020”. Since the number of accidents is already on a rather low level in some European countries it is becoming more and more difficult to obtain a significant data basis allowing to find ade-quate measures to overcome the safety deficits on European roads. This motivates seeking for functional correlations between accidents and critical situations, e.g. tailgating conflicts, etc. Although there are several studies stating that such correlations exist, e.g. Gettmann et al. [1], other studies refuted them again, e.g. Souleyrette et al. [2]. The research question regarding this correlation is still open, and it seems that it only can be addressed by evaluating long-term measurements over a year (or even longer). A reasonable approach is to generate a data basis with critical traffic situations and accidents to assure the significance problem. Cur-rently, little is known about atypical situations in traffic, such as overtaking, u-turns, stopping, etc., e.g. Reulke et al. [3], which usually are not, but may evolve critical. In Owens and Hunter [4] atypical behaviour of pedestrians in a parking area was investigated. Therefore, systems are needed that enable a detection of atypical situations and conflicts. Realisations of such systems on the basis of a single camera are known, e.g. Ismail et al. [5], Laureshyn [6], Saunier et al. [7], but lack of non-automation and inability of handling scenes with mutual

384 M. Junghans, et al., Int. J. of Safety and Security Eng., Vol. 6, No. 2 (2016)
occlusion of road users. Clearly, the ability to measure details of interaction or conflict between spatially and timely close traffic objects, is crucial for the scientific community to make progress in this field. Therefore, another, fully automated system, went into operation in Brunswick, Germany, in 2014 Knake-Langhorst et al. [8], which tries to solve the occlu-sion problem by the use of several cameras, radar and laser scanners. In this paper, a tool chain is introduced, which was developed and tested successfully within the project OptiS-iLK (Optimisation of the safety and the performance at intersections of different traffic modes) funded by the Ministry for Science and Culture of the State of Lower Saxony (MWK) to detect and classify critical and atypical situations in a traffic scene. The results are reported for an ungated level crossing in Bienrode, Germany, within ranges of approximately 120 m length, which was under automated surveillance by a single camera mounted at 12 m height over ground. This paper is structured as follows: In the following section, the tool chain is introduced. Afterwards, the experiments and results are discussed and finally, the results are concluded and future prospects are given.
2 METHODICAL APPROACHIn this section, insight about the developed methods is given. In Fig. 1, the processing tool chain is shown, which realises the wide area traffic situation surveillance approach. The video server provides the images of the video scene, which are requested by the detection and classification module. Then the tracking module provides trajectories of the objects, which will be analysed by the situation detections to provide normal, atypical or critical traffic situ-ations. Depending on the adopted parameters and the chosen thresholds, the event recorder is capable of saving the data, i.e. compressed video, trajectories, parameters, etc.
2.1 Object detection, classification and tracking
The object detection algorithm developed here is based on so-called vehicle traps. A vehicle trap is a region of some specific form and size within the image which triggers an event, if a vehicle is detected. Within OptiSiLK, a pattern recognition approach was chosen comprising a Feature-Vector generation using the Histogram of oriented Gradients (HoG) algorithm and a Support Vector Machine (SVM) [9] trained to distinguish between background and the vehicle classes passenger car, van and lorry. Once detected, vehicles were tracked using an optical correlation-based approach that uses robust regression with GNC and preconditioning [10]. Doing so enables tracking of vehicles over a distance of more than 100 m accurately, which favourably compares with results with other sensor setups and tracking algorithms (e.g. the widely adopted KLT-approach used in NGSIM, see Punzo et al. [11]). In Fig. 2, the surveillance area of the ungated level crossing is shown including the results of the SVM for vehicle classification.
Figure 1: Process chain to detect, classify and track traffic objects, situation detection and recording.

M. Junghans, et al., Int. J. of Safety and Security Eng., Vol. 6, No. 2 (2016) 385
The strength of the tracking approach is that the motion estimation is based on the optical flow information of a big number of pixels within the region of interest (ROI). The time sequence of the ROI-images is transformed into a cost function (regression) in a way that the global minimum of the cost function characterises the dominant motion, which is supported by the most pixels of the image region. Non-dominant motions are characterised by local minima in the cost function (robust regression). If a local minimum can be tracked through-out the whole traffic scene, occlusion does not alter trajectory data. The term “robust” refers to the use of so-called robust scalable error functions, which allow distinguishing between several motions within an image region, e.g. the motion of a vehicle and the motion of the background. Consequently, applying the algorithm, different objects can be detected in dependence on their motion patterns. Therefore, partly occluded objects can be tracked reli-ably. An Extended Kalman Filter is applied for post processing the raw trajectories.
2.2 Traffic situation detection
The camera observes road users of different transportation modes and their interactions. A human observer often finds traffic situations not fitting into the concept of a normal traffic situation. Therefore, in our analysis we considered situations as critical situations, which show an obvious and detectable interaction of traffic objects, which may be critical or poten-tially dangerous. Moreover, we considered normal and atypical traffic situations. Atypical traffic situations are situations that differ from normal situations and are normally uncritical (u-turns, wiggly lines, etc.). Critical situations are situations, in which interacting traffic par-ticipants are timely and spatially near to each other (e.g. rear-end approaching at high speeds, intensive braking, etc.). For both types of traffic situations, methods were developed to detect them automatically.
2.2.1 Critical traffic situationsTo detect critical traffic situations parameters of the traffic conflict technique called surrogate safety measures (SSM) are computed, which indicate an upcoming accident or conflict in a
Figure 2: Wide-area-based object detection, classification and tracking at the level crossing in Bienrode, Germany. The objects are detected within the vehicle trap (red ellipse) and tracked by the blue ellipses.

386 M. Junghans, et al., Int. J. of Safety and Security Eng., Vol. 6, No. 2 (2016)
time based, location based, kinematic based or probabilistic way, which can be found in sev-eral publications, e.g. Hydén [12], van der Horst [13], Shelby [14], Detzer et al. [15]. In OptiSiLK SSMs were computed, which represent not only the state of the art, but also novel parameters were developed. Therefore, the big number of known SSMs was analysed, and it was concluded that the SSMs TTC (time to collision), DRAC (deceleration rate to avoid the crash), PET (post encroachment time), Delta-v (speed difference before and after the assumed crash) are most important to predict collisions. Additionally, the probability density distribu-tions of these parameters were determined. Further, the collision probability P(o1 ∩ o2) between two interacting vehicles o1 and o2 based on the probability density distributions f1 and f2 of the positions of the two vehicles was computed. A novel DRAC2 (deceleration rate to avoid the crash on brake) was developed in Biemann [16], which takes into account the braking intensity of the preceding and succeeding vehicles and the reaction time. In Fig. 3 (left) the determination of P(o1 ∩ o2) is illustrated. Functions f1 and f2 are the local probabil-ity density functions of both vehicles o1 and o2 at hand of an example scene (right) are shown. The trajectories on the right of Fig. 3 (top left) for the detected objects (bottom right) are shown in different colours, i.e. blue and green and their prediction in white. In case of inter-action, the colours change from white (normal) to amber (attention) to red (upcoming accident).
It is clear that P(o1 ∩ o2) needs to be calibrated like any other SSM, which is adopted for situation detection. In this case we chose a probability of 0.7 for the “attention level” (amber) and 0.9 for “collision warning” (red) for a 2 s prediction horizon. Critical traffic situations were georeferenced in a map (not shown here) to visualise their frequent local occurrences. We found out that left turning seems to be potentially dangerous with regards to the intersecting, not separated traffic and this specific scenario. This came out to be true due to glare from the sun in the evening hours. During the evening hours, several real accidents were reported over the past 5 years. This is in line with the assumption that left turning drivers were blinded by the sun, and thus did not recognise the approaching vehicles. “
2.2.2 Atypical traffic situationsIn order to automatically distinguish between a normal and atypical traffic situation, a two dimensional probability density function (Probability Density Map, PDM) is used. A “nor-mal” trajectory fits in the PDM, while an atypical trajectory differs. The principle of the PDM is to assess the traffic objects’ states probabilistically with regards to their occurrence along
Figure 3: left: Principle of determining P(o1 ∩ o2) between two interacting traffic objects (top) on the basis of the probability density functions of their positions f1 and f2; right: Collision prediction on the basis of estimated kinematic motion parameters (left); georeferenced conflict points marked as coloured dots (right).

M. Junghans, et al., Int. J. of Safety and Security Eng., Vol. 6, No. 2 (2016) 387
their trajectory. Therefore, the probability is computed that traffic objects pass the position (x,y), at a speed (vx,vy) and an acceleration (ax,ay) with a specific direction. Clearly, frequent positions, speeds, etc. result in a higher probability than less frequent. In Fig. 4, the PDM for positions, speed and acceleration are shown. To estimate abnormality, several thousand tra-jectories for different traffic modes were used for training. After training the trajectories were clustered taking into account their driving relation (entry and exit-lane). A score for measur-ing “atypicality” of a probe trajectory is computed by summing and normalizing the PDM-probabilities encountered at each trajectory position (refer to Saul et al. [17] for more details).
3 EXPERIMENTS AND RESULTS
3.1 Object detection and tracking
3.1.1 Synthetic scenesThe novel algorithm for the robust object detection and tracking was first analysed using abstract synthetic data. A set of test data was generated, containing straight lines. A straight line is an abstract representation of the dominant motion in a ROI in an occluded situation (represented by outlier points). It was found, that the robust regression-based algorithm with GNC, and preconditioning was able to correctly identify 100% of the straight lines in the case of 65% outlier points and 83% of the straight lines in case of 90% outliers. In Fig. 5, an exam-ple from the test data set with 90% outliers is shown. The straight line to be found is hard to recognise for a human observer, while the algorithm performs well. For more details see Leich et al. [10].
3.1.2 Real traffic scenesOn the basis of these findings, comparable results are expected for real traffic scenes. In real traffic scenes, we could find that a numerical stable tracking on the basis of the novel algo-rithm at an occlusion ratio of 90% could be achieved too, after improving the algorithm to deal with multimodal saddle points in the cost function. The algorithm is tracking the anno-tated vehicles in traffic scene properly as shown in Fig. 6.
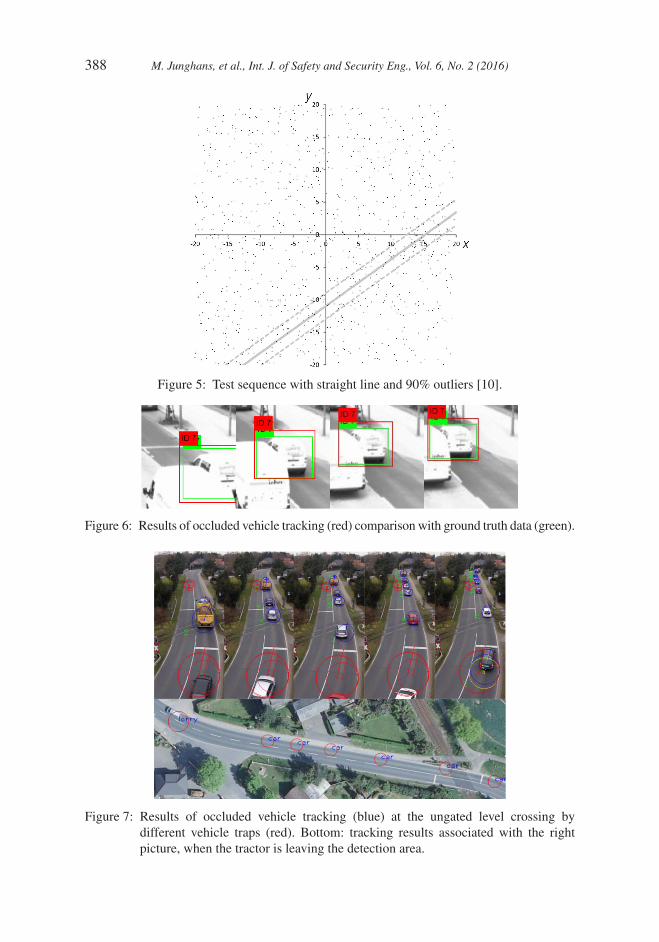
In Fig. 7, the effect of the robust occluded vehicle tracking at the ungated level-crossing is shown. Several vehicle traps (red ellipses) are set up for both directions, each of which is trained for a specific vehicle class. Following the tracking results from the left to the right, a good impression of the performance of the algorithm can be gained. Additionally, it can be
Figure 4: PDM of Position (left), speed (centre) and acceleration (red and green), deceleration (blue) (right). High probabilities are shown in red/blue, low in green [17].
388 M. Junghans, et al., Int. J. of Safety and Security Eng., Vol. 6, No. 2 (2016)
Figure 5: Test sequence with straight line and 90% outliers [10].
Figure 6: Results of occluded vehicle tracking (red) comparison with ground truth data (green).
Figure 7: Results of occluded vehicle tracking (blue) at the ungated level crossing by different vehicle traps (red). Bottom: tracking results associated with the right picture, when the tractor is leaving the detection area.

M. Junghans, et al., Int. J. of Safety and Security Eng., Vol. 6, No. 2 (2016) 389
seen that the lorry with trailer is detected twice, which emphasises the challenges of our future work.
3.2 Situation detection
3.2.1 Critical traffic situationsFor the detection of critical situations at the level crossing in Bienrode, optical loops were placed in the scene and SSM were measured locally when vehicles crossed them.
The results in Table 1 show what happened at the different optical loop locations located 8 m upstream of the level crossing LC, on the LC and 7 m downstream of the LC. It can be seen that the mean level of the SSMs DRAC and TTC emphasise that the traffic situation is safe under normal conditions, i.e. the TTC is approximately within 6.1 to 10.6 s (TTCcrit < 2s), whereas the DRAC is with 0.006 to 0.016 m/s² rather low (DRACcrit > 3.5 m/s2). Further, we can state that most of the critical situations happen on or after the level crossing, i.e. we meas-ured between 42 and 51 “critical TTC events” on or behind the level crossing (direction Brunswick) and between 99 and 131 on or behind the Level crossing (direction Wenden). A deeper view into the data lets us assume that the discrepancy among the critical situations between the directions Brunswick and Wenden is due to the vehicles accelerating at about 1.0 m/s² after the level crossing resulting in more tailgating conflicts and lower mean net time gaps of about 18.2 s. In the Brunswick direction the vehicles decelerate at about −2.4 m/s² after the level crossing due the followed right turn, resulting in mean net time gaps of about 20.4 s. Additionally, whole trajectories were used to determine critical situations spatially on the basis of the predicted trajectories by the application of adaptive filters. In Fig. 8, the results of the spatial determination of critical situation are shown. The map presents the areas of frequently occurring critical situations in dependence on their criticality with different colours (green – TTC < 2 s, amber – TTC < 1.2 s, red – TTC < 0.4 s). It can be seen that there are areas with higher criticality, particularly after the level crossing (direction Wenden) and before the level crossing (direction Brunswick). The latter case seems to be contradictory to the local findings according to the above table in which critical situations were stated to happen mostly behind
Table 1: Critical situations (mean values) and their frequencies before, on and behind the level crossing.
Mean TTCDirection BrunswickDirection Wenden
8 m before the LC On the LC 7 m behind the LC
10.6 s8.6 s
9.8 s6.1 s
9.2 s7.0 s
Frequency TTC<0.5 sDirection BrunswickDirection Wenden
8 m before the LC On the LC 7 m behind the LC
42 / day36 / day
42 / day131 / day
51 / day99 / day
Mean DRACDirection BrunswickDirection Wenden
8 m before the LC On the LC 7 m behind the LC
0.006 m/s2
0.009 m/s20.010 m/s2
0.016 m/s20.011 m/s2
0.016 m/s2
Frequency DRAC>4 m/s2
Direction BrunswickDirection Wenden
8 m before the LC On the LC 7 m behind the LC
3 / day3 / day
9 / day4 / day
14 / day5 / day

390 M. Junghans, et al., Int. J. of Safety and Security Eng., Vol. 6, No. 2 (2016)
the level crossing. This clearly shows the limits of local measurements. In contrast and as mentioned above, the advantages of spatial measurements are clear, since for each position on the map criticality metrics can be computed (which is also possible, but very costly with a lot of local measurements). Further, we see that areas are marked as red, where no conflicts hap-pened, e.g. on the pavement. The reason is not clear yet, but due to the fact that spatial measurements were obtained by the application of adaptive filters within a time horizon of 2 s and the assumption of linear motion, conflicts were predicted to some position, which might not be the true one. This task is still under investigation.
Moreover, there is a maximum of TTC values between 0.0 and 0.1 s, which can be attrib-uted to errors of the image processing algorithm due to objects that were detected twice, e.g. lorries and cars with trailers. The surveillance system was installed on the meadow (right side of Fig. 8). It provided trajectories of the leaving vehicles (direction Wenden) of 100 to 120 m length and of the approaching vehicles (direction Brunswick) of about 60 to 80 m length. Consequently, the results shown need to be considered carefully, since the TTC values visual-ised here do not cover the whole detection and tracking area. The figure illustrates the vision for the future work: a dynamic and complete safety risk map for traffic areas with quantified safety risks for each position in the map.
3.2.2 Atypical traffic situations
In Fig. 9, examples of the PDM of normal situations for positions and speeds at the ungated level crossing in Bienrode are shown. Clearly, there are areas with slower and normal (about
Figure 8: Critical situations at the ungated level crossing in Bienrode, Germany.
Figure 9: PDM of positions (left, red: high probability, green: low probability) and speeds (right, red: high speeds, green: low speeds).

M. Junghans, et al., Int. J. of Safety and Security Eng., Vol. 6, No. 2 (2016) 391
0–30 km/h, green) and areas with higher speeds (up to 80 km/h, red). According to the method introduced above, deviations from the normal positions and speeds are classified as atypical. The red areas in the far left side (direction Wenden) of the right picture suggest very unreal-istically high speeds, and the vehicles seem to leave the road. This is due to the flat viewing angle of the camera. When occluded vehicles leave the observation area, the tracking algo-rithm sometimes predicts their positions wrong. The results are too high speeds at the very end of the wide area traffic scene.
Applying the PDM approach, we were capable of detecting different traffic situations auto-matically, e.g. slow driving, overtaking, stopping, intense braking, etc. In Fig. 10 a vehicle follows a bicycle for more than 20 s yielding the shown trajectory. Here, we need to empha-sise that the PDM for position and direction were normal, but the PDM for speed was abnormal, thus classifying the trajectory as atypical.
In Fig. 11, a car is overtaking another car before the driver can recognise the level cross-ing. In this case, both the position and the speed PDMs were atypical yielding the atypical trajectory on the right.
4 CONCLUSIONS AND FUTURE PROSPECTSIn this paper, a tool chain was introduced which was applied to detect, classify and track traffic objects in a wide-area traffic scene at an ungated level crossing in Bienrode, a small town near Brunswick, Germany. The measured trajectories of the vehicles were aimed for analysing and testing objective methods of traffic conflict techniques allowing traffic safety
Figure 10: A car is following a bicycle slowly without overtaking (left) yielding an atypical trajectory (right).
Figure 11: The dark vehicle is overtaking a van (left) yielding an atypical trajectory (right)

392 M. Junghans, et al., Int. J. of Safety and Security Eng., Vol. 6, No. 2 (2016)
analysis of traffic areas on the basis of traffic conflicts. The results summarised here were the outcomes of a sub-project of the project OptiSiLK (Optimisation of the safety and the perfor-mance at intersections of different traffic modes), which was funded by the MWK.
Within OptiSiLK a new algorithm for video-based traffic object detection was developed, capable of tracking vehicles for a distance of more than 120 m with one single camera, even if they were occluded by up to 90%. Clearly, this gives new opportunities for traffic safety analyses, which require reliable and highly accurate trajectories of interacting traffic objects. Further, several methods for a fully automated detection of atypical and critical situations were developed and tested. The results show that there seem to be areas of the level crossing, which are more critical than others, which was not expected in this way. Although the results are promising, the current tool chain needs further improvement to decrease the number of false alarms when detecting critical situations, particularly the separation of traffic objects (vehicles with trailer) is one open point. Further, vehicles at the far end of the traffic scene (more than 100 m away from the camera) may diverge yielding unrealistically high velocities and wrong positions. Due to this, the tracking is currently only reasonably possible up to a distance of less than 100 m. Nevertheless, bringing the system to state for analysing traffic safety in wide area traffic, further investigations are required. Our future work is character-ised by improving the image processing techniques and adapting it to new motion models as well as the development of novel SSM.
REFERENCES [1] Gettman, D., Pu, L., Sayed, T. & Shelby, S., Surrogate safety assessment model and
validation: final report, report no. fhwa-hrt-08-051, turner-fairbanks highway research center, federal highway administration, McLean, VA, 2008.
[2] Souleyrette, R. & Hochstein, J., Development of a conflict analysis methodology using ssam. final report, center for transportation research and education, Iowa State Univer-sity, 2012.
[3] Reulke, R., Meysel, F. & Bauer, S., Situation analysis and atypical event detection with multiple cameras and multi-object tracking. In RobVis, pp. 234–247, Springer-Verlag Berlin-Heidelberg, 2008.
[4] Owens, J. & Hunter, A., Application of the self-organizing map to trajectory classifca-tion. Proceedings of the Third IEEE International Workshop on Visual Surveillance (VS’2000), IEEE Computer Society: Washington, DC, USA, 2000.
[5] Ismail, K., Sayed, T. & Saunier, N., Automated analysis of pedestrian-vehicle conflicts: a context for before-and-after studies. in transportation research board (trb): Journal of the Transportation Research Board, 2009.
[6] Laureshyn, A., Application of automated video analysis to road user behavior. PhD Thesis, Lund University, Sweden, 2010.
[7] Saunier, N., Sayed, T. & Ismail, K., Large scale automated analysis of vehicle interac-tions and collisions. In Transportation Research Board (TRB): Journal of the Transpor-tation Research Board, 2010.
[8] Knake-Langhorst, S., Frankiewicz, T., Gimm, K. & Köster, F., Test Site AIM – Toolbox and enabler for applied research and development in traffic and mobility. Accepted for publication at Traffic Research Arena (TRA) 2016, Warsaw, 2016.
[9] Dalal, N. & Triggs, B., Histograms of oriented gradients for human detection. IEEE Computer Society Conference on Computer Vision and Pattern Recognition, Vol. 1. IEEE, 2005.

M. Junghans, et al., Int. J. of Safety and Security Eng., Vol. 6, No. 2 (2016) 393
[10] Leich, A., Junghans, M., Kozempel, K. & Saul, H., Road user tracker based on robust regression with gnc and preconditioning. In SPIE Conference on Electronic Imaging, San Francisco, USA, 2015.
[11] Punzo, V., Borzacchiello, M.T. & Ciuffo, B., On the assessment of vehicle trajectory data accuracy and application to the Next Generation SIMulation (NGSIM) program data. Transportation Research Part C: Emerging Technologies 19.6, 1243–1262, 2011.http://dx.doi.org/10.1016/j.trc.2010.12.007
[12] Hydén, C., Traffic conflicts technique: state-of-the-art. In Traffic Safety Work with video processing ed. H.H. Topp, University Kaiserslautern. Transportation Department, Green Series No. 43, 1998.
[13] van der Horst, A.R.A., A time-based analysis of road user behaviour in normal and criti-cal encounters. PhD thesis, TU Delft, 1990.
[14] Shelby, S.G., Delta-V as a measure of traffic conflict severity. In Transportation Research Board 90th Annual Meeting, 2011.
[15] Detzer, S., Junghans, M., Kozempel, K. & Saul, H., Analysis of traffic safety for cyclists – an automatic detection of critical traffic situations of cyclists. 20th International Conference on Urban Transport and the Environment, The Algarve, Portugal, 2014.
[16] Biemann, R., Untersuchung von Zusammenhängen zwischen Konfliktkenngrößen und verkehrstechnischen Kenngrößen, Internal Report, DLR, Institute of Transportation Systems, Berlin, Germany, 2014.
[17] Saul, H., Kozempel, K. & Haberjahn, M., A comparison of methods for detecting atypi-cal trajectories. 20th International Conference on Urban Transport and the Environment. The Algarve, Portugal, 2014.http://dx.doi.org/10.2495/UT140331