Embed Size (px)
Citation preview
Edelweiss ELSS F(An Open Ended Equity Linked Savings Scheme)
undFor more details on Edelweiss ELSS Fund please refer page 2
Why You Should Invest in Edelweiss ELSS Fund?
Mutual Fund investments are subject to market risks. Please read the Statement of Additional Information (SAI)
& Scheme Information Document (SID) of the scheme carefully before investing.
Factsheet | January 2011
Equity Returns
Tax Saving
`2on 24 Dec 2010
Per unit
Dividend declared
`2on 21 Ja
n 2011Per u
nit
Dividend declared
dividends
within30 days
Name of the Scheme/Option Amount of Dividend (in `)Record Date NAV per unit (in `)
Face Value per unit (in `)
Edelweiss ELSS Fund - Dividend Option 2 per unitFriday,
December 24, 2010
As on December 24, 2010
20.1910.00
Edelweiss ELSS Fund - Dividend Option 2 per unitFriday,
January 21, 2011As on January 21, 2011
17.4510.00
Distribution of dividend is subject to availability of distributable surplus. Dividend is declared on the face value of Rs.10/- per unit. Past performance may or may not be sustained in future. Pursuant to payment of dividend, the NAV of the Dividend Option of Edelweiss ELSS Fund falls to the extent of the dividend payout and statutory levy, if any.
For Scheme details & risk factors please refer last page. Mutual Fund investments are subject to market risks. Please read the Statement of Additional Information (SAI) & Scheme Information Document (SID) of the scheme carefully before investing.
For further information
Systematic approach to stock picking. No reliance on emotions or
gut feel while choosing stocks. Stocks are selected on the basis of
Growth, Quality, Valuation and Performance.
Our Quant based system takes into account most of the stocks in the
top 200 in market cap; thus no opportunity is missed.
Quant Based Portfolio Modeling Process:
Performance:
Past performance may or may not be *Inception Date : 30th Dec 2008
sustained in future
Returns less than one year are absolute and returns equal to or greater than one year are compounded annualized (CAGR).Performance of the dividend option for the investor would be net of the dividend distribution tax, if any.
As on January 31, 2011
Scheme Name 6 Months 1 YearSince
Inception*
Edelweiss ELSS Fund - Growth -2.15 13.64 34.82
S & P CNX Nifty (Benchmark) 2.58 12.78 34.20
Returns (%)
STP / SIP Options:
Frequency
Daily
Weekly / Monthly
Minimum Investment Amount
`500/- & in multiples of `1/-thereafter
`300/- & in multiples of `1/- thereafter
The idea is to generate returns while keeping volatility under
control by maintaining strict discipline.
The portfolio construction takes into account the risk profile of the
portfolio compared to its benchmark. Risk is constantly monitored
and corrective actions are taken to avoid under - performance.
Risk Management:
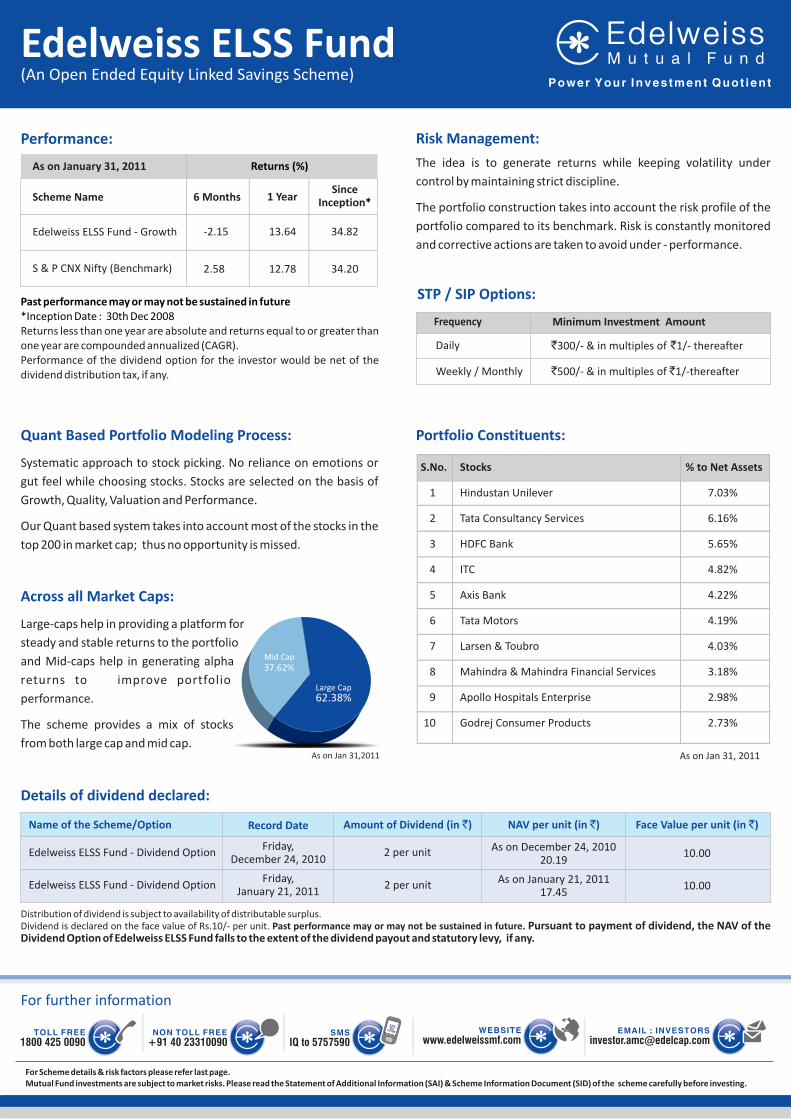
Portfolio Constituents:
As on Jan 31, 2011
Large-caps help in providing a platform for
steady and stable returns to the portfolio
and Mid-caps help in generating alpha
returns to improve portfolio
performance.
The scheme provides a mix of stocks
from both large cap and mid cap.
Across all Market Caps:
Mid Cap 00.00%
Large Cap 00.00%
Edelweiss ELSS F(An Open Ended Equity Linked Savings Scheme)
und
Details of dividend declared:
S.No. Stocks % to Net Assets
1 Hindustan Unilever 7.03%
2 Tata Consultancy Services 6.16%
3 HDFC Bank 5.65%
4 ITC 4.82%
5 Axis Bank 4.22%
6 Tata Motors 4.19%
7 Larsen & Toubro 4.03%
8 Mahindra & Mahindra Financial Services 3.18%
9 Apollo Hospitals Enterprise 2.98%
10 Godrej Consumer Products 2.73%
As on Jan 31,2011
Large Cap 62.38%
Mid Cap 37.62%
Markets & Beyond
The stock market loves gory metaphors. A fall becomes a blood bath, a
poor result is accompanied by a rout and markets crash (or go up in
flames) as stocks generate emotions formerly reserved for India
Pakistan cricket matches. All this color makes for enormous excitement
as the warrior (or worrier) resident in us is let loose but it plays havoc
with our internal decision making leading us to very poor quality long
term returns.
Take the events of the last month: Markets have fallen sharply (the worst
fall since the recovery began in March 2009) evoking a large degree of
worry and concern. After a hiatus of nearly 2 years, downside volatility is
back. At this point as investors we need great clarity on our goals to
navigate an emotionally and otherwise difficult environment. If as an
investor, volatility is of concern, then one ought to look at products that
have volatility control as an objective such as MIPs or the Edelweiss MF’s
Absolute Return Fund. On the other hand if investing in the market is a
part of a structured plan using SIPs, it is important to stick to the
discipline of investing through booms and through falls.
Knowing one’s investment objective and crafting the discipline needed
to keep investing through volatility is key to making the market work for
you. In times such as these when exciting or worrying information hits us
on a daily basis (if not hourly), it is our confidence in our own objectives
that allows us to act in a manner that maximizes our long term returns.
Know thyself is a almost a cliché, but these words are crucial to making
markets work for you. Incidentally these words come from the oracle at
Delphi, whose advice was sought by kings and leaders of ancient
Greece. Her other consistent piece of advice was “Nothing in excess” –
both sound advice for investors of today as for the kings of yesterday.
Right now markets face a series of headwinds that include political
events, inflation accompanied by tightening monetary policy and an
overreliance on flows. Yet, keep in mind the fact that these are taking
place in the backdrop of a country that is growing at over 8.5% a year
with a vibrant and prospering private sector that has rewarded investors
who have kept the faith for the last three decades.
For the last year, the RBI has been juggling with meeting multiple
objectives. Keep growth going, manage inflation and make sure there is
no extreme stress on the banking system. For the first three quarters of
2010, this was relatively an easy task. Rates were very low, far lower than
normal and rate hikes came under the guise of “normalization”. Being
normal is a wonderful thing and no one had any complaints with
restoring normalcy.
RBI’s tone began shifting around October 2010. Further hikes were not a
return to normalcy but the beginning of a tightening process. At the
same time, RBI has been shifting its inflation goals, moving targets
upwards, looking for time, hoping that volatile components of inflation
trend down averting the need for tightening. As of the Jan monetary
policy, the anticipated rate of inflation has been revised to around 7% in
March 2011.
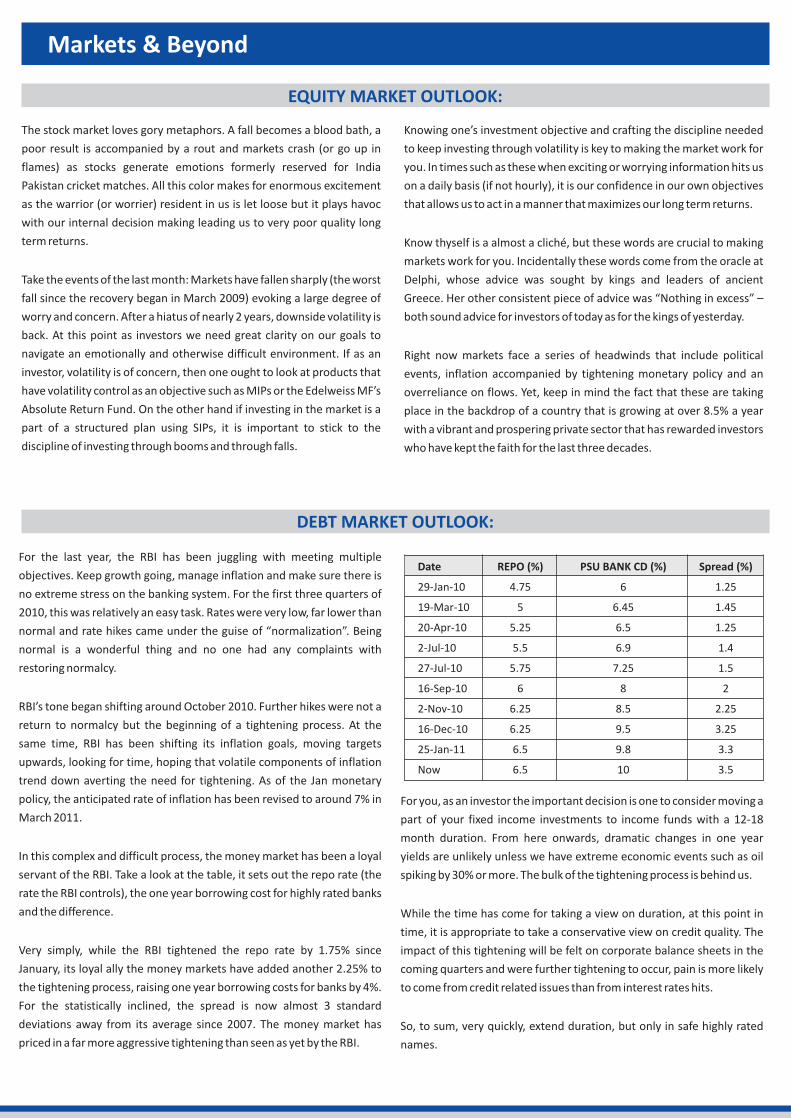
In this complex and difficult process, the money market has been a loyal
servant of the RBI. Take a look at the table, it sets out the repo rate (the
rate the RBI controls), the one year borrowing cost for highly rated banks
and the difference.
Very simply, while the RBI tightened the repo rate by 1.75% since
January, its loyal ally the money markets have added another 2.25% to
the tightening process, raising one year borrowing costs for banks by 4%.
For the statistically inclined, the spread is now almost 3 standard
deviations away from its average since 2007. The money market has
priced in a far more aggressive tightening than seen as yet by the RBI.
For you, as an investor the important decision is one to consider moving a
part of your fixed income investments to income funds with a 12-18
month duration. From here onwards, dramatic changes in one year
yields are unlikely unless we have extreme economic events such as oil
spiking by 30% or more. The bulk of the tightening process is behind us.
While the time has come for taking a view on duration, at this point in
time, it is appropriate to take a conservative view on credit quality. The
impact of this tightening will be felt on corporate balance sheets in the
coming quarters and were further tightening to occur, pain is more likely
to come from credit related issues than from interest rates hits.
So, to sum, very quickly, extend duration, but only in safe highly rated
names.
EQUITY MARKET OUTLOOK:
DEBT MARKET OUTLOOK:
Date REPO (%) PSU BANK CD (%) Spread (%)
29-Jan-10 4.75 6 1.25
19-Mar-10 5 6.45 1.45
20-Apr-10 5.25 6.5 1.25
2-Jul-10 5.5 6.9 1.4
27-Jul-10 5.75 7.25 1.5
16-Sep-10 6 8 2
2-Nov-10 6.25 8.5 2.25
16-Dec-10 6.25 9.5 3.25
25-Jan-11 6.5 9.8 3.3
Now 6.5 10 3.5
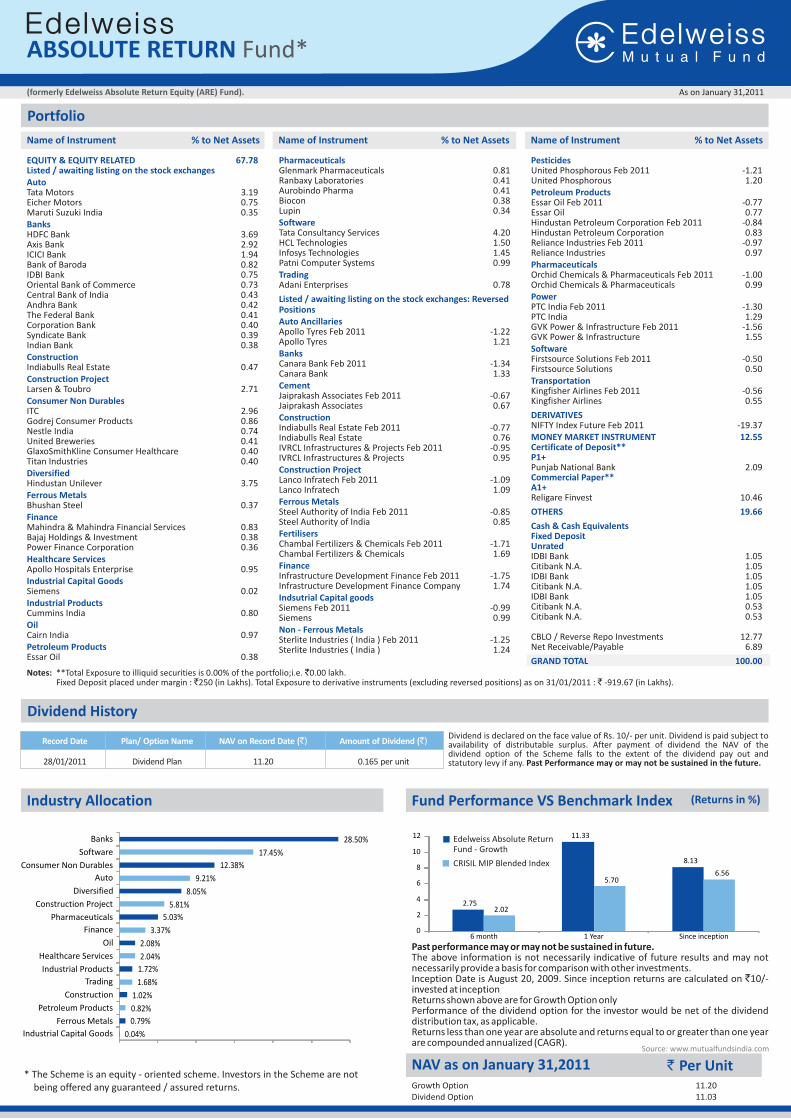
Industry Allocation
As on January 31,2011
Notes: **Total Exposure to illiquid securities is 0.00% of the portfolio;i.e. `0.00 lakh. Fixed Deposit placed under margin : `250 (in Lakhs). Total Exposure to derivative instruments (excluding reversed positions) as on 31/01/2011 : ` -919.67 (in Lakhs).
ABSOLUTE RETURN Fund*
Edelweiss Absolute Return Fund - Growth
CRISIL MIP Blended Index
Fund Performance VS Benchmark Index
Portfolio
EQUITY & EQUITY RELATED 67.78Listed / awaiting listing on the stock exchangesAuto
Banks
Construction
Construction Project
Consumer Non Durables
Diversified
Ferrous Metals
Finance
Healthcare Services
Industrial Capital Goods
Industrial Products
Oil
Petroleum Products
Tata Motors 3.19Eicher Motors 0.75Maruti Suzuki India 0.35
HDFC Bank 3.69Axis Bank 2.92ICICI Bank 1.94Bank of Baroda 0.82IDBI Bank 0.75Oriental Bank of Commerce 0.73Central Bank of India 0.43Andhra Bank 0.42The Federal Bank 0.41Corporation Bank 0.40Syndicate Bank 0.39Indian Bank 0.38
Indiabulls Real Estate 0.47
Larsen & Toubro 2.71
ITC 2.96Godrej Consumer Products 0.86Nestle India 0.74United Breweries 0.41GlaxoSmithKline Consumer Healthcare 0.40Titan Industries 0.40
Hindustan Unilever 3.75
Bhushan Steel 0.37
Mahindra & Mahindra Financial Services 0.83Bajaj Holdings & Investment 0.38Power Finance Corporation 0.36
Apollo Hospitals Enterprise 0.95
Siemens 0.02
Cummins India 0.80
Cairn India 0.97
Essar Oil 0.38
Name of Instrument % to Net Assets Name of Instrument % to Net Assets Name of Instrument % to Net Assets
Pharmaceuticals
Software
Trading
Listed / awaiting listing on the stock exchanges: Reversed PositionsAuto Ancillaries
Banks
Cement
Construction
Construction Project
Ferrous Metals
Fertilisers
Finance
Indsutrial Capital goods
Non - Ferrous Metals
Glenmark Pharmaceuticals 0.81Ranbaxy Laboratories 0.41Aurobindo Pharma 0.41Biocon 0.38Lupin 0.34
Tata Consultancy Services 4.20HCL Technologies 1.50Infosys Technologies 1.45Patni Computer Systems 0.99
Adani Enterprises 0.78
Apollo Tyres Feb 2011 -1.22Apollo Tyres 1.21
Canara Bank Feb 2011 -1.34Canara Bank 1.33
Jaiprakash Associates Feb 2011 -0.67Jaiprakash Associates 0.67
Indiabulls Real Estate Feb 2011 -0.77Indiabulls Real Estate 0.76IVRCL Infrastructures & Projects Feb 2011 -0.95IVRCL Infrastructures & Projects 0.95
Lanco Infratech Feb 2011 -1.09Lanco Infratech 1.09
Steel Authority of India Feb 2011 -0.85Steel Authority of India 0.85
Chambal Fertilizers & Chemicals Feb 2011 -1.71Chambal Fertilizers & Chemicals 1.69
Infrastructure Development Finance Feb 2011 -1.75Infrastructure Development Finance Company 1.74
Siemens Feb 2011 -0.99Siemens 0.99
Sterlite Industries ( India ) Feb 2011 -1.25Sterlite Industries ( India ) 1.24
Pesticides
Petroleum Products
Pharmaceuticals
Power
Software
Transportation
DERIVATIVES
MONEY MARKET INSTRUMENT 12.55Certificate of Deposit**P1+
Commercial Paper**A1+
OTHERS 19.66
Cash & Cash EquivalentsFixed DepositUnrated
GRAND TOTAL 100.00
United Phosphorous Feb 2011 -1.21United Phosphorous 1.20
Essar Oil Feb 2011 -0.77Essar Oil 0.77Hindustan Petroleum Corporation Feb 2011 -0.84Hindustan Petroleum Corporation 0.83Reliance Industries Feb 2011 -0.97Reliance Industries 0.97
Orchid Chemicals & Pharmaceuticals Feb 2011 -1.00Orchid Chemicals & Pharmaceuticals 0.99
PTC India Feb 2011 -1.30PTC India 1.29GVK Power & Infrastructure Feb 2011 -1.56GVK Power & Infrastructure 1.55
Firstsource Solutions Feb 2011 -0.50Firstsource Solutions 0.50
Kingfisher Airlines Feb 2011 -0.56Kingfisher Airlines 0.55
NIFTY Index Future Feb 2011 -19.37
Punjab National Bank 2.09
Religare Finvest 10.46
IDBI Bank 1.05Citibank N.A. 1.05IDBI Bank 1.05Citibank N.A. 1.05IDBI Bank 1.05Citibank N.A. 0.53Citibank N.A. 0.53
CBLO / Reverse Repo Investments 12.77Net Receivable/Payable 6.89
Past performance may or may not be sustained in future.The above information is not necessarily indicative of future results and may not necessarily provide a basis for comparison with other investments.Inception Date is August 20, 2009. Since inception returns are calculated on `10/- invested at inceptionReturns shown above are for Growth Option only Performance of the dividend option for the investor would be net of the dividend distribution tax, as applicable. Returns less than one year are absolute and returns equal to or greater than one year are compounded annualized (CAGR).
Source: www.mutualfundsindia.com
NAV as on January 31,2011 ` Per UnitGrowth Option 11.20Dividend Option 11.03
* The Scheme is an equity - oriented scheme. Investors in the Scheme are not being offered any guaranteed / assured returns.
(Returns in %)
(formerly Edelweiss Absolute Return Equity (ARE) Fund).
12
2.75
11.33
8.13
2.02
5.706.56
0
2
4
6
8
10
6 month 1 Year Since inception
Dividend History
0.04%
0.79%
0.82%
1.02%
1.68%
1.72%
2.04%
2.08%
3.37%
5.03%
5.81%
8.05%
9.21%
12.38%
17.45%
28.50%
Industrial Capital Goods
Ferrous Metals
Petroleum Products
Construction
Trading
Industrial Products
Healthcare Services
Oil
Finance
Pharmaceuticals
Construction Project
Diversified
Auto
Consumer Non Durables
Software
Banks
Dividend is declared on the face value of Rs. 10/- per unit. Dividend is paid subject to availability of distributable surplus. After payment of dividend the NAV of the dividend option of the Scheme falls to the extent of the dividend pay out and statutory levy if any. Past Performance may or may not be sustained in the future. 0.165 per unit
Record Date Plan/ Option Name NAV on Record Date (`) Amount of Dividend (`)
28/01/2011 Dividend Plan 11.20
Edelweiss ELSS Fund - Growth
S & P CNX Nifty
Industry Allocation
NAV as on January 31,2011 ` Per Unit
Fund Performance VS Benchmark Index
As on January 31,2011
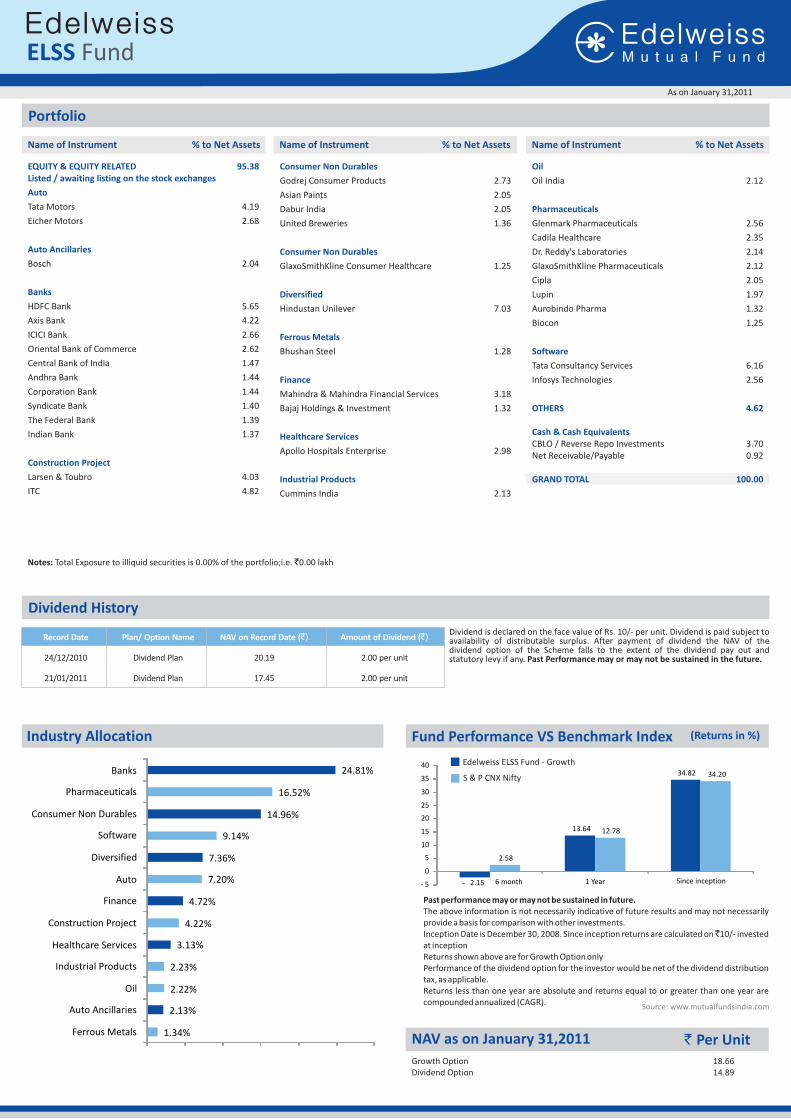
Past performance may or may not be sustained in future.The above information is not necessarily indicative of future results and may not necessarily provide a basis for comparison with other investments.Inception Date is December 30, 2008. Since inception returns are calculated on ̀ 10/- invested at inceptionReturns shown above are for Growth Option onlyPerformance of the dividend option for the investor would be net of the dividend distribution tax, as applicable.Returns less than one year are absolute and returns equal to or greater than one year are compounded annualized (CAGR).
Growth Option 18.66 Dividend Option 14.89
ELSS Fund
Notes: Total Exposure to illiquid securities is 0.00% of the portfolio;i.e. `0.00 lakh
EQUITY & EQUITY RELATED 95.38Listed / awaiting listing on the stock exchanges
Auto
Auto Ancillaries
Banks
Construction Project
Tata Motors 4.19
Eicher Motors 2.68
Bosch 2.04
HDFC Bank 5.65
Axis Bank 4.22
ICICI Bank 2.66
Oriental Bank of Commerce 2.62
Central Bank of India 1.47
Andhra Bank 1.44
Corporation Bank 1.44
Syndicate Bank 1.40
The Federal Bank 1.39
Indian Bank 1.37
Larsen & Toubro 4.03
ITC 4.82
Name of Instrument % to Net Assets Name of Instrument % to Net Assets Name of Instrument % to Net Assets
Consumer Non Durables
Consumer Non Durables
Diversified
Ferrous Metals
Finance
Healthcare Services
Industrial Products
Godrej Consumer Products 2.73
Asian Paints 2.05
Dabur India 2.05
United Breweries 1.36
GlaxoSmithKline Consumer Healthcare 1.25
Hindustan Unilever 7.03
Bhushan Steel 1.28
Mahindra & Mahindra Financial Services 3.18
Bajaj Holdings & Investment 1.32
Apollo Hospitals Enterprise 2.98
Cummins India 2.13
Oil
Pharmaceuticals
Software
OTHERS 4.62
Cash & Cash Equivalents
GRAND TOTAL 100.00
Oil India 2.12
Glenmark Pharmaceuticals 2.56
Cadila Healthcare 2.35
Dr. Reddy's Laboratories 2.14
GlaxoSmithKline Pharmaceuticals 2.12
Cipla 2.05
Lupin 1.97
Aurobindo Pharma 1.32
Biocon 1.25
Tata Consultancy Services 6.16
Infosys Technologies 2.56
CBLO / Reverse Repo Investments 3.70Net Receivable/Payable 0.92
Portfolio
Source: www.mutualfundsindia.com
Dividend History
(Returns in %)
1.34%
2.13%
2.22%
2.23%
3.13%
4.22%
4.72%
7.20%
7.36%
9.14%
14.96%
16.52%
24.81%
Ferrous Metals
Auto Ancillaries
Oil
Industrial Products
Healthcare Services
Construction Project
Finance
Auto
Diversified
Software
Consumer Non Durables
Pharmaceuticals
Banks
- 2.15
13.64
34.82
2.58
12.78
34.20
- 5
0
5
10
15
20
25
30
35
40
6 month 1 Year Since inception
Dividend is declared on the face value of Rs. 10/- per unit. Dividend is paid subject to availability of distributable surplus. After payment of dividend the NAV of the dividend option of the Scheme falls to the extent of the dividend pay out and statutory levy if any. Past Performance may or may not be sustained in the future. 2.00 per unit
2.00 per unit
Record Date Plan/ Option Name NAV on Record Date (`) Amount of Dividend (`)
24/12/2010 Dividend Plan 20.19
21/01/2011 Dividend Plan 17.45
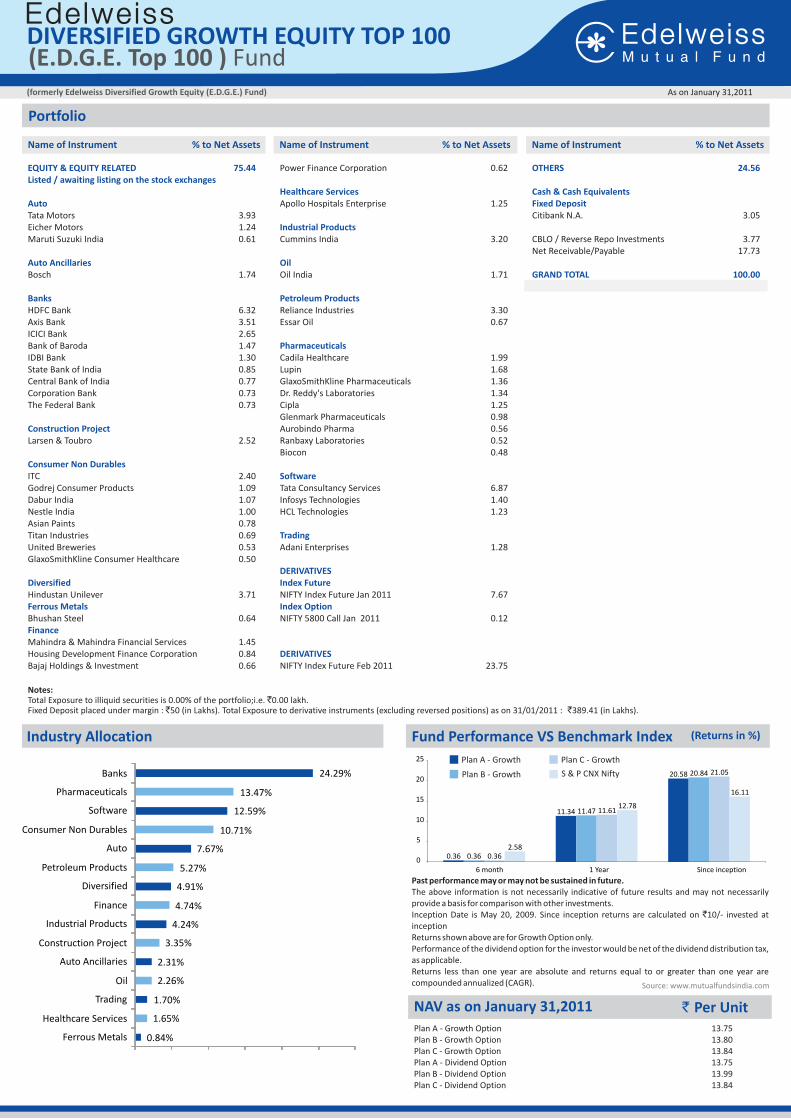
Notes:Total Exposure to illiquid securities is 0.00% of the portfolio;i.e. `0.00 lakh. Fixed Deposit placed under margin : `50 (in Lakhs). Total Exposure to derivative instruments (excluding reversed positions) as on 31/01/2011 : `389.41 (in Lakhs).
EQUITY & EQUITY RELATED 75.44Listed / awaiting listing on the stock exchanges
Auto
Auto Ancillaries
Banks
Construction Project
Consumer Non Durables
Diversified
Ferrous Metals
Finance
Tata Motors 3.93Eicher Motors 1.24Maruti Suzuki India 0.61
Bosch 1.74
HDFC Bank 6.32Axis Bank 3.51ICICI Bank 2.65Bank of Baroda 1.47IDBI Bank 1.30State Bank of India 0.85Central Bank of India 0.77Corporation Bank 0.73The Federal Bank 0.73
Larsen & Toubro 2.52
ITC 2.40Godrej Consumer Products 1.09Dabur India 1.07Nestle India 1.00Asian Paints 0.78Titan Industries 0.69United Breweries 0.53GlaxoSmithKline Consumer Healthcare 0.50
Hindustan Unilever 3.71
Bhushan Steel 0.64
Mahindra & Mahindra Financial Services 1.45Housing Development Finance Corporation 0.84Bajaj Holdings & Investment 0.66
Name of Instrument % to Net Assets Name of Instrument % to Net Assets Name of Instrument % to Net Assets
Power Finance Corporation 0.62
Apollo Hospitals Enterprise 1.25
Cummins India 3.20
Oil India 1.71
Reliance Industries 3.30Essar Oil 0.67
Cadila Healthcare 1.99Lupin 1.68GlaxoSmithKline Pharmaceuticals 1.36Dr. Reddy's Laboratories 1.34Cipla 1.25Glenmark Pharmaceuticals 0.98Aurobindo Pharma 0.56Ranbaxy Laboratories 0.52Biocon 0.48
Tata Consultancy Services 6.87Infosys Technologies 1.40HCL Technologies 1.23
Adani Enterprises 1.28
NIFTY Index Future Jan 2011 7.67
NIFTY 5800 Call Jan 2011 0.12
NIFTY Index Future Feb 2011 23.75
Healthcare Services
Industrial Products
Oil
Petroleum Products
Pharmaceuticals
Software
Trading
DERIVATIVESIndex Future
Index Option
DERIVATIVES
OTHERS 24.56
Cash & Cash EquivalentsFixed Deposit
GRAND TOTAL 100.00
Citibank N.A. 3.05
CBLO / Reverse Repo Investments 3.77Net Receivable/Payable 17.73
Portfolio
As on January 31,2011(formerly Edelweiss Diversified Growth Equity (E.D.G.E.) Fund)
NAV as on January 31,2011 ` Per Unit
Plan A - Growth
Plan B - Growth
Plan C - Growth
S & P CNX Nifty
Fund Performance VS Benchmark Index
Plan A - Growth Option 13.75Plan B - Growth Option 13.80Plan C - Growth Option 13.84Plan A - Dividend Option 13.75Plan B - Dividend Option 13.99Plan C - Dividend Option 13.84
Industry Allocation
DIVERSIFIED GROWTH EQUITY TOP 100 (E.D.G.E. Top 100 ) Fund
(Returns in %)
0.84%
1.65%
1.70%
2.26%
2.31%
3.35%
4.24%
4.74%
4.91%
5.27%
7.67%
10.71%
12.59%
13.47%
24.29%
Ferrous Metals
Healthcare Services
Trading
Oil
Auto Ancillaries
Construction Project
Industrial Products
Finance
Diversified
Petroleum Products
Auto
Consumer Non Durables
Software
Pharmaceuticals
Banks
Past performance may or may not be sustained in future.The above information is not necessarily indicative of future results and may not necessarily provide a basis for comparison with other investments.Inception Date is May 20, 2009. Since inception returns are calculated on `10/- invested at inceptionReturns shown above are for Growth Option only.Performance of the dividend option for the investor would be net of the dividend distribution tax, as applicable.Returns less than one year are absolute and returns equal to or greater than one year are compounded annualized (CAGR). Source: www.mutualfundsindia.com
0.36
11.34
20.58
0.36
11.47
20.84
0.36
11.61
21.05
2.58
12.78
16.11
0
5
10
15
20
25
6 month 1 Year Since inception
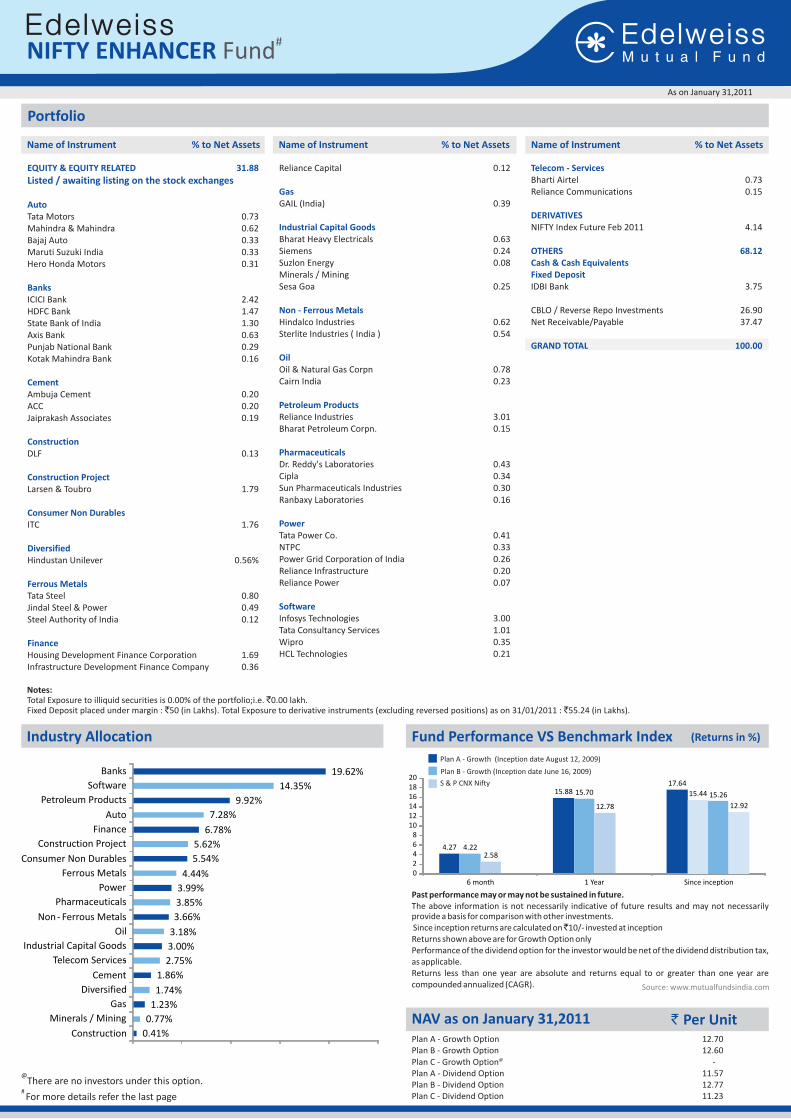
Notes:Total Exposure to illiquid securities is 0.00% of the portfolio;i.e. `0.00 lakh.Fixed Deposit placed under margin : `50 (in Lakhs). Total Exposure to derivative instruments (excluding reversed positions) as on 31/01/2011 : `55.24 (in Lakhs).
Portfolio
EQUITY & EQUITY RELATED 31.88
Listed / awaiting listing on the stock exchanges
Auto
Banks
Cement
Construction
Construction Project
Consumer Non Durables
Diversified
Ferrous Metals
Finance
Tata Motors 0.73Mahindra & Mahindra 0.62Bajaj Auto 0.33Maruti Suzuki India 0.33Hero Honda Motors 0.31
ICICI Bank 2.42HDFC Bank 1.47State Bank of India 1.30Axis Bank 0.63Punjab National Bank 0.29Kotak Mahindra Bank 0.16
Ambuja Cement 0.20ACC 0.20Jaiprakash Associates 0.19
DLF 0.13
Larsen & Toubro 1.79
ITC 1.76
Hindustan Unilever 0.56%
Tata Steel 0.80Jindal Steel & Power 0.49Steel Authority of India 0.12
Housing Development Finance Corporation 1.69Infrastructure Development Finance Company 0.36
Name of Instrument % to Net Assets Name of Instrument % to Net Assets Name of Instrument % to Net Assets
Reliance Capital 0.12
GAIL (India) 0.39
Bharat Heavy Electricals 0.63Siemens 0.24Suzlon Energy 0.08Minerals / MiningSesa Goa 0.25
Hindalco Industries 0.62Sterlite Industries ( India ) 0.54
Oil & Natural Gas Corpn 0.78Cairn India 0.23
Reliance Industries 3.01Bharat Petroleum Corpn. 0.15
Dr. Reddy's Laboratories 0.43Cipla 0.34Sun Pharmaceuticals Industries 0.30Ranbaxy Laboratories 0.16
Tata Power Co. 0.41NTPC 0.33Power Grid Corporation of India 0.26Reliance Infrastructure 0.20Reliance Power 0.07
Infosys Technologies 3.00Tata Consultancy Services 1.01Wipro 0.35HCL Technologies 0.21
Gas
Industrial Capital Goods
Non - Ferrous Metals
Oil
Petroleum Products
Pharmaceuticals
Power
Software
Telecom - Services
DERIVATIVES
OTHERS 68.12Cash & Cash EquivalentsFixed Deposit
GRAND TOTAL 100.00
Bharti Airtel 0.73Reliance Communications 0.15
NIFTY Index Future Feb 2011 4.14
IDBI Bank 3.75
CBLO / Reverse Repo Investments 26.90Net Receivable/Payable 37.47
As on January 31,2011
NIFTY ENHANCER #Fund
Industry Allocation
Plan A - Growth (Inception date August 12, 2009)
Plan B - Growth (Inception date June 16, 2009)
S & P CNX Nifty
Fund Performance VS Benchmark Index
NAV as on January 31,2011 ` Per UnitPlan A - Growth Option 12.70Plan B - Growth Option 12.60
@Plan C - Growth Option -Plan A - Dividend Option 11.57Plan B - Dividend Option 12.77Plan C - Dividend Option 11.23
Past performance may or may not be sustained in future.The above information is not necessarily indicative of future results and may not necessarily provide a basis for comparison with other investments. Since inception returns are calculated on ̀ 10/- invested at inceptionReturns shown above are for Growth Option only Performance of the dividend option for the investor would be net of the dividend distribution tax, as applicable.Returns less than one year are absolute and returns equal to or greater than one year are compounded annualized (CAGR). Source: www.mutualfundsindia.com
@There are no investors under this option.
# For more details refer the last page
(Returns in %)
0.41%
0.77%
1.23%
1.74%
1.86%
2.75%
3.00%
3.18%
3.66%
3.85%
3.99%
4.44%
5.54%
5.62%
6.78%
7.28%
9.92%
14.35%
19.62%
Construction
Minerals / Mining
Gas
Diversified
Cement
Telecom -Services
Industrial Capital Goods
Oil
Non - Ferrous Metals
Pharmaceuticals
Power
Ferrous Metals
Consumer Non Durables
Construction Project
Finance
Auto
Petroleum Products
Software
Banks
4.27
15.8817.64
4.22
15.70
2.58
12.78
02468
101214161820
6 month 1 Year Since inception
12.92
15.44 15.26
Cash & Cash EquivalentSOV
Asset Allocation
Portfolio
Cash & Cash Equivalents
GRAND TOTAL 100.00
CBLO / Reverse Repo Investments 99.82Net Receivable/Payable 0.18
Name of Instrument % to Net Assets
As on January 31,2011
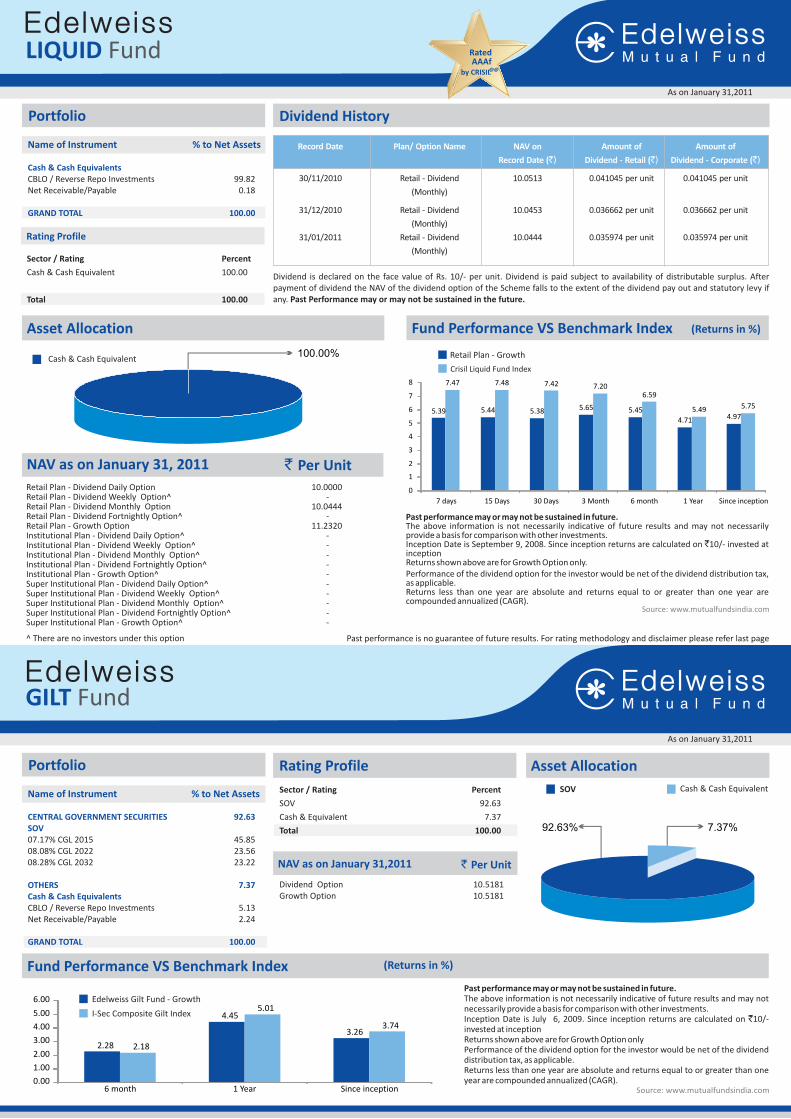
Dividend is declared on the face value of Rs. 10/- per unit. Dividend is paid subject to availability of distributable surplus. After payment of dividend the NAV of the dividend option of the Scheme falls to the extent of the dividend pay out and statutory levy if any. Past Performance may or may not be sustained in the future.
LIQUID Fund
Sector / Rating Percent
Cash & Cash Equivalent 100.00
Total 100.00
Rating Profile
Dividend History
Asset Allocation
Cash & Cash Equivalent
NAV as on January 31, 2011 ` Per Unit
^ There are no investors under this option
Fund Performance VS Benchmark Index
Retail Plan - Growth
Crisil Liquid Fund Index
Past performance may or may not be sustained in future.The above information is not necessarily indicative of future results and may not necessarily provide a basis for comparison with other investments.Inception Date is September 9, 2008. Since inception returns are calculated on `10/- invested at inceptionReturns shown above are for Growth Option only.Performance of the dividend option for the investor would be net of the dividend distribution tax, as applicable.Returns less than one year are absolute and returns equal to or greater than one year are compounded annualized (CAGR).
Source: www.mutualfundsindia.com
100.00%
(Returns in %)
0.041045 per unit 0.041045 per unit
10.0453 0.036662 per unit 0.036662 per unit
0.035974 per unit 0.035974 per unit
Record Date Plan/ Option Name NAV on Amount of Amount of
Record Date (`) Dividend - Retail (`) Dividend - Corporate (`)
30/11/2010 Retail - Dividend 10.0513
(Monthly)
31/12/2010 Retail - Dividend
(Monthly)
31/01/2011 Retail - Dividend 10.0444
(Monthly)
NAV as on January 31,2011 ` Per Unit
Dividend Option 10.5181 Growth Option 10.5181
Portfolio
Name of Instrument % to Net Assets
CENTRAL GOVERNMENT SECURITIES 92.63SOV
OTHERS 7.37Cash & Cash Equivalents
GRAND TOTAL 100.00
07.17% CGL 2015 45.8508.08% CGL 2022 23.5608.28% CGL 2032 23.22
CBLO / Reverse Repo Investments 5.13Net Receivable/Payable 2.24
Rating Profile
Sector / Rating Percent
SOV 92.63
Cash & Equivalent 7.37
Total 100.00
Fund Performance VS Benchmark Index
Edelweiss Gilt Fund - Growth
I-Sec Composite Gilt Index
(Returns in %)
Past performance may or may not be sustained in future.The above information is not necessarily indicative of future results and may not necessarily provide a basis for comparison with other investments.Inception Date is July 6, 2009. Since inception returns are calculated on `10/- invested at inceptionReturns shown above are for Growth Option onlyPerformance of the dividend option for the investor would be net of the dividend distribution tax, as applicable.Returns less than one year are absolute and returns equal to or greater than one year are compounded annualized (CAGR).
As on January 31,2011
GILT Fund
Source: www.mutualfundsindia.com
Rated AAAf
@@by CRISIL
92.63% 7.37%
5.39 5.44 5.38 5.65 5.45
4.71 4.97
7.47 7.48 7.42 7.206.59
5.49 5.75
0
1
2
3
4
5
6
7
8
7 days 15 Days 30 Days 3 Month 6 month 1 Year Since inception
2.28
4.45
3.26
2.18
5.01
3.74
0.00
1.00
2.00
3.00
4.00
5.00
6.00
6 month 1 Year Since inception
Retail Plan - Dividend Daily Option 10.0000Retail Plan - Dividend Weekly Option^ -Retail Plan - Dividend Monthly OptionRetail Plan - Dividend Fortnightly Option^ -Retail Plan - Growth OptionInstitutional Plan - Dividend Daily Option^ -Institutional Plan - Dividend Weekly Option^ -Institutional Plan - Dividend Monthly Option^ -Institutional Plan - Dividend Fortnightly Option^ - Institutional Plan - Growth Option^ -Super Institutional Plan - Dividend Daily Option^ -Super Institutional Plan - Dividend Weekly Option^ -Super Institutional Plan - Dividend Monthly Option^ -Super Institutional Plan - Dividend Fortnightly Option^ - Super Institutional Plan - Growth Option^ -
10.0444
11.2320
Past performance is no guarantee of future results. For rating methodology and disclaimer please refer last page
All corporate ratings are assigned by rating agencies like CRISIL, CARE, ICRA, FITCH.**Thinly traded/Non traded securities and illiquid securities as defined in SEBI Regulations and Guidelines.
Portfolio
Name of Instrument % to Net Assets
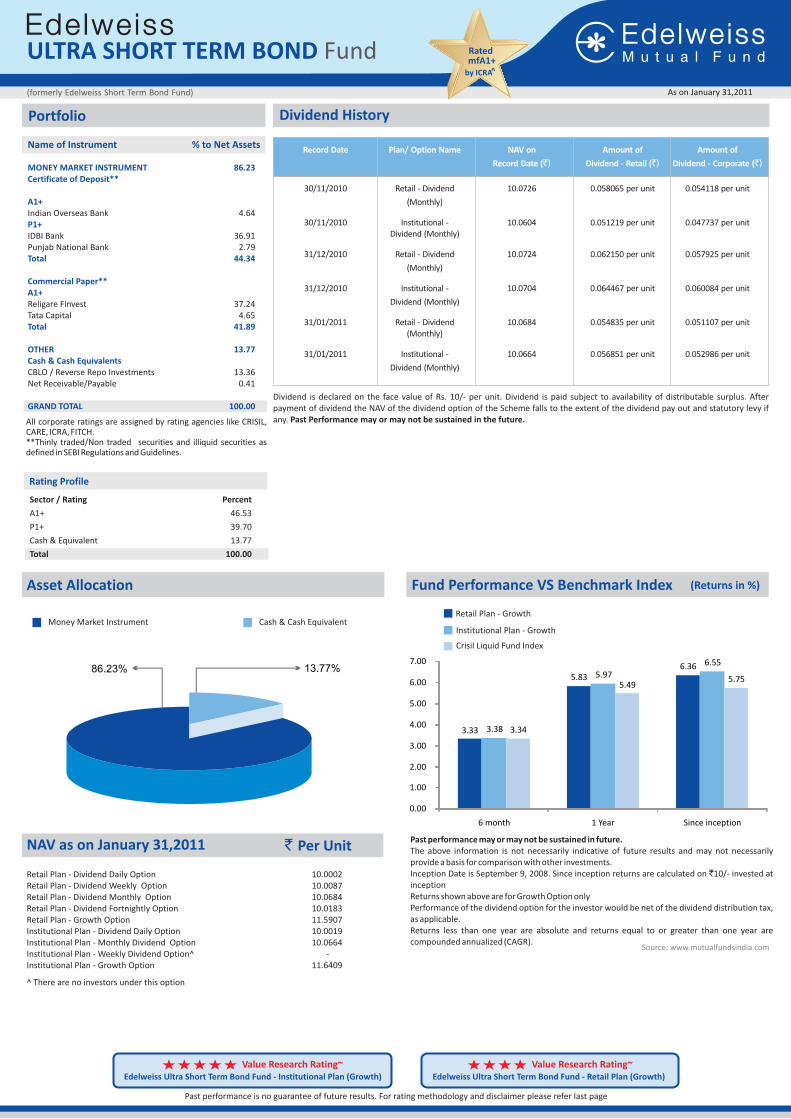
0.058065 per unit 0.054118 per unit
0.051219 per unit 0.047737 per unit
0.062150 per unit 0.057925 per unit
0.064467 per unit 0.060084 per unit
0.054835 per unit 0.051107 per unit
0.056851 per unit 0.052986 per unit
Record Date Plan/ Option Name NAV on Amount of Amount of
Record Date (`) Dividend - Retail (`) Dividend - Corporate (`)
30/11/2010 Retail - Dividend 10.0726
(Monthly)
30/11/2010 Institutional - 10.0604Dividend (Monthly)
31/12/2010 Retail - Dividend 10.0724
(Monthly)
31/12/2010 Institutional - 10.0704
Dividend (Monthly)
31/01/2011 Retail - Dividend 10.0684(Monthly)
31/01/2011 Institutional - 10.0664
Dividend (Monthly)
Dividend is declared on the face value of Rs. 10/- per unit. Dividend is paid subject to availability of distributable surplus. After payment of dividend the NAV of the dividend option of the Scheme falls to the extent of the dividend pay out and statutory levy if any. Past Performance may or may not be sustained in the future.
Dividend History
Asset Allocation
Money Market Instrument
Fund Performance VS Benchmark Index
Past performance may or may not be sustained in future.The above information is not necessarily indicative of future results and may not necessarily provide a basis for comparison with other investments.Inception Date is September 9, 2008. Since inception returns are calculated on `10/- invested at inceptionReturns shown above are for Growth Option onlyPerformance of the dividend option for the investor would be net of the dividend distribution tax, as applicable.Returns less than one year are absolute and returns equal to or greater than one year are compounded annualized (CAGR).
Source: www.mutualfundsindia.com
As on January 31,2011(formerly Edelweiss )Short Term Bond Fund
ULTRA SHORT TERM BOND Fund
MONEY MARKET INSTRUMENT 86.23Certificate of Deposit**
A1+
P1+
Total 44.34
Commercial Paper**A1+
Total 41.89
OTHER 13.77Cash & Cash Equivalents
GRAND TOTAL 100.00
Indian Overseas Bank 4.64
IDBI Bank 36.91Punjab National Bank 2.79
Religare Finvest 37.24Tata Capital 4.65
CBLO / Reverse Repo Investments 13.36Net Receivable/Payable 0.41
Sector / Rating Percent
A1+ 46.53
P1+ 39.70
Cash & Equivalent 13.77
Total 100.00
Rating Profile
NAV as on January 31,2011 ` Per Unit
Retail Plan - Dividend Daily Option 10.0002Retail Plan - Dividend Weekly Option 10.0087 Retail Plan - Dividend Monthly Option 10.0684 Retail Plan - Dividend Fortnightly Option 10.0183Retail Plan - Growth Option 11.5907 Institutional Plan - Dividend Daily Option 10.0019Institutional Plan - Monthly Dividend Option 10.0664Institutional Plan - Weekly Dividend Option^ -Institutional Plan - Growth Option 11.6409
Retail Plan - Growth
Institutional Plan - Growth
Crisil Liquid Fund Index
Cash & Cash Equivalent
(Returns in %)
Edelweiss Ultra Short Term Bond Fund - Institutional Plan (Growth)
Value Research Rating~Edelweiss Ultra Short Term Bond Fund - Retail Plan (Growth)
Value Research Rating~
Past performance is no guarantee of future results. For rating methodology and disclaimer please refer last page
86.23% 13.77%
3.33
5.836.36
3.38
5.97
6.55
3.34
5.495.75
0.00
1.00
2.00
3.00
4.00
5.00
6.00
7.00
6 month 1 Year Since inception
Rated mfA1+
^by ICRA
^ There are no investors under this option
Fund Performance VS Benchmark Index (Returns in %)
Asset AllocationSector / Rating Percent
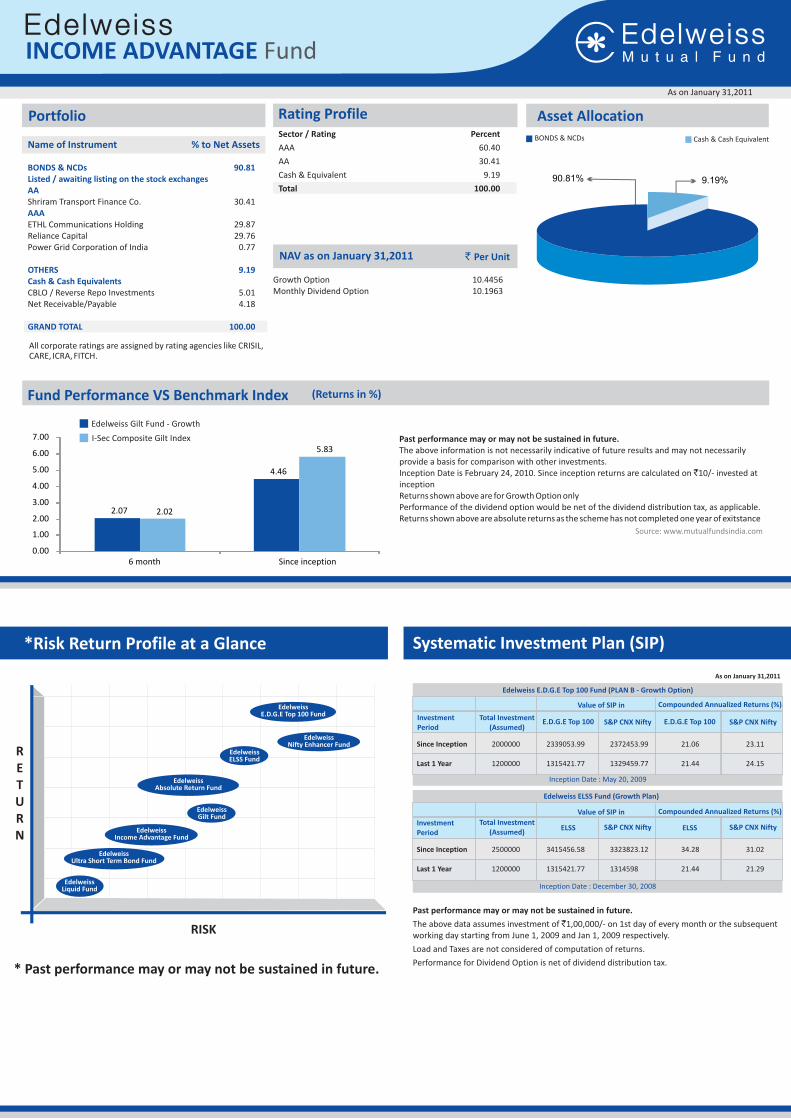
AAA 60.40
AA 30.41
Cash & Equivalent 9.19
Total 100.00
Rating Profile
NAV as on January 31,2011 ` Per Unit
All corporate ratings are assigned by rating agencies like CRISIL, CARE, ICRA, FITCH.
Portfolio
Name of Instrument % to Net Assets
Past performance may or may not be sustained in future.The above information is not necessarily indicative of future results and may not necessarily provide a basis for comparison with other investments.Inception Date is February 24, 2010. Since inception returns are calculated on `10/- invested at inceptionReturns shown above are for Growth Option onlyPerformance of the dividend option would be net of the dividend distribution tax, as applicable.Returns shown above are absolute returns as the scheme has not completed one year of exitstance
Source: www.mutualfundsindia.com
Growth Option 10.4456 Monthly Dividend Option 10.1963
As on January 31,2011
INCOME ADVANTAGE Fund
BONDS & NCDs 90.81Listed / awaiting listing on the stock exchangesAA
AAA
OTHERS 9.19Cash & Cash Equivalents
GRAND TOTAL 100.00
Shriram Transport Finance Co. 30.41
ETHL Communications Holding 29.87Reliance Capital 29.76Power Grid Corporation of India 0.77
CBLO / Reverse Repo Investments 5.01Net Receivable/Payable 4.18
Edelweiss Gilt Fund - Growth
I-Sec Composite Gilt Index
BONDS & NCDs Cash & Cash Equivalent
*Risk Return Profile at a Glance
RETURN
RISK
EdelweissLiquid Fund
NIFTY ENHANCER
EdelweissAbsolute Return Fund
EdelweissGilt Fund
EdelweissIncome Advantage Fund
EdelweissUltra Short Term Bond Fund
EdelweissELSS Fund
EdelweissE.D.G.E Top 100 Fund
EdelweissNifty Enhancer Fund
* Past performance may or may not be sustained in future.
90.81% 9.19%
2.07
4.46
2.02
5.83
0.00
1.00
2.00
3.00
4.00
5.00
6.00
7.00
6 month Since inception
Systematic Investment Plan (SIP)
Past performance may or may not be sustained in future.
The above data assumes investment of `1,00,000/- on 1st day of every month or the subsequent working day starting from June 1, 2009 and Jan 1, 2009 respectively.
Load and Taxes are not considered of computation of returns.
Performance for Dividend Option is net of dividend distribution tax.
Edelweiss ELSS Fund (Growth Plan)
S&P CNX NiftyELSS
Value of SIP in
Investment Period
Total Investment(Assumed)
Inception Date : December 30, 2008
Since Inception 2000000 2339053.99 2372453.99 21.06 23.11
Last 1 Year 1200000 1315421.77 1329459.77 21.44 24.15
Edelweiss E.D.G.E Top 100 Fund (PLAN B - Growth Option)
S&P CNX NiftyE.D.G.E Top 100
Value of SIP in
Investment Period
Total Investment(Assumed)
Inception Date : May 20, 2009
S&P CNX Nifty
Compounded Annualized Returns (%)
ELSS
S&P CNX NiftyE.D.G.E Top 100
Compounded Annualized Returns (%)
As on January 31,2011
Since Inception 2500000 3415456.58 3323823.12 34.28 31.02
Last 1 Year 1200000 1315421.77 1314598 21.44 21.29
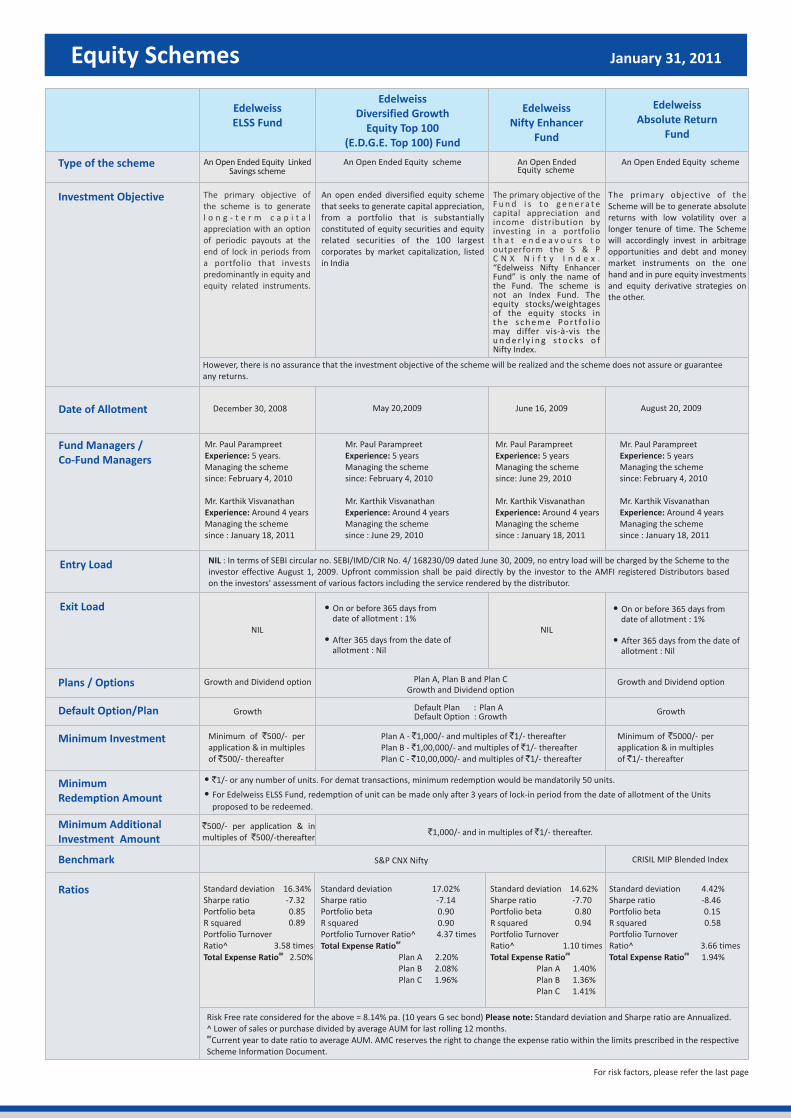
Investment Objective
Type of the scheme
Fund Managers /Co-Fund Managers
Entry Load
Exit Load
Plans / Options
Minimum Investment
Minimum Redemption Amount
Benchmark
Ratios
An Open Ended Equity scheme
An Open Ended Equity scheme
The primary objective of the scheme is to generate l o n g - t e r m c a p i t a l appreciation with an option of periodic payouts at the end of lock in periods from a portfolio that invests predominantly in equity and equity related instruments.
An open ended diversified equity scheme that seeks to generate capital appreciation, from a portfolio that is substantially constituted of equity securities and equity related securities of the 100 largest corporates by market capitalization, listed in India
The primary objective of the Scheme will be to generate absolute returns with low volatility over a longer tenure of time. The Scheme will accordingly invest in arbitrage opportunities and debt and money market instruments on the one hand and in pure equity investments and equity derivative strategies on the other.
Edelweiss Diversified Growth
Equity Top 100 (E.D.G.E. Top 100) Fund
Edelweiss Absolute Return
Fund
Edelweiss Nifty Enhancer
Fund
Edelweiss ELSS Fund
NIL : In terms of SEBI circular no. SEBI/IMD/CIR No. 4/ 168230/09 dated June 30, 2009, no entry load will be charged by the Scheme to theinvestor effective August 1, 2009. Upfront commission shall be paid directly by the investor to the AMFI registered Distributors based on the investors' assessment of various factors including the service rendered by the distributor.
Growth and Dividend option Growth and Dividend optionPlan A, Plan B and Plan CGrowth and Dividend option
Minimum of `500/- per application & in multiples of `500/- thereafter
•
• For Edelweiss ELSS Fund, redemption of unit can be made only after
`1/- or any number of units. For demat transactions, minimum redemption would be mandatorily 50 units.
3 years of lock-in period from the date of allotment of the Units
proposed to be redeemed.
Plan A - `1,000/- and multiples of `1/- thereafter Plan B - `1,00,000/- and multiples of `1/- thereafterPlan C - `10,00,000/- and multiples of `1/- thereafter
Minimum of `5000/- per application & in multiples of `1/- thereafter
CRISIL MIP Blended IndexS&P CNX Nifty
Standard deviation 4.42%Sharpe ratio -8.46Portfolio beta 0.15R squared 0.58Portfolio Turnover Ratio^ 3.66 times
##Total Expense Ratio 1.94%
Standard deviation 17.02%Sharpe ratio -7.14Portfolio beta 0.90R squared 0.90Portfolio Turnover Ratio^ 4.37 times
##Total Expense Ratio Plan A 2.20% Plan B 2.08% Plan C 1.96%
Standard deviation 14.62%Sharpe ratio -7.70Portfolio beta 0.80R squared 0.94Portfolio Turnover Ratio^ 1.10 times
##Total Expense Ratio Plan A 1.40% Plan B 1.36% Plan C 1.41%
Standard deviation 16.34%Sharpe ratio -7.32Portfolio beta 0.85R squared 0.89
Portfolio Turnover Ratio^ 3.58 times
##Total Expense Ratio 2.50%
An Open Ended Equity schemeAn Open Ended Equity Linked Savings scheme
NILNIL
• On or before 365 days from date of allotment : 1%
• After 365 days from the date of allotment : Nil
• On or before 365 days from date of allotment : 1%
• After 365 days from the date of allotment : Nil
The primary objective of theF u n d i s t o g e n e r a t e capital appreciation and income distribution by investing in a portfolio t h a t e n d e a v o u r s t o outperform the S & P C N X N i f t y I n d e x .
“Edelweiss Nifty Enhancer Fund” is only the name of the Fund. The scheme is not an Index Fund. The equity stocks/weightages of the equity stocks in t h e s c h e m e Po r t fo l i omay differ vis-à-vis the u n d e r l y i n g s t o c k s o f Nifty Index.
However, there is no assurance that the investment objective of the scheme will be realized and the scheme does not assure or guarantee any returns.
Equity Schemes January 31, 2011
Risk Free rate considered for the above = 8.14% pa. (10 years G sec bond) Please note: Standard deviation and Sharpe ratio are Annualized.^ Lower of sales or purchase divided by average AUM for last rolling 12 months. ##Current year to date ratio to average AUM. AMC reserves the right to change the expense ratio within the limits prescribed in the respective Scheme Information Document.
Default Option/Plan Default Plan : Plan ADefault Option : Growth
Minimum Additional Investment Amount
`500/- per application & inmultiples of `500/-thereafter
` `1,000/- and in multiples of 1/- thereafter.
For risk factors, please refer the last page
Date of Allotment December 30, 2008 May 20,2009 June 16, 2009 August 20, 2009
Growth Growth
Mr. Paul Parampreet Experience: 5 years Managing the scheme since: February 4, 2010
Mr. Karthik VisvanathanExperience: Around 4 years Managing the scheme since : January 18, 2011
Mr. Paul Parampreet Experience: 5 years Managing the scheme since: February 4, 2010
Mr. Karthik VisvanathanExperience: Around 4 years Managing the scheme since : June 29, 2010
Mr. Paul Parampreet Experience: 5 years Managing the schemesince: June 29, 2010
Mr. Karthik VisvanathanExperience: Around 4 years Managing the scheme since : January 18, 2011
Mr. Paul Parampreet Experience: 5 years. Managing the schemesince: February 4, 2010
Mr. Karthik VisvanathanExperience: Around 4 years Managing the scheme since : January 18, 2011
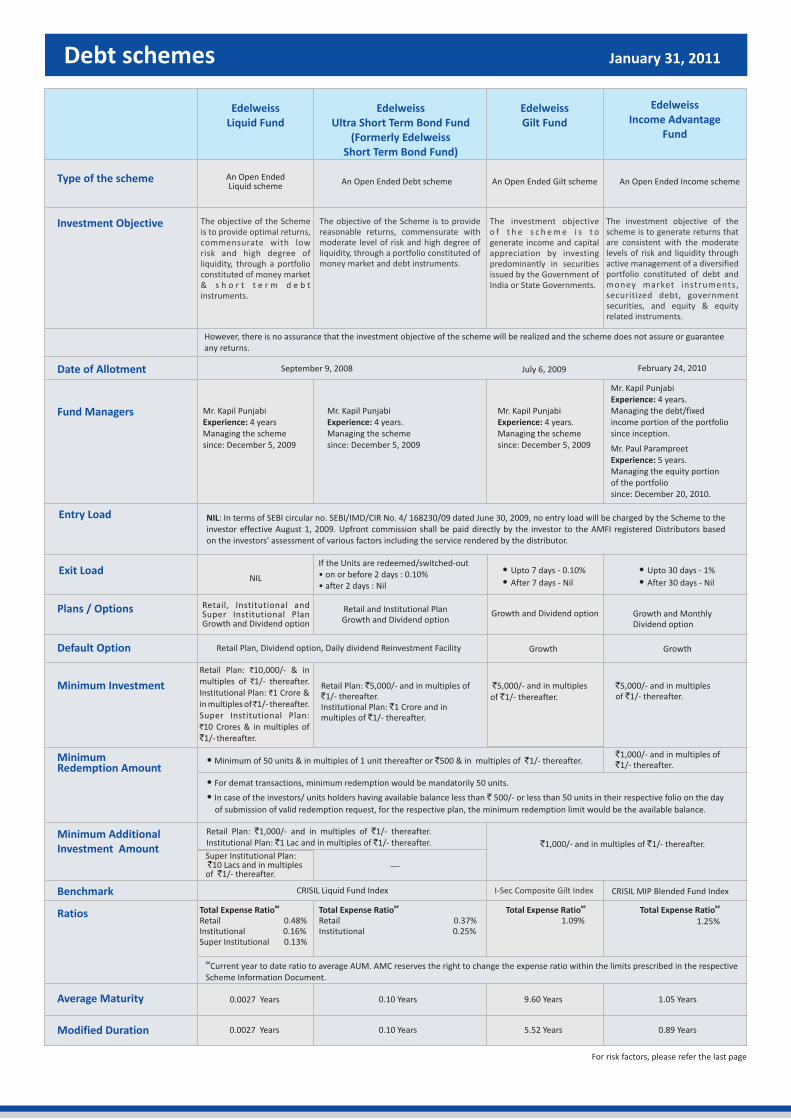
Debt schemes January 31, 2011
Investment Objective
Type of the scheme
Fund Managers
Entry Load
Exit Load
Plans / Options
Minimum Investment
Minimum Redemption Amount
Benchmark
Ratios
Average Maturity
Modified Duration
An Open Ended Gilt scheme An Open Ended Income scheme
The objective of the Scheme is to providereasonable returns, commensurate with moderate level of risk and high degree of liquidity, through a portfolio constituted of money market and debt instruments.
The investment objective o f t h e s c h e m e i s t o generate income and capital appreciation by investing predominantly in securities issued by the Government ofIndia or State Governments.
Edelweiss Ultra Short Term Bond Fund
(Formerly Edelweiss Short Term Bond Fund)
Edelweiss Income Advantage
Fund
Edelweiss Gilt Fund
Edelweiss Liquid Fund
Mr. Kapil Punjabi Experience: 4 years.Managing the debt/fixed income portion of the portfolio since inception.
Mr. Paul Parampreet Experience: 5 years. Managing the equity portion of the portfoliosince: December 20, 2010.
Mr. Kapil Punjabi Experience: 4 years. Managing the scheme since: December 5, 2009
Mr. Kapil Punjabi Experience: 4 years Managing the scheme since: December 5, 2009
NIL: In terms of SEBI circular no. SEBI/IMD/CIR No. 4/ 168230/09 dated June 30, 2009, no entry load will be charged by the Scheme to theinvestor effective August 1, 2009. Upfront commission shall be paid directly by the investor to the AMFI registered Distributors based on the investors' assessment of various factors including the service rendered by the distributor.
If the Units are redeemed/switched-out • on or before 2 days : 0.10%• after 2 days : Nil
Retail, Institutional and Super Institutional PlanGrowth and Dividend option
Growth and Monthly Dividend option
Growth and Dividend option
Retail Plan: `10,000/- & in multiples of `1/- thereafter.Institutional Plan: `1 Crore & in multiples of ̀ 1/- thereafter. Super Institutional Plan: `10 Crores & in multiples of `1/- thereafter.
Retail Plan: `5,000/- and in multiples of `1/- thereafter.Institutional Plan: `1 Crore and inmultiples of `1/- thereafter.
`5,000/- and in multiples of `1/- thereafter.
• Minimum of 50 units & in multiples of 1 unit thereafter or `500 & in multiples of `1/- thereafter.
• For demat transactions, minimum redemption would be mandatorily 50 units.
• In case of the investors/ units holders having available balance less than ` 500/- or less than 50 units in their respective folio on the day
of submission of valid redemption request, for the respective plan, the minimum redemption limit would be the available balance.
I-Sec Composite Gilt Index
##Total Expense Ratio 1.25%
##Total Expense Ratio Retail 0.37%Institutional 0.25%
##Total Expense Ratio 1.09%
##Total Expense RatioRetail 0.48%Institutional 0.16%Super Institutional 0.13%
An Open Ended Debt scheme An Open Ended Liquid scheme
The objective of the Schemeis to provide optimal returns, commensurate with low risk and high degree of liquidity, through a portfolio constituted of money market& s h o r t t e r m d e b t instruments.
The investment objective of the scheme is to generate returns that are consistent with the moderate levels of risk and liquidity through active management of a diversified portfolio constituted of debt and money market instruments, securitized debt, governmentsecurities, and equity & equity related instruments.
Mr. Kapil Punjabi Experience: 4 years. Managing the scheme since: December 5, 2009
NIL• Upto 30 days - 1%
• After 30 days - Nil
Retail and Institutional PlanGrowth and Dividend option
`5,000/- and in multiples of `1/- thereafter.
CRISIL Liquid Fund Index CRISIL MIP Blended Fund Index
However, there is no assurance that the investment objective of the scheme will be realized and the scheme does not assure or guarantee any returns.
• Upto 7 days - 0.10%
• After 7 days - Nil
0.10 Years
0.10 Years
0.0027 Years
0.0027 Years
9.60 Years
5.52 Years
1.05 Years
0.89 Years
##Current year to date ratio to average AUM. AMC reserves the right to change the expense ratio within the limits prescribed in the respective Scheme Information Document.
Default Option Growth Growth
Minimum Additional Investment Amount ` `1,000/- and in multiples of 1/- thereafter.
Retail Plan: `1,000/- and in multiples of `1/- thereafter.Institutional Plan: `1 Lac and in multiples of `1/- thereafter.
Super Institutional Plan: `10 Lacs and in multiples of `1/- thereafter.
Date of Allotment September 9, 2008 February 24, 2010July 6, 2009
Retail Plan, Dividend option, Daily dividend Reinvestment Facility
`1,000/- and in multiples of `1/- thereafter.
For risk factors, please refer the last page
Investor Service Centers & Risk Factors
All Mutual Fund and securities investments are subject to market risk and there can be no assurance that the schemes’ objectives will be achieved. As with any investment in securities, the NAV of the Units issued under the Scheme can go up or down depending on the factors and forces affecting the capital markets. The name of the schemes does not in any manner indicate either the quality of the scheme, its future prospects and return. Past performance of the Sponsor and their Affiliates/AMC/Mutual Fund & its Scheme(s) does not indicate the future performance of the Scheme and may not necessarily provide a basis of comparison with other investments. Investment in Mutual Fund Units involves investment risks such as trading volumes, settlement risk, liquidity risk, default risk including the possible loss of principal and uncertainty of dividend distribution. As the price / value / interest rates of the securities in which the scheme invests fluctuates, the value of your investment in the scheme may go up or down. Investors are not being offered any guaranteed / assured returns under any scheme of Edelweiss Mutual Fund.
Edelweiss Mutual Fund is set up as a Trust under the Indian Trusts Act, 1882 by Edelweiss Capital Limited. Sponsor: Edelweiss Capital Limited (ECL)(liability restricted to initial contribution of `1 Lac).Trustee: Edelweiss Trusteeship Company Limited (ETCL), a Company registered under the Companies Act, 1956 Investment Manager: Edelweiss Asset Management Limited (EAML), a Company registered under the Companies Act, 1956.Copy of the Statement of Additional Information (SAI) / Scheme Information Document (SID) and Key Information Memorandum (KIM) can be obtained from any of our Investor Services Centers as well as from our website www.edelweissmf.com. Mutual Fund investments are subject to market risks. Please read the Statement of Additional Information (SAI) & Scheme Information Document (SID) of the respective schemes carefully before investing.
: The view of the fund managers should not be construed as advice. Investors must make their own investment decisions based on their specific investment objectives and financial positions and using such AMFI qualified advisors as may be necessary. Opinions expressed in various articles are not necessarily those of Edelweiss Asset Management Limited (EAML) or any of its Directors, Officers, Employees and personnel. Consequently, the Edelweiss Asset Management Limited (EAML) or any of its Directors, Officers, Employees and personnel do not accept any responsibility for the editorial content or its accuracy, completeness or reliability and hereby disclaim any liability with regard to the same.
Statutory Details:
Disclaimer
Karvy Investor Service Centers
Agra - 0562-4000601 Ahmedabad - 079-26402967 / 079 -32997508 Ajmer - 0145-2628055 Aligarh - 0571-3200210 Allahabad - 0532-3240012 Ambala - 0171- 3200223 Amritsar - 0183-5053804 Anand - 02692 - 248980 Ankleshwar - 02646-227349 Asansol - 0341-2314624 Aurangabad - 0240-2363517 Balasore - 06782-260503 Bangalore - 080 - 32008452 Bareilly - 0581-3200414 Baroda - 0265 - 6640870 Begusarai - 06243-243696 Belgaum - 0831-2402722 Behrampur (OR) - 0680 - 2208006 / 0680-3205010 Bhagalpur - 0641-3200584 Bharuch - 02642-2225022 Bhavnagar - 0278 - 3001004 Bhilai - 0788-3297477 Bhopal - 0755-4092706 Bhubaneswar - 0674 - 6534585 Bokaro - 06542 - 233330/32/30 Burdwan - 0342- 2550219 Calicut - 0495-3042083 Chandigarh - 0172-5071725 Chennai - 044 42028512 Cochin - 0484-4010273 Coimbatore - 9600930515 Cuttack - 0671-2613906 Dehradun - 0135 - 3205130 Dhanbad - 0326 - 6452027 Dharwad - 0836-2744207 Durgapur - 0343-3207052 Erode - 0424 2225615, 2225616 Faridabad - 0129-3213529 Gandhidham - 02836- 320585 Gaya - 0631-2220065 Ghaziabad - 0120-3100049 Goa - 0832 - 2426874 Gorakhpur - 0551-3200444 Guntur - 0863-2339094 Gurgaon - 0124-3210019 Guwahati - 0361 - 2203324 Gwalior - 0751-3201709 Haldwani - 05946-282635 Hissar - 01662-225845 Hubli - 0836-2232443 Hyderabad - 040 - 23312454 Indore - 0731 - 2553615 Jaipur - 0141- 2375039 Jalandhar - 0181-4634410 Jalgaon - 0257 - 2226761 Jalpaiguri - 03561-224207 Jammu - 9906296475 Jamnagar - 0288-2556260 Jamshedpur - 0657-2487045 Jhansi - 0510 - 2333685 Jodhpur - 0291-5103026 Jorhat - 0376 - 2301923 Kanpur - 0512-3209782 Karaikudi - 04565-237192 Karur - 04324-248871 / 04324-326048 Kharagpur - 03222- 242512/03222 253380 Kolhapur - 0231- 2653656 Kolkata - 033 - 24659297 Kota - 0744-2366145 Kottayam - 0481-2300868 Lucknow - 0522-3213115 Ludhiana - 0161-4648747 Malda - 03512-223190 Madurai - 0452-2600852 / 865 Mangalore - 0824 - 2494110 Margao - 0832-2734656 Mathura - 0565-3202615 Meerut - 0121-3202163 Mehsana - 02762 322559 Moradabad - 0591-3201272 Mumbai - 022 - 66235353 Muzaffarpur - 0621-3200474 Mysore - 0821 - 2438006 Nadiad - 0268-2563245 Nagpur - 0712 - 6619382 Nasik - 0253-6611395 Navsari - 02637-280367 New Delhi - 011- 43681700 Panipat - 0180-3200136 Patiala - 0175-5004349 Patna - 0612-6453098 Pondicherry - 0413 - 4210640 Pune - 020-25533795 Raipur - 0771-2236696 Rajahmundry - 0883-2432076 Rajkot - 0281-3046532 Ranchi - 0651 - 2331320 Rohtak - 01262-318564 Rourkela - 0661-2510770 Saharanpur - 0132-3200125 Salem - 0427-2210835,2210983 Sambalpur - 0663-2522105 Shillong - 0364 - 2224186 Shimla - 0177-3206519 Shimoga - 08182-322577 Silchar - 03842-261229 Siliguri - 0353- 2526393 Surat - 0261-3042170 Tirunelveli - 0462-2335135 - 38 Tirupur - 0421-2214221 Trichur - 0487 - 3246231 Trichy - 0431 - 4020227 Trivandrum - 0471 - 2725728 Udaipur - 0294-2429370 Valsad - 02632-258481 Vapi - 0260-3206404 Varanasi - 0542-3204893 Vijayawada - 0866 2475126 Visakhapatnam - 0891- 2752917 Warangal - 0870-2553884
• Delhi- 603, 6th Floor, Mercantile House, 15 Kasturba Gandhi Marg, New Delhi – 110001 Tel - 011 - 4357 1105• Kolkata- Savitri Tower, 2nd Floor, 3A Upper Wood Street, Kolkatta - 700017 Tel - 033 - 4421 8800• Mumbai - 5th Floor, One Indiabulls Centre, Tower 1, 841, Senapati Bapat Marg, Elphinstone Road, Mumbai - 400 013 Tel - 022-40979821
Additional Edelweiss Mutual Fund Branches
Risk factors
Karvy Computershare Private Limited
UNIT EMF ‘Madhura Estates’, Municipal No.1-9/13/C, Plot No.13 & 13 C, Survey No.74 & 75, Madhapur Village, Serilingampally Mandal & Municipality, Ranga Reddy District, Hyderabad – 500 081.Tel: 040-4030 8000
MUTUAL FUND:Edelweiss Mutual Fund Registered Office: 14th Floor Express Towers,Nariman Point, Mumbai - 400021Corporate Office: 5th Floor, One Indiabulls Centre, Tower 1, 841, Senapati Bapat Marg, Elphinstone Road, Mumbai – 400 013www.edelweissmf.com
~Value Research Ratings and are similar to that of fixed income obligations of highest credit- quality category with Value Research Fund Ratings are a composite measure of historical risk-adjusted returns. In maturity of upto one year. This rating should however, not be construed as an indication of the case of short-term debt funds, this rating is based on the average weekly returns for the the performance of the Mutual Fund scheme or of volatility in its returns. This rating should last 18-month period. These ratings do not take into account the exit load. not be treated as a recommendation to buy, sell or hold the Units issued by the Mutual Fund.
@@Five stars indicate that a fund is in the top 10 per cent of its category in terms of historical AAAf: CRISIL AAAf Rating Methodology Edelweiss Liquid Fund risk-adjusted returns. 125 open-ended Debt: Ultra Short-term Funds were rated as on AAAf The fund’s portfolio holdings provide very strong protection against losses from credit January 31, 2011. Value Research Fund Ratings are subject to change every month. The defaults. The credit quality ratings are based on an analysis of the fund’s investment Rating is based on primary data provided by respective funds, Value Research does not philosophy, its management, investment strategies, operational policies and internal guarantee the accuracy. controls. Credit quality incorporates the credit risk of securities and the counterparty risk ^ ICRA mfA1+ Rating Methodology for Edelweiss Ultra Short Term Bond Fund involved in transactions CRISIL has developed a Credit Quality Matrix to evaluate a bond The credit risk rating assigned to the scheme is mfA1+. The highest-credit-quality short- fund’s overall level of protection against losses associated with credit default. The matrix is a term rating assigned by ICRA to debt funds. set of credit factors & credit scores derived scientifically from CRISIL’s rating default and Rating methodology used by ICRA is based on evaluating the inherent credit quality of the transition rates over past ten years. Ranking source: CRISIL FundServices, CRISIL Ltd.funds portfolio. As a measure of the credit quality of a debt fund’s assets, ICRA uses the Disclaimer: A CRISIL credit quality rating on a bond fund reflects CRISIL's current opinion on concept of ”credit scores”, based on ICRA’s assessment of credit risk associated with each the degree of protection offered by the rated instrument from losses related to credit exposure of the portfolio taking into account its maturity, investment objectives and default. It does not constitute an audit by CRISIL of the fund house, the scheme or policies, its management characteristics and the creditworthiness of its investment companies in the scheme's portfolio. CRISIL does not guarantee the completeness or portfolio. ICRA reviews relevant fund information on an ongoing basis to support its accuracy of information on which the rating is based. A CRISIL rating is not a published rating opinions. Source: ICRA Ltd. recommendation to buy, sell or hold the rated scheme: it does not comment on the market Disclaimer: This rating is the highest-credit-quality short-term rating assigned by ICRA to price or suitability for a particular investor.debt funds. Debt funds rated in this category carry the lowest credit risk in the short term
Rating Methodology and Disclaimer
“S&P®” and “Standard and Poor's®” are trademarks of the McGraw-hill Companies, Inc. (“S&P”), and have been licensed for use by India Index Services & Products Limited in connection with the S&P CNX Nifty Index. “The Product is not sponsored, endorsed, sold or promoted by India Index Services & Products Limited ("IISL") or Standard & Poor's, a division of The McGraw-Hill Companies, Inc. ("S&P"). Neither IISL nor S&P makes any representation or warranty, express or implied, to the owners of the Product or any member of the public regarding the advisability of investing in securities generally or in the Product. Please read the full Disclaimers in relation to the S&P CNX Nifty Index in the Offer Document / Prospectus / Information Statement.”
#Disclaimer for Edelweiss Nifty Enhancer Fund