Embed Size (px)
Citation preview
Edelweiss Mutual Fund Factsheet - December 2015
Scan QR Code with your mobile and learn more.
If you don’t have the QRreader, simply download one of the many free applications available for your handset !!!
Mutual Fund investments are subject to market risks, read all scheme related documents carefully.
SAVE TAX DIVIDENDS
Tax exemption limitof up to Rs. 1.5 lacsunder Section 80C
Get the advantage of Long term capital appreciation by investing in Equities
CREATEWEALTH
Earn regular Dividends
The ower of three,
that makes Edelweiss ELSS Fund ! worth it
Edelweiss ELSS Fund helps youSave Tax & Create Wealth at the same time.
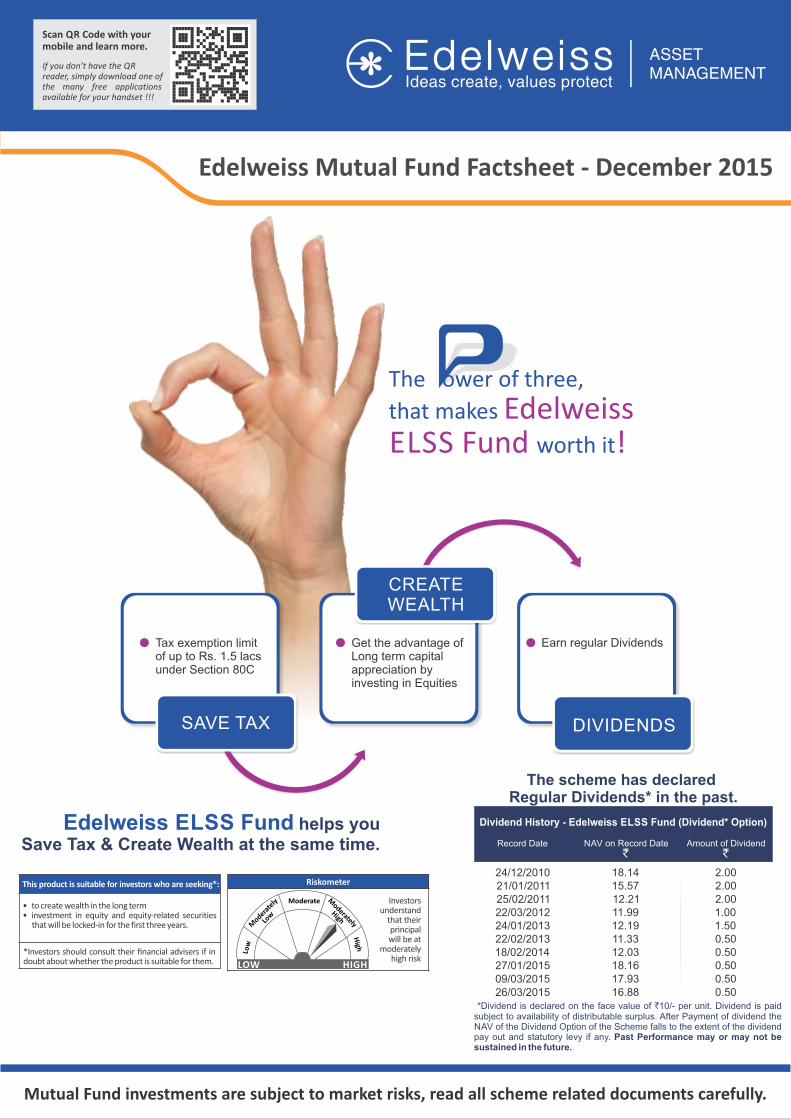
Dividend History - Edelweiss ELSS Fund (Dividend* Option)
The scheme has declared Regular Dividends* in the past.
Record Date NAV on Record Date Amount of Dividend
2.00
1.001.500.500.500.500.500.50
2.002.00
*Dividend is declared on the face value of `10/- per unit. Dividend is paid subject to availability of distributable surplus. After Payment of dividend the NAV of the Dividend Option of the Scheme falls to the extent of the dividend pay out and statutory levy if any. Past Performance may or may not be sustained in the future.
24/12/201021/01/201125/02/201122/03/201224/01/201322/02/201318/02/201427/01/201509/03/201526/03/2015
18.14
11.9912.1911.3312.0318.1617.9316.88
15.5712.21
LOW HIGH
Investors understand
that their principal will be at
moderately high risk
RiskometerThis product is suitable for investors who are seeking*:
• to create wealth in the long term• investment in equity and equity-related securities
that will be locked-in for the first three years.
*Investors should consult their financial advisers if in doubt about whether the product is suitable for them.
Index
2
Markets & Beyond
Exchange Traded Fund
• Equity Market Outlook
• Debt Market Outlook
• Edelweiss Exchange Traded Scheme - NiftyAn Open Ended Exchange Traded Fund
• Edelweiss Exchange Traded Scheme - BankingAn Open Ended Exchange Traded Fund
PAGE NO.
PAGE NO.
3
14
15
4
Schedule
• Schedule 2: How to Read Factsheet
PAGE NO.
22
• Edelweiss Absolute Return Fund*An Open-ended Equity Scheme(*The Scheme is an equity-oriented Scheme. Investors in the Scheme are not being offered any guaranteed / assured returns)
• Edelweiss Diversified Growth Equity Top 100 (E.D.G.E. Top 100) FundAn Open-ended Equity Scheme
• Edelweiss ELSS FundAn Open-ended Equity Linked Savings Scheme
• Edelweiss Emerging Leaders FundAn Open-ended Equity Scheme
• Edelweiss Prudent Advantage FundAn Open-ended Equity Scheme
• Edelweiss Arbitrage FundAn Open Ended Equity Scheme
• Edelweiss Equity Savings Advantage FundAn Open Ended Equity Scheme
PAGE NO.
5
6
8
9
11
12
13
Equity Funds
• Edelweiss Liquid FundAn Open-ended Liquid Scheme
• Edelweiss Bond FundAn Open-ended Debt Scheme
• Edelweiss Short Term Income Fund An Open-ended Income Scheme
• Edelweiss Gilt Fund An Open-ended Gilt Scheme
Fixed Income FundsPAGE NO.
16
17
18
19
PAGE NO.
Markets & Beyond
EQUITY MARKET OUTLOOK
WHAT WE SAID LAST TIMEGlobally, the US Fed meeting during the month would be a key event to watch out for.
The first interest rate hike since 2006 appears imminent on the basis of supportive US
economic data. Dollar index could further strengthen against this backdrop which
could weaken the INR. Simultaneously, Chinese and European central banks could
continue with its expansionary monetary policy in their meetings given their economic
backdrop.
On the domestic front, the ongoing winter session of Parliament could set the tone for
markets. The central government has lined up number of legislations including the
much-awaited Goods and Services Tax (GST) Bill. Inflation pickup coupled with the
impact of Seventh Pay Commission (likely to be implemented from Jan 1, 2016) on
aggregate demand could influence the Reserve Bank of India's decision on benchmark
rates going forward. Simultaneously, the central bank has emphasized on transmission
of the previous rate cuts to the consumers.
We expect Nifty 50 to be in the range - 7600 to 8300 - for the coming month, barring
tail event.
WHAT HAPPENED?Domestic markets were volatile for the month but ended flat (Nifty 50: 0.1%), as
global concerns around the US Fed rate hike, European Central Bank (ECB) policy
meeting, commodity slump and domestic policy reforms continued to weigh. Oil fell
to its lowest level since 2009 on the backdrop of rate hike concerns, stronger dollar
and reluctance to reduce output. First half of the month saw markets succumbing to
ECB and the US monetary policy jitters while the second half recuperated these
losses owing to predictable Fed policy outcome, stable currency and plunging
commodity prices that are beneficial to commodity consuming nations like India.
In its December meeting, the US Fed finally raised its benchmark rates by an
anticipated 25 bps, first time since 2006. More importantly, dovish commentary of
the central bank coupled with the guidance of “gradual” rate hikes going ahead,
soothed investor concerns. Going ahead, the central bank will focus on economic
data around inflation, employment and international developments. US economy
data readings continued to be impressive led by solid jobs data (~276k initial jobless
claims in December 2015), lower unemployment rate (5%), steady wage growth
(2.3% YoY), uptick in inflation (CPI YoY: 0.5% vs. 0.2% in November), healthy GDP
growth numbers (2.0% annualised) and robust consumer spending. On the other
hand, ECB's actions fell short of expectations as the ECB chief indicated better health
of the economy. Crude oil rout further got accentuated (16% decline MoM) as
Organisation of Petroleum Exporting Countries (OPEC) abandoned its oil output
ceiling and continued to pump beyond its stated target. Simultaneously, the US
Senate revoked the 40-year old oil exports ban, which further raised concerns of
oversupply. China's official PMI for the month of December came in at 49.7 vs. 49.6 in
November that highlighted yet another month of contraction. Overall, global
markets (MSCI World: -1.9% MoM) and emerging markets (MSCI EM: -2.5% MoM)
ended the year on a sour note. FIIs were net sellers in the domestic market to the
extent of Rs 2,817 crores.
In India, as expected, the Reserve Bank of India (RBI) kept its benchmark rates
unchanged citing moderate inflationary expectations owing to weak monsoon, and
impact of the 7th Pay Commission on aggregate demand. In its mid-year review, the
government lowered its GDP growth forecast to 7-7.5% in FY16E compared to earlier
estimate of 8.1-8.5% citing weakness in corporate spending, weak agriculture output
and global slowdown. The panel under Chief Economic Advisor rolled out its draft
Goods and Services Tax (GST) bill proposal and recommended 17-18% as the revenue
neutral rate while proposing a rate of 40% for demerit goods such as tobacco
products. However, the winter session of parliament was nearly a washout further
delaying passage of the GST bill. The government approved FDI proposals in excess
of Rs 7,000 crores, made PAN mandatory for cash transactions over Rs 2 lakh, and
imposed anti-dumping duty on cold-rolled flat products of stainless steel ranging
from 5-57% for a period of five years to safeguard interest of domestic
manufacturers. The RBI also released final guidelines regarding the computation of
interest rates based on marginal cost of funds. However, the central bank raised
concerns over weak corporate balance sheets and their possible repercussions on
banks' asset quality.
November CPI rose for the second consecutive month to 5.4% (14-month high)
compared to 5.0% in October led by higher food inflation and receding tailwinds from
a lower base. October IIP rebounded to a five-year high of 9.8%, higher than 3.6% in
September and against consensus expectations of 7.6% led by festive demand boost.
However, manufacturing PMI fell to a 25-month low of 50.3 in Nov vs. 50.7 in Oct.
India's current account deficit (CAD) narrowed to $8.2 billion (1.6% of GDP) in
September 2015 quarter compared to $10.9 billion (2.2% of GDP) during the same
quarter in previous year.
OUTLOOK FOR THE COMING MONTHGlobally, incoming data from the US, Eurozone and China would be watched
closely to assess the health of their respective economies and possible
implications on their monetary policies. Rising geopolitical tensions in the
Middle East could trigger risk-off scenario.
On the domestic front, Q3FY16E earnings season could lead to company
specific actions. Majority of IT players have issued profit warning for Q3FY16E
as operations were hit due to heavy floods at their Chennai facility. Credit
growth and asset quality would be of importance in banking results.
Commentary from the domestic players could highlight pickup in the
investment cycle. Commodity consumers could continue to benefit from
lower raw material inputs.
We expect Nifty 50 to be in the range - 7500 to 8100 - for the coming month,
barring tail event.
MACRO-ECONOMIC INDICATORS• October IIP growth increased to 9.80% YoY vs. 3.60 % YoY in September
• November WPI inflation came at -1.99% vs. -3.81% in October
• November CPI inflation continued to inch up to 5.41% YoY vs. 5.00% in
October
• November imports fell by 30.3% YoY while exports declined by 24.4% YoY
• India's Composite Purchasing Managers' Index (PMI) came at 50.2 in
November
MARKET ACTIVITY AND VALUATION
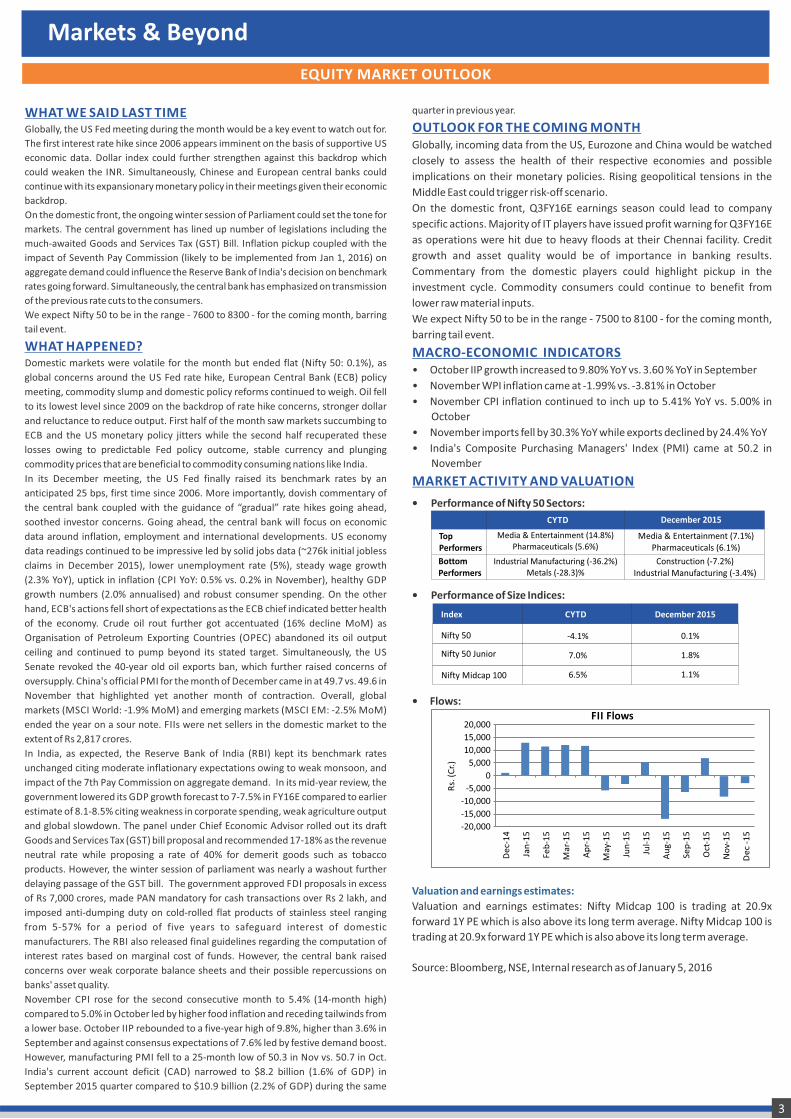
• Performance of Nifty 50 Sectors:
• Performance of Size Indices:
• Flows:
Valuation and earnings estimates:
Valuation and earnings estimates: Nifty Midcap 100 is trading at 20.9x
forward 1Y PE which is also above its long term average. Nifty Midcap 100 is
trading at 20.9x forward 1Y PE which is also above its long term average.
Source: Bloomberg, NSE, Internal research as of January 5, 2016
TopPerformers
Bottom Performers
December 2015CYTD
Media & Entertainment (14.8%) Pharmaceuticals (5.6%)
Industrial Manufacturing (-36.2%)Metals (-28.3)%
Media & Entertainment (7.1%)Pharmaceuticals (6.1%)
Construction (-7.2%)Industrial Manufacturing (-3.4%)
Nifty 50
Nifty 50 Junior
-4.1%
7.0%
6.5%
Nifty Midcap 100
0.1%
1.8%
1.1%
Index CYTD December 2015
De
c-1
4
Jan
-15
Feb
-15
Mar
-15
Ap
r-1
5
May
-15
Jun
-15
Jul-
15
Au
g-1
5
Sep
-15
Oct
-15
No
v-1
5
De
c -1
5
20,000
15,000
10,000
5,000
0
-5,000
-10,000
-15,000
-20,000
Rs.
(C
r.)
FII Flows
3
WHAT WE SAID LAST TIME
Although the crude oil prices have declined recently, CPI inflation excluding
food, fuel, petrol and diesel also rose for three consecutive months on
account of price increases in respect of housing, recreation and amusement,
and personal care and effects. The scope for additional policy cuts would
largely depend on the medium term inflation and growth outlook. Policy
rates may remain stable at least for the remainder of this fiscal, with the
focus of RBI now likely to shift towards ensuring better transmission of rates.
WHAT HAPPENED?
RBI maintained 'status quo' on key policy rates in its December policy review.
In the December review, RBI maintained its inflation and growth projections
for FY17, though some downside risks to both these estimates remain. RBI
stated that the one-off spike in housing rent allowance would be looked
through.
In what was probably the most awaited event, US FOMC decided to hike its
interest rate by 25 bps, first hike in almost a decade, citing 'solid' economic
recovery and improving labour market conditions. In her commentary, the
US Fed Chair reiterated data dependent 'accommodative' stance, while
maintaining a gradual and steady pace of hikes.
Wholesale Price Index based inflation rose to a 10 month high of -1.99% in
November from a record low of -3.81% in October, primarily due to statistical
effect of a low base and rise in food prices especially of pulses and
vegetables. Primary articles inflation rose to 2.27% in November from -
0.36% in the previous month. Food articles inflation rose to 5.20% in
November compared with 2.44% in October, while on a month on month
basis, the food articles index was up by 2.30%. Within the food articles
sector, WPI index in onions came down by 15.1% and in case of pulses it rose
by 4.4%. WPI inflation rate in manufactured products rose to -1.42% in
November from -1.67% in October, while that of fuel and power sector
inched up to -11.09% in November from -16.32% a month ago.
Manufactured products inflation rose slightly to -1.42% in November from -
1.67% a month ago. The non-food manufactured products inflation, which is
a proxy for the core inflation, fell marginally same at -1.9% in November, and
compared with -2.00% a month ago. The ministry also revised the inflation
rate for September to -4.59% from a provisional inflation rate of -4.54%.
India's headline inflation rate based on the Consumer Price Index
(Combined) rose to a 14-month high of 5.41% in November, from 5.00% in
the previous month, mainly on account of a sharp rise in pulses and statistical
effect of a low base.
India's industrial growth in October rose to a five year high of 9.8%, primarily
driven by high double digit growth in the capital and consumer goods sectors
along with a statistical effect of a low base. The industrial output had grown
3.8% a month ago and 2.7% in October 2014. Growth in capital goods which
is an indicator of investment demand, registered a double digit growth of
16.10% in October vs -3.2% a year ago, mainly on the back of a low base.
Among the broad sectors, the growth in manufacturing, which accounts for
nearly three-fourths of the total weight of the Index of Industrial Production,
registered a growth of to 10.6% in October from 2.6% a month ago. Within
the consumer goods segment, output of consumer durables recorded a
growth of 42.2% vs -8.40% in September. Consumer non-durables output
growth was 4.7% as against a contraction of -4.6% a month ago. Also the
growth in the other two sectors, electricity and mining, electricity output
rose 9.0% in October compared with 11.4% a month ago, while mining sector
registered a growth of 4.7% from 3.0% a month ago. Industrial growth in Apr-
Sep was 4.0%, against 2.9% a year ago.
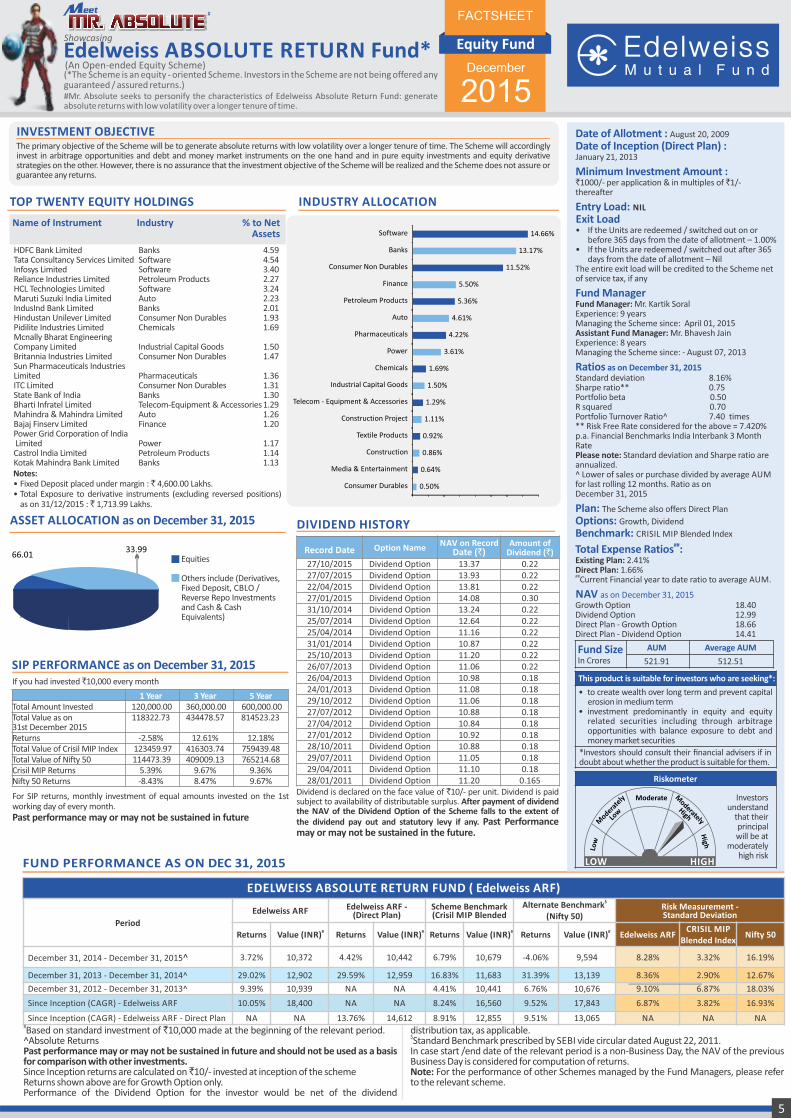
The 10-year benchmark G-sec yield closed at 7.76%, down 3 bps from last
month level of 7.79% while yield on the short-term 1-year bond went
marginally up by 5 bps to 7.30%.
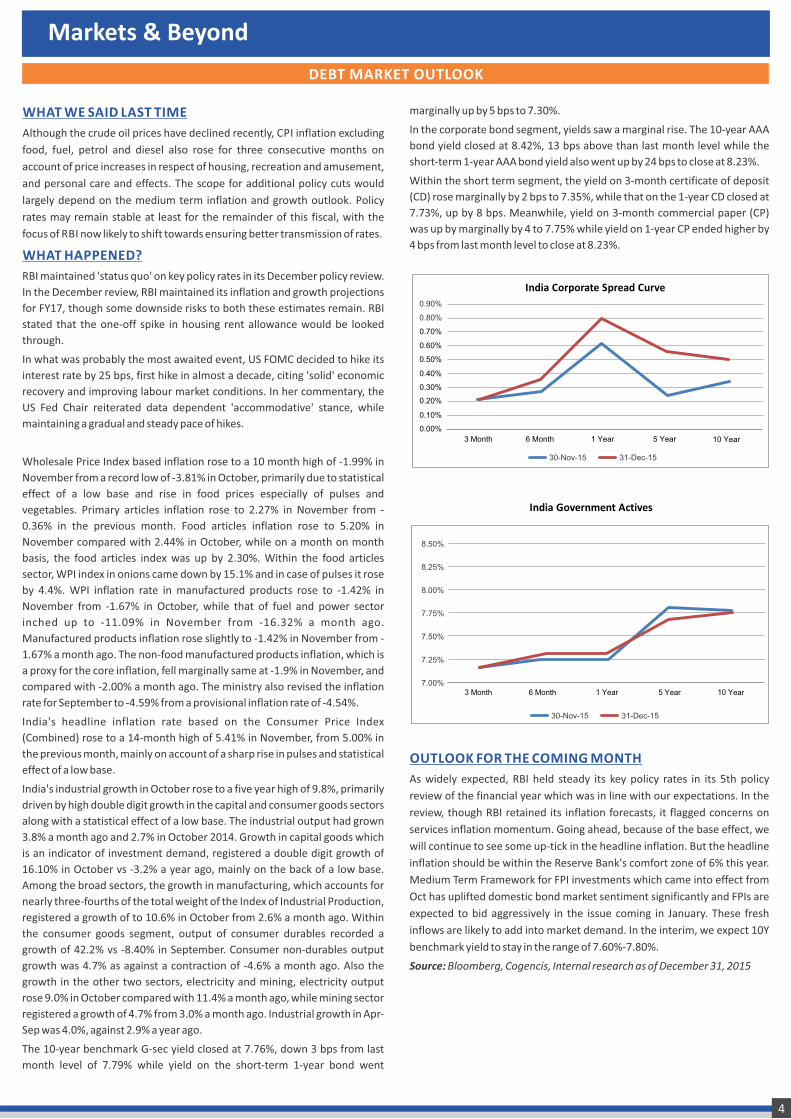
In the corporate bond segment, yields saw a marginal rise. The 10-year AAA
bond yield closed at 8.42%, 13 bps above than last month level while the
short-term 1-year AAA bond yield also went up by 24 bps to close at 8.23%.
Within the short term segment, the yield on 3-month certificate of deposit
(CD) rose marginally by 2 bps to 7.35%, while that on the 1-year CD closed at
7.73%, up by 8 bps. Meanwhile, yield on 3-month commercial paper (CP)
was up by marginally by 4 to 7.75% while yield on 1-year CP ended higher by
4 bps from last month level to close at 8.23%.
OUTLOOK FOR THE COMING MONTH
As widely expected, RBI held steady its key policy rates in its 5th policy
review of the financial year which was in line with our expectations. In the
review, though RBI retained its inflation forecasts, it flagged concerns on
services inflation momentum. Going ahead, because of the base effect, we
will continue to see some up-tick in the headline inflation. But the headline
inflation should be within the Reserve Bank's comfort zone of 6% this year.
Medium Term Framework for FPI investments which came into effect from
Oct has uplifted domestic bond market sentiment significantly and FPIs are
expected to bid aggressively in the issue coming in January. These fresh
inflows are likely to add into market demand. In the interim, we expect 10Y
benchmark yield to stay in the range of 7.60%-7.80%.
Source: Bloomberg, Cogencis, Internal research as of December 31, 2015
Markets & Beyond
DEBT MARKET OUTLOOK
8.50%
8.25%
8.00%
7.75%
7.50%
7.25%
7.00%
30-Nov-15 31-Dec-15
0.90%
30-Nov-15 31-Dec-15
0.80%
India Corporate Spread Curve
India Government Actives
4
(*The Scheme is an equity - oriented Scheme. Investors in the Scheme are not being offered any guaranteed / assured returns.)#Mr. Absolute seeks to personify the characteristics of Edelweiss Absolute Return Fund: generate absolute returns with low volatility over a longer tenure of time.
Edelweiss ABSOLUTE RETURN Fund*
December
2015
Equity Fund
FACTSHEET
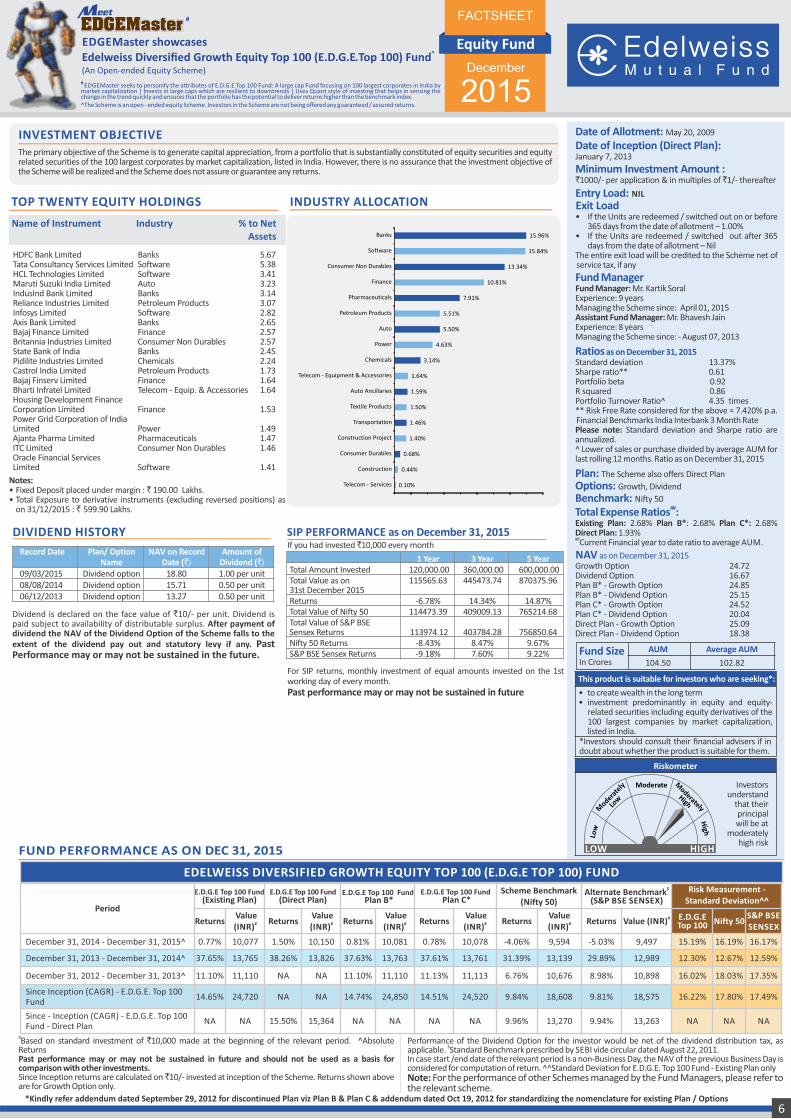
The primary objective of the Scheme will be to generate absolute returns with low volatility over a longer tenure of time. The Scheme will accordingly invest in arbitrage opportunities and debt and money market instruments on the one hand and in pure equity investments and equity derivative strategies on the other. However, there is no assurance that the investment objective of the Scheme will be realized and the Scheme does not assure or guarantee any returns.
INVESTMENT OBJECTIVE
FUND PERFORMANCE AS ON DEC 31, 2015
EDELWEISS ABSOLUTE RETURN FUND ( Edelweiss ARF)
Period
Edelweiss ARF Edelweiss ARF -(Direct Plan)
Scheme Benchmark(Crisil MIP Blended
$Alternate Benchmark(Nifty 50)
Risk Measurement -Standard Deviation
Returns# Value (INR) Returns # Value (INR) Returns
# Value (INR) Returns #Value (INR) Edelweiss ARFCRISIL MIP
Blended Index Nifty 50
December 31, 2014 - December 31, 2015^ 3.72% 10,372 4.42% 10,442 6.79% 10,679 -4.06% 9,594 8.28 % 3.32% 16.19%
December 31, 2013 - December 31, 2014^ 29.02% 12,902 29.59% 12,959 16.83% 11,683 31.39% 13,139 8.36% 2.90% 12.67%
December 31, 2012 - December 31, 2013^ 9.39% 10,939 NA NA 4.41% 10,441 6.76% 10,676 9.10% 6.87% 18.03%
Since Inception (CAGR) - Edelweiss ARF 10.05% 18,400 NA NA 8.24% 16,560 9.52% 17,843 6.87% 3.82% 16.93%
Since Inception (CAGR) - Edelweiss ARF - Direct Plan NA NA 13.76% 14,612 8.91% 12,855 9.51% 13,065 NA NA NA#Based on standard investment of `10,000 made at the beginning of the relevant period. ^Absolute ReturnsPast performance may or may not be sustained in future and should not be used as a basis for comparison with other investments.Since Inception returns are calculated on ̀ 10/- invested at inception of the schemeReturns shown above are for Growth Option only.Performance of the Dividend Option for the investor would be net of the dividend
distribution tax, as applicable.$Standard Benchmark prescribed by SEBI vide circular dated August 22, 2011.In case start /end date of the relevant period is a non-Business Day, the NAV of the previous Business Day is considered for computation of returns.Note: For the performance of other Schemes managed by the Fund Managers, please refer to the relevant scheme.
Name of Instrument Industry % to Net Assets
Notes: • Fixed Deposit placed under margin : ̀ 4,600.00 Lakhs. • Total Exposure to derivative instruments (excluding reversed positions)
as on 31/12/2015 : ̀ 1,713.99 Lakhs.
INDUSTRY ALLOCATION
Dividend is declared on the face value of `10/- per unit. Dividend is paid subject to availability of distributable surplus. After payment of dividend the NAV of the Dividend Option of the Scheme falls to the extent of the dividend pay out and statutory levy if any. Past Performance may or may not be sustained in the future.
DIVIDEND HISTORY
Record Date Option NameNAV on Record
Date (`)Amount of
Dividend (`)27/10/2015 Dividend Option 13.37 0.2227/07/2015 Dividend Option 13.93 0.2222/04/2015 Dividend Option 13.81 0.2227/01/2015 Dividend Option 14.08 0.3031/10/2014 Dividend Option 13.24 0.2225/07/2014 Dividend Option 12.64 0.2225/04/2014 Dividend Option 11.16 0.2231/01/2014 Dividend Option 10.87 0.2225/10/2013 Dividend Option 11.20 0.2226/07/2013 Dividend Option 11.06 0.2226/04/2013 Dividend Option 10.98 0.1824/01/2013 Dividend Option 11.08 0.1829/10/2012 Dividend Option 11.06 0.1827/07/2012 Dividend Option 10.88 0.1827/04/2012 Dividend Option 10.84 0.1827/01/2012 Dividend Option 10.92 0.1828/10/2011 Dividend Option 10.88 0.1829/07/2011 Dividend Option 11.05 0.1829/04/2011 Dividend Option 11.10 0.1828/01/2011 Dividend Option 11.20 0.165
TOP TWENTY EQUITY HOLDINGS
ASSET ALLOCATION as on December 31, 2015
66.0133.99
Equities
Others include (Derivatives, Fixed Deposit, CBLO / Reverse Repo Investments and Cash & Cash Equivalents)
Date of Allotment : August 20, 2009
Date of Inception (Direct Plan) :January 21, 2013
Minimum Investment Amount : `1000/- per application & in multiples of `1/- thereafter
Entry Load: NIL
Exit Load• If the Units are redeemed / switched out on or
before 365 days from the date of allotment – 1.00%• If the Units are redeemed / switched out after 365
days from the date of allotment – NilThe entire exit load will be credited to the Scheme net of service tax, if any
Fund ManagerFund Manager: Mr. Kartik SoralExperience: 9 years Managing the Scheme since: April 01, 2015Assistant Fund Manager: Mr. Bhavesh JainExperience: 8 years Managing the Scheme since: - August 07, 2013
Ratios as on December 31, 2015Standard deviation 8.16%Sharpe ratio** 0.75Portfolio beta 0.50R squared 0.70Portfolio Turnover Ratio^ 7.40 times** Risk Free Rate considered for the above = 7.420% p.a. Financial Benchmarks India Interbank 3 Month RatePlease note: Standard deviation and Sharpe ratio are annualized. ^ Lower of sales or purchase divided by average AUM for last rolling 12 months. Ratio as on December 31, 2015
Plan: The Scheme also offers Direct Plan
Options: Growth, Dividend
Benchmark: CRISIL MIP Blended Index##Total Expense Ratios :
Existing Plan: 2.41%Direct Plan: 1.66%##Current Financial year to date ratio to average AUM.
NAV as on December 31, 2015Growth Option 18.40Dividend Option 12.99 Direct Plan - Growth Option 18.66 Direct Plan - Dividend Option 14.41
HDFC Bank Limited Banks 4.59Tata Consultancy Services Limited Software 4.54Infosys Limited Software 3.40Reliance Industries Limited Petroleum Products 2.27HCL Technologies Limited Software 3.24Maruti Suzuki India Limited Auto 2.23IndusInd Bank Limited Banks 2.01Hindustan Unilever Limited Consumer Non Durables 1.93Pidilite Industries Limited Chemicals 1.69Mcnally Bharat Engineering Company Limited Industrial Capital Goods 1.50Britannia Industries Limited Consumer Non Durables 1.47Sun Pharmaceuticals Industries Limited Pharmaceuticals 1.36ITC Limited Consumer Non Durables 1.31State Bank of India Banks 1.30Bharti Infratel Limited Telecom-Equipment & Accessories 1.29Mahindra & Mahindra Limited Auto 1.26Bajaj Finserv Limited Finance 1.20Power Grid Corporation of India Limited Power 1.17Castrol India Limited Petroleum Products 1.14Kotak Mahindra Bank Limited Banks 1.13
This product is suitable for investors who are seeking*:
• to create wealth over long term and prevent capital erosion in medium term
• investment predominantly in equity and equity related securities including through arbitrage opportunities with balance exposure to debt and money market securities
*Investors should consult their financial advisers if in doubt about whether the product is suitable for them.
LOW HIGH
Investors understand
that their principal will be at
moderately high risk
Riskometer
Fund SizeIn Crores
AUM Average AUM
521.91 512.51
If you had invested `10,000 every month
For SIP returns, monthly investment of equal amounts invested on the 1st working day of every month. Past performance may or may not be sustained in future
SIP PERFORMANCE as on December 31, 2015
1 Year 3 Year 5 YearTotal Amount Invested 120,000.00 360,000.00 600,000.00 Total Value as on 118322.73 434478.57 814523.23 31st December 2015 Returns -2.58% 12.61% 12.18%Total Value of Crisil MIP Index 123459.97 416303.74 759439.48Total Value of Nifty 50 114473.39 409009.13 765214.68Crisil MIP Returns 5.39% 9.67% 9.36%Nifty 50 Returns -8.43% 8.47% 9.67%
5
(An Open-ended Equity Scheme)
0.50%
0.64%
0.86%
0.92%
1.11%
1.29%
1.50%
1.69%
3.61%
4.22%
4.61%
5.36%
5.50%
11.52%
13.17%
14.66%
Consumer Durables
Media & Entertainment
Construction
Textile Products
Construction Project
Telecom - Equipment & Accessories
Industrial Capital Goods
Chemicals
Power
Pharmaceuticals
Auto
Petroleum Products
Finance
Consumer Non Durables
Banks
Software
*Kindly refer addendum dated September 29, 2012 for discontinued Plan viz Plan B & Plan C & addendum dated Oct 19, 2012 for standardizing the nomenclature for existing Plan / Options
Equity Fund
FACTSHEET
EDGEMaster seeks to personify the attributes of E.D.G.E Top 100 Fund: A large cap Fund focusing on 100 largest corporates in India by market capitalization | Invests in large caps which are resilient to downtrends | Uses Quant style of investing that helps in sensing the change in the trend quickly and ensures that the portfolio has the potential to deliver returns higher than the benchmark index.^The Scheme is an open - ended equity Scheme. Investors in the Scheme are not being offered any guaranteed / assured returns.
The primary objective of the Scheme is to generate capital appreciation, from a portfolio that is substantially constituted of equity securities and equity related securities of the 100 largest corporates by market capitalization, listed in India. However, there is no assurance that the investment objective of the Scheme will be realized and the Scheme does not assure or guarantee any returns.
INVESTMENT OBJECTIVE
FUND PERFORMANCE AS ON DEC 31, 2015
EDELWEISS DIVERSIFIED GROWTH EQUITY TOP 100 (E.D.G.E TOP 100) FUND
#Based on standard investment of `10,000 made at the beginning of the relevant period. ^Absolute ReturnsPast performance may or may not be sustained in future and should not be used as a basis for comparison with other investments.Since Inception returns are calculated on ̀ 10/- invested at inception of the Scheme. Returns shown above are for Growth Option only.
Performance of the Dividend Option for the investor would be net of the dividend distribution tax, as $applicable. Standard Benchmark prescribed by SEBI vide circular dated August 22, 2011.
In case start /end date of the relevant period is a non-Business Day, the NAV of the previous Business Day is considered for computation of return. ̂ ^Standard Deviation for E.D.G.E. Top 100 Fund - Existing Plan onlyNote: For the performance of other Schemes managed by the Fund Managers, please refer to the relevant scheme.
Period
E.D.G.E Top 100 Fund (Existing Plan)
E.D.G.E Top 100 Fund (Direct Plan)
E.D.G.E Top 100 Fund Plan B*
E.D.G.E Top 100 Fund Plan C*
Scheme Benchmark(Nifty 50)
$Alternate Benchmark(S&P BSE SENSEX)
Risk Measurement -Standard Deviation^^
Returns Value
#(INR)Returns
Value #(INR)
Returns Value
#(INR)Returns
Value #(INR)
ReturnsValue
#(INR)Returns #Value (INR) E.D.G.E
Top 100 Nifty 50S&P BSE SENSEX
December 31, 2014 - December 31, 2015^ 0.77% 10,077 1.50% 10,150 0.81% 10,081 0.78% 10,078 -4.06% 9,594 -5.03% 9,497 15.19% 16.19% 16.17%
December 31, 2013 - December 31, 2014^ 37.65% 13,765 38.26% 13,826 37.63% 13,763 37.61% 13,761 31.39% 13,139 29.89% 12,989 12.30% 12.67% 12.59%
December 31, 2012 - December 31, 2013^ 11.10% 11,110 NA NA 11.10% 11,110 11.13% 11,113 6.76% 10,676 8.98% 10,898 16.02% 18.03% 17.35%
Since Inception (CAGR) - E.D.G.E. Top 100 Fund
14.65% 24,720 NA NA 14.74% 24,850 14.51% 24,520 9.84% 18,608 9.81% 18,575 16.22% 17.80% 17.49%
Since - Inception (CAGR) - E.D.G.E. Top 100 Fund - Direct Plan
NA NA 15.50% 15,364 NA NA NA NA 9.96% 13,270 9.94% 13,263 NA NA NA
Notes: • Fixed Deposit placed under margin : ̀ 190.00 Lakhs. • Total Exposure to derivative instruments (excluding reversed positions) as
on 31/12/2015 : ̀ 599.90 Lakhs.
INDUSTRY ALLOCATION
Date of Allotment: May 20, 2009
Date of Inception (Direct Plan): January 7, 2013
Minimum Investment Amount : `1000/- per application & in multiples of `1/- thereafter
Entry Load: NIL
Exit Load• If the Units are redeemed / switched out on or before
365 days from the date of allotment – 1.00%• If the Units are redeemed / switched out after 365
days from the date of allotment – NilThe entire exit load will be credited to the Scheme net of service tax, if any
Fund ManagerFund Manager: Mr. Kartik SoralExperience: 9 years Managing the Scheme since: April 01, 2015Assistant Fund Manager: Mr. Bhavesh JainExperience: 8 years Managing the Scheme since: - August 07, 2013
Ratios as on December 31, 2015Standard deviation 13.37%Sharpe ratio** 0.61Portfolio beta 0.92R squared 0.86Portfolio Turnover Ratio^ 4.35 times** Risk Free Rate considered for the above = 7.420% p.a. Financial Benchmarks India Interbank 3 Month RatePlease note: Standard deviation and Sharpe ratio are annualized. ^ Lower of sales or purchase divided by average AUM for last rolling 12 months. Ratio as on December 31, 2015
Plan: The Scheme also offers Direct Plan
Options: Growth, Dividend
Benchmark: Nifty 50##Total Expense Ratios :
Existing Plan: 2.68% Plan B*: 2.68% Plan C*: 2.68% Direct Plan: 1.93%##Current Financial year to date ratio to average AUM.
NAV as on December 31, 2015Growth Option 24.72Dividend Option 16.67 Plan B* - Growth Option 24.85Plan B* - Dividend Option 25.15 Plan C* - Growth Option 24.52 Plan C* - Dividend Option 20.04 Direct Plan - Growth Option 25.09 Direct Plan - Dividend Option 18.38
December
2015
Name of Instrument Industry % to Net Assets
TOP TWENTY EQUITY HOLDINGS
HDFC Bank Limited Banks 5.67Tata Consultancy Services Limited Software 5.38HCL Technologies Limited Software 3.41Maruti Suzuki India Limited Auto 3.23IndusInd Bank Limited Banks 3.14Reliance Industries Limited Petroleum Products 3.07Infosys Limited Software 2.82Axis Bank Limited Banks 2.65Bajaj Finance Limited Finance 2.57Britannia Industries Limited Consumer Non Durables 2.57State Bank of India Banks 2.45Pidilite Industries Limited Chemicals 2.24Castrol India Limited Petroleum Products 1.73Bajaj Finserv Limited Finance 1.64Bharti Infratel Limited Telecom - Equip. & Accessories 1.64Housing Development Finance Corporation Limited Finance 1.53Power Grid Corporation of India Limited Power 1.49Ajanta Pharma Limited Pharmaceuticals 1.47ITC Limited Consumer Non Durables 1.46Oracle Financial Services Limited Software 1.41
Dividend is declared on the face value of `10/- per unit. Dividend is paid subject to availability of distributable surplus. After payment of dividend the NAV of the Dividend Option of the Scheme falls to the extent of the dividend pay out and statutory levy if any. Past Performance may or may not be sustained in the future.
DIVIDEND HISTORY
Record Date Plan/ Option NAV on Record Amount of Name Date (`) Dividend (`)
09/03/2015 Dividend option 18.80 1.00 per unit08/08/2014 Dividend option 15.71 0.50 per unit06/12/2013 Dividend option 13.27 0.50 per unit
LOW HIGH
Investors understand
that their principal will be at
moderately high risk
Riskometer
This product is suitable for investors who are seeking*:
• to create wealth in the long term• investment predominantly in equity and equity-
related securities including equity derivatives of the 100 largest companies by market capitalization, listed in India.
*Investors should consult their financial advisers if in doubt about whether the product is suitable for them.
Fund SizeIn Crores
AUM Average AUM
104.50 102.82For SIP returns, monthly investment of equal amounts invested on the 1st working day of every month. Past performance may or may not be sustained in future
SIP PERFORMANCE as on December 31, 2015If you had invested `10,000 every month
1 Year 3 Year 5 YearTotal Amount Invested 120,000.00 360,000.00 600,000.00 Total Value as on 115565.63 445473.74 870375.9631st December 2015 Returns -6.78% 14.34% 14.87% Total Value of Nifty 50 114473.39 409009.13 765214.68 Total Value of S&P BSE Sensex Returns 113974.12 403784.28 756850.64Nifty 50 Returns -8.43% 8.47% 9.67%S&P BSE Sensex Returns -9.18% 7.60% 9.22%
6
0.10%
0.44%
0.68%
1.40%
1.46%
1.50%
1.59%
1.64%
3.14%
4.63%
5.50%
5.51%
7.91%
10.81%
13.34%
15.84%
15.96%
Telecom - Services
Construction
Consumer Durables
Construction Project
Transportation
Textile Products
Auto Ancillaries
Telecom - Equipment & Accessories
Chemicals
Power
Auto
Petroleum Products
Pharmaceuticals
Finance
Consumer Non Durables
Software
Banks
Top 10 Equity Holdings Top 10 Equity Holdings% to Net Assetsof the Scheme
Shares notionallyheld by an investor*
Shares notionallyheld by an investor*
Edelweiss Absolute Return Fund
Top 10 stocks in the Portfolio as on December 31, 2015
(An Open Ended Equity scheme)
% to Net Assetsof the Scheme
Mutual Fund investments are subject to market risks, read all scheme related documents carefully.
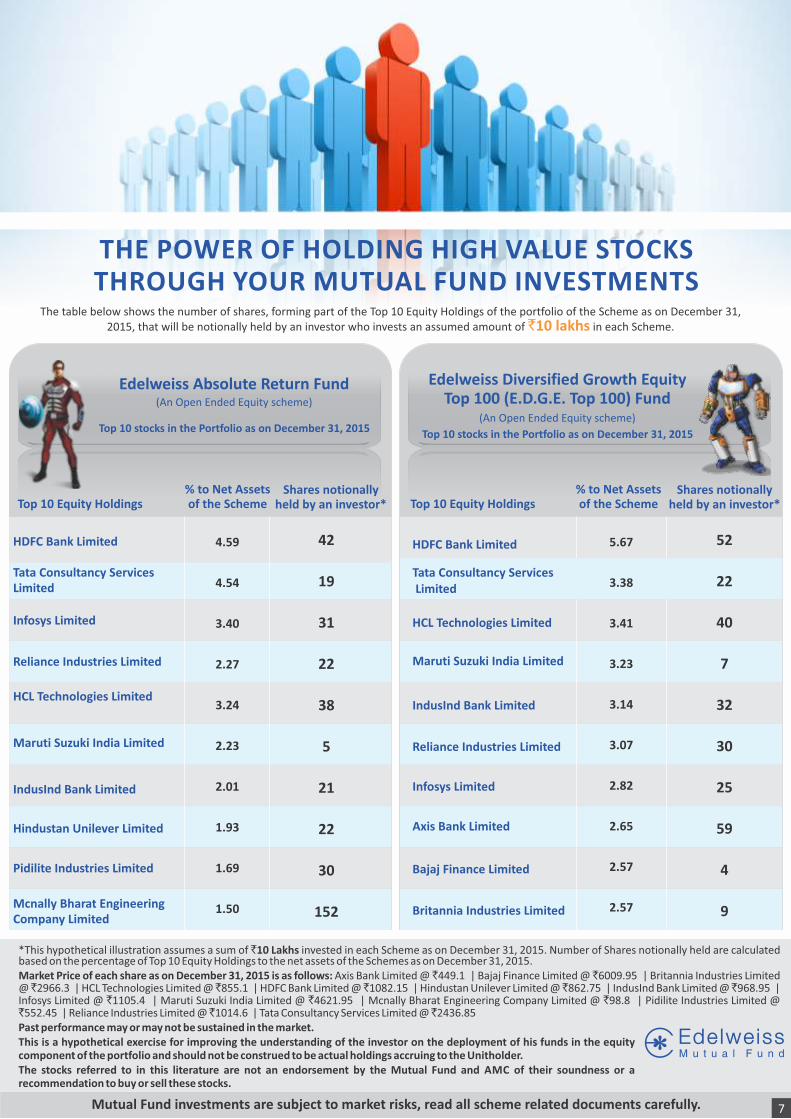
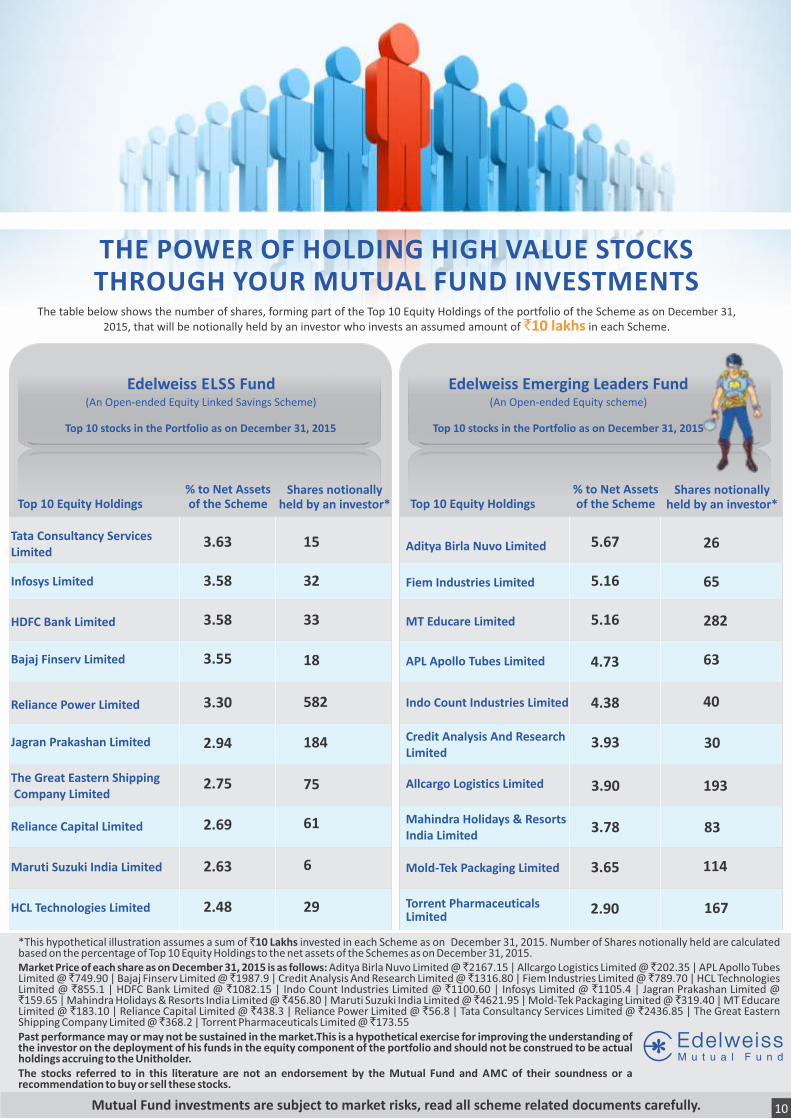
THE POWER OF HOLDING HIGH VALUE STOCKS THROUGH YOUR MUTUAL FUND INVESTMENTS
The table below shows the number of shares, forming part of the Top 10 Equity Holdings of the portfolio of the Scheme as on December 31, 2015, that will be notionally held by an investor who invests an assumed amount of in each Scheme.`10 lakhs
42
19
31
22
38
5
21
22
30
152
4.59
4.54
3.40
2.27
3.24
2.23
2.01
1.93
1.69
1.50
Edelweiss Diversified Growth Equity Top 100 (E.D.G.E. Top 100) Fund
(An Open Ended Equity scheme)
Top 10 stocks in the Portfolio as on December 31, 2015
52
22
40
7
32
30
25
59
4
9
5.67
3.38
3.41
3.23
3.14
3.07
2.82
2.65
2.57
2.57
*This hypothetical illustration assumes a sum of `10 Lakhs invested in each Scheme as on December 31, 2015. Number of Shares notionally held are calculatedbased on the percentage of Top 10 Equity Holdings to the net assets of the Schemes as on December 31, 2015.Market Price of each share as on December 31, 2015 is as follows: Axis Bank Limited @ 449.1 | Bajaj Finance Limited @ 6009.95 | Britannia Industries Limited ` `@ 2966.3 | HCL Technologies Limited @ 855.1 | HDFC Bank Limited @ 1082.15 | Hindustan Unilever Limited @ 862.75 | IndusInd Bank Limited @ 968.95 | ` ` ` ` `Infosys Limited @ 1105.4 | Maruti Suzuki India Limited @ 4621.95 | Mcnally Bharat Engineering Company Limited @ 98.8 | Pidilite Industries Limited @ ` ` `` ` `552.45 | Reliance Industries Limited @ 1014.6 | Tata Consultancy Services Limited @ 2436.85Past performance may or may not be sustained in the market.This is a hypothetical exercise for improving the understanding of the investor on the deployment of his funds in the equity component of the portfolio and should not be construed to be actual holdings accruing to the Unitholder.The stocks referred to in this literature are not an endorsement by the Mutual Fund and AMC of their soundness or a recommendation to buy or sell these stocks.
HDFC Bank Limited
Tata Consultancy ServicesLimited
Infosys Limited
Reliance Industries Limited
HCL Technologies Limited
Maruti Suzuki India Limited
IndusInd Bank Limited
Hindustan Unilever Limited
Pidilite Industries Limited
Mcnally Bharat Engineering Company Limited
7
HDFC Bank Limited
Tata Consultancy Services Limited
HCL Technologies Limited
Maruti Suzuki India Limited
IndusInd Bank Limited
Reliance Industries Limited
Infosys Limited
Axis Bank Limited
Bajaj Finance Limited
Britannia Industries Limited
EDELWEISS ELSS FUND
ELSS FundEquity Fund
FACTSHEET
(An Open-ended Equity Linked Savings Scheme)
FUND PERFORMANCE AS ON DEC 31, 2015
#Based on standard investment of ̀ 10,000 made at the beginning of the relevant period. ^Absolute ReturnsPast performance may or may not be sustained in future and should not be used as a basis for comparison with other investments.Since Inception returns are calculated on ̀ 10/- invested at inception of the schemeReturns shown above are for Growth Option only.
Performance of the Dividend Option for the investor would be net of the dividend distribution tax, as applicable.$Standard Benchmark prescribed by SEBI vide circular dated August 22, 2011.In case start /end date of the relevant period is a non-Business Day, the NAV of the previous Business Day is considered for computation of returns.Note: For the performance of other Schemes managed by the Fund Managers, please refer to the relevant scheme.
Period
Edelweiss ELSS FundEdelweiss ELSS Fund
(Direct Plan)Scheme Benchmark
(Nifty 500)
$Alternate Benchmark(Nifty 50)
Risk Measurement -Standard Deviation
Returns # Value (INR) Returns # Value (INR) Returns # Value (INR) Returns # Value (INR)Edelweiss ELSS Fund
Nifty 500
Nifty 50
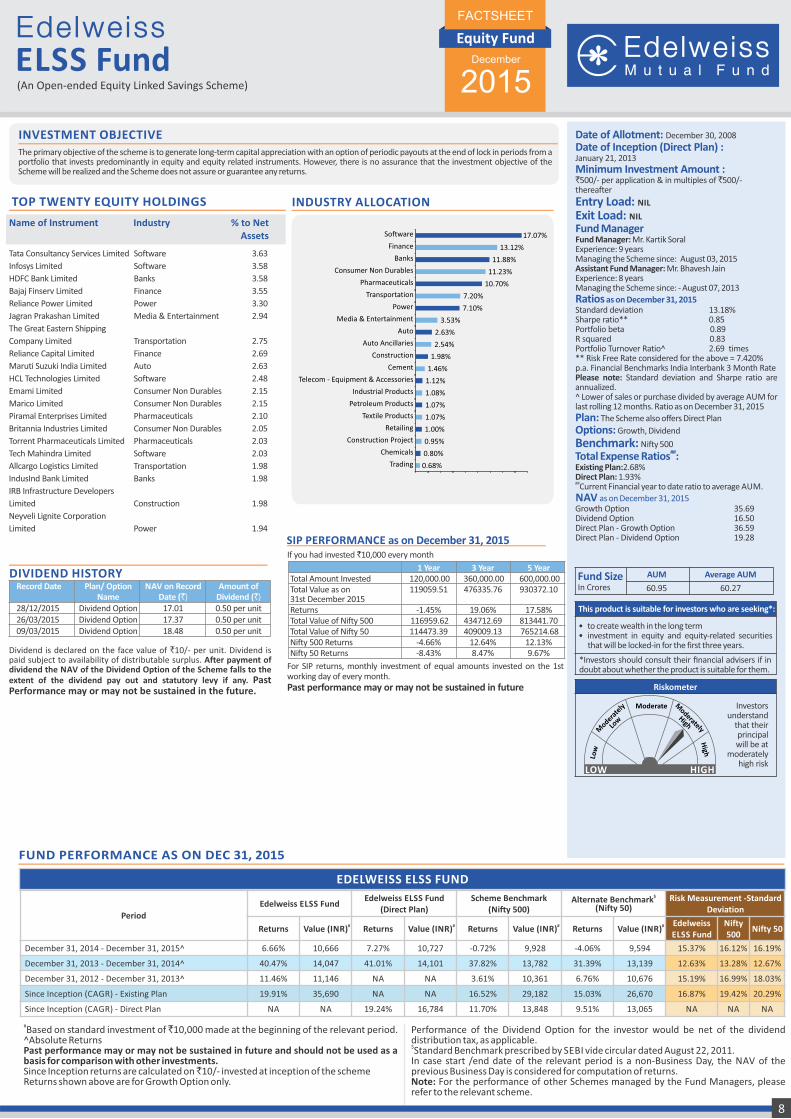
December 31, 2014 - December 31, 2015^ 6.66% 10,666 7.27% 10,727 -0.72% 9,928 -4.06% 9,594 15.37% 16.12% 16.19%
December 31, 2013 - December 31, 2014^ 40.47% 14,047 41.01% 14,101 37.82% 13,782 31.39% 13,139 12.63% 13.28% 12.67%
December 31, 2012 - December 31, 2013^ 11.46% 11,146 NA NA 3.61% 10,361 6.76% 10,676 15.19% 16.99% 18.03%
Since Inception (CAGR) - Existing Plan 19.91% 35,690 NA NA 16.52% 29,182 15.03% 26,670 16.87% 19.42% 20.29%
Since Inception (CAGR) - Direct Plan NA NA 19.24% 16,784 11.70% 13,848 9.51% 13,065 NA NA NA
INDUSTRY ALLOCATION
Tata Consultancy Services Limited Software 3.63
Infosys Limited Software 3.58
HDFC Bank Limited Banks 3.58
Bajaj Finserv Limited Finance 3.55
Reliance Power Limited Power 3.30
Jagran Prakashan Limited Media & Entertainment 2.94
The Great Eastern Shipping
Company Limited Transportation 2.75
Reliance Capital Limited Finance 2.69
Maruti Suzuki India Limited Auto 2.63
HCL Technologies Limited Software 2.48
Emami Limited Consumer Non Durables 2.15
Marico Limited Consumer Non Durables 2.15
Piramal Enterprises Limited Pharmaceuticals 2.10
Britannia Industries Limited Consumer Non Durables 2.05
Torrent Pharmaceuticals Limited Pharmaceuticals 2.03
Tech Mahindra Limited Software 2.03
Allcargo Logistics Limited Transportation 1.98
IndusInd Bank Limited Banks 1.98
IRB Infrastructure Developers
Limited Construction 1.98
Neyveli Lignite Corporation
Limited Power 1.94
Name of Instrument Industry % to Net Assets
TOP TWENTY EQUITY HOLDINGS
December
2015
Dividend is declared on the face value of `10/- per unit. Dividend is paid subject to availability of distributable surplus. After payment of dividend the NAV of the Dividend Option of the Scheme falls to the extent of the dividend pay out and statutory levy if any. Past Performance may or may not be sustained in the future.
DIVIDEND HISTORYRecord Date Plan/ Option NAV on Record Amount of
Name Date (`) Dividend (`)28/12/2015 Dividend Option 17.01 0.50 per unit26/03/2015 Dividend Option 17.37 0.50 per unit09/03/2015 Dividend Option 18.48 0.50 per unit
The primary objective of the scheme is to generate long-term capital appreciation with an option of periodic payouts at the end of lock in periods from a portfolio that invests predominantly in equity and equity related instruments. However, there is no assurance that the investment objective of the Scheme will be realized and the Scheme does not assure or guarantee any returns.
INVESTMENT OBJECTIVE Date of Allotment: December 30, 2008
Date of Inception (Direct Plan) :January 21, 2013
Minimum Investment Amount : `500/- per application & in multiples of `500/- thereafter
Entry Load: NIL
Exit Load: NIL
Fund ManagerFund Manager: Mr. Kartik SoralExperience: 9 years Managing the Scheme since: August 03, 2015Assistant Fund Manager: Mr. Bhavesh Jain Experience: 8 years Managing the Scheme since: - August 07, 2013
Ratios as on December 31, 2015Standard deviation 13.18%Sharpe ratio** 0.85Portfolio beta 0.89R squared 0.83Portfolio Turnover Ratio^ 2.69 times** Risk Free Rate considered for the above = 7.420% p.a. Financial Benchmarks India Interbank 3 Month RatePlease note: Standard deviation and Sharpe ratio are annualized. ^ Lower of sales or purchase divided by average AUM for last rolling 12 months. Ratio as on December 31, 2015
Plan: The Scheme also offers Direct Plan
Options: Growth, Dividend
Benchmark: Nifty 500##Total Expense Ratios :
Existing Plan:2.68%Direct Plan: 1.93%##Current Financial year to date ratio to average AUM.
NAV as on December 31, 2015Growth Option 35.69Dividend Option 16.50 Direct Plan - Growth Option 36.59 Direct Plan - Dividend Option 19.28
LOW HIGH
Investors understand
that their principal will be at
moderately high risk
Riskometer
This product is suitable for investors who are seeking*:
• to create wealth in the long term• investment in equity and equity-related securities
that will be locked-in for the first three years.
*Investors should consult their financial advisers if in doubt about whether the product is suitable for them.
Fund SizeIn Crores
AUM Average AUM
60.95 60.27
For SIP returns, monthly investment of equal amounts invested on the 1st working day of every month. Past performance may or may not be sustained in future
SIP PERFORMANCE as on December 31, 2015If you had invested `10,000 every month
1 Year 3 Year 5 YearTotal Amount Invested 120,000.00 360,000.00 600,000.00 Total Value as on 119059.51 476335.76 930372.1031st December 2015 Returns -1.45% 19.06% 17.58% Total Value of Nifty 500 116959.62 434712.69 813441.70Total Value of Nifty 50 114473.39 409009.13 765214.68 Nifty 500 Returns -4.66% 12.64% 12.13%Nifty 50 Returns -8.43% 8.47% 9.67%
8
0.68%
0.80%
0.95%
1.00%
1.07%
1.07%
1.08%
1.12%
1.46%
1.98%
2.54%
2.63%
3.53%
7.10%
7.20%
10.70%
11.23%
11.88%
13.12%
17.07%
Trading
Chemicals
Construction Project
Retailing
Textile Products
Petroleum Products
Industrial Products
Telecom - Equipment & Accessories
Cement
Construction
Auto Ancillaries
Auto
Media & Entertainment
Power
Transportation
Pharmaceuticals
Consumer Non Durables
Banks
Finance
Software
Equity Fund
#Edelweiss Emerging Leaders Fund
FUND PERFORMANCE AS ON DEC 31, 2015
#Based on standard investment of `10,000 made at the beginning of the relevant period. ^Absolute ReturnsPast performance may or may not be sustained in future and should not be used as a basis for comparison with other investments.Since Inception returns are calculated on ̀ 10/- invested at inception of the schemeReturns shown above are for Growth Option only.
Performance of the Dividend Option for the investor would be net of the dividend distribution tax, as applicable.$Standard Benchmark prescribed by SEBI vide circular dated August 22, 2011.In case start /end date of the relevant period is a non-Business Day, the NAV of the previous Business Day is considered for computation of returns.Note: For the performance of other Schemes managed by the Fund Managers, please refer to the relevant scheme.
Period
Edelweiss Emerging Leaders Fund
Edelweiss Emerging Leaders Fund (Direct Plan)
Scheme Benchmark(Nifty Midcap 100
Index)
$Alternate Benchmark(Nifty 50)
Risk Measurement-Standard Deviation
Returns Value
#(INR)Returns
Value #(INR)
Returns Value
#(INR)Returns
Value #(INR)
Edelweiss Emerging
Leaders Fund
Nifty Midcap 100
IndexNifty 50
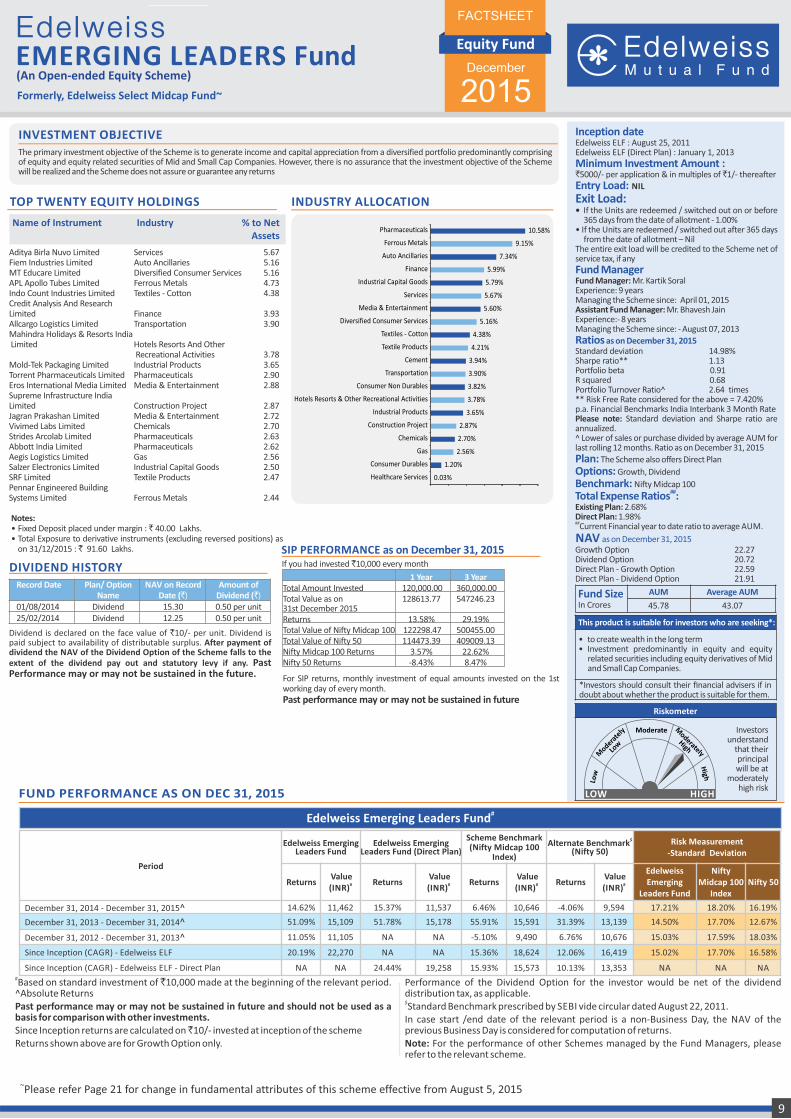
December 31, 2014 - December 31, 2015^ 14.62% 11,462 15.37% 11,537 6.46% 10,646 -4.06% 9,594 17.21% 18.20% 16.19%
December 31, 2013 - December 31, 2014^ 51.09% 15,109 51.78% 15,178 55.91% 15,591 31.39% 13,139 14.50% 17.70% 12.67%
December 31, 2012 - December 31, 2013^ 11.05% 11,105 NA NA -5.10% 9,490 6.76% 10,676 15.03% 17.59% 18.03%
Since Inception (CAGR) - Edelweiss ELF 20.19% 22,270 NA NA 15.36% 18,624 12.06% 16,419 15.02% 17.70% 16.58%
Since Inception (CAGR) - Edelweiss ELF - Direct Plan NA NA 24.44% 19,258 15.93% 15,573 10.13% 13,353 NA NA NA
FACTSHEET
December
2015
Name of Instrument Industry % to Net Assets
Notes: • Fixed Deposit placed under margin : ̀ 40.00 Lakhs.• Total Exposure to derivative instruments (excluding reversed positions) as
on 31/12/2015 : ̀ 91.60 Lakhs.
TOP TWENTY EQUITY HOLDINGS
Aditya Birla Nuvo Limited Services 5.67Fiem Industries Limited Auto Ancillaries 5.16MT Educare Limited Diversified Consumer Services 5.16APL Apollo Tubes Limited Ferrous Metals 4.73Indo Count Industries Limited Textiles - Cotton 4.38Credit Analysis And Research Limited Finance 3.93Allcargo Logistics Limited Transportation 3.90Mahindra Holidays & Resorts India Limited Hotels Resorts And Other
Recreational Activities 3.78Mold-Tek Packaging Limited Industrial Products 3.65Torrent Pharmaceuticals Limited Pharmaceuticals 2.90Eros International Media Limited Media & Entertainment 2.88Supreme Infrastructure India Limited Construction Project 2.87Jagran Prakashan Limited Media & Entertainment 2.72Vivimed Labs Limited Chemicals 2.70Strides Arcolab Limited Pharmaceuticals 2.63Abbott India Limited Pharmaceuticals 2.62Aegis Logistics Limited Gas 2.56Salzer Electronics Limited Industrial Capital Goods 2.50SRF Limited Textile Products 2.47Pennar Engineered Building Systems Limited Ferrous Metals 2.44
(An Open-ended Equity Scheme)
~Please refer Page 21 for change in fundamental attributes of this scheme effective from August 5, 2015
EMERGING LEADERS FundFormerly, Edelweiss Select Midcap Fund~
Inception date Edelweiss ELF : August 25, 2011 Edelweiss ELF (Direct Plan) : January 1, 2013
Minimum Investment Amount : `5000/- per application & in multiples of `1/- thereafter
Entry Load: NIL
Exit Load: • If the Units are redeemed / switched out on or before
365 days from the date of allotment - 1.00%• If the Units are redeemed / switched out after 365 days
from the date of allotment – Nil The entire exit load will be credited to the Scheme net of service tax, if any
Fund ManagerFund Manager: Mr. Kartik SoralExperience: 9 yearsManaging the Scheme since: April 01, 2015Assistant Fund Manager: Mr. Bhavesh JainExperience:- 8 yearsManaging the Scheme since: - August 07, 2013
Ratios as on December 31, 2015Standard deviation 14.98%Sharpe ratio** 1.13Portfolio beta 0.91R squared 0.68Portfolio Turnover Ratio^ 2.64 times** Risk Free Rate considered for the above = 7.420% p.a. Financial Benchmarks India Interbank 3 Month RatePlease note: Standard deviation and Sharpe ratio are annualized. ^ Lower of sales or purchase divided by average AUM for last rolling 12 months. Ratio as on December 31, 2015
Plan: The Scheme also offers Direct Plan
Options: Growth, Dividend
Benchmark: Nifty Midcap 100##Total Expense Ratios :
Existing Plan: 2.68%Direct Plan: 1.98%##Current Financial year to date ratio to average AUM.
NAV as on December 31, 2015Growth Option 22.27Dividend Option 20.72Direct Plan - Growth Option 22.59Direct Plan - Dividend Option 21.91
LOW HIGH
Investors understand
that their principal will be at
moderately high risk
Riskometer
This product is suitable for investors who are seeking*:
• to create wealth in the long term• Investment predominantly in equity and equity
related securities including equity derivatives of Mid and Small Cap Companies.
*Investors should consult their financial advisers if in doubt about whether the product is suitable for them.
The primary investment objective of the Scheme is to generate income and capital appreciation from a diversified portfolio predominantly comprising of equity and equity related securities of Mid and Small Cap Companies. However, there is no assurance that the investment objective of the Scheme will be realized and the Scheme does not assure or guarantee any returns
INVESTMENT OBJECTIVE
INDUSTRY ALLOCATION
Fund SizeIn Crores
AUM Average AUM
45.78 43.07
Dividend is declared on the face value of `10/- per unit. Dividend is paid subject to availability of distributable surplus. After payment of dividend the NAV of the Dividend Option of the Scheme falls to the extent of the dividend pay out and statutory levy if any. Past Performance may or may not be sustained in the future.
DIVIDEND HISTORYRecord Date Plan/ Option NAV on Record Amount of
Name Date (`) Dividend (`)01/08/2014 Dividend 15.30 0.50 per unit25/02/2014 Dividend 12.25 0.50 per unit
SIP PERFORMANCE as on December 31, 2015If you had invested `10,000 every month
1 Year 3 Year Total Amount Invested 120,000.00 360,000.00 Total Value as on 128613.77 547246.23 31st December 2015 Returns 13.58% 29.19% Total Value of Nifty Midcap 100 122298.47 500455.00Total Value of Nifty 50 114473.39 409009.13 Nifty Midcap 100 Returns 3.57% 22.62%Nifty 50 Returns -8.43% 8.47%
For SIP returns, monthly investment of equal amounts invested on the 1st working day of every month. Past performance may or may not be sustained in future
9
0.03%
1.20%
2.56%
2.70%
2.87%
3.65%
3.78%
3.82%
3.90%
3.94%
4.21%
4.38%
5.16%
5.60%
5.67%
5.79%
5.99%
7.34%
9.15%
10.58%
Healthcare Services
Consumer Durables
Gas
Chemicals
Construction Project
Industrial Products
Hotels Resorts & Other Recreational Activities
Consumer Non Durables
Transportation
Cement
Textile Products
Textiles - Cotton
Diversified Consumer Services
Media & Entertainment
Services
Industrial Capital Goods
Finance
Auto Ancillaries
Ferrous Metals
Pharmaceuticals
% to Net Assetsof the Scheme
Shares notionallyheld by an investor*
Shares notionallyheld by an investor*
Edelweiss Emerging Leaders Fund
Edelweiss ELSS Fund
Top 10 stocks in the Portfolio as on December 31, 2015
(An Open-ended Equity Linked Savings Scheme) (An Open-ended Equity scheme)
Top 10 stocks in the Portfolio as on December 31, 2015
% to Net Assetsof the Scheme
The table below shows the number of shares, forming part of the Top 10 Equity Holdings of the portfolio of the Scheme as on December 31,
2015, that will be notionally held by an investor who invests an assumed amount of in each Scheme.`10 lakhs
THE POWER OF HOLDING HIGH VALUE STOCKS THROUGH YOUR MUTUAL FUND INVESTMENTS
Top 10 Equity Holdings Top 10 Equity Holdings
Mutual Fund investments are subject to market risks, read all scheme related documents carefully.
*This hypothetical illustration assumes a sum of ̀ 10 Lakhs invested in each Scheme as on December 31, 2015. Number of Shares notionally held are calculatedbased on the percentage of Top 10 Equity Holdings to the net assets of the Schemes as on December 31, 2015.Market Price of each share as on is as follows: December 31, 2015 Aditya Birla Nuvo Limited @ ̀ 2167.15 | Allcargo Logistics Limited @ ̀ 202.35 | APL Apollo Tubes Limited @ ̀ 749.90 | Bajaj Finserv Limited @ ̀ 1987.9 | Credit Analysis And Research Limited @ ̀ 1316.80 | Fiem Industries Limited @ ̀ 789.70 | HCL Technologies Limited @ `855.1 | HDFC Bank Limited @ `1082.15 | Indo Count Industries Limited @ `1100.60 | Infosys Limited @ `1105.4 | Jagran Prakashan Limited @ `159.65 | Mahindra Holidays & Resorts India Limited @ ̀ 456.80 | Maruti Suzuki India Limited @ ̀ 4621.95 | Mold-Tek Packaging Limited @ ̀ 319.40 | MT Educare Limited @ `183.10 | Reliance Capital Limited @ `438.3 | Reliance Power Limited @ `56.8 | Tata Consultancy Services Limited @ `2436.85 | The Great Eastern Shipping Company Limited @ ̀ 368.2 | Torrent Pharmaceuticals Limited @ ̀ 173.55Past performance may or may not be sustained in the market.This is a hypothetical exercise for improving the understanding of the investor on the deployment of his funds in the equity component of the portfolio and should not be construed to be actual holdings accruing to the Unitholder.The stocks referred to in this literature are not an endorsement by the Mutual Fund and AMC of their soundness or a recommendation to buy or sell these stocks.
10
Tata Consultancy Services Limited
Infosys Limited
HDFC Bank Limited
Bajaj Finserv Limited
Reliance Power Limited
Jagran Prakashan Limited
The Great Eastern Shipping Company Limited
Reliance Capital Limited
Maruti Suzuki India Limited
HCL Technologies Limited
3.63
3.58
3.58
3.55
3.30
2.94
2.75
2.69
2.63
2.48
15
32
33
18
582
184
75
61
6
29
Aditya Birla Nuvo Limited
Fiem Industries Limited
MT Educare Limited
APL Apollo Tubes Limited
Indo Count Industries Limited
Credit Analysis And ResearchLimited
Allcargo Logistics Limited
Mahindra Holidays & ResortsIndia Limited
Mold-Tek Packaging Limited
Torrent Pharmaceuticals Limited
5.67
5.16
5.16
4.73
4.38
3.93
3.90
3.78
3.65
2.90
26
65
282
63
40
30
193
83
114
167
*Kindly refer addendum dated September 29, 2012 for discontinued Plan viz Plan B & addendum dated Oct 19, 2012 for standardizing the nomenclature for existing Plan / Options
PRUDENT ADVANTAGE FundEquity Fund
FACTSHEET
(An Open-ended Equity scheme)
#Based on standard investment of `10,000 made at the beginning of the relevant period. ^Absolute ReturnsPast performance may or may not be sustained in future and should not be used as a basis for comparison with other investments.Since Inception returns are calculated on `10/- invested at inception of the Scheme. Returns shown above are for Growth Option only.Performance of the Dividend Option for the investor would be net of the dividend distribution tax, as applicable.
$Standard Benchmark prescribed by SEBI vide circular dated August 22, 2011.In case start /end date of the relevant period is a non-Business Day, the NAV of the previous Business Day is considered for computation of returns. ^^Standard Deviation for Edelweiss Equity Enhancer - Existing Plan only***Nifty 50 was the erstwhile benchmark of the Scheme as on the date of performance i.e. September 30, 2014 ̂ ^^Revised benchmark w.e.f September 10, 2014Note: For the performance of other Schemes managed by the Fund Managers, please refer to the relevant scheme.
TOP TWENTY EQUITY HOLDINGS
Period
Edelweiss PAF - Plan A
Edelweiss PAF (Direct Plan) Edelweiss PAF - Plan B* Scheme Benchmark
(Nifty 200 Index)^^^
$Alternate Benchmark(Nifty 50)
Risk Measurement -Standard Deviation^^
Returns Value #(INR) Returns # Value (INR) Returns # Value (INR) Returns # Value (INR) Returns Value
#(INR)PAF Nifty
200Nifty 50
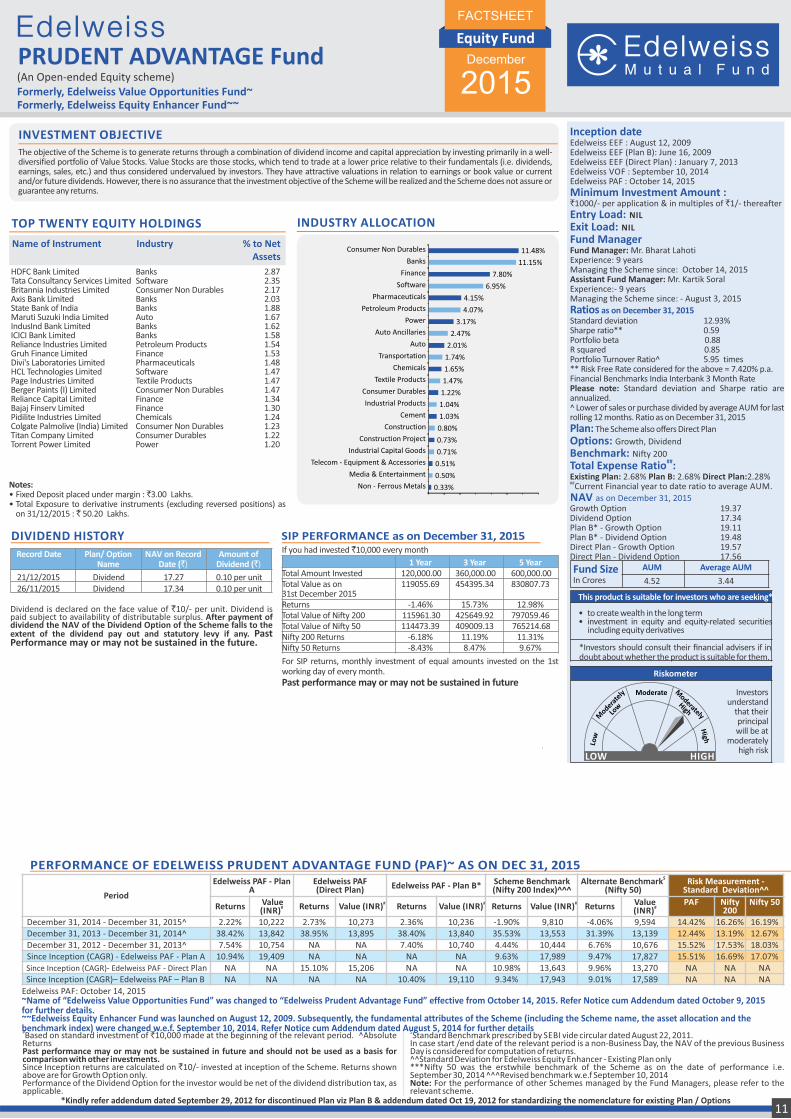
December 31, 2014 - December 31, 2015^ 2.22% 10,222 2.73% 10,273 2.36% 10,236 -1.90% 9,810 -4.06% 9,594 14.42% 16.26% 16.19%December 31, 2013 - December 31, 2014^ 38.42% 13,842 38.95% 13,895 38.40% 13,840 35.53% 13,553 31.39% 13,139 12.44% 13.19% 12.67%December 31, 2012 - December 31, 2013^ 7.54% 10,754 NA NA 7.40% 10,740 4.44% 10,444 6.76% 10,676 15.52% 17.53% 18.03%Since Inception (CAGR) - Edelweiss PAF - Plan A 10.94% 19,409 NA NA NA NA 9.63% 17,989 9.47% 17,827 15.51% 16.69% 17.07%
Since Inception (CAGR)- Edelweiss PAF - Direct Plan NA NA 15.10% 15,206 NA NA 10.98% 13,643 9.96% 13,270 NA NA NA Since Inception (CAGR)– Edelweiss PAF – Plan B NA NA NA NA 10.40% 19,110 9.34% 17,943 9.01% 17,589 NA NA NA
~Name of “Edelweiss Value Opportunities Fund” was changed to “Edelweiss Prudent Advantage Fund” effective from October 14, 2015. Refer Notice cum Addendum dated October 9, 2015 for further details.~~Edelweiss Equity Enhancer Fund was launched on August 12, 2009. Subsequently, the fundamental attributes of the Scheme (including the Scheme name, the asset allocation and the benchmark index) were changed w.e.f. September 10, 2014. Refer Notice cum Addendum dated August 5, 2014 for further details
Formerly, Edelweiss Value Opportunities Fund~Formerly, Edelweiss Equity Enhancer Fund~~
PERFORMANCE OF EDELWEISS PRUDENT ADVANTAGE FUND (PAF)~ AS ON DEC 31, 2015
Edelweiss PAF: October 14, 2015
Name of Instrument Industry % to Net Assets
HDFC Bank Limited Banks 2.87Tata Consultancy Services Limited Software 2.35Britannia Industries Limited Consumer Non Durables 2.17Axis Bank Limited Banks 2.03State Bank of India Banks 1.88Maruti Suzuki India Limited Auto 1.67IndusInd Bank Limited Banks 1.62ICICI Bank Limited Banks 1.58Reliance Industries Limited Petroleum Products 1.54Gruh Finance Limited Finance 1.53Divi's Laboratories Limited Pharmaceuticals 1.48HCL Technologies Limited Software 1.47Page Industries Limited Textile Products 1.47Berger Paints (I) Limited Consumer Non Durables 1.47Reliance Capital Limited Finance 1.34Bajaj Finserv Limited Finance 1.30Pidilite Industries Limited Chemicals 1.24Colgate Palmolive (India) Limited Consumer Non Durables 1.23Titan Company Limited Consumer Durables 1.22Torrent Power Limited Power 1.20
Notes: • Fixed Deposit placed under margin : ̀ 3.00 Lakhs.• Total Exposure to derivative instruments (excluding reversed positions) as
on 31/12/2015 : ̀ 50.20 Lakhs.
Inception date Edelweiss EEF : August 12, 2009Edelweiss EEF (Plan B): June 16, 2009Edelweiss EEF (Direct Plan) : January 7, 2013Edelweiss VOF : September 10, 2014Edelweiss PAF : October 14, 2015
Minimum Investment Amount : `1000/- per application & in multiples of `1/- thereafter
Entry Load: NIL
Exit Load: NIL
Fund ManagerFund Manager: Mr. Bharat LahotiExperience: 9 years Managing the Scheme since: October 14, 2015Assistant Fund Manager: Mr. Kartik SoralExperience:- 9 years Managing the Scheme since: - August 3, 2015
Ratios as on December 31, 2015Standard deviation 12.93%Sharpe ratio** 0.59Portfolio beta 0.88R squared 0.85Portfolio Turnover Ratio^ 5.95 times** Risk Free Rate considered for the above = 7.420% p.a. Financial Benchmarks India Interbank 3 Month RatePlease note: Standard deviation and Sharpe ratio are annualized. ^ Lower of sales or purchase divided by average AUM for last rolling 12 months. Ratio as on December 31, 2015
Plan: The Scheme also offers Direct Plan
Growth, DividendOptions: Benchmark: Nifty 200
##Total Expense Ratio : Existing Plan: 2.68% Plan B: 2.68% Direct Plan:2.28%##Current Financial year to date ratio to average AUM.
NAV as on December 31, 2015Growth Option 19.37Dividend Option 17.34Plan B* - Growth Option 19.11Plan B* - Dividend Option 19.48Direct Plan - Growth Option 19.57Direct Plan - Dividend Option 17.56
The objective of the Scheme is to generate returns through a combination of dividend income and capital appreciation by investing primarily in a well-diversified portfolio of Value Stocks. Value Stocks are those stocks, which tend to trade at a lower price relative to their fundamentals (i.e. dividends, earnings, sales, etc.) and thus considered undervalued by investors. They have attractive valuations in relation to earnings or book value or current and/or future dividends. However, there is no assurance that the investment objective of the Scheme will be realized and the Scheme does not assure or guarantee any returns.
INVESTMENT OBJECTIVE
INDUSTRY ALLOCATION
Dividend is declared on the face value of `10/- per unit. Dividend is paid subject to availability of distributable surplus. After payment of dividend the NAV of the Dividend Option of the Scheme falls to the extent of the dividend pay out and statutory levy if any. Past Performance may or may not be sustained in the future.
DIVIDEND HISTORY
Fund SizeIn Crores
AUM Average AUM
4.52 3.44
LOW HIGH
Investors understand
that their principal will be at
moderately high risk
Riskometer
This product is suitable for investors who are seeking*:
• to create wealth in the long term• investment in equity and equity-related securities
including equity derivatives
*Investors should consult their financial advisers if in doubt about whether the product is suitable for them.
December
2015
21/12/2015 Dividend 17.27 0.10 per unit26/11/2015 Dividend 17.34 0.10 per unit
For SIP returns, monthly investment of equal amounts invested on the 1st working day of every month. Past performance may or may not be sustained in future
SIP PERFORMANCE as on December 31, 2015If you had invested `10,000 every month
1 Year 3 Year 5 YearTotal Amount Invested 120,000.00 360,000.00 600,000.00 Total Value as on 119055.69 454395.34 830807.7331st December 2015 Returns -1.46% 15.73% 12.98% Total Value of Nifty 200 115961.30 425649.92 797059.46Total Value of Nifty 50 114473.39 409009.13 765214.68 Nifty 200 Returns -6.18% 11.19% 11.31%Nifty 50 Returns -8.43% 8.47% 9.67%
11
Record Date Plan/ Option NAV on Record Amount of Name Date (`) Dividend (`)
0.33%
0.50%
0.51%
0.71%
0.73%
0.80%
1.03%
1.04%
1.22%
1.47%
1.65%
1.74%
2.01%
2.47%
3.17%
4.07%
4.15%
6.95%
7.80%
11.15%
11.48%
Non - Ferrous Metals
Media & Entertainment
Telecom - Equipment & Accessories
Industrial Capital Goods
Construction Project
Construction
Cement
Industrial Products
Consumer Durables
Textile Products
Chemicals
Transportation
Auto
Auto Ancillaries
Power
Petroleum Products
Pharmaceuticals
Software
Finance
Banks
Consumer Non Durables
ARBITRAGE FundEquity Fund
FACTSHEET
(An Open-ended Equity scheme)
December
2015
EDELWEISS ARBITRAGE FUND ( Edelweiss ARB)
Period
Edelweiss ARB(Regular Plan)
Edelweiss ARB -(Direct Plan)
Scheme Benchmark(Crisil Liquid Fund Index )
$Alternate Benchmark(Nifty 50)
Risk Measurement -Standard Deviation
Returns # Value (INR) Returns # Value (INR) Returns# Value (INR) Returns
Value #(INR)
Edelweiss ARB
Crisil Liquid Nifty 50
December 31, 2014 - December 31, 2015^ 7.96% 10,796 8.29% 10,829 8.23% 10,823 -4.06% 9,594 1.13% 0.32% 16.19%
Since Inception (CAGR) - Edelweiss ARB - Regular Plan 8.29% 11,280 NA NA 8.44% 11,304 3.82% 10,583 1.06% 0.34% 15.08%
Since Inception (CAGR) - Edelweiss ARB - Direct Plan NA NA 8.66% 11,338 8.44% 11,304 3.82% 10,583 NA NA NA#Based on standard investment of ̀ 10,000 made at the beginning of the relevant period. ^Absolute ReturnsPast performance may or may not be sustained in future and should not be used as a basis for comparison with other investments.Since Inception returns are calculated on ̀ 10/- invested at inception of the schemeReturns shown above are for Growth Option only.Performance of the Dividend Option for the investor would be net of the dividend
distribution tax, as applicable.$Standard Benchmark prescribed by SEBI vide circular dated August 22, 2011.In case start /end date of the relevant period is a non-Business Day, the NAV of the previous Business Day is considered for computation of returns.Note: For the performance of other Schemes managed by the Fund Managers, please refer to the relevant scheme.
FUND PERFORMANCE AS ON DEC 31, 2015
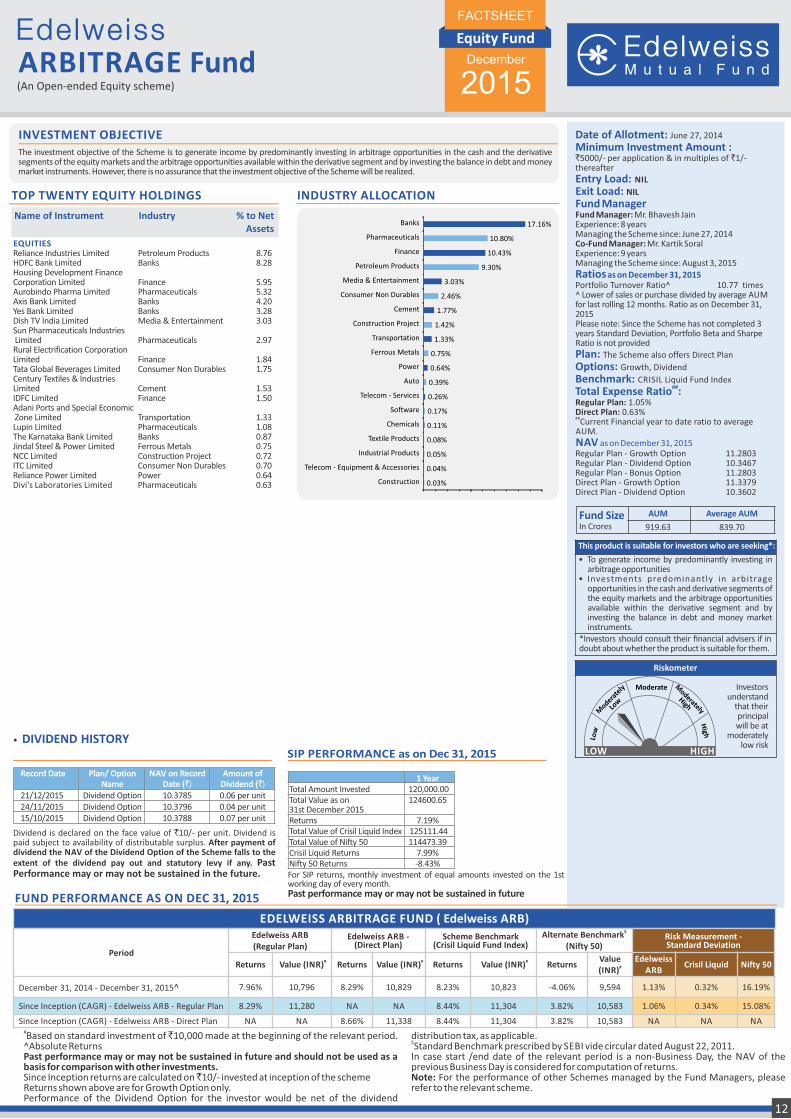
Name of Instrument Industry % to Net Assets
TOP TWENTY EQUITY HOLDINGS
Petroleum Products 8.76Banks 8.28
Finance 5.95Pharmaceuticals 5.32Banks 4.20Banks 3.28Media & Entertainment 3.03
Pharmaceuticals 2.97
Finance 1.84Consumer Non Durables 1.75
Cement 1.53Finance 1.50
Transportation 1.33Pharmaceuticals 1.08Banks 0.87Ferrous Metals 0.75Construction Project 0.72Consumer Non Durables 0.70Power 0.64Pharmaceuticals 0.63
EQUITIES Reliance Industries Limited HDFC Bank Limited Housing Development Finance Corporation Limited Aurobindo Pharma Limited Axis Bank Limited Yes Bank Limited Dish TV India Limited Sun Pharmaceuticals Industries Limited Rural Electrification Corporation Limited Tata Global Beverages Limited Century Textiles & Industries Limited IDFC Limited Adani Ports and Special Economic Zone Limited Lupin Limited The Karnataka Bank Limited Jindal Steel & Power Limited NCC Limited ITC Limited Reliance Power Limited Divi's Laboratories Limited
Date of Allotment: June 27, 2014
Minimum Investment Amount : `5000/- per application & in multiples of `1/- thereafter
Entry Load: NIL
Exit Load: NIL
Fund ManagerFund Manager: Mr. Bhavesh JainExperience: 8 years Managing the Scheme since: June 27, 2014Co-Fund Manager: Mr. Kartik SoralExperience: 9 years Managing the Scheme since: August 3, 2015
Ratios as on December 31, 2015Portfolio Turnover Ratio^ 10.77 times^ Lower of sales or purchase divided by average AUM for last rolling 12 months. Ratio as on December 31, 2015Please note: Since the Scheme has not completed 3 years Standard Deviation, Portfolio Beta and Sharpe Ratio is not provided
Plan: The Scheme also offers Direct Plan
Growth, DividendOptions: Benchmark: CRISIL Liquid Fund Index
##Total Expense Ratio : Regular Plan: 1.05%Direct Plan: 0.63%##Current Financial year to date ratio to average AUM.
NAV as on December 31, 2015Regular Plan - Growth Option 11.2803Regular Plan - Dividend Option 10.3467Regular Plan - Bonus Option 11.2803Direct Plan - Growth Option 11.3379Direct Plan - Dividend Option 10.3602
This product is suitable for investors who are seeking*:
• To generate income by predominantly investing in arbitrage opportunities
• Investments predominantly in arbitrage opportunities in the cash and derivative segments of the equity markets and the arbitrage opportunities available within the derivative segment and by investing the balance in debt and money market instruments.
*Investors should consult their financial advisers if in doubt about whether the product is suitable for them.
LOW HIGH
Investors understand
that their principal will be at
moderately low risk
Riskometer
The investment objective of the Scheme is to generate income by predominantly investing in arbitrage opportunities in the cash and the derivative segments of the equity markets and the arbitrage opportunities available within the derivative segment and by investing the balance in debt and money market instruments. However, there is no assurance that the investment objective of the Scheme will be realized.
INVESTMENT OBJECTIVE
INDUSTRY ALLOCATION
Dividend is declared on the face value of `10/- per unit. Dividend is paid subject to availability of distributable surplus. After payment of dividend the NAV of the Dividend Option of the Scheme falls to the extent of the dividend pay out and statutory levy if any. Past Performance may or may not be sustained in the future.
• DIVIDEND HISTORY
Record Date Plan/ Option NAV on Record Amount of Name Date (`) Dividend (`)
21/12/2015 Dividend Option 10.3785 0.06 per unit 24/11/2015 Dividend Option 10.3796 0.04 per unit15/10/2015 Dividend Option 10.3788 0.07 per unit
Fund SizeIn Crores
AUM Average AUM
919.63 839.70
If you had invested `10,000 every month
For SIP returns, monthly investment of equal amounts invested on the 1st working day of every month. Past performance may or may not be sustained in future
SIP PERFORMANCE as on Dec 31, 2015
1 Year 3 Year 5 YearTotal Amount Invested 120,000.00 Total Value as on 124600.65 31st December 2015 Returns 7.19% Total Value of Crisil Liquid Index 125111.44 Total Value of Nifty 50 114473.39 Crisil Liquid Returns 7.99% Nifty 50 Returns -8.43%
12
0.03%
0.04%
0.05%
0.08%
0.11%
0.17%
0.26%
0.39%
0.64%
0.75%
1.33%
1.42%
1.77%
2.46%
3.03%
9.30%
10.43%
10.80%
17.16%
Construction
Telecom - Equipment & Accessories
Industrial Products
Textile Products
Chemicals
Software
Telecom - Services
Auto
Power
Ferrous Metals
Transportation
Construction Project
Cement
Consumer Non Durables
Media & Entertainment
Petroleum Products
Finance
Pharmaceuticals
Banks
#Based on standard investment of `10,000 made at the beginning of the relevant period. ^Absolute ReturnsPast performance may or may not be sustained in future and should not be used as a basis for comparison with other investments.Since Inception returns are calculated on ̀ 10/- invested at inception of the schemeReturns shown above are for Growth Option only.Performance of the Dividend Option for the investor would be net of the dividend distribution tax, as applicable.
$Standard Benchmark prescribed by SEBI vide circular dated August 22, 2011.^^CRISIL MIP Blended Index was the erstwhile benchmark of the Scheme as on the date of Performance detail i.e. March 28, 2014. ̂ ^^Revised benchmark w.e.f May 16, 2014In case start /end date of the relevant period is a non-Business Day, the NAV of the previous Business Day is considered for computation of returns.Note: For the performance of other Schemes managed by the Fund Managers, please refer to the relevant scheme.
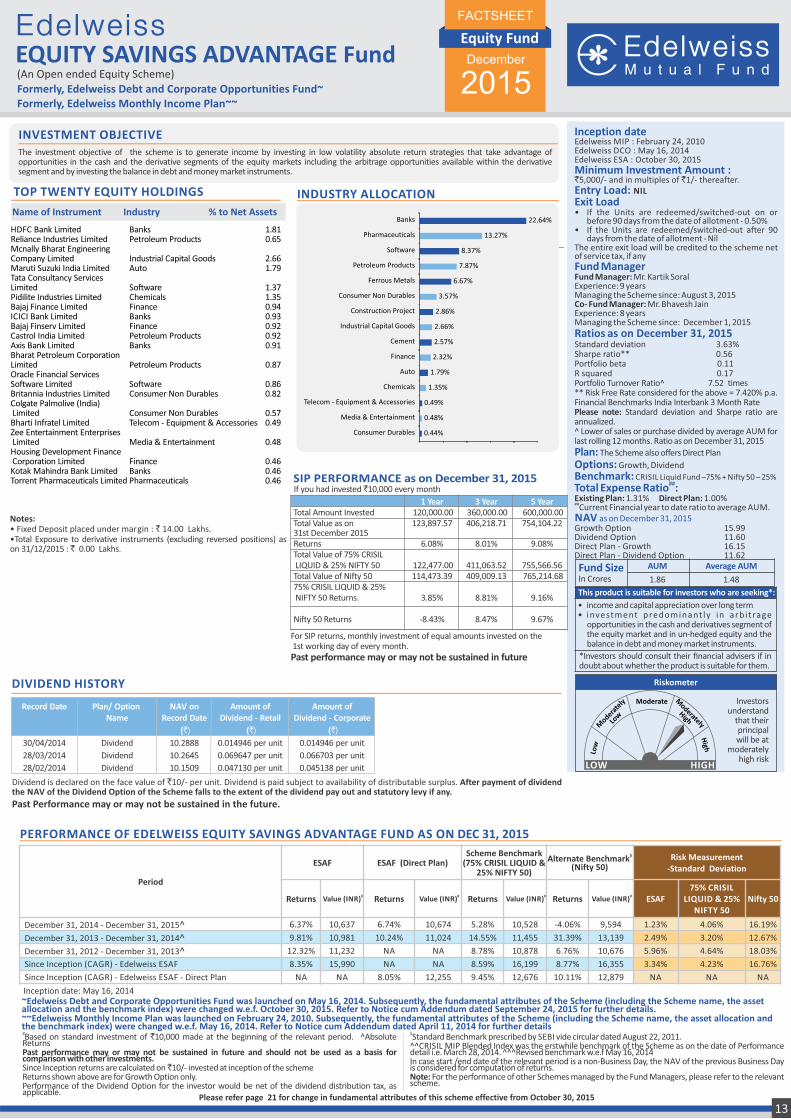
EQUITY SAVINGS ADVANTAGE Fund(An Open ended Equity Scheme)Formerly, Edelweiss Debt and Corporate Opportunities Fund~Formerly, Edelweiss Monthly Income Plan~~
Name of Instrument Industry % to Net Assets
HDFC Bank Limited Banks 1.81Reliance Industries Limited Petroleum Products 0.65Mcnally Bharat Engineering Company Limited Industrial Capital Goods 2.66Maruti Suzuki India Limited Auto 1.79Tata Consultancy Services Limited Software 1.37Pidilite Industries Limited Chemicals 1.35Bajaj Finance Limited Finance 0.94ICICI Bank Limited Banks 0.93Bajaj Finserv Limited Finance 0.92Castrol India Limited Petroleum Products 0.92Axis Bank Limited Banks 0.91Bharat Petroleum Corporation Limited Petroleum Products 0.87Oracle Financial Services Software Limited Software 0.86Britannia Industries Limited Consumer Non Durables 0.82Colgate Palmolive (India) Limited Consumer Non Durables 0.57Bharti Infratel Limited Telecom - Equipment & Accessories 0.49Zee Entertainment Enterprises Limited Media & Entertainment 0.48Housing Development Finance Corporation Limited Finance 0.46Kotak Mahindra Bank Limited Banks 0.46Torrent Pharmaceuticals Limited Pharmaceuticals 0.46
Dividend is declared on the face value of `10/- per unit. Dividend is paid subject to availability of distributable surplus. After payment of dividend the NAV of the Dividend Option of the Scheme falls to the extent of the dividend pay out and statutory levy if any.
Past Performance may or may not be sustained in the future.
Record Date Plan/ Option NAV on Amount of Amount of Name Record Date Dividend - Retail Dividend - Corporate
(`) (`) (`)
30/04/2014 Dividend 10.2888 0.014946 per unit 0.014946 per unit
28/03/2014 Dividend 10.2645 0.069647 per unit 0.066703 per unit
28/02/2014 Dividend 10.1509 0.047130 per unit 0.045138 per unit
DIVIDEND HISTORY
~Edelweiss Debt and Corporate Opportunities Fund was launched on May 16, 2014. Subsequently, the fundamental attributes of the Scheme (including the Scheme name, the asset allocation and the benchmark index) were changed w.e.f. October 30, 2015. Refer to Notice cum Addendum dated September 24, 2015 for further details.~~Edelweiss Monthly Income Plan was launched on February 24, 2010. Subsequently, the fundamental attributes of the Scheme (including the Scheme name, the asset allocation and the benchmark index) were changed w.e.f. May 16, 2014. Refer to Notice cum Addendum dated April 11, 2014 for further details
PERFORMANCE OF EDELWEISS EQUITY SAVINGS ADVANTAGE FUND AS ON DEC 31, 2015
Inception date: May 16, 2014
Equity Fund
FACTSHEET
December
2015
Notes: • Fixed Deposit placed under margin : ` 14.00 Lakhs.• Total Exposure to derivative instruments (excluding reversed positions) as on 31/12/2015 : ̀ 0.00 Lakhs.
Inception date Edelweiss MIP : February 24, 2010Edelweiss DCO : May 16, 2014 Edelweiss ESA : October 30, 2015Minimum Investment Amount : `5,000/- and in multiples of `1/- thereafter.Entry Load: NIL
Exit Load• If the Units are redeemed/switched-out on or
before 90 days from the date of allotment - 0.50%• If the Units are redeemed/switched-out after 90
days from the date of allotment - NilThe entire exit load will be credited to the scheme net of service tax, if any Fund Manager Fund Manager: Mr. Kartik Soral Experience: 9 years Managing the Scheme since: August 3, 2015Co- Fund Manager: Mr. Bhavesh JainExperience: 8 years Managing the Scheme since: December 1, 2015
Ratios as on December 31, 2015Standard deviation 3.63%Sharpe ratio** 0.56Portfolio beta 0.11R squared 0.17Portfolio Turnover Ratio^ 7.52 times** Risk Free Rate considered for the above = 7.420% p.a. Financial Benchmarks India Interbank 3 Month RatePlease note: Standard deviation and Sharpe ratio are annualized. ^ Lower of sales or purchase divided by average AUM for last rolling 12 months. Ratio as on December 31, 2015
Plan: The Scheme also offers Direct Plan
Options: Growth, Dividend
Benchmark: CRISIL Liquid Fund –75% + Nifty 50 – 25%##Total Expense Ratio :
Existing Plan: 1.31% Direct Plan: 1.00%##Current Financial year to date ratio to average AUM.NAV as on December 31, 2015Growth Option 15.99 Dividend Option 11.60Direct Plan - Growth 16.15Direct Plan - Dividend Option 11.62
LOW HIGH
Investors understand
that their principal will be at
moderately high risk
Riskometer
This product is suitable for investors who are seeking*:
• income and capital appreciation over long term• investment predominant ly in arb i t rage
opportunities in the cash and derivatives segment of the equity market and in un-hedged equity and the balance in debt and money market instruments.
*Investors should consult their financial advisers if in doubt about whether the product is suitable for them.
The investment objective of the scheme is to generate income by investing in low volatility absolute return strategies that take advantage of opportunities in the cash and the derivative segments of the equity markets including the arbitrage opportunities available within the derivative segment and by investing the balance in debt and money market instruments.
INVESTMENT OBJECTIVE
INDUSTRY ALLOCATION
Fund SizeIn Crores
AUM Average AUM
1.86 1.48
Please refer page 21 for change in fundamental attributes of this scheme effective from October 30, 2015
13
TOP TWENTY EQUITY HOLDINGS
For SIP returns, monthly investment of equal amounts invested on the 1st working day of every month. Past performance may or may not be sustained in future
SIP PERFORMANCE as on December 31, 2015If you had invested `10,000 every month
1 Year 3 Year 5 YearTotal Amount Invested 120,000.00 360,000.00 600,000.00 Total Value as on 123,897.57 406,218.71 754,104.2231st December 2015 Returns 6.08% 8.01% 9.08% Total Value of 75% CRISIL LIQUID & 25% NIFTY 50 122,477.00 411,063.52 755,566.56Total Value of Nifty 50 114,473.39 409,009.13 765,214.68 75% CRISIL LIQUID & 25% NIFTY 50 Returns. 3.85% 8.81% 9.16%
Nifty 50 Returns -8.43% 8.47% 9.67%
Period
ESAF ESAF (Direct Plan)Scheme Benchmark
(75% CRISIL LIQUID & 25% NIFTY 50)
$Alternate Benchmark(Nifty 50)
Risk Measurement-Standard Deviation
Returns # Value (INR) Returns # Value (INR) Returns # Value (INR) Returns # Value (INR) ESAF75% CRISIL
LIQUID & 25% NIFTY 50
Nifty 50
December 31, 2014 - December 31, 2015^ 6.37% 10,637 6.74% 10,674 5.28% 10,528 -4.06% 9,594 1.23% 4.06% 16.19%
December 31, 2013 - December 31, 2014^ 9.81% 10,981 10.24% 11,024 14.55% 11,455 31.39% 13,139 2.49% 3.20% 12.67%
December 31, 2012 - December 31, 2013^ 12.32% 11,232 NA NA 8.78% 10,878 6.76% 10,676 5.96% 4.64% 18.03%
Since Inception (CAGR) - Edelweiss ESAF 8.35% 15,990 NA NA 8.59% 16,199 8.77% 16,355 3.34% 4.23% 16.76%
Since Inception (CAGR) - Edelweiss ESAF - Direct Plan NA NA 8.05% 12,255 9.45% 12,676 10.11% 12,879 NA NA NA
Telecom - Equipment & Accessories
0.44%
0.48%
0.49%
1.35%
1.79%
2.32%
2.57%
2.66%
2.86%
3.57%
6.67%
7.87%
8.37%
13.27%
22.64%
Consumer Durables
Media & Entertainment
Chemicals
Auto
Finance
Cement
Industrial Capital Goods
Construction Project
Consumer Non Durables
Ferrous Metals
Petroleum Products
Software
Pharmaceuticals
Banks
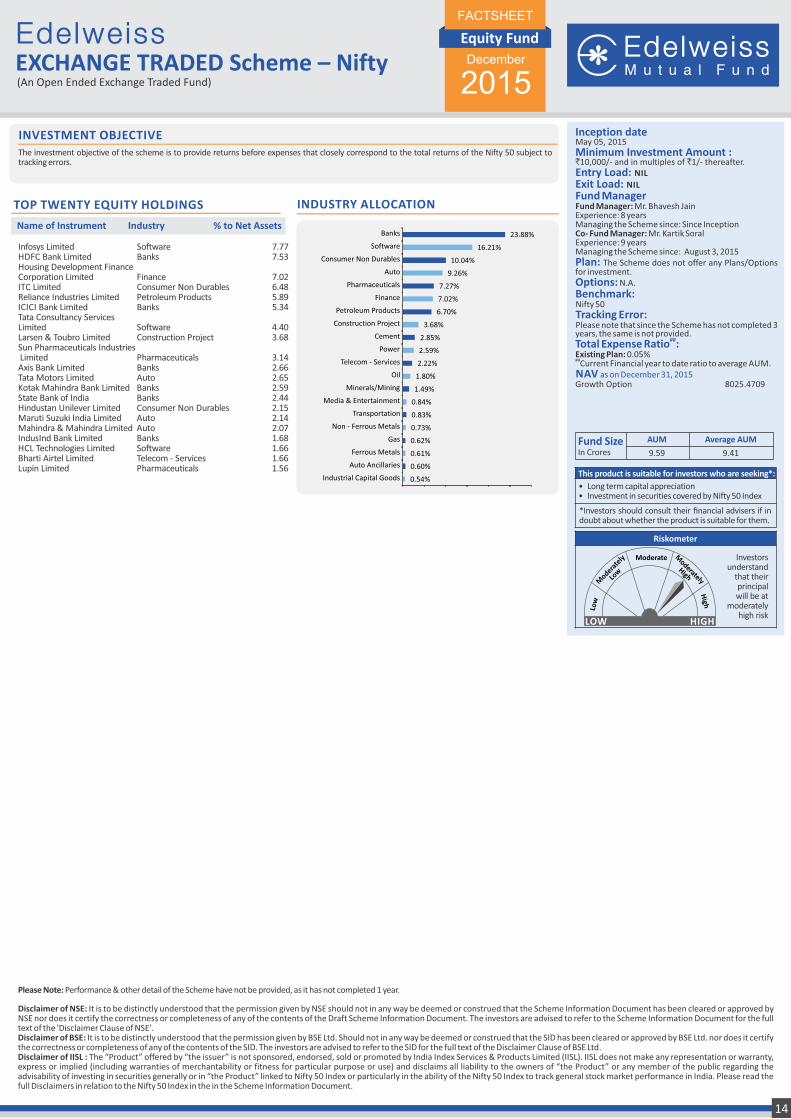
EXCHANGE TRADED Scheme – Nifty(An Open Ended Exchange Traded Fund)
Inception date May 05, 2015Minimum Investment Amount : `10,000/- and in multiples of `1/- thereafter.Entry Load: NIL
Exit Load: NIL
Fund Manager Fund Manager: Mr. Bhavesh JainExperience: 8 years Managing the Scheme since: Since InceptionCo- Fund Manager: Mr. Kartik SoralExperience: 9 years Managing the Scheme since: August 3, 2015Plan: The Scheme does not offer any Plans/Options for investment.Options: N.A.
Benchmark: Nifty 50Tracking Error:Please note that since the Scheme has not completed 3 years, the same is not provided.
##Total Expense Ratio : Existing Plan: 0.05%##Current Financial year to date ratio to average AUM.NAV as on December 31, 2015Growth Option 8025.4709
LOW HIGH
Investors understand
that their principal will be at
moderately high risk
Riskometer
This product is suitable for investors who are seeking*:
• Long term capital appreciation• Investment in securities covered by Nifty 50 Index
*Investors should consult their financial advisers if in doubt about whether the product is suitable for them.
The investment objective of the scheme is to provide returns before expenses that closely correspond to the total returns of the Nifty 50 subject to tracking errors.
INVESTMENT OBJECTIVE
Fund SizeIn Crores
AUM Average AUM
9.59 9.41
Please Note: Performance & other detail of the Scheme have not be provided, as it has not completed 1 year.
Disclaimer of NSE: It is to be distinctly understood that the permission given by NSE should not in any way be deemed or construed that the Scheme Information Document has been cleared or approved by NSE nor does it certify the correctness or completeness of any of the contents of the Draft Scheme Information Document. The investors are advised to refer to the Scheme Information Document for the full text of the 'Disclaimer Clause of NSE'. Disclaimer of BSE: It is to be distinctly understood that the permission given by BSE Ltd. Should not in any way be deemed or construed that the SID has been cleared or approved by BSE Ltd. nor does it certify the correctness or completeness of any of the contents of the SID. The investors are advised to refer to the SID for the full text of the Disclaimer Clause of BSE Ltd. Disclaimer of IISL : The “Product” offered by “the issuer” is not sponsored, endorsed, sold or promoted by India Index Services & Products Limited (IISL). IISL does not make any representation or warranty, express or implied (including warranties of merchantability or fitness for particular purpose or use) and disclaims all liability to the owners of “the Product” or any member of the public regarding the advisability of investing in securities generally or in “the Product” linked to Nifty 50 Index or particularly in the ability of the Nifty 50 Index to track general stock market performance in India. Please read the full Disclaimers in relation to the Nifty 50 Index in the in the Scheme Information Document.
14
Name of Instrument Industry % to Net Assets
Infosys Limited Software 7.77HDFC Bank Limited Banks 7.53Housing Development Finance Corporation Limited Finance 7.02ITC Limited Consumer Non Durables 6.48Reliance Industries Limited Petroleum Products 5.89ICICI Bank Limited Banks 5.34Tata Consultancy Services Limited Software 4.40Larsen & Toubro Limited Construction Project 3.68Sun Pharmaceuticals Industries Limited Pharmaceuticals 3.14Axis Bank Limited Banks 2.66Tata Motors Limited Auto 2.65Kotak Mahindra Bank Limited Banks 2.59State Bank of India Banks 2.44Hindustan Unilever Limited Consumer Non Durables 2.15Maruti Suzuki India Limited Auto 2.14Mahindra & Mahindra Limited Auto 2.07IndusInd Bank Limited Banks 1.68HCL Technologies Limited Software 1.66Bharti Airtel Limited Telecom - Services 1.66Lupin Limited Pharmaceuticals 1.56
INDUSTRY ALLOCATIONTOP TWENTY EQUITY HOLDINGS
0.54%
0.60%
0.61%
0.62%
0.73%
0.83%
0.84%
1.49%
1.80%
2.22%
2.59%
2.85%
3.68%
6.70%
7.02%
7.27%
9.26%
10.04%
16.21%
23.88%
Industrial Capital Goods
Auto Ancillaries
Ferrous Metals
Gas
Non - Ferrous Metals
Transportation
Media & Entertainment
Minerals/Mining
Oil
Telecom - Services
Power
Cement
Construction Project
Petroleum Products
Finance
Pharmaceuticals
Auto
Consumer Non Durables
Software
Banks
Equity Fund
FACTSHEET
December
2015
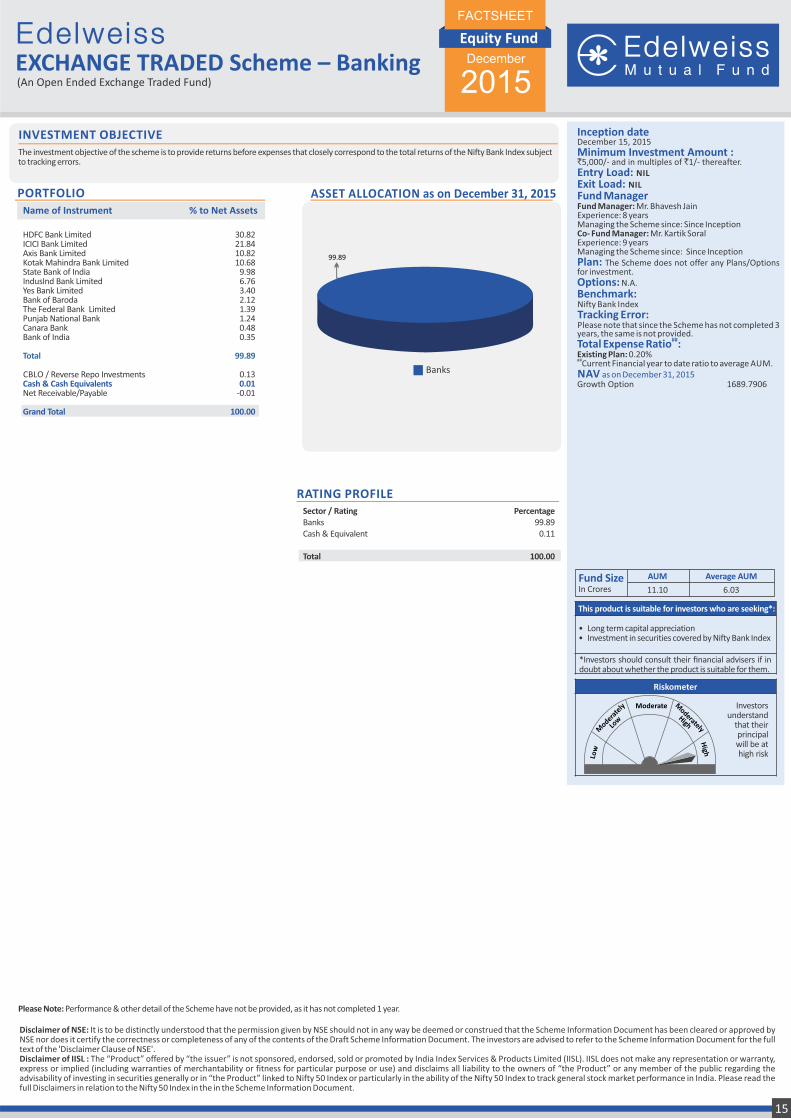
Equity Fund
FACTSHEET
ASSET ALLOCATION as on December 31, 2015Name of Instrument % to Net Assets
PORTFOLIO
HDFC Bank Limited 30.82ICICI Bank Limited 21.84Axis Bank Limited 10.82Kotak Mahindra Bank Limited 10.68State Bank of India 9.98IndusInd Bank Limited 6.76Yes Bank Limited 3.40Bank of Baroda 2.12The Federal Bank Limited 1.39Punjab National Bank 1.24Canara Bank 0.48Bank of India 0.35
Total 99.89
CBLO / Reverse Repo Investments 0.13Cash & Cash Equivalents 0.01 Net Receivable/Payable -0.01
Grand Total 100.00
December
2015
Investors understand
that their principal will be at high risk
Riskometer
This product is suitable for investors who are seeking*:
• Long term capital appreciation• Investment in securities covered by Nifty Bank Index
*Investors should consult their financial advisers if in doubt about whether the product is suitable for them.
RATING PROFILESector / Rating PercentageBanks 99.89Cash & Equivalent 0.11
Total 100.00
The investment objective of the scheme is to provide returns before expenses that closely correspond to the total returns of the Nifty Bank Index subject to tracking errors.
INVESTMENT OBJECTIVE
Fund SizeIn Crores
AUM Average AUM
11.10 6.03
15
EXCHANGE TRADED Scheme – Banking(An Open Ended Exchange Traded Fund)
Inception date December 15, 2015Minimum Investment Amount : `5,000/- and in multiples of `1/- thereafter.Entry Load: NIL
Exit Load: NIL
Fund Manager Fund Manager: Mr. Bhavesh JainExperience: 8 years Managing the Scheme since: Since InceptionCo- Fund Manager: Mr. Kartik SoralExperience: 9 years Managing the Scheme since: Since InceptionPlan: The Scheme does not offer any Plans/Options for investment.Options: N.A.
Benchmark: Nifty Bank IndexTracking Error:Please note that since the Scheme has not completed 3 years, the same is not provided.
##Total Expense Ratio : Existing Plan: 0.20%##Current Financial year to date ratio to average AUM.NAV as on December 31, 2015Growth Option 1689.7906
Disclaimer of NSE: It is to be distinctly understood that the permission given by NSE should not in any way be deemed or construed that the Scheme Information Document has been cleared or approved by NSE nor does it certify the correctness or completeness of any of the contents of the Draft Scheme Information Document. The investors are advised to refer to the Scheme Information Document for the full text of the 'Disclaimer Clause of NSE'. Disclaimer of IISL : The “Product” offered by “the issuer” is not sponsored, endorsed, sold or promoted by India Index Services & Products Limited (IISL). IISL does not make any representation or warranty, express or implied (including warranties of merchantability or fitness for particular purpose or use) and disclaims all liability to the owners of “the Product” or any member of the public regarding the advisability of investing in securities generally or in “the Product” linked to Nifty 50 Index or particularly in the ability of the Nifty 50 Index to track general stock market performance in India. Please read the full Disclaimers in relation to the Nifty 50 Index in the in the Scheme Information Document.
99.89
Banks
Please Note: Performance & other detail of the Scheme have not be provided, as it has not completed 1 year.
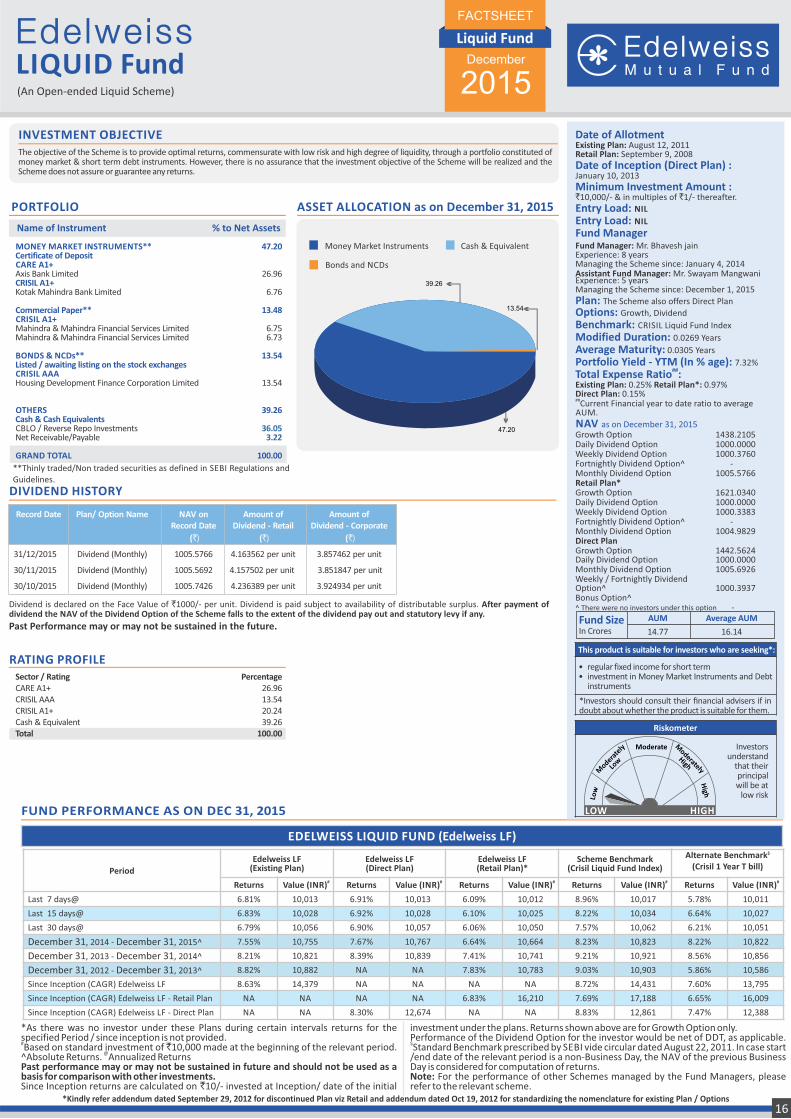
*Kindly refer addendum dated September 29, 2012 for discontinued Plan viz Retail and addendum dated Oct 19, 2012 for standardizing the nomenclature for existing Plan / Options
LIQUID FundLiquid Fund
FACTSHEET
(An Open-ended Liquid Scheme)
FUND PERFORMANCE AS ON DEC 31, 2015
*As there was no investor under these Plans during certain intervals returns for the specified Period / since inception is not provided.#Based on standard investment of `10,000 made at the beginning of the relevant period.
@^Absolute Returns. Annualized ReturnsPast performance may or may not be sustained in future and should not be used as a basis for comparison with other investments.Since Inception returns are calculated on `10/- invested at Inception/ date of the initial
investment under the plans. Returns shown above are for Growth Option only.Performance of the Dividend Option for the investor would be net of DDT, as applicable. $Standard Benchmark prescribed by SEBI vide circular dated August 22, 2011. In case start /end date of the relevant period is a non-Business Day, the NAV of the previous Business Day is considered for computation of returns.Note: For the performance of other Schemes managed by the Fund Managers, please refer to the relevant scheme.
Period
Edelweiss LF (Existing Plan)
Edelweiss LF (Direct Plan)
Edelweiss LF(Retail Plan)*
Scheme Benchmark(Crisil Liquid Fund Index)
$Alternate Benchmark(Crisil 1 Year T bill)
Returns # Value (INR) Returns # Value (INR) Returns # Value (INR) Returns # Value (INR) Returns #Value (INR)
Last 7 days@ 6.81% 10,013 6.91% 10,013 6.09% 10,012 8.96% 10,017 5.78% 10,011
Last 15 days@ 6.83% 10,028 6.92% 10,028 6.10% 10,025 8.22% 10,034 6.64% 10,027
Last 30 days@ 6.79% 10,056 6.90% 10,057 6.06% 10,050 7.57% 10,062 6.21% 10,051
December 31, 2014 - December 31, 2015^ 7.55% 10,755 7.67% 10,767 6.64% 10,664 8.23% 10,823 8.22% 10,822
December 31, 2013 - December 31, 2014^ 8.21% 10,821 8.39% 10,839 7.41% 10,741 9.21% 10,921 8.56% 10,856
December 31, 2012 - December 31, 2013^ 8.82% 10,882 NA NA 7.83% 10,783 9.03% 10,903 5.86% 10,586
Since Inception (CAGR) Edelweiss LF 8.63% 14,379 NA NA NA NA 8.72% 14,431 7.60% 13,795
Since Inception (CAGR) Edelweiss LF - Retail Plan NA NA NA NA 6.83% 16,210 7.69% 17,188 6.65% 16,009
Since Inception (CAGR) Edelweiss LF - Direct Plan NA NA 8.30% 12,674 NA NA 8.83% 12,861 7.47% 12,388
EDELWEISS LIQUID FUND (Edelweiss LF)
Name of Instrument % to Net Assets
PORTFOLIO
**Thinly traded/Non traded securities as defined in SEBI Regulations and Guidelines.
Dividend is declared on the Face Value of `1000/- per unit. Dividend is paid subject to availability of distributable surplus. After payment of dividend the NAV of the Dividend Option of the Scheme falls to the extent of the dividend pay out and statutory levy if any.
Past Performance may or may not be sustained in the future.
DIVIDEND HISTORY
RATING PROFILE
Record Date Plan/ Option Name NAV on Amount of Amount of Record Date Dividend - Retail Dividend - Corporate
(`) (`) (`)
31/12/2015 Dividend (Monthly) 1005.5766 4.163562 per unit 3.857462 per unit
30/11/2015 Dividend (Monthly) 1005.5692 4.157502 per unit 3.851847 per unit
30/10/2015 Dividend (Monthly) 1005.7426 4.236389 per unit 3.924934 per unit
December
2015
Cash & Equivalent
39.26
ASSET ALLOCATION as on December 31, 2015
Money Market Instruments
47.20
Bonds and NCDs
13.54
MONEY MARKET INSTRUMENTS** 47.20Certificate of Deposit CARE A1+Axis Bank Limited 26.96CRISIL A1+Kotak Mahindra Bank Limited 6.76
Commercial Paper** 13.48CRISIL A1+Mahindra & Mahindra Financial Services Limited 6.75Mahindra & Mahindra Financial Services Limited 6.73
BONDS & NCDs** 13.54Listed / awaiting listing on the stock exchangesCRISIL AAA Housing Development Finance Corporation Limited 13.54
OTHERS 39.26Cash & Cash Equivalents CBLO / Reverse Repo Investments 36.05Net Receivable/Payable 3.22
GRAND TOTAL 100.00
Sector / Rating PercentageCARE A1+ 26.96CRISIL AAA 13.54CRISIL A1+ 20.24Cash & Equivalent 39.26Total 100.00
Date of AllotmentExisting Plan: August 12, 2011Retail Plan: September 9, 2008
Date of Inception (Direct Plan) :January 10, 2013
Minimum Investment Amount : `10,000/- & in multiples of `1/- thereafter.
Entry Load: NIL
Entry Load: NIL
Fund ManagerFund Manager: Mr. Bhavesh jainExperience: 8 years Managing the Scheme since: January 4, 2014Assistant Fund Manager: Mr. Swayam MangwaniExperience: 5 years Managing the Scheme since: December 1, 2015 Plan: The Scheme also offers Direct Plan
Growth, DividendOptions: Benchmark: CRISIL Liquid Fund Index
Modified Duration: 0.0269 Years
Average Maturity: 0.0305 Years
Portfolio Yield - YTM (In % age): 7.32%##Total Expense Ratio :
Existing Plan: 0.25% Retail Plan*: 0.97%Direct Plan: 0.15%##Current Financial year to date ratio to average AUM.
NAV as on December 31, 2015Growth Option 1438.2105 Daily Dividend Option 1000.0000 Weekly Dividend Option 1000.3760 Fortnightly Dividend Option^ - Monthly Dividend Option 1005.5766Retail Plan* Growth Option 1621.0340 Daily Dividend Option 1000.0000 Weekly Dividend Option 1000.3383 Fortnightly Dividend Option^ -Monthly Dividend Option 1004.9829 Direct PlanGrowth Option 1442.5624 Daily Dividend Option 1000.0000 Monthly Dividend Option 1005.6926 Weekly / Fortnightly DividendOption^ 1000.3937 Bonus Option^^ There were no investors under this option -
LOW HIGH
Investors understand
that their principal will be at
low risk
Riskometer
This product is suitable for investors who are seeking*:
• regular fixed income for short term• investment in Money Market Instruments and Debt
instruments
*Investors should consult their financial advisers if in doubt about whether the product is suitable for them.
The objective of the Scheme is to provide optimal returns, commensurate with low risk and high degree of liquidity, through a portfolio constituted of money market & short term debt instruments. However, there is no assurance that the investment objective of the Scheme will be realized and the Scheme does not assure or guarantee any returns.
INVESTMENT OBJECTIVE
Fund SizeIn Crores
AUM Average AUM
14.77 16.14
16
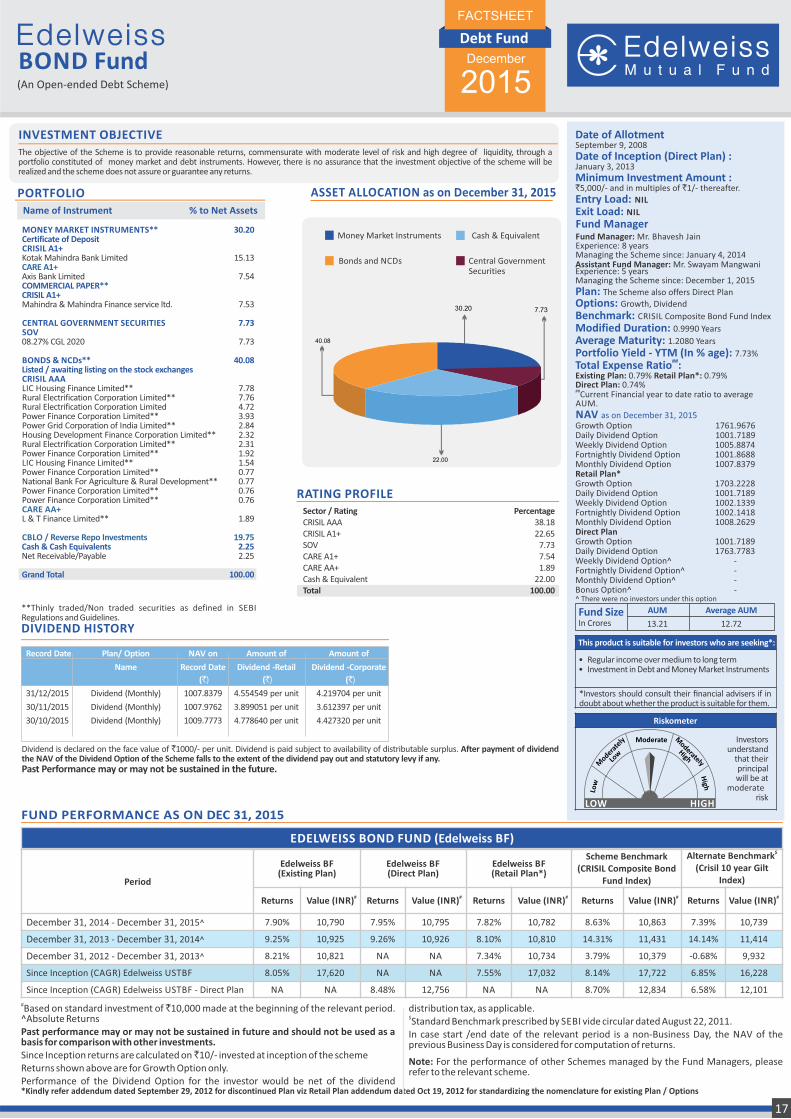
*Kindly refer addendum dated September 29, 2012 for discontinued Plan viz Retail Plan addendum dated Oct 19, 2012 for standardizing the nomenclature for existing Plan / Options
BOND FundDebt Fund
FACTSHEET
(An Open-ended Debt Scheme)
#Based on standard investment of ̀ 10,000 made at the beginning of the relevant period. ^Absolute ReturnsPast performance may or may not be sustained in future and should not be used as a basis for comparison with other investments.Since Inception returns are calculated on ̀ 10/- invested at inception of the schemeReturns shown above are for Growth Option only.Performance of the Dividend Option for the investor would be net of the dividend
distribution tax, as applicable.$Standard Benchmark prescribed by SEBI vide circular dated August 22, 2011.In case start /end date of the relevant period is a non-Business Day, the NAV of the previous Business Day is considered for computation of returns.
Note: For the performance of other Schemes managed by the Fund Managers, please refer to the relevant scheme.
FUND PERFORMANCE AS ON DEC 31, 2015
Period
Edelweiss BF(Existing Plan)
Edelweiss BF(Direct Plan)
Edelweiss BF (Retail Plan*)
Scheme Benchmark(CRISIL Composite Bond
Fund Index)
Alternate Benchmark$
(Crisil 10 year Gilt Index)
Returns# Value (INR) Returns # Value (INR) Returns # Value (INR) Returns # Value (INR) Returns #Value (INR)
December 31, 2014 - December 31, 2015^ 7.90% 10,790 7.95% 10,795 7.82% 10,782 8.63% 10,863 7.39% 10,739
December 31, 2013 - December 31, 2014^ 9.25% 10,925 9.26% 10,926 8.10% 10,810 14.31% 11,431 14.14% 11,414
December 31, 2012 - December 31, 2013^ 8.21% 10,821 NA NA 7.34% 10,734 3.79% 10,379 -0.68% 9,932
Since Inception (CAGR) Edelweiss USTBF 8.05% 17,620 NA NA 7.55% 17,032 8.14% 17,722 6.85% 16,228
Since Inception (CAGR) Edelweiss USTBF - Direct Plan NA NA 8.48% 12,756 NA NA 8.70% 12,834 6.58% 12,101
EDELWEISS BOND FUND (Edelweiss BF)
Record Date Plan/ Option NAV on Amount of Amount of
Name Record Date Dividend -Retail Dividend -Corporate
(`) (`) (`)
31/12/2015 Dividend (Monthly) 1007.8379 4.554549 per unit 4.219704 per unit
30/11/2015 Dividend (Monthly) 1007.9762 3.899051 per unit 3.612397 per unit
30/10/2015 Dividend (Monthly) 1009.7773 4.778640 per unit 4.427320 per unit
DIVIDEND HISTORY
**Thinly traded/Non traded securities as defined in SEBI Regulations and Guidelines.
Name of Instrument % to Net Assets
PORTFOLIO ASSET ALLOCATION as on December 31, 2015
Dividend is declared on the face value of `1000/- per unit. Dividend is paid subject to availability of distributable surplus. After payment of dividend the NAV of the Dividend Option of the Scheme falls to the extent of the dividend pay out and statutory levy if any. Past Performance may or may not be sustained in the future.
MONEY MARKET INSTRUMENTS** 30.20Certificate of Deposit CRISIL A1+Kotak Mahindra Bank Limited 15.13CARE A1+Axis Bank Limited 7.54COMMERCIAL PAPER**CRISIL A1+Mahindra & Mahindra Finance service ltd. 7.53
CENTRAL GOVERNMENT SECURITIES 7.73SOV08.27% CGL 2020 7.73
BONDS & NCDs** 40.08Listed / awaiting listing on the stock exchanges CRISIL AAALIC Housing Finance Limited** 7.78Rural Electrification Corporation Limited** 7.76Rural Electrification Corporation Limited 4.72Power Finance Corporation Limited** 3.93Power Grid Corporation of India Limited** 2.84Housing Development Finance Corporation Limited** 2.32Rural Electrification Corporation Limited** 2.31Power Finance Corporation Limited** 1.92LIC Housing Finance Limited** 1.54Power Finance Corporation Limited** 0.77National Bank For Agriculture & Rural Development** 0.77Power Finance Corporation Limited** 0.76Power Finance Corporation Limited** 0.76CARE AA+L & T Finance Limited** 1.89
CBLO / Reverse Repo Investments 19.75 Cash & Cash Equivalents 2.25 Net Receivable/Payable 2.25
Grand Total 100.00
Cash & EquivalentMoney Market Instruments
Central Government Securities
40.08
Bonds and NCDs
December
2015
30.20 7.73
22.00
Date of AllotmentSeptember 9, 2008
Date of Inception (Direct Plan) :January 3, 2013
Minimum Investment Amount : `5,000/- and in multiples of `1/- thereafter.
Entry Load: NIL
Exit Load: NIL
Fund ManagerFund Manager: Mr. Bhavesh JainExperience: 8 years Managing the Scheme since: January 4, 2014Assistant Fund Manager: Mr. Swayam MangwaniExperience: 5 years Managing the Scheme since: December 1, 2015
Plan: The Scheme also offers Direct Plan
Growth, DividendOptions: Benchmark: CRISIL Composite Bond Fund Index
Modified Duration: 0.9990 Years
Average Maturity: 1.2080 Years
Portfolio Yield - YTM (In % age): 7.73%##Total Expense Ratio :
Existing Plan: 0.79% Retail Plan*: 0.79%Direct Plan: 0.74%##Current Financial year to date ratio to average AUM.
NAV as on December 31, 2015Growth Option 1761.9676Daily Dividend Option 1001.7189 Weekly Dividend Option 1005.8874 Fortnightly Dividend Option 1001.8688 Monthly Dividend Option 1007.8379 Retail Plan*Growth Option 1703.2228 Daily Dividend Option 1001.7189 Weekly Dividend Option 1002.1339 Fortnightly Dividend Option 1002.1418 Monthly Dividend Option 1008.2629Direct PlanGrowth Option 1001.7189 Daily Dividend Option 1763.7783 Weekly Dividend Option^ - Fortnightly Dividend Option^ -Monthly Dividend Option^ - Bonus Option^ -^ There were no investors under this option
LOW HIGH
Investors understand
that their principal will be at
moderate risk
Riskometer
This product is suitable for investors who are seeking*:
• Regular income over medium to long term• Investment in Debt and Money Market Instruments
*Investors should consult their financial advisers if in doubt about whether the product is suitable for them.
RATING PROFILESector / Rating PercentageCRISIL AAA 38.18CRISIL A1+ 22.65SOV 7.73CARE A1+ 7.54CARE AA+ 1.89Cash & Equivalent 22.00Total 100.00
The objective of the Scheme is to provide reasonable returns, commensurate with moderate level of risk and high degree of liquidity, through a portfolio constituted of money market and debt instruments. However, there is no assurance that the investment objective of the scheme will be realized and the scheme does not assure or guarantee any returns.
INVESTMENT OBJECTIVE
Fund SizeIn Crores
AUM Average AUM
13.21 12.72
17
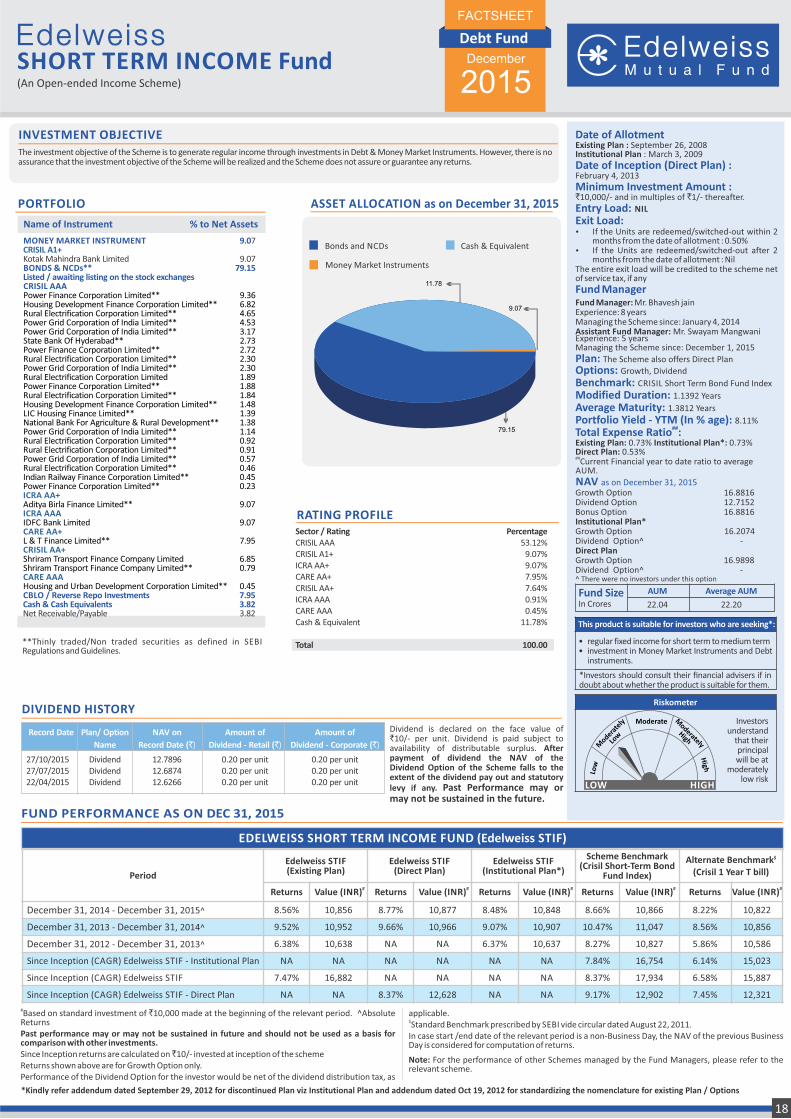
*Kindly refer addendum dated September 29, 2012 for discontinued Plan viz Institutional Plan and addendum dated Oct 19, 2012 for standardizing the nomenclature for existing Plan / Options
FUND PERFORMANCE AS ON DEC 31, 2015
SHORT TERM INCOME FundDebt Fund
FACTSHEET
(An Open-ended Income Scheme)
**Thinly traded/Non traded securities as defined in SEBI Regulations and Guidelines.
Name of Instrument % to Net Assets
PORTFOLIO
Record Date Plan/ Option NAV on Amount of Amount of
Name Record Date (`) Dividend - Retail (`) Dividend - Corporate (`)
27/10/2015 Dividend 12.7896 0.20 per unit 0.20 per unit27/07/2015 Dividend 12.6874 0.20 per unit 0.20 per unit 22/04/2015 Dividend 12.6266 0.20 per unit 0.20 per unit
DIVIDEND HISTORY
Dividend is declared on the face value of `10/- per unit. Dividend is paid subject to availability of distributable surplus. After payment of dividend the NAV of the Dividend Option of the Scheme falls to the extent of the dividend pay out and statutory levy if any. Past Performance may or may not be sustained in the future.
#Based on standard investment of `10,000 made at the beginning of the relevant period. ^Absolute ReturnsPast performance may or may not be sustained in future and should not be used as a basis for comparison with other investments.Since Inception returns are calculated on ̀ 10/- invested at inception of the schemeReturns shown above are for Growth Option only.Performance of the Dividend Option for the investor would be net of the dividend distribution tax, as
applicable.$Standard Benchmark prescribed by SEBI vide circular dated August 22, 2011.In case start /end date of the relevant period is a non-Business Day, the NAV of the previous Business Day is considered for computation of returns.
Note: For the performance of other Schemes managed by the Fund Managers, please refer to the relevant scheme.
Period
Edelweiss STIF(Existing Plan)
Edelweiss STIF(Direct Plan)
Edelweiss STIF (Institutional Plan*)
Scheme Benchmark(Crisil Short-Term Bond
Fund Index)
$Alternate Benchmark(Crisil 1 Year T bill)
Returns # Value (INR) Returns # Value (INR) Returns # Value (INR) Returns # Value (INR) Returns #Value (INR)
December 31, 2014 - December 31, 2015^ 8.56% 10,856 8.77% 10,877 8.48% 10,848 8.66% 10,866 8.22% 10,822
December 31, 2013 - December 31, 2014^ 9.52% 10,952 9.66% 10,966 9.07% 10,907 10.47% 11,047 8.56% 10,856
December 31, 2012 - December 31, 2013^ 6.38% 10,638 NA NA 6.37% 10,637 8.27% 10,827 5.86% 10,586
Since Inception (CAGR) Edelweiss STIF - Institutional Plan NA NA NA NA NA NA 7.84% 16,754 6.14% 15,023
Since Inception (CAGR) Edelweiss STIF 7.47% 16,882 NA NA NA NA 8.37% 17,934 6.58% 15,887
Since Inception (CAGR) Edelweiss STIF - Direct Plan NA NA 8.37% 12,628 NA NA 9.17% 12,902 7.45% 12,321
EDELWEISS SHORT TERM INCOME FUND (Edelweiss STIF)
December
2015
ASSET ALLOCATION as on December 31, 2015
MONEY MARKET INSTRUMENT 9.07CRISIL A1+Kotak Mahindra Bank Limited 9.07BONDS & NCDs** 79.15Listed / awaiting listing on the stock exchanges CRISIL AAAPower Finance Corporation Limited** 9.36Housing Development Finance Corporation Limited** 6.82Rural Electrification Corporation Limited** 4.65Power Grid Corporation of India Limited** 4.53Power Grid Corporation of India Limited** 3.17State Bank Of Hyderabad** 2.73Power Finance Corporation Limited** 2.72Rural Electrification Corporation Limited** 2.30Power Grid Corporation of India Limited** 2.30Rural Electrification Corporation Limited 1.89Power Finance Corporation Limited** 1.88Rural Electrification Corporation Limited** 1.84Housing Development Finance Corporation Limited** 1.48LIC Housing Finance Limited** 1.39National Bank For Agriculture & Rural Development** 1.38Power Grid Corporation of India Limited** 1.14Rural Electrification Corporation Limited** 0.92Rural Electrification Corporation Limited** 0.91Power Grid Corporation of India Limited** 0.57Rural Electrification Corporation Limited** 0.46Indian Railway Finance Corporation Limited** 0.45Power Finance Corporation Limited** 0.23ICRA AA+Aditya Birla Finance Limited** 9.07ICRA AAAIDFC Bank Limited 9.07 CARE AA+L & T Finance Limited** 7.95CRISIL AA+Shriram Transport Finance Company Limited 6.85Shriram Transport Finance Company Limited** 0.79CARE AAAHousing and Urban Development Corporation Limited** 0.45CBLO / Reverse Repo Investments 7.95Cash & Cash Equivalents 3.82 Net Receivable/Payable 3.82
Date of AllotmentExisting Plan : September 26, 2008Institutional Plan : March 3, 2009
Date of Inception (Direct Plan) :February 4, 2013
Minimum Investment Amount : `10,000/- and in multiples of `1/- thereafter.
Entry Load: NIL
Exit Load:Ÿ If the Units are redeemed/switched-out within 2
months from the date of allotment : 0.50%Ÿ If the Units are redeemed/switched-out after 2
months from the date of allotment : NilThe entire exit load will be credited to the scheme net of service tax, if any
Fund ManagerFund Manager: Mr. Bhavesh jainExperience: 8 years Managing the Scheme since: January 4, 2014Assistant Fund Manager: Mr. Swayam MangwaniExperience: 5 years Managing the Scheme since: December 1, 2015 Plan: The Scheme also offers Direct Plan
Growth, DividendOptions: Benchmark: CRISIL Short Term Bond Fund Index
Modified Duration: 1.1392 Years
Average Maturity: 1.3812 Years
Portfolio Yield - YTM (In % age): 8.11%##Total Expense Ratio :
Existing Plan: 0.73% Institutional Plan*: 0.73%Direct Plan: 0.53%##Current Financial year to date ratio to average AUM.
NAV as on December 31, 2015Growth Option 16.8816Dividend Option 12.7152 Bonus Option 16.8816Institutional Plan* Growth Option 16.2074Dividend Option^ -
Direct PlanGrowth Option 16.9898 Dividend Option^ -^ There were no investors under this option
LOW HIGH
Investors understand
that their principal will be at
moderately low risk
Riskometer
This product is suitable for investors who are seeking*:
• regular fixed income for short term to medium term• investment in Money Market Instruments and Debt
instruments.
*Investors should consult their financial advisers if in doubt about whether the product is suitable for them.
RATING PROFILESector / Rating PercentageCRISIL AAA 53.12%CRISIL A1+ 9.07%ICRA AA+ 9.07%CARE AA+ 7.95%CRISIL AA+ 7.64%ICRA AAA 0.91%CARE AAA 0.45%Cash & Equivalent 11.78%
Total 100.00
The investment objective of the Scheme is to generate regular income through investments in Debt & Money Market Instruments. However, there is no assurance that the investment objective of the Scheme will be realized and the Scheme does not assure or guarantee any returns.
INVESTMENT OBJECTIVE
Fund SizeIn Crores
AUM Average AUM
22.04 22.20
18
Cash & Equivalent
11.78
Bonds and NCDs
79.15
Money Market Instruments
9.07
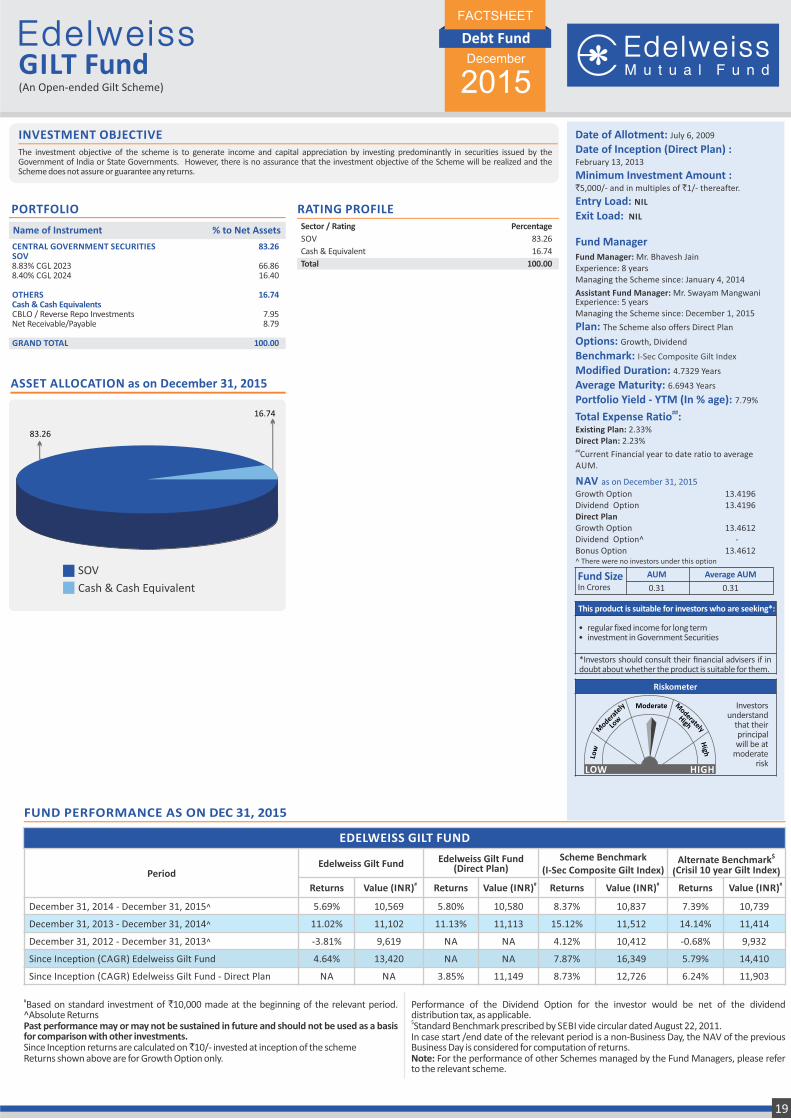
GILT FundDebt Fund
FACTSHEET
(An Open-ended Gilt Scheme)
Name of Instrument % to Net Assets
PORTFOLIO RATING PROFILESector / Rating Percentage
SOV 83.26
Cash & Equivalent 16.74
Total 100.00
ASSET ALLOCATION as on December 31, 2015
CENTRAL GOVERNMENT SECURITIES 83.26SOV8.83% CGL 2023 66.868.40% CGL 2024 16.40
OTHERS 16.74Cash & Cash Equivalents CBLO / Reverse Repo Investments 7.95Net Receivable/Payable 8.79
GRAND TOTAL 100.00
83.26
Cash & Cash Equivalent
SOV
16.74
#Based on standard investment of `10,000 made at the beginning of the relevant period. ^Absolute ReturnsPast performance may or may not be sustained in future and should not be used as a basis for comparison with other investments.Since Inception returns are calculated on ̀ 10/- invested at inception of the schemeReturns shown above are for Growth Option only.
Performance of the Dividend Option for the investor would be net of the dividend distribution tax, as applicable.$Standard Benchmark prescribed by SEBI vide circular dated August 22, 2011.In case start /end date of the relevant period is a non-Business Day, the NAV of the previous Business Day is considered for computation of returns.Note: For the performance of other Schemes managed by the Fund Managers, please refer to the relevant scheme.
FUND PERFORMANCE AS ON DEC 31, 2015
PeriodEdelweiss Gilt Fund Edelweiss Gilt Fund
(Direct Plan)Scheme Benchmark
(I-Sec Composite Gilt Index)
$Alternate BenchmarkCrisil 10 year Gilt Index( )
Returns# Value (INR) Returns # Value (INR) Returns # Value (INR) Returns # Value (INR)
December 31, 2014 - December 31, 2015^ 5.69% 10,569 5.80% 10,580 8.37% 10,837 7.39% 10,739
December 31, 2013 - December 31, 2014^ 11.02% 11,102 11.13% 11,113 15.12% 11,512 14.14% 11,414
December 31, 2012 - December 31, 2013^ -3.81% 9,619 NA NA 4.12% 10,412 -0.68% 9,932
Since Inception (CAGR) Edelweiss Gilt Fund 4.64% 13,420 NA NA 7.87% 16,349 5.79% 14,410
Since Inception (CAGR) Edelweiss Gilt Fund - Direct Plan NA NA 3.85% 11,149 8.73% 12,726 6.24% 11,903
EDELWEISS GILT FUND
December
2015
Date of Allotment: July 6, 2009
Date of Inception (Direct Plan) :February 13, 2013
Minimum Investment Amount : `5,000/- and in multiples of `1/- thereafter.
Entry Load: NIL
Exit Load: NIL
Fund ManagerFund Manager: Mr. Bhavesh JainExperience: 8 years Managing the Scheme since: January 4, 2014
Assistant Fund Manager: Mr. Swayam MangwaniExperience: 5 years Managing the Scheme since: December 1, 2015
Plan: The Scheme also offers Direct Plan
Growth, DividendOptions: Benchmark: I-Sec Composite Gilt Index
Modified Duration: 4.7329 Years
Average Maturity: 6.6943 Years
Portfolio Yield - YTM (In % age): 7.79%##Total Expense Ratio :
Existing Plan: 2.33%Direct Plan: 2.23%##Current Financial year to date ratio to average AUM.
NAV as on December 31, 2015
Growth Option 13.4196Dividend Option 13.4196 Direct Plan Growth Option 13.4612Dividend Option^ -Bonus Option 13.4612^ There were no investors under this option
LOW HIGH
Investors understand
that their principal will be at
moderate risk
Riskometer
This product is suitable for investors who are seeking*:
• regular fixed income for long term• investment in Government Securities
*Investors should consult their financial advisers if in doubt about whether the product is suitable for them.
The investment objective of the scheme is to generate income and capital appreciation by investing predominantly in securities issued by the Government of India or State Governments. However, there is no assurance that the investment objective of the Scheme will be realized and the Scheme does not assure or guarantee any returns.
INVESTMENT OBJECTIVE
Fund SizeIn Crores
AUM Average AUM
0.31 0.31
19
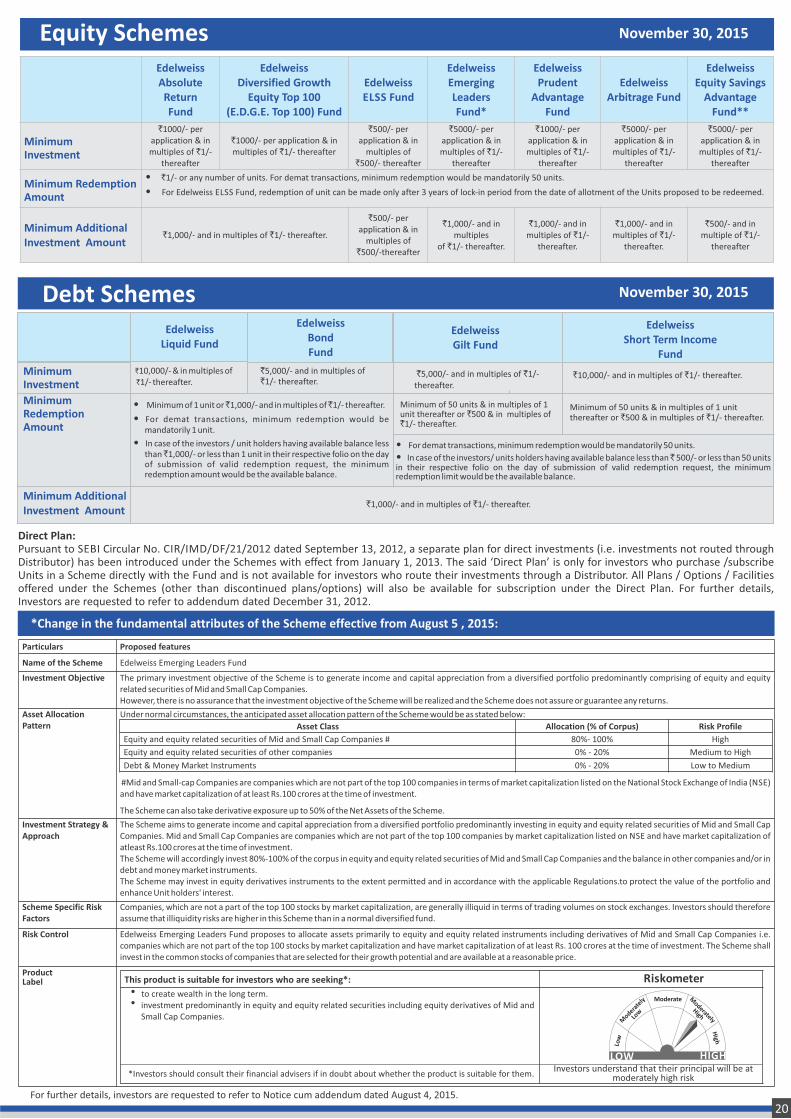
For risk factors, please refer last page
Debt Schemes
November 30, 2015
November 30, 2015
Equity Schemes
Direct Plan:Pursuant to SEBI Circular No. CIR/IMD/DF/21/2012 dated September 13, 2012, a separate plan for direct investments (i.e. investments not routed through Distributor) has been introduced under the Schemes with effect from January 1, 2013. The said ‘Direct Plan’ is only for investors who purchase /subscribe Units in a Scheme directly with the Fund and is not available for investors who route their investments through a Distributor. All Plans / Options / Facilities offered under the Schemes (other than discontinued plans/options) will also be available for subscription under the Direct Plan. For further details, Investors are requested to refer to addendum dated December 31, 2012.
Edelweiss Liquid Fund
`10,000/- & in multiples of ̀ 1/- thereafter.
Minimum Investment
Minimum Redemption Amount
Minimum Additional Investment Amount
Edelweiss Bond Fund
`5,000/- and in multiples of `1/- thereafter.
Edelweiss Gilt Fund
`5,000/- and in multiples of `1/- thereafter.
`10,000/- and in multiples of `1/- thereafter.
Minimum of 50 units & in multiples of 1 unit thereafter or `500 & in multiples of `1/- thereafter.
`1,000/- and in multiples of `1/- thereafter.
Edelweiss Short Term Income
Fund
Minimum of 50 units & in multiples of 1 unit thereafter or `500 & in multiples of `1/- thereafter.
• For demat transactions, minimum redemption would be mandatorily 50 units.
• In case of the investors/ units holders having available balance less than ̀ 500/- or less than 50 unitsin their respective folio on the day of submission of valid redemption request, the minimumredemption limit would be the available balance.
• Minimum of 1 unit or ̀ 1,000/- and in multiples of ̀ 1/- thereafter.
• For demat transactions, minimum redemption would be mandatorily 1 unit.
• In case of the investors / unit holders having available balance less than ̀ 1,000/- or less than 1 unit in their respective folio on the day of submission of valid redemption request, the minimum redemption amount would be the available balance.
Edelweiss Absolute Return Fund
Edelweiss Diversified Growth
Equity Top 100 (E.D.G.E. Top 100) Fund
Edelweiss ELSS Fund
Edelweiss Emerging LeadersFund*
Edelweiss Prudent
Advantage Fund
Edelweiss Arbitrage Fund
Edelweiss Equity Savings
Advantage Fund**
Minimum Investment
`1000/- per application & in multiples of `1/-
thereafter
`1000/- per application & in multiples of `1/- thereafter
`500/- per application & in
multiples of `500/- thereafter
`5000/- per application & in multiples of `1/-
thereafter
`1000/- per application & in multiples of `1/-
thereafter
`5000/- per application & in multiples of `1/-
thereafter
`5000/- per application & in multiples of `1/-
thereafter
Minimum Redemption Amount
• `1/- or any number of units. For demat transactions, minimum redemption would be mandatorily 50 units.
• For Edelweiss ELSS Fund, redemption of unit can be made only after 3 years of lock-in period from the date of allotment of the Units proposed to be redeemed.
Minimum Additional Investment Amount
`1,000/- and in multiples of `1/- thereafter.
`500/- per application & in
multiples of `500/-thereafter
`1,000/- and in multiples
of `1/- thereafter.
`1,000/- and in multiples of `1/-
thereafter.
`1,000/- and in multiples of `1/-
thereafter.
`500/- and in multiple of `1/-
thereafter
*Change in the fundamental attributes of the Scheme effective from August 5 , 2015:
Asset Class Allocation (% of Corpus) Risk Profile
Equity and equity related securities of Mid and Small Cap Companies # 80%- 100% High
Equity and equity related securities of other companies 0% - 20% Medium to High
Debt & Money Market Instruments 0% - 20% Low to Medium
For further details, investors are requested to refer to Notice cum addendum dated August 4, 2015.
Particulars Proposed features
Name of the Scheme Edelweiss Emerging Leaders Fund
Investment Objective The primary investment objective of the Scheme is to generate income and capital appreciation from a diversified portfolio predominantly comprising of equity and equity related securities of Mid and Small Cap Companies. However, there is no assurance that the investment objective of the Scheme will be realized and the Scheme does not assure or guarantee any returns.
Asset Allocation Pattern
Under normal circumstances, the anticipated asset allocation pattern of the Scheme would be as stated below:
#Mid and Small-cap Companies are companies which are not part of the top 100 companies in terms of market capitalization listed on the National Stock Exchange of India (NSE) and have market capitalization of at least Rs.100 crores at the time of investment.
The Scheme can also take derivative exposure up to 50% of the Net Assets of the Scheme.
Investment Strategy & Approach
The Scheme aims to generate income and capital appreciation from a diversified portfolio predominantly investing in equity and equity related securities of Mid and Small Cap Companies. Mid and Small Cap Companies are companies which are not part of the top 100 companies by market capitalization listed on NSE and have market capitalization of atleast Rs.100 crores at the time of investment. The Scheme will accordingly invest 80%-100% of the corpus in equity and equity related securities of Mid and Small Cap Companies and the balance in other companies and/or in debt and money market instruments.The Scheme may invest in equity derivatives instruments to the extent permitted and in accordance with the applicable Regulations.to protect the value of the portfolio and enhance Unit holders' interest.
Scheme Specific Risk Factors
Companies, which are not a part of the top 100 stocks by market capitalization, are generally illiquid in terms of trading volumes on stock exchanges. Investors should therefore assume that illiquidity risks are higher in this Scheme than in a normal diversified fund.
Risk Control Edelweiss Emerging Leaders Fund proposes to allocate assets primarily to equity and equity related instruments including derivatives of Mid and Small Cap Companies i.e. companies which are not part of the top 100 stocks by market capitalization and have market capitalization of at least Rs. 100 crores at the time of investment. The Scheme shall invest in the common stocks of companies that are selected for their growth potential and are available at a reasonable price.
Product Label This product is suitable for investors who are seeking*:
to create wealth in the long term.investment predominantly in equity and equity related securities including equity derivatives of Mid and Small Cap Companies.
LOW HIGH
retemoksiR
Investors understand that their principal will be at moderately high risk
20
*Investors should consult their financial advisers if in doubt about whether the product is suitable for them.
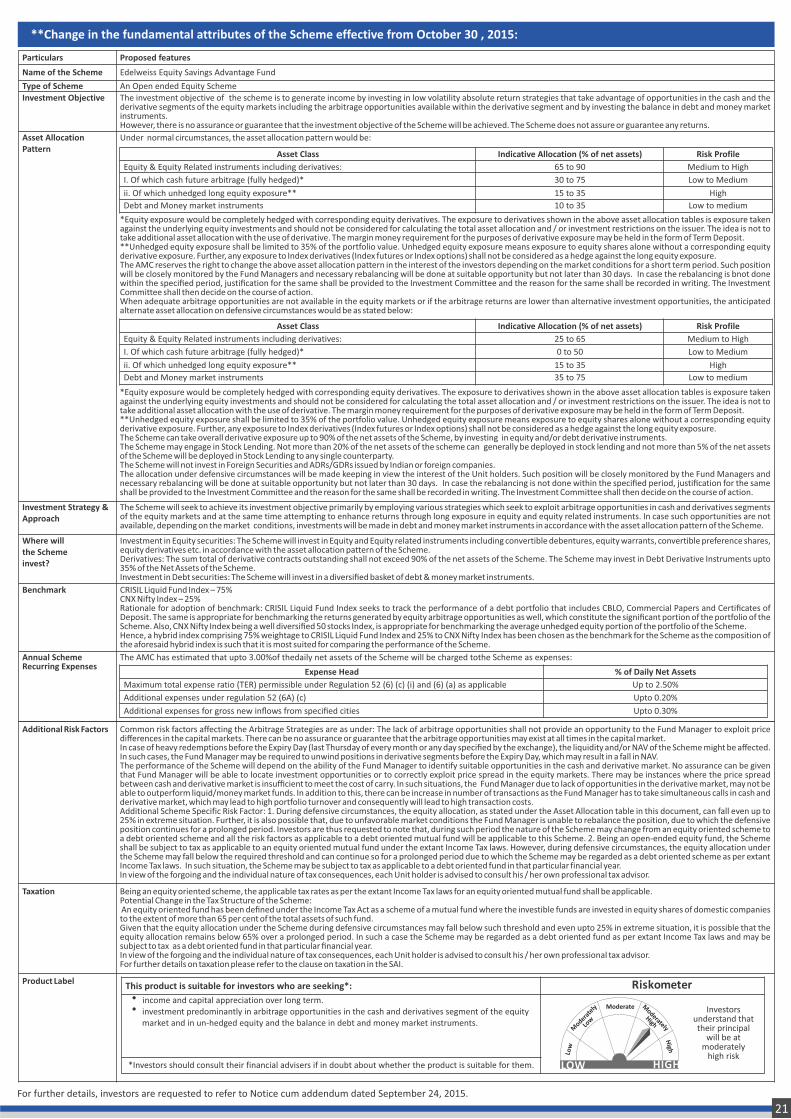
**Change in the fundamental attributes of the Scheme effective from October 30 , 2015:
For further details, investors are requested to refer to Notice cum addendum dated September 24, 2015.
Particulars Proposed features
Name of the Scheme Edelweiss Equity Savings Advantage Fund
Type of Scheme An Open ended Equity Scheme
Investment Objective The investment objective of the scheme is to generate income by investing in low volatility absolute return strategies that take advantage of opportunities in the cash and the derivative segments of the equity markets including the arbitrage opportunities available within the derivative segment and by investing the balance in debt and money market instruments. However, there is no assurance or guarantee that the investment objective of the Scheme will be achieved. The Scheme does not assure or guarantee any returns.
Asset Allocation Pattern
Under normal circumstances, the asset allocation pattern would be:
*Equity exposure would be completely hedged with corresponding equity derivatives. The exposure to derivatives shown in the above asset allocation tables is exposure taken against the underlying equity investments and should not be considered for calculating the total asset allocation and / or investment restrictions on the issuer. The idea is not to take additional asset allocation with the use of derivative. The margin money requirement for the purposes of derivative exposure may be held in the form of Term Deposit.**Unhedged equity exposure shall be limited to 35% of the portfolio value. Unhedged equity exposure means exposure to equity shares alone without a corresponding equity derivative exposure. Further, any exposure to Index derivatives (Index futures or Index options) shall not be considered as a hedge against the long equity exposure. The AMC reserves the right to change the above asset allocation pattern in the interest of the investors depending on the market conditions for a short term period. Such position will be closely monitored by the Fund Managers and necessary rebalancing will be done at suitable opportunity but not later than 30 days. In case the rebalancing is bnot done within the specified period, justification for the same shall be provided to the Investment Committee and the reason for the same shall be recorded in writing. The Investment Committee shall then decide on the course of action. When adequate arbitrage opportunities are not available in the equity markets or if the arbitrage returns are lower than alternative investment opportunities, the anticipated alternate asset allocation on defensive circumstances would be as stated below:
*Equity exposure would be completely hedged with corresponding equity derivatives. The exposure to derivatives shown in the above asset allocation tables is exposure taken against the underlying equity investments and should not be considered for calculating the total asset allocation and / or investment restrictions on the issuer. The idea is not to take additional asset allocation with the use of derivative. The margin money requirement for the purposes of derivative exposure may be held in the form of Term Deposit.**Unhedged equity exposure shall be limited to 35% of the portfolio value. Unhedged equity exposure means exposure to equity shares alone without a corresponding equity derivative exposure. Further, any exposure to Index derivatives (Index futures or Index options) shall not be considered as a hedge against the long equity exposure.The Scheme can take overall derivative exposure up to 90% of the net assets of the Scheme, by investing in equity and/or debt derivative instruments.The Scheme may engage in Stock Lending. Not more than 20% of the net assets of the scheme can generally be deployed in stock lending and not more than 5% of the net assets of the Scheme will be deployed in Stock Lending to any single counterparty.The Scheme will not invest in Foreign Securities and ADRs/GDRs issued by Indian or foreign companies.The allocation under defensive circumstances will be made keeping in view the interest of the Unit holders. Such position will be closely monitored by the Fund Managers and necessary rebalancing will be done at suitable opportunity but not later than 30 days. In case the rebalancing is not done within the specified period, justification for the same shall be provided to the Investment Committee and the reason for the same shall be recorded in writing. The Investment Committee shall then decide on the course of action.
Investment Strategy & Approach
The Scheme will seek to achieve its investment objective primarily by employing various strategies which seek to exploit arbitrage opportunities in cash and derivatives segments of the equity markets and at the same time attempting to enhance returns through long exposure in equity and equity related instruments. In case such opportunities are not available, depending on the market conditions, investments will be made in debt and money market instruments in accordance with the asset allocation pattern of the Scheme.
Where willthe Schemeinvest?
Investment in Equity securities: The Scheme will invest in Equity and Equity related instruments including convertible debentures, equity warrants, convertible preference shares, equity derivatives etc. in accordance with the asset allocation pattern of the Scheme.Derivatives: The sum total of derivative contracts outstanding shall not exceed 90% of the net assets of the Scheme. The Scheme may invest in Debt Derivative Instruments upto 35% of the Net Assets of the Scheme. Investment in Debt securities: The Scheme will invest in a diversified basket of debt & money market instruments.
Benchmark CRISIL Liquid Fund Index – 75%CNX Nifty Index – 25%Rationale for adoption of benchmark: CRISIL Liquid Fund Index seeks to track the performance of a debt portfolio that includes CBLO, Commercial Papers and Certificates of Deposit. The same is appropriate for benchmarking the returns generated by equity arbitrage opportunities as well, which constitute the significant portion of the portfolio of the Scheme. Also, CNX Nifty Index being a well diversified 50 stocks Index, is appropriate for benchmarking the average unhedged equity portion of the portfolio of the Scheme. Hence, a hybrid index comprising 75% weightage to CRISIL Liquid Fund Index and 25% to CNX Nifty Index has been chosen as the benchmark for the Scheme as the composition of the aforesaid hybrid index is such that it is most suited for comparing the performance of the Scheme.
Annual Scheme Recurring Expenses
The AMC has estimated that upto 3.00% of the daily net assets of the Scheme will be charged to the Scheme as expenses:
Asset Class Indicative Allocation (% of net assets) Risk Profile
Equity & Equity Related instruments including derivatives: 65 to 90 Medium to High
I. Of which cash future arbitrage (fully hedged)* 30 to 75 Low to Medium
ii. Of which unhedged long equity exposure** 15 to 35 High
Debt and Money market instruments 10 to 35 Low to medium
Asset Class Indicative Allocation (% of net assets) Risk Profile
Equity & Equity Related instruments including derivatives: 25 to 65 Medium to High
I. Of which cash future arbitrage (fully hedged)* 0 to 50 Low to Medium
ii. Of which unhedged long equity exposure** 15 to 35 High
Debt and Money market instruments 35 to 75 Low to medium
Expense Head % of Daily Net Assets
Maximum total expense ratio (TER) permissible under Regulation 52 (6) (c) (i) and (6) (a) as applicable Up to 2.50%
Additional expenses under regulation 52 (6A) (c) Upto 0.20%
Additional expenses for gross new inflows from specified cities Upto 0.30%
Additional Risk Factors Common risk factors affecting the Arbitrage Strategies are as under: The lack of arbitrage opportunities shall not provide an opportunity to the Fund Manager to exploit price differences in the capital markets. There can be no assurance or guarantee that the arbitrage opportunities may exist at all times in the capital market.In case of heavy redemptions before the Expiry Day (last Thursday of every month or any day specified by the exchange), the liquidity and/or NAV of the Scheme might be affected. In such cases, the Fund Manager may be required to unwind positions in derivative segments before the Expiry Day, which may result in a fall in NAV.The performance of the Scheme will depend on the ability of the Fund Manager to identify suitable opportunities in the cash and derivative market. No assurance can be given that Fund Manager will be able to locate investment opportunities or to correctly exploit price spread in the equity markets. There may be instances where the price spread between cash and derivative market is insufficient to meet the cost of carry. In such situations, the Fund Manager due to lack of opportunities in the derivative market, may not be able to outperform liquid/money market funds. In addition to this, there can be increase in number of transactions as the Fund Manager has to take simultaneous calls in cash and derivative market, which may lead to high portfolio turnover and consequently will lead to high transaction costs. Additional Scheme Specific Risk Factor: 1. During defensive circumstances, the equity allocation, as stated under the Asset Allocation table in this document, can fall even up to 25% in extreme situation. Further, it is also possible that, due to unfavorable market conditions the Fund Manager is unable to rebalance the position, due to which the defensive position continues for a prolonged period. Investors are thus requested to note that, during such period the nature of the Scheme may change from an equity oriented scheme to a debt oriented scheme and all the risk factors as applicable to a debt oriented mutual fund will be applicable to this Scheme. 2. Being an open-ended equity fund, the Scheme shall be subject to tax as applicable to an equity oriented mutual fund under the extant Income Tax laws. However, during defensive circumstances, the equity allocation under the Scheme may fall below the required threshold and can continue so for a prolonged period due to which the Scheme may be regarded as a debt oriented scheme as per extant Income Tax laws. In such situation, the Scheme may be subject to tax as applicable to a debt oriented fund in that particular financial year. In view of the forgoing and the individual nature of tax consequences, each Unit holder is advised to consult his / her own professional tax advisor.
Taxation Being an equity oriented scheme, the applicable tax rates as per the extant Income Tax laws for an equity oriented mutual fund shall be applicable. Potential Change in the Tax Structure of the Scheme: An equity oriented fund has been defined under the Income Tax Act as a scheme of a mutual fund where the investible funds are invested in equity shares of domestic companies to the extent of more than 65 per cent of the total assets of such fund. Given that the equity allocation under the Scheme during defensive circumstances may fall below such threshold and even upto 25% in extreme situation, it is possible that the equity allocation remains below 65% over a prolonged period. In such a case the Scheme may be regarded as a debt oriented fund as per extant Income Tax laws and may be subject to tax as a debt oriented fund in that particular financial year. In view of the forgoing and the individual nature of tax consequences, each Unit holder is advised to consult his / her own professional tax advisor. For further details on taxation please refer to the clause on taxation in the SAI.
Product Label This product is suitable for investors who are seeking*:
income and capital appreciation over long term. investment predominantly in arbitrage opportunities in the cash and derivatives segment of the equity market and in un-hedged equity and the balance in debt and money market instruments.
LOW HIGH
retemoksiR
Investors understand that their principal
will be at moderately
high risk
21
*Investors should consult their financial advisers if in doubt about whether the product is suitable for them.
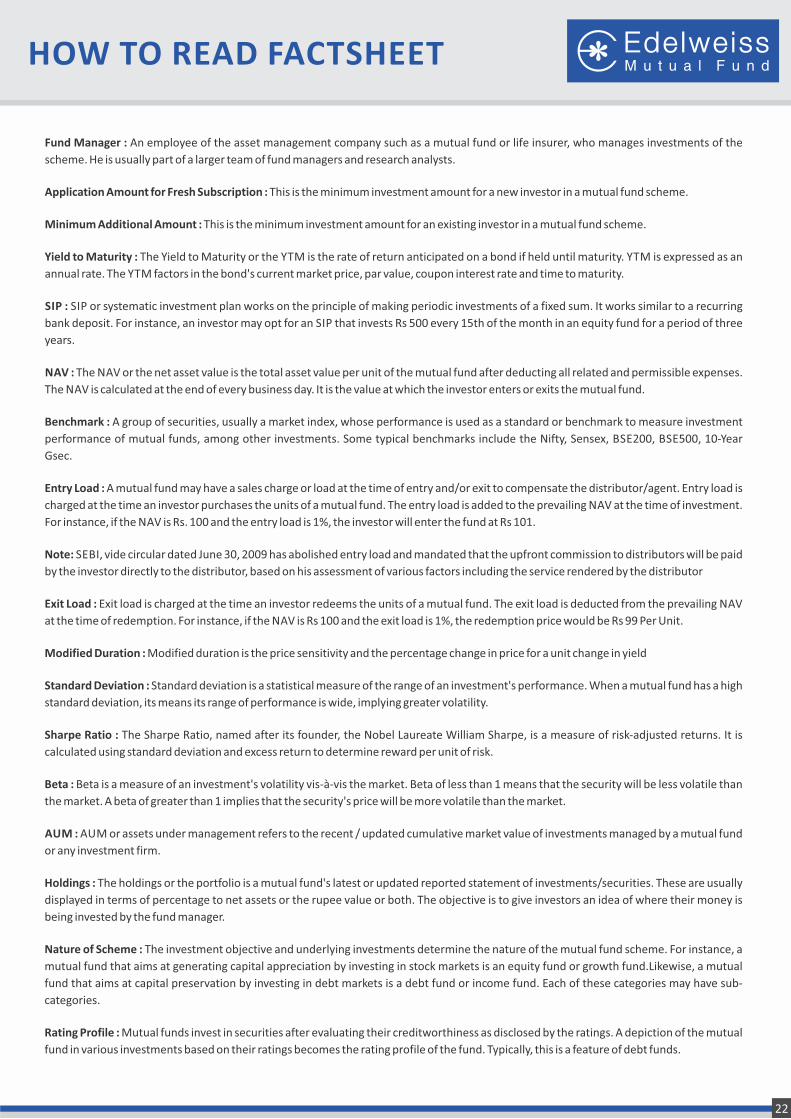
HOW TO READ FACTSHEET
Fund Manager : An employee of the asset management company such as a mutual fund or life insurer, who manages investments of the
scheme. He is usually part of a larger team of fund managers and research analysts.
Application Amount for Fresh Subscription : This is the minimum investment amount for a new investor in a mutual fund scheme.
Minimum Additional Amount : This is the minimum investment amount for an existing investor in a mutual fund scheme.
Yield to Maturity : The Yield to Maturity or the YTM is the rate of return anticipated on a bond if held until maturity. YTM is expressed as an
annual rate. The YTM factors in the bond's current market price, par value, coupon interest rate and time to maturity.
SIP : SIP or systematic investment plan works on the principle of making periodic investments of a fixed sum. It works similar to a recurring
bank deposit. For instance, an investor may opt for an SIP that invests Rs 500 every 15th of the month in an equity fund for a period of three
years.
NAV : The NAV or the net asset value is the total asset value per unit of the mutual fund after deducting all related and permissible expenses.
The NAV is calculated at the end of every business day. It is the value at which the investor enters or exits the mutual fund.
Benchmark : A group of securities, usually a market index, whose performance is used as a standard or benchmark to measure investment
performance of mutual funds, among other investments. Some typical benchmarks include the Nifty, Sensex, BSE200, BSE500, 10-Year
Gsec.
Entry Load : A mutual fund may have a sales charge or load at the time of entry and/or exit to compensate the distributor/agent. Entry load is
charged at the time an investor purchases the units of a mutual fund. The entry load is added to the prevailing NAV at the time of investment.
For instance, if the NAV is Rs. 100 and the entry load is 1%, the investor will enter the fund at Rs 101.
Note: SEBI, vide circular dated June 30, 2009 has abolished entry load and mandated that the upfront commission to distributors will be paid
by the investor directly to the distributor, based on his assessment of various factors including the service rendered by the distributor
Exit Load : Exit load is charged at the time an investor redeems the units of a mutual fund. The exit load is deducted from the prevailing NAV
at the time of redemption. For instance, if the NAV is Rs 100 and the exit load is 1%, the redemption price would be Rs 99 Per Unit.
Modified Duration : Modified duration is the price sensitivity and the percentage change in price for a unit change in yield
Standard Deviation : Standard deviation is a statistical measure of the range of an investment's performance. When a mutual fund has a high
standard deviation, its means its range of performance is wide, implying greater volatility.
Sharpe Ratio : The Sharpe Ratio, named after its founder, the Nobel Laureate William Sharpe, is a measure of risk-adjusted returns. It is
calculated using standard deviation and excess return to determine reward per unit of risk.
Beta : Beta is a measure of an investment's volatility vis-à-vis the market. Beta of less than 1 means that the security will be less volatile than
the market. A beta of greater than 1 implies that the security's price will be more volatile than the market.
AUM : AUM or assets under management refers to the recent / updated cumulative market value of investments managed by a mutual fund
or any investment firm.
Holdings : The holdings or the portfolio is a mutual fund's latest or updated reported statement of investments/securities. These are usually
displayed in terms of percentage to net assets or the rupee value or both. The objective is to give investors an idea of where their money is
being invested by the fund manager.
Nature of Scheme : The investment objective and underlying investments determine the nature of the mutual fund scheme. For instance, a
mutual fund that aims at generating capital appreciation by investing in stock markets is an equity fund or growth fund.Likewise, a mutual
fund that aims at capital preservation by investing in debt markets is a debt fund or income fund. Each of these categories may have sub-
categories.
Rating Profile : Mutual funds invest in securities after evaluating their creditworthiness as disclosed by the ratings. A depiction of the mutual
fund in various investments based on their ratings becomes the rating profile of the fund. Typically, this is a feature of debt funds.
22
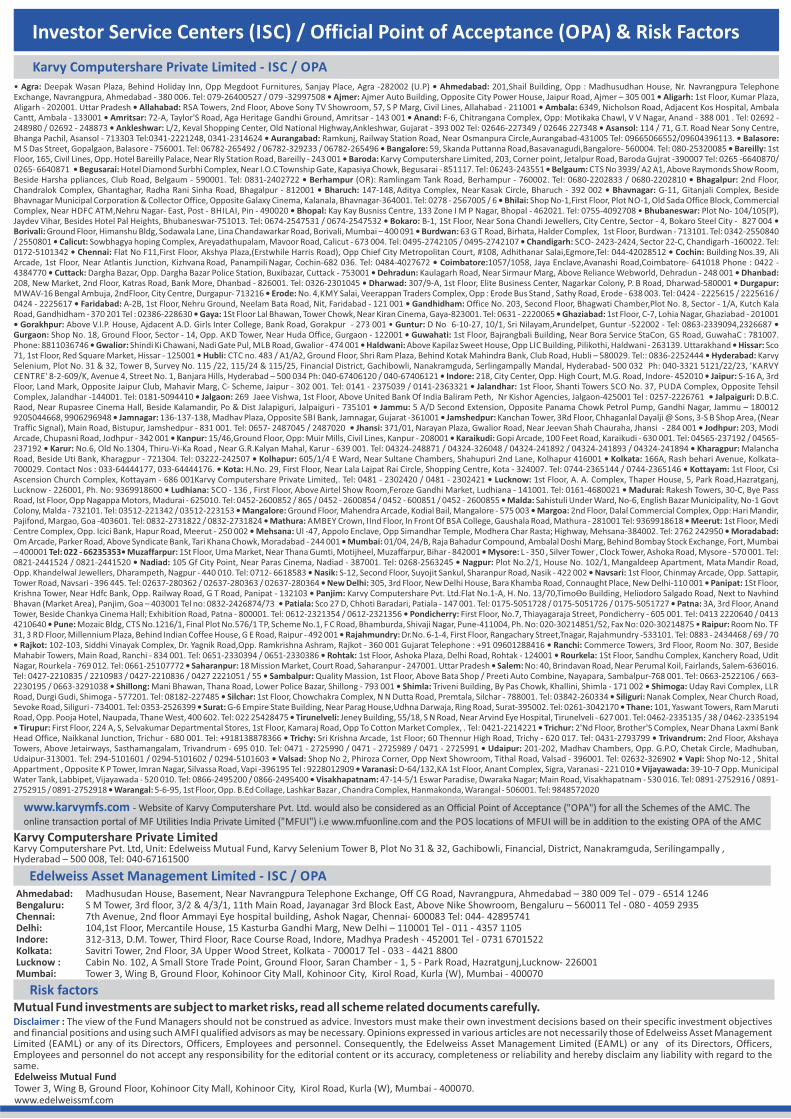
Investor Service Centers (ISC) / Official Point of Acceptance (OPA) & Risk Factors
Edelweiss Asset Management Limited - ISC / OPA
Mutual Fund investments are subject to market risks, read all scheme related documents carefully.Disclaimer : The view of the Fund Managers should not be construed as advice. Investors must make their own investment decisions based on their specific investment objectives and financial positions and using such AMFI qualified advisors as may be necessary. Opinions expressed in various articles are not necessarily those of Edelweiss Asset Management Limited (EAML) or any of its Directors, Officers, Employees and personnel. Consequently, the Edelweiss Asset Management Limited (EAML) or any of its Directors, Officers, Employees and personnel do not accept any responsibility for the editorial content or its accuracy, completeness or reliability and hereby disclaim any liability with regard to the same.
Risk factors
Karvy Computershare Private Limited - ISC / OPA
Karvy Computershare Private Limited Karvy Computershare Pvt. Ltd, Unit: Edelweiss Mutual Fund, Karvy Selenium Tower B, Plot No 31 & 32, Gachibowli, Financial, District, Nanakramguda, Serilingampally ,Hyderabad – 500 008, Tel: 040-67161500
Edelweiss Mutual FundTower 3, Wing B, Ground Floor, Kohinoor City Mall, Kohinoor City, Kirol Road, Kurla (W), Mumbai - 400070. www.edelweissmf.com
Ahmedabad: Madhusudan House, Basement, Near Navrangpura Telephone Exchange, Off CG Road, Navrangpura, Ahmedabad – 380 009 Tel - 079 - 6514 1246Bengaluru: S M Tower, 3rd floor, 3/2 & 4/3/1, 11th Main Road, Jayanagar 3rd Block East, Above Nike Showroom, Bengaluru – 560011 Tel - 080 - 4059 2935Chennai: 7th Avenue, 2nd floor Ammayi Eye hospital building, Ashok Nagar, Chennai- 600083 Tel: 044- 42895741Delhi: 104,1st Floor, Mercantile House, 15 Kasturba Gandhi Marg, New Delhi – 110001 Tel - 011 - 4357 1105Indore: 312-313, D.M. Tower, Third Floor, Race Course Road, Indore, Madhya Pradesh - 452001 Tel - 0731 6701522Kolkata: Savitri Tower, 2nd Floor, 3A Upper Wood Street, Kolkata - 700017 Tel - 033 - 4421 8800Lucknow : Cabin No. 102, A Small Store Trade Point, Ground Floor, Saran Chamber - 1, 5 - Park Road, Hazratgunj,Lucknow- 226001Mumbai: Tower 3, Wing B, Ground Floor, Kohinoor City Mall, Kohinoor City, Kirol Road, Kurla (W), Mumbai - 400070
www.karvymfs.com - Website of Karvy Computershare Pvt. Ltd. would also be considered as an Official Point of Acceptance ("OPA") for all the Schemes of the AMC. The
online transaction portal of MF Utilities India Private Limited ("MFUI") i.e www.mfuonline.com and the POS locations of MFUI will be in addition to the existing OPA of the AMC
• Agra: Deepak Wasan Plaza, Behind Holiday Inn, Opp Megdoot Furnitures, Sanjay Place, Agra -282002 (U.P) • Ahmedabad: 201,Shail Building, Opp : Madhusudhan House, Nr. Navrangpura Telephone Exchange, Navrangpura, Ahmedabad - 380 006. Tel: 079-26400527 / 079 -32997508 • Ajmer: Ajmer Auto Building, Opposite City Power House, Jaipur Road, Ajmer – 305 001 • Aligarh: 1st Floor, Kumar Plaza, Aligarh - 202001. Uttar Pradesh • Allahabad: RSA Towers, 2nd Floor, Above Sony TV Showroom, 57, S P Marg, Civil Lines, Allahabad - 211001 • Ambala: 6349, Nicholson Road, Adjacent Kos Hospital, Ambala Cantt, Ambala - 133001 • Amritsar: 72-A, Taylor'S Road, Aga Heritage Gandhi Ground, Amritsar - 143 001 • Anand: F-6, Chitrangana Complex, Opp: Motikaka Chawl, V V Nagar, Anand - 388 001 . Tel: 02692 - 248980 / 02692 - 248873 • Ankleshwar: L/2, Keval Shopping Center, Old National Highway,Ankleshwar, Gujarat - 393 002 Tel: 02646-227349 / 02646 227348 • Asansol: 114 / 71, G.T. Road Near Sony Centre, Bhanga Pachil, Asansol - 713303 Tel:0341-2221248, 0341-2314624 • Aurangabad: Ramkunj, Railway Station Road, Near Osmanpura Circle,Aurangabad-431005 Tel: 09665066552/09604396113. • Balasore: M S Das Street, Gopalgaon, Balasore - 756001. Tel: 06782-265492 / 06782-329233 / 06782-265496 • Bangalore: 59, Skanda Puttanna Road,Basavanagudi,Bangalore- 560004. Tel: 080-25320085 • Bareilly: 1st Floor, 165, Civil Lines, Opp. Hotel Bareilly Palace, Near Rly Station Road, Bareilly - 243 001 • Baroda: Karvy Computershare Limited, 203, Corner point, Jetalpur Road, Baroda Gujrat -390007 Tel: 0265 -6640870/ 0265- 6640871 • Begusarai: Hotel Diamond Surbhi Complex, Near I.O.C Township Gate, Kapasiya Chowk, Begusarai - 851117. Tel: 06243-243551 • Belgaum: CTS No 3939/ A2 A1, Above Raymonds Show Room, Beside Harsha ppliances, Club Road, Belgaum - 590001. Tel: 0831-2402722 • Berhampur (OR): Ramlingam Tank Road, Berhampur - 760002. Tel: 0680-2202833 / 0680-2202810 • Bhagalpur: 2nd Floor, Chandralok Complex, Ghantaghar, Radha Rani Sinha Road, Bhagalpur - 812001 • Bharuch: 147-148, Aditya Complex, Near Kasak Circle, Bharuch - 392 002 • Bhavnagar: G-11, Gitanjali Complex, Beside Bhavnagar Municipal Corporation & Collector Office, Opposite Galaxy Cinema, Kalanala, Bhavnagar-364001. Tel: 0278 - 2567005 / 6 • Bhilai: Shop No-1,First Floor, Plot NO-1, Old Sada Office Block, Commercial Complex, Near HDFC ATM,Nehru Nagar- East, Post - BHILAI, Pin - 490020 • Bhopal: Kay Kay Busniss Centre, 133 Zone I M P Nagar, Bhopal - 462021. Tel: 0755-4092708 • Bhubaneswar: Plot No- 104/105(P), Jaydev Vihar, Besides Hotel Pal Heights, Bhubaneswar-751013. Tel: 0674-2547531 / 0674-2547532 • Bokaro: B-1, 1St Floor, Near Sona Chandi Jewellers, City Centre, Sector - 4, Bokaro Steel City - 827 004 • Borivali: Ground Floor, Himanshu Bldg, Sodawala Lane, Lina Chandawarkar Road, Borivali, Mumbai – 400 091 • Burdwan: 63 G T Road, Birhata, Halder Complex, 1st Floor, Burdwan - 713101. Tel: 0342-2550840 / 2550801 • Calicut: Sowbhagya hoping Complex, Areyadathupalam, Mavoor Road, Calicut - 673 004. Tel: 0495-2742105 / 0495-2742107 • Chandigarh: SCO- 2423-2424, Sector 22-C, Chandigarh -160022. Tel: 0172-5101342 • Chennai: Flat No F11,First Floor, Akshya Plaza,(Erstwhile Harris Road), Opp Chief City Metropolitan Court, #108, Adhithanar Salai,Egmore,Tel: 044-42028512 • Cochin: Building Nos.39, Ali Arcade, 1st Floor, Near Atlantis Junction, Kizhvana Road, Panampili Nagar, Cochin-682 036. Tel: 0484-4027672 • Coimbatore:1057/1058, Jaya Enclave,Avanashi Road,Coimbatore- 641018 Phone : 0422 - 4384770 • Cuttack: Dargha Bazar, Opp. Dargha Bazar Police Station, Buxibazar, Cuttack - 753001 • Dehradun: Kaulagarh Road, Near Sirmaur Marg, Above Reliance Webworld, Dehradun - 248 001 • Dhanbad: 208, New Market, 2nd Floor, Katras Road, Bank More, Dhanbad - 826001. Tel: 0326-2301045 • Dharwad: 307/9-A, 1st Floor, Elite Business Center, Nagarkar Colony, P. B Road, Dharwad-580001 • Durgapur: MWAV-16 Bengal Ambuja, 2ndFloor, City Centre, Durgapur- 713216 • Erode: No. 4,KMY Salai, Veerappan Traders Complex, Opp : Erode Bus Stand , Sathy Road, Erode - 638 003. Tel: 0424 - 2225615 / 2225616 / 0424 - 2225617 • Faridabad: A-2B, 1st Floor, Nehru Ground, Neelam Bata Road, Nit, Faridabad - 121 001 • Gandhidham: Office No. 203, Second Floor, Bhagwati Chamber,Plot No. 8, Sector - 1/A, Kutch Kala Road, Gandhidham - 370 201 Tel : 02386-228630 • Gaya: 1St Floor Lal Bhawan, Tower Chowk, Near Kiran Cinema, Gaya-823001. Tel: 0631 - 2220065 • Ghaziabad: 1st Floor, C-7, Lohia Nagar, Ghaziabad - 201001 • Gorakhpur: Above V.I.P. House, Ajdacent A.D. Girls Inter College, Bank Road, Gorakpur - 273 001 • Guntur: D No 6-10-27, 10/1, Sri Nilayam,Arundelpet, Guntur -522002 - Tel: 0863-2339094,2326687 • Gurgaon: Shop No. 18, Ground Floor, Sector - 14, Opp. AKD Tower, Near Huda Office, Gurgaon - 122001 • Guwahati: 1st Floor, Bajrangbali Building, Near Bora Service StaCon, GS Road, GuwahaC : 781007. Phone: 8811036746 • Gwalior: Shindi Ki Chawani, Nadi Gate Pul, MLB Road, Gwalior - 474 001 • Haldwani: Above Kapilaz Sweet House, Opp LIC Building, Pilikothi, Haldwani - 263139. Uttarakhand • Hissar: Sco 71, 1st Floor, Red Square Market, Hissar - 125001 • Hubli: CTC no. 483 / A1/A2, Ground Floor, Shri Ram Plaza, Behind Kotak Mahindra Bank, Club Road, Hubli – 580029. Tel:: 0836-2252444 • Hyderabad: Karvy Selenium, Plot No. 31 & 32, Tower B, Survey No. 115 /22, 115/24 & 115/25, Financial District, Gachibowli, Nanakramguda, Serlingampally Mandal, Hyderabad- 500 032 Ph: 040-3321 5121/22/23, 'KARVY CENTRE' 8-2-609/K, Avenue 4, Street No. 1, Banjara Hills, Hyderabad – 500 034 Ph: 040-67406120 / 040-67406121 • Indore: 218, City Center, Opp. High Court, M.G. Road, Indore- 452010 • Jaipur: S-16 A, 3rd Floor, Land Mark, Opposite Jaipur Club, Mahavir Marg, C- Scheme, Jaipur - 302 001. Tel: 0141 - 2375039 / 0141-2363321 • Jalandhar: 1st Floor, Shanti Towers SCO No. 37, PUDA Complex, Opposite Tehsil Complex, Jalandhar -144001. Tel: 0181-5094410 • Jalgaon: 269 Jaee Vishwa, 1st Floor, Above United Bank Of India Baliram Peth, Nr Kishor Agencies, Jalgaon-425001 Tel : 0257-2226761 • Jalpaiguri: D.B.C. Raod, Near Rupasree Cinema Hall, Beside Kalamandir, Po & Dist Jalapiguri, Jalpaiguri - 735101 • Jammu: 5 A/D Second Extension, Opposite Panama Chowk Petrol Pump, Gandhi Nagar, Jammu – 180012 9205044668, 9906296948 • Jamnagar: 136-137-138, Madhav Plaza, Opposite SBI Bank, Jamnagar, Gujarat -361001 • Jamshedpur: Kanchan Tower, 3Rd Floor, Chhaganlal Dayalji @ Sons, 3-S B Shop Area, (Near Traffic Signal), Main Road, Bistupur, Jamshedpur - 831 001. Tel: 0657- 2487045 / 2487020 • Jhansi: 371/01, Narayan Plaza, Gwalior Road, Near Jeevan Shah Chauraha, Jhansi - 284 001 • Jodhpur: 203, Modi Arcade, Chupasni Road, Jodhpur - 342 001 • Kanpur: 15/46,Ground Floor, Opp: Muir Mills, Civil Lines, Kanpur - 208001 • Karaikudi: Gopi Arcade, 100 Feet Road, Karaikudi - 630 001. Tel: 04565-237192 / 04565-237192 • Karur: No.6, Old No.1304, Thiru-Vi-Ka Road , Near G.R.Kalyan Mahal, Karur - 639 001. Tel: 04324-248871 / 04324-326048 / 04324-241892 / 04324-241893 / 04324-241894 • Kharagpur: Malancha Road, Beside Uti Bank, Kharagpur - 721304. Tel: 03222-242507 • Kolhapur: 605/1/4 E Ward, Near Sultane Chambers, Shahupuri 2nd Lane, Kolhapur 416001 • Kolkata: 166A, Rash behari Avenue, Kolkata-700029. Contact Nos : 033-64444177, 033-64444176. • Kota: H.No. 29, First Floor, Near Lala Lajpat Rai Circle, Shopping Centre, Kota - 324007. Tel: 0744-2365144 / 0744-2365146 • Kottayam: 1st Floor, Csi Ascension Church Complex, Kottayam - 686 001Karvy Computershare Private Limited,. Tel: 0481 - 2302420 / 0481 - 2302421 • Lucknow: 1st Floor, A. A. Complex, Thaper House, 5, Park Road,Hazratganj, Lucknow - 226001, Ph. No: 9369918600 • Ludhiana: SCO - 136 , First Floor, Above Airtel Show Room,Feroze Gandhi Market, Ludhiana - 141001. Tel: 0161-4680021 • Madurai: Rakesh Towers, 30-C, Bye Pass Road, Ist Floor, Opp Nagappa Motors, Madurai - 625010. Tel: 0452-2600852 / 865 / 0452 - 2600854 / 0452 - 600851 / 0452 - 2600855 • Malda: Sahistuli Under Ward, No-6, English Bazar Municipality, No-1 Govt Colony, Malda - 732101. Tel: 03512-221342 / 03512-223153 • Mangalore: Ground Floor, Mahendra Arcade, Kodial Bail, Mangalore - 575 003 • Margoa: 2nd Floor, Dalal Commercial Complex, Opp: Hari Mandir, Pajifond, Margao, Goa -403601. Tel: 0832-2731822 / 0832-2731824 • Mathura: AMBEY Crown, IInd Floor, In Front Of BSA College, Gaushala Road, Mathura - 281001 Tel: 9369918618 • Meerut: 1st Floor, Medi Centre Complex, Opp. Icici Bank, Hapur Road, Meerut - 250 002 • Mehsana: Ul -47, Appolo Enclave, Opp Simandhar Temple, Modhera Char Rasta; Highway, Mehsana-384002. Tel: 2762 242950 • Moradabad: Om Arcade, Parker Road, Above Syndicate Bank, Tari Khana Chowk, Moradabad - 244 001 • Mumbai: 01/04, 24/B, Raja Bahadur Compound, Ambalal Doshi Marg, Behind Bombay Stock Exchange, Fort, Mumbai – 400001 Tel: 022 - 66235353• Muzaffarpur: 1St Floor, Uma Market, Near Thana Gumti, Motijheel, Muzaffarpur, Bihar - 842001 • Mysore: L - 350 , Silver Tower , Clock Tower, Ashoka Road, Mysore - 570 001. Tel: 0821-2441524 / 0821-2441520 • Nadiad: 105 Gf City Point, Near Paras Cinema, Nadiad - 387001. Tel: 0268-2563245 • Nagpur: Plot No.2/1, House No. 102/1, Mangaldeep Apartment, Mata Mandir Road, Opp. Khandelwal Jewellers, Dharampeth, Nagpur - 440 010. Tel: 0712- 6618583 • Nasik: S-12, Second Floor, Suyojit Sankul, Sharanpur Road, Nasik - 422 002 • Navsari: 1st Floor, Chinmay Arcade, Opp. Sattapir, Tower Road, Navsari - 396 445. Tel: 02637-280362 / 02637-280363 / 02637-280364 • New Delhi: 305, 3rd Floor, New Delhi House, Bara Khamba Road, Connaught Place, New Delhi-110 001 • Panipat: 1St Floor, Krishna Tower, Near Hdfc Bank, Opp. Railway Road, G T Road, Panipat - 132103 • Panjim: Karvy Computershare Pvt. Ltd.Flat No.1-A, H. No. 13/70,TimoƟo Building, Heliodoro Salgado Road, Next to Navhind Bhavan (Market Area), Panjim, Goa – 403001 Tel no: 0832-2426874/73 • Patiala: Sco 27 D, Chhoti Baradari, Patiala - 147 001. Tel: 0175-5051728 / 0175-5051726 / 0175-5051727 • Patna: 3A, 3rd Floor, Anand Tower, Beside Chankya Cinema Hall; Exhibition Road, Patna - 800001. Tel: 0612-2321354 / 0612-2321356 • Pondicherry: First Floor, No.7, Thiayagaraja Street, Pondicherry - 605 001. Tel: 0413 2220640 / 0413 4210640 • Pune: Mozaic Bldg, CTS No.1216/1, Final Plot No.576/1 TP, Scheme No.1, F C Road, Bhamburda, Shivaji Nagar, Pune-411004, Ph. No: 020-30214851/52, Fax No: 020-30214875 • Raipur: Room No. TF 31, 3 RD Floor, Millennium Plaza, Behind Indian Coffee House, G E Road, Raipur - 492 001 • Rajahmundry: Dr.No. 6-1-4, First Floor, Rangachary Street,Tnagar, Rajahmundry -533101. Tel: 0883 - 2434468 / 69 / 70 • Rajkot: 102-103, Siddhi Vinayak Complex, Dr. Yagnik Road,Opp. Ramkrishna Ashram, Rajkot - 360 001 Gujarat Telephone : +91 09601288416 • Ranchi: Commerce Towers, 3rd Floor, Room No. 307, Beside Mahabir Towers, Main Road, Ranchi - 834 001. Tel: 0651-2330394 / 0651-2330386 • Rohtak: 1st Floor, Ashoka Plaza, Delhi Road, Rohtak - 124001 • Rourkela: 1St Floor, Sandhu Complex, Kanchery Road, Udit Nagar, Rourkela - 769 012. Tel: 0661-25107772 • Saharanpur: 18 Mission Market, Court Road, Saharanpur - 247001. Uttar Pradesh • Salem: No: 40, Brindavan Road, Near Perumal Koil, Fairlands, Salem-636016. Tel: 0427-2210835 / 2210983 / 0427-2210836 / 0427 2221051 / 55 • Sambalpur: Quality Massion, 1st Floor, Above Bata Shop / Preeti Auto Combine, Nayapara, Sambalpur-768 001. Tel: 0663-2522106 / 663-2230195 / 0663-3291038 • Shillong: Mani Bhawan, Thana Road, Lower Police Bazar, Shillong - 793 001 • Shimla: Triveni Building, By Pas Chowk, Khallini, Shimla - 171 002 • Shimoga: Uday Ravi Complex, LLR Road, Durgi Gudi, Shimoga - 577201. Tel: 08182-227485 • Silchar: 1st Floor, Chowchakra Complex, N N Dutta Road, Premtala, Silchar - 788001. Tel: 03842-260334 • Siliguri: Nanak Complex, Near Church Road, Sevoke Road, Siliguri - 734001. Tel: 0353-2526399 • Surat: G-6 Empire State Building, Near Parag House,Udhna Darwaja, Ring Road, Surat-395002. Tel: 0261-3042170 • Thane: 101, Yaswant Towers, Ram Maruti Road, Opp. Pooja Hotel, Naupada, Thane West, 400 602. Tel: 022 25428475 • Tirunelveli: Jeney Building, 55/18, S N Road, Near Arvind Eye Hospital, Tirunelveli - 627 001. Tel: 0462-2335135 / 38 / 0462-2335194 • Tirupur: First Floor, 224 A, S, Selvakumar Departmental Stores, 1st Floor, Kamaraj Road, Opp To Cotton Market Complex, . Tel: 0421-2214221 • Trichur: 2'Nd Floor, Brother'S Complex, Near Dhana Laxmi Bank Head Office, Naikkanal Junction, Trichur - 680 001. Tel: +918138878366 • Trichy: Sri Krishna Arcade, 1st Floor; 60 Thennur High Road, Trichy - 620 017. Tel: 0431-2793799 • Trivandrum: 2nd Floor, Akshaya Towers, Above Jetairways, Sasthamangalam, Trivandrum - 695 010. Tel: 0471 - 2725990 / 0471 - 2725989 / 0471 - 2725991 • Udaipur: 201-202, Madhav Chambers, Opp. G.P.O, Chetak Circle, Madhuban, Udaipur-313001. Tel: 294-5101601 / 0294-5101602 / 0294-5101603 • Valsad: Shop No 2, Phiroza Corner, Opp Next Showroom, Tithal Road, Valsad - 396001. Tel: 02632-326902 • Vapi: Shop No-12 , Shital Appartment , Opposite K P Tower, Imran Nagar, Silvassa Road, Vapi -396195 Tel : 9228012909 • Varanasi: D-64/132,KA 1st Floor, Anant Complex, Sigra, Varanasi - 221 010 • Vijayawada: 39-10-7 Opp. Municipal Water Tank, Labbipet, Vijayawada - 520 010. Tel: 0866-2495200 / 0866-2495400 • Visakhapatnam: 47-14-5/1 Eswar Paradise, Dwaraka Nagar; Main Road, Visakhapatnam - 530 016. Tel: 0891-2752916 / 0891-2752915 / 0891-2752918 • Warangal: 5-6-95, 1st Floor, Opp. B.Ed Collage, Lashkar Bazar , Chandra Complex, Hanmakonda, Warangal - 506001. Tel: 9848572020