Embed Size (px)
Citation preview

Why the Future of Geography is Cheap
Jon Reades, Department of Geography, King’s College London
Summary
We live in a world transformed by big (geo)data: from Facebook likes and satellites, to Oyster
cards and drones, the process of collecting and analysing data about the world around us is
becoming very, very cheap. Twenty years ago, gathering data about the human and physical
environment was expensive, but now a lot of it is generated as the ‘exhaust’ of daytoday activity:
tapping on to the bus or train, taking photos (whether from a satellite, drone, or disposable
camera), making phone calls, using our credit cards, and surfing the web. As the costs of
capturing, curating, and processing these data sets falls, the discipline of geography is changing;
so in this short, deliberately provocative, piece I hope to get you thinking about how the rise of
‘cheap’ creates opportunities that geography students are uniquely positioned to observe, but
perhaps poorly trained to exploit.
Introduction
Today’s students face a world in which many of the defining career options for geographers with
basic quantitative skills will either no longer exist, or will have been seriously deskilled. Indeed, so
much can now be done through a web browser (e.g. CartoDB) that specifying ‘Knowledge of
ArcGIS’ is increasingly superfluous for a new hire; not because geoanalysis jobs are no longer in
demand or no longer done – in fact, they are more vital than ever – but because the market for
these skills has split in two: expensive, specialist software is being superseded by simple, non
specialist webbased tools on the ‘basic’ side, and by customised code on the ‘advanced’ side. The
logic behind resources such as ArcGIS Online and Google’s Fusion Tables is that making maps
should be possible for anyone, regardless of background or training. At the same time, geodata
analysis, which calls for the ability to pull in and manipulate realtime data on river-flow or air
quality, may become the preserve of ‘data scientists’ and engineers.
In short, because of the way that the discipline has been studied and taught in Britain, geography
practitioners are at risk of being sidelined at the very moment that our understanding of the
complexity of (spatial) relationships between subjects and objects in real and virtual worlds

2
becomes critically important. We are witnessing the triumph of ‘cheap’ and a resulting change in
the mix of skills that are in demand by employers in the public, private, and third sectors. So a
reluctance to engage with quantitative and computational methods – to engage, in other words,
with data – puts geographers, and their hardwon understanding of the balance and
appropriateness of methodological approaches, at risk. To meet this challenge, the Alevel syllabus
is changing and the way that Geography is taught in secondary schools will need to change as well
if it’s not to end up being seen as a ‘cheap’ backup instead of what it actually is: a valuable
contribution to critical engagement with the world.
As I indicated above, the title of this short paper is intended as a deliberate provocation: I wouldn’t
have become a geographer if I thought that our discipline had no value. Instead, I hope to get you
thinking about how the rise of ‘cheap’ creates opportunities that geography students are uniquely
positioned to observe, but may be poorly trained to exploit. My argument is not new: this short
paper should be read together with the RGSIGB’s A Short Introduction to Quantitative Geography
(Harris, 2012), which is just one of a number of recent publications to detail the importance of
quantitative skills in geography and other disciplines (see also: Society Counts [British Academy,
2012], Geographers Count… [Harris et al., 2013], and Learning to code [Singleton 2014] amongst
others), and which highlight a relative weakness in these skills amongst British students.
Figure 1. Tools of the Trade? Sources & Attributions: Arduino Uno (Derivative Work by JotaCartas, CC BY 2.0); Oyster Card (Own Work by Frank Murmann, CC BY 3.0); Xbox Kinect (Own Work by EvanAmos, Public Domain); iPhones (Apple.com); DJI Phantom (DJI.com).
However, in this piece I’d like to distinguish here between quantitative geography as commonly
taught and the emergence of what we might call computational geography, or geocomputation for

3
short. Even though these two dimensions of our discipline are inseparable, computational
approaches differ in important ways from the quantitative skills commonly taught in ‘methods’
classes: computational geography is underpinned by algorithms that employ concepts such as
iteration and recursion tackling everything from a data processing problem to an entire research
question. For example, Alex Singleton’s OpenAtlas (available for free from the Consumer Data
Research Centre) contains 134,567 maps. Alex designed and wrote a script able to iterate over the
Census areas (i.e. to ‘visit’ each area in turn when creating a map), and to recurse into smaller
subregions from larger regions in order to generate maps at, literally, every conceivable scale; and
then he let the computer do the ‘boring bit’ of actually creating each and every map.
Figure 2. Before and AfterBurn Point Clouds (Source: Jake Simpson, KCL)
Thinking algorithmically requires students – and professionals – to deal with abstraction: we don’t
want to define how each analysis should work, or how each map should look; rather, we want to
specify a set of rules around how to go about selecting and displaying data on a map generically,
and then let the computer make them for us. In this way of working, it’s not really any more work to
create 500 maps than it is to create 5 because we’ve been able to describe to the computer how
maps are made in terms of code that it can ‘understand’ or, more accurately, apply. And when we
combine computational approaches with rich data from, for instance, a drone then we can convert
a set of digital photos into a ‘point cloud’ that allows us to estimate the damage caused by peat
fires with unprecedented detail (see Figure 2).

4
Figure 3. Twitter Languages in London (Source: Ed Manley, CASA/UCL)
Of course, not all computational geographers work with numerical data: they have used text
scraped from social networking sites to look at topics ranging from language use in London (see
Figure 3) to gentrification. And at other times, they create and populate virtual worlds within which
they can run hundreds or thousands of simulations in order to better understand the parameters
affecting how wildfires spread, how cities grow, and how neighbourhood segregation can emerge
even in tolerant communities. By manipulating the initial conditions of these simulations,
geocomputation enables us to explore the ‘space’ of the inputs: we can test out different forestry
management practices in a virtual forest, start silicon wildfires, and see what happens! We can do
this for different types of trees, terrains, climates, and practices, searching for the combinations
that reduce the risk of a massive, uncontrollable conflagration such as happened recently in
Indonesia.
Geocomputation is therefore more properly understood as a way of thinking about a problem rather
than being a new branch of geography, and at its heart it remains the analysis of information in a
spatial context. Until recently, students could expect to encounter these methods and ideas only at
the postgraduate level, with UCL’s Centre for Advanced Spatial Analysis being the bestknown
training ground for Masters and PhD students. The landscape is changing rapidly, however, with a
number of universities, including King’s College London and the University of Liverpool, having
recently introduced optional, programmingoriented modules to 2nd and 3rd year undergraduates on
topics such as ‘geocomputation’ and ‘geographic data science’. Geographers with the requisite
skills find themselves with the opportunity to collaborate with Computer Scientists, Electrical
Engineers, Anthropologists, Digital Humanities Scholars, as well as with organisations ranging

5
from BT Research to Transport for London, from the Treasury to Local Authorities, from the
Defence Science and Technology Laboratory to the Humanitarian OpenStreetMap Team.
Why Now?
In 1999, Rita Gardner, Director of the RGSIBG, observed that 80% of information is spatially
referenced in some way (Geographical, Vol.71, No.8). We have no real idea what that figure might
be today, but thanks to the growth of a datadriven economy – what NESTA has called the Rise of
the Datavores – in industry and academia it’s now nearly impossible to avoid discussions of ‘big
data’ and ‘data science’. You’ve probably come across the term in the news as well: the
controversy surrounding Edward Snowden (who is thought to have download more than 1.7 million
secret documents on mass surveillance by the security services) is rooted in the ability of
governments today to capture and analyse everything: who we call, what we buy, what we say to
one another. But ‘big data’ is also changing how organisations in sectors from software to steel,
and from teaching to transport, think about their operations. Crucially, nearly all of this data is
geographical in some way because social and economic activity is inherently geographical: even
for Internet businesses human and physical geography matter, which is why Google and Facebook
are building their data centres in Finland (low temperatures and skilled workers).
Figure 4. Chicago’s Transport Plan: Output from the CATS Model (ca. 1955)
Of course, we’ve been stretching computers to their limits ever since the first roomsized machines
were installed on campuses fifty years ago and maps were created by a ‘Cartographatron’ (see
Figure 4). Back then, geographers and geographic analysis needs were often in the vanguard of

6
computational research: one of the first big applications of the computer in Britain during the 1950s
was to work out the supply chain for distributing tea made in London to the rest of the UK, and
British Rail then got the Lyons Tea Company’s programmers to work out the shortest routes
between every rail station – over 5,000 in all – in Britain (GrahamCumming, "The Great Railway
Caper").
Figure 5. The Regions of Britain, as Seen Through Phone Usage (Source: Ratti et al.)
So even if it seems like the ground is shifting beneath the feet of many Geography teachers, this
change has actually been a long time coming: back in 1965, Gordon Moore – cofounder of the
chipmaker Intel – observed that the performance of computers was doubling roughly every two
years. That may not sound like much, but over 40 years exponential growth adds up: a computer
chip in the early 1970s might have had 2,000 transistors, by the early 2010s they had
2,500,000,000. In the early 2000s, one of the challenges faced by the Ordnance Survey was
getting maps on to phones, now phones have both more power and a higher resolution displays
than the desktops of the time! Regardless of whether ‘Moore’s Law’ holds for another 5, or 25
years, this change has radically altered how data are created and consumed by society.

7
Dimensions of Cheap
It is this breathtaking technological transformation that helps us to understand why we’re now
debating the onset of a 2nd quantitative revolution in geography (see the special issue of Dialogues
in Human Geography). If the first ‘revolution’ in the 60s and 70s was about the availability of
computing at all, then this one is about the availability of computers everywhere. Chips are now so
cheap that we can literally throw them away in the name of research (e.g. TrashTrack – which
attached strippeddown mobile phone hardware to rubbish in order to track the ‘removal chain’)
and, with a bit of patience, a desktop computer can now process, analyse, and map ten billion
phone calls (see Figure 5 and free content from PLoS One). But if you are thinking that ‘cheap’ is
just about money, then you are missing out on how a confluence of technological and social trends
is radically transforming how we work with geodata and democratising – for both good and ill – our
access to GIS:
Cheap sensors: miniaturisation has affected not just the things we see as computers, but many of
the tools we use in research. The fact that computers are embedded in everything means that
anything is a potential sensor: our mobile phones can help to monitor crowding or congestion, and
our WiFi usage can help researchers to understand who goes where, when, and even why. We
can now attach a set of air quality sensors to a bicycle wheel (e.g. the Copenhagen Wheel) and
power it by pedalling around the city. Add a GPS module and now the sensors can also record
their location anywhere on the planet. Edina’s free FieldTripGB application allows students to
collect and share GPS trails from their smartphones while taking geotagged photos and
observations along the way; all of this can then be pulled together by the teacher for inclass
analysis (see RGSIBG Fieldwork).
For fun, one of my colleagues attached a small ‘Arduino’ (a computer costing less than £40) to the
plant in his office; it now tweets when it gets thirsty. More seriously, Arduinos and their siblings –
the Raspberry Pi and lessknown LillyPads, which are designed to be sewn into clothing – are
being used in a range of contexts, including flood and drought reporting (such as Gaugemap, with
its tweeting river sensors), and cheap drones are now being used for crop monitoring and disaster
relief. Physical geography has always made use of cuttingedge technology, but the use of drones
takes the study of stratovolcanos to a whole new level (see video linked from Figure 6).

8
Figure 6. Flying a Drone Over Bárðarbunga Volcano (Source: DJI)
Cheap data: the pervasiveness of computers means that we are now looking at a very different
scale of data collection; we used to have to do a lot of legwork for each data point, but now we can
get billions of them in a matter of minutes. However, cheap data is also about a philosophy of
access to data: the UK government has, on the whole, been a worldleader in making data open.
The open data movement – represented here in the UK by the efforts of the Open Data Institute,
which runs a variety of training and outreach activities – believes that the more governments and
other organisations make their data available, the more innovation and creativity we will see.
Many governments now actively support this opening up of data – again, nearly all of it implicitly or
explicitly geographical – through the creation of web portals and two of the bestknown can be
found in the UK: the London Data Store and Data.gov.uk. Academic initiatives are also trying to
make this data more accessible to teachers: the DataShine web site allows you to view much of
the Census as an interactive web map and even to save your results as a PDF map; and the
CDRC provides access to even more types of data by geographical location. The ‘best’ open data
can be used by anyone, at any time, for any reason at all, and many commercial ‘apps’ use this as
a foundation for their business. Companies can make money by adding value to existing data (e.g.
making it searchable, making it ‘smarter’, tying in other data…); the CityMapper app, on which
many urbanites depend for travel information, is dependent in turn on free access to data from
transport authorities, mapping agencies, and the like.
Cheap software: in many ways, the growth of open data was presaged by the growth of open
software, of which the Linux operating system remains the most famous. Often referred to by the

9
acronym FOSS (Free Open Source Software), our discipline is not immune to this change and the
majority of geocomputational researchers work with Python, R and QGIS. All of these are free: free
to download; free to install; free to use… and they’ll run on a Mac as well! By making the
underlying code accessible to everyone, FOSS tools make it possible for contributors to add new
features at a rapid clip. Alasdair Rae’s elegant maps of commuting in Britain were generated via
programmed iteration in QGIS! Nor were my maps of London’s housing crisis (see Figure 7)
created by hand: the 100,000 transactions shown on each map were processed entirely in code.
Figure 7. Affordability of Property Transactions in London (Source: Jon Reades, KCL)
Switching to FOSS isn’t always painless since it requires teaching materials to be redeveloped –
sometimes quite frequently because of the rapid rate of progress – and installation isn’t always
seamless, but the budget and flexibility benefits are enormous. Of course, even free software isn't
very powerful if it only does the one specific thing its creator intended; QGIS by itself is useful, but
it's the open plugin model – which gives users new abilities such as making timebased
animations, or embedding Google’s StreetView, amongst thousands of others – that makes QGIS
shine. Got a complex, annoying, but common task to accomplish? Chances are someone has
already written a plugin for it! Best of all, the plugins are all written in a language – Python – that
students are already encountering in their Computer Science classes at GCSE and Alevel.
Cheap interaction: a final area in which the spread of cheap hardware is having an impact is user
interaction. This might sound a bit abstract, but if you think about the pervasiveness of touch
screens and XBox Kinects then the implications are rather more exciting. Researchers at UCL’s
10
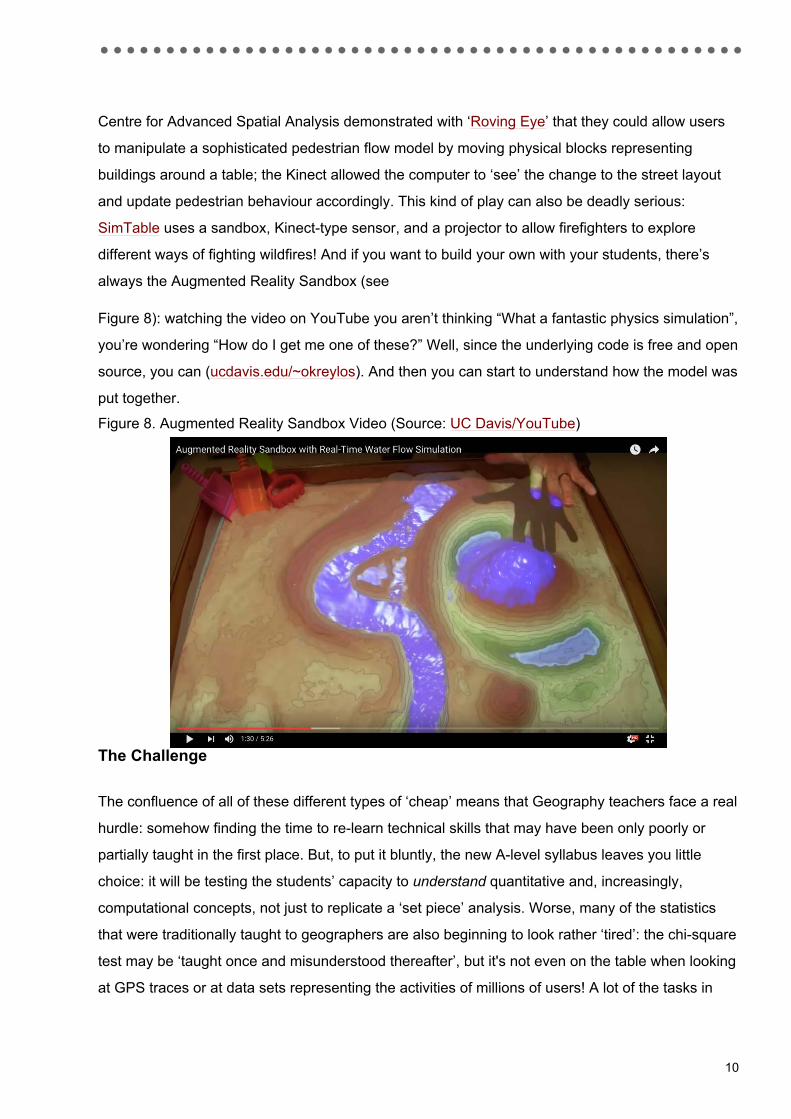
Centre for Advanced Spatial Analysis demonstrated with ‘Roving Eye’ that they could allow users
to manipulate a sophisticated pedestrian flow model by moving physical blocks representing
buildings around a table; the Kinect allowed the computer to ‘see’ the change to the street layout
and update pedestrian behaviour accordingly. This kind of play can also be deadly serious:
SimTable uses a sandbox, Kinecttype sensor, and a projector to allow firefighters to explore
different ways of fighting wildfires! And if you want to build your own with your students, there’s
always the Augmented Reality Sandbox (see
Figure 8): watching the video on YouTube you aren’t thinking “What a fantastic physics simulation”,
you’re wondering “How do I get me one of these?” Well, since the underlying code is free and open
source, you can (ucdavis.edu/~okreylos). And then you can start to understand how the model was
put together.
Figure 8. Augmented Reality Sandbox Video (Source: UC Davis/YouTube)
The Challenge
The confluence of all of these different types of ‘cheap’ means that Geography teachers face a real
hurdle: somehow finding the time to relearn technical skills that may have been only poorly or
partially taught in the first place. But, to put it bluntly, the new Alevel syllabus leaves you little
choice: it will be testing the students’ capacity to understand quantitative and, increasingly,
computational concepts, not just to replicate a ‘set piece’ analysis. Worse, many of the statistics
that were traditionally taught to geographers are also beginning to look rather ‘tired’: the chisquare
test may be ‘taught once and misunderstood thereafter’, but it's not even on the table when looking
at GPS traces or at data sets representing the activities of millions of users! A lot of the tasks in

11
which computational geographers engage apply concepts that are rarely, or weakly, taught in
secondary schools.
Moreover, the ‘big data’ streaming in from sensors and systems across the planet are not ‘given’ to
us in the way that data often were in undergraduate degree or PGCE programmes: some of you
may recall being given an SPSS file and told to perform a set of seemingly arbitrary tasks in order
to obtain ‘a result’ with some level of statistical significance. Realworld and realtime data doesn’t
look anything like this: it is messy, incomplete, undocumented, and almost always biased. Why
might Twitter data be a bad way to understand deprivation, but a good way to understand
gentrification? Why might mobile phone data be useful for exploring workingage commuting
patterns, but miss out the most vulnerable members of society?
The only way to even begin to work with this kind of data is via the ‘magic’ of code and by
developing a much deeper appreciation of what data actually is. Students who have been spoon
fed predigested data sets will naturally be less resilient when encountering realworld data for the
first time because the careful scrubbing by instructors that gives nice, clear ‘teachable’ answers
has not happened, and the data set contains everything from missing and incomplete ones, to
readings that are materially incorrect because of a sensor malfunction or influenced by something
beyond our control. However, without this exposure to real data, students end up with a Magic 8
Ball mentality of ‘try again later’ or ‘computer says no’. In this kind of environment it’s impossible for
learners to have the depth of background and experience to ask ‘what if’ questions and to deploy
the realworld modeller’s toolkit of standardisation, normalisation, cleaning and transformation.
The Value of Computational Thinking
Exposure to realworld geodata can also deepen student understanding of the mathematics and
statistics. You will rarely encounter a normal distribution working with Census data! Some of the
most difficult spatial statistics in common use – Getis Ord General G/Gi*, and Moran’s I, for
instance – can be much more readily grasped as examples of recursion and iteration than they can
as mathematical formulae. And a more abstract conception of spatial data supports a deeper
understanding of techniques, such as Geographically Weighted Regression, that remain cutting
edge to this day. The two most popular languages amongst computational geographers – Python
and R – are widely used in other disciplines as well: Python is frequently used in the Computer
Science Alevel and underlies both ESRI’s ArcGIS model builder and the entire QGIS application.
Moreover, both languages are amongst the most popular for data scientists, so it's good for
employability too.

12
Programming skills are highly transferable in the same way that wider quantitative skills are
transferable, but it also reinforces one of the most visibly lacking skills in undergraduates: the
ability to think abstractly and adaptively. Working with data via code is very different from working
with data via a graphical user interface in a GIS or spreadsheet application: you develop a deeper
understanding of the essential fungibility of all types of data, as well as a more profound
comprehension of how geodata works and can be manipulated to serve an analytical end. Place
names in a historical text can be translated into coordinate pairs using a dictionary derived from
Wikipedia, and observations from moisture sensors can be interpolated on to a raster surface to
enable us to look at the intensity of rainfall. ‘Space archaeology’, in which people search for
evidence of ancient settlements by the traces they leave in satellite photographs, is being
augmented by code that trains computers to ‘see’ straight lines where none should exist, and
LiDAR is being used to peer beneath the jungle canopy for lost cities in South America and
Cambodia.
Figure 9. Crowd Modelling in Mecca (Images courtesy Crowd Dynamics International Ltd.)
It’s easy to equate computational geography with ‘big (geo)data’ – which is already beginning to
sound a bit 2012 – but it’s also applied in another context: simulation. The most common form of
geographical simulation is via AgentBased Models in which you can represent everything from
cars to households as independent ‘snippets’ of code. This kind of coding can improve our
understanding of the complexity of the world around us – why do traffic jams seems to travel
backwards even though cars are all travelling forwards – but it also highlights the extent to which
the real world is only partially captured by data. The Roving Eye and SimTable mentioned above

13
are examples of AgentBased Models, and they are commonly used in situations where
understanding the activities of individuals or households is important: after a series of disasters in
which pilgrims were crushed to death, the Saudi government is using ABMs to try to improve the
safety of the Hajj, the largest flow of people on the planet, by modelling how crowds – which can
exceed a million people – behave on the Jamarat Bridge and on the streets approach the Holy
Mosque!
SimCity is another modern example of an AgentBased Model, but the best known model was
created in 1971 by an American economist named Thomas Schelling: it allows students to see how
even a grossly simplified representation of human behaviour – reduced to just a vague preference
to be near people ‘like me’ – can reproduce extreme segregation at the urban scale. The Schelling
Model (free downloadable version) contains two types of households – usually, and suggestively,
coloured black and white – each of which has a degree of preference for households of the same
colour. Students can change the strength of the preference, the number of each type of household,
and the amount of space available to see what types of spatial patterns emerge. Even though it’s a
grossly simplified version of the real world, many geographers have never really grasped the
meaning of ‘all models are wrong, but some are useful’ (attributed to the statistician George Box);
social simulation brings this issue to the front every time and there are clearly going to be some
interesting discussions after a few runs of a segregation model.
To sum up, researchers, corporations, and governments are examining human behaviour on an
unprecedented scale with a view to understanding how we make decisions about where to live and
who to love, selling us individually targeted products based on our browsing habits, and trying to
keep us safe. For some this is the ‘end of theory’ because we no longer need to extrapolate,
sample, or just plain guess; for others, we seem to be headed towards an Orwellian dystopia in
which we are surveilled by governments and unaccountable corporations without consent and
without appeal. We all have growing 'data shadows' thanks to the penetration of our physical and
social worlds by networkenabled computers, but the majority of students – and their teachers –
are unaware of the myriad ways in which this data can be used and abused.
Shifting Perspective
Changes to secondary education create new opportunities for Geography teachers: they do not
need to master programming themselves in order to work with Computer Science teachers to
develop joint exercises that teach geographers to think like programmers and programmers to
think like geographers. The concepts mastered in the Computer Science Alevel may seem to have
little realworld relevance, so it's hard to think of a better exercise for a group of such students than

14
to get them outside collecting geodata that they can bring back to the lab and analyse collectively
using code. On a project like this, both disciplines bring something exciting to the table since
students can generate, monitor, collect, and analyse their own data. It’s a full data science pipeline!
Even for the most dataphobic geographer, the use of GPS data can lead to wider discussions of
topics such as surveillance and privacy. Can you find your classmate’s home just by looking at his
or her data? What about hidden friendships or relationships? How variable are our travel patterns?
How widely do we roam? These are the kinds of questions that might well be explored in the
forthcoming ALevel individual investigation. And these types of exercises and discussions also
help to move us away from the ‘traditional’ divide between human and physical geography;
algorithms don’t distinguish between disciplinary boundaries, what matters is the relevance of the
approach. Can river models help us to understand the flow of crowds? Can landslide models tell us
something about the impact of rail closures?
Sad to say, there are still some geography teachers who do not get enough access to, or have the
desire to take advantage of, the computer lab beyond a requisite ‘GIS session’. To answer the
inevitable question from colleagues: what do computers have to do with geography? Geography
can provide the practical context – the ground – in which concepts covered in maths and
computing classes are applied in practice. Not only does this kind of experiential, problemoriented
learning reinforce the formal teaching in other classes, but it is also likely to increase retention in
Computer Science of students – including women and those with Black and Minority Ethnic
backgrounds – for which there is evidence to suggest that they place additional value on the
potential impact of their studies (see Raja 2014). So linking maths and computing to issues ranging
from segregation to development seems to create possibilities for enhanced retention and higher
achievement.
Spatial thinking now pervades social sciences with, for example, ideas of mobility and diffusion
infecting public health and transportation research (Torrens 2010, p.135), but in universities it’s still
the case that just over half of undergraduate programmes in Geography include any discussion of
spatial statistics or computer modelling (Harris et al., p.4). To educate the next generation of
computational geographers we need to start earlier: there is an up and coming cohort of recent
graduates of Masters and Doctoral programmes, but for tomorrow’s Alevel students to start to
acquire computational thinking at that point in time will be too late since the most exciting and
rapidly changing areas of our discipline will have been colonised, or even subsumed, by ‘physicists
with geography envy’.

15
Figure 10. Tekja Data Visualisation CoFounders & Visualisation of Commuter FlowsSources: Jacopo Hirschstein and Amanda Taylor, Tekja Data Visualisation; London commuter map, Tekja Data Visualisation.
Not that this challenge can’t be met and welcomed: while there is an obvious ‘human flavour’ to the
examples I’ve used – they are the ones that I know best – in my work I regularly collaborate with
physical geographers, theoretical physicists, computer scientists, transport engineers, data
visualisation specialists, and sociologists amongst others. We regularly swap techniques and
concepts that might be useful without much regard for disciplinary boundaries; it is what makes this
field so exciting! But for completeness, and for a richer sense of how these techniques are being
applied in physical geography, there are useful taster chapters in the new edition of Key Methods
in Geography – in particular the chapters by Guth, Lane, Malanson & Heumann, and Millington – to
round out the ideas presented here.
Geography is one of the only disciplines where diverse intellectual traditions are in regular, if
sometimes contentious, contact. And geocomputation has the potential to be one of the main
avenues for knowledge exchange between the hard sciences, the social sciences, and the
humanities! Some students, and not a few parents, seem to think of geography as the ‘safe’
backup Alevel: interesting and useful enough to continue to AS, but easy to drop once it’s clear
that the student is on track to master the ‘hard’ sciences. That view needs to change. It deserves to
change. At the bleeding edge geography doesn't wear socks and sandals, it looks a lot like a tech
startup in Shoreditch or Hackney Wick (see ’.

16
Figure 10) while remaining grounded in the discipline’s critical traditions. The future of geography
may be cheap, but even so one thing will remain expensive: people with the broadbased
knowledge, the specialist skills, and the passion to change it.
Acknowledgements
This work has benefited immensely from the time and generosity of colleagues and collaborators
across the UK, many of who are referenced in the text. Special mention, however, should be made
of the contribution made by Dr. James Millington: the ideas expressed above seek to capture our
extensive and ongoing discussions around the purpose, methods, and delivery of our
undergraduate Geocomputation pathway at King’s College London. This piece could not have
been written without his input, though any misrepresentations or omissions remains mine alone.
References
The British Academy (2012), Society Counts, URL:
<http://www.britac.ac.uk/policy/Society_Counts.cfm>.
Harris, R. (2012), A Short Introduction to Quantitative Geography, Royal Geographical Society with
IBG, URL: <https://www.rgs.org/NR/rdonlyres/46EB70CA-5508-4FB6-9629-
ECD718CDCB83/0/AShortIntroductiontoQuantitativeGeography.pdf>.
Harris, R. and Fitzpatrick, K. and Souch, C. and Brunsdon, C. and Jarvis, C. and Keylock, C. and
Orford, S. and Singleton, A. and Tate, N. (2013), Quantitative Methods in Geography: Making the
Connections between Schools, Universities and Employers, Royal Geographical Society with IBG,
URL:
<https://www.researchgate.net/publication/256191493_Quantitative_Methods_in_Geography_Maki
ng_the_Connections_between_Schools_Universities_and_Employers>.
Raja, T. (2014), ‘Is coding the new literacy?’, Mother Jones, June 2014, URL:
<http://m.motherjones.com/media/2014/06/ computerscienceprogrammingcodediversitysexism
education>.
Singleton, A. (2014), “Learning to Code”, Geographical Magazine, January 2014, p.77.
Torrens, P.M. (2010), “Geography and computational social science”, GeoJournal, 75:133148.