Embed Size (px)
Citation preview
WHY RUSSIA'S RURAL POOR ARE POOR
Stephen K. WegrenSouthern Methodist University
David J . O'BrienUniversity of Missouri
Valeri V. Patsiokovsk iInstitute for Socio-Economic Problems of the Population — Moscow
The National Council for Eurasian and East European Research
910 17th Street, N.W .Suite 300
Washington, D.C. 20006
TITLE VIII PROGRAM

Project Information*
Contractor:
Southern Methodist University
Principal Investigator :
Stephen K. Wegren
Council Contract Number :
816-14g
Date :
August 7, 2003
Copyright Informatio n
Individual researchers retain the copyright on their work products derived from research funde dthrough a contract or grant from the National Council for Eurasian and East European Researc h(NCEEER). However, the NCEEER and the United States Government have the right to duplicat eand disseminate, in written and electronic form, reports submitted to NCEEER to fulfill Contract o rGrant Agreements either (a) for NCEEER's own internal use, or (b) for use by the United State sGovernment, and as follows : (1) for further dissemination to domestic, international, and foreig ngovernments, entities and/or individuals to serve official United States Government purposes or (2 )for dissemination in accordance with the Freedom of Information Act or other law or policy of th eUnited States Government granting the public access to documents held by the United State sGovernment . Neither NCEEER nor the United States Government nor any recipient of thi sReport may use it for commercial sale .
* The work leading to this report was supported in part by contract or grant funds provided by th eNational Council for Eurasian and East European Research, funds which were made available by th eU.S. Department of State under Title VIII (The Soviet-East European Research and Training Act o f1983, as amended) . The analysis and interpretations contained herein are those of the author.
ii
Executive Summar y
The article is organized around two general questions : (1) how have the rural poor fared during
reform; and (2) to what extent have the rural poor adapted to new conditions during reform? This articl e
contributes an original analysis to the rural poverty issue in two ways . First, it explores a topic tha t
previously has not been analyzed in the literature ; and second, it uses survey data which allows an in-depth
examination of rural poverty at the household level . Our data allow us to focus on households living in
poverty, and our units of analysis are rural households and rural individuals .
Our data suggest that there are fundamental differences in the stock of human and productive capita l
between poor and non-poor households . In our sample, households at or below the poverty line have a mean
size of 2 .7 persons, while households above the poverty line have a mean size of 4 .0 persons, representing a
substantial difference . An individual at or below the poverty line is older, having a mean age of 53 .7 years of
age, while an individual above the poverty line has a mean age of 47 .9 years of age, which is also a
considerable difference . Individuals at or below the poverty line have lower levels of education : husbands
have a mean educational level of 9 .7 years and wives 9 .5 . Conversely, individuals above the poverty line are
better educated and have a mean of 10 .8 years for the husband and 11 .0 years for the wife .
Individuals living in poverty are more likely to feel lonely, unhappy and depressed . On a scale of 1 -
4, with 1 being "never" and 4 being "most of the time," persons in poverty have a mean score of 1 .85 for
feeling lonely, 2 .06 for feeling happy, and 1 .81 for feeling depressed. Persons above the poverty threshol d
have a mean score of 1 .46 for feeling lonely, 2 .35 for feeling happy, and 1 .50 for feeling depressed. These
results are important because they are linked to pro-reform behaviors . In particular, statistically significan t
correlations show that :
(1) Feeling happy is positively correlated to increasing land plots . l(2) Feeling happy is positively correlated to feeling in control of one's life . 2(3) Feeling in control of one ' s life is positively correlated to increasing land plots ?(4) Feeling in control of one's life is positively correlated to satisfaction with village life . 4(5) Satisfaction with village life is positively correlated to increasing land plots . 5
Therefore, persons in poverty have more negative psychological dispositions and less positive,
which in turn affects the likelihood of using opportunities created by reform such as participating in the lan d
market .
iii
Introduction
The Soviet Union was a welfare state, officially classless, and although stratification existed i n
reality, it was neither significant nor did it affect a large portion of the population . All of that changed as
market reforms were introduced, first half-heartedly under Gorbachev in 1989, but then full force unde r
Yeltsin in 1992. During Russia's transition from a command to a market economy, some distinguishin g
socio-economic trends stand out .
The first is a significant increase in stratification among social classes, giving rise to new social
strata--led by the oligarchs who possess enormous wealth and power and who number no more than 1,00 0
persons throughout Russia (Freeland, 2000, chap . 5) .6 In terms of class hierarchy, the oligarchs ar e
followed by the so-called New Russians, who number less than one million persons throughout Russia . '
Rising inequality is evident not only between New Russians and the rest of the population, but also acros s
occupations, within occupational groups, and across regions .
In short, economic differentiation increased severalfold throughout Russia, indicated by an
increasing Gini coefficient to about .38- .40 in 1995, which was above the level in OECD countries bu t
less than in Latin American countries (Aslund, 1997, p . 129). By the mid-1990s, the richest 20% of the
population received about 50% of total monetary income in the nation, a trend which continued for th e
rest of the decade (Aslund, 1997, p . 129). Meanwhile, Russian workers suffered from wage arrears, a
decline in real incomes and purchasing power, decreasing standards of living, increasing health problems ,
lower food consumption and a deterioration in the quality of their diet, and a loss of job security
(Gustafson, 1999, chap . 8 ; Desai and Idson, 2000) .
In rural Russia, stratification also increased, with some analysts speaking of "collapsing" an d
"surviving" agricultural enterprises ; others wrote about "winners and losers" (Kitching, 1998 ; Wegren ,
O'Brien, Patsiorkovski, 2003) . On the whole, however, the agricultural sector did not become as stratifie d
as urban Russia . Rural Russia was not as highly stratified primarily because :
(1) the new Russian rich were more interested in acquiring lucrative oil and gas rights or sendin g
their riches abroad, and thus rural land was not perceived as attractive as other natural resources ;
(2) most rural citizens had low incomes and limited purchasing power ;
1

(3) legislation restricted the ability to buy rural land and required that agricultural land be used fo r
agricultural purposes ;
(4) economic opportunity was less in rural Russia, with avenues to upward mobility mor e
restricted ; and
(5) a decaying rural infrastructure reduced the value and convenience of rural land ownership as a ninvestment.8
With the increase in social stratification, a second notable aspect during Russia's transition is a n
increase in poverty. This article focuses on rural poverty . Even though rural Russia had less stratification ,
it did not mean it was less poor, and in fact, some surveys show that rural areas have the highest
percentage of the poorest of the poor (Krasil'nikova, 2000, p . 44) . Indeed, one comparative study found
that "urban poverty is markedly lower than rural poverty" in transition countries (Grootaert and
Braithwaite, 1999, p . 49) . This is a common pattern among countries throughout the world. In the former
Soviet Union, however, higher incidence of rural poverty is not standard and suggests that the rural sector
was a "loser" during the transition .
The purpose of this article is not to quantify or estimate the level of rural poverty . Rather, the goal
is to further our understanding of the condition of living in rural poverty and the factors that contribute to
poverty . The article is motivated by the fact that while significant attention has been given to socio -
economic consequences of Russia's market transition and the increase in poverty in general (see McAuley ,
1995 ; Braithwaite, Grootaert & Milanovic, 1999, chap . 2 ; Desai and Idson, 2000, chap . 13 ; Silverman and
Yanowitch, 2000, chap . 3 ; Klugman and Marnie, 2001, chap . 16), absent in the scholarly literature are
detailed analyses about rural poverty.
The neglect of rural poverty among analysts is unfortunate because the number of people affecte d
by poverty is significant, numbering in the tens of millions . 9 Those millions of people have a direct impact
on the conduct and economic success of rural reforms, and their plight during reform . It was hardly th e
intent of market reforms to impoverish millions of new rural Russians, but that is exactly what happened .
In that sense, this article speaks to an aspect of reform that was less than successful .
The article is organized around two general questions : (1) how have the rural poor fared durin g
2
reform; and (2) to what extent have the rural poor adapted to new conditions during reform? This article
contributes an original analysis to the rural poverty issue in two ways . First, it explores a topic tha t
previously has not analyzed in the literature ; and second, it uses survey data which allows an in-depth
examination of rural poverty at the household level . Our data allow us to focus on households living i n
poverty, and our units of analysis are rural households and rural individuals . We begin first with a few
words about our research data before turning to an analysis of rural poverty .
Research Data
The data for this article are drawn from a survey conducted in five Russian regions during 2001 .
Those five regions include: Belgorod oblast, Volgograd oblast, Krasnodar kray, Novgorod oblast, and th e
Chuvash Republic . Within each region, four villages were selected, and within each village, 40 household s
were surveyed, for a total sample of 800 households (160 households in each region) . The pretest of th e
questions was conducted in June 2001 in Ryazan oblast, followed by the full survey during July-Octobe r
2001 . Thus, N=800 for our sample and this article .
In selecting villages to be surveyed, a primary objective was to gather data from "real" rural
Russians, owing to the well-known effects of modernization and urbanization which influence attitude s
and behaviors . Previously, when surveying "rural" Russia, it has often been the case that "rural" village s
are selected due to their close proximity to an urban center, for the sake of convenience . The consequenc e
of this selection method is that respondents' views do not capture the real attitudes of rural Russia . Our
selection method purposefully focused on remote villages that were located several hours (by bus) from a n
urban center . Moreover, a cross-section of different types of villages was used : small, middle-sized,
economically weak, and economically strong .
For each of the selected villages a stratified sample was composed from the household list o f
permanent residents which is kept by the village administration for all households within its jurisdiction .
This list is updated annually and contains demographic and social characteristics of the households on th e
list . Households on this list included persons working on large farms, private farmers, persons working i n
food processing or food trade business, and persons engaged in private household agricultural productio n
3
and/or processing . One person from each household was interviewed. Data were collected about th e
respondent and the household in which he/she resides, which allows either the individual or the househol d
to be used as the unit of analysis . The survey consisted of more than 100 questions per respondent .
Interviews were conducted person to person by a research team from the Institute on Socio-Economic
Problems of the Population (Moscow) .
In order to conduct our analysis, a dummy variable was created : (1) households living "in
poverty" and those "not in poverty ." For purposes of this article, we use monetary incomes, even thoug h
we acknowledge that non-monetary income is an important factor in overall household welfare, and that
non-monetary income increased as a share of total household income for rural families during the 1990 s
(O'Brien, Patsiorkovski, & Dershem, 2000) . The use of monetary incomes as a measure of household
welfare is a commonly accepted methodology among analysts of poverty (Grootaert and Braithwaite ,
1999, p . 19) . At the time of our survey the official subsistence level was 1,574 rubles per person pe r
month (about $54 at 2001 exchange rates) . With a mean size of three persons per household, a household
living in poverty would have a monetary income of 4,722 rubles per month or less (about $163) .
Thus, we created a dichotomous variable which divides households into two groups : those with
monetary incomes at or below this threshold, and those above it . References below will be made to "the
rural poor" and "non-poor," referring to households below the poverty threshold and those above it ,
respectively . In reality, we recognize that material and life style differences are not likely to be significan t
between households with 4,722 rubles per month and 4,723 rubles per month, but we justify this cutoff a s
analytically necessary, and one that is based on official government standards .
Post-Soviet Poverty : Background
Officially, poverty was non-existent in the Soviet Union, although in reality it existed but the tru e
extent is unknown . Estimates place the Soviet poverty rate at about 6-14% of the total population, an d
about 11% of Russians (McAuley, 1979, chap . 4 ; Klugman and Marnie, 2001, p . 447) . Soviet poverty
was highly correlated to family size : the more children under 18, the higher the incidence of poverty .
Especially affected were single parent households or households with one wage earner . In addition, certain
4
groups of pensioners were vulnerable, such as those who lived alone or had no alternative sources o f
income (McAuley, 1979; Matthews, 1986 ; Klugman and Mamie, 2001) . There was also a great deal of
regional variation throughout the Soviet Union . The republics with the highest incidence of poverty wer e
in Central Asia (Braithwaite, 1990) .
Upon liberalization of the economy from Soviet-era regulation, there was no commonly accepted
methodology for calculating the poverty threshold . In 1992, in the midst of economic crisis--soaring
inflation and plummeting production--the Russian Ministry of Labor devised a methodology to measur e
poverty which assumed that citizens spent 68% of their income on food, 19% on nonfood goods, 7% o n
services, and 5% on taxes and other expenses (Rimashevskaya, 2001, p . 158). Some analysts argued thi s
level was actually too low, that families spent even more on food, and therefore the assumption of th e
Ministry of Labor was inaccurate as a measure of poverty .
In reality, non-food prices and the cost of services were rising even faster than food prices, and so
the entire poverty methodology was distorted and the threshold probably too low . As nonfood goods
continued to outstrip food prices, the 68% assumption became untenable and so in 1995 the Russia n
Ministry of Labor reduced the share of food in the subsistence budget to 57%. By placing more emphasi s
on nonfood goods, this raised the poverty threshold and increased the number of persons living in povert y
from 30 million to 40 million (Desai and Idson, 2000, p . 208).
This method remained in place for a number of years, and served as the foundation of legislatio n
which defined minimum living standards and pensions . In 2000, the methodology was changed again, but
not as drastically . The composition of the food basket for pensioners was changed to reflect thei r
consumption patterns more accurately . For the nonfood portion of minimal living standards, th e
methodology was changed from basing calculations on the expenditure patterns of poor families to a
basket of 115 nonfood items based on expenditure norms for goods and services (Rimashevskaya, 2001 ,
p . 159) .
While the percentage of Russians living in poverty has been debated and disputed, it is agreed tha t
poverty increased dramatically during Russia's transition in comparison to the Soviet period . We shoul d
note that there is no universally accepted number of people living in poverty, as poverty rates are based o n
5
estimates and extrapolations from surveys (McAuley, 1995, pp . 180-83) . In general, unofficial estimate s
are higher, and often distinguish between the "poor" and "extremely poor" (Krasil'nikova, 2000) . With
those caveats in mind, a general picture of the Russian poverty rate can be presented . In October 1991 ,
Russian President Boris Yeltsin estimated that 55% of Russian families lived at or below the official
poverty level . In early 1992, the International Labor Organization estimated that 85% of Russians lived i n
poverty (Silverman and Yanowitch, 2000, p . 42), while the official government estimate was much lower ,
about one-third of the population .
Thereafter, estimates about the population living in poverty varied, but it is generally accepted tha t
poverty rates drifted downward, from about one-third to one-quarter of the population until the latter par t
the decade (Silverman and Yanowitch, 2000, p . 46; Rimashevskaya, 2001, p . 163). Following the
financial collapse of August 1998, the number of people living in poverty increased, according to som e
estimates, to more than 38% of Russian population at the beginning of 1999 (Silverman and Yanowitch ,
2000, p . 156), while others put the rate at about 30% (Rimashevskaya, 2001, p . 163) . Western estimate s
were even higher, estimating that 79 million Russians, out of a population of 147 million (almost 54%) ,
were living below the official poverty line in late 1998 (The Financial Times, November 12, 1998, p . 3) .
In April 1999, the World Bank predicted that up to 30 million people would live in "extreme poverty" i n
the year 2000 (The Financial Times, April 19, 1999, p .18). In the Putin era some argue that the poverty
rate has declined to the mid-20 percentiles, affecting about 40 million Russians (Moscow News, September
25-October 1, 2002), while other estimates state that poverty has increased to levels comparable to th e
early 1990s (Rimashevskaya, 2001, p . 163).
Finally, the literature on Russian poverty has examined in detail the causes of poverty and
provided a comprehensive view of the primary factors affecting the incidence of poverty . A short
summary of those findings provides a comparative background to causes of rural poverty which ar e
considered in sections below . 10 The factors relating to poverty in Russia during the 1990s include :
(1) Location . There is a strong regional component to poverty, a legacy of the planned economy ,
replete with one-dimensional local economies and outdated technology in the industrial heartland .
(2) Family composition. The incidence of poverty increases with family size . In the early 1990s,
6
85% of families with three or more children were in poverty .
(3) Unemployment. Families headed by an unemployed member have high rates of poverty . As
the 1990s progressed, the average duration of unemployment increased .
(4) Wages and Pensions. Real wages declined during the 1990s, compounded by wage arrear s
which often extended for months . Pension payments also lagged inflation and were chronically in
arrears .
(5) Gender. Households headed by women have higher poverty rates than households headed b y
men.
Rural Poverty in Russia
Analyses of the general causes of poverty, as discussed above, place emphasis on structural
factors . Those general causes of poverty yields useful insights into our understanding of poverty in post -
Soviet Russia. Ultimately, however, structural factors do not go far enough, and do not capture the ful l
range of relevant variables . The purpose of this section is to introduce additional factors why Russia's rura l
poor are poor .
Although one of the original goals of agrarian reform was to destroy the vestiges of the old Sovie t
system, it is highly unlikely that reformers intended or wanted to increase rural poverty for the masses .
Nonetheless, it may be argued that reform policy during the 1990s took the form of state urban bias .
Urban bias theory explains how the rural sector is discriminated against and how that discriminatio n
contributes to rural poorness .
Flowing from the work of M. Lipton in the 1970s, who wrote a book entitled Why Poor People
Stay Poor, urban bias became widely accepted as a political economy approach to why rural interests wer e
often discriminated against in developing nations (Lipton, 1976) . The model was expanded upon an d
became a powerful explanation for urban-rural relations in Third World and post-Soviet states (Bates ,
J981 ; Bates, 1983; Sadowski, 1991 ; Thiesenhusen, 1995 ; and Wegren, 2002) .
Urban bias defines urban-rural relationships and maintains that states act to protect urban interest s
and discriminate against rural interests . The urban bias theory argues that financial, productive, and human
7
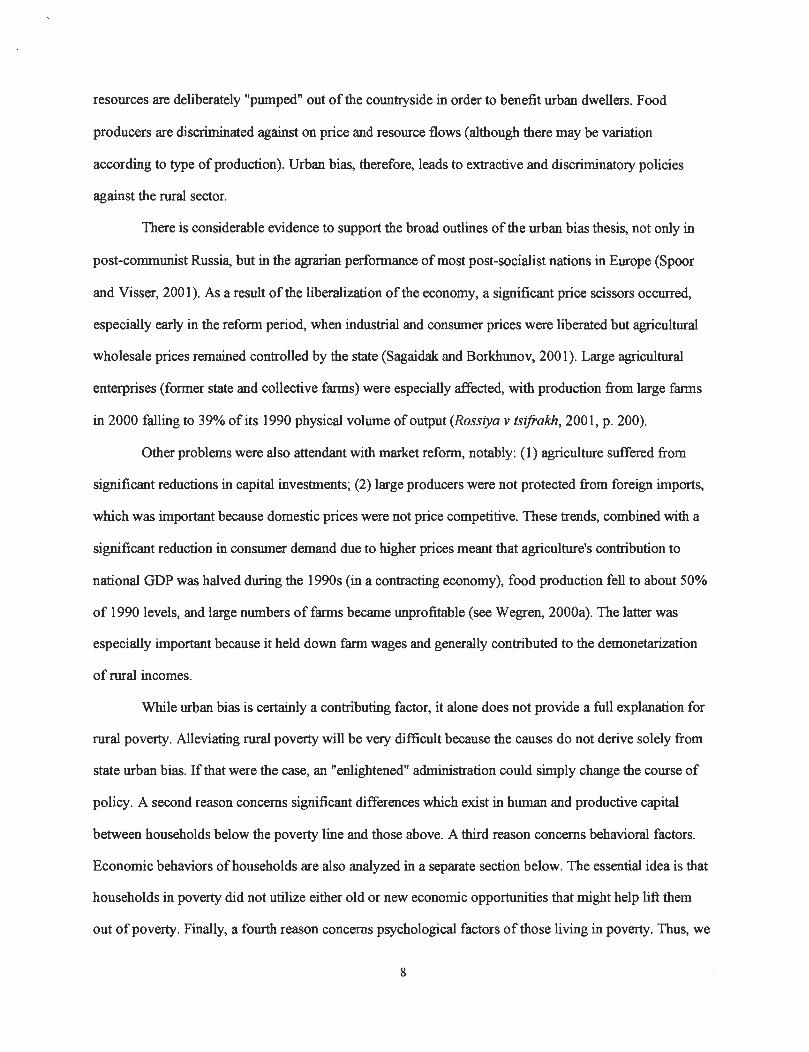
resources are deliberately "pumped" out of the countryside in order to benefit urban dwellers. Food
producers are discriminated against on price and resource flows (although there may be variatio n
according to type of production) . Urban bias, therefore, leads to extractive and discriminatory policie s
against the rural sector .
There is considerable evidence to support the broad outlines of the urban bias thesis, not only in
post-communist Russia, but in the agrarian performance of most post-socialist nations in Europe (Spoo r
and Visser, 2001) . As a result of the liberalization of the economy, a significant price scissors occurred ,
especially early in the reform period, when industrial and consumer prices were liberated but agricultura l
wholesale prices remained controlled by the state (Sagaidak and Borkhunov, 2001) . Large agricultural
enterprises (former state and collective farms) were especially affected, with production from large farm s
in 2000 falling to 39% of its 1990 physical volume of output (Rossiya v tsifrakh, 2001, p . 200) .
Other problems were also attendant with market reform, notably : (1) agriculture suffered from
significant reductions in capital investments ; (2) large producers were not protected from foreign imports ,
which was important because domestic prices were not price competitive . These trends, combined with a
significant reduction in consumer demand due to higher prices meant that agriculture's contribution t o
national GDP was halved during the 1990s (in a contracting economy), food production fell to about 50 %
of 1990 levels, and large numbers of farms became unprofitable (see Wegren, 2000a) . The latter was
especially important because it held down farm wages and generally contributed to the demonetarizatio n
of rural incomes .
While urban bias is certainly a contributing factor, it alone does not provide a full explanation fo r
rural poverty. Alleviating rural poverty will be very difficult because the causes do not derive solely fro m
state urban bias . If that were the case, an "enlightened" administration could simply change the course o f
policy . A second reason concerns significant differences which exist in human and productive capita l
between households below the poverty line and those above . A third reason concerns behavioral factors .
Economic behaviors of households are also analyzed in a separate section below . The essential idea is that
households in poverty did not utilize either old or new economic opportunities that might help lift the m
out of poverty . Finally, a fourth reason concerns psychological factors of those living in poverty . Thus, we
8
argue that poverty cannot be alleviated by changes in policy alone because the factors contributing to rural
poverty are structural, behavioral, and psychological . Each is discussed in detail below .
Structural Factors of Rural Poverty
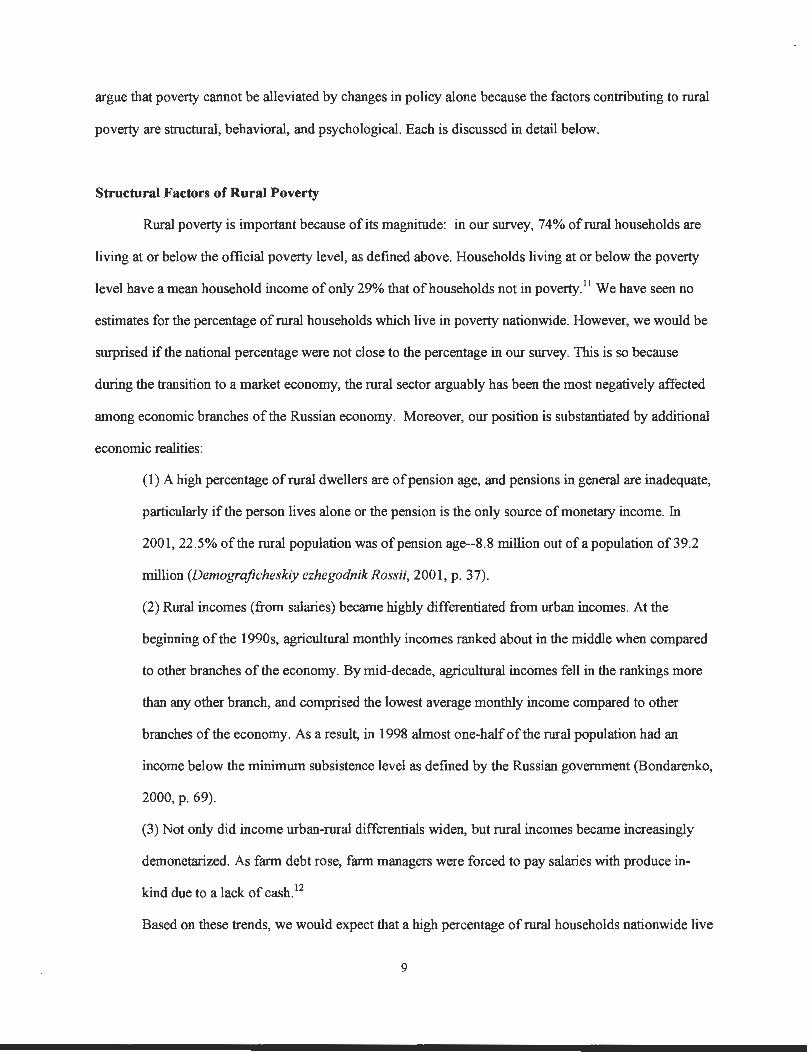
Rural poverty is important because of its magnitude : in our survey, 74% of rural households are
living at or below the official poverty level, as defined above . Households living at or below the poverty
level have a mean household income of only 29% that of households not in poverty .11 We have seen no
estimates for the percentage of rural households which live in poverty nationwide . However, we would be
surprised if the national percentage were not close to the percentage in our survey . This is so because
during the transition to a market economy, the rural sector arguably has been the most negatively affecte d
among economic branches of the Russian economy . Moreover, our position is substantiated by additiona l
economic realities :
(1) A high percentage of rural dwellers are of pension age, and pensions in general are inadequate,
particularly if the person lives alone or the pension is the only source of monetary income . In
2001, 22 .5% of the rural population was of pension age--8 .8 million out of a population of 39 . 2
million (Demograficheskiy ezhegodnik Rossii, 2001, p . 37) .
(2) Rural incomes (from salaries) became highly differentiated from urban incomes . At the
beginning of the 1990s, agricultural monthly incomes ranked about in the middle when compare d
to other branches of the economy. By mid-decade, agricultural incomes fell in the rankings more
than any other branch, and comprised the lowest average monthly income compared to other
branches of the economy . As a result, in 1998 almost one-half of the rural population had an
income below the minimum subsistence level as defined by the Russian government (Bondarenko ,
2000, p . 69) .
(3) Not only did income urban-rural differentials widen, but rural incomes became increasingl y
demonetarized . As farm debt rose, farm managers were forced to pay salaries with produce in -
kind due to a lack of cash. 1 2
Based on these trends, we would expect that a high percentage of rural households nationwide liv e
9

at or below the poverty line . This does not mean that some "entrepreneurial" households did not improve
their welfare by taking advantage of opportunities created by reform--some evidence confirms this is
precisely what happened (O'Brien, Patsiorkovski, & Dershem, 2000, chap . 9 ; Wegren, O'Brien, &
Patsiorkovski, 2003) . However, even with modest improvements among some households, the level of
welfare was very low for the vast majority of rural households . This section, therefore, presents an
overview of structural factors which contribute to rural poverty . One of the most noted scholars on poverty
in the Soviet Union and former Soviet Union argued that :
There is both old and new poverty in Russia, but. . .most of it is new . . . . [T]he new households havemuch the same stock of durables as the non-poor . . .they have much the same stock of human capital . Inprinciple, therefore, it should be relatively easy to transform them back into non-poor (McAuley ,1995, p . 188) .
We find, however, little reason for optimism that the poor can be "easily" converted back into
non-poor. In particular, there are several structural factors to be overcome . Our data suggest the following :
(1) low wages are a primary cause of poverty ; 13 (2) long-term unemployment is a problem ; and (3 )
insufficient pensions are also a principal cause of poverty .
For example, a common cause of poverty, unemployment, especially long-term, is a significan t
contributor to rural poverty in our sample. In our survey, only 8 .6% of households living in poverty have a
member who lost a job during 2000 . However, of the total number of households living in poverty, 44 %
have at least one member who is unemployed, suggesting either long-term unemployment or chroni c
unemployment. Further, of those living in poverty, 49% of husbands work full time, about 12% ar e
unemployed, and 34% are retired . For wives, 33% worked full time, 43 .5% are retired, and 7% are
unemployed. The three factors contributing to poverty are not easily remedied because they require
significant changes in state social policy and/or significant infusions of monetary resources into the rural
economy, a trend which was not evident during the 1990s .
Moreover, our data suggest that there are fundamental differences in the stock of human an d
productive capital between poor and non-poor household. We do not agree, therefore, that households i n
poverty share essentially the same base of human and productive capital with households not in poverty . In
1 0
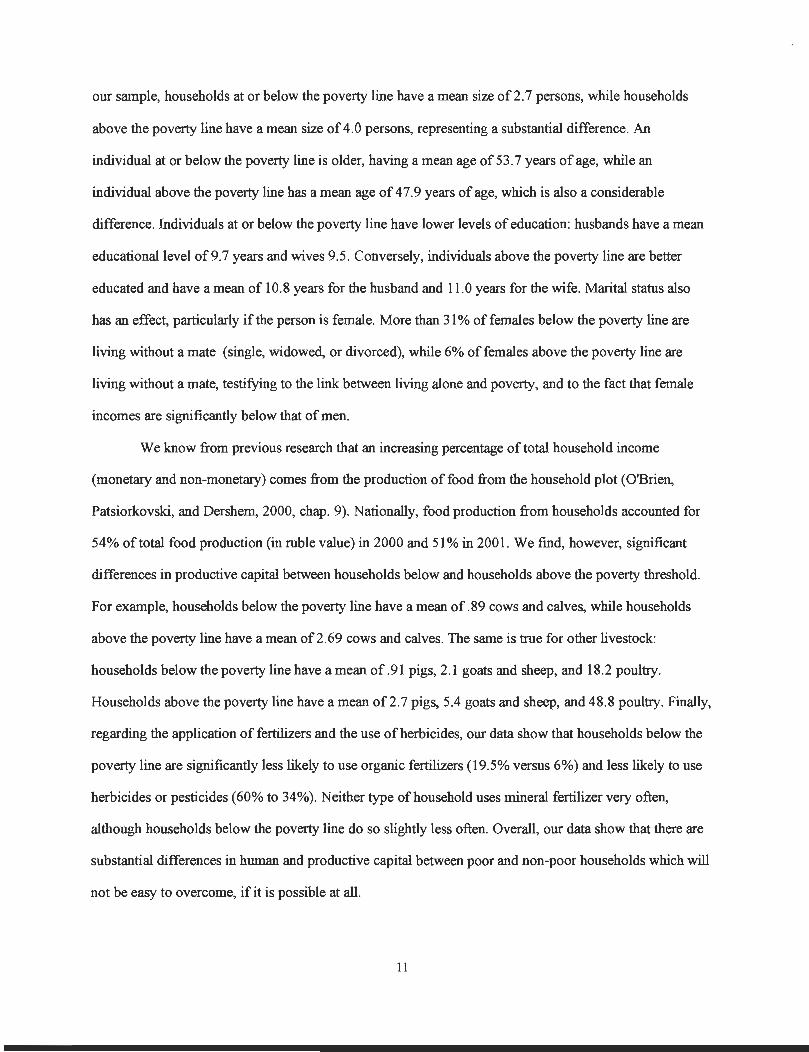
our sample, households at or below the poverty line have a mean size of 2 .7 persons, while households
above the poverty line have a mean size of 4 .0 persons, representing a substantial difference . An
individual at or below the poverty line is older, having a mean age of 53 .7 years of age, while an
individual above the poverty line has a mean age of 47 .9 years of age, which is also a considerabl e
difference. Individuals at or below the poverty line have lower levels of education : husbands have a mean
educational level of 9 .7 years and wives 9 .5 . Conversely, individuals above the poverty line are better
educated and have a mean of 10 .8 years for the husband and 11 .0 years for the wife . Marital status als o
has an effect, particularly if the person is female . More than 31% of females below the poverty line are
living without a mate (single, widowed, or divorced), while 6% of females above the poverty line ar e
living without a mate, testifying to the link between living alone and poverty, and to the fact that femal e
incomes are significantly below that of men .
We know from previous research that an increasing percentage of total household incom e
(monetary and non-monetary) comes from the production of food from the household plot (O'Brien ,
Patsiorkovski, and Dershem, 2000, chap . 9) . Nationally, food production from households accounted for
54% of total food production (in ruble value) in 2000 and 51% in 2001 . We find, however, significant
differences in productive capital between households below and households above the poverty threshold .
For example, households below the poverty line have a mean of .89 cows and calves, while households
above the poverty line have a mean of 2 .69 cows and calves . The same is true for other livestock :
households below the poverty line have a mean of .91 pigs, 2 .1 goats and sheep, and 18.2 poultry .
Households above the poverty line have a mean of 2 .7 pigs, 5 .4 goats and sheep, and 48.8 poultry . Finally ,
regarding the application of fertilizers and the use of herbicides, our data show that households below th e
poverty line are significantly less likely to use organic fertilizers (19 .5% versus 6%) and less likely to us e
herbicides or pesticides (60% to 34%). Neither type of household uses mineral fertilizer very often ,
although households below the poverty line do so slightly less often . Overall, our data show that there ar e
substantial differences in human and productive capital between poor and non-poor households which will
not be easy to overcome, if it is possible at all .
1 1
Behavioral Factors of Rural Households in Poverty
The section above demonstrated significant differences in human and productive capital betwee n
poor and non-poor households . This section shows that the differences between the two types o f
households extend to economic behaviors as well . Specifically, we examine the use of land reform
opportunities and household food production . This section shows that households in poverty have no t
utilized new opportunities with regard to the use of land; and underutilize existing opportunities inherite d
from the Soviet period with regard to the growing and marketing of household food production .
Land reform brought new legal rights to individuals, firms, and enterprises to buy, sell, trade, or
lease land . Land may be privately owned and passed on to heirs . Virtually all rural households have a
household plot, both nationwide and in our sample (about 98%) . Nationwide, household plots are
responsible for producing a significant amount of Russia's food--more than one-half of the nation's tota l
value since the mid-1990s (in ruble value) . Previous research has shown that the Russian land market
mostly consists of transactions of small plots of land (generally less than one hectare) which are used fo r
the growing of food (Wegren and Belen'kiy, 2002) . The interesting question is whether poor and non-poo r
households utilize the opportunities afforded by reform to the same extent .
We measure utilization of land reform opportunities by asking whether the household increased it s
household plot since 1991, and if so, by how much . It could be expected that households in poverty woul d
be motivated to maximize land usage in order to grow food, which in turn provides monetary and non -
monetary income to the household, provides a sense of economic security, and reduces monetar y
expenditures on food. We find, however, that households in poverty are somewhat less likely to hav e
increased their household plot since 1991 : 32% of households at or below the poverty threshold increased
their land plot, while 42% of households above the poverty line did. Moreover, there are significant
differences in the size of the increase . Less than 5% of households at or below the poverty line increase d
their household plot by at least 1 .0 hectares, while almost 19% of households above the poverty lin e
increased their land plots by a minimum of 1 .0 hectares, and 5% increased by 10 or more hectares .
Overall, households in poverty have a mean household plot size of .23 hectares, while households above
the poverty line have a mean plot size of .30 hectares, or 30% larger .
1 2
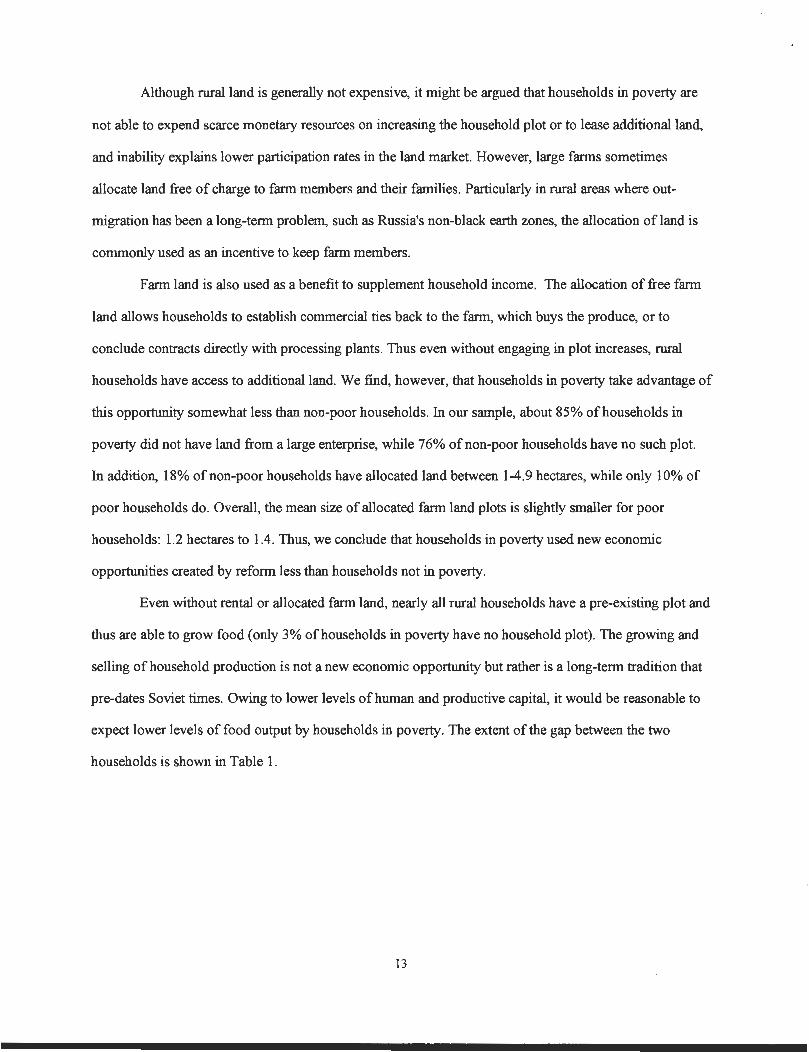
Although rural land is generally not expensive, it might be argued that households in poverty are
not able to expend scarce monetary resources on increasing the household plot or to lease additional land ,
and inability explains lower participation rates in the land market. However, large farms sometimes
allocate land free of charge to farm members and their families . Particularly in rural areas where out-
migration has been a long-term problem, such as Russia's non-black earth zones, the allocation of land i s
commonly used as an incentive to keep farm members .
Farm land is also used as a benefit to supplement household income . The allocation of free farm
land allows households to establish commercial ties back to the farm, which buys the produce, or t o
conclude contracts directly with processing plants . Thus even without engaging in plot increases, rura l
households have access to additional land . We find, however, that households in poverty take advantage of
this opportunity somewhat less than non-poor households . In our sample, about 85% of households in
poverty did not have land from a large enterprise, while 76% of non-poor households have no such plot .
In addition, 18% of non-poor households have allocated land between 1-4 .9 hectares, while only 10% o f
poor households do . Overall, the mean size of allocated farm land plots is slightly smaller for poo r
households : 1 .2 hectares to 1 .4 . Thus, we conclude that households in poverty used new economi c
opportunities created by reform less than households not in poverty .
Even without rental or allocated farm land, nearly all rural households have a pre-existing plot an d
thus are able to grow food (only 3% of households in poverty have no household plot) . The growing and
selling of household production is not a new economic opportunity but rather is a long-term tradition tha t
pre-dates Soviet times . Owing to lower levels of human and productive capital, it would be reasonable t o
expect lower levels of food output by households in poverty . The extent of the gap between the two
households is shown in Table 1 .
1 3

Table 1 : Mean Volume of Annual Household Food Productio n
Households in Poverty Households not inpoverty
Production ofhouseholds in poverty as
% of production inhouseholds not in
poverty
Potatoes produced (kg) 921 .31 1622 .90 57%
Vegetables produced (kg) 547.06 1046 .67 52%
Fruit produced (kg) 212.32 805 .18 26%
Meat produced (kg) 248 .61 788 .43 31 %
Milk produced (liters) 3841 .32 7021 .55 55%
Hay produced (kg) 3225 .47 7884.24 4J %
Eggs produced (number) 1488 .96 2272.53 65%
Percentages have been rounded .Source : Authors' calculations based on survey data, 2001 .
The table shows that households living at or below the poverty line produce significantly less foo d
from their plot than do households above the poverty line . The structural factors surveyed above surely
have an effect on the trends demonstrated in the table, but even so, the rural poor lag behind the non-poo r
by a surprising margin. The rural poor produce just over one-half the volume of staples of the Russian
diet, potatoes and vegetables, which for the population as a whole consumption increased, whil e
consumption of animal products decreased (Wegren, 2000b) . Of particular note is the fact that the rural
poor produce less than one-third the volume of meat as the non-poor, and meat is usually a primar y
product produced by households throughout Russia . Our data suggest that the rural poor shared in thi s
economic expansion to a lesser degree than the non-poor . The consequences of this fact have direc t
ramifications for household welfare, as illustrated in Table 2
1 4
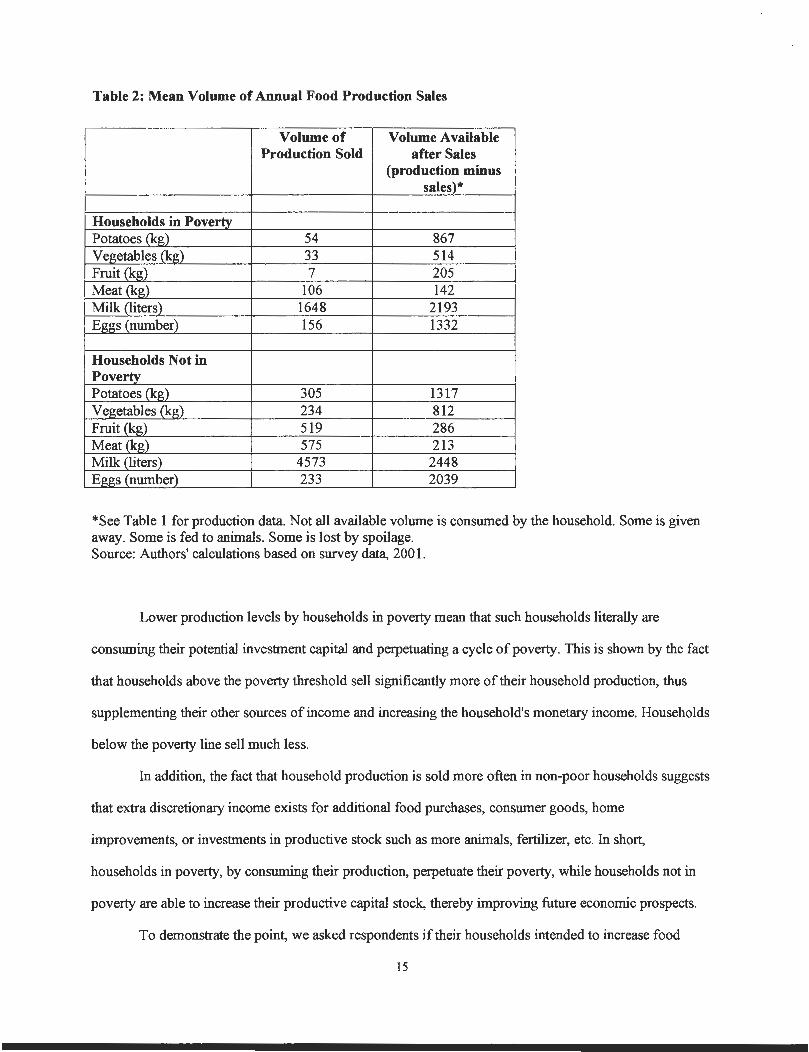
Table 2: Mean Volume of Annual Food Production Sales
Volume ofProduction Sold
Volume Availableafter Sales
(production minu ssales) *
Households in PovertyPotatoes (kg) 54 867Vegetables (kg) 33 51 4Fruit (kg) 7 205Meat (kg) 106 14 2Milk (liters) 1648 219 3Eggs (number) 156 133 2
Households Not inPovertyPotatoes (kg) 305 131 7Vegetables (kg) 234 812Fruit (kg) 519 286Meat (kg) 575 213Milk (liters) 4573 2448Eggs (number) 233 2039
*See Table 1 for production data . Not all available volume is consumed by the household . Some is givenaway. Some is fed to animals . Some is lost by spoilage .Source : Authors' calculations based on survey data, 2001 .
Lower production levels by households in poverty mean that such households literally ar e
consuming their potential investment capital and perpetuating a cycle of poverty . This is shown by the fact
that households above the poverty threshold sell significantly more of their household production, thu s
supplementing their other sources of income and increasing the household's monetary income . Household s
below the poverty line sell much less .
In addition, the fact that household production is sold more often in non-poor households suggest s
that extra discretionary income exists for additional food purchases, consumer goods, home
improvements, or investments in productive stock such as more animals, fertilizer, etc . In short,
households in poverty, by consuming their production, perpetuate their poverty, while households not i n
poverty are able to increase their productive capital stock, thereby improving future economic prospects .
To demonstrate the point, we asked respondents if their households intended to increase foo d
1 5
production in the future. Households not in poverty more frequently answer that they intend to increas e
production (37% to 23%) . We than asked how they plan to increase production . Households not in
poverty respond more that they intend to obtain additional land (35% to 25%) . Land adds to productive
capacity . Households in poverty respond that their households intend to add livestock--a consumable
commodity (72% to 64%). We have seen how the rural poor consume more and sell less of househol d
production, and thus this pattern would appear to continue into the future . Moreover, both cohorts
overwhelmingly intend to depend upon their own labor to increase production, with little if any assistance
from relatives, friends, or their farm . With more limited human capital, the prospects for households in
poverty to increase production significantly are worse .
Psychological Factors of Rural Individuals in Poverty
This section uses the individual as the unit of analysis to examine psychological factors of rural
poverty . Individuals in poverty have certain psychological characteristics . Specifically, individuals livin g
in poverty are more likely to feel lonely, unhappy, and depressed, On a scale of 1-4, with 1 being "never "
and 4 being "most of the time," persons in poverty have a mean score of 1 .85 for feeling lonely, 2 .06 for
feeling happy, and 1 .81 for feeling depressed . Persons above the poverty threshold have a mean score o f
1 .46 for feeling lonely, which means they are lonely less often; 2 .35 for feeling happy, which means they
are happy more often ; and 1 .50 for feeling depressed, which means they are depressed less often .
Different moods in turn are correlated to having a sense of control in one's life, as shown using Pearson
correlations with two-tailed significance tests in Table 3 .
1 6
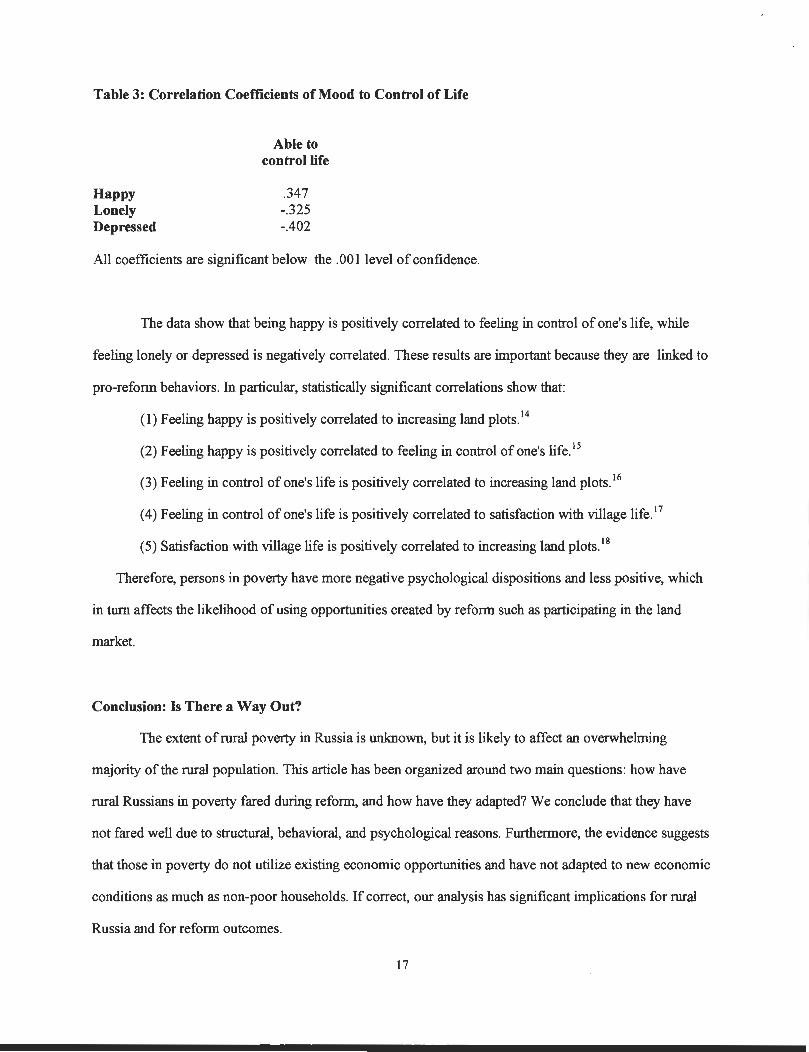
Table 3: Correlation Coefficients of Mood to Control of Life
Able tocontrol life
Happy .347Lonely - .325Depressed - .402
All coefficients are significant below the .001 level of confidence.
The data show that being happy is positively correlated to feeling in control of one's life, whil e
feeling lonely or depressed is negatively correlated. These results are important because they are linked t o
pro-reform behaviors . In particular, statistically significant correlations show that :
(1) Feeling happy is positively correlated to increasing land plots. 1 4
(2) Feeling happy is positively correlated to feeling in control of one's life . 1 5
(3) Feeling in control of one's life is positively correlated to increasing lan d plots.16
(4) Feeling in control of one's life is positively correlated to satisfaction with village life .17
(5) Satisfaction with village life is positively correlated to increasing land plots . 1 8
Therefore, persons in poverty have more negative psychological dispositions and less positive, whic h
in turn affects the likelihood of using opportunities created by reform such as participating in the lan d
market .
Conclusion: Is There a Way Out?
The extent of rural poverty in Russia is unknown, but it is likely to affect an overwhelmin g
majority of the rural population. This article has been organized around two main questions : how have
rural Russians in poverty fared during reform, and how have they adapted? We conclude that they hav e
not fared well due to structural, behavioral, and psychological reasons . Furthermore, the evidence suggest s
that those in poverty do not utilize existing economic opportunities and have not adapted to new economi c
conditions as much as non-poor households. If correct, our analysis has significant implications for rura l
Russia and for reform outcomes .
1 7

First, with regard to policy and politics, our data show that persons living below the poverty lin e
are somewhat more likely to support the Communist party in national elections, and are somewhat less
likely to support state policies toward land reform and the reform of state and collective farms .19 At
present, differences in political opinions and over policy are not extremely large--owing to the fact tha t
rural sector as a whole has suffered from urban bias, and in general has seen its standard of living decline .
We would expect political and policy differences to increase in the future as stratification deepens, which
brings us to our second point .
From the mid-1990s to mid-2000, rural stratification has been less significant than in urban Russia
and actually decreased (Rimashevskaya, 2001, p . 89) . However, we expect rural stratification to increase
in the future unless remedial policy steps are taken . Stratification will increase not only because of th e
factors analyzed above (structural, behavioral, and psychological), but also because of the survival
strategies used by households .
Our analysis suggests that we are witnessing the early stages of the creation of a permanen t
economic and psychological underclass in rural Russia. Perhaps it would not be an exaggeration to say
that those in poverty have maladapted, are trapped in poverty, and are unable to devise appropriat e
strategies to remove themselves from it . The question is : what to do about it? The problem is that our
evidence suggests that households in poverty do not respond to stimuli created by need (their poverty), to
opportunities created by reform (increase land plots), or to incentives for improvement (opportunities t o
grow and sell food to improve household income) .
What, then, can be done to alleviate rural poverty in Russia? Part of the poverty problem, thoug h
certainly not all, was caused by government policies. The government can address, indirectly, some of th e
structural production factors, although the overall effect may very well be limited . In May 2002, a
program entitled "Social Development of the Countryside to the Year 2010" was approved by the Russia n
government (see Ushachev, Toropov, & Bondarenko, 2002) . Although wide-ranging, the program ha s
several shortcomings.
(1) Similar social development programs have not been fully funded or fulfilled . Indeed, both
during the Soviet past and the post-Soviet 1990s, the political landscape is littered with rura l
1 8
social development programs that existed primarily on paper . It is not clear why this newest
program will be different, if the political will is greater now than in the past .
(2) The program only indirectly addresses rural poverty . Some of the main goals are to expand the
labor market, reduce rural unemployment, and improve productivity of existing productive an d
human capital . However, it does not address low rural wages.
(3) Although the program envisions an expenditure of more than 167 billion rubles during 2003 -
2010 to fulfill its goals (about 5 .5 billion dollars at 2002 exchange rates), only 11% is scheduled
to come from the federal government . Another 42% is supposed to be allocated by regiona l
governments . The remaining 47% is to come from unspecified off-budget sources .
(4) With a few exceptions, most regional governments do not have the budgetary resources t o
fund this program. At present, the program envisions the transfer of social services from large
farming enterprises to municipal governments. Moreover, new land laws envision that municipal
governments will become an intermediary in land transactions, exercising the right of first refusa l
for agricultural land, and then reselling or leasing it to other users . With these additional financia l
obligations, it is not clear where monies will come from in order to expand housing, improv e
cultural, health, and recreation facilities, increase the level of rural education, create rural jobs, an d
attract young specialists--all while the federal government has quietly begun to require highe r
percentages of local tax revenues be directed to the center . In short, funding for the program i s
suspect.
The other part of the problem is how to change behaviors and psychology . This problem i s
obviously more difficult, for it asks people in poverty to change the way they behave and the way the y
think. Our analysis suggests that those in poverty are either unable or unwilling to lift themselves out o f
poverty . Therefore, it would seem again the burden falls on government . We feel that the government has
to do more than the program on social development discussed above . Two programmatic ideas that are
possible and feasible may lead to short-term behavioral change and long-term psychological improvement .
The first proposal is to set up a special land fund for households in poverty to receive free lan d
allotments to use for the growing of food . Poor households increase their land plots less and are less likely
1 9
to have rental plots, thus affecting household food production volumes, consumption, and prospects fo r
additional monetary income . Land from large farms is not universally available and not practical in poo r
climate and soil regions. A similar land transfer program was adopted by the Russian government durin g
1992-1994 which created land funds for distribution to persons wishing to begin independent private
farms. The program was successful in jump starting the private farming movement in Russia .
A similar program could be implemented, with needs-based criteria developed, to allow th e
poorest families to obtain free land that is either presently unused or underused by large farms. Or, a
defined percentage of land obtained by municipal governments during land transactions could be set aside
for poor households . The transfer of land could be free except for a small transaction fee for document
preparation, and the recipient household could still be held accountable to existing laws on land us e
protection of its fertility .
The second proposal is that the local governments create a special program to buy food from poo r
households, which at present market small volumes of their production . Already, the Russian government
has introduced a policy of price supports, and during 2001 and 2002 harvest seasons intervened in th e
domestic grain market, spending 5-6 billion rubles . Thus, a precedent of government intervention in food
markets has been reestablished . Local governments could "recommend" that a defined percentage of foo d
purchased by state-licensed purchasing agents--which buy food for state use in hospitals, orphanages, and
for the military--come from poor households. This measure would provide poor households with a
guaranteed outlet for food production, and might entice them to produce more and sell more . With thes e
two proposals in place, which would provide tangible and hopefully effective economic assistance, th e
prospects for longer term improvement in psychological mood are improved among the poor .
REFERENCES
2 0
Aslund, A. (1997) . Social Problems and Policy in Postcommunist Russia . In E . B. Kapstein and M .
Mandelbaum, (Eds.), Sustaining the Transition: The Social Safety Net in Postcommunist Europe. New
York, Council on Foreign Relations .
Bates, R . H. (1981) . Markets and States in Tropical Africa: The Political Basis of Agricultural
Policies . Berkeley : University of California Press .
Bates, R . H. (1983) . Essays on the Political Economy of Rural Africa . Berkeley: University of
California Press .
Bondarenko, L. V. (2000) . Sostoyaniye sotsial'no-trudovoy sfery sela (The Status of the Social-Labor
Sphere of the Countryside) . Voprosy ekonomiki, 7, 67-75 .
Braithwaite, J . (1990) . Income Distribution and Poverty in the Soviet Republics . Journal of Sovie t
Nationalities, 1 (3), 158-73 .
Braithwaite, J ., Grootaert, C ., & Milanovic, B . (1999) . Poverty and Social Assistance in Transitio n
Countries . New York: St . Martin's Press .
Demograficheskiy ezhegodnik Rossii (2001) . Moscow : Goskolemstat.
Freeland, C . (2000) . Sale of the Century: Russia's Wild Ride from Communism to Capitalism . New
York: Crown Business .
Grootaert, C . & Braithwaite, J . (1999) . The Determinants of Poverty in Eastern Europe and th e
Former Soviet Union . In Braithwaite, J ., Grootaert, C ., & Milanovic, B . (Eds) . Poverty and Social
Assistance in Transition Countries . New York: St . Martin's Press.
Gustafson, T . (1999) . Capitalism Russian-Style . Cambridge : Cambridge University Press .
Hough, J . F . (2000) . The Logic of Economic Reform in Russia. Washington, DC: The Brooking s
Institution .
Humphrey, C . (2002) . The Unmaking of Soviet Life : Everyday Economies after Socialism . Ithaca,
NY: Cornell University Press.
Kitching, G. (1998). The Development of Agrarian Capitalism in Russia 1991-97 : Some Observations
from Fieldwork . The Journal of Peasant Studies, 25 (3),1-30 .
2 1
Klugman, J ., & Marnie, S . (2001) . Poverty . In B . Granville & P . Oppenheimer, (Eds .), Russia's Post-
Communist Economy . Oxford: Oxford University Press .
Krasil'nikova, M. (2000) . Sub"ektivnye otsenki urovnya bednosti v Rossii (Subjective Estimates of th e
Level of Poverty in Russia) . Monitoring obshcestvennogo meneniya: ekonomicheskie i sotsial'nye
peremeny, 6, 40-45 .
Lipton, M. (1976) . Why Poor People Stay Poor : Urban Bias in World Development . Cambridge :
MA: Harvard University Press .
Matthews, M . (1986) . Poverty in the Soviet Union . Cambridge : Cambridge University Press .
McAuley, A. (1979) . Economic Welfare in the Soviet Union : Poverty, Living Standards, and
Inequality . Madison : University of Wisconsin Press .
McAuley, A. (1995) . Inequality and Poverty . In D. Lane, ed ., Russia in Transition : Politics ,
Privatisation and Inequality . London and New York: Longman .
O'Brien, D . J ., Patsiorkovski, V ., & Dershem, L . D. (2000) . Household Capital and the Agraria n
Problem in Russia . Aldershot : Ashgate.
Rossiya v tsifrakh . (2001) . Moscow : Goskomstat .
Rimashevakaya, N. M. (Ed.) (2001) . Rossiya 2000: sotsial'no-demograficheskaya situatsiya .
Moscow: Institute of Social-Economic Problems of the Population .
Sagaidak, E . & Borkhunov, N . (2001) . Agroprodovol'stvennaya politika i tseny (Agrofood Policy and
Prices) . APK: ekonomika, upravlenie, 4, 42-50 .
Sadowski, Y . M. (1991) . Political Vegetables? Washington, DC: The Brookings Institution .
Silverman B. & Yanowitch, M. (2000) . New Rich, New Poor, New Russia : Winners and Losers on th e
Russian Road to Capitalism . Armonk, NY: M. E. Sharpe .
Spoor, M. & Visser, O . (2001). The State of Agrarian Reform in the Former Soviet Union . Europe-
Asia Studies, 53 (6), 885-901 .
Thiesenhusen, W. C . (1995) . Broken Promises : Agrarian Reform and the Latin American Campesino .
Boulder . CO: Westview Press .
2 2
Ushachev, I ., Toropov, D. & Bondarenko, L . (2002) . 0 Federal'noy tselevoy programme 'Sotsial'no e
razvitie sela na period do 2010 goda' (On the Federal Special Purpose Program 'The Social Developmen t
of the Countryside to the Year 2010) . APK: ekonomika, upravlenie, 7, 3-8 .
Wegren, S . K. (2000a). State Withdrawal and the Impact of Marketization on Rural Russia . Policy
Studies Journal, 28 (1), 46-67 .
Wegren, S . K. (2000b) . The Russian Food Problem: Domestic and Foreign Consequences . Problems
of Post-Communism, 47 (1), 38-48 .
Wegren, S . K. (2002) . Democratization and Urban Bias in Postcommunist Russia . Comparative
Politics, 34 (4), 457-76 .
Wegren, S . K. & Belen'kiy, V. R. (2002) . Change in Land Relations : The Russian Land Market . In D .
J . O'Brien and S . K. Wegren, (Eds .), Rural Reform in Post-Soviet Russia. Washington, DC, an d
Baltimore : Woodrow Wilson Center Press/Johns Hopkins University Press .
Wegren, S . K., O'Brien, D . J . & Patsiorkovski, V. (2003) . Winners and Losers in Russian Agrarian
Reform . The Journal of Peasant Studies, 30 (1) .
ENDNOTES
1 Below the .001 level of confidence .
2 Below the .001 level of confidence .
Below the .05 level of confidence.
4 Below the .001 level of confidence .
5 Below the .05 level of confidence.
6 Contributing to economic differentiation by oligarchs was of the 'grabification' of the country ' s key economic assets : naturalresources, oil, gas, minerals, and precious stones in particular, which occurred during non-agricultural privatization in the earl y1990s (Hough, 2000, chap . 2 ; Freeland, 2000, chap . 1) .
This term refers to entrepreneurs and businessmen who took advantage of market reforms to start new businesses or engage i nprivate trade (see Gustafson, 1999, chap . 5 ; Silverman and Yanowitch, 2000, chap . 6 ; Humphrey, 2002, pp . 58-62) .
2 3
8 For example, the latter was seen in Saratov oblast as early as 1997 . Saratov was the first of Russia's regions to adopt a land la wthat permitted the sale of agricultural land, and land sales were by auction. Despite heavy advertisement of the auction, only aboutone-half of available rural land plots were purchased, and many of the buyers were from Moscow, not Saratov .
9 If we assume that about 75% of rural households live at or below the poverty line, as in our sample, it would mean that povertyaffects approximately 29 million rural Russians .
10 This list is comprised from : McAuley, 1995, pp . 178-82 ; Grootaert and Braithwaite, 1999, pp . 47-56 ; Klugman and Marnie,2001, pp. 459-65 ; and Krasil'nikova, 2002 .
11 Households in poverty have a mean monthly income of 2,491 rubles from all sources, while households not in poverty have amean monthly income of 8,542 rubles .
12 In mid-1997, for example, a Goskomstat survey data of Russian households showed that rural households received only 70% o ftheir total income in monetary form, compared with 88% for urban households . Just prior to the financial crisis of August 1998, thesituation was much the same: rural households received 69% of their income in monetary form, while urban households receive d95% . Calculated from Statisticheskiy biulleten', 1 (March 1999), p . 35 ; and ibid ., 1 (January 2000), p . 19 .
13 Of persons living below the poverty threshold, 37% are ordinary farm workers, while only 2% are farm managers and 8% arefarm specialists .
14 Below the .001 level of confidence .
15 Below the .001 level of confidence .
16 Below the .05 level of confidence .
17 Below the .001 level of confidence .
18 Below the .05 level of confidence .
19 Attitudes toward reform are important because we maintain that opinions about reform influence behaviors : those with negativ eperceptions are less likely to feel happy and more likely to not engage in economic behaviors that support reform or that improv ehousehold welfare .
24


![Pro-Poor Public-Private Partnerships for Rural Energy ... · Pro-Poor Public-Private Partnerships for Rural Energy Services National Feasibility ParakramPyakurel[AEPC] and SaritaGurung[Rural](https://img.pdfslide.us/doc/110x75/5d1da63288c993a34b8ca6a6/pro-poor-public-private-partnerships-for-rural-energy-pro-poor-public-private.jpg)