Embed Size (px)
Citation preview
LAWRENCE H. SUMMERS Harvard University
Why Is the Unemployment
Rate So Very High near Full
Employment?
IN A WELL-KNOWN PAPER in one of the inaugural issues of the Brookings Papers, Robert Hall posed the question "Why Is the Unemployment Rate So High at Full Employment?" 1 Hall, writing in the context of the 3.5 percent unemployment rate that prevailed in 1969, answered his question by explaining that the full-employment rate was so high because of the normal turnover that is inevitable in a dynamic economy where some sectors are expanding and others are contracting and because of the special problems of certain disadvantaged groups. Hall himself was pessimistic about the prospects for maintaining unemployment consis- tently below 4 percent through expansionary policies. But he raised the prospect that successful structural policies could do so. While aspirations became attuned to expectations as unemployment rose during the 1970s, the Humphrey-Hawkins Full Employment and Balanced Growth Act of 1978 nonetheless set an unemployment target of 4 percent for 1983.
Today, four yeSws into an economic recovery, the unemployment rate hovers around 7 percent. Over the past decade, it has averaged 7.6
I am grateful to David Cutler and Louise Sheiner for extremely capable research assistance and useful discussions. Larry Katz and Jim Poterba provided helpful comments on an earlier draft of this paper. I have benefited even more than usual from the comments of members of the Brookings Panel. The National Science Foundation provided financial support. A data appendix is available from the author on request.
1. Robert E. Hall, "Why Is the Unemployment Rate So High at Full Employment?," BPEA, 3:1970, pp. 369-402. The title of this paper is patterned after Hall's title. The differences reflect increases in unemployment over the past fifteen years and some doubts about just how close the American economy currently is to full employment.
339
340 Brookings Papers on Economic Activity, 2:1986
percent and has never fallen below 5.8 percent. Even most forecasts that call for steady growth over the next five years do not foresee unemploy- ment rates dipping back below 6 percent. It is helpful to recall that unemployment peaked at 7.2 percent during the relatively severe reces- sion of 1958. While some of the difference between recent and past levels of unemployment has resulted from cyclical developments, it is clear that a substantial increase in the normal or natural rate of unemployment has taken place. Where Kennedy-Johnson economists set 4 percent as an interim full-employment target, contemporary policymakers would regard even the temporary achievement of 6 percent unemployment as a great success.
This paper describes and explains the substantial recent increase in normal unemployment. The first part of the paper assesses the relation- ship between unemployment and other indicators of labor market tightness and describes changes in the composition of the unemployed population. The data reveal that the level of unemployment consistent with any given level of vacancies, capacity utilization, or change in inflation has increased significantly over time. It appears that little of this movement can be traced to measurement difficulties in the Bureau of Labor Statistics' Current Population Survey. Rather, increases in unemployment are a serious problem because they are concentrated among mature men, job losers, and the long-term unemployed. The portrayal of rising unemployment as the consequence of an increase in the share of secondary workers in the labor force that was popular during the 1970s is no longer accurate.
The second and more speculative part of the paper draws on the dramatic variations in state and regional economic performance that have taken place over the past fifteen years in an effort to get at the causes of rising unemployment. It links observed increases in unem- ployment with structural changes in the economy that have lowered employment in high-wage sectors and increased it in low-wage sectors. The structural changes include both macroeconomic developments that have reduced the demand for the output of high-wage industries and labor market pressures, particularly in unionized sectors, that have pushed up wages in sectors where they were already high. I conclude that reversing the dramatic sectoral shocks of the last few years can make an important contribution to reducing unemployment.

Lawrence H. Summers 341
Increasing Unemployment in the United States
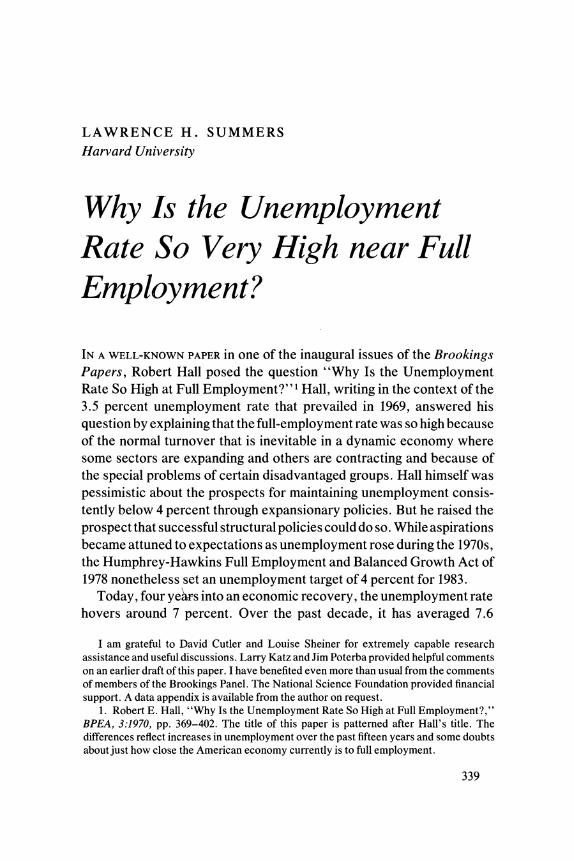
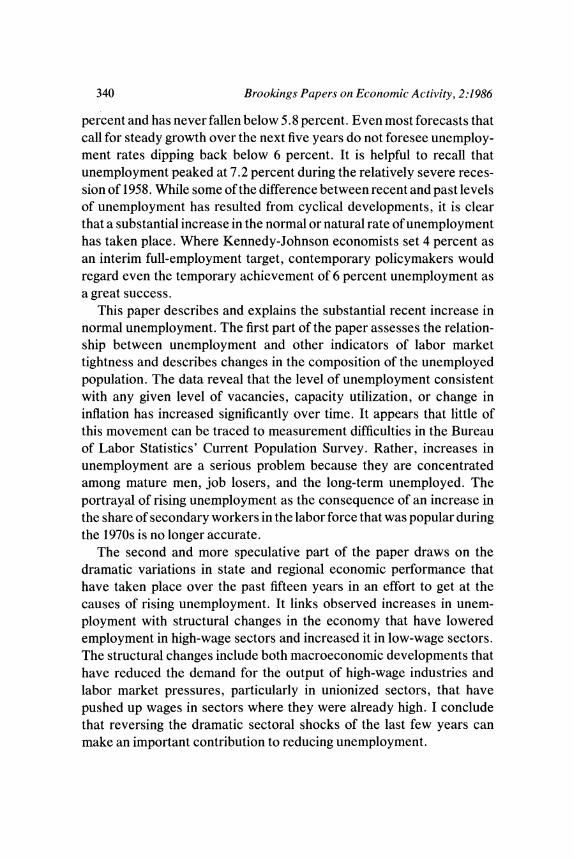
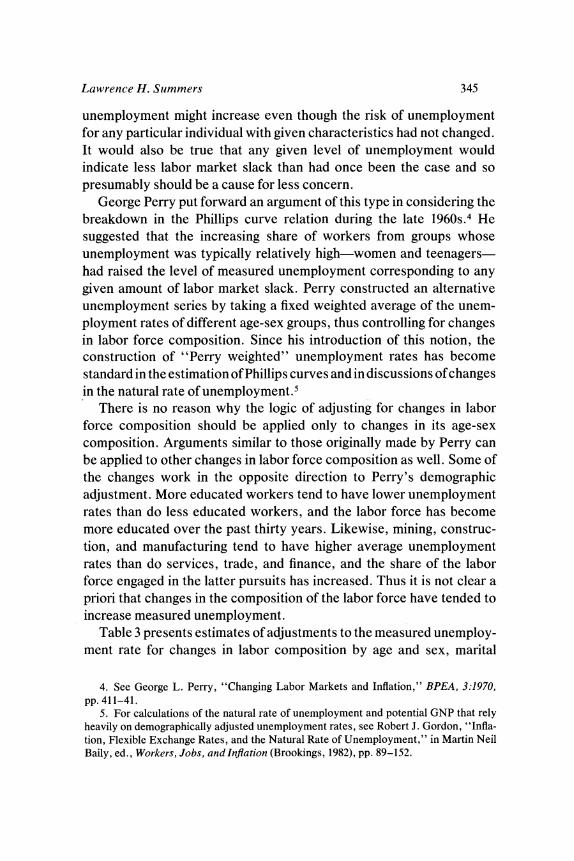
Figure 1 depicts the evolution of the total U.S. unemployment rate and the unemployment rate for married men since the Korean War. The fairly steady increase in both rates is interrupted only during the 1960s. While the amplitude of fluctuations in the unemployment rate has increased, it is also clear that the normal level of unemployment has risen. A conspicuous feature of the data is that the rate for married men has increased in tandem with the overall rate.
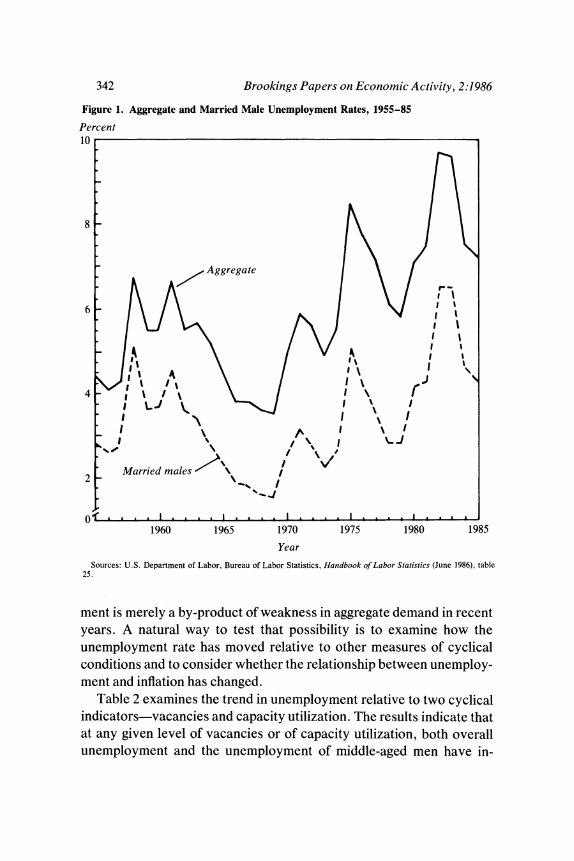
Table 1 presents information on the unemployment rate and the employment ratio (the ratio of employed adults to the total adult population) over the seven business cycles since 1953. Again, a secular increase in unemployment is evident. With the exception of the boom of the 1960s and the early 1970s, each cycle has higher peak, trough, and average unemployment rates than the one that preceded it. Indeed, the unemployment rate at the last peak, in July of 1981, was comparable with the rates reached at most previous cyclical troughs. Unemployment at the next peak is not knowable. But most forecasts do not call for substantial declines. The most recent Congressional Budget Office forecast, which assumes fairly steady growth uninterrupted by recession for the next five years, calls for unemployment to decline only to 6.0 percent by 1991.2
The secular increase in unemployment contrasts sharply with the behavior of the employment ratio, which has trended upwards and is today close to its historical peak. The rise reflects the rapid increase in the labor force participation of adult women, from 37.6 percent in 1960 to 43.3 percent in 1970, 51.3 percent in 1980, and 54.7 percent in 1985. Since 1973, both unemployment and employment have grown quite rapidly. Total employment increased by 25 percent between 1973 and 1985.
Unemployment can increase for either cyclical or structural reasons. Before I turn to an analysis of changes in the structure of the labor market, it is necessary to address the possibility that rising unemploy-
2. Congressional Budget Office, The Economic and Budget Outlook: An Update (Government Printing Office, August 1986).
342 Brookings Papers on Economic Activity, 2:1986
ment is merely a by-product of weakness in aggregate demand in recent years. A natural way to test that possibility is to examine how the unemployment rate has moved relative to other measures of cyclical conditions and to consider whether the relationship between unemploy- ment and inflation has changed.
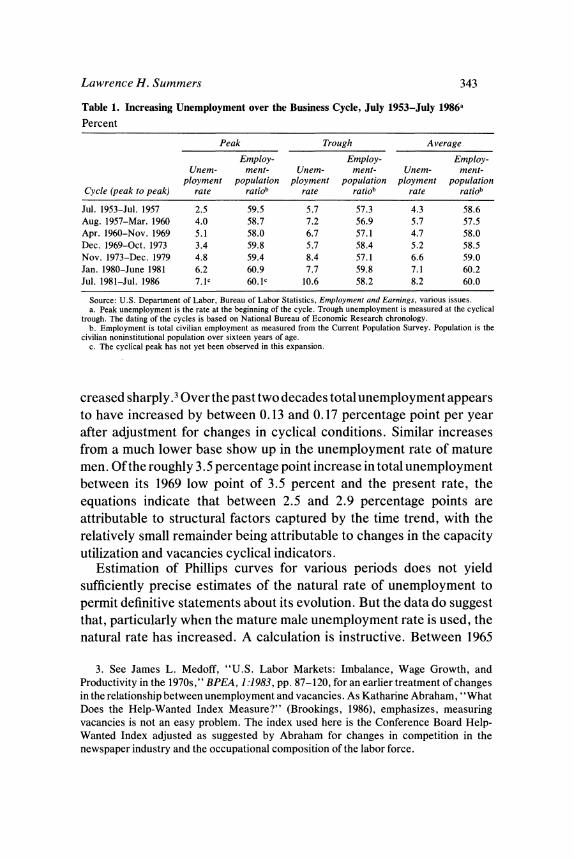
Table 2 examines the trend in unemployment relative to two cyclical indicators-vacancies and capacity utilization. The results indicate that at any given level of vacancies or of capacity utilization, both overall unemployment and the unemployment of middle-aged men have in-
Figure 1. Aggregate and Married Male Unemployment Rates, 1955-85
Percent 10
8
6
/ \
Married males~~
'I
1960 1965 1970 1975 1980 1985
Year
Sources: U.S. Department of Labor, Bureau of Labor Statistics, Handbook of Labor Statistics (June 1986), table 25.
Lawrence H. Summers 343
creased sharply.3 Over the past two decades total unemployment appears to have increased by between 0.13 and 0.17 percentage point per year after adjustment for changes in cyclical conditions. Similar increases from a much lower base show up in the unemployment rate of mature men. Of the roughly 3.5 percentage point increase in total unemployment between its 1969 low point of 3.5 percent and the present rate, the equations indicate that between 2.5 and 2.9 percentage points are attributable to structural factors captured by the time trend, with the relatively small remainder being attributable to changes in the capacity utilization and vacancies cyclical indicators.
Estimation of Phillips curves for various periods does not yield sufficiently precise estimates of the natural rate of unemployment to permit definitive statements about its evolution. But the data do suggest that, particularly when the mature male unemployment rate is used, the natural rate has increased. A calculation is instructive. Between 1965
Table 1. Increasing Unemployment over the Business Cycle, July 1953-July 1986a
Percent
Peak Trough Average
Employ- Employ- Employ- Unem- ment- Unem- ment- Unem- ment-
ployment population ployment population ployment population Cycle (peak to peak) rate ratiob rate ratiob rate ratiob
Jul. 1953-Jul. 1957 2.5 59.5 5.7 57.3 4.3 58.6 Aug. 1957-Mar. 1960 4.0 58.7 7.2 56.9 5.7 57.5 Apr. 1960-Nov. 1969 5.1 58.0 6.7 57.1 4.7 58.0 Dec. 1969-Oct. 1973 3.4 59.8 5.7 58.4 5.2 58.5 Nov. 1973-Dec. 1979 4.8 59.4 8.4 57.1 6.6 59.0 Jan. 1980-June 1981 6.2 60.9 7.7 59.8 7.1 60.2 Jul. 1981-Jul. 1986 7.1c 60.1c 10.6 58.2 8.2 60.0
Source: U.S. Department of Labor, Bureau of Labor Statistics, Employment and Earnings, various issues. a. Peak unemployment is the rate at the beginning of the cycle. Trough unemployment is measured at the cyclical
trough. The dating of the cycles is based on National Bureau of Economic Research chronology. b. Employment is total civilian employment as measured from the Current Population Survey. Population is the
civilian noninstitutional population over sixteen years of age. c. The cyclical peak has not yet been observed in this expansion.
3. See James L. Medoff, "U.S. Labor Markets: Imbalance, Wage Growth, and Productivity in the 1970s," BPEA, 1:1983, pp. 87-120, for an earlier treatment of changes in the relationship between unemployment and vacancies. As Katharine Abraham, "What Does the Help-Wanted Index Measure?" (Brookings, 1986), emphasizes, measuring vacancies is not an easy problem. The index used here is the Conference Board Help- Wanted Index adjusted as suggested by Abraham for changes in competition in the newspaper industry and the occupational composition of the labor force.
344 Brookings Papers on Economic Activity, 2:1986
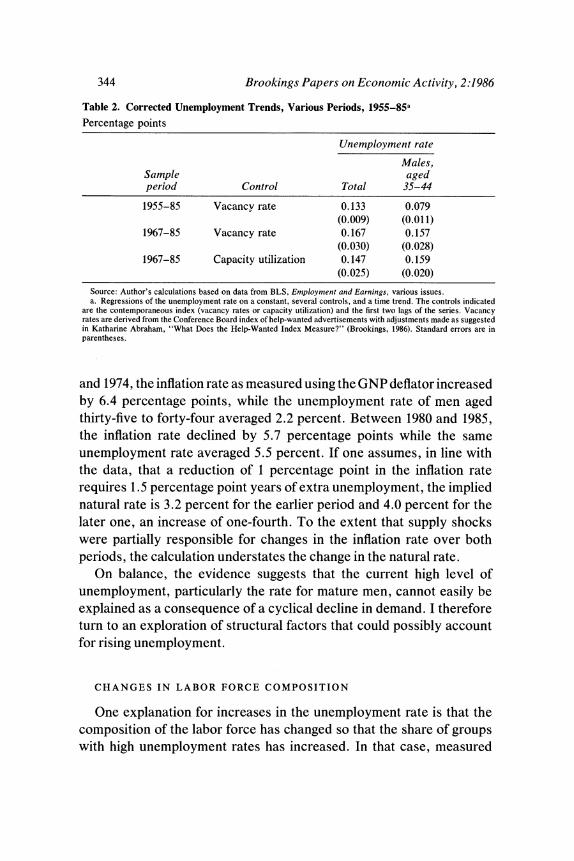
and 1974, the inflation rate as measured using the GNP deflator increased by 6.4 percentage points, while the unemployment rate of men aged thirty-five to forty-four averaged 2.2 percent. Between 1980 and 1985, the inflation rate declined by 5.7 percentage points while the same unemployment rate averaged 5.5 percent. If one assumes, in line with the data, that a reduction of 1 percentage point in the inflation rate requires 1.5 percentage point years of extra unemployment, the implied natural rate is 3.2 percent for the earlier period and 4.0 percent for the later one, an increase of one-fourth. To the extent that supply shocks were partially responsible for changes in the inflation rate over both periods, the calculation understates the change in the natural rate.
On balance, the evidence suggests that the current high level of unemployment, particularly the rate for mature men, cannot easily be explained as a consequence of a cyclical decline in demand. I therefore turn to an exploration of structural factors that could possibly account for rising unemployment.
CHANGES IN LABOR FORCE COMPOSITION
One explanation for increases in the unemployment rate is that the composition of the labor force has changed so that the share of groups with high unemployment rates has increased. In that case, measured
Table 2. Corrected Unemployment Trends, Various Periods, 1955-85a
Percentage points
Unemployment rate
Males, Sample aged period Control Total 35-44
1955-85 Vacancy rate 0.133 0.079 (0.009) (0.011)
1967-85 Vacancy rate 0.167 0.157 (0.030) (0.028)
1967-85 Capacity utilization 0.147 0.159 (0.025) (0.020)
Source: Author's calculations based on data from BLS, Employment and Earnings, various issues. a. Regressions of the unemployment rate on a constant, several controls, and a time trend. The controls indicated
are the contemporaneous index (vacancy rates or capacity utilization) and the first two lags of the series. Vacancy rates are derived from the Conference Board index of help-wanted advertisements with adjustments made as suggested in Katharine Abraham, "What Does the Help-Wanted Index Measure?" (Brookings, 1986). Standard errors are in parentheses.
Lawrence H. Summers 345
unemployment might increase even though the risk of unemployment for any particular individual with given characteristics had not changed. It would also be true that any given level of unemployment would indicate less labor market slack than had once been the case and so presumably should be a cause for less concern.
George Perry put forward an argument of this type in considering the breakdown in the Phillips curve relation during the late 1960s.4 He suggested that the increasing share of workers from groups whose unemployment was typically relatively high-women and teenagers- had raised the level of measured unemployment corresponding to any given amount of labor market slack. Perry constructed an alternative unemployment series by taking a fixed weighted average of the unem- ployment rates of different age-sex groups, thus controlling for changes in labor force composition. Since his introduction of this notion, the construction of "Perry weighted" unemployment rates has become standard in the estimation of Phillips curves and in discussions of changes in the natural rate of unemployment.5
There is no reason why the logic of adjusting for changes in labor force composition should be applied only to changes in its age-sex composition. Arguments similar to those originally made by Perry can be applied to other changes in labor force composition as well. Some of the changes work in the opposite direction to Perry's demographic adjustment. More educated workers tend to have lower unemployment rates than do less educated workers, and the labor force has become more educated over the past thirty years. Likewise, mining, construc- tion, and manufacturing tend to have higher average unemployment rates than do services, trade, and finance, and the share of the labor force engaged in the latter pursuits has increased. Thus it is not clear a priori that changes in the composition of the labor force have tended to increase measured unemployment.
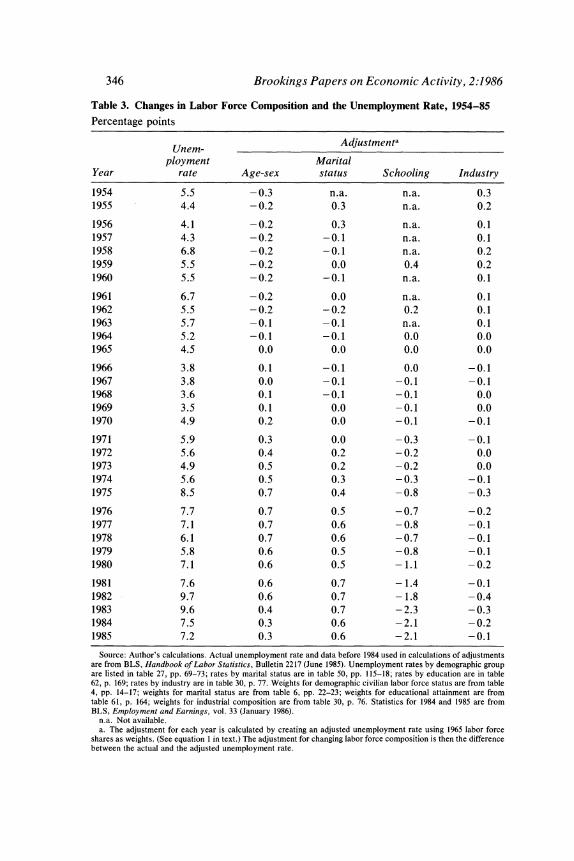
Table 3 presents estimates of adjustments to the measured unemploy- ment rate for changes in labor composition by age and sex, marital
4. See George L. Perry, "Changing Labor Markets and Inflation," BPEA, 3:1970, pp. 411-41.
5. For calculations of the natural rate of unemployment and potential GNP that rely heavily on demographically adjusted unemployment rates, see Robert J. Gordon, "Infla- tion, Flexible Exchange Rates, and the Natural Rate of Unemployment," in Martin Neil Baily, ed., Workers, Jobs, and Inflation (Brookings, 1982), pp. 89-152.
346 Brookings Papers on Economic Activity, 2:1986
Table 3. Changes in Labor Force Composition and the Unemployment Rate, 1954-85
Percentage points
Unem- Adjustmenta
ployment Marital Year rate Age-sex status Schooling Industry
1954 5.5 -0.3 n.a. n.a. 0.3 1955 4.4 -0.2 0.3 n.a. 0.2
1956 4.1 -0.2 0.3 n.a. 0.1 1957 4.3 -0.2 -0.1 n.a. 0.1 1958 6.8 -0.2 -0.1 n.a. 0.2 1959 5.5 -0.2 0.0 0.4 0.2 1960 5.5 -0.2 -0.1 n.a. 0.1
1961 6.7 -0.2 0.0 n.a. 0.1 1962 5.5 -0.2 -0.2 0.2 0.1 1963 5.7 -0.1 -0.1 n.a. 0.1 1964 5.2 -0.1 -0.1 0.0 0.0 1965 4.5 0.0 0.0 0.0 0.0
1966 3.8 0.1 -0.1 0.0 -0.1 1967 3.8 0.0 -0.1 -0.1 -0.1 1968 3.6 0.1 -0.1 -0.1 0.0 1969 3.5 0.1 0.0 -0.1 0.0 1970 4.9 0.2 0.0 -0.1 -0.1
1971 5.9 0.3 0.0 - 0.3 -0.1 1972 5.6 0.4 0.2 - 0.2 0.0 1973 4.9 0.5 0.2 -0.2 0.0 1974 5.6 0.5 0.3 -0.3 -0.1 1975 8.5 0.7 0.4 -0.8 -0.3
1976 7.7 0.7 0.5 -0.7 -0.2 1977 7.1 0.7 0.6 -0.8 -0.1 1978 6.1 0.7 0.6 -0.7 -0.1 1979 5.8 0.6 0.5 -0.8 -0.1 1980 7.1 0.6 0.5 - 1.1 -0.2
1981 7.6 0.6 0.7 - 1.4 -0.1 1982 9.7 0.6 0.7 - 1.8 -0.4 1983 9.6 0.4 0.7 - 2.3 -0.3 1984 7.5 0.3 0.6 - 2.1 -0.2 1985 7.2 0.3 0.6 -2.1 -0.1
Source: Author's calculations. Actual unemployment rate and data before 1984 used in calculations of adjustments are from BLS, Handbook of Labor Statistics, Bulletin 2217 (June 1985). Unemployment rates by demographic group are listed in table 27, pp. 69-73; rates by marital status are in table 50, pp. 115-18; rates by education are in table 62, p. 169; rates by industry are in table 30, p. 77. Weights for demographic civilian labor force status are from table 4, pp. 14-17; weights for marital status are from table 6, pp. 22-23; weights for educational attainment are from table 61, p. 164; weights for industrial composition are from table 30, p. 76. Statistics for 1984 and 1985 are from BLS, Employment and Earnings, vol. 33 (January 1986).
n.a. Not available. a. The adjustment for each year is calculated by creating an adjusted unemployment rate using 1965 labor force
shares as weights. (See equation 1 in text.) The adjustment for changing labor force composition is then the difference between the actual and the adjusted unemployment rate.
Lawrence H. Summers 347
status, schooling, and primary industry. The adjustment for each year is calculated by first creating an adjusted unemployment rate as a fixed weighted average of group-specific unemployment rates using 1965 labor force shares as weights. That is,
(1) A URt = E si65 URit.
The adjusted unemployment rate, A UR, is the unemployment rate that would prevail in a given year if each labor force group had its 1965 share, Si65, of the labor force. The adjustment for changing labor force compo- sition is then the difference between the actual and the adjusted unem- ployment rate.
While it would be ideal to estimate the adjustment using a single decomposition of the labor force into subgroups, it is not possible to do so with the available data. The table therefore presents four separate adjustments. The age-sex adjustment is based on a decomposition of the labor force into the fourteen categories used by Perry.6 The marital status adjustment divides the labor force into six categories-men and women who are single, married with spouse present, and widowed, separated, or divorced. The schooling adjustment is based on a division of the labor force into six categories ranging from workers with less than five years of schooling to those completing four or more years of college.7 Finally, the industry adjustment is based on a decomposition of the experienced labor force into categories corresponding to the one-digit standard industrial classification (SIC) code.8
The changing age-sex composition of the labor force can account for relatively little of the increase in unemployment in recent years. The adjustment (relative to 1965) peaked at 0.7 percentage point in the mid- 1970s and has declined since then to only 0.3 point in 1985. The decline in the adjustment reflects two developments: the decline in the labor force share of teenagers and the declining relative unemployment rate of women. The labor force share of teenagers has fallen from 7.9 percent
6. The categories are men and women aged sixteen to nineteen, twenty to twenty-four, twenty-five to thirty-four, thirty-five to forty-four, forty-five to fifty-four, fifty-five to sixty- four, and sixty-five and over.
7. The schooling adjustment is calculated using data for March of each year because questions on educational attainment are asked only in the March CPS.
8. The industry adjustment is not strictly parallel to the others since it is an adjustment to the unemployment rate of experienced workers. This noncomparability is inevitable given that new entrants to the labor force cannot meaningfully be assigned an industry.

348 Brookings Papers on Economic Activity, 2:1986
in 1965 to 6.8 percent in 1985, a decline that is assumed here to have no effect on the youth unemployment rate. If, as Michael Wachter has argued, crowding effects cause increases in the youth unemployment rate, the decline in the adjustment in recent years would be significantly greater.9
The dramatic change in the composition of the labor force in recent years has been the increase in female labor force participation. If unemployment rates for men and women had maintained the pattern they exhibited in the 1960s, the measured unemployment rate would have increased substantially. But, as I discuss later, the gap between the unemployment rates of men and women has narrowed in recent years, so the effect is not very large.
More important than the age-sex adjustment is the adjustment for the changing marital status of the labor force. It rose to 0.6 percentage point in the mid-1970s but, unlike the age-sex adjustment, has not turned down since. The major marital status change is the drop in the fraction of men in the labor force who are married. In 1965, 18 percent of the male labor force had never been married, compared with 27 percent in 1985. Given that unemployment rates were three times as high for single as for married men in 1985, the effect of reductions in the share of the labor force that is married is quite substantial. 10
Quantitatively, the most important adjustment for changes in the composition of the labor force involves education. Assuming no changes in group-specific unemployment rates, recent increases in education should have reduced the unemployment rate by 2.1 percentage points between 1965 and 1985. That adjustment dwarfs the demographic and marital status corrections. 11 Over the past twenty years the share of the labor force that received some college education nearly doubled, from 22 to 40 percent, while the share with less than an eighth-grade education fell from 23 percent to only 7 percent.
9. See Michael L. Wachter, "Intermediate Swings in Labor-Force Participation," BPEA, 2:1977, pp. 545-74. Wachter forecast, on the basis of demographic considerations, a significant decline in the natural rate of unemployment in the early 1980s.
10. The adjustment is not independent of the previous adjustment for changes in the age-sex composition of the labor force. It also reflects increases in the share of women in the labor force and to some extent reflects changes in the age structure of the labor force. The rise in the proportion of single men noted in the text is particularly striking in light of the decline in the share of teenagers and young men in the labor force.
11. Robert M. Solow made this point in "Macro-policy and Full Employment," in Eli Ginzberg, ed., Jobs for Americans (Prentice Hall, 1976), pp. 46-48.
Lawrence H. Summers 349
It is arguable that the educational adjustment made here is inappro- priate because the differentials in unemployment between different educational groups reflect not the effects of education but rather differ- ences in the innate skills of more and less educated workers. Undoubt- edly, the adjustment calculated here is an overestimate of the true effect of increased educational attainment on unemployment for this reason, but the overestimate may not be large. The premise of policies directed at discouraging teenagers from dropping out of high school is that more schooling means less unemployment. And the fact that the relative unemployment rate of college graduates has dropped as their number has swelled casts doubt on the importance of sorting effects of the type noted above.
Finally, the industry adjustment shown in the final column of the table indicates that changes in the industrial mix, particularly the decline in the share of employment in the volatile manufacturing sector, has also worked to reduce unemployment. In some recent years, when manufac- turing has been weak because of adverse cyclical conditions, the adjust- ment has been quantitatively significant, reaching 0.4 percentage point in 1982.
While it is inappropriate to sum the various adjustments in table 3 because they are not independent, it seems clear that mix effects cannot account for the recent increase in unemployment. The mix effects that should have led to decreases in unemployment, increases in education and reductions in manufacturing employment are quantitatively much more important than the demographic mix effects that are emphasized in most discussions of rising unemployment. Taking into account the changing composition of the labor force does not reduce and may even increase the size of the rise in unemployment that must be explained.
WHOSE UNEMPLOYMENT HAS INCREASED?
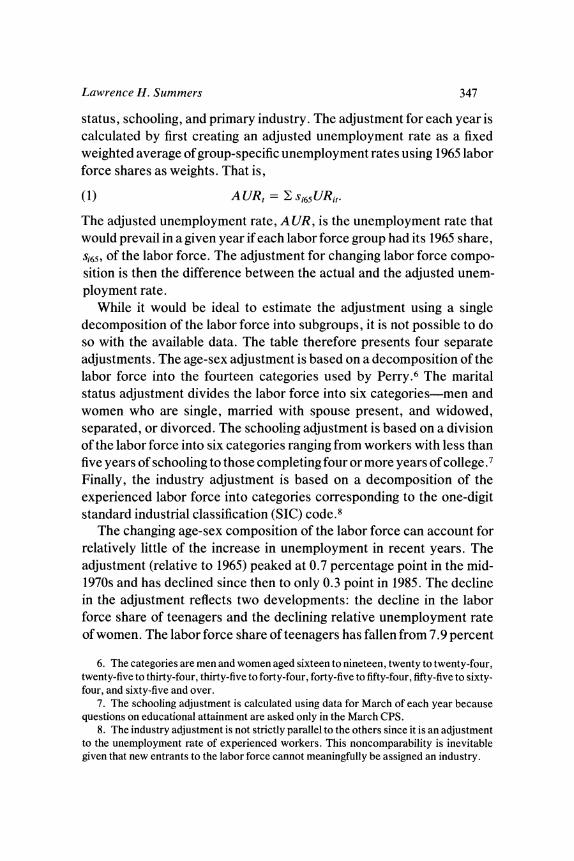
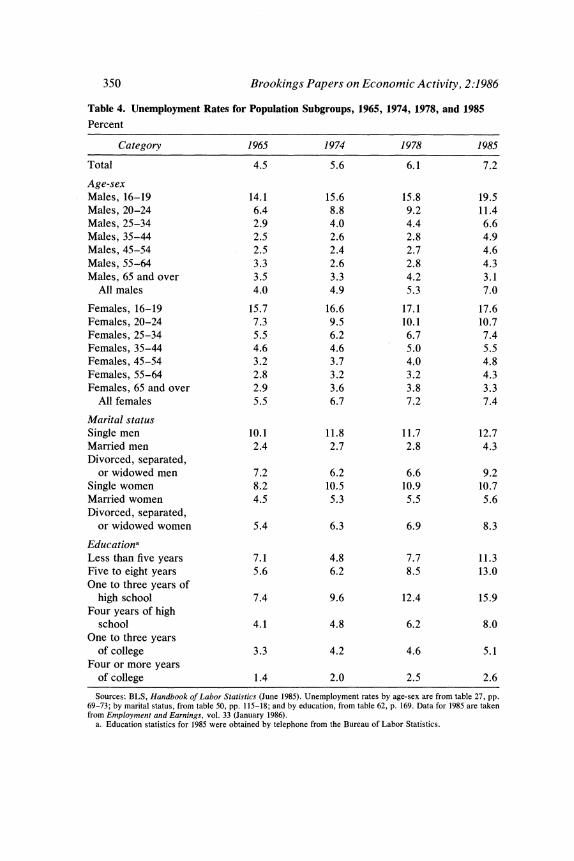
Since changes in labor force composition cannot account for increases in employment, it is natural to ask how the increase in unemployment in recent years has been distributed across the population. Table 4 presents unemployment rates for various subgroups of the population in 1965, 1974, 1978, and 1985. The years 1965, 1974, and 1978 are contrasted with 1985 because each is a year of moderately low but not cyclically minimal unemployment. The broad conclusions that emerge in the discussion are not sensitive to the choice of years.
350 Brookings Papers on Economic Activity, 2:1986
Table 4. Unemployment Rates for Population Subgroups, 1965, 1974, 1978, and 1985
Percent
Category 1965 1974 1978 1985
Total 4.5 5.6 6.1 7.2
Age-sex Males, 16-19 14.1 15.6 15.8 19.5 Males, 20-24 6.4 8.8 9.2 11.4 Males, 25-34 2.9 4.0 4.4 6.6 Males, 35-44 2.5 2.6 2.8 4.9 Males, 45-54 2.5 2.4 2.7 4.6 Males, 55-64 3.3 2.6 2.8 4.3 Males, 65 and over 3.5 3.3 4.2 3.1
All males 4.0 4.9 5.3 7.0
Females, 16-19 15.7 16.6 17.1 17.6 Females, 20-24 7.3 9.5 10.1 10.7 Females, 25-34 5.5 6.2 6.7 7.4 Females, 35-44 4.6 4.6 5.0 5.5 Females, 45-54 3.2 3.7 4.0 4.8 Females, 55-64 2.8 3.2 3.2 4.3 Females, 65 and over 2.9 3.6 3.8 3.3
All females 5.5 6.7 7.2 7.4
Marital status Single men 10.1 11.8 11.7 12.7 Married men 2.4 2.7 2.8 4.3 Divorced, separated,
or widowed men 7.2 6.2 6.6 9.2 Single women 8.2 10.5 10.9 10.7 Married women 4.5 5.3 5.5 5.6 Divorced, separated,
or widowed women 5.4 6.3 6.9 8.3
Educationa Less than five years 7.1 4.8 7.7 11.3 Five to eight years 5.6 6.2 8.5 13.0 One to three years of
high school 7.4 9.6 12.4 15.9 Four years of high
school 4.1 4.8 6.2 8.0 One to three years
of college 3.3 4.2 4.6 5.1 Four or more years
of college 1.4 2.0 2.5 2.6
Sources: BLS, Handbook of Labor Statistics (June 1985). Unemployment rates by age-sex are from table 27, pp. 69-73; by marital status, from table 50, pp. 115-18; and by education, from table 62, p. 169. Data for 1985 are taken from Employment and Earnings, vol. 33 (January 1986).
a. Education statistics for 1985 were obtained by telephone from the Bureau of Labor Statistics.
Lawrence H. Summers 351
The most dramatic relative increases in unemployment have occurred among prime-aged males. While aggregate unemployment increased by 18 percent, from 6.1 percent to 7.2 percent, between 1978 and 1985, the unemployment rate for men aged thirty-five to forty-four increased by 75 percent, from 2.8 percent to 4.9 percent. The increase occurred despite a rise in that cohort's labor force nonparticipation rate from 4.3 to 5.0 percent. A similar but less pronounced increase in unemployment is observed for men in the other under-sixty-five age groups. It is noteworthy that even going as far back as 1965, the conclusion that unemployment among mature men has risen disproportionately remains valid.
Unemployment rates for women have risen relatively little, despite huge increases in labor force participation rates. For women aged thirty- five to forty-four, the unemployment rate increased only 10 percent, from 5.0 to 5.5 percent, during 1978-85. The relative increases in unemployment were somewhat smaller for younger women and some- what greater for older women. There is a substantial difference between the experience of young men and that of young women. While increases in the unemployment of women aged sixteen to nineteen and twenty to twenty-four have been relatively small since 1974, there have been significant increases in the unemployment rate of young men, particu- larly those aged sixteen to nineteen.
The total unemployment rate is a weighted average of the unemploy- ment rates of different demographic groups with weights depending on their shares of the labor force. A simple way of combining the effects of changing demographic composition and changing group-specific unem- ployment rates is to ask what contribution different demographic groups make to total unemployment in different years. The contribution of a given group to total unemployment is the product of its labor force share and its unemployment rate. Performing this calculation reveals two significant developments. First, the amount of unemployment attribut- able to teenagers has declined in recent years. Teenagers contributed 1.2 percentage points to the 4.5 percent unemployment rate in 1965, 1.5 points to the 5.6 percent unemployment rate in 1974, 1.5 points to the 6.1 percent unemployment rate in 1978, but only 1.3 points to the 7.2 percent unemployment rate in 1985. Second, the bulk of the increase in unemployment in recent years is attributable to men aged twenty and above, whose contribution to total unemployment increased from 1.9 percentage points in 1965 to 2.3 points in 1978 and 3.3 points in 1985.
352 Brookings Papers on Economic Activity, 2:1986
Data on unemployment rates for different marital status groups reveal that unemployment has increased most dramatically among married and formerly married men. The rate for these groups increased by about 50 percent between 1978 and 1985. For single men and women and for married women the data reveal only very minor increases in unemploy- ment since 1974. These patterns cast doubt on the arguments that increases in measured unemployment are primarily the result of a rise in the fraction of the population on the margin between working and not working.'2 Surely mature men, especially those who are married, are the group for whom it is least plausible that social changes have made marginal labor force attachment attractive.
Finally, the breakdown of unemployment rates by education in table 4 reveals that the extent of the increase in unemployment over the past decade declines steadily with increased education. The unemployment rate of high school drop-outs increased by more than one-fourth between 1978 and 1985, compared with an increase of only 4 percent for college graduates and 11 percent for workers with some college education. The unemployment rate for those with only one to five years of schooling rose by almost 50 percent. The level of unemployment is not, however, monotonically related to education either in the 1970s or at present. People receiving no high school training have significantly lower unem- ployment rates than do high school drop-outs.'3 That pattern at least raises a question about arguments that unemployment is due to a lack of skills on the part of workers.
WHAT TYPES OF UNEMPLOYMENT HAVE INCREASED?
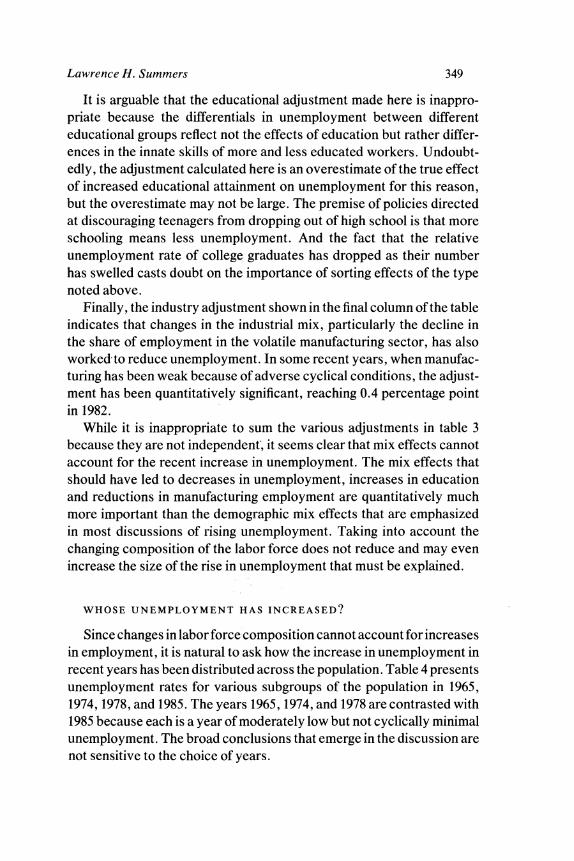
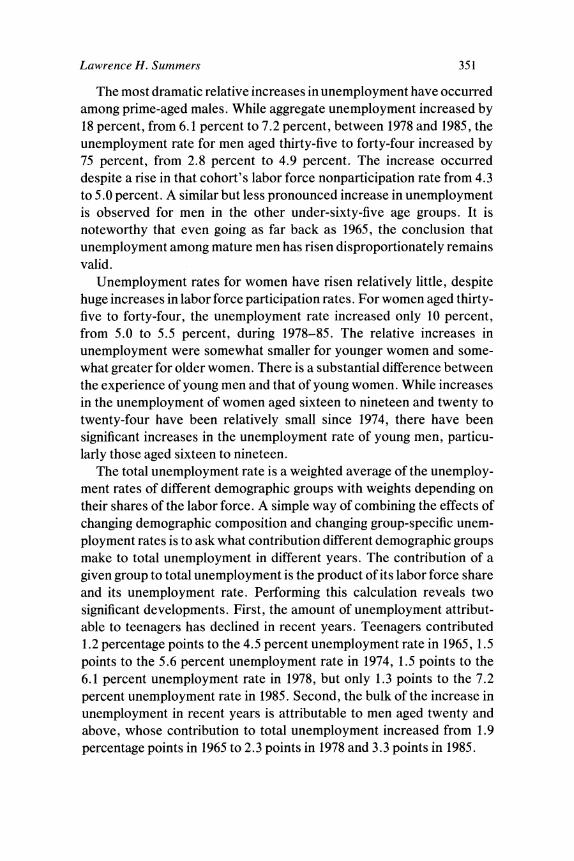
The discussion so far suggests that the increase in measured unem- ployment is potentially a serious social problem. Further evidence to that effect can be gleaned from data on changes in the composition of unemployment by reason and duration. As table 5 suggests, most of the increase in unemployment over the last decade is concentrated among
12. For the clearest and most persuasive statement of this view see Robert Hall's comment on Medoff, "U.S. Labor Markets, " BPEA, 1:1983, pp. 121-23. I consider the argument in more detail later.
13. Age effects may be at work here. It is likely that high school drop-outs in the labor force are on average much younger than people receiving less than eight years of schooling. The issue cannot be investigated using published tabulations.
Lawrence H. Summers 353
job losers. The unemployment rate attributable to job loss rose from 1.6 percent in 1967 to 2.4 percent in 1974,2.5 percent in 1978, and 3.6 percent in 1985. Unemployment attributable to job leavers has not increased at all since 1974, while unemployment among new entrants to the work force has increased modestly. Noticeable increases in unemployment have also taken place among workers reentering the work force. For reasons spelled out in detail in my earlier paper with Kim Clark, I believe that a substantial part of the reentrant category is composed of workers who have recently lostjobs. 14 If even a portion of the increase in reentrant unemployment is added to the job losers category, it appears clear that
Table 5. Unemployment by Reason and Duration, Various Years, 1965-85
Percent except where otherwise indicated
Unem- Reason for unemployment
ployment Re- New Year rate Job losers Job leavers entrants entrants
1967a 3.8 1.6 0.5 1.2 0.5 1974 5.6 2.4 0.8 1.6 0.7 1978 6.1 2.5 0.8 1.8 0.9 1985 7.2 3.6 0.8 2.0 0.9
Duration of unemployment Share of
Unem- 27 or Mean long-term ployment 0-5 6-14 15-26 more duration unem-
Year rate weeks weeks weeks weeks (weeks)b ploymentc
1965 4.5 2.2 1.3 0.5 0.5 11.8 42.5 1974 5.6 2.8 1.7 0.6 0.4 9.8 45.2 1978 6.1 2.8 1.9 0.8 0.6 11.9 46.0 1985 7.2 3.0 2.2 0.9 1.1 15.6 54.Od
Sources: BLS, Handbook of Labor Statistics (June 1985). Unemployment by reason for unemployment is in table 32, pp. 80-81. Unemployment by duration of unemployment is in table 31, pp. 78-79. Statistics for 1985 are from Employment and Earnings, vol. 33 (January 1986), table 12, p. 166, and table 14, p. 167.
a. Data on reason for unemployment do not begin until 1967. b. Mean duration of interrupted spells. c. Fraction of the year's unemployment due to persons with more than twenty-seven weeks of unemployment as
derived from the Work Experience Survey. d. Because 1985 data are unavailable, data from 1984 are used.
14. Kim B. Clark and Lawrence H. Summers, "Labor Market Dynamics and Unem- ployment: A Reconsideration," BPEA, 1:1979, pp. 13-60. We show that many reentrants have relatively recent work experience and report durations of unemployment very close to the total time since they last worked. The traditional picture of housewives reentering the labor force after their children have grown up is grossly inconsistent with the facts regarding reentrant unemployment.

354 Brookings Papers on Economic Activity, 2:1986
the bulk of the increase in unemployment in recent years is the result of job loss.
The data also suggest that a large part of the observed increase in unemployment is due to increases in the duration of unemployment. Of the 1.1 percentage point increase in the unemployment rate between 1978 and 1985, 0.5 point, or almost half, is attributable to increases in the number of people reporting themselves as out of work for more than twenty-seven weeks. The incidence of such long-term unemployment has more than doubled since 1965. Only a relatively small part of the observed increase in unemployment is due to an increase in the number of people reporting themselves as unemployed for fewer than five weeks.
Data on unemployment duration are difficult to interpret because of the high incidence of reporting errors. It appears that almost three- quarters of the unemployed population report their duration of unem- ployment inconsistently from month to month.15 There is also the complication, emphasized by many authors, that almost half of all unemployment spells end in withdrawal from the labor force rather than in employment.'6 Nonetheless, the available information suggests that unemployment is increasingly concentrated among a relatively small group that is unemployed for long stretches of time.
An easy way to see this point is to note that doubling the mean duration of incomplete spells of unemployment (shown in table 5) provides an estimate of the mean duration of the completed spell for those currently unemployed. 17 As Clark and I argued in our earlier paper, this concept is far superior to the more commonly studied mean duration of a completed spell for those entering unemployment in assessing the dynamics of unemployment. The expected total duration of unemploy-
15. The consistency of individuals' reported unemployment duration from month to month is examined in James M. Poterba and Lawrence H. Summers, "Response Variation in the CPS: Caveats for the Unemployment Analyst," Monthly Labor Review, vol. 107 (March 1984), pp. 37-43.
16. This finding is probably a consequence of measurement error in the CPS survey. See James M. Poterba and Lawrence H. Summers, "Reporting Errors and Labor Market Dynamics," Econometrica (forthcoming).
17. For discussions of alternative concepts of the duration of unemployment, see Stephen W. Salant, "Search Theory and Duration Data: A Theory of Sorts," Quarterly Journal of Economics, vol. 91 (February 1977), pp. 39-57; George A. Akerlof and Brian G. M. Main, "Unemployment Spells and Unemployment Experience," American Eco- nomic Review, vol. 70 (December 1980), pp. 885-93; and Clark and Summers, "Labor Market Dynamics."
Lawrence H. Summers 355
ment for the unemployed is now thirty-one weeks, compared with twenty-four weeks in 1978, twenty weeks in 1974, and twenty-four weeks in 1965. Taking account in some way of the shortening of reported spells of unemployment that can be attributed to labor force withdrawal would further increase the estimated duration of joblessness for the currently unemployed population.
Additional evidence on the concentration of unemployment among the long-term unemployed is provided by the retrospective Work Ex- perience Survey conducted annually in March as a supplement to the CPS. The March survey, in which respondents are asked about the extent of their unemployment and employment experience in the pre- ceding year, makes it possible to calculate the fraction of total unem- ployment attributable to people experiencing different amounts of un- employment in the preceding year. In our earlier paper, Clark and I used this data to suggest that a large fraction of unemployment in 1969, 1974, and 1975 was attributable to the relatively small subgroup of the popu- lation that experienced more than six months of unemployment in the preceding year.18 Replicating our calculations for subsequent years suggests that the importance of long-term unemployment has increased significantly. While people out of work for twenty-seven or more weeks accounted for 45.2 percent of all unemployment reported in the 1974 Work Experience Survey, they accounted for 46.0 percent of unemploy- ment in 1978 and 54.0 percent of unemployment in 1984, the most recent year for which data are available.
Increases in normal unemployment over the past twenty years rep- resent a serious problem. The view that the current high level of unemployment is primarily the result of the increased unemployment of secondary workers is simply false. In fact, the increases in unemploy- ment have been relatively greatest for mature men with dependents. And they have resulted primarily fromjob loss and increases in duration of unemployment.
CPS UNEMPLOYMENT AND OTHER LABOR MARKET INDICATORS
A number of recent analyses have called attention to the fact that the observed increase in the official unemployment rate has not coincided
18. Clark and Summers, "Labor Market Dynamics," table 4, pp. 36-37.
356 Brookings Papers on Economic Activity, 2:1986
with substantial increases in other labor market indicators. '9 It could be that some flaw in the CPS measure of unemployment accounts for the observed increase, though such an argument is difficult to evaluate. Unemployment as reflected in the CPS is more a state of mind than an objective reality. The substantial importance of rotation group bias and the sensitivity of the measured unemployment rate to even small changes in the phrasing or the order of the questions asked suggests the subjective nature of measured unemployment.20 This means that it is difficult to examine whether or not the CPS is correctly measuring unemployment. In an important sense, unemployment is what the CPS says it is.
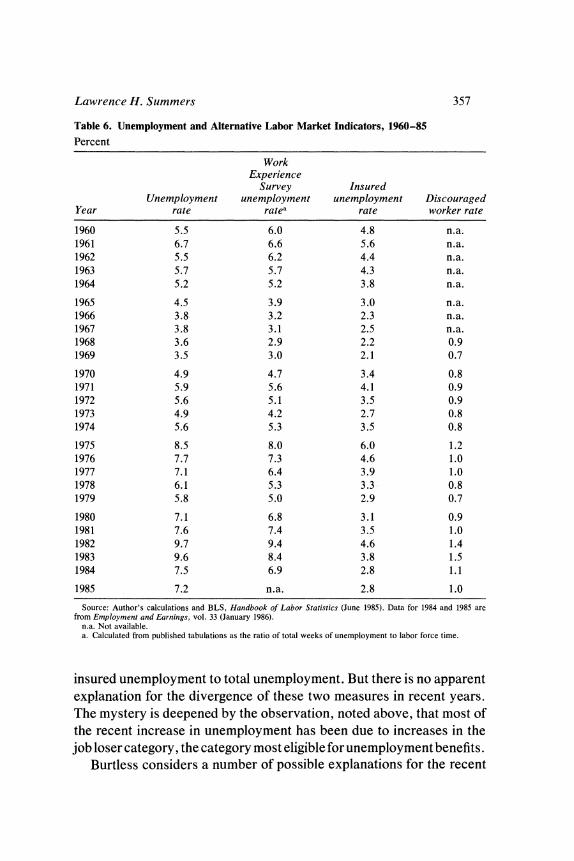
Nonetheless, it is useful to contrast movements in CPS unemployment rates with movements in other variables that are likely to reflect changes in labor market conditions. Table 6 presents estimates of the CPS unemployment rate, the insured unemployment rate, the unemployment rate as inferred from the annual retrospective Work Experience Survey, and the discouraged worker rate.2" A major mystery is the sharp recent decline in the ratio of insured unemployment to total unemployment. The insured unemployment rate-the number of recipients of unemploy- ment benefits divided by the number of jobs covered by unemployment insurance-was about 15 percent lower in 1985 than it was in 1978 and 20 percent lower in 1985 than it was in 1974. It was only one-third greater than it was in 1969. As Gary Burtless explains, one would expect insured unemployment to be below actual unemployment since many of the unemployed are ineligible for benefits.22 Burtless also suggests that the increasing share of the population covered by unemployment insurance can account for some of the pre-1980 trend decrease in the ratio of
19. See, for example, Martin Neil Baily, "Labor Market Performance, Competition, and Inflation," in Baily, ed., Workers, Jobs, and Inflation, pp. 15-44; Hall's comment on Medoff, "U.S. Labor Markets"; Gary Burtless, "Why is Insured Unemployment So Low?," BPEA, 1:1983, pp. 225-49; and George A. Akerlof and Janet L. Yellen, "Unem- ployment through the Filter of Memory," Quarterly Journal of Economics, vol. 100 (August 1985), pp. 747-73.
20. For a discussion of these points stressing the ambiguity inherent in the distinction between being unemployed and not being in the labor force, see Clark and Summers, "Labor Market Dynamics."
21. It would be desirable to examine the quit and lay-off rates in conjunction with other labor market indicators. Unfortunately, publication of these turnover data was discontin- ued after 1981. As Baily, "Labor Markets," argued, their behavior up until 1981 does not mirror that of the official unemployment rate.
22. Burtless, "Insured Unemployment."
Lawrence H. Summers 357
insured unemployment to total unemployment. But there is no apparent explanation for the divergence of these two measures in recent years. The mystery is deepened by the observation, noted above, that most of the recent increase in unemployment has been due to increases in the job loser category, the category most eligible for unemployment benefits.
Burtless considers a number of possible explanations for the recent
Table 6. Unemployment and Alternative Labor Market Indicators, 1960-85
Percent
Work Experience
Survey Insured Unemployment unemployment unemployment Discouraged
Year rate ratea rate worker rate
1960 5.5 6.0 4.8 n.a. 1961 6.7 6.6 5.6 n.a. 1962 5.5 6.2 4.4 n.a. 1963 5.7 5.7 4.3 n.a. 1964 5.2 5.2 3.8 n.a.
1965 4.5 3.9 3.0 n.a. 1966 3.8 3.2 2.3 n.a. 1967 3.8 3.1 2.5 n.a. 1968 3.6 2.9 2.2 0.9 1969 3.5 3.0 2.1 0.7
1970 4.9 4.7 3.4 0.8 1971 5.9 5.6 4.1 0.9 1972 5.6 5.1 3.5 0.9 1973 4.9 4.2 2.7 0.8 1974 5.6 5.3 3.5 0.8
1975 8.5 8.0 6.0 1.2 1976 7.7 7.3 4.6 1.0 1977 7.1 6.4 3.9 1.0 1978 6.1 5.3 3.3 0.8 1979 5.8 5.0 2.9 0.7
1980 7.1 6.8 3.1 0.9 1981 7.6 7.4 3.5 1.0 1982 9.7 9.4 4.6 1.4 1983 9.6 8.4 3.8 1.5 1984 7.5 6.9 2.8 1.1
1985 7.2 n.a. 2.8 1.0
Source: Author's calculations and BLS, Handbook of Labor Statistics (June 1985). Data for 1984 and 1985 are from Employment and Earnings, vol. 33 (January 1986).
n.a. Not available. a. Calculated from published tabulations as the ratio of total weeks of unemployment to labor force time.
358 Brookings Papers on Economic Activity, 2:1986
low level of the insured unemployment rate without finding any that are wholly persuasive. It appears that many people who, based on their answers to the CPS questionnaire, appear to be eligible for unemploy- ment insurance are not collecting it, possibly because benefits began to be taxed in 1980 or, more plausibly, because administrative changes have increased the logistical difficulties associated with collecting ben- efits. It is conceivable that receipt of benefits carries more stigma in the Reagan era than it once did. Perhaps the most plausible explanation, in view of the increasing average duration of unemployment, is that many of the unemployed have exhausted their unemployment insurance eli- gibility during either their current unemployment spell or a previous one. Although it is not clear what the low insured unemployment rate means, at a minimum it exonerates unemployment insurance as a cause of the high level of unemployment. If a smaller share of the labor force is collecting benefits than used to be the case, unemployment insurance can hardly be blamed for increasing unemployment.
The second column of table 6 follows George Akerlof and Janet Yellen in reporting the Work Experience Survey unemployment rate, calculated as the ratio of reported unemployment for the preceding year to reported labor force participation, defined as the sum of time spent employed and unemployed.23 As they note, using data for the 1960-81 period, there has been a tendency for the retrospective unemployment rate to decline relative to the official rate over time. Between 1974 and 1984, the Work Experience Survey unemployment rate increased by 1.6 points; the official rate, 1.9 points.
Akerlof and Yellen estimate that the CPS unemployment rate corre- sponding to any given Work Experience Survey unemployment rate rose by about 0.8 percent per year through 1981, a relationship that has held up over the three additional years for which data have since become available.24 The CPS rate has thus risen by about 12 percent, or 1
23. My calculation differs slightly from that of Akerlof and Yellen, "Unemployment through the Filter of Memory," because I use reported labor force participation from the Work Experience Survey as the denominator in calculating the Work Experience Survey unemployment rate rather than using labor force data from the CPS as they did. My procedure reduces somewhat the differential between the two series.
24. The precise estimate depends on what adjustment is made for the changes in the CPS instituted in 1967 after the Gordon Commission report. See President's Commission to Appraise Employment and Unemployment Statistics, Measuring Employment and Unemployment (GPO, 1962).
Lawrence H. Summers 359
percentage point, relative to the retrospectively reported unemployment rate over the past fifteen years. Akerlof and Yellen find, however, that there has been essentially no trend increase in the ratio of CPS unem- ployment to retrospective unemployment for either prime-age men or prime-age women over this period. They also report that about one- fourth of the movement in official unemployment relative to Work Experience Survey unemployment can be explained by changes in the composition of the labor force, particularly the influx of women, for whom the ratio of retrospective unemployment to official unemployment is particularly low.
Citing a variety of psychological studies suggesting that the more painful an experience the better people recall it, Akerlof and Yellen attribute the rising differential between the two rates to a decrease in the discomfort associated with unemployment. They buttress their claim by noting that the ratio of retrospective unemployment to official unem- ployment is highest for mature men and that it rises in recessions. A natural interpretation of the Work Experience Survey information is that unemployment has become a less painful and salient experience for young workers. It might be more accurate to say that the unemployment of young workers has become less salient for their parents, since one member of a household, typically an adult, provides information on the labor market status of all household members in the Work Experience Survey, as in the CPS. The reduction in the salience of unemployment is not surprising given the sharp increase in the share of young people in school. It seems reasonable to conclude from the Work Experience Survey data that a 7 percent unemployment rate today is associated with less distress than was once the case. But the data shed little light on the observed increase in unemployment, most of which has come from adults.
The final column of the table presents the "discouraged worker" rate, estimated as the number of discouraged workers divided by the total labor force. Discouraged workers are defined as those who cite inability to find work as their sole reason for not searching. Many analysts have argued that they should properly be counted as unemployed. The discouraged worker rate has moved in parallel with the official unem- ployment rate over the past fifteen years. If, as some have argued, an increasing percentage of unemployment reflects marginal labor force attachment, one might have expected to see a decline in the ratio of
360 Brookings Papers on Economic Activity, 2:1986
discouraged workers to unemployed persons. The observed increase in discouragement over the past decade suggests that increases in unem- ployment do in fact reflect increases in the difficulty ofjob finding.
Different labor market indicators capture different aspects of labor market performance. It does not appear that other labor market indica- tors provide a basis for concluding that the observed increase in CPS unemployment reflects measurement error. However, they do suggest that the nature of unemployment may have changed over the past fifteen years.
THE SEARCH ACTIVITIES OF THE UNEMPLOYED
Oversimplifying slightly, people are counted as unemployed if they report being available for work in the Current Population Survey week and report having looked for work in the preceding four weeks. In practice, the first question regarding availability for work is the principal determinant of unemployment status. All survey respondents are asked their primary activity. Five answers are possible for the unemployed: with a job (to which they expect to return), looking for work, keeping house, in school, and other. The last category includes but is not limited to retired workers. If increasing unemployment reflects an increase in the number of people marginally attached to the labor force, the number reporting their primary activity as looking for work should have declined. The intensity of their search should also have declined.
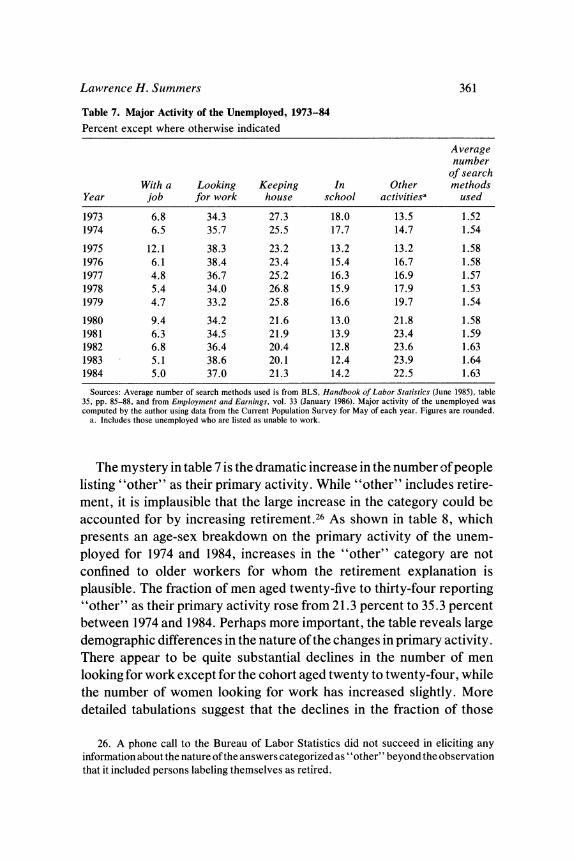
While data on the primary activity of the unemployed are not pub- lished, I was able to construct a time series on primary activity using raw data from the CPS for May of each year from 1973 through 1984. A conspicuous feature of the data reported in table 7 is that only a minority of the unemployed report themselves as having a job or report their primary activity as looking for work.25 The fraction reporting their primary activity as looking for work or as having a job to which they expect to return varies cyclically but shows no trend during 1973-84. The data reveal significant declines in the proportion of the unemployed reporting their primary activity as keeping house or being in school, a finding that is supported by the observation that the average number of search methods used by unemployed persons has gradually increased.
25. See Hall's comment on Medoff, "U.S. Labor Markets"; and Hall, "The Nature and Measurement of Unemployment," Working Paper 252 (National Bureau of Economic Research, July 1978).
Lawrence H. Summers 361
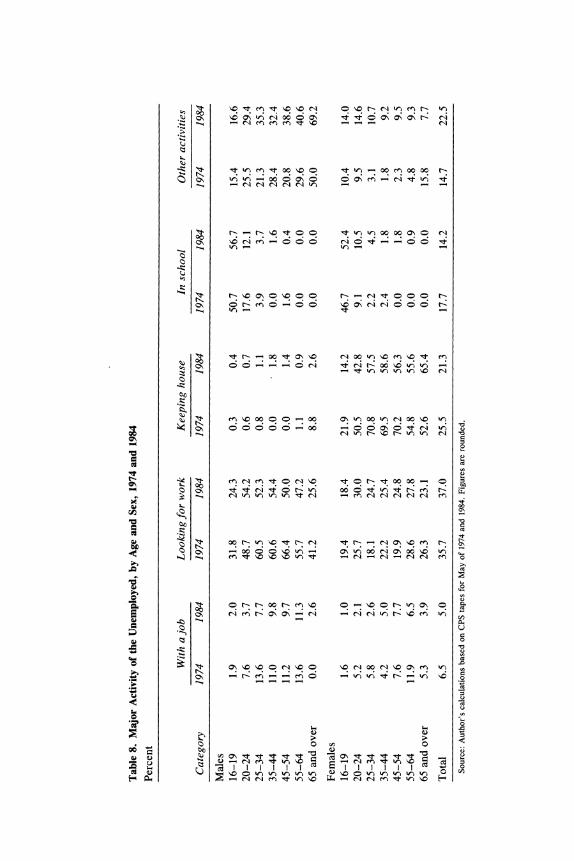
The mystery in table 7 is the dramatic increase in the number of people listing "other" as their primary activity. While "other" includes retire- ment, it is implausible that the large increase in the category could be accounted for by increasing retirement.26 As shown in table 8, which presents an age-sex breakdown on the primary activity of the unem- ployed for 1974 and 1984, increases in the "other" category are not confined to older workers for whom the retirement explanation is plausible. The fraction of men aged twenty-five to thirty-four reporting "other" as their primary activity rose from 21.3 percent to 35.3 percent between 1974 and 1984. Perhaps more important, the table reveals large demographic differences in the nature of the changes in primary activity. There appear to be quite substantial declines in the number of men looking for work except for the cohort aged twenty to twenty-four, while the number of women looking for work has increased slightly. More detailed tabulations suggest that the declines in the fraction of those
Table 7. Major Activity of the Unemployed, 1973-84
Percent except where otherwise indicated
Average number
of search With a Looking Keeping In Other methods
Year job for work house school activitiesa used
1973 6.8 34.3 27.3 18.0 13.5 1.52 1974 6.5 35.7 25.5 17.7 14.7 1.54
1975 12.1 38.3 23.2 13.2 13.2 1.58 1976 6.1 38.4 23.4 15.4 16.7 1.58 1977 4.8 36.7 25.2 16.3 16.9 1.57 1978 5.4 34.0 26.8 15.9 17.9 1.53 1979 4.7 33.2 25.8 16.6 19.7 1.54
1980 9.4 34.2 21.6 13.0 21.8 1.58 1981 6.3 34.5 21.9 13.9 23.4 1.59 1982 6.8 36.4 20.4 12.8 23.6 1.63 1983 5.1 38.6 20.1 12.4 23.9 1.64 1984 5.0 37.0 21.3 14.2 22.5 1.63
Sources: Average number of search methods used is from BLS, Handbook of Labor Statistics (June 1985), table 35, pp. 85-88, and from Employment and Earnings, vol. 33 (January 1986). Major activity of the unemployed was computed by the author using data from the Current Population Survey for May of each year. Figures are rounded.
a. Includes those unemployed who are listed as unable to work.
26. A phone call to the Bureau of Labor Statistics did not succeed in eliciting any information about the nature of the answers categorized as "other" beyond the observation that it included persons labeling themselves as retired.
Cq t r?e'1o0ON '~~O?NONON-
00
* )N .}
06 6 ( 4
ONx'I f) OC0 en O
O OCC 1 -
1- Ic ,:^t 0 0 W) W) OC OC (O C) X
C. r-NO C; C (0003OC o~~~- 00 (O Ic cq OC W) 'I en 'I It ent
00 b t 0 t m o. O N - O O O i O t O O '
Cq~~~~~~~~~~~~~~~~~~~~~~~~~~~~~~~~~~~~~~~~~~~~~~~~~~~~~~' (V -:t o CA "C O O r- ,:t O0 O O
00
t2e
0~~~~~~~~~~~~~~~~~~~~~~~~~~~~~~~~~~~~~~. 0~~~~~~~~~~~~~~~~~~
Cu~~~~~~~~~~~~~~~~~~~~~~~~~~~~~~~~~~~~~~~~C
0~~~~~~~~~~~~~~~~~~~~~~~~.
ON N "C " C) O' " C) "C c l00 q"C ON en~
06
0 0
t Y~~~t
o .0 ,
O O0 0 0 0_
9 <t_^ ?? m NN 00
C. -
O ? t o lClrON ?O ClClr t CNO H

Lawrence H. Summers 363
whose primary activity is looking for work are concentrated among job losers and leavers.
Given the ambiguities associated with the "other" category, it is not clear how to interpret these figures. They may well be related to the greater increase in unemployment among men than among women. They may also have something to do with broader social trends regarding the division of family responsibilities between men and women. Another possibility is that single men, who have increased as a share of the male labor force in recent years, feel less pressure to look for work than their married counterparts.
All of the information presented so far on the increase in unemploy- ment suggests that it is a serious problem. Increases in normal unem- ployment reflect neither measurement problems nor changes in the demographic composition of the labor force. Rather, unemployment has increased in those segments of the population where it is most serious- among married men, job losers, and the long-term unemployed.
Regional Differences in Unemployment
So far my object has been more to account for the observed increase in unemployment than to explain it. Inevitably, aggregate time series data are not rich enough to distinguish alternative explanations for rising unemployment. In seeking explanations, I turn to information on the different labor market experiences of different parts of the country.27
Data by state reflect widely noted patterns in recent regional economic growth. During the past fifteen years, for example, New England has performed extraordinarily well, while the North Central States have fared poorly. California's economy has done well, while Alabama, Mississippi, and Louisiana have suffered significant increases in unem- ployment.
The data reveal significant volatility in the pattern of state unemploy-
27. Studies exploring aspects of the geographic distribution of unemployment include Robert E. Hall, "Turnover in the Labor Force," BPEA, 3:1972, pp. 709-56; Medoff, "U.S. Labor Markets"; and Stephen T. Marston, "Two Views of the Geographic Distribution of Unemployment," Quarterly Journal of Economics, vol. 100 (February 1985), pp. 57-79, among many others. The view of geographic differences in unemployment put forward here parallels, in some respects, that of Hall and Marston.

364 Brookings Papers on Economic Activity, 2:1986
ment rates. The correlation between 1970 and 1985 state unemployment rates was 0.54. Somewhat surprisingly, the correlation between unem- ployment rates in the mid-1970s and 1985 was significantly lower. For example, the correlation between unemployment rates in 1976 and 1985 was only 0.03, and the correlation between unemployment rates in 1978 and 1985 was 0.33. That volatility over the past fifteen years indicates that regional information has the potential to illuminate the causes of the observed increase in normal unemployment.28
EMPLOYMENT OPPORTUNITIES AND UNEMPLOYMENT
One explanation for regional unemployment differentials is differ- ences in industrial composition. For example, the problems of the North Central area are often attributed to its heavy reliance on manufacturing, while the strength of the New England economy is explained by the growth in its "high-tech" industries. To the extent that regional differ- ences in unemployment reflect only differences in industrial composi- tion, however, they can explain only a little of the observed increase in aggregate unemployment.
In order to explore the importance of such composition effects in explaining differences in state unemployment rates, I used direct infor- mation from the CPS to compute adjusted state unemployment rates that control for differences in demographic, educational, industrial, and occupational composition among states. I used data from the May CPS for selected years to estimate an equation relating an individual's employment status to his age, sex, and marital characteristics, two-digit industry, one-digit occupation, educational attainment, and his state of residence.29 Using the coefficients on the state dummies, I constructed adjusted unemployment rates and then normalized them so that average adjusted unemployment would equal average unemployment as officially reported for the entire year.
28. U.S. Department of Labor, Bureau of Labor Statistics, Geographic Profile of Employment and Unemployment, 1985 (September 1986) and earlier issues.
29. The variables included in the equation used to construct adjusted state unemploy- ment rates were age, sex, age-sex, marital status-sex, education, education squared, education-sex, education squared-sex, race, center city status, one-digit occupation, two- digit industry, and state dummies.
Lawrence H. Summers 365
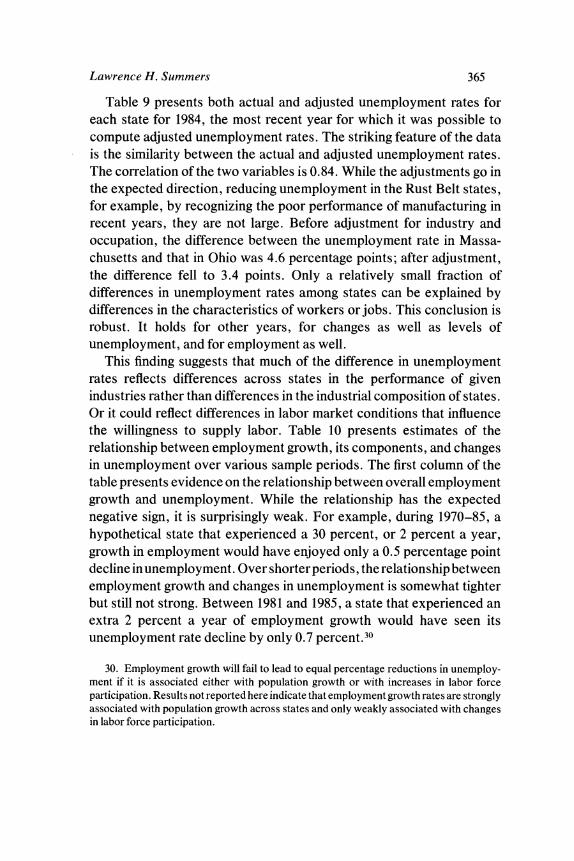
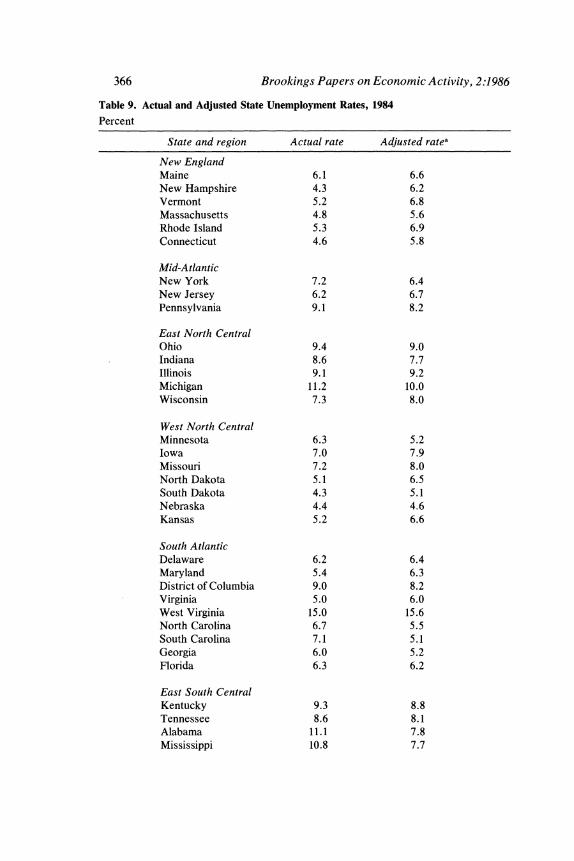
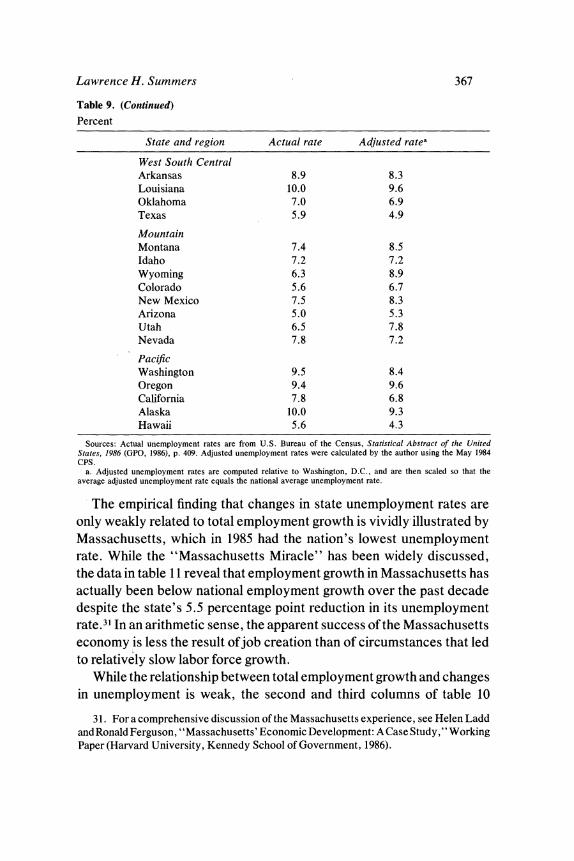
Table 9 presents both actual and adjusted unemployment rates for each state for 1984, the most recent year for which it was possible to compute adjusted unemployment rates. The striking feature of the data is the similarity between the actual and adjusted unemployment rates. The correlation of the two variables is 0.84. While the adjustments go in the expected direction, reducing unemployment in the Rust Belt states, for example, by recognizing the poor performance of manufacturing in recent years, they are not large. Before adjustment for industry and occupation, the difference between the unemployment rate in Massa- chusetts and that in Ohio was 4.6 percentage points; after adjustment, the difference fell to 3.4 points. Only a relatively small fraction of differences in unemployment rates among states can be explained by differences in the characteristics of workers or jobs. This conclusion is robust. It holds for other years, for changes as well as levels of unemployment, and for employment as well.
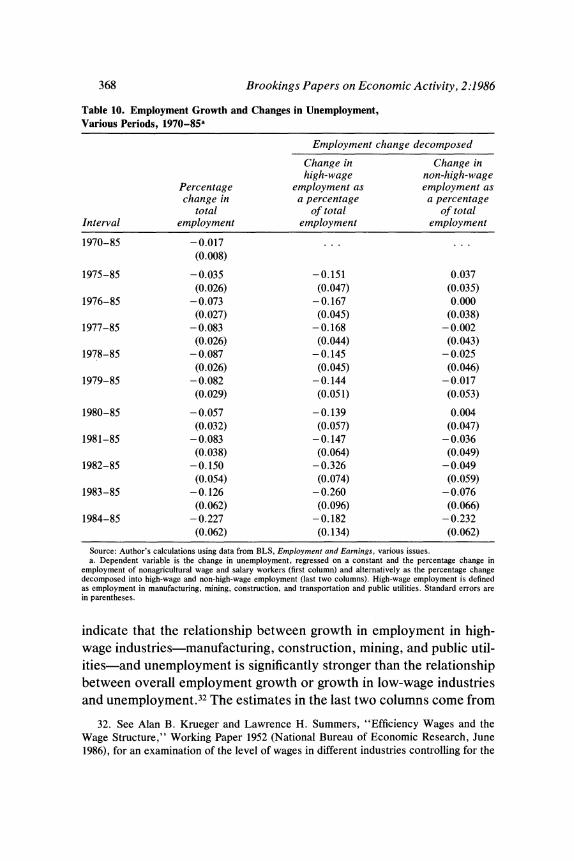
This finding suggests that much of the difference in unemployment rates reflects differences across states in the performance of given industries rather than differences in the industrial composition of states. Or it could reflect differences in labor market conditions that influence the willingness to supply labor. Table 10 presents estimates of the relationship between employment growth, its components, and changes in unemployment over various sample periods. The first column of the table presents evidence on the relationship between overall employment growth and unemployment. While the relationship has the expected negative sign, it is surprisingly weak. For example, during 1970-85, a hypothetical state that experienced a 30 percent, or 2 percent a year, growth in employment would have enjoyed only a 0.5 percentage point decline in unemployment. Over shorter periods, the relationship between employment growth and changes in unemployment is somewhat tighter but still not strong. Between 1981 and 1985, a state that experienced an extra 2 percent a year of employment growth would have seen its unemployment rate decline by only 0.7 percent.30
30. Employment growth will fail to lead to equal percentage reductions in unemploy- ment if it is associated either with population growth or with increases in labor force participation. Results not reported here indicate that employment growth rates are strongly associated with population growth across states and only weakly associated with changes in labor force participation.
366 Brookings Papers on Economic Activity, 2:1986
Table 9. Actual and Adjusted State Unemployment Rates, 1984
Percent
State and region Actual rate Adjusted ratea
New England Maine 6.1 6.6 New Hampshire 4.3 6.2 Vermont 5.2 6.8 Massachusetts 4.8 5.6 Rhode Island 5.3 6.9 Connecticut 4.6 5.8
Mid-Atlantic New York 7.2 6.4 New Jersey 6.2 6.7 Pennsylvania 9.1 8.2
East North Central Ohio 9.4 9.0 Indiana 8.6 7.7 Illinois 9.1 9.2 Michigan 11.2 10.0 Wisconsin 7.3 8.0
West North Central Minnesota 6.3 5.2 Iowa 7.0 7.9 Missouri 7.2 8.0 North Dakota 5.1 6.5 South Dakota 4.3 5.1 Nebraska 4.4 4.6 Kansas 5.2 6.6
South Atlantic Delaware 6.2 6.4 Maryland 5.4 6.3 District of Columbia 9.0 8.2 Virginia 5.0 6.0 West Virginia 15.0 15.6 North Carolina 6.7 5.5 South Carolina 7.1 5.1 Georgia 6.0 5.2 Florida 6.3 6.2
East South Central Kentucky 9.3 8.8 Tennessee 8.6 8.1 Alabama 11.1 7.8 Mississippi 10.8 7.7
Lawrence H. Summers 367
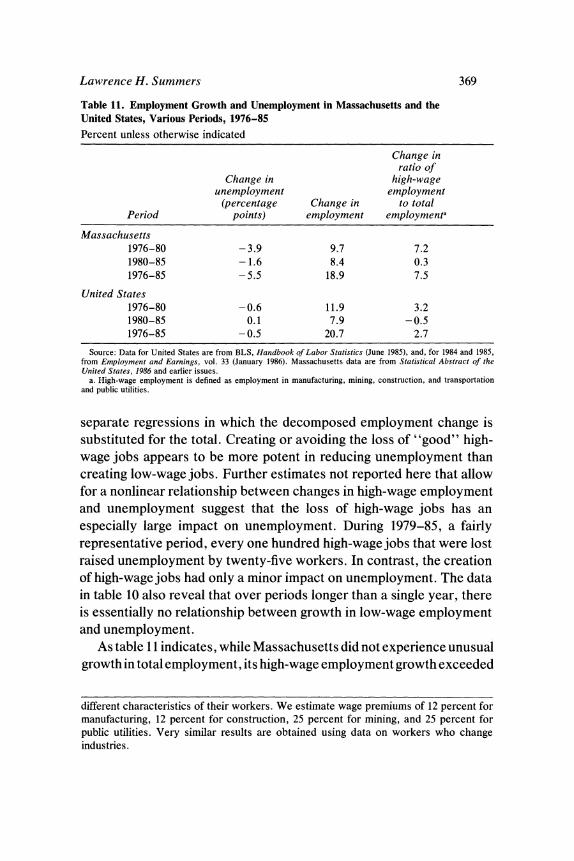
The empirical finding that changes in state unemployment rates are only weakly related to total employment growth is vividlyillustrated by Massachusetts, which in 1985 had the nation's lowest unemployment rate. While the "Massachusetts Miracle" has been widely discussed, the data in table 11 reveal that employment growth in Massachusetts has actually been below national employment growth over the past decade despite the state's 5.5 percentage point reduction in its unemployment rate.3" In an arithmetic sense, the apparent success of the Massachusetts economy is less the result of job creation than of circumstances that led to relatively slow labor force growth.
While the relationship between total employment growth and changes in unemployment is weak, the second and third columns of table 10
Table 9. (Continued)
Percent
State and region Actual rate Adjusted ratea
West South Central Arkansas 8.9 8.3 Louisiana 10.0 9.6 Oklahoma 7.0 6.9 Texas 5.9 4.9
Mountain Montana 7.4 8.5 Idaho 7.2 7.2 Wyoming 6.3 8.9 Colorado 5.6 6.7 New Mexico 7.5 8.3 Arizona 5.0 5.3 Utah 6.5 7.8 Nevada 7.8 7.2
Pacific Washington 9.5 8.4 Oregon 9.4 9.6 California 7.8 6.8 Alaska 10.0 9.3 Hawaii 5.6 4.3
Sources: Actual unemployment rates are from U.S. Bureau of the Census, Statistical Abstract of the United States, 1986 (GPO, 1986), p. 409. Adjusted unemployment rates were calculated by the author using the May 1984 CPS.
a. Adjusted unemployment rates are computed relative to Washington, D.C., and are then scaled so that the average adjusted unemployment rate equals the national average unemployment rate.
31. Fora comprehensive discussion of the Massachusetts experience, see Helen Ladd and Ronald Ferguson, "Massachusetts' Economic Development: A Case Study," Working Paper (Harvard University, Kennedy School of Government, 1986).
368 Brookings Papers on Economic Activity, 2:1986
indicate that the relationship between growth in employment in high- wage industries-manufacturing, construction, mining, and public util- ities-and unemployment is significantly stronger than the relationship between overall employment growth or growth in low-wage industries and unemployment.32 The estimates in the last two columns come from
Table 10. Employment Growth and Changes in Unemployment, Various Periods, 1970-85a
Employment change decomposed
Change in Change in high-wage non-high-wage
Percentage employment as employment as change in a percentage a percentage
total of total of total Interval employment employment employment
1970-85 -0.017 ... ... (0.008)
1975-85 -0.035 -0.151 0.037 (0.026) (0.047) (0.035)
1976-85 -0.073 -0.167 0.000 (0.027) (0.045) (0.038)
1977-85 -0.083 -0.168 -0.002 (0.026) (0.044) (0.043)
1978-85 - 0.087 -0.145 - 0.025 (0.026) (0.045) (0.046)
1979-85 -0.082 -0.144 -0.017 (0.029) (0.051) (0.053)
1980-85 -0.057 -0.139 0.004 (0.032) (0.057) (0.047)
1981-85 -0.083 -0.147 -0.036 (0.038) (0.064) (0.049)
1982-85 -0.150 -0.326 -0.049 (0.054) (0.074) (0.059)
1983-85 -0.126 -0.260 -0.076 (0.062) (0.096) (0.066)
1984-85 -0.227 -0.182 - 0.232 (0.062) (0.134) (0.062)
Source: Author's calculations using data from BLS, Employment and Earnings, various issues. a. Dependent variable is the change in unemployment, regressed on a constant and the percentage change in
employment of nonagricultural wage and salary workers (first column) and alternatively as the percentage change decomposed into high-wage and non-high-wage employment (last two columns). High-wage employment is defined as employment in manufacturing, mining, construction, and transportation and public utilities. Standard errors are in parentheses.
32. See Alan B. Krueger and Lawrence H. Summers, "Efficiency Wages and the Wage Structure," Working Paper 1952 (National Bureau of Economic Research, June 1986), for an examination of the level of wages in different industries controlling for the
Lawrence H. Summers 369
separate regressions in which the decomposed employment change is substituted for the total. Creating or avoiding the loss of "good" high- wage jobs appears to be more potent in reducing unemployment than creating low-wage jobs. Further estimates not reported here that allow for a nonlinear relationship between changes in high-wage employment and unemployment suggest that the loss of high-wage jobs has an especially large impact on unemployment. During 1979-85, a fairly representative period, every one hundred high-wage jobs that were lost raised unemployment by twenty-five workers. In contrast, the creation of high-wage jobs had only a minor impact on unemployment. The data in table 10 also reveal that over periods longer than a single year, there is essentially no relationship between growth in low-wage employment and unemployment.
As table 11 indicates, while Massachusetts did not experience unusual growth in total employment, its high-wage employment growth exceeded
Table 11. Employment Growth and Unemployment in Massachusetts and the United States, Various Periods, 1976-85
Percent unless otherwise indicated
Change in ratio of
Change in high-wage unemployment employment
(percentage Change in to total Period points) employment employmenta
Massachusetts 1976-80 - 3.9 9.7 7.2 1980-85 - 1.6 8.4 0.3 1976-85 -5.5 18.9 7.5
United States 1976-80 -0.6 11.9 3.2 1980-85 0.1 7.9 -0.5 1976-85 -0.5 20.7 2.7
Source: Data for United States are from BLS, Handbook of Labor Statistics (June 1985), and, for 1984 and 1985, from Employment and Earnings, vol. 33 (January 1986). Massachusetts data are from Statistical Abstract of the United States, 1986 and earlier issues.
a. High-wage employment is defined as employment in manufacturing, mining, construction, and transportation and public utilities.
different characteristics of their workers. We estimate wage premiums of 12 percent for manufacturing, 12 percent for construction, 25 percent for mining, and 25 percent for public utilities. Very similar results are obtained using data on workers who change industries.
370 Brookings Papers on Economic Activity, 2:1986
that of the rest of the country-though not by enough to account for the extraordinary performance of its economy.
These findings on the relationship between changes in employment and unemployment are instructive. They suggest that in analyzing recent changes in unemployment in the United States, it is not enough to focus on the determination of the total level of employment.33 It is also necessary to examine the composition of employment growth and to consider the incentives individuals may have to remain unemployed.
WHAT IS INVOLUNTARY UNEMPLOYMENT?
As countless analysts have pointed out, the notion of invol-dntary unemployment involves important logical difficulties. The argument usually goes something like this: virtually everyone counted as unem- ployed could find some type ofjob at some wage; even if not, the option of self-employment is surely open; in the sense that there is some option open to all the unemployed, there is a voluntary component to all unemployment.34 Careful critics of the concept of involuntary unem- ployment are quick to stress that labeling unemployment as voluntary does not make it benign or socially inconsequential. But they do stress that a proper analysis of its causes requires recognizing its voluntary element.
The standard response to this line of argument is usually to conjure up images of the Great Depression, to highlight the personal and social costs of unemployment, and then to take refuge in some notion that unemployment is involuntary only when "reasonable" jobs are not available. Without some specification of what is meant by a "reasonable" job, the concept of involuntary unemployment is vague, but, at the same time, it does seem to capture an important aspect of what many see happening over the course of cyclical fluctuations.
Perhaps the most coherent set of attempts to justif the concept of involuntary unemployment relies on some notion of segmented labor
33. Increasing unemployment in Europe has been associated with a cessation of job creation distinguishing it sharply from the United States.
34. For perhaps the best-known recent attack on the concept of involuntary unem- ployment, see Robert E. Lucas, Jr., "Unemployment Policy," American Economic Review, vol. 68 (May 1978, Papers and Proceedings, 1977), pp. 353-57.
Lawrence H. Summers 371
markets.35 Where employed workers of a given ability do not receive equal compensation, a meaningful definition of involuntary unemploy- ment is possible. A worker may be defined as involuntarily unemployed if he is unable to get ajob at a wage that other workers of his ability are receiving, even if he could get an alternative lower-wage job. If labor markets are segmented so that there are differences in employed workers' compensation unrelated to differences in their ability, it is possible to observe unemployment that has both voluntary and involuntary aspects. It is voluntary in the sense that unemployed workers decline some opportunities to work. But it is involuntary in the sense that others with the same ability as the unemployed are working at wages the unemployed would be willing to accept. Segmented labor markets raise another possibility as well. Some of the unemployed may prefer low-wage jobs to being unemployed, but choose to remain unemployed in order to queue for high-wage jobs.
Any explanation of involuntary unemployment that relies on labor market segmentation must account for the differences in the wages of equally skilled workers in different industries. More specifically, it must explain why high-wage employers who face an excess supply of labor do not reduce wages. A convincing segmented-market interpretation of unemployment should also be able to explain why workers would choose to remain unemployed in order to wait for high-wage jobs, rather than wait while working at lower-paying positions. I take up these issues in turn.
There are three broad classes of explanations for the failure of high- wage employers to reduce their wages in the face of an excess supply of labor. The most obvious is that there are institutional impediments that make it impossible. Unions are one such impediment; regulations are
35. For arguments along the lines sketched here, see John R. Harris and Michael P. Todaro, "Migration, Unemployment and Development: A Two Sector Analysis," Amer- ican Economic Review, vol. 60 (March 1970), pp. 126-42; Robert E. Hall, "The Rigidity of Wages and the Persistence of Unemployment," BPEA, 2:1975, pp. 301-35; Ian M. McDonald and Robert M. Solow, "Wages and Employment in a Segmented Labor Market," Quarterly Journal of Economics, vol. 100 (November 1985), pp. 1115-41; and Jeremy I. Bulow and Lawrence H. Summers, "A Theory of Dual Labor Markets with Application to Industrial Policy, Discrimination, and Keynesian Unemployment," Journal of Labor Economics, vol. 4 (July 1986), pp. 376-414.
372 Brookings Papers on Economic Activity, 2:1986
another.36 But even in the absence of these institutions, there are substantial differentials in the wages different types of employers pay to similarworkers.37 A second class of explanations for wage differentials-- labeled efficiency wage theories-holds that firms find it profitable over some range to increase their wages even in the face of an excess supply of labor. By paying higher wages, firms enhance productivity through improved work-force morale, reduced turnover and hiring costs, and increased worker effort.38 A third class of explanations-insider-outsider theories-involves the notion of rent sharing between workers and firms. Because hiring and training new workers is costly, incumbent workers have leverage and so are able to capture a share of the rents that firms earn. Firms are therefore unable to reduce wages even in the face of an excess supply of labor. An important piece of evidence to this effect is that high-wage industries and high-wage firms tend to pay all types of workers high wages.39
All three classes of explanations for the failure of high-wage employers to reduce wages when labor supply is excessive support the plausibility of segmented labor markets and thus explain the existence of involuntary unemployment as I have defined it. But on the arguments developed so far, unemployment exists only because the unemployed prefer remaining unemployed to accepting work in low-wage industries. Given the general empirical finding that labor supply is relatively inelastic, it is unlikely
36. For the importance of regulation, see Hall, "The Rigidity of Wages"; for the effects of unions, see McDonald and Solow, "Wages and Employment."
37. This point has been recognized by institutional labor economists for many years. A recent review of the evidence on wage differentials may be found in Alan B. Krueger and Lawrence H. Summers, "Reflections on the Inter-industry Wage Structure," Working Paper 1968 (National Bureau of Economic Research, June 1986). Similar conclusions are reached in William Dickens and Lawrence Katz, "Industry and Occupational Wage Patterns and Theories of Wage Determination" (Harvard University, 1986).
38. Foran excellent summary of various efficiency wage theories and a strong argument for their relevance to macroeconomics, see Joseph E. Stiglitz, "Theories of Wage Rigidity," in James L. Butkiewicz, Kenneth J. Koford, and Jeffrey B. Miller, eds., Keynes' Economic Legacy: Contemporary Economic Theories (Praeger, 1986), pp. 153-206. For a survey of some of the relevant empirical literature, see Lawrence F. Katz, "Efficiency Wage Theories: A Partial Evaluation," in Stanley Fischer, ed., NBER Macroeconomics Annual 1986 (MIT, 1986), pp. 235-76.
39. This finding is reported by William Dickens and Lawrence Katz, "Interindustry Wage Differences and Industry Characteristics" (Harvard University, 1986); and by Erica Lynn Groshen, "Sources of Within Industry Wage Dispersion: Do Wages Vary By Employer?" (Ph.D. dissertation, Harvard University, 1986).

Lawrence H. Summers 373
that a large number of workers will be willing to work at high- but not low-wage jobs. A more compelling explanation of involuntary unem- ployment would explain why workers choose to forgo low-wage work in order to seek high-wage work.
In their paper on unemployment in less developed countries, Harris and Todaro offered a very plausible answer to this question. They explained that the high-wage jobs were in the city while the low-wage jobs were in rural areas. It was thus impossible to queue for a high-wage job while holding a low-wage job. The market equilibrated when unem- ployment in the city was sufficiently high and the chance of getting a high-wage job in the city sufficiently small that workers would opt for the certainty of a low-wage job in the country.
Such an explanation is not plausible for developed economies. Perhaps the most plausible explanation for what has been called "transitional unemployment" is that workers who have lost high-wage jobs find it difficult to accept their fate and so prefer remaining unemployed to acknowledging the permanence of their loss by taking a low-wage job.40 In a society where status is highly bound up with one's occupation, it is to be expected that workers who lose attractive high-wage jobs will be reluctant to accept lesserjobs.
Also, there are fixed costs for workers as well as firms in entering an employment relationship, so that workers who expect to return to high- wage jobs in a relatively short time may find it difficult or undesirable, or both, to take ajob at a low-wage firm. Something of this sort must lie behind firms' reluctance to hire "overqualified workers." The unem- ployed may also feel that accepting a low-wage job suggests to potential high-wage employers that they are not qualified for better jobs and so reduces their chance of getting them. Finally, in some circumstances it may be more efficient to search while remaining unemployed than while working.
While the idea of transitional unemployment can easily be criticized by pointing to the costs to workers of remaining unemployed, the empirical observation that total employment growth in a given state has only a very limited impact on unemployment does suggest that a theory
40. I borrow the term "transitional unemployment" from McDonald and Solow, "Segmented Labor Market." I use it to refer to the unemployment of workers transiting in both directions between the high- and low-wage sectors of the economy.
374 Brookings Papers on Economic Activity, 2:1986
of transitional unemployment is preferable to simple theories based on wage rigidities. If involuntary unemployment were caused by rigid wages, one would expect it to be sharply reduced by movements in the demand for labor, and thus employment, in a given state. The fact that it is not makes it worthwhile at least to explore labor supply aspects of the determination of unemployment. The empirical finding that reduc- tions in high-wage employment increase unemployment and that this impact is not easily offset by growth in low-wage employment suggests that the transitional unemployment suffered by persons losing high-wage jobs is significant.
UNIONS AND UNEMPLOYMENT
To understand the causes of the high and rising normal level of unemployment, it may be desirable to focus on the factors influencing the extent of "transitional unemployment." Without embracing any theory of the cause of transitional unemployment, the preceding discus- sion suggests that its extent is likely to be determined by the size of the wage differentials between high- and low-wage jobs, the availability of high-wagejobs, and the costs, pecuniary and nonpecuniary, of remaining unemployed. Although all these factors are difficult to quantify, it is a reasonable conjecture that in areas where the level of unionization is high, ceteris paribus, there should be more transitional unemployment. This is especially the case when, as in recent years, the economy is subjected to large intersectoral shocks. High and rising union wage premiums are likely to cause job losses in the unionized sector of the economy and also to make those who lose high-wagejobs more reluctant to accept alternative lower-wage employment. The empirical work presented in table 12 examines the conjecture that unions increase unemployment.
In investigating the relationship between unionization and unemploy- ment, the critical empirical problem is eliminating other factors that may be correlated with both. Most obviously, the high-wage sector of the economy tends to be more highly unionized than other parts of the economy and in recent years has suffered high unemployment. I address this issue in several ways. First, I estimate the relationship between unionization and both actual unemployment rates and the unemployment rates adjusted for changes in the composition of the labor force, as
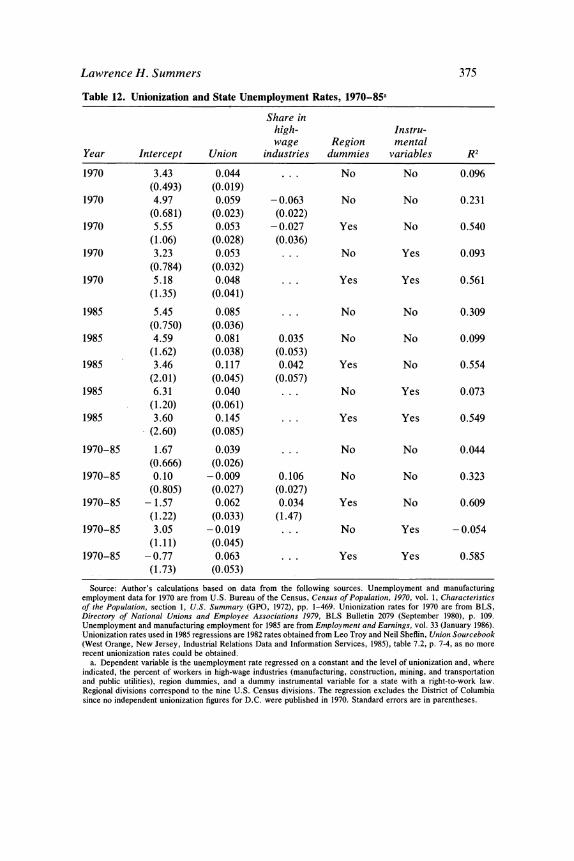
Lawrence H. Summers 375
Table 12. Unionization and State Unemployment Rates, 1970-85a
Share in high- Instru- wage Region mental
Year Intercept Union industries dummies variables R2
1970 3.43 0.044 ... No No 0.096 (0.493) (0.019)
1970 4.97 0.059 -0.063 No No 0.231 (0.681) (0.023) (0.022)
1970 5.55 0.053 -0.027 Yes No 0.540 (1.06) (0.028) (0.036)
1970 3.23 0.053 ... No Yes 0.093 (0.784) (0.032)
1970 5.18 0.048 ... Yes Yes 0.561 (1.35) (0.041)
1985 5.45 0.085 ... No No 0.309 (0.750) (0.036)
1985 4.59 0.081 0.035 No No 0.099 (1.62) (0.038) (0.053)
1985 3.46 0.117 0.042 Yes No 0.554 (2.01) (0.045) (0.057)
1985 6.31 0.040 ... No Yes 0.073 (1.20) (0.061)
1985 3.60 0.145 ... Yes Yes 0.549 (2.60) (0.085)
1970-85 1.67 0.039 ... No No 0.044 (0.666) (0.026)
1970-85 0.10 -0.009 0.106 No No 0.323 (0.805) (0.027) (0.027)
1970-85 -1.57 0.062 0.034 Yes No 0.609 (1.22) (0.033) (1.47)
1970-85 3.05 -0.019 ... No Yes - 0.054 (1.11) (0.045)
1970-85 -0.77 0.063 ... Yes Yes 0.585 (1.73) (0.053)
Source: Author's calculations based on data from the following sources. Unemployment and manufacturing employment data for 1970 are from U.S. Bureau of the Census, Census of Population, 1970, vol. 1, Characteristics of the Population, section 1, U.S. Summary (GPO, 1972), pp. 1-469. Unionization rates for 1970 are from BLS, Directory of National Unions and Employee Associations 1979, BLS Bulletin 2079 (September 1980), p. 109. Unemployment and manufacturing employment for 1985 are from Employment and Earnings, vol. 33 (January 1986). Unionization rates used in 1985 regressions are 1982 rates obtained from Leo Troy and Neil Sheflin, Union Sourcebook (West Orange, New Jersey, Industrial Relations Data and Information Services, 1985), table 7.2, p. 7-4, as no more recent unionization rates could be obtained.
a. Dependent variable is the unemployment rate regressed on a constant and the level of unionization and, where indicated, the percent of workers in high-wage industries (manufacturing, construction, mining, and transportation and public utilities), region dummies, and a dummy instrumental variable for a state with a right-to-work law. Regional divisions correspond to the nine U.S. Census divisions. The regression excludes the District of Columbia since no independent unionization figures for D.C. were published in 1970. Standard errors are in parentheses.
376 Brookings Papers on Economic Activity, 2:1986
described earlier. Because the results are broadly similar for the two concepts and because data on official unemployment are available over alonger time span, only results using official unemployment are reported. Second, in several of the specifications reported in table 12, I control for the share of the high-wage sector (or alternatively the share of manufac- turing) in total employment and for regions in estimating the effect of unionization on unemployment. Third, I treat unionization as endoge- nous and use the presence or absence of a right-to-work law as an instrument. Nineteen states have such laws, almost all of which were put in place before 1960, so it is plausible to take the presence of a right- to-work law as exogenous. A number of investigators have found that right-to-work laws have a significant effect on union coverage.41
The results in table 12 support several conclusions. First, there is a clear and substantively significant impact of unionization on state unemployment rates. The estimates for 1985, controlling for both the region and the share of employment in high-wage industries, suggest that an increase of 10 percentage points in a state's unionization rate increases its unemployment rate by 1.2 percentage points. Because there are substantial regional differences in the degree of unionization (in 1982, Texas, with 12.5 percent of its work force unionized, was the fortieth most unionized state, while Pennsylvania, with 27.0 percent, ranked tenth), those differences can account for quantitatively important re- gional variations in the extent of unemployment. Second, there is suggestive evidence that the impact of unionization on unemployment has increased over time. The estimated equation for the change in unemployment between 1970 and 1985, holding constant the high-wage share of employment and region, suggests that a state with a 20 percent unionization rate, approximately the sample average, experienced an increase in unemployment of 1.2 percentage points relative to a hypo- thetical state that had no unions. In this sense, a significant part of the observed increase in normal unemployment in recent years may be attributed to the effects of unions.42
41. See, for example, Henry S. Farber, "Right-to-Work Laws and the Extent of Unionization," Journal of Labor Economics, vol. 2 (July 1984), pp. 319-52.
42. The increase is partially offset by the decline in union coverage of about4 percentage points between 1970 and 1982. The coefficient estimates for 1985 imply that the decline in union membership reduced the unemployment rate by about 0.5 percentage point. Of course, to the extent that union coverage declined because union members were laid off, the decline in union membership may, over a long transition period, actually have further increased unemployment.
Lawrence H. Summers 377
In their widely read book What Do Unions Do?, Richard Freeman and James Medoff estimate that highly unionized states have on average an unemployment rate that is 1 percentage point higher than that of "low" union states.43 That finding parallels the one reported here. But they report being unable to find any relationship between unionization and the fraction of the population employed in a state, and they infer from that that unions may draw workers into the labor force but that they do not reduce employment. My own findings differ. Table 13 reports estimates of the impact of unionization on the employment ratio. While the impact is estimated less precisely than the impact of unionization on the state unemployment rates in table 12, the results strongly corroborate the conclusions reached using unemployment data. In fact, in most specifications, the impact of unionization on the employment ratio is greater than its impact on the unemployment rate. For example, when the region and the share of employment in high-wage industries are controlled for, the data suggest that in 1985 an increase of 10 percentage points in the fraction of the work force that was unionized would reduce the employment ratio by almost 4 percent. Likewise, in most but not all specifications, the impact of unionization on the employment ratio increased by more between 1970 and 1985 than did the impact of unionization on unemployment.
In results not reported here, I have explored the robustness of these conclusions in a number of ways. First, I have estimated the relationship between unionization, unemployment, and the employment ratio using data for every year between 1970 and 1985. The data confirm the upward trend in the impact of unionization. In fact, the trend appears more dramatic when results for the early 1970s are compared with those for the early 1980s. Second, I have estimated the effects of unions on unemployment rates separately for male and female workers. The results indicate that unions have a somewhat greater impact on male unemploy- ment. Third, I have reestimated the equations after combining smaller states into larger units as was done by the CPS in the early 1970s. The reestimate has little impact on the results. Further corroboration for the conclusions reached here comes from the work of other investigators using data on metropolitan areas rather than states. For example, Edward Montgomery, using data on forty-four standard metropolitan statistical
43. Richard Freeman and James Medoff, What Do Unions Do? (Basic Books, 1984), pp. 120-21.
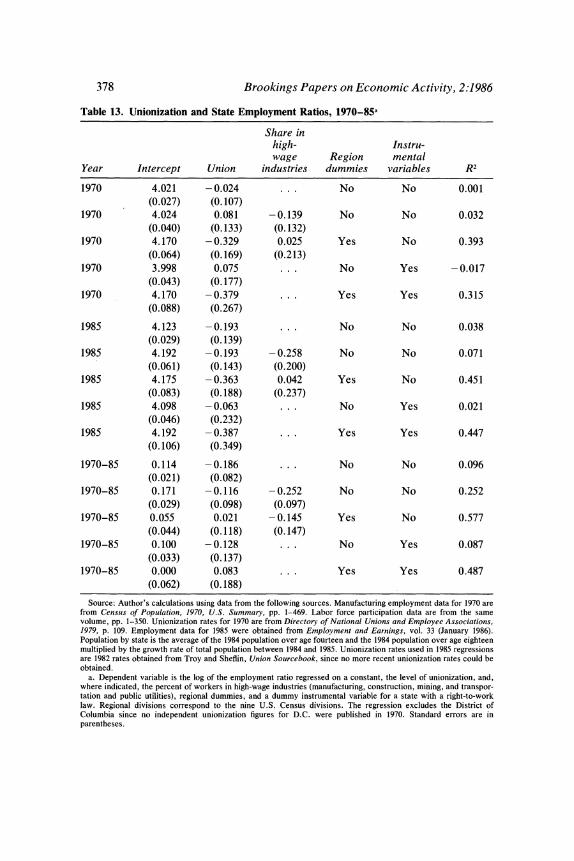
378 Brookings Papers on Economic Activity, 2:1986
Table 13. Unionization and State Employment Ratios, 1970-85a
Share in high- Instru- wage Region mental
Year Intercept Union industries dummies variables R2
1970 4.021 -0.024 ... No No 0.001 (0.027) (0.107)
1970 4.024 0.081 -0.139 No No 0.032 (0.040) (0.133) (0.132)
1970 4.170 -0.329 0.025 Yes No 0.393 (0.064) (0.169) (0.213)
1970 3.998 0.075 ... No Yes -0.017 (0.043) (0.177)
1970 4.170 -0.379 ... Yes Yes 0.315 (0.088) (0.267)
1985 4.123 -0.193 ... No No 0.038 (0.029) (0.139)
1985 4.192 -0.193 -0.258 No No 0.071 (0.061) (0.143) (0.200)
1985 4.175 -0.363 0.042 Yes No 0.451 (0.083) (0.188) (0.237)
1985 4.098 -0.063 ... No Yes 0.021 (0.046) (0.232)
1985 4.192 -0.387 ... Yes Yes 0.447 (0.106) (0.349)
1970-85 0.114 -0.186 ... No No 0.096 (0.021) (0.082)
1970-85 0.171 -0.116 -0.252 No No 0.252 (0.029) (0.098) (0.097)
1970-85 0.055 0.021 -0.145 Yes No 0.577 (0.044) (0.118) (0.147)
1970-85 0.100 -0.128 ... No Yes 0.087 (0.033) (0.137)
1970-85 0.000 0.083 ... Yes Yes 0.487 (0.062) (0.188)
Source: Author's calculations using data from the following sources. Manufacturing employment data for 1970 are from Census of Population, 1970, U.S. Summary, pp. 1-469. Labor force participation data are from the same volume, pp. 1-350. Unionization rates for 1970 are from Directory of National Unions and Employee Associations, 1979, p. 109. Employment data for 1985 were obtained from Employment and Earnings, vol. 33 (January 1986). Population by state is the average of the 1984 population over age fourteen and the 1984 population over age eighteen multiplied by the growth rate of total population between 1984 and 1985. Unionization rates used in 1985 regressions are 1982 rates obtained from Troy and Sheflin, Union Sourcebook, since no more recent unionization rates could be obtained.
a. Dependent variable is the log of the employment ratio regressed on a constant, the level of unionization, and, where indicated, the percent of workers in high-wage industries (manufacturing, construction, mining, and transpor- tation and public utilities), regional dummies, and a dummy instrumental variable for a state with a right-to-work law. Regional divisions correspond to the nine U.S. Census divisions. The regression excludes the District of Columbia since no independent unionization figures for D.C. were published in 1970. Standard errors are in parentheses.
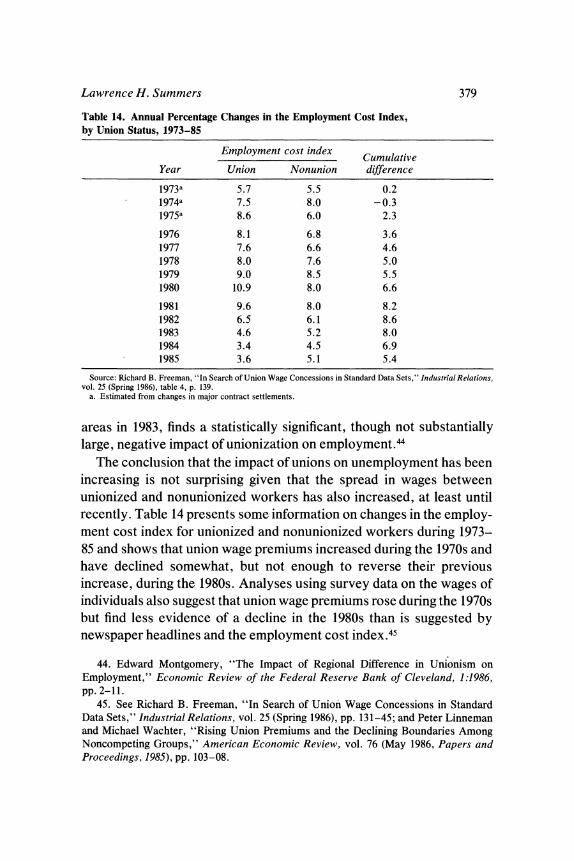
Lawrence H. Summers 379
areas in 1983, finds a statistically significant, though not substantially large, negative impact of unionization on employment."4
The conclusion that the impact of unions on unemployment has been increasing is not surprising given that the spread in wages between unionized and nonunionized workers has also increased, at least until recently. Table 14 presents some information on changes in the employ- ment cost index for unionized and nonunionized workers during 1973- 85 and shows that union wage premiums increased during the 1970s and have declined somewhat, but not enough to reverse their previous increase, during the 1980s. Analyses using survey data on the wages of individuals also suggest that union wage premiums rose during the 1970s but find less evidence of a decline in the 1980s than is suggested by newspaper headlines and the employment cost index.45
Table 14. Annual Percentage Changes in the Employment Cost Index, by Union Status, 1973-85
Employment cost index Cumulative Year Union Nonunion difference
1973a 5.7 5.5 0.2 1974a 7.5 8.0 -0.3 1975a 8.6 6.0 2.3
1976 8.1 6.8 3.6 1977 7.6 6.6 4.6 1978 8.0 7.6 5.0 1979 9.0 8.5 5.5 1980 10.9 8.0 6.6
1981 9.6 8.0 8.2 1982 6.5 6.1 8.6 1983 4.6 5.2 8.0 1984 3.4 4.5 6.9 1985 3.6 5.1 5.4
Source: Richard B. Freeman, "In Search of Union Wage Concessions in Standard Data Sets," Industrial Relations, vol. 25 (Spring 1986), table 4, p. 139.
a. Estimated from changes in major contract settlements.
44. Edward Montgomery, "The Impact of Regional Difference in Unionism on Employment," Economic Review of the Federal Reserve Bank of Cleveland, 1:1986, pp.2-11.
45. See Richard B. Freeman, "In Search of Union Wage Concessions in Standard Data Sets," Industrial Relations, vol. 25 (Spring 1986), pp. 131-45; and Peter Linneman and Michael Wachter, "Rising Union Premiums and the Declining Boundaries Among Noncompeting Groups," American Economic Review, vol. 76 (May 1986, Papers and Proceedings, 1985), pp. 103-08.
380 Brookings Papers on Economic Activity, 2:1986
The coincidence of rising union wage premiums and an increasing impact of unionization on state unemployment rates, along with the widely observed decline in employment growth in unionized firms, makes it plausible that union power has accounted for a significant part of the increase in normal unemployment in recent years. The fact that the loss of unionized jobs resulted in increased unemployment despite the rapid creation of jobs in the low-wage service sector provides some support for the "transitional" theory of unemployment advocated here.
FURTHER EVIDENCE ON TRANSITIONAL UNEMPLOYMENT
The discussion so far suggests that increasing union wage premiums during the 1970s contributed to the rising rate of normal unemployment by causing an increase in transitional unemployment. Transitional un- employment is a likely concomitant of any increase in the importance of noncompetitive wage differentials, whether caused by unions or by the efficiency wage and rent sharing considerations discussed above.
Table 15, which is drawn from the work of Linda Bell and Richard Freeman, presents several different estimates of the extent of wage dispersion in the economy during 1970-85. Each of the measures indicates that wage dispersion has increased.46 Rising wage dispersion does not necessarily indicate an increase in the importance of noncom- petitive wage differentials. It could occur because increases in the demand for labor in high-wage industries moved firms along upward- sloping short-run labor supply curves. However, using several different data sources, Bell and Freeman find that the correlation across industries between employment growth and wage growth over the decade of the 1970s was negative, which suggests that shocks in the wage-setting process that moved firms along their labor demand curves predominated. Without invoking the considerations leading to labor market segmenta- tion, noted above, it is difficult to account for these shocks.
It is likely that efficiency wage or rent-sharing considerations led to increases in noncompetitive wage differentials during the 1970s. This inference is supported by evidence that the gap between the wages paid by small firms and those paid by large firms increased during the 1970s
46. LindaAnnBellandRichardB. Freeman, "DoesaFlexible Industry Wage Structure Increase Employment?: The U.S. Experience," in Linda Ann Bell, "Essays on Labor Market Efficiency" (Ph.D. dissertation, Harvard University, May 1986).
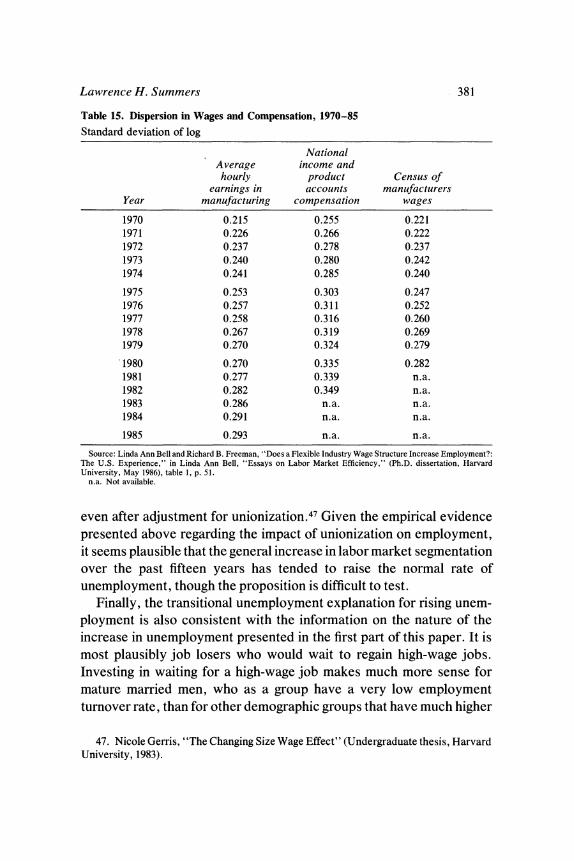
Lawrence H. Summers 381
even after adjustment for unionization.47 Given the empirical evidence presented above regarding the impact of unionization on employment, it seems plausible that the general increase in labor market segmentation over the past fifteen years has tended to raise the normal rate of unemployment, though the proposition is difficult to test.
Finally, the transitional unemployment explanation for rising unem- ployment is also consistent with the information on the nature of the increase in unemployment presented in the first part of this paper. It is most plausibly job losers who would wait to regain high-wage jobs. Investing in waiting for a high-wage job makes much more sense for mature married men, who as a group have a very low employment turnover rate, than for other demographic groups that have much higher
Table 15. Dispersion in Wages and Compensation, 1970-85 Standard deviation of log
National Average income and
hourly product Census of earnings in accounts manufacturers
Year manufacturing compensation wages
1970 0.215 0.255 0.221 1971 0.226 0.266 0.222 1972 0.237 0.278 0.237 1973 0.240 0.280 0.242 1974 0.241 0.285 0.240
1975 0.253 0.303 0.247 1976 0.257 0.311 0.252 1977 0.258 0.316 0.260 1978 0.267 0.319 0.269 1979 0.270 0.324 0.279
1980 0.270 0.335 0.282 1981 0.277 0.339 n.a. 1982 0.282 0.349 n.a. 1983 0.286 n.a. n.a. 1984 0.291 n.a. n.a.
1985 0.293 n.a. n.a.
Source: Linda Ann Bell and Richard B. Freeman, "Does a Flexible Industry Wage Structure Increase Employment?: The U.S. Experience," in Linda Ann Bell, "Essays on Labor Market Efficiency," (Ph.D. dissertation, Harvard University, May 1986), table 1, p. 51.
n.a. Not available.
47. Nicole Gerris, "The Changing Size Wage Effect" (Undergraduate thesis, Harvard University, 1983).
382 Brookings Papers on Economic Activity, 2:1986
turnover rates. Persons losing high-wage jobs are most likely to experi- ence protracted spells of unemployment. Sectoral shocks leading to the loss of high-wage jobs would also lead to plant shutdowns, reducing capacity and thereby raising capacity utilization. In addition, sectoral shocks that hit at high-wage industries could easily account for the change in the vacancies-unemployment relationship, if job losers were reluctant to accept low-wage employment in expanding sectors.
Conclusions
The analysis in this paper suggests that the rise in normal unemploy- ment over the past twenty years represents a serious problem. The additional unemployment is concentrated among mature married men who have lost jobs and are likely to be out of work for periods of six months or more. Increased unemployment cannot be convincingly dismissed as the consequence of marginal labor force attachment or measurement problems in the CPS. Nor is it simply the result of cyclical weakness in the economy. Persistently high unemployment has coin- cided with relatively high vacancy and capacity utilization rates.
These conclusions have important implications for economic policy. First, they suggest that while high unemployment is a serious problem, expansionary aggregate demand policies are unlikely to be able to reduce it to the levels of the 1950s and 1960s without creating excessive inflationary pressures, unless they reverse the structural changes that have taken place in recent years. Increased union wage premiums and wage dispersion more generally mean that in equilibrium more people will lose high-wage jobs and choose to remain unemployed longer than was previously the case. The latter effect is magnified by the increasing tendency for the unemployed to be in families with other working members. Between 1977 and 1985, the share of unemployed married males who had another family member working full time increased from 37.4 percent to 43.6 percent.
Second, while expansionary policies are not likely to reduce the equilibrium unemployment rate, stable fiscal and monetary policies can probably make a significant contribution. Since workers losing high- wage jobs are the ones most likely to choose transitional unemployment
Lawrence H. Summers 383
over taking a low-wage job, policies that temporarily contract the high- wage sector of the economy are likely to create structural unemployment. There may be important asymmetries between the effects of expansion- ary and contractionary policies. Policies that hurt the high-wage sector may create much more transitional unemployment than policies that promote it can alleviate if new high-wage jobs are taken by workers other than those previously laid off.
The recent fiscal-monetary mix and the associated squeeze on the high-wage manufacturing sector are instructive. When the manufactur- ing sector is squeezed, unemployment increases sharply as those who lose jobs wait to get them back. The eventual abnormal increase in manufacturing output that will be necessary to service the trade debt the United States is now incurring is unlikely to reduce unemployment by as much as the contraction increased it.

Comments and Discussion
Katharine G. Abraham: Lawrence Summers argues two main points. First, the bulk of the increase in "normal" U.S. unemployment since the mid-1960s cannot be attributed simply to shifts in the demographic composition of the work force, but has been concentrated among mature men who lose their jobs and experience extended spells of unemploy- ment. Second, this increase in mature male unemployment has resulted in large part from high and growing noncompetitive wage differentials, which have contributed to employment declines in the high-wage sectors in the face of demand shocks and led those who lose high-wage jobs to hold out longer in hopes of getting their old jobs back.
Let me start with Summer's "stylized facts" regarding the decom- position of the observed increase in the U.S. unemployment rate. It is true that no more than a small part of the observed increase in the U.S. unemployment rate between 1965 and 1985 can be attributed simply to shifts in the demographic composition of the labor force towards more unemployment-prone workers. However, Summers's suggestion that the increasing level of educational attainment among labor force participants has actually worked to decrease the unemployment rate is open to question. Not having more than an eighth-grade education or having a college degree both obviously mean something very different for today's new entrants than for the cohorts that are currently retiring. Relative educational attainment within an age cohort probably does affect em- ployment prospects; relative educational attainment across age cohorts is unlikely to matter in the same way.
Having rejected the idea that demographic shifts in the composition of the labor force can explain the growth in unemployment, Summers considers how the increase in unemployment has been distributed across
384
Lawrence H. Summers 385
the labor force. He emphasizes the fact that, over the 1965 to 1985 period taken as a whole, there have been larger cumulative increases in unemployment among mature men than among other groups. What he does not emphasize is that the pattern of unemployment growth looked very different prior to the late 1970s than it has since then. This is important, because it means that no single explanation for the upward drift in U.S. unemployment, including Summers's explanation, is likely to apply to the entire 1965 to 1985 period.
Summers's tables 4 and 5 show that increases in unemployment between 1978 and 1985 were relatively larger for men aged thirty-five to forty-four and for married men than for other groups and that the share of unemployment attributable to job losers and to those experiencing long spells of unemployment rose. But between 1965 and 1974, the largest increases in unemployment occurred among young men, young women, and older women; men aged thirty-five to forty-four experienced virtually no change in their unemployment rate, and the unemployment rates for older men actually fell. Between 1974 and 1978, the increase in unemployment was spread relatively evenly across age-sex groups. The statistics on unemployment by marital status group show a similar pattern: only during the 1978 to 1985 period do married men and divorced, separated, and widowed men fare relatively worse than other groups. Data on unemployment by reason-job losers, job leavers, and so on- are not available before 1967, but the data on the distribution of unemployment show that long-term unemployment became dramatically more important only beginning in 1978.
Because using any particular years for such an assessment may be misleading, I have examined some of these trends using annual data. My table 1 reports annual unemployment rates since 1954 for men aged thirty-five to forty-four and for married men. These unemployment rates were strikingly stable up until the last few years. Regressions of the two mature male unemployment rates on a constant, a time trend, and the overall unemployment rate are summarized in my table 2. These models bear on the question of whether mature males' unemployment rates have in fact risen more rapidly than the unemployment rates of other groups, as Summers has asserted. Looking at the model for the entire 1954 to 1985 period, the answer to that question would appear to be a simple "no." However, fitting separate subperiod models indicates that mature men's unemployment actually trended downwards relative to overall

386 Brookings Papers on Economic Activity, 2:1986
unemployment through the late 1970s, though it may have risen relative to overall unemployment since then. Significantly, the coefficients in the earlier subperiod model are quite robust to changes in both the starting year and the ending year used to estimate the model.
Table 1. Aggregate and Mature Male Unemployment Rates, 1954-85
Unemployment rate
Males aged Married
Year 35-44 malesa Aggregate
1954 4.1 n.a. 5.5 1955 3.1 2.6 4.4
1956 2;6 2.3 4.1 1957 2.8 2.8 4.3 1958 5.1 5.1 6.8 1959 3.7 3.6 5.5 1960 3.8 3.7 5.5
1961 4.6 4.6 6.7 1962 3.6 3.6 5.5 1963 3.5 3.4 5.7 1964 2.9 2.8 5.2 1965 2.6 2.4 4.5
1966 2.0 1.9 3.8 1967 1.7 1.8 3.8 1968 1.6 1.6 3.6 1969 1.5 1.5 3.5 1970 2.4 2.6 4.9
1971 3.1 3.2 5.9 1972 2.7 2.8 5.6 1973 2.0 2.3 4.9 1974 2.6 2.7 5.6 1975 4.9 5.1 8.5
1976 4.1 4.2 7.7 1977 3.5 3.6 7.0 1978 2.8 2.8 6.0 1979 2.9 2.8 5.8 1980 4.1 4.2 7.1
1981 4.5 4.3 7.6 1982 6.9 6.5 9.7 1983 7.1 6.5 9.6 1984 5.2 4.6 7.5 1985 4.9 4.3 7.2
Source: U.S. Department of Labor, Bureau of Labor Statistics, Handbook of Labor Statistics, Bulletin 2217 (June 1985), and BLS, Employment and Earnings, vol. 33 (January 1986).
n.a. Not available. a. Data for married males start in 1955.
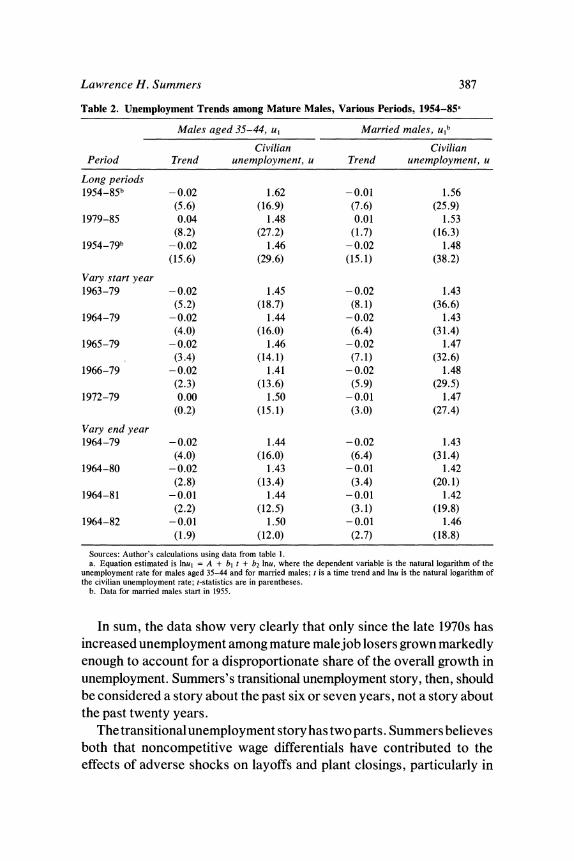
Lawrence H. Summers 387
In sum, the data show very clearly that only since the late 1970s has increased unemployment among mature malejob losers grown markedly enough to account for a disproportionate share of the overall growth in unemployment. Summers's transitional unemployment story, then, should be considered a story about the past six or seven years, not a story about the past twenty years.
The transitional unemployment story has two parts. Summers believes both that noncompetitive wage differentials have contributed to the effects of adverse shocks on layoffs and plant closings, particularly in
Table 2. Unemployment Trends among Mature Males, Various Periods, 1954-85a
Males aged 35-44, u1 Married males, Ulb
Civilian Civilian Period Trend unemployment, u Trend unemployment, u
Long periods 1954-85b -0.02 1.62 -0.01 1.56
(5.6) (16.9) (7.6) (25.9) 1979-85 0.04 1.48 0.01 1.53
(8.2) (27.2) (1.7) (16.3) 1954-79b -0.02 1.46 -0.02 1.48
(15.6) (29.6) (15.1) (38.2)
Vary start year 1963-79 -0.02 1.45 - 0.02 1.43
(5.2) (18.7) (8.1) (36.6) 1964-79 -0.02 1.44 -0.02 1.43
(4.0) (16.0) (6.4) (31.4) 1965-79 -0.02 1.46 -0.02 1.47
(3.4) (14.1) (7.1) (32.6) 1966-79 -0.02 1.41 - 0.02 1.48
(2.3) (13.6) (5.9) (29.5) 1972-79 0.00 1.50 -0.01 1.47
(0.2) (15.1) (3.0) (27.4)
Vary end year 1964-79 -0.02 1.44 -0.02 1.43
(4.0) (16.0) (6.4) (31.4) 1964-80 -0.02 1.43 -0.01 1.42
(2.8) (13.4) (3.4) (20.1) 1964-81 -0.01 1.44 -0.01 1.42
(2.2) (12.5) (3.1) (19.8) 1964-82 -0.01 1.50 -0.01 1.46
(1.9) (12.0) (2.7) (18.8)
Sources: Author's calculations using data from table 1. a. Equation estimated is Inul = A + b, t + b2 Inu, where the dependent variable is the natural logarithm of the
unemployment rate for males aged 35-44 and for married males; t is a time trend and Inu is the natural logarithm of the civilian unemployment rate; t-statistics are in parentheses.
b. Data for married males start in 1955.
388 Brookings Papers on Economic Activity, 2:1986
the union sector, and that widening wage differentials have led recently displaced workers to choose to remain unemployed longer than they would otherwise have done. Summers is less explicit than he might have been concerning the respective roles played by demand factors per se versus noncompetitive wage differentials in swelling the flows of laid-off workers into unemployment in recent years. However, it is plausible that wage rigidity in the high-wage sectors has contributed to job loss in those sectors. I find it less plausible that reduced willingness on the part of today's displaced workers to accept alternate employment has been a significant factor in raising the unemployment rate.
One reason for my skepticism regarding this second part of Summers's transitional unemployment story is that I find it hard to believe that most unemployed mature men, particularly unemployed married men, are really in a position to wait very long for good jobs. While I don't want to make too much of anecdotal evidence, General Motors' experience with its Guaranteed Income Stream (GIS) program comes to mind here. Under that program, high-seniority laid-off workers are entitled to a guaranteed income until they reach retirement age. The condition attached to the guarantee is that if offered a job at another GM plant, even ajob halfway across the country, the laid-off worker must accept it. The jobs are not necessarily attractive: the worker who moves starts over at the bottom of the plant seniority ladder, which may mean working the night shift, performing an onerous task, and being vulnerable to temporary layoff. According to Al Warren, GM's Vice-President for Industrial Relations, married men almost always accept offered jobs rather than lose their GIS eligibility, whereas single men are more likely to turnjobs down. His interpretation: married men simply cannot afford to be without ajob, even if it is a worse job than they held before.
Statistics on growth in the union-nonunion wage differential and in cross-industry wage differentials are the main evidence underlying Summers's view that the unemployed now have reason to hold out longer in hopes of getting their old jobs back. But the data on the union compensation premium in table 14 imply that while the union premium did grow substantially from the early 1970s through 1982, by 1985 it had fallen back to its 1978 level. Similarly, the Bell and Freeman data in table 15 show that cross-industry wage dispersion grew rapidly before 1978, but less rapidly between 1978 and 1985. Thus, the data do not offer strong support for the view that the relative attractiveness of union jobs
Lawrence H. Summers 389
or high-wage-industry jobs increased substantially over the 1978 to 1985 period during which mature male unemployment has risen.
It should also be noted that neither growth in the union-nonunion wage differential nor growth in the dispersion of average wages across industries necessarily implies an increase in the dispersion of wage offers available to unemployed workers, as would be necessary for standard search models to predict an increase in the duration of unemployment. Any conclusion regarding the dispersion of wages among individuals requires knowing something both about the relative wages in different sorts ofjobs and about the relative shares of employment in those jobs. All else the same, if the share of employment in high-wage jobs shrinks and the share of employment in average-wage jobs rises, overall wage dispersion will tend to fall. Over the same periods that increases in union- nonunion and cross-industry wage differentials have occurred, the union share of total employment fell, and the high-wage industries where wage growth was most rapid experienced below-average or even negative employment growth. Without more information, it is impossible to say what the net effect on overall wage dispersion was. But some added information is available. James Medoff has looked at the dispersion of hourly wage rates using Current Population Survey data for the period 1973 to 1984. He finds no increase in the dispersion of hourly wages among individuals. ' Thus, even if it can be assumed that increases in the dispersion of wages paid to employed workers translate into increased dispersion of the wage offers made to the unemployed, the evidence does not establish that any such increase has occurred.
All in all, I am more prepared to believe that the recent increase in mature male unemployment reflects increases in the numbers of dis- placed workers than that it reflects on increased propensity of those displaced workers to hold out in hopes of getting their old jobs back.
Michael L. Wachter: Lawrence Summers has done an admirablejob of describing the current pattern of unemployment. Overall I agree with his diagnoses of the problem. In my comments I want to discuss four aspects of the Summers paper: whether the economy is indeed near full
1. James L. Medoff, "The Structure of Hourly Earnings Among U.S. Private Sector Employees: 1973-1984" (Harvard University, December 1984).
390 Brookings Papers on Economic Activity, 2:1986
employment; the appropriate adjustments to the unemployment rate based on labor supply considerations; the impact of noncompetitive wages on "wait" unemployment; and the policy implications of the research findings.
The first issue is the assumption in the title of the paper that the economy is "near" full employment at 7 percent. Although Summers offers some evidence that is suggestive of a nonaccelerating inflation rate of unemployment (NAIRU) of 7 percent, the evidence is decidedly mixed, and Summers seems unwilling to take a strong stand on the issue. For example, he mentions that the traditional approach of solving a wage inflation equation for the unemployment rate consistent with stable inflation does not lead to robust equilibrium unemployment rates. Based on his evidence, a reader (such as myself) who believed that the NAIRU was 6 percent rather than 7 percent would not be convinced to change his view of the matter.
Whether the economy's NAIRU is as low as 6 percent, or as high as 7 percent, is important to Summers's interpretation of the evidence. If we are near full employment, then it is legitimate to compare 1985 with earlier full-employment years such as 1965 and 1978. In addition, the composition of the current pool of unemployed can be interpreted as representing structural rather than cyclical problems, and the change from 1965 to 1985 can be studied as reflecting long-term structural trends in the unemployment problem.
The strongest evidence that the economy is not at its NAIRU is the trend in wage and price inflation rates. Recent growth rates of wage and price are at levels not experienced since the early 1960s and, more important, there is little evidence that inflation rates are about to increase. For example, the rate of increase of average hourly earnings (AHE) is now below 3 percent on an annual basis. That measure of core inflation was 6.9 percent in 1982 and then declined annually to 4.9 in 1983, 3.2 in 1984, 3.0 in 1985, and 2.6 percent for the four quarters ending with the second quarter of 1986. The AHE current rate of wage growth may be artificially depressed because of compositional shifts in the economy, but even after those shifts are corrected for, the conclusion is that the labor market is slack. The employment cost index, which is less subject to compositional bias, is increasing at a rate closer to 4 than to 3 percent, and here again the 1985-86 trend has been down rather than up.
Adding to the evidence that the economy is not at NAIRU is the fact
Lawrence H. Summers 391
that the unemployment rate has also been declining slowly along with wage growth rates. Near full employment one might expect that the movement up the short-run Phillips curve would offset any downward shift in that relationship due to the lag in the adjustment of inflation expectations. That is, near full employment one might anticipate that even slowly declining unemployment rates would result in at least stable, and probably increasing, core rates of inflation. But this is not yet happening.
If the economy's NAIRU is 6 rather than 7 percent, then there is a substantial amount of cyclical unemployment left in the economy. The point is important since individuals in different age-sex, education, and industry categories experience different percentage point improvements when the economy makes its final approach to NAIRU. Hence Sum- mers' s conclusions with respect to which groups have suffered increased unemployment rates since 1965 might reflect the remaining cyclical gap rather than structural forces.
Putting aside the NAIRU issue, I believe that Summers makes an important contribution interpreting today's structural unemployment. His interpretation is based on supply-side characteristics of the labor force and the related importance of the growth in "wait" unemployment.
Summers argues that earlier attempts, including my own, to adjust for demographic factors were too focused on age-sex differences in unemployment and ignored other important differences, such as educa- tional attainment. If unemployment differs among groups with different levels of education, industry of employment, or marital status, the omission of those factors results in a biased correction for age-sex effects.
In defense of earlier adjustments, I note that the youth unemployment problem of the 1970s was reasonably well approximated by controlling for age and sex. In 1979, for example, one-half of the unemployed were young workers between the ages of sixteen and twenty-four. Distinctions based on marital status and educational attainment add little insight and might even introduce a bias. Youths are always disproportionately unmarried, not divorced, and, especially in the case of teenagers, characterized by a low level of educational attainment. Hence, interac- tion variables between those characteristics and age are important, and their exclusion also poses omitted variable problems. In the 1970s it was difficult to decipher whether changes in those rates reflected short-run
392 Brookings Papers on Economic Activity, 2:1986
age-based demographic effects or longer-run effects that would prove independent of age. Now that youth unemployment is declining, there is more support for including those other variables based on the belief that trends in those rates are not driven by age factors.
Summers's analysis indicates that shifts in unemployment by marital status are an important part of the structural story. I believe that this is correct but that the underlying mechanism is marital status in conjunction with the number of wage earners in a family. It is certainly the case that the number of families with two wage earners has been increasing, and search theory implies that these families should have higher rates of unemployment. Similarly, single-parent, female-headed families are likely to experience high unemployment incidence because of frequent transition into and out of the labor force. Unfortunately, the quantitative importance of these factors is difficult to test given the available data.
With respect to labor supply corrections, Summers argues that earlier age-sex adjustments in estimating NAIRU should result in a finding of a lower NAIRU today. Hence if NAIRU today is 7 percent, then those corrections can be presumed to be incorrect. But this conclusion assumes that the economy has returned to full employment, a point that is not proved in the paper. My own recent work does suggest that youth unemployment in particular has been declining relative to adult rates. If the current NAIRU is 6 percent, then adjusting for the GNP cyclical gap results in youth unemployment rates lower than their 1978 full-employ- ment levels. The one important exception to this conclusion is black males aged eighteen to twenty-four.
I agree strongly with Summers's arguments concerning the impor- tance of union wage differentials in causing unemployment. Although Summers refers to this type of unemployment as transitional unemploy- ment, it is useful to use the term "wait" unemployment. Whereas transitional unemployment can represent almost any form of frictional or structural unemployment, the labor economics literature uses the wait unemployment terminology to refer to that unemployment that arises from the rationing of high-wage jobs in a non-market-clearing sector. Summers's conclusions with respect to the impact of noncom- petitive wages on unemployment support my current research with Peter Linneman.
In calculating a cross-sectional time series of union wage premiums for each year between 1973 and 1984, Linneman and I found that union
Lawrence H. Summers 393
wage premiums increased strongly during the late 1970s and early 1980s, often by as much as 50 percent over the period. We then used the estimated industry-union premiums as explanatory variables in a second- stage cross-sectional time series regression to explain changes in union- nonunion shares of employment. The results from this second-stage equation show a quantitatively large and statistically significant impact of industry-union premiums on employment shares. These results across industries support Summers's findings where the data base is across states.
Although the evidence supports the contention that noncompetitive wage differentials cause wait unemployment, it does not tell us whether the problem is likely to prove long lasting or transitional. Although Summers may be tilting toward the long-lasting nature of the problem, a case can be made that it is transitional.
Whether one waits for a job with a noncompetitive wage or quickly accepts a competitive wage depends not only on the size of the wage differential but also on the probability of being hired and receiving that wage premium job. In the 1970s wait unemployment was concentrated among young or entry-level workers who could expect some turnover in noncompetitive high-wage public service jobs and, to a lesser extent, in union jobs. There was good incentive to look for those jobs, either because they were funded by the government and relatively insensitive to economic conditions or because the union sector's structural problem had not yet emerged across a broad range of industries.
In other words, during the 1970s the probability of finding ajob with a noncompetitive wage was higher than it has been in the 1980s. More specifically, the probability of a successful wait was high enough to encourage waiting on the part of the new entrant group or those unemployed from nonpremium wage jobs. During the 1980s, the proba- bility of landing such ajob has been declining. Those who have lost such ajob might still be expected to wait in hope of landing a new job. In any cyclical bounce they might be recalled. Moreover, the process of adjusting one's reservation wage downward takes time. But new entrants or workers employed elsewhere are unlikely to be attracted to the queue. Their probability of finding ajob in the declining union sector is simply too low.
My final comment concerns Summers's short section covering his policy conclusions. The Summers paper concludes with the recommen-
394 Brookings Papers on Economic Activity, 2:1986
dation that rising rates of adult male unemployment, although a problem, should not be addressed by expansionary monetary and fiscal policies. Although the paper is silent on whether rising adult male unemployment rates should be addressed by structural policies, that appears to be the implicit message. The issue is relevant because of the current debate on whether funding for disadvantaged youth programs should be shifted toward programs that assist displaced adult males.
The problem of structural unemployment, however, cannot be easily addressed. There is a need to target funding toward particular groups. The issue is to identify variables that rank pockets of structural unem- ployment in terms of their need for policy assistance. There is no particular reason to assume that groups with increasing rates of unem- ployment are the ones to be targeted for assistance. Such a variable would lead toward continuing assistance for disadvantaged youths, depending on their family income. If this were used to rank groups, disadvantaged youths and single-parent families would continue to be targeted.
General Discussion
Martin Baily pointed out that while the adjustments Summers makes for post-1965 changes in the age-sex composition of the labor force alter the 1985 unemployment rate only slightly, even Summers's procedure shows that the changes added 1.0 percentage point to the unemployment rate between 1954 and 1978. The Perry procedure weighted each age- sex group by the relative earnings of its workers and yielded an adjust- ment for the same period in the neighborhood of 2.0 percentage points.
Christopher Sims noted that the models whose results are shown in tables 12 and 13 provide only weak evidence for union effects on unemployment and employment. The most reliably specified models include regional dummies and an instrumented union variable; the largest t-statistic on any union variable in any of these models is only 1.7. Summers felt that controlling for regional effects probably obscured some of the union effects and noted that regional controls increased the standard errors but did not decrease the magnitudes of the union coefficients.
Jeffrey Sachs stressed that increased unemployment could not be blamed directly on union actions. In his view, a more convincing
Lawrence H. Summers 395
interpretation is that exogenous supply shocks have led to both declining employment in the union sector and declining wages in the nonunion sector, producing the pattern of correlations Summers reports in the second half of the paper. Summers agreed that rising union wage premiums probably reflected wage rigidity in the face of adverse shocks rather than pure union push.
Stanley Fischer, noting that in previous work Summers had explained high European unemployment as a consequence of employed workers' keeping wages high even when others are out of work, asked why the same interpretation was not applicable to the United States. Summers replied that a key difference between the United States and Europe is the presence of a large nonunion sector in the United States. The explanations that he and others have offered for the rigidity of union wages do not apply to the U.S. nonunion sector. To explain U.S. unemployment, one must explain why the U.S. nonunion sector does not soak up any unemployment generated in the high-wage union sector. This is the reason for introducing the transitional unemployment inter- pretation.
Wayne Vroman questioned Summers's contention that remaining unemployed to wait for a good job has become more attractive in recent years. According to Summers, people who lose high-paying jobs find that the prospective wage in their next best alternativejob has declined. Thus they wait longer to regain their former jobs. But Vroman cited evidence that other sources of family income-unemployment benefits and earnings of other family members-have declined since the late 1970s, so that family income during an unemployed worker's wait for a job is lower than it used to be. The effect would be to shorten the equilibrium duration of unemployment.
Vroman noted that both he and Gary Burtless have documented a decline in the availability of unemployment insurance benefits. A similar decline is shown in table 6 of the Summers paper. The cutbacks, which occurred after 1979, have been largest in programs for the long-term unemployed. They have also been largest in the major industrial states that have experienced especially high unemployment in the 1980s. Thus the cutback in unemployment insurance benefits has been concentrated among the same workers whose unemployment experience has worsened the most.
Vroman added that evidence on other family income sources for the
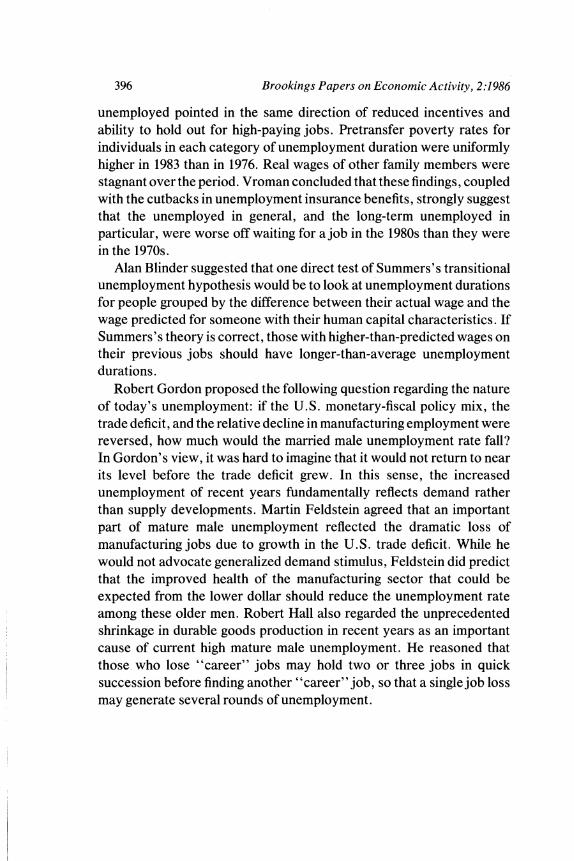
396 Brookings Papers on Economic Activity, 2:1986
unemployed pointed in the same direction of reduced incentives and ability to hold out for high-paying jobs. Pretransfer poverty rates for individuals in each category of unemployment duration were uniformly higher in 1983 than in 1976. Real wages of other family members were stagnant over the period. Vroman concluded that these findings, coupled with the cutbacks in unemployment insurance benefits, strongly suggest that the unemployed in general, and the long-term unemployed in particular, were worse off waiting for a job in the 1980s than they were in the 1970s.
Alan Blinder suggested that one direct test of Summers's transitional unemployment hypothesis would be to look at unemployment durations for people grouped by the difference between their actual wage and the wage predicted for someone with their human capital characteristics. If Summers's theory is correct, those with higher-than-predicted wages on their previous jobs should have longer-than-average unemployment durations.
Robert Gordon proposed the following question regarding the nature of today's unemployment: if the U.S. monetary-fiscal policy mix, the trade deficit, and the relative decline in manufacturing employment were reversed, how much would the married male unemployment rate fall? In Gordon's view, it was hard to imagine that it would not return to near its level before the trade deficit grew. In this sense, the increased unemployment of recent years fundamentally reflects demand rather than supply developments. Martin Feldstein agreed that an important part of mature male unemployment reflected the dramatic loss of manufacturing jobs due to growth in the U.S. trade deficit. While he would not advocate generalized demand stimulus, Feldstein did predict that the improved health of the manufacturing sector that could be expected from the lower dollar should reduce the unemployment rate among these older men. Robert Hall also regarded the unprecedented shrinkage in durable goods production in recent years as an important cause of current high mature male unemployment. He reasoned that those who lose "career" jobs may hold two or three jobs in quick succession before finding another "career" job, so that a single job loss may generate several rounds of unemployment.