Embed Size (px)
Citation preview

Why & how – performance
management & evaluation
OECD Trento Centre
10th – 13th November

This presentation covers …
• Why performance manage & evaluate
• The benefits, the risks
• The choices of approach
• How to plan, deliver and evaluate
performance
• Some hints lessons from the ‘field’
• My evidence – 25+ years practice
• Doing the right
things?
• Doing enough of
them?
• Do them better?
• Benefits, costs,
impacts?
• Will impact last?
How does it seem to you?

Why do it?
• If we don’t know
where we are going
any way will get us
there…
• If we don’t know
where we are going,
how will we know
when we get there?
• Getting there together
Why do it?
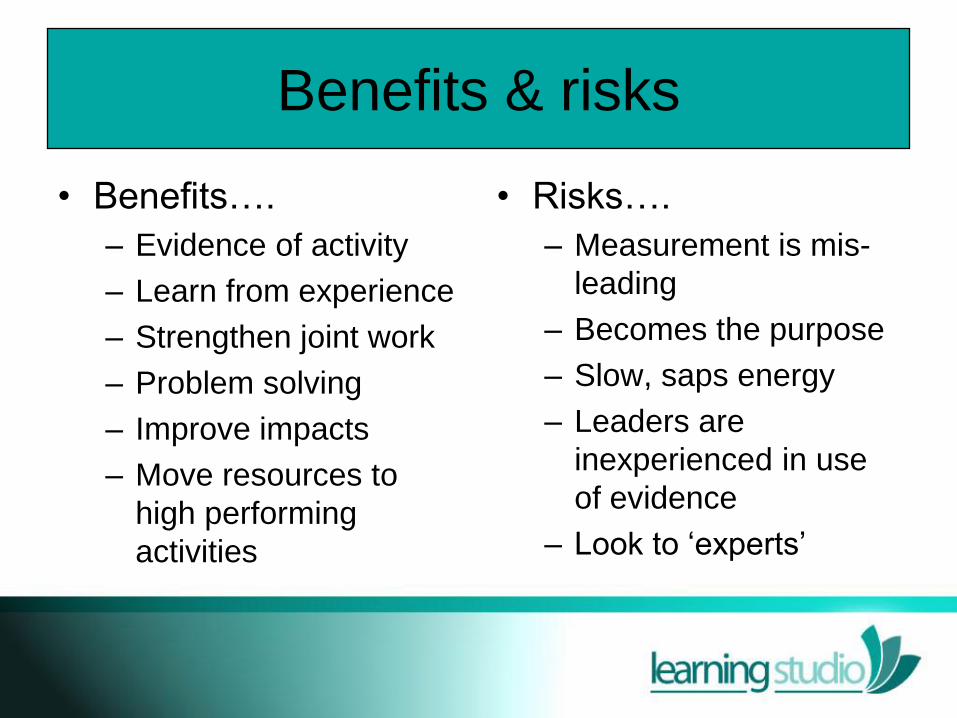
Benefits & risks
• Benefits….
– Evidence of activity
– Learn from experience
– Strengthen joint work
– Problem solving
– Improve impacts
– Move resources to
high performing
activities
• Risks….
– Measurement is mis-
leading
– Becomes the purpose
– Slow, saps energy
– Leaders are
inexperienced in use
of evidence
– Look to ‘experts’

Preconditions of success
• Clarity about shared
outcome
• Responsive
governance
• Systemic model for
change
• Fit for purpose
information flows

Importance of cause & effect
• Risk of changing
symptoms, rather
than underlying
conditions
• How & where do you
intervene, in order to
achieve what?
• Trends and
sustainable impacts

Important concepts
• Outcomes
• Outputs
• Baselines
• Trend & forecast
• Indicator
• Targets (# & %)
• Impacts

What do you think, so far?
• How does this
compare with your
experience?
• New ideas?
• Things you might
change?
• Things over – looked?
• What’s real?

Remember the important
concepts?
• Outcomes
• Outputs
• Baselines
• Trend & forecast
• Indicator
• Targets (# & %)
• Impacts

Your theory of change…
• What do you all agree
will create change?
• What’s your evidence
for this?
• What’s the depth of
agreement &
understanding?
• Triangulated – how?

Levels & contexts
• Levels of…– Population
– Complexity
– Maturity / experience
• Contexts– History
– Life cycle
– Persistence of problems
– Etc etc
• Fitness for purpose

EU models
• 3 stage process
• At centre of programme design
• Informs policy cycle
• Performance and impact in mind from outset
• Critical ‘friend’

Generic indicators
• Eg SME sectoral
support
• Limit # of indicators
(max 8?)
• Relate actions to
causes & effects
• Logic chain in actions,
impacts, indicators

• How indicators link
with activity
• Assumptions
– Virtuous circle of
improvement
– Add in ‘risk’
– Informs choice &
modifies behaviour
A system of indicators

• Management plan for
how performance &
evaluation relate
• Multi phase / multi
annual
• Multi project focus
within a programme
• Hierarchy of systems
Planning it EU style

Things to avoid
• Managing resources vs
performance
• Indicators with no
baseline
• Perverse effects
• Weak feedback & feed
through
• Slow responsiveness
Things to avoid…if you can

Planning & structuring
• Concept / issue mapping
• Stakeholder consultation
• Evaluability assessment
• Logic models
• Formative / developmental

Obtaining data
• Surveys (social & beneficiary)
• Individual stakeholder interviews
• Priority evaluation
• Focus groups
• Critical incident analysis
• Case studies
• Data – admin & 2nd ry
• Observation
• Group consultation
Qualitative or quantitative?
• Informs subtle processes
eg behaviour change
• Interest in contexts
• Human judgements
• ‘Bottom up’ understanding
• Explaining causal patterns
• Impacts for different groups
• Innovation – & explanations
for differential impacts

Qualitative or quantitative?
• Aggregate judgements
• Explanatory & predictive
modelling
• Overview – extent & scale
• Comparisons across
settings / client groups
• Particular interventions
• Trend analysis

What do you think, so far?
• How does this
compare with your
experience?
• New ideas?
• Things you might
change?
• Things over – looked?
• What’s real?

Analysing information
• Input:output
• Econometric
• Regression analysis
• Experimental
• Delphi – expert
feedback
• SWOT

Tools to use
• Cost benefit analysis
• Benchmarking
• Cost effectiveness
• Economic impact
• Equalities impact
• Environmental impact
• Strategic
• Multi criteria
• Expert panels

From experience ….
• Outcomes
• Real focus on causes
• Deep agreement on
activities
• Small no. indicators
• Rates of change &
absolute numbers
• Plausibility

….and also from experience
• Forensic interest in
delivery chains
• How does the
customer experience
the service?
• ‘Clout’ in governance
• Is the story, ‘change’?

Baselines
• Where are we
heading?
• What scenarios and
influencing factors are
there?
• How will our targets
relate to the future?
• So what?
T he Matter of B aselines
Baselines have two parts: history and forecast
O
O
H
M OK?
L
Point to Point Turning the Curve
History Forecast

Discussion examples
• Based on 2 thumbnail
cases studies…
• How does this compare
with your experience?
• New ideas?
• Things you might
change?
• Things over – looked?
• What’s real?

Programme performance
• Different types of
performance
• How much?
• How well?
• How many benefit?
• What proportion?
• So what?
H ow m uch did
w e do?
Program m e Perform ance M easures
H ow w ell
d id w e do it?
Is anyone
better off?
Q uantity Q uality
Eff
ec
t
Eff
ort
# %

How much did we do? How well did we do it?
Is anyone better off?
LeastImportant
Quantity Quality
Eff
ect
Eff
ort 2nd Most
Important
3rd MostImportant Most
Important

How much did we do? How well did we do it?
Is anyone better off?
# Clients/customers
served
# Activities (by type
of activity)
% Common measures
% Activity-specific
measures
e.g. client staff ratio, workload ratio, staff
turnover rate, staff morale, % staff fully
trained, % clients seen in their own language,
worker safety, unit cost
e.g. % timely, % clients completing activity,
% correct and complete, % meeting standard
% Skills / Knowledge(e.g. parenting skills)
% Attitude(e.g. toward drugs)
% Behavior(e.g.school attendance)
% Circumstance(e.g. working, in stable housing)
#
#
#
#
Point in Time
vs. Point to Point
Improvement

a drinking example …
• Different types of
indicators tell
different stories
• They inter-relate to
provide the whole
picture
How much did we do?
Drug/Alcohol Treatment Programme
How well did we do it?
Is anyone better off?
Number of
persons
treated
Percent of
staff with
training/
qualification
Number of clients
off alcohol &
drugs- at discharge
- 12 months after discharge
Percent of clients
off alcohol &
drugs- at discharge
- 12 months after exit
Quantity Quality

Thanks for listening
• Thoughts?
• Feelings?
• Decisions to act?
• How can performance
management systems
help change
behaviour for the
better/ best?

Resources on line
• http://ec.europa.eu/re
gional_policy/sources/
docgener/evaluation/e
valsed/index_en.htm
• http://ec.europa.eu/re
gional_policy/sources/
docoffic/working/sf20
00_en.htm

Happy to help
• Andrew Harrison
• +44(0)1214494815
• www.learning-studio.org
• http://learning-studio.typepad.com/thinking__studio_style/