Embed Size (px)
Citation preview
Why have Undergraduate Grades Increased?
Rey Hernández-Julián Adam Looney1
Rising average grades at American universities have prompted fears of “grade inflation.” This
paper assesses the causes of rising grades by applying the methods used to estimate price
inflation. With rich data from a large public university, including information on the
characteristics of students, the exact courses they attended, and course information from
historical course catalogs, we decompose the increase in average grades into those components
explained by changes in student and course characteristics, and the unexplained component,
which we refer to as “inflation.” About one-quarter of the increase in grades from 1982 to 2002
was driven by changes in the courses selected by students; enrollment shifted toward historically
“easier grading” departments over time, mechanically increasing average grades. An additional
one-quarter of the increase is attributable to increases in the observable quality of students, such
as average SAT scores. Less than half of the increase in average grades from 1982 to 2002
appears to arise from “inflation.” Migration toward higher-grading courses also appears to have
played a role in rising grades during the late 1960s at Harvard. These results add to evidence
suggesting that differences in relative grades across departments discourage students from
studying in low-grading departments, like math or hard sciences, and that policies intended to
level the playing field across departments could both reduce the rise in average grades and
improve incentives.
1 Metropolitan State University of Denver and the Brookings Institution. Email addresses: [email protected] and [email protected]. Thanks to Ted Gayer, David Lebow, Byron Lutz, Jonah Rockoff, and many others for helpful conversations and useful advice. Natasha Plotkin, Elizabeth Elzer, and Michael Donnelly provided valuable research assistance.
1

Average grades at American universities have increased significantly over the past 50 years,
from about 2.5 in 1960 to 3.1 in 2006 (on a 4 point grading scale), raising concerns about grade
inflation. The use of the word ‘inflation’—borrowed from the language of consumer prices—
reflects a common belief that today's faculty are assigning higher grades for what was once
ordinary work (Rojstaczer 2008). However, as with consumer prices, average grades may also
rise because of improvements in quality or changes in the choices of consumers: college
admissions has become more competitive and student enrollments have tended to shift from
‘harder’ to ‘easier’ classes. Understanding the importance of these factors is relevant for
understanding the costs associated with rising grades and for designing policies to address grade
inflation. However, the role of these factors is unknown because the appropriate data and
empirical methods have yet to be applied to measure these sources of rising grades.
In this paper, we construct an annual quality-adjusted inflation index for grades drawing on the
empirical methods used to produce measures of price inflation, and use non-parametric methods
to evaluate how changes in student characteristics and their course choices affected the
distribution of student grades over time.
We apply these methods to individual student-level data from a large public university that
includes exact transcript information like courses attended and grades received and student
characteristics like SAT scores, age, and gender to measure grade inflation controlling for
school-wide changes in student characteristics and course choices. The transcript data contain
over 2.5 million individual grades earned by almost 90,000 students over the course of 41
academic semesters starting in the fall of 1982 and ending in the fall of 2002, making it the
largest set of microdata that has been used to analyze grade inflation. Over the sample period,
average grades increased 0.33 grade points (from 2.66 to 2.99), similar to increases in grades
recorded at other universities. At the same time, the university became more selective and
average SAT scores increased by about 34 points. 2
In order to compare the grades of students taking the same (or very similar) classes at different
points in time, we matched classes based on course titles and descriptions with course
descriptions from historical course catalogs. Over the 20-year period, enrollment in departments
2 SAT scores were re-centered by the College Board in April 1995; SAT scores for students entering prior to 1996 have been re-centered using a conversion table (College Board 2012).
2
where grades were historically high increased—particularly in the humanities and certain career-
oriented fields—while enrollment fell in historically low-grading departments like math, physics,
and engineering.
We measure grade inflation using standard hedonic regression techniques, which also allows us
to decompose the average increase in grades into those components explained by changes in
student characteristics, changes in the distribution of classes selected by students, and
unexplained factors, which, as in the price literature, we describe as inflation. Using non-
parametric analyses, we then assess how the distribution of grades has changed because of
changes in student characteristics and course selection. In essence, this analysis attempts to form
the counterfactual “what would grades have been in 1982 if those students took the same classes
and had the same characteristics and qualifications as students in 2002?” The technique, similar
to propensity-score reweighting (DiNardo, Fortin, Lemieux, 1996), has been widely applied in
other contexts, particularly to changes in wages, but has never before been used to analyze
grades.
According to these analyses, more than half of the increase in average grades from 1982 and
2002 arises because of changes in course choice and improvements in the quality of the student
body. The shift to historically “easier” classes increased average grades by almost 0.1 grade
point. Increases in SAT scores and changes in other student characteristics boosted grades almost
another 0.1 grade point. Nevertheless, about 45 percent of the increase in grades is left
unexplained by observable characteristics of students and enrollment—a figure that suggests a
large role of assigning higher grades for similar work.
Although scholars have noted that differences in relative grades across courses provide an
incentive to select into higher-grading courses, our estimates suggest that it may be a more
important contributor to rising grades than previously imagined. For instance, Hernández-Julián
(2010) demonstrates that students responded to incentives in scholarship programs by choosing
easier classes; Bar, Kadiyali, and Zussman (2009), show that grades at Cornell increased when
median grades were published online and students migrated to higher-grading classes; and Sabot
and Wakeman-Linn (1991) and Johnson (2003), show that enrollment choices are partially grade
driven. These studies identify the mechanism of course selection as a contributor to rising
3
grades; our study builds on their work by providing a quantitative measure of the magnitude of
that contribution.
Though the bulk of our analysis is devoted to the analysis of student-level data, we also examine
data on major choices across the country, which suggest that trends in course selection and their
effect on average grades at the university we examine may be somewhat idiosyncratic. Over the
past four decades, for instance, major choices shifted the most during the 1970s, when available
data suggests that grade inflation was minimal. And, since the early 1980s, major choices have
remained fairly stable, during which time the data shows that grade inflation picked up.
We also examine evidence from Harvard College that is more consistent with evidence that
changes in course choice contributed to rising grades. We show that the well-documented
increase in average grades that occurred at Harvard in the late 1960s and early 1970s was
accompanied by a swift decline in the number of students who majored in the hard sciences of
more than 30 percent between 1962 and 1971, with a corresponding increase in the number
majoring in the humanities. At the same time these students found new course offerings in
humanities and social sciences in part because of the creation of thirteen new departments
(Report of the President of Harvard College, various years). (Indeed, as this shift unwound after
the Vietnam War grades declined, albeit not to their earlier levels.)
Of course, these findings also suggest that a relaxation of grading standards is also an important
contributor to rising grades. In fact, our analysis is unable to assess whether the rigor of course
material has changed nor whether student effort has changed over time. Evidence suggests that
grades have been rising over a period when student inputs, measured by time spent studying, has
fallen (Babcock and Marks 2010).
If rising grades were simply due to an overall reduction in grading intensity, this could lead to
reduced incentives for hard work by students and more difficulty in identifying truly outstanding
work by graduate schools or employers given the truncation of grades at the highest marks.
However, the finding that student choice to avoid low-grading departments is an important
contributor to rising grades adds an additional source of costs and may have different
implications for grading policy. In effect, differences in grading policies across departments
impose a tax on low-grading departments, discouraging students from taking those classes and
4
encouraging them to instead study in higher-grading fields. As a result, fewer students study
subjects that closely match their interests, abilities, or that yield the greatest rewards in the labor
market. This may reduce the enjoyment and value students get from their education and the
future economic gains to themselves and their employers after graduation. To put a fine point on
it, at a time when many are concerned that too few students study sciences, mathematics,
engineering, or other quantitative or technical fields, grading policy is actively discouraging the
pursuit of those fields. Addressing such costs requires not just attention to overall average grades
but also leveling the playing field across departments.
Rising Grades
Several studies using a variety of data sources have painted similar pictures of grade inflation
over the past several decades. Adelman (2004), examining college transcript data for three
nationally representative cohorts of students, the high school classes of 1972, 1982, and 1992,
finds that average grades were 0.04 points lower for the class of 1982 than that of 1972, and 0.08
points higher for the class of 1992 than that of 1982. Examining data on average GPAs reported
by about 80 voluntarily participating schools, Rojstaczer and Healy (2010) find that average
grades rose sharply, by almost 0.2 grade points, in the 1960s, flattened out in the 1970s and early
80s, before rising again at a rate of about 0.1 grade point per decade through 2006. They also
find that since the 1960s, grades rose about 0.2 points more at private schools than at public
schools. Babcock (2010), examining results from the National Postsecondary Student Aid Study,
reports that GPAs for full-time students rose from 2.83 to 2.97 between 1993 and 2004. Though
the magnitude of grade inflation varies across data sources, the evidence taken together suggest
that grades rose somewhere around 0.1 grade points per decade between the 1960s and 2000s,
except during the 1970s when average grades stayed relatively constant.
A common explanation for rising grades is “inflation” in the sense of faculty assigning higher
grades for equivalent work. For instance, Roskovsky and Hartley (2002) provide a list of
possible contributors to rising grades whose central theme is summarized as an upward shift in
5
grades without a corresponding increase in student achievement that is driven by a number of
potential factors: incentives to grant higher grades due to the Vietnam War draft; a response to
student diversity; new curricular or grading policies; responses to student evaluations; adjunct
faculty; or a growing consumer culture. Some theorize that competition among colleges to place
students in better jobs also encourages grade inflation (Tampieri 2011; Chan, Hao, and Suen
2007).
A number of studies have also examined how grades influence student choices. First, it is clear
that there are large and persistent differences in grades across departments (Achen and Courant
2009). In addition, Sabot and Wakeman-Linn (1991) and Bar, Kadiyali, and Zussman (2009)
show that students are responsive to the incentives in grading and seek out higher grading
departments and classes. These studies, and related research (Johnson 1996; Rojstaczer and
Healy 2010) suggest an important role of “shopping” by students for classes to improve their
grades. Similarly, Hernández-Julián (2010) shows that grade-dependent scholarships may cause
students to seek out higher-grading classes to maintain the required GPA. Barr, Kadiyali, and
Zussman, in particular, examine a change in policy that provided information on median course
grades and find that this policy change encouraged students to migrate to courses with higher
grades and, using simulations, show that these changes in course selection increased grades.
Research by Philip Babcock (2010) focuses not on the source of changes in average grades but
its potential implications: He analyzes grade microdata from the University of California, San
Diego, and finds that students spend less time studying for classes with high average grades than
classes with low average grades, holding the course instructor and course content constant. This
paper builds on the work of these papers by providing a historical analysis that attempts to
decompose the increase in grades into components explained by student quality, composition, or
other factors. Our analysis cannot establish a causal relationship between differences in average
grades across departments and changes in course choices. But, if “shopping” for higher-grading
courses is a contributor to grade inflation, our analysis helps place bounds on the magnitude of
its contribution.
6
Data
Our analysis uses data from a large, public school ranked among the top 100 national universities
by U.S. News and World Report, covering the period from 1982 to 2002. These data include
more than 2.5 million observations of course grades assigned to almost 90,000 students and are
matched to records of students’ demographic characteristics, including age, gender, and date of
university enrollment. For over three-quarters of these students, we also observe SAT scores.3
The analysis focuses on the sample of students for whom all demographic information and SAT
scores are available, although the overall pattern of average grades, enrollments, and other
characteristics appears to be the same as in the full sample and does not appear to affect the
results.4
A key challenge in our analysis is ensuring an apples-to-apples comparison of classes over a 20-
year period in which courses and departments changed considerably. Some departments were
eliminated, new departments formed, and the content of classes changed. The goal of our
analysis is to compare the grades assigned in the same courses and departments at different
points in time.
To match past classes to their current versions, we use course descriptions from historical course
catalogs from the 1985, 2000, 2001, and 2002 academic years.5 Many classes have the same
number, title, and course description in all years. However, the content of many courses has
changed, and other courses have been eliminated or created. Therefore, as an initial step, we
categorized courses based on their department and level of courses (i.e. 100-level, 200-level, etc.,
which roughly corresponds to courses directed to first year students, second year students, etc.).
Each course offered each year was assigned a department and level that corresponded to the
department and level in 2001. For example, the university once had an independent Zoology
department offering classes like Zoology 222: Human Anatomy. Today, that course is offered as
Biological Sciences 222: Human Anatomy; in our dataset, Zoology 222, and all other Zoology
3 Our dataset includes ACT score data for some students but it is not a useful substitute for SAT scores, since 94 percent of students with missing SAT scores also have missing ACT scores.4 A comparison of the characteristics of our regression sample with the sample as a whole is provided in appendix 3. Some students take the ACT instead of the SAT; for others SAT scores are simply missing. 5 2000 is the earliest year for which course catalogs are available on the Internet. We tried to obtain hard copies of course catalogs for earlier years, but 1985 was the only year the Registrar was able to provide.
7
classes, are matched to their equivalents in the Biological Sciences department throughout the
sample period. As another example, the Structural Steel Design course had the number 302 in the
Civil Engineering department in 1985 but later became Civil Engineering 406; we assign it to the
permanent label of a 400-level Civil Engineering class throughout the sample. Using this
technique, we are able to match 97 percent of courses in 1985 to a department and level that exist
in 2001. This means we are able to closely track the evolution of grades within narrowly defined
departments and course levels over the entire 20-year period. However, the ability to exactly
match individual courses over time within departments is more challenging given how
departmental offerings change and course descriptions evolve over time. Many courses remain
exactly the same or almost the same over time. For instance, in 1985, Accounting 200, or Basic
Accounting, is described as “a general survey of accounting for the student requiring only a basic
knowledge of principles and concepts,” while in 2001, the same course is described as a “general
survey of accounting for students requiring only a basic knowledge of principles and concepts.”
However, some classes and departments evolve more significantly, so the matching process
necessarily is more subjective. Appendix table 1 provides some examples drawn from historical
course catalogs that illustrate some of these challenges and how they were addressed. In our
analysis we felt comfortable matching about 64 percent of courses offered in 1985 to the exact
courses offered in 2001. A concern is that students may be substituting “easier” for “harder”
courses within a department/level (i.e. taking the easier Sophomore-level math class). However,
the robustness checks in our analysis suggests that most differences in grading (and course
selection that affects overall average grades) is occurring across departments and to a lesser
extent, across course levels (100 level, 200 level etc.) rather than across specific classes within a
department; hence matching courses based on their departments and levels appears to capture
most of the variation in selection over time.
To refine the matching based on the course catalogs, we also looked directly at the enrollment
data to see if there are sudden changes in enrollments from year to year within departments and
courses to check for unusual patterns and to improve our matching process.
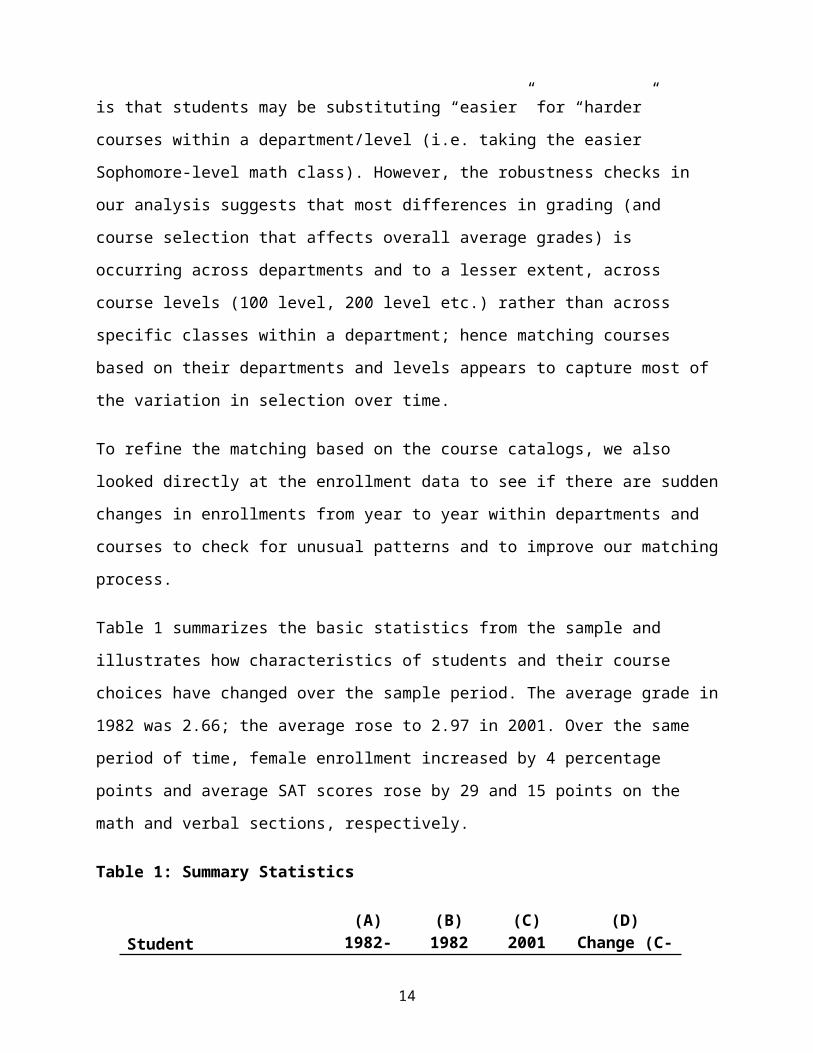
Table 1 summarizes the basic statistics from the sample and illustrates how characteristics of
students and their course choices have changed over the sample period. The average grade in
1982 was 2.66; the average rose to 2.97 in 2001. Over the same period of time, female
8
enrollment increased by 4 percentage points and average SAT scores rose by 29 and 15 points on
the math and verbal sections, respectively.
Table 1: Summary Statistics
(A) (B) (C) (D)
Student Characteristics 1982-2002 1982 2001 Change (C-B)
SAT Math 565 551 581 29SAT Verbal 552 546 561 15Male 0.56 0.59 0.55 -0.04Age 20.1 19.7 19.8 0.1Grade 2.82 2.66 2.97 0.31Number of Students 132,085 11,389 15,433 4,044Number of Courses Attended 2,739,705 112,548 146,157 33,609
SAT, gender, age, and grade summary statistics represent course-credited weighted averages for the indicated sample periods. Column C presents data for 2001 instead of 2002 because our sample only includes data for the first half of 2002. Over the whole sample, each unique student registered for an average of 20.7 courses.
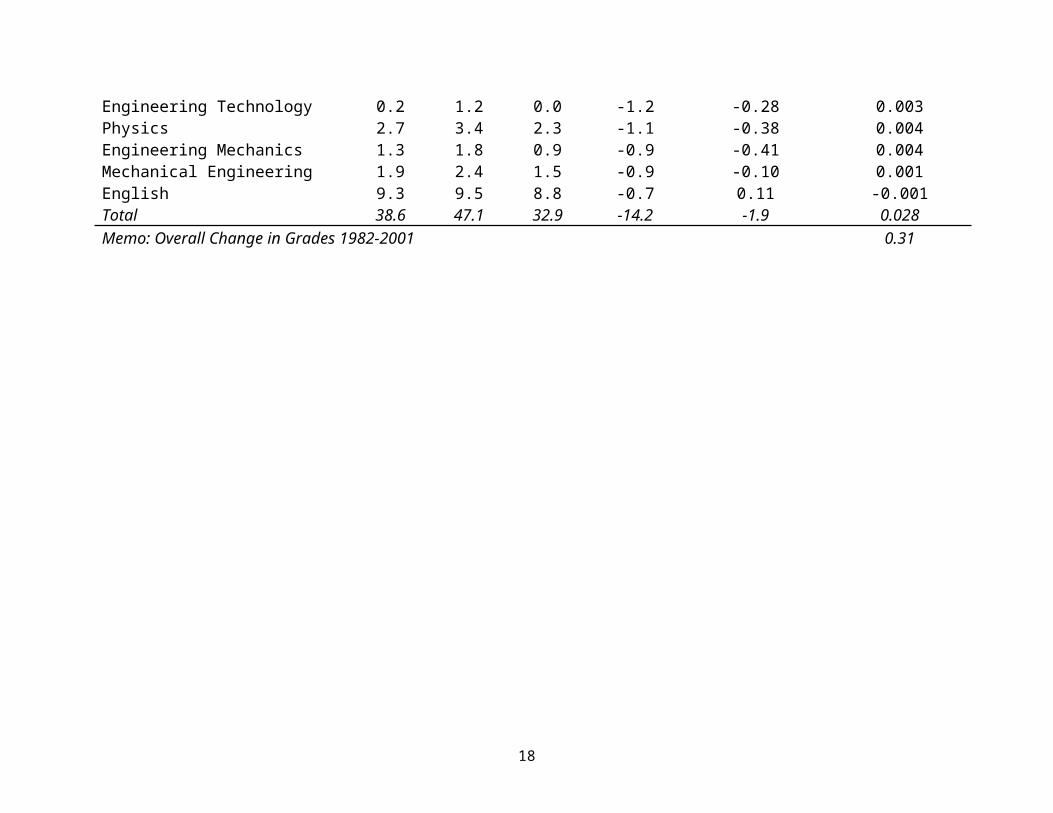
Table 2 shows that the courses selected by students changed significantly over time. It lists the
ten departments that experienced the largest increases in enrollment and the ten that experienced
the largest decreases, and the average grade in each of those departments over the entire sample
period. Of the ten departments that grew the most in popularity between 1982 and 2001, two are
humanities (Spanish and Philosophy), and five are departments geared toward preparing students
for specific, non-technical careers following graduation (Marketing, Speech & Communications,
Graphic Communications, Education, and Parks, Recreation & Tourism Management). Only two
are technical or scientific (Computer Science and Health Science). As column E shows, eight out
of ten of these departments assigned grades that were, on average, substantially above the mean
for the sample period. Of the ten departments that declined the most in popularity, on the other
hand, six are science and engineering disciplines. In eight of these ten departments, grades were
below the mean.
We can estimate the contribution of the change in enrollment in a given department to the overall
rise in average grades between 1982 and 2001 by multiplying the percentage-point change in
enrollment in that department by the number of grade points by which grades in that department
exceed or fall below the average in the sample as a whole. For example, since enrollment in
Education rose by 0.9 p.p. between 1982 and 2001, and average grades in that department
9
exceeded the whole-school average by 0.76 grade points, the overall contribution of the
department to the rise in average grades is about 0.009*0.76=0.007. Summing the individual
contributions over the 20 departments listed in this table, we estimate that changes in enrollment
among these departments together created a 0.054-grade-point increase in average grades, or
about 17 percent of the overall rise in average grades over the sample period.
10
Table 2: Changes in Course Enrollment and the Contribution to Rising Grades (A) (B) (C) (D) (E) (F)
Departments by Increasing and Decreasing Enrollment
1982-2002
(Avg.)1982 2001
Change in Enrollment
(C-B)
Department Grade (Difference
from Overall Mean)
Contribution to Change in GPA
(D*E)
Departments with Increasing Enrollment (percent of all course credits) Marketing 2.0 0.0 2.7 2.7 -0.13 -0.003Speech & Communications 1.9 1.1 3.0 1.9 0.39 0.008Spanish 2.0 1.2 2.8 1.5 0.21 0.003Graphic Communications 0.5 0.1 1.1 1.0 0.33 0.003Education 4.3 3.4 4.3 0.9 0.76 0.007Philosophy 1.1 0.2 1.1 0.9 0.04 0.000Parks, Rec. & Tourism Mgt. 1.8 1.3 2.2 0.9 0.27 0.002Nursing 1.6 0.8 1.6 0.8 0.29 0.002Health Science 0.8 0.0 0.7 0.7 0.42 0.003Computer Science 3.0 3.0 3.7 0.7 0.11 0.001Total 18.8 11.2 23.1 11.9 2.7 0.026Departments with Decreasing EnrollmentMathematical Sciences 9.7 11.5 8.5 -2.9 -0.40 0.012Management 4.0 5.6 3.4 -2.2 0.15 -0.003Electrical & Computer Eng. 2.9 3.9 2.2 -1.7 -0.07 0.001Economics 3.4 4.5 3.1 -1.4 -0.14 0.002Accounting 3.0 3.4 2.2 -1.3 -0.43 0.005Engineering Technology 0.2 1.2 0.0 -1.2 -0.28 0.003Physics 2.7 3.4 2.3 -1.1 -0.38 0.004Engineering Mechanics 1.3 1.8 0.9 -0.9 -0.41 0.004Mechanical Engineering 1.9 2.4 1.5 -0.9 -0.10 0.001English 9.3 9.5 8.8 -0.7 0.11 -0.001Total 38.6 47.1 32.9 -14.2 -1.9 0.028Memo: Overall Change in Grades 1982-2001 0.31
11
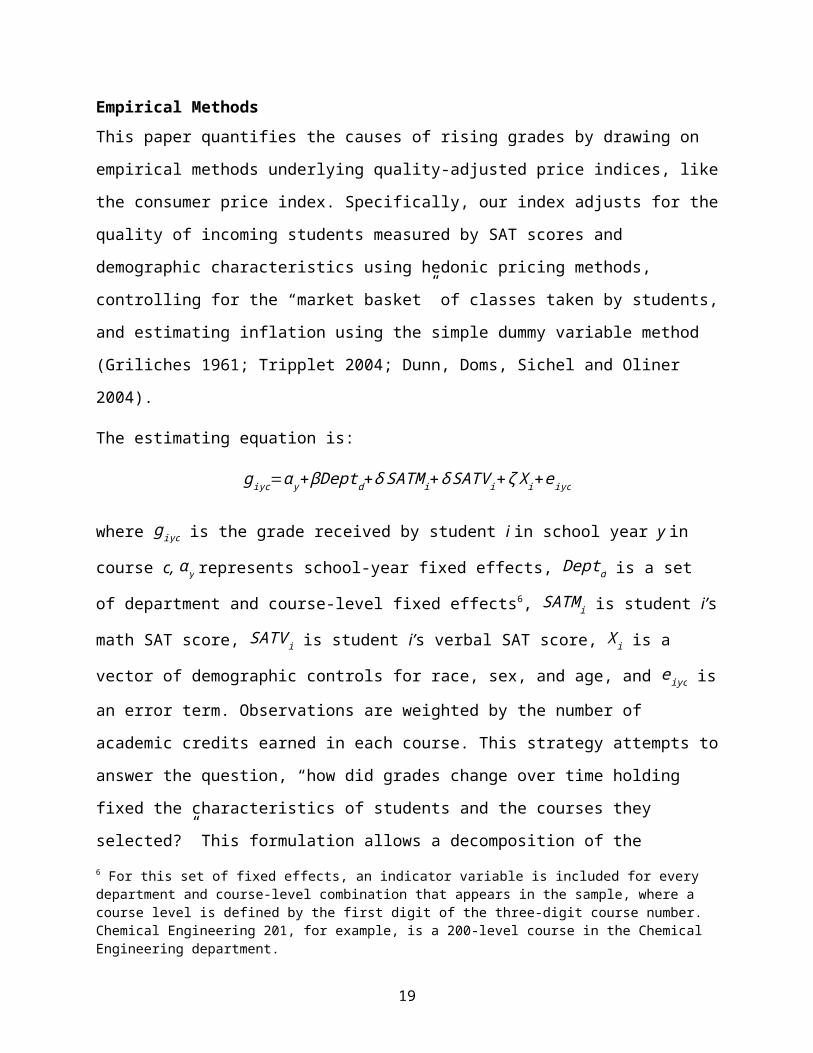
Empirical Methods
This paper quantifies the causes of rising grades by drawing on empirical methods underlying
quality-adjusted price indices, like the consumer price index. Specifically, our index adjusts for
the quality of incoming students measured by SAT scores and demographic characteristics using
hedonic pricing methods, controlling for the “market basket” of classes taken by students, and
estimating inflation using the simple dummy variable method (Griliches 1961; Tripplet 2004;
Dunn, Doms, Sichel and Oliner 2004).
The estimating equation is:
giyc=α y+βDeptd+δ SATM i+δ SATV i+ζ X i+eiyc
where giyc is the grade received by student i in school year y in course c, α y represents school-
year fixed effects, Deptd is a set of department and course-level fixed effects6, SATM i is student
i’s math SAT score, SATV i is student i’s verbal SAT score, X i is a vector of demographic
controls for race, sex, and age, and e iyc is an error term. Observations are weighted by the number
of academic credits earned in each course. This strategy attempts to answer the question, “how
did grades change over time holding fixed the characteristics of students and the courses they
selected?” This formulation allows a decomposition of the contribution of changes in average
grades over time into the part ‘explained’ by changes in courses and changes in demographics.
To examine how the distribution of grades changed because of changes in underlying
characteristics, we apply a reweighing technique developed by DiNardo, Fortin, and Lemieux
(1996, henceforth DFL). DFL provide a method to analyze the effect of changes in covariates on
the distribution of some outcome, such as wages. This approach allows us to estimate what the
distribution of grades would have been in the 1982 school year had student demographics and
course choices matched those of the 2001 school year. To do this, we reweight each 1982 course
grade observation according to the relative likelihood of observing the combination of control
variables for that observation in 2001 instead of in 1982. The control variables are the same ones
used in the regressions above (excluding race): the gender, age, and SAT scores of the student
receiving the grade, and the department and course level for which the grade was given.
6 For this set of fixed effects, an indicator variable is included for every department and course-level combination that appears in the sample, where a course level is defined by the first digit of the three-digit course number. Chemical Engineering 201, for example, is a 200-level course in the Chemical Engineering department.
12
We estimate the likelihoods of observing the various combinations of control variables in 2001
relative to their likelihoods in 1982 using a probit model. Specifically, we limit our sample to
observations from 1982 and 2001 and estimate the following specification:
P (Year y=2001|X iyc¿=Φ ( X 'iyc β)+εiyc
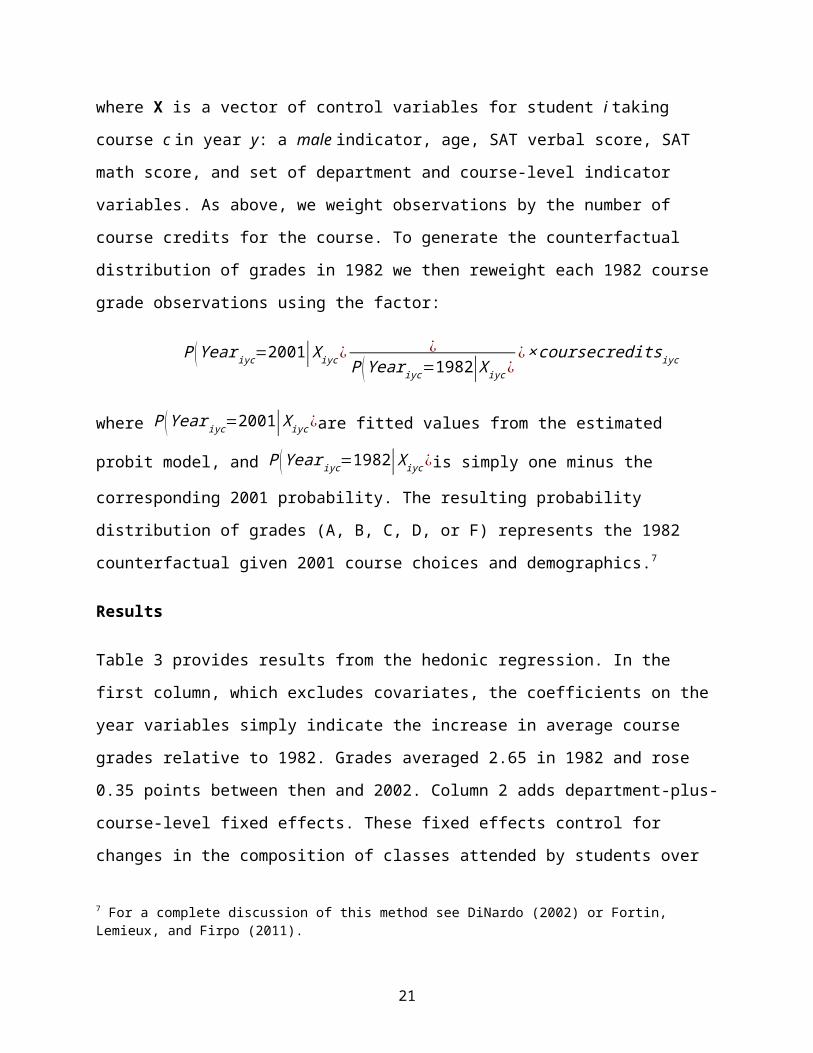
where X is a vector of control variables for student i taking course c in year y: a male indicator,
age, SAT verbal score, SAT math score, and set of department and course-level indicator
variables. As above, we weight observations by the number of course credits for the course. To
generate the counterfactual distribution of grades in 1982 we then reweight each 1982 course
grade observations using the factor:
P (Yeariyc=2001|X iyc ¿¿
P (Yeariyc=1982|X iyc ¿¿× coursecreditsiyc
where P (Yeariyc=2001|X iyc ¿are fitted values from the estimated probit model, and
P (Yeariyc=1982|X iyc ¿is simply one minus the corresponding 2001 probability. The resulting
probability distribution of grades (A, B, C, D, or F) represents the 1982 counterfactual given
2001 course choices and demographics.7
Results
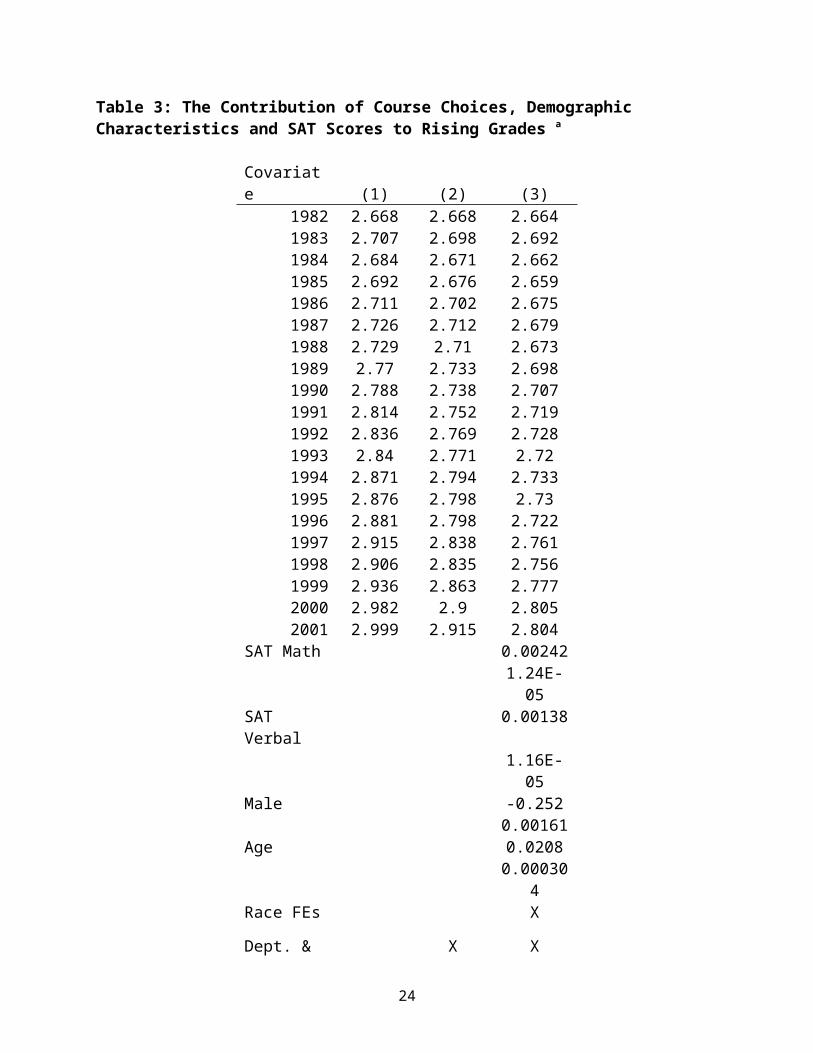
Table 3 provides results from the hedonic regression. In the first column, which excludes
covariates, the coefficients on the year variables simply indicate the increase in average course
grades relative to 1982. Grades averaged 2.65 in 1982 and rose 0.35 points between then and
2002. Column 2 adds department-plus-course-level fixed effects. These fixed effects control for
changes in the composition of classes attended by students over time. Column 3 adds controls for
math and verbal SAT scores and student gender and age. For each 100-point increase in math
SAT score students’ grades rise by about 0.24, on a 4.0 grade point scale; the same increase in
verbal SAT score is associated with a 0.14 increase in average grades. Older students perform
better and women earn grades about 0.25 points higher than those of men.
7 For a complete discussion of this method see DiNardo (2002) or Fortin, Lemieux, and Firpo (2011).
13
Moving from column 1 to column 2, and column 2 to column 3, the coefficients on the year
dummies fall, indicating that after controlling for the distribution of class and the characteristics
of students, the “unexplained” component of rising grades, which we interpret as inflation, falls
significantly. Indeed, controlling for course selections, demographic characteristics, and SAT
scores reduces the coefficient on year 2002 from 0.352 to 0.157, suggesting that controlling for
those factors accounts for more than half of the increase in average grades between 1982 and
2002.
Using the coefficients on student characteristics from the third regression, we can estimate the
contribution of changes in student characteristics over the sample period to the overall rise in
grades. Specifically, since women’s grades are, on average, 0.25 GPA points higher than men’s,
the 4 percentage point increase in the share of women in the student body contributed
0.04*0.25=0.001 to the overall rise in GPA between 1982 and 2001. Similarly, since a student
who is one year older earns grades that are, on average, 0.2 GPA points higher, and the student
body was, on average, 0.1 year older in 2001 than 1982, the increase in average age accounts for
0.1*0.2=0.002 of the rise in grades. The increase in average SAT scores accounts for a larger
share of the increase in grades: Average math SAT scores increased 29 points between 1982 and
2001, implying a 0.024*29=0.70 GPA-point contribution to the increase, while the 15 point
increase in verbal scores implies a 0.014*15=0.21 GPA-point contribution.
As a general observation, the simple fact that women appear to outperform men in terms of GPA
by roughly 0.25 grade points is notable given the sizable increase in female enrollment at
universities over the last several decades. According to the National Center on Educational
Statistics female enrollment at degree-granting institutions increased from about 41 percent to 56
percent between 1970 and 2000.8 This alone would tend to boost GPAs by 0.04 grade points, or
almost 15 percent of the nationwide increase in grades over that period reported in Rojstaczer
and Healy.
8 U.S. Department of Education, National Center for Education Statistics. (2011).
14
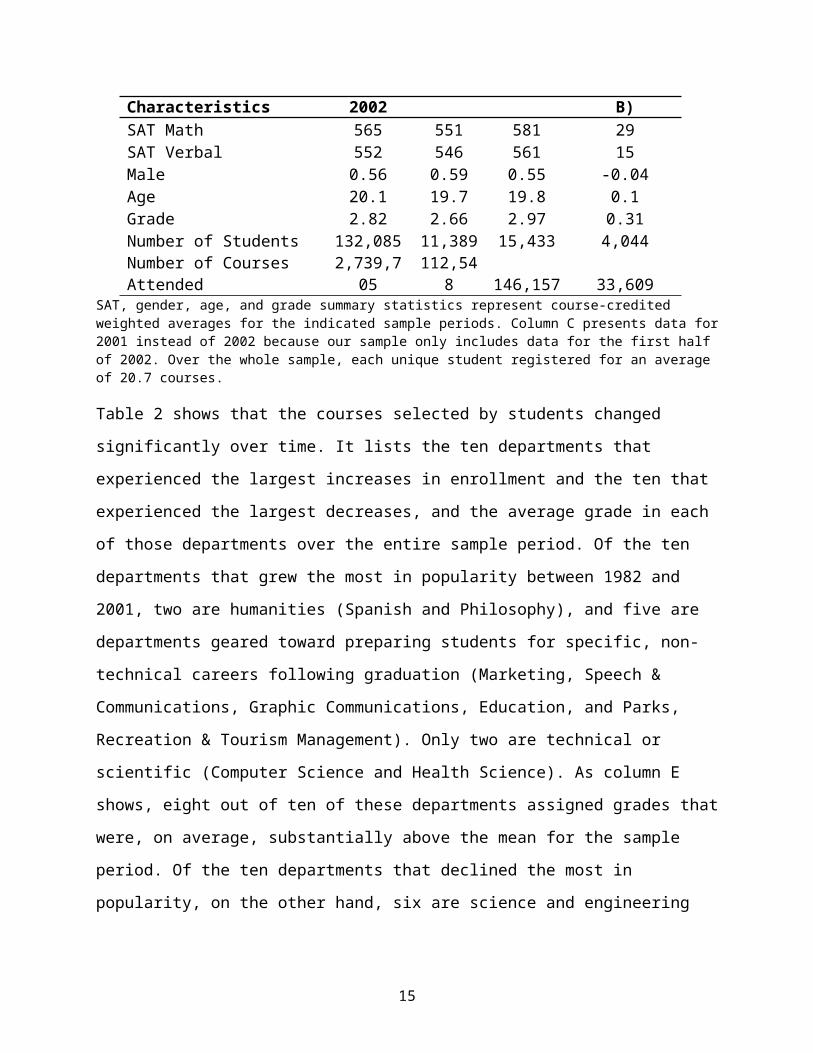
Table 3: The Contribution of Course Choices, Demographic Characteristics and SAT Scores to Rising Grades a
Covariate (1) (2) (3)1982 2.668 2.668 2.6641983 2.707 2.698 2.6921984 2.684 2.671 2.6621985 2.692 2.676 2.6591986 2.711 2.702 2.6751987 2.726 2.712 2.6791988 2.729 2.71 2.6731989 2.77 2.733 2.6981990 2.788 2.738 2.7071991 2.814 2.752 2.7191992 2.836 2.769 2.7281993 2.84 2.771 2.721994 2.871 2.794 2.7331995 2.876 2.798 2.731996 2.881 2.798 2.7221997 2.915 2.838 2.7611998 2.906 2.835 2.7561999 2.936 2.863 2.7772000 2.982 2.9 2.8052001 2.999 2.915 2.804
SAT Math 0.002421.24E-05
SAT Verbal 0.001381.16E-05
Male -0.2520.00161
Age 0.02080.000304
Race FEs XDept. & level FEs b X X
Observations2,241,61
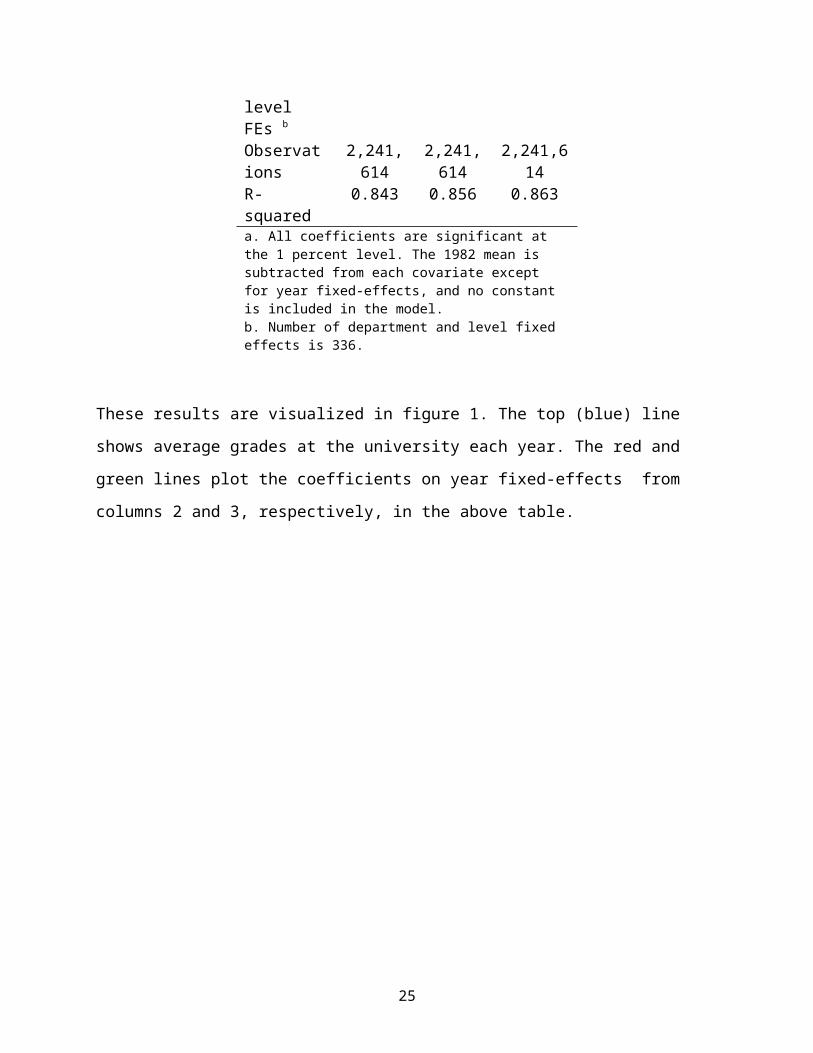
4 2,241,614 2,241,614R-squared 0.843 0.856 0.863a. All coefficients are significant at the 1 percent level. The 1982 mean is subtracted from each covariate except for year fixed-effects, and no constant is included in the model. b. Number of department and level fixed effects is 336.
15

These results are visualized in figure 1. The top (blue) line shows average grades at the
university each year. The red and green lines plot the coefficients on year fixed-effects from
columns 2 and 3, respectively, in the above table.
16
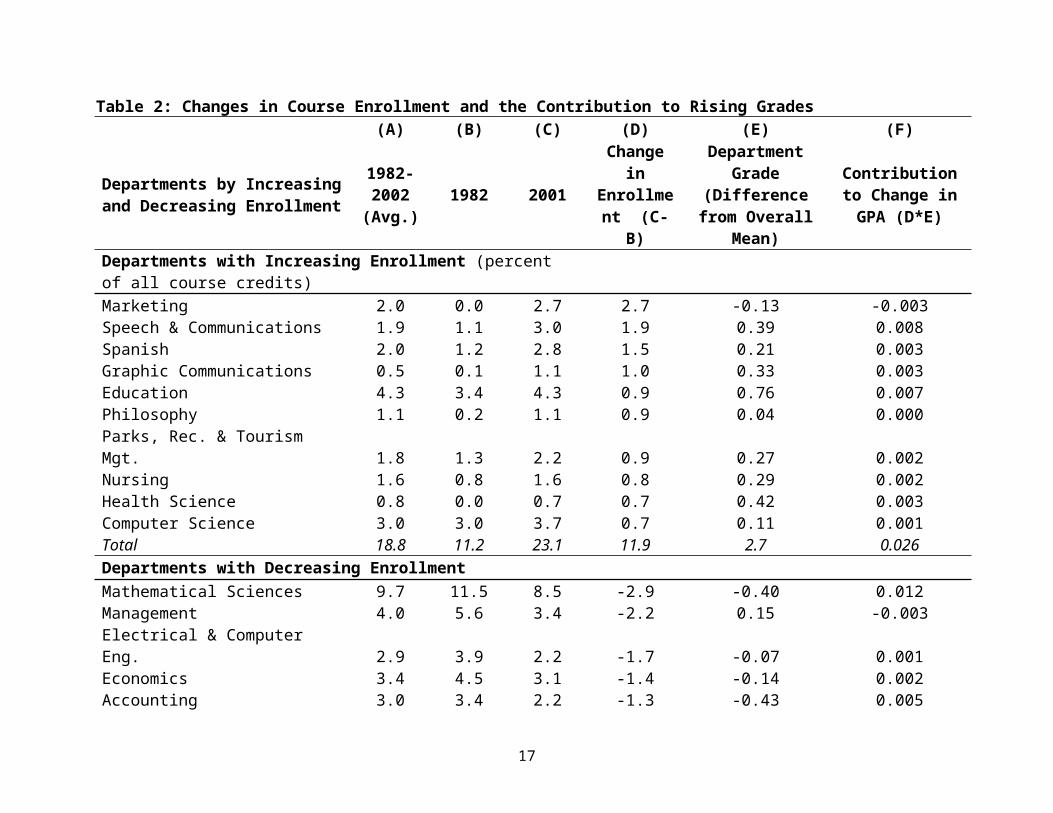
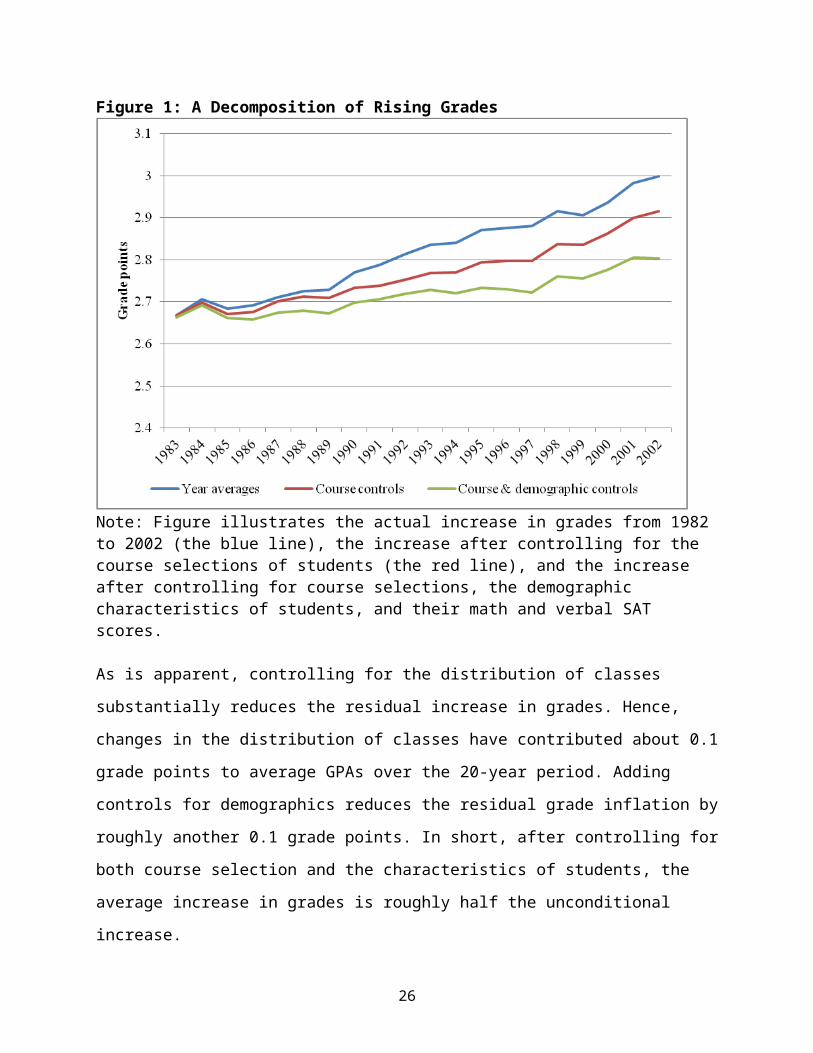
Figure 1: A Decomposition of Rising Grades
Note: Figure illustrates the actual increase in grades from 1982 to 2002 (the blue line), the increase after controlling for the course selections of students (the red line), and the increase after controlling for course selections, the demographic characteristics of students, and their math and verbal SAT scores.
As is apparent, controlling for the distribution of classes substantially reduces the residual
increase in grades. Hence, changes in the distribution of classes have contributed about 0.1 grade
points to average GPAs over the 20-year period. Adding controls for demographics reduces the
residual grade inflation by roughly another 0.1 grade points. In short, after controlling for both
course selection and the characteristics of students, the average increase in grades is roughly half
the unconditional increase.
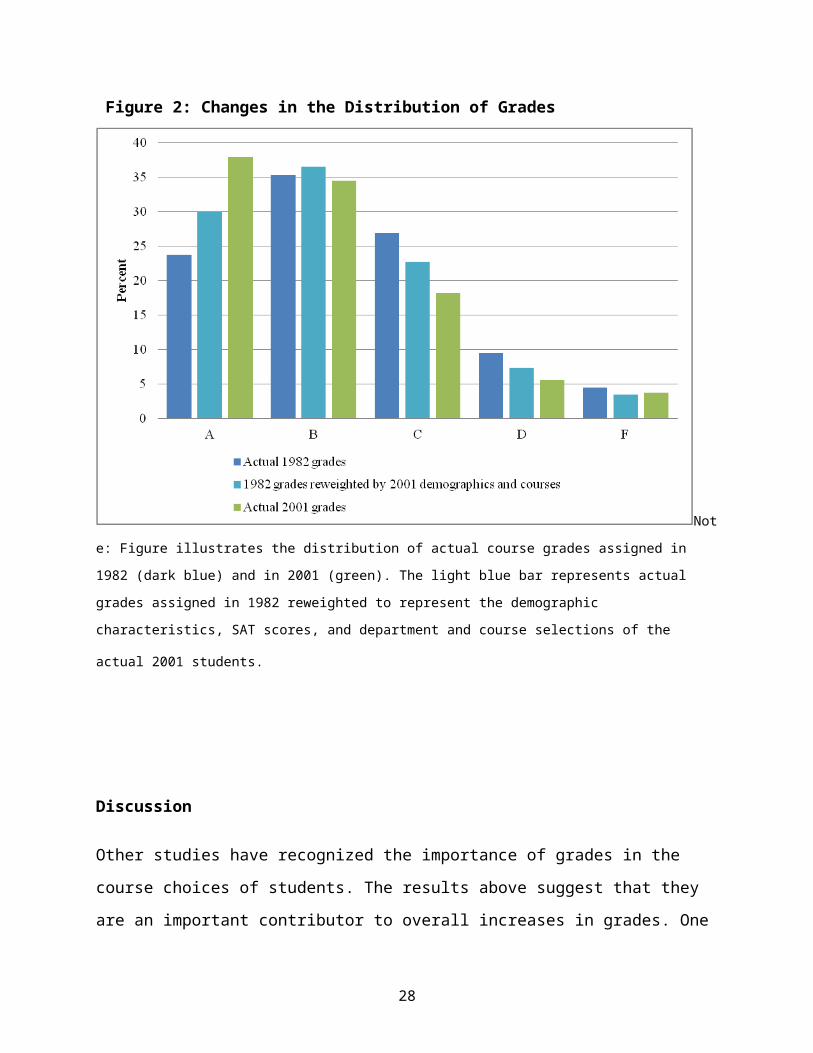
Figure 2 examines how the distribution of grades changed between the beginning and ending of
the sample period using the reweighting technique detailed above. The dark blue bars illustrate
that in 1982 about 24 percent of grades were As, 35 percent Bs, 27 percent Cs, 9 percent Ds, and
4 percent Fs. By 2001—the green bars in the chart—the proportion of As had increased to 38
percent and Bs, Cs, and Ds, had fallen to 34 percent, 18 percent, and 6 percent; Fs were about
unchanged. Reweighting the 1982 data to match the student characteristics and course
17
enrollment patterns of 2001 (the light blue bars) suggests that a substantial portion of the
increase in grades is accounted for by changes in observable characteristics. For instance,
according to this analysis about 30 percent of students in 1982 would have received As if they
had the SAT scores and other characteristics of students in 2001 and if they had the same
enrollment patterns as did students in 2001. In this counterfactual, 30 percent of 1982 students
would have received As, 37 percent Bs, 23 percent Cs, 7 percent Ds, and 3 percent Fs. Overall,
in this analysis, changes in characteristics and course choices account for a bit more than half of
the increase in average grades over time, and for slightly less than half of the increase in the
proportion of students receiving As.
Figure 2: Changes in the Distribution of Grades
Not
e: Figure illustrates the distribution of actual course grades assigned in 1982 (dark blue) and in 2001 (green). The
light blue bar represents actual grades assigned in 1982 reweighted to represent the demographic characteristics,
SAT scores, and department and course selections of the actual 2001 students.
18
Discussion
Other studies have recognized the importance of grades in the course choices of students. The
results above suggest that they are an important contributor to overall increases in grades. One
question is how important these choices are at other schools and in earlier periods of time.
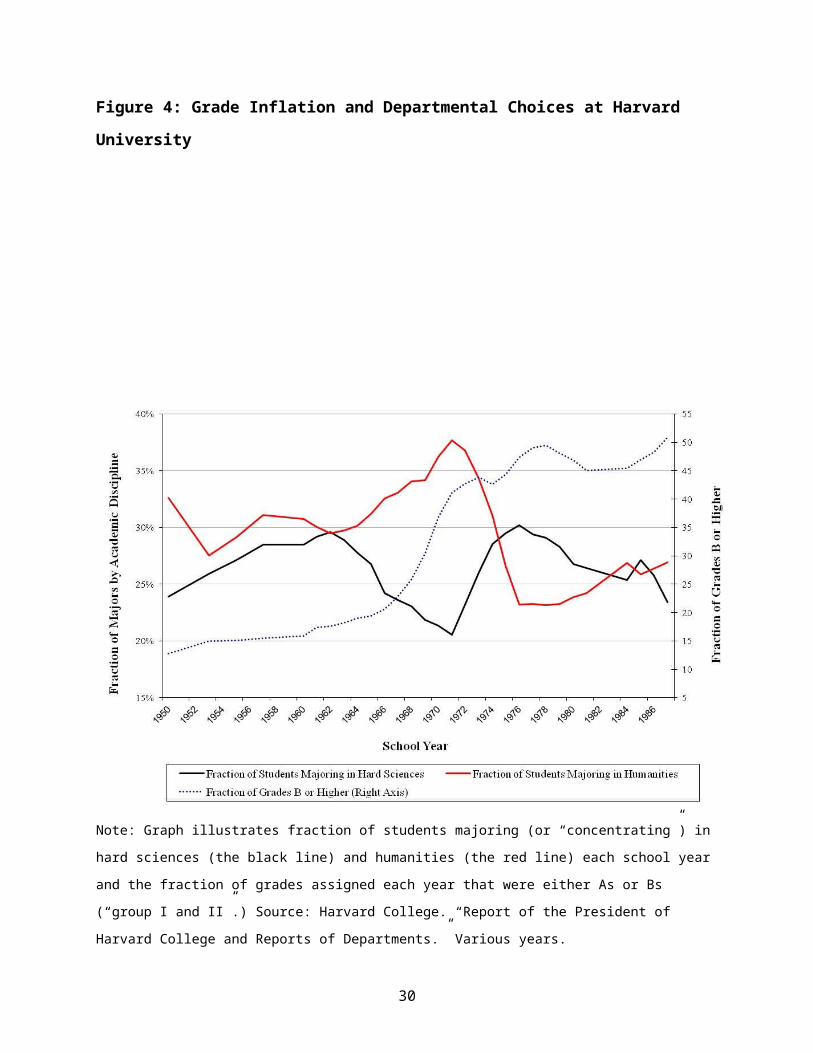
While individual-level grade data is hard to find, some evidence suggests the phenomenon could
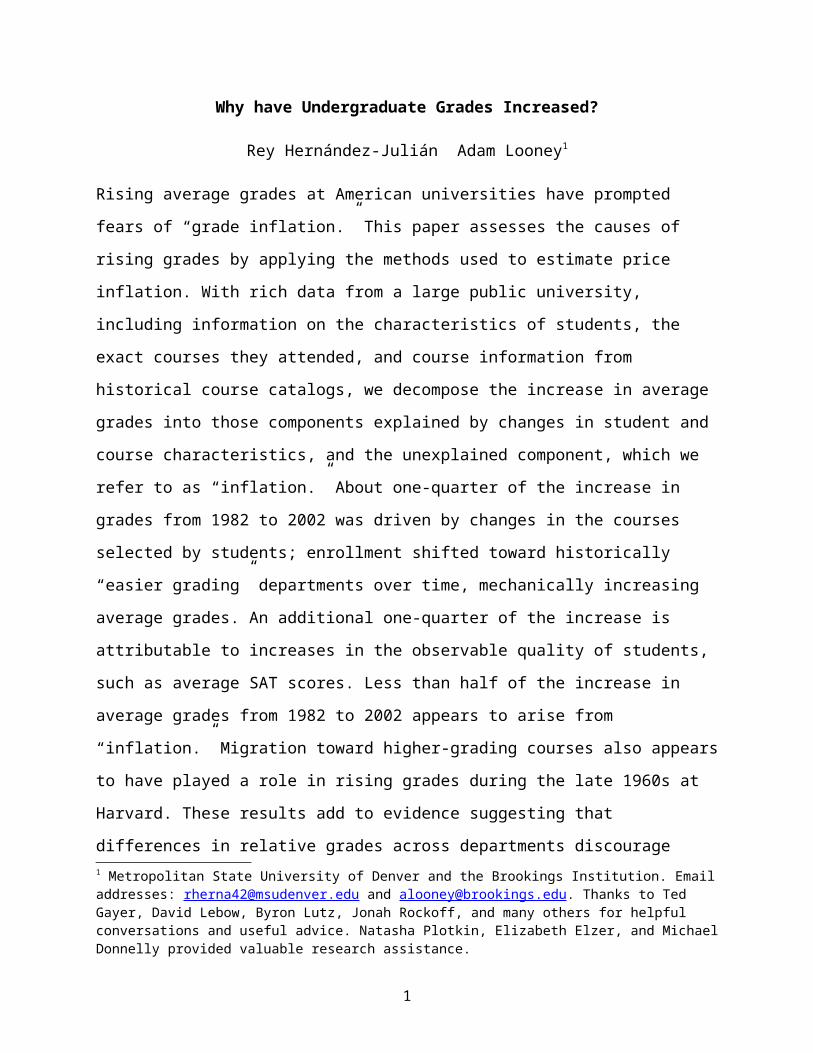
be widespread. For instance, data on course enrollment from Harvard University. The Harvard
data show that there was a migration from the hard sciences to the humanities. As seen in Figure
4, enrollment in hard sciences decreased by 10 percentage points—almost 30 percent—while
enrollment in humanities increased more than 7 percentage points (social sciences make up the
remainder). At the same time, average grades increased, suggesting that the change in enrollment
pattern was associated with rising grades as one expects given that humanities have historically
been higher grading departments. Indeed, after 1972, as enrollments began to reverse, average
grades declined slightly. (However, they remained above the level of the early 1960s, suggesting
that course choice is only one component of the increase.) The number of academic departments
also increased rapidly, from 32 in 1963 to 46 in 1975, with most of the increase between 1966
and 1972. Most of these new departments were in the humanities. Hence, students faced
increased choices of departmental offerings—often in higher-grading fields—at exactly the same
time they were presented with increased incentives to raise their grades in order to defer their
draft eligibility.
19

Figure 4: Grade Inflation and Departmental Choices at Harvard University
Note: Graph illustrates fraction of students majoring (or “concentrating”) in hard sciences (the black line) and
humanities (the red line) each school year and the fraction of grades assigned each year that were either As or Bs
(“group I and II”.) Source: Harvard College. “Report of the President of Harvard College and Reports of
Departments.” Various years.
This change in the distribution of departments and class enrollment may have been an important
driver of average grades during the Vietnam War, and would have been caused by changes in
20
students’ behavior rather than a relaxation of grading standards. Although the magnitude of the
increase in grades is unlikely to be explained entirely by the shift in course selection, it is
plausible that it made up a meaningful component of the increase.
The results in this paper indicate that for at least one major university in the U.S., changes in the
characteristics of the student body and the courses students select explain a substantial fraction of
the rise in average grades from the early 1980s to the early 2000s. The simplest way to interpret
the residual rise in grades after controlling for student characteristics and course choices is as
grade inflation, in the sense of higher grades for equivalent work. Since our analysis does not
control for the difficulty of content within individual courses or for the unobserved effort of
students, however, changes in such factors could also explain some of the residual.
The decomposition of the rise in average grades into changes in student characteristics, course
choices, and grade inflation could inform how universities and policymakers think about the
issue of rising grades and grading policy. For instance, the finding that changing student
characteristics—not just SAT scores, but gender and age of the student body—matters for
grading suggests that policies aimed at slowing the rise in grades may disproportionately affect
certain groups, raising issues of fairness. The evidence that changes in course choices have
contributed significantly to rising grades—and related evidence described above about how
students respond to incentives generated by grade differences across grades—suggests that
differences in policies across departments distort students course choices. This can have direct
negative consequences by discouraging students from pursuing courses of greatest interest to the
student or skills in greatest demand in the labor market. In addition, by contributing to rising
grades it may add to the compression in grades, weakening incentives for student learning and
providing accurate signals to potential employers and graduate schools.
21
References
Achen, Alexandra C. and Paul N. Courant. 2009. “What Are Grades Made Of?” Journal of Economic Perspectives 23(3): 77-92.
Adelman, Clifford. 1996. Principal Indicators of Student Acaademic Histories in Postsecondary Education, 1972-2000. Washington, D.C.: Department of Education, Institute of Education Sciences.
Babcock, Philip. 2010. “Real Costs of Nominal Grade Inflation? New Evidence from Student Course Evaluations.” Economic Inquiry 48(4): 983-996.
Babcock, Philip, and Mindy Marks. 2011. “The Falling Time Cost of College: Evidence from Half a Century of Time Use Data.” Review of Economics and Statistics 93(2): 468-478.
Bar, Talia, Vrinda Kadiyali, and Asaf Zussman. 2009. "Grade Information and Grade Inflation: The Cornell Experiment." Journal of Economic Perspectives 23(3): 93–108.
Chan, William, Li Hao, and Wing Suen. 2007. “A Signaling Theory of Grade Inflation.” International Economic Review 48(3): 1065-1090.
College Board. 2012. “SAT Equivalence Tables.” [http://professionals.collegeboard.com/data-reports-research/sat/equivalence-tables].
Dinardo, John. 2002. “Propensity Score Reweighting and Changes in Wage Distribution.” University of Michigan, Unpublished Manuscript.
DiNardo, John, Nicole Fortin, and Thomas Lemieux. 1996. “Labor Market Institutions and the Distribution of Wages, 1973-1992: A Semiparametric Approach.” Econometrica no. 64(5): 1001-44.
Dunn, Wendy, Mark Doms, Stephen Oliner, and Daniel Sichel. 2004. “How Fast Do Personal Computers Depreciate? Concepts and New Estimates.” NBER Working Paper 10521.
Fortin, Nicole, Thomas Lemieux, and Sergio Firpo. 2011. “Decomposition Methods in Economics.” Handbook of Labor Economics ed. 1, vol. 4, no. 4.
Griliches, Zvi, ed. Price Indexes and Quality Change. Cambridge, Mass.: Harvard Univ. Press, 1971.
Harvard College. “Report of the President of Harvard College and Reports of Departments.” Various years.
Hernández-Julián, Rey. 2010. “Merit-Based Scholarships and Student Effort.” Education Finance and Policy 5(1):14-35.
Jewell, R. Todd, Michael A. McPherson, and Margie A. Tieslau. Forthcoming. “Whose Fault Is It? Assigning Blame for Grade Inflation in Higher Education.” Applied Economics.
Johnson, Valen. Grade Inflation: A Crisis in College Education. New York: Springer, 2003.Marklein, Mary Beth. 2002. “A call for an end to grade inflation.” USA Today, February 5. [http://www.usatoday.com/life/health/2002-02-05-grade-inflation.htm].
Rojstaczer, Stuart. “Grade Inflation at American Colleges and Universities.” www.gradeinflation.com, June 24, 2008.
22
Rojstaczer, Stuart, and Christopher Healy. 2010. “Grading in American Colleges and Universities.” Teachers College Record.
Rosovsky, Henry, and Matthew Harley. 2002. “Evaluation and the Academy: Are We Doing the Right Thing?” American Academy of Arts and Sciences.
Sabot, Richard, and John Wakeman-Linn. 1991. “Grade Inflation and Course Choice.” Journal of Economic Perspectives 5(1):159-170.
Tampieri, Alessandro. 2011. “Grade Inflation, Students’ Social Background, and String-Pulling.” Quaderni DSE Working Paper no. 801.
Triplett, Jack. 2004. “Handbook on Hedonic Indexes and Quality Adjustments in Price Indexes: Special Application to Information Technology Products.” STI Working Paper 2004/9.
U.S. Department of Education, National Center for Education Statistics. 2011. Digest of Education Statistics, 2010 (NCES 2011-015), Chapter 3.
U.S. Department of Education, National Center for Education Statistics, Higher Education General Information Survey (HEGIS). 2011. “Degrees and Other Formal Awards Conferred” surveys, 1970-71 through 1985-86; and 1990-91 through 2009-10 Integrated Postsecondary Education Data System, “Completions Survey” (IPEDS-C:91-96), and Fall 2001 through Fall 2010. [http://nces.ed.gov/programs/digest/d11/tables/dt11_289.asp].
23
Appendix 1: Demographic characteristics of student body compared with nationIn the table below, we compare demographic characteristics of the student body studied
in this paper with statistics on students enrolled at 4-year, degree-granting institutions across the country, using data from the National Center for Education Statistics and the College Board. At the school we study, in 2009, men made up about an 11 percent higher share of the student body than at other 4-year schools. The student body is also less diverse than the national average, with white students comprising about 82 percent of students, compared with 65 percent among all 4-year schools. As one would expect from a college that ranks among the top 100 in U.S. News and World Report’s national college rankings, a much higher-than-average share of the student body is enrolled full time, and entering freshmen earn higher SAT scores than the national average.
University a Nation b
Percent full-time 93.6 78.6Percent male 54.4 43.8Race (percentages) White 82.2 64.8 Black 7.2 13.7 Hispanic 1.5 9.6 Asian 1.6 6.5SAT Verbal 25th-75th percentile range 550-640 420-580
SAT Math 25th-75th percentile range 580-670 430-600a. Demographic statistics represent degree-seeking undergraduate students. SAT score ranges represent first-time, first-year degree-seeking students enrolled in Fall 2009.b. Demographic statistics represent undergraduates at 4-year degree-granting institutions, except race data, which also includes post-baccalaureate students. SAT score ranges represent 2009 college-bound seniors.
Sources: Common Data Set for the university studied; National Center for Education Statistics’ Digest of Education Statistics, 2011, Tables 202 & 238 [http://nces.ed.gov/programs/digest/index.asp]; College Board’s 2009 College-Bound Seniors Total Group Profile Report [http://www.clemson.edu/oirweb1/FB/factBook/CommonDataSet2009.html.
Appendix 2: Chemical Engineering Course Match ExampleThe left panel provides the course titles and descriptions from the 1985-1986 course guide; the right panel provides the same material from the 2001 course guide. For certain classes (e.g. Introduction to Chemical Engineering) the title and description match perfectly. In other cases, for example Unit Operations Theory I in 1985 and Fluid Flow in 2001, the match is more subjective and the match is made based on the sequence of classes and the similarity of the course description.
24
Chemical Engineering, 1985
201 Introduction to Chemical Engineering 3(2,2) An introduction to the concepts of chemical engineering and a study of PVT relations for gases and vapors, material and energy balances, equilibria in chemical systems, and combined material and energy balances. Preq: CH 112, ENGR 180.
220, H220 Chemical Engineering Thermodynamics I 3(3,0) A first basic course in static equilibria. Topics include the first and second laws of thermodynamics, real and ideal gases, thermodynamic properties of fluids, phase changes, and heats of reaction . Preq: CHE 201 and MTHSC 206
301 Unit Operations Theory I 3(3,0) The general principles of chemical engineering and a study of the following unit operations: Fluid Flow, Fluid Transportation, Heat Transmission and Evaporation. Special emphasis is placed on theory and its practical application to design. Preq: CHE 201, MTHSC 206.
302 Unit Operations Theory II 3(3,0) A study of selected unit operations based on diffusional phenomena. Primary attention will be given to differential contact operations such as absorption, humidification, and gas-liquid contact. Preq: CHE 301, 352.
306 Unit Operations Laboratory I 2(1,3) Laboratory work in the unit operations of fluid flow, heat transfer, and evaporation. Stress is laid on the relation between theory and experimental results and on report writing. Preq: CHE 301 .
Chemical Engineering, 2001
211 Introduction to Chemical Engineering 4(3,2) Introduction to fundamental concepts of chemical engineering, including mass and energy balances, PVT relationships for gases and vapors, and elementary phase equilibria; problem-solving and computer skills are developed in lab. Preq: CH 102; ENGR 120, PHYS 122.
220 Chemical Engineering Thermodynamics I 3(3,0) Topics include first and second laws of thermodynamics, ideal gases, PVT properties of real fluids, energy balances with chemical reactions, and thermodynamic properties of real fluids. Preq: CH E 211 and MTHSC 206.
307 Unit Operations Laboratory I 3(2,3) [O.1] [W.1] Laboratory work in the unit operations of fluid flow, heat transfer, and evaporation. Stress is on the relation between theory and experimental results and the statistical interpretation of those results and on report preparation and presentation. Preq: CH E 311, E G 209. Coreq: EX ST 411 or MTHSC 302.
311 Fluid Flow 3(3,0) Fundamentals of fluid flow and the application of theory to chemical engineering unit operations, such as pumps, compressors, and fluidization. Preq: CH E 211, MTHSC 206.
312 Heat and Mass Transfer 3(3,0) Study of the basics of heat transmission and mass transport. Special emphasis is placed on theory and its application to design. Preq: CH E 220, 311.
25
Appendix 2: Selected additional course match examples
1985 Course 2001 CourseAccounting 405: Corporate Taxation Tax planning and research. Income taxation with emphasis on special problems applicable to corporations, partnerships, estates, and trusts. Preq: Junior standing.
Accounting 406: Business Taxation Provides an introduction to the importance of taxation in business decision making; emphasizes the interrelationship of taxes, the choice of business form, and various business transactions; exposes students to the breadth of business decisions which are affected by the Federal Income Tax. Preq: A grade of C or better in ACCT 301.
Computer Science 120: Introduction to Information Processing Systems Introduction to the techniques, principles and concepts of modern information processing systems, intended primarily for nontechnical majors. Topics include information processing packages and application, usage of typical information processing packages, digital computers, programming fundamentals and languages, and implementation of computer programs.
Computer Science 120: Introduction to Information Technology Investigation of ethical and societal issues based on the expanding integration of computers into our everyday lives. Historical background, terminology, new technologies and the projected future of computers are considered. Practical experience with common computer software technologies is included. Will not satisfy computer science requirements in any computer science major.
Political Science 422: Public Policy Analysis Selected views of public administration and the problems involved. Preq: POSC 101 or consent of instructor.
Political Science 421: Public Policy Processes Introduction to public policy process, analysis, and evaluation. Topics include examination and comparison of policymaking models, policy analysis and decision-making techniques, and approaches to program evaluation. Preq: PO SC 101, Junior standing, or consent of instructor.
Zoology 201: Invertebrate Zoology A survey of the phyla of invertebrate animals, including their taxonomy, morphology, development, and evolution. Preq: BIOL 111 or consent of instructor.
Biological Sciences 302: Invertebrate Biology In-depth survey and comparison of free-living invertebrate animals emphasizing functional anatomy, development, and evolutionary relationships. Preq: Introductory two-semester biology sequence with laboratory. Coreq: BIOSC 306.
26
Appendix 3: Comparison of Full Sample with Regression Sample
The raw data we received from the university contains about 3.1 million course observations. From the outset, we drop the roughly 400,000 observations of graduate courses, which are those with course numbers 600 or above, leaving us with a sample of about 2.7 million undergraduate-level course observations.
In the regression sample, we exclude the roughly 18 percent of undergraduate course observations that are missing values for one or more of the control variables. In about two-thirds of these cases, the missing values are SAT scores. In Appendix Table 3 we compare means for a number of characteristics of the regression sample with means for all observations in the full sample for which data is available. The differences in means between the regression sample and the available data in the full sample are negligible for grades, SAT scores, and gender. The only characteristic for which the regression sample and full sample differ meaningfully is student age: The course-credit-weighted average age of a student in the regression sample is 0.5 years lower than the average in the full 1982-2002 sample.
The bottom table below provides a more detailed comparison of the sample of students missing SAT scores with the rest of the sample. The most significant difference between students with missing SAT scores and the rest of the sample is their average age: In 1982, the course-credit-weighted average age of students who are missing scores is 5.6 years higher than that of students with non-missing scores. This discrepancy shrinks over the sample period to a difference of 3.0 years in 2002. While the average grades of students with non-missing SAT scores rise steadily over the sample period, from 2.65 in 1982 to 3.00 in 2002, there is no clear upward trend among the students with missing scores. For these students, average grades fluctuate between about 2.8 and 2.9 throughout the sample. The fraction of students with missing scores rises from about 13 percent to 18 percent between 1982 and 1997, after which it falls steadily to about 12.6 in 2002.
Summary Statistics: Full versus Regression Sample
School year 1982 2001 1982-2002 MissingSample Full Reg. Full Reg. Full Reg. school yearSAT Math 551 552 581 581 565 566 537SAT Verbal 546 547 561 561 552 553 535Male 0.59 0.58 0.55 0.54 0.56 0.55 0.42Age 19.7 19.3 19.8 19.5 20.1 19.6 20.5Grade 2.66 2.65 2.97 2.98 2.81 2.81 2.98
Reasons for Observation Exclusion
Num. of obs. in sample: % of sample with missing:
School Year a Full Regression SAT ScoresGende
r Age Race Grade1982-2002 2,739,705 2,241,618 10.61 0.23 0.23 0.67 5.41
1982 112,548 93,265 8.05 0.40 0.40 5.43 6.612001 146,157 122,686 11.26 0.13 0.13 0.13 5.24
27
a. Number of observations with missing school year = 82,474, or 3.0% of full sample.
Comparison of Missing-SAT-Score Sample with Rest of SampleMale Age Avg. grade % Missing
scoresMissing SAT No Yes No Yes No Yes1982 0.58 0.60 19.3 24.9 2.65 2.83 13.421983 0.57 0.59 19.4 24.8 2.67 2.84 13.231984 0.57 0.58 19.4 24.6 2.71 2.86 12.951985 0.57 0.55 19.5 25.1 2.68 2.85 13.701986 0.56 0.55 19.5 24.7 2.69 2.88 13.511987 0.56 0.53 19.5 24.9 2.71 2.84 13.571988 0.56 0.55 19.5 24.6 2.73 2.84 13.351989 0.56 0.57 19.5 24.7 2.73 2.85 13.961990 0.56 0.59 19.5 24.2 2.77 2.78 14.091991 0.56 0.56 19.4 24.2 2.79 2.80 16.111992 0.56 0.57 19.5 24.4 2.81 2.85 16.761993 0.55 0.58 19.6 25.0 2.84 2.91 16.971994 0.54 0.58 19.7 25.0 2.84 2.90 17.201995 0.54 0.59 19.9 25.0 2.87 2.87 17.001996 0.53 0.59 20.1 24.3 2.88 2.85 17.841997 0.53 0.58 20.1 23.8 2.88 2.83 17.831998 0.53 0.58 20.1 23.6 2.91 2.88 17.601999 0.54 0.57 20.0 23.1 2.91 2.84 16.552000 0.54 0.55 19.7 22.7 2.94 2.89 15.222001 0.54 0.56 19.5 22.4 2.98 2.91 14.692002 0.54 0.55 19.1 22.1 3.00 2.91 12.61
Appendix 4: Class size and course load controlsIn this appendix, we estimate regression specifications to examine two additional
potential contributors to the rise in average grades over the sample period: changes in average class size and changes in average course load taken on by students. Column 1 of the table below, provided for reference, is identical to column 3 of table 3 in the main paper. Column 2 repeats this regression adding a control for class size to the specification, while column 3 replaces that control with one for the student’s course load. For each course grade observation, class size is defined as the number of students enrolled in the course, while course load is defined as the number of credits the student is taking for credit during the year in which he takes that course. 2002 is omitted from the specification with the course load control, since only half of that year’s course data is available.
The coefficient on class size is close to zero and has negligible effects on the year fixed-effect coefficients. A one-credit increase in course load, meanwhile, is associated with a 0.014-
28
point higher course grade, after controlling for department and course level and demographic effects. Since average course load decreased slightly over the sample period, from 31.5 to 30.3 between 1982 and 2001, controlling for course load actually makes the remaining time trend slightly steeper: The coefficient on the 2001 dummy is 0.02 higher with a course load control included that without. It is unclear how to interpret the course load control, since it seems unlikely that a heavier course load would, in itself, lead to a student to earn higher grades. What seems more likely is that the course load control is capturing some unobserved component of student ability, which is plausible considering that SAT scores are imperfect measures of ability.
Covariate (1) (2) (3)1983 0.0169 0.017 0.01891984 0.0455 0.0457 0.04971985 0.0155 0.0157 0.02171986 0.0118 0.0119 0.02191987 0.0283 0.0282 0.03831988 0.0317 0.0314 0.04511989 0.0258 0.0255 0.04011990 0.0507 0.0506 0.06521991 0.0597 0.0597 0.07381992 0.0722 0.0723 0.08991993 0.0809 0.0812 0.11994 0.073 0.0734 0.09161995 0.0857 0.086 0.1081996 0.0832 0.0836 0.1061997 0.0752 0.0754 0.0991998 0.114 0.114 0.1381999 0.109 0.109 0.1312000 0.13 0.13 0.1512001 0.158 0.158 0.1782002 0.157 0.158
SAT Math 0.00242 0.00242 0.00238SAT Verbal 0.00138 0.00138 0.00137Male -0.252 -0.252 -0.237Age 0.0208 0.0208 0.0219Race FEs X X XDept. and level FEs X X XClass size 3.78E-06Course load 0.0139Constant 0.24 0.238 -0.0107Observations 2,241,614 2,241,614 2,180,369
29
R-squared 0.186 0.186 0.193a. Number of department-plus-level fixed effects is 337.
The figure below plots the coefficients on year fixed-effects from columns 1 and 3 of the regression table. Column 2 is not graphed since the year fixed-effect coefficients are negligibly different from those in column 1.
19831984
19851986
19871988
19891990
19911992
19931994
19951996
19971998
19992000
20012002
0
0.02
0.04
0.06
0.08
0.1
0.12
0.14
0.16
0.18
0.2
Baseline Courseload control
Appendix 5: Individual class controlsWe test the robustness of the department and course-level fixed effects in the baseline
model by replacing these controls with a set of fixed effects for individual courses. The first column of the table below replicates column 3 from table 3 in the main paper. The second column repeats this regression replacing the department and course-level fixed effects with fixed effects for individual courses, yielding year fixed-effect coefficients that are, on average, 0.015 points smaller than in the original model. This specification can control for course-choice effects only imperfectly, since many courses are not observed for one or more years within the sample period. (Courses may be missing either simply because they are introduced or cancelled at some point between 1982 and 2002 or because they changed department or number but were not matched to their new department or number due to imperfections in our matching process.)
In column 3, therefore, we limit the sample to courses that we observe during every year from 1982 and 2001. Though this strategy has the downside of shrinking the sample by 35 percent, increasing the risk of selection bias, the resulting coefficients on year fixed effects are very close to those in column 2. Many of the classes that are dropped in column 3 are missing only in 2002, since in that year we only observe data from the first half of the academic year. In column 4, therefore, we limit our scope to the years 1982 to 2001, which allows us to drop fewer
30
classes. Again, the resulting regression coefficients are similar to those in columns 2 and 3 of the table. Interestingly, the bulk of the difference in year fixed-effect coefficients between the original regression and the regression in column 3 emerges in the early years of the sample period, from 1983 to 1985, and stays relatively constant thereafter. The same can be said of the coefficients in column 4.
The graph below plots the coefficients on year fixed effects for each column in the table.
Covariate (1) (2) (3) (4)1983 0.0169 0.0134 0.0182 0.01561984 0.0455 0.0414 0.0389 0.03961985 0.0155 0.00782 0.00129 0.001281986 0.0118 0.00297 -0.0114 -0.0181987 0.0283 0.015 0.00891 0.003261988 0.0317 0.0185 0.0217 0.006511989 0.0258 0.0119 0.0131 -0.000911990 0.0507 0.0349 0.0244 0.01641991 0.0597 0.0459 0.05 0.03871992 0.0722 0.0561 0.0738 0.06371993 0.0809 0.0656 0.0706 0.06211994 0.073 0.058 0.0531 0.04441995 0.0857 0.0675 0.0698 0.05451996 0.0832 0.0606 0.066 0.05221997 0.0752 0.0505 0.0604 0.04571998 0.114 0.0888 0.103 0.08731999 0.109 0.0885 0.0947 0.0822000 0.13 0.109 0.121 0.1072001 0.158 0.138 0.144 0.1312002 0.157 0.145 0.133
SAT Math 0.00242 0.00249 0.00279 0.00282SAT Verbal 0.00138 0.0014 0.00149 0.00145Male -0.252 -0.246 -0.261 -0.257Age 0.0208 0.021 0.0225 0.0228Race FEs X X X XDept. & level FEsCourse FEs Xa Xb Xc Xd
Constant 0.24 0.202 0.0548 -0.115
Observations 2,241,6142,241,61
4 1,465,660 1,503,725R-squared 0.186 0.22 0.205 0.204
Sample
full full
Always-offered classes
Always-offered classes
excluding 2002
a. Number of department and course level fixed effects is 336.b. Number of course fixed effects is 2,838
31
c. Number of course fixed effects is 409.d. Number of course fixed effects is 503.
19831984
19851986
19871988
19891990
19911992
19931994
19951996
19971998
19992000
20012002
-0.05
0
0.05
0.1
0.15
0.2
Dept.+level controlsClass controls, full sampleClass controls, always-offered classesClass controls, always-offered classes excluding 2002
32