Embed Size (px)
Citation preview

Why Europe’s energy and
climate policies are coming apart*
David Buchan
SP 28
July 2013
* This paper has benefited from comments by OIES colleagues: Patrick Heather, Malcolm Keay, John
Rhys, David Robinson, Katja Yafimava, and is based in part on a report by the author for the European
Parliament.
ii
The contents of this paper are the author’s sole responsibility. They
do not necessarily represent the views of the Oxford Institute for
Energy Studies, of any of the Institute’s members, and/or of the
author’s other affiliations.
Copyright © 2013
Oxford Institute for Energy Studies
(Registered Charity, No. 286084)
This publication may be reproduced in part for educational or non-profit purposes
without special permission from the copyright holder, provided acknowledgment of
the source is made. No use of this publication may be made for resale or for any other
commercial purpose whatsoever without prior permission in writing from the Oxford
Institute for Energy Studies.
ISBN 978-1-907555-79-4

iii
Contents
1. Introductory summary ................................................................................................ 1
2. Recession and other cyclical tensions between energy and climate policies ...... 4
Beguiling contrast with the USA in electricity (1) .................................................... 5
Beguiling contrast with the USA in gas (2) ............................................................... 6
3. Renewables and other structural factors driving energy and climate policies
apart .............................................................................................................................. 9
Capacity mechanisms............................................................................................... 17
Remedies .................................................................................................................. 21
4. Infrastructure – stitching the market together, slowly ....................................... 24
The Infrastructure Regulation of 2013 ..................................................................... 25
5. Market coupling, network codes, and other tools of integration ....................... 29
Electricity ................................................................................................................. 30
Prices .................................................................................................................... 30
Market design....................................................................................................... 31
Network Codes..................................................................................................... 33
Gas ........................................................................................................................... 34
Prices .................................................................................................................... 34
Market design....................................................................................................... 36
Network codes ..................................................................................................... 40
6. Conclusion .............................................................................................................. 41
References ................................................................................................................... 45
Figures
Figure 1: Evolution of end-user electricity prices for industry, taxes excluded (2005 =
index 100) ...................................................................................................................... 5
Figure 2: US and UK gas prices drift apart.................................................................... 6
Figure 3: The UK’s shrinking margin of safety ........................................................... 10 Figure 4: Installed electricity generating capacity in Germany (GWs) ....................... 11 Figure 5: Increasing penetration of green power ......................................................... 12
Figure 6: Renewable support levels by country and technology (2011) ..................... 14 Figure 8: Wholesale day-ahead gas prices at selected EU hubs – 2009–12
(Euro/MWh) ................................................................................................................. 36
Tables
Table 1: Member states’ progress – renewable shares in total energy consumption ... 17 Table 2: Annual average price at European spot exchanges – 2005 to 2011
(euro/MWh) ................................................................................................................. 31

1
1. Introductory summary
The European Union is the only major region of the world that has seriously tried to
integrate its energy and climate policies. Reflecting the fact that, in terms of a global
average, the burning of fossil fuels accounts for two-thirds of all man-made
greenhouse gases, the EU has made emissions reduction a very significant goal of its
energy policy, while still retaining the more traditional aim of ensuring supplies of
secure and affordable energy. It has promoted low-carbon energy supply, and pursued
energy efficiency policies to curb energy demand and therefore emissions. Initially,
energy and climate policies were legislated separately. In the late 1990s, the EU
started to pass reforms – in the hope of creating a single market in energy – while in
the early 2000s it began to set indicative renewable energy targets for its member
states. Then in 2005 the EU established the Emissions Trading System (ETS), a pan-
European climate instrument whose coverage encompassed all major electricity
generators. Energy and climate policies were further bolted together in the energy and
climate package of legislation that was proposed in 2007, negotiated in 2008, and
approved in 2009. The energy part of this package was the Third Package of reforms
to trading arrangements and regulatory governance of the single market, while the
climate part comprised a revamp of the ETS, mandatory targets for renewable energy,
and a softer target for energy efficiency. Climate and energy policies need to go
together. Climate policy really is synonymous with energy policy; agriculture is the
only other sector producing major amounts of man-made greenhouse gases, but
drastic action here would involve an end to ploughing (which releases carbon from
the soil) or to keeping livestock (which generates methane).
But, after what looked in 2009 like a plausible marriage between climate and energy
policy, divorce is now in the air. Recession has made Europe’s governments, industry,
and consumers neurotic about high energy prices – which many blame on expensive
renewables. Bulgaria recently lost a government to protests about electricity prices;
Spain has broken contracts with renewable energy producers in order to scale back its
commitments to them; and German industry is obsessed about losing export
competitiveness because of energy costs. The main complaint is about the surge in
subsidies on renewables. The complainers make the contrast with the USA, which
they say has refused to saddle itself with a burdensome climate policy and which is
also reaping the benefit of shale gas, driving down both its gas and electricity costs.

2
Few complain about the cost of the ETS, because it has not actually brought about any
real costs; recession has rendered it useless as a financial instrument for promoting
low-carbon generation and curbing high carbon consumption. Yet few rush to fix the
ETS, lest a repaired ETS impose a cost that would be unwelcome in times of
recession. Günther Oettinger, the EU energy commissioner, argues that Europe can no
longer afford to subordinate energy policy to a unilateral climate policy. ‘We cannot
be the good guys for the whole world, when no one is following us’, he told a
Brussels conference at the end of May 2013.
However, the growing tension between energy and climate policies is not just the
result of recession – a cyclical factor. The Commission’s energy directorate has
become increasingly worried that climate-related policies – in other words national
subsidies for renewables and for back-up generation capacity (needed for intermittent
renewables) – are throwing up structural obstacles in the pathway to a pan-European
market. These national subsidy schemes serve national interests and priorities, not
surprisingly. National subsidies for renewable energy are designed to help national
renewable generators meet national renewable targets; this distorts investment
patterns within the single market. National capacity schemes reserve national spare
capacity for national needs, in contravention of normal free trade within the single
market.
But the objection of the Commission’s energy directorate to national subsidies is not
just that they are national; the Commission had to concede national subsidies for
renewable energy when it failed twice in the 2000s to convince the Council of
Ministers and the Parliament of the merits of a pan-European renewable subsidy
scheme which would have involved green electricity certificates being traded across
borders, in the same way as ETS allowances. The Commission’s other objection to
these national schemes is that they introduce a degree of state intervention into the
marketplace that undermines the liberalization considered necessary to achieve the
single market.
As a result, the Commission is undertaking what it sees as a damage limitation
exercise by producing guidelines that, among other goals, seek to Europeanize, or at
least regionalize, national renewable and capacity subsidies. The guidelines, expected
during the summer of 2013, will urge member states to harmonize, or even merge,

3
support schemes for renewables, perhaps on a regional basis, and to allow energy
companies from other member states to participate in capacity schemes.
However, these recommendations assume rapid progress in completing the framework
for the single market – in terms of building more cross-border interconnectors,
harmonizing trading arrangements, and agreeing on network codes in electricity and
gas. In 2011 EU leaders said this work should be completed by 2014, as part of their
public commitment to having ‘a fully functioning, interconnected and integrated
internal energy market’ by that date. This work is proceeding. The Commission
wants, in particular, to achieve maximum progress towards a pan-European energy
network, so as to give individual member states minimal excuse to design autarkic
national renewable and capacity schemes. But building infrastructure takes a long
time and harmonizing trading arrangements is a complex business; it is clear the work
will only be half finished in 2014.
Some member states might therefore be tempted to ignore these guidelines, and if so
the Commission might eventually be tempted to use its state aid control powers in an
attempt to enforce aspects of the guidelines. This would be the wrong way to tackle
the growing contradiction between energy market liberalization and climate-related
public intervention for all concerned. The Commission needs to produce a serious re-
think of how to accommodate these conflicting goals, and governments need to give
the matter serious consideration. Unless the EU abandons its climate policy, which is
still unlikely, the problem will not go away. Both renewable energy and back-up
generating capacity may need subsidizing on a permanent basis.
4
2. Recession and other cyclical tensions between energy and climate
policies
The two cyclical factors creating strain between Europe’s energy and climate policies
are the economic downturn and the failure of the rest of the world to follow Europe’s
unilateral lead on climate policy. These factors will not last forever – which is why
they can be described as cyclical – but they will last for some time. Austerity policies
look like prolonging the eurozone debt crisis for several years to come. In 2015 the
global climate negotiations are supposed to produce an agreement, which could bring
the USA, China, and other major emitters more into line with the EU. However, it is
already agreed that such an accord would not take effect until 2020.
Deepening recession and rising unemployment in large parts of Europe have
increased public sensitivity about the price of energy, especially that of gas which in
Europe is expensive to the extent that it is linked to the still-buoyant world price of
oil. Much of the blame for high energy prices is attributed to climate policies in
general, and to subsidies for renewables in particular. The volume of these subsidies
is rising at least as fast as the level of renewable energy generation capacity, which is
increasing each year in line with EU-agreed targets. Indeed, subsidies for renewables
are rising faster than renewable generation capacity in some countries, for example
the UK, which is pushing more expensive offshore wind generation capacity harder
than cheaper onshore wind.
Prominent among those people arguing most strongly for EU energy policy to be
decoupled from climate policy are Europe’s industrialists. This is despite the fact that
provision has been made at the EU level, and in most member states, to exempt
energy-intensive sectors from some or all of the extra climate-related costs imposed
on energy users. Intensive energy users judged to be particularly exposed to
international competition can get free carbon allowances on the Emission Trading
System, although this is currently a minor benefit given the low ETS price. In addition
to this assistance, most EU governments, including the UK, have added tax breaks or
cost exemptions. In Germany, where the clamour is loudest about the issue of
Europe’s energy costs undermining its competitiveness, energy-intensive companies
pay a tiny fraction of the renewable energy surcharge that German households have to

5
pay. These companies are also exempted from electricity grid charges with, again,
German households picking up the bill and cross-subsidizing industry.
However, the factor which is making much of European industry both anxious and
jealous is the perceived benefits of the shale gas revolution in the USA. The European
Commission noted with alarm in its March 2013 Green Paper on energy and climate
policy that gas prices for industry were more than four times lower in the USA than in
Europe. [1] The Green Paper cites IEA data that, for the 2005–12 period, real
(discounting for inflation) electricity prices charged to industry rose by an average of
38 per cent in west European countries, while in the USA they decreased by 4 per
cent, mostly because of lower gas generation costs.
Beguiling contrast with the USA in electricity (1)
Figure 1: Evolution of end-user electricity prices for industry, taxes excluded
(2005 = index 100)
Source: International Energy Agency.
6
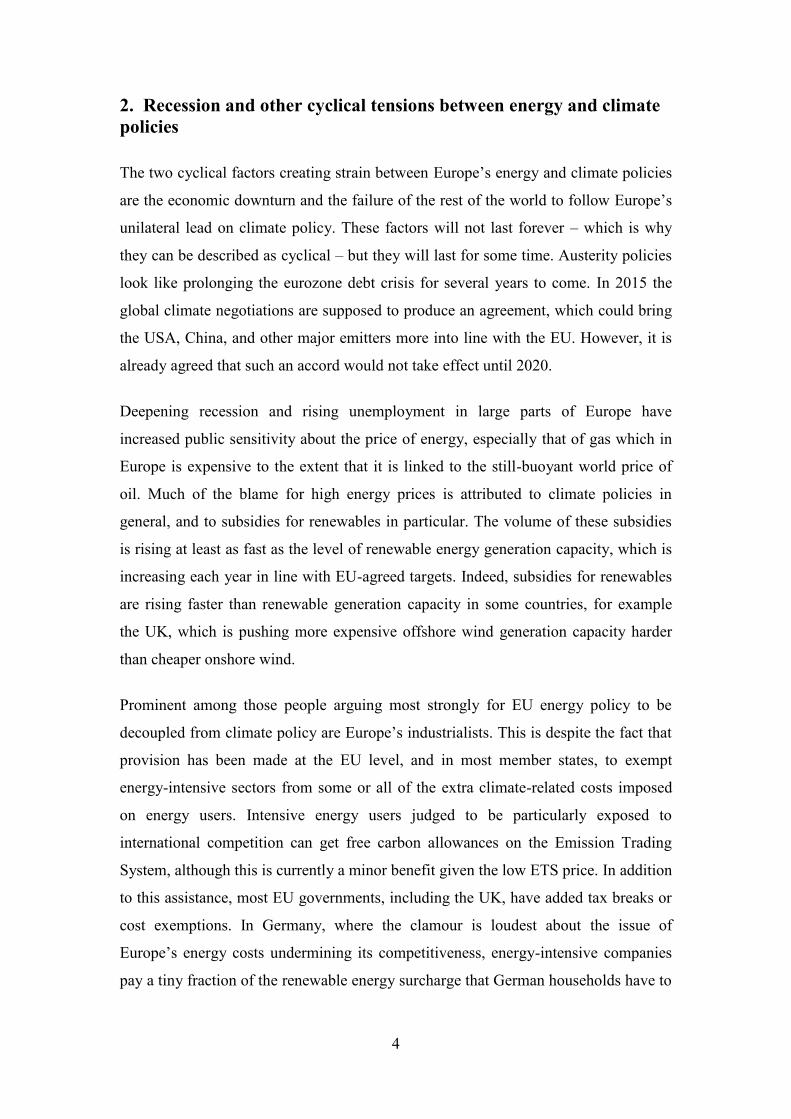
Beguiling contrast with the USA in gas (2)
Figure 2: US and UK gas prices drift apart
Source: EU Joint Research Centre report on unconventional gas, 2012
It is not self-evident that cheap energy has always benefited the USA or other
countries such as Russia, especially where the energy in question is fuel for
appliances like cars. High or higher energy prices have driven efficiency in Europe
and Japan and have helped them sell products all around the world. Countries can
adjust to higher energy prices, shedding jobs in sectors where energy is a significant
raw material input, and gaining jobs in sectors producing energy-efficient appliances
and services. But there is no escaping the fact that European industries such as
aluminium, chemicals, and petrochemicals face a real worry about losing jobs and
market share to the USA. Gas accounts for 35 per cent of the energy used by Europe’s
chemical industry, and gas can represent 60–80 per cent of the cost of fertilizer. Since
2008 Europe has lost 2m tonnes of aluminium production a year, while global
production has expanded by 10m tonnes a year, mainly in the Middle East and Asia.
But Europe cannot do much to close the current gas price gap. It might be able to buy
gas in the USA cheaply, but the cost advantage could not survive the journey across
the Atlantic, once the costs of liquefying, shipping, and re-gasifying the gas are taken
into account. Europe might of course accelerate development of its own shale gas, and
this is indeed what Poland, some other central European states, and the UK are trying

7
to do. But the consensus forecast is that shale gas production costs in Europe will be
more than double those in the USA, because, compared to the USA, Europe’s shale
layers are deeper, its regulations may be tighter, and its oil and gas service less
competitive [2]. Moreover, no substantial shale gas production is expected in Europe
until after 2020.
Europe should not panic about its gas and electricity price divergences with the USA,
partly because the differential may be temporary (certainly so, if the US government
allows gas exports that will cause domestic prices to rise), and partly because there is
not much Europe can do to close the price gap. But the US shale gas revolution
partially undermined the assumption of rising fossil fuel prices on which Europe’s
energy and climate package was negotiated in 2007–8 and signed into law in 2009.
This is important because the higher the price of fossil fuels, the lower the real net
cost of replacing them with renewables. This was part of the European Commission’s
sales pitch for the 2009 package (and the argument was also used by the UK
government for its national version of an integrated energy and climate policy). The
assumption was understandable – the oil price had risen steadily and strongly
throughout the 2000–8 period – and not totally mistaken. After a spectacularly quick
collapse and bounce-back in 2008, the oil price has stabilized at around $100 a barrel.
But Europe’s policy makers have been wrong-footed by the impact of shale
development, which few in Europe had heard about in 2007–8, on the domestic US
gas price. This has, in a sense, ‘re-regionalized’ the US gas market price. Just as it had
begun to seem that gas pricing in the US market was about to join the rest of the gas
world, through imports of LNG, shale development suddenly put the USA back on its
own separate planet of much cheaper gas prices. Direct exposure to competition from
cheaper US energy is, furthermore, all the more alarming to many European
industrialists at a time when Brussels and Washington have committed themselves to
attempts to negotiate a transatlantic free-trade zone.
Europe’s 2009 policy package was also based on the hope that the Copenhagen
summit at the end of that year would see the rest of the world copying Europe’s
ambitious lead in climate policy. That hope of a global climate treaty was dashed at
Copenhagen. What remains is a vague commitment to reach, in 2015, some sort of
agreement that would take effect in 2020. For many Europeans, their continent’s

8
failure to get matching commitments from other countries goes halfway to
undermining Europe’s unilateral climate policy – and the process of undermining is
completed by the irony that shale gas is reducing emissions in the USA while raising
them in Europe’s power generation – where increased amounts of US coal, displaced
into Europe by shale gas at home, is being burnt.
9
3. Renewables and other structural factors driving energy and
climate policies apart
In addition to cyclical factors, structural changes are also increasing the tension
between energy and climate policy in the EU’s energy sector. These mostly relate to
renewable energy: the way it has been supported through national subsidies, the
consequent demand for national subsidies for back-up power generation and, as the
European Commission sees it, the challenge that these national schemes pose to its
conception of a single pan-European energy market that it has been trying to create
for nearly 20 years. Here the tensions are as much inside the Commission as outside it
– between those who are reluctant to let the development of renewables spoil the tidy
symmetry of their single market blueprint, and those who accept that the single
market must accommodate climate policy and, if necessary, change.
The 2009 energy and climate programme was the culmination of legislative efforts
from the mid-1990s onwards to unify markets that had been originally designed as
national monopolies to serve national interests and customers. It contained a final
package of legislation to separate transmission systems from energy groups, in order
to transform them into common carriers of energy across frontiers. It formalized
European organizations of national energy regulators and transmission system
operators (TSOs), giving them the tasks of coupling markets together and of agreeing
network codes to harmonize trading arrangements across the EU (all of which is
discussed later in the paper). But all this work of linking up markets and harmonizing
trade arrangements is predicated on an ‘energy only’ market where the forces of
supply and demand are supposed to create competitive, cost-reflective, and
convergent prices, free of national barriers or aids.
However, in reality, the share of non-subsidized electricity is becoming a shrinking
part of the total market because of the growing volume of renewables. There is also
the prospect that national subsidies will be applied to a further slice of the market, in
order to keep enough conventional, fossil-fuelled generators ready and willing to
provide back-up for intermittent renewables, when the wind drops or the sky clouds
over. In this way, subsidies could take over most of the electricity market, with little
left of the ‘energy only’ market. As the Eurelectric industry association of Europe’s
main generators says, ‘competitive markets cannot be a minor part of the market’.

10
The capacity issue can cover two somewhat different problems. The first is a lack of
sufficient overall capacity in which, even if all of a country’s power generators
(renewable ones included) are generating at full capacity, there may still be a risk of
the lights going out. The UK is a classic case of this position: due to the country’s
delay in replacing dirty coal plants and ageing nuclear reactors, this risk of an overall
capacity shortage is growing. Figure 3 below shows the estimate from Ofgem, the UK
regulator, of how the country’s safety margin of reserve capacity (following the red
line marking Ofgem’s base case) will shrink from around 14 per cent of overall
generation today to less than 5 per cent by 2015/16. This is a risk, even though the
UK’s overall capacity in 2015 will still include relatively few intermittent renewables
flowing onto and off its grid.
Figure 3: The UK’s shrinking margin of safety
Source: Ofgem
The second is a problem which more EU states, and also the UK in the future, will
face as renewables grow: a lack of appropriate capacity that is both fast and
sufficiently flexible to back up intermittent renewables. This is Germany’s challenge.
The country still has considerable overall spare capacity left over from the gold-plated
pre-liberalization era. The sudden shut down in 2011 of eight nuclear reactors with 8
gigawatts (GW) of capacity, at a stroke of Chancellor Merkel’s pen, still left Germany
with nearly 100 GW of generating capacity. This constitutes, for the moment, a
comfortable reserve margin of at least 15 GW (or 15 per cent, roughly the current UK

11
margin), because peak load or peak demand is around 82–3GW. However, this
demand is being met with an increasingly changeable supply mix. What Germany
lacks is sufficient flexible conventional back-up to counterbalance the huge amount of
wind and solar power coming on stream in Germany. Figure 4 below is a projection of
Germany’s energy mix in the light of its nuclear phase-out decision and its
energiewende programme to expand renewables.
The expansion of installed capacity for renewables is shown above the dotted line in
Figure 4. This is not at all the same as actual output because only a small percentage
of total installed wind and solar capacity can be firmly relied on to produce at any
time. The area below the dotted line shows what is available as installed conventional
generating capacity – coal (hard coal and lignite), gas, and (until around 2022) some
nuclear power. This is all firm capacity – in the sense that, unlike renewables, it can
be switched on and off when needed (but only slowly in the case of nuclear,
reasonably quickly in the case of coal, and very quickly only in the case of gas and
pumped water storage). Figure 4 shows that, at least until 2020, the majority of
Germany’s conventional generating back-up, available to offset variations in
renewables, will consist of its relatively inflexible coal and nuclear capacity.
Figure 4: Installed electricity generating capacity in Germany (GWs)
Source: Prognos; Energy Research Institute; Ministry of Economics

12
In its March 2013 Renewable Energy Progress Report, the Commission said the
overall picture was of:
… a generally solid initial start at EU level, but with slower than expected removal of key barriers
to renewable energy growth and with additional efforts by particular member states necessary [3].
Table 5 below (taken from the Renewable Energy Progress Report) illustrates the
solid start in the 2007–10 period, and the fact that, according to this Eurostat
projection, it has stalled in the last two years.
Figure 5: Increasing penetration of green power
Source: Renewable Energy Progress Report.
The situation by 2010 was not looking too bad even if, on the road to the binding
targets of 2020, half the EU membership had not met their indicative goals for 2010 in
renewable electricity, and three-quarters had failed to meet indicative goals in
renewable transport. However, as regards technology, the actual deployment of
offshore wind has been falling well behind the levels set out in the national renewable
plans that member states file to Brussels. Onshore wind and biomass are also lagging.
By contrast, in what has been called ‘the solar surprise’, the installation of solar PV
capacity has outstripped expectations, though this has also led to disruptive cuts in
subsidies. As a result, renewables are penetrating the electricity sector faster than
other sectors (see Figure 5). This is line with Europe’s overall strategy of first de-
carbonizing its electricity supply and then further electrifying the wider economy.
In the first quarter of 2013, however, investment in renewables fell by 25 per cent
across Europe and came to a standstill in certain countries such as Spain. Analysis
carried out for the Commission [3] casts some doubt on the sustainability of
renewable energy expansion, because of administrative and infrastructure obstacles

13
and disruptive changes to support schemes. Barriers to renewables are still
widespread. Administrative procedures are still complex; only three countries –
Denmark, Italy, and the Netherlands – have a single permitting system for the
building of renewable generation projects. Once built, renewable projects often find it
difficult to get the necessary connection to the low-voltage grid. Such grid connection
problems for renewables usually occur within a member state and thus the new EU
regulation on infrastructure (see Section 4) is not of much help. This regulation
streamlines planning procedures for a selected number of priority high-voltage power
lines and high-pressure gas pipelines across borders.
The other constraint on the growth of renewables is the growing criticism of the cost
of subsidizing them. The nominal cost is very high (the real net cost to an economy
also depends on the costs of the fuels replaced by renewables). The latest official
figures, provided by the Council for European Energy Regulators (CEER) are for
2010, and cover only 17 EU member states (although all the larger ones are included)
[4]. According to the CEER survey, the 17 countries spent a total of Euros 25.2bn
supporting renewable electricity. Nearly 40 per cent (Euros 9.5bn) of this was in
Germany, while the second largest subsidizer was Spain with Euros 5.3bn spent in
supporting green power. Spain was spending much more than the larger states of
Italy, France, and the UK because its share of renewables in electricity generation was
much higher (20 per cent in 2011) than that of Italy (10.0 per cent), France (3 per
cent), and the UK (5.7 per cent).
Today, these subsidy figures will be different. Germany’s renewables support
spending is even higher. A 47 per cent increase in its 2013 consumer levy to pay for
renewables could bring Germany’s subsidy [in 2013] to around Euros 20bn, though
the Merkel government is trying to trim this. Meanwhile, Spain might now be
spending less on support for renewables. Madrid is certainly trying to spend less. In
2012 it suspended negotiations on any new projects and in 2010 Spain placed an
annual limit on the number of hours it was prepared to pay existing renewable
electricity producers. This limit shook investor confidence because its imposition on
existing producers appeared to be a breach of contract. Spain has not been alone in
taking retroactive measures to cut subsidies, the Czech Republic and Bulgaria have
also done so.

14
Much of the disruption has been in solar PV schemes. Solar PV merits a fairly high
level of support, because of its potential as a decentralized power source in cities and
crowded spaces. Figure 6 below shows how far solar PV subsidy levels have outpaced
support for other renewables. In 2010, for instance, solar PV in the Czech Republic
was being subsidized to the tune of Euros 496 per megawatt hour. Such a rate was far
too high, given the sharp fall in the cost of buying Chinese PV panels, and given that
PV investment is particularly reactive to subsidy incentives. Where PV subsidies are
generous, the relative ease of installing solar PV can cause a sudden surge in solar
generation capacity, outstripping infrastructure and giving rise to windfall profits for
operators. (The windfall profit margins for European solar PV developers may have
been boosted by the Chinese dumping solar panels on the EU market at a sales price
below their cost of production in China, as has been alleged by the European
Commission.) Therefore politicians and regulators have been scrambling to cut PV
tariffs, leading to a boom and bust in several countries in a way that has disillusioned
public opinion in relation to renewables, dislocated supply chains, and discouraged
future investment.
Figure 6: Renewable support levels by country and technology (2011)
Source: CEER 2013
As Marie Donnelly, the Commission official in charge of renewables, told a
conference in January 2013:
I am not sure we are going to make our 2020 targets. We cannot afford to be complacent, because
the trajectory [to meet the target] should go up sharply nearer 2020 [5].
15
This trajectory allowed member states seven years, up to 2012, to achieve the first 20
per cent of the target. However, in each subsequent two-year period up to 2020 it
steadily raises the bar, so that in 2019–20, member states are supposed to achieve no
less than 35 per cent of their total goal.
The integration challenge posed by renewables is to reduce the differences between
the 27 national schemes, and thus to reduce the trade and investment distortions they
cause – and to do so in a way that meshes renewables into the energy market more
successfully. So the challenge is to both European market and energy market
integration.
Support schemes for renewables are national for a variety of reasons: because
renewables are part of a member state’s energy mix, which is still formally a national
prerogative; because national renewables programmes long pre-date EU involvement
in this area; and because member states have been given different targets for
renewables. And because governments have different targets, they insist that they
need to have control over the subsidy schemes used to meet these targets. Faced with
the level of attachment to national subsidy schemes felt by governments, their
national renewable energy lobbies, and their supporters in the European Parliament,
the Commission confined itself, in the 2009 energy and climate package, to trying to
reduce the differences in subsidy levels by encouraging cross-border trade in
renewable energy or certificates of renewable energy. The Commission twice (in 2001
and 2007) proposed pan-European trading of green energy certificates, and twice it
was rebuffed by the Council of Ministers and the European Parliament, which have
regarded cross-border trading as EU harmonization-by-the-backdoor (which it could
be). At present, the only cross-border trading of renewables which is officially
recognized and encouraged is between consenting governments in order to meet their
targets. (And even some of this cross-border trading could be virtual rather than
actual, with one government selling a ‘statistical transfer’ of some of its renewable
energy to another government that would be buying the right to count this foreign
percentage of renewable energy towards its national target.)
The Commission is expected to propose guidelines for national support schemes
(alongside guidelines on capacity markets). These will address three main issues.
First, the issue of cost control. The guidelines will stress the need for support tariffs to

16
be adjusted transparently, regularly, and quickly so as to keep pace with falling
technology costs, as frequently did not happen with solar PV schemes. They will warn
that retroactive subsidy-cutting damages investor confidence. The guidelines may
seek to establish a benchmark of renewable technology costs that member states can
use as a basis for setting subsidy levels.
Second, the issue of energy market integration. The guidelines will suggest that
producers of renewable energy need to be more exposed to market prices and
disciplines, in the same way as conventional power producers. Feed-in tariffs – which
provide renewables producers with a fixed subsidy covering all their costs, together
with a mark-up – are now considered less useful than premiums that just top up
whatever revenue a producer of renewable energy can get from the regular energy
market. As to market discipline, renewables producers should be made responsible for
the imbalances that their erratic solar or wind power deliveries can cause. This already
happens in Spain, for example.
Finally, the issue of European market integration. Member states will be urged to
trade and cooperate more on joint renewables projects, as set out in the 2009
renewables directive. Neighbouring countries should also be encouraged to harmonize
or merge their support schemes, on the basis of regions that might coincide with areas
where regulators and TSOs are coupling markets and harmonizing trade
arrangements.
17
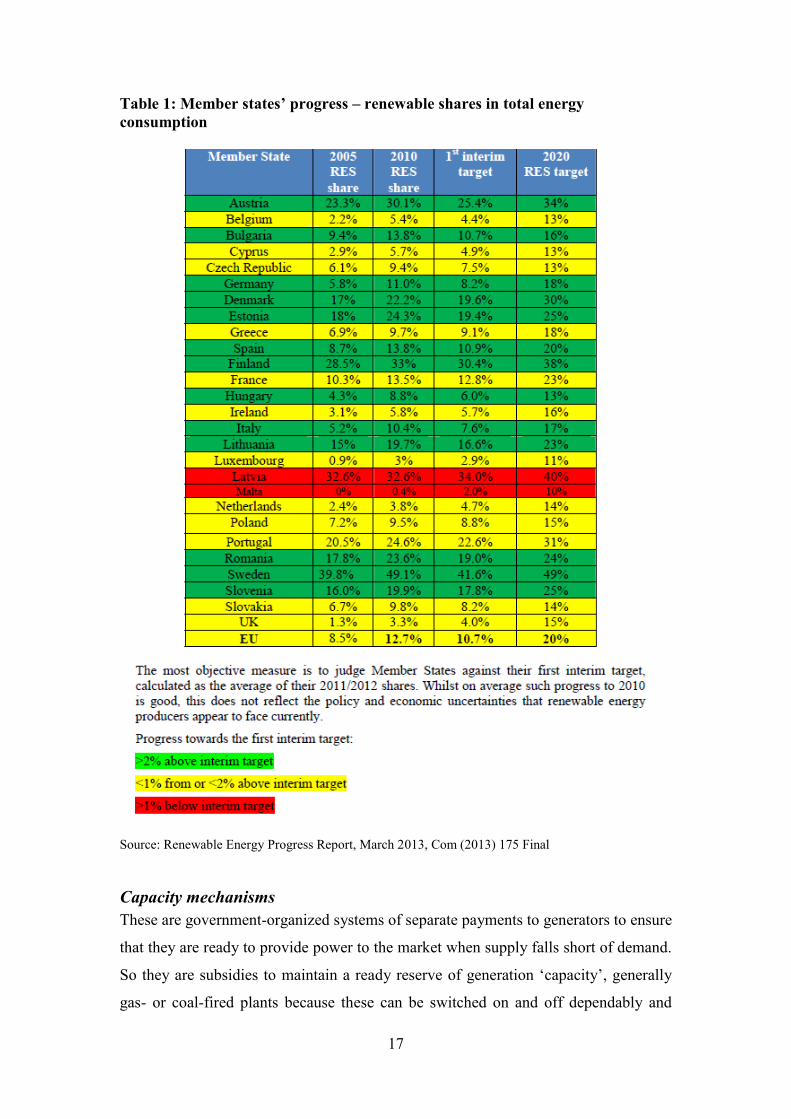
Table 1: Member states’ progress – renewable shares in total energy
consumption
Source: Renewable Energy Progress Report, March 2013, Com (2013) 175 Final
Capacity mechanisms
These are government-organized systems of separate payments to generators to ensure
that they are ready to provide power to the market when supply falls short of demand.
So they are subsidies to maintain a ready reserve of generation ‘capacity’, generally
gas- or coal-fired plants because these can be switched on and off dependably and

18
fairly quickly. These capacity mechanisms should be distinguished from traditional
short-term ‘balancing’ mechanisms or markets in which sudden variations in supply
or demand need quick, or (in the case of electricity), instantaneous correction to
restore balance; fast-reacting hydroelectricity is often used for this. However,
expansion of balancing markets can play a role in easing the capacity problem.
Renewable energies that have the greatest scope for expansion – such as wind and
solar power – complicate the economics of capacity back-up because they are not
only intermittent energy sources but are also free, in the sense that they have virtually
zero marginal or running costs. This feature puts them first in the ‘merit order’: the
traditional line-up in which electricity grid operators call upon generators to supply
demand. This dispatching system starts, logically, with the cheapest source of power,
and moves to the most expensive source until all demand is satisfied. Financially, this
means that the marginal cost of the last unit of power supplied sets the price for
everyone. So, up to now, the most expensive source with the highest marginal cost
(often likely to be gas or coal) has been able to cover its higher fuel cost, while the
cheaper generation source with zero or low marginal cost (wind, solar, nuclear) can
make enough money to cover its capital costs that are high relative to its fuel costs.
However, given the volume of subsidized renewable energy now coming on to the
grid in some countries, the ‘first’ in the merit order can also be the ‘last’. In other
words, renewable energy can, at times of high wind and solar generation, supply the
entire demand without gas or coal plants being called on and being able to earn any
money. Moreover, when renewable energy supply not only fulfils demand, but
exceeds it, the market price goes negative. This is now happening several times a year
in Germany, where renewables producers, with their near-zero operating costs, are
ready to pay a power exchange to take their electricity, provided that penalty price is
less than the subsidy they get for continuing to generate.
Some analysts argue that the current design of energy-only markets – where the only
revenue comes from the sale of energy commodities and there is no subsidy – may
never be able to cover the capital costs of intermittent wind and solar power, no
matter how competitive these renewables become [5]. The reason is that when these
renewables generate electricity, they do so uncontrollably, sometimes driving the
power price on exchanges to very low levels – even to zero or negative. When the

19
wind stops, the price rises, but at that point wind farms have nothing to sell. The daily
cycle of solar power is generally better matched with demand from the working day
than wind is. In certain sunny countries such as Spain and Chile, some developers
have started to build solar PV without subsidy because falling technology costs,
coupled with good solar resources, have brought solar PV to grid parity with
conventional fossil fuels there. However, they may find that, as solar capacity builds
up and periodically surges on to the market in ever-greater quantities, solar power
may still ‘destroy’ its own market price. The logic of this analysis is that intermittent
renewables will require permanent subsidy – unless the pricing of electricity is
reformed so that generators are rewarded, not as today for the volume of electrons
sold, but for the reliability of the service provided [6].
The intermittency of renewables makes all other energy sources in the marketplace
intermittent too This is bad business for the owners of gas and coal plants. If their
plants can only operate for a couple of hundred hours a year, it might not matter to
their owners, provided they can capture the very high peak prices a free market would
produce during those hours. But investors in conventional energy suspect that
politicians would not dare risk upsetting voters with such peak prices, and that they
will therefore cap prices. The obvious back-up for renewable energy is fast and
flexible gas plants. But gas is more expensive than coal in Europe at present. Few
companies in Europe are planning to build any new gas plants, and some companies
have mothballed existing plants in the hope of getting capacity payments.
Capacity mechanisms are controversial. In planning capacity markets, the UK and
other countries are making ‘a colossal error’, according to Walter Boltz, Austria’s
outspoken national regulator.
We made the problem ourselves with the growth in renewables, so let us think of how we can fix it
without killing the market [7].
However, the Council of European Energy Regulators (CEER), of which Mr Boltz is
a member, concedes that ‘energy only’ markets, meaning markets where a generator’s
only revenue comes from selling his energy, may have ‘some market flaws that lead
to a sub-optimal level of generation adequacy’ [8]. The regulators went on to say that
‘pure energy-only market designs have an inescapable tendency to produce scarcity
from time to time’, adding that it was difficult for regulators to distinguish between
efficient (in other words, genuine) scarcity prices, and prices that reflect market power

20
(that is, possibly affected by manipulation) during periods of scarcity. In any case, the
regulators did not believe that ‘policy-makers [i.e. politicians] are generally willing to
accept potentially severe prices spikes and the demand rationing associated with
energy-only markets’.
For its part, the European Commission has now conceded that its 2009 energy and
climate package:
… underestimated the impact on market integration of 27 different national support schemes for
renewables [and] did not address the issue of whether the market offered the necessary incentives to
invest in generation, distribution, transmission and storage capacity in a system with greater shares
of renewables [9].
What particularly haunts the Commission is the prospect that the combination of
national renewable and capacity markets would effectively shut off countries’ energy
sectors from each other, and negate much of the painstaking work, described in other
sections of this paper, of building cross-border interconnectors, agreeing pan-
European network codes, and coupling power markets. Many in the EU executive feel
that they let ‘the genie out of the bottle’ by conceding that member states could run
their own renewable support programmes, and do not want to make the same mistake
again with national capacity schemes. But the capacity genie is already uncorked.
Several member states already have capacity mechanisms. Sweden and Finland pay
certain generators to maintain a strategic reserve; Ireland, Spain, and Portugal make
more broadly based capacity payments; and the UK and France plan capacity auctions
or markets (see Figure 7).
Figure 7: National capacity mechanisms and plans
Source: Eurelectric presentation. 2013.
21
More specifically, the Commission fears that national capacity mechanisms,
especially if badly designed or introduced unevenly in some countries and not in
others, could distort investment. Capital investment would be attracted to states
paying the most for capacity, just as it follows the more generous of national subsidies
for renewable energy. They could also distort trade. Extra investment in a country
with a capacity mechanism could create an artificial surplus of power there,
encouraging more cross-border trade that would overload available interconnectors. In
addition, such a mechanism could create a re-distributional effect, with citizens of a
country with a capacity system paying for security of supply for citizens in another
member state without a capacity scheme. Finally, the Commission fears problems
from whichever type of capacity system a country chooses. A strategic reserve of the
Swedish or Finnish variety has only a limited impact on the wholesale energy market,
because it is rarely called upon. However, it only works to improve the supply side by
adding or maintaining generation capacity. In contrast, a capacity auction of the kind
the UK is proposing would allow providers of demand reduction, as well as suppliers,
to bid for capacity payments – thereby impacting both sides of the energy equation.
But capacity markets are more complex to design and administer.
Remedies
The Commission has the legal power, under its right to review state aid and public
service obligations, to restrict and even block national renewable and capacity subsidy
schemes. And it may have to use this power in the case of the UK government’s
proposed Electricity Market Reform soon, as this presents an unusually difficult
challenge to the state aid regime [10]. For this reform consists of a series of state-
organized guaranteed prices for renewables and (for the first time) for nuclear power,
with no provision for phasing out or reducing these price guarantees. It also
introduces a capacity market.
Normally, the EU executive has allowed states to pay declining amounts of aid to
renewables projects because these are viewed as necessary, proportionate, and in
pursuit of an agreed EU policy goal: low-carbon energy. As a matter of practical
politics, the Commission may take the same broadly permissive attitude towards
states organizing capacity payments to keep the lights on – provided these are deemed
necessary and proportionate – because security of energy supply is also an agreed EU

22
policy goal. The Commission may feel it cannot afford, especially given the shaky
political state of integration in today’s Europe, to be seen to thwart member states in
the exercise of their legitimate right to try to assure their own energy security.
Moreover, there is no easy European alternative to national capacity schemes.
Technically, an EU-wide scheme would have been easier to introduce for renewables
than for capacity. The aim with renewables is just to add supply, whereas capacity
affects both sides of the equation – demand and supply – and the balance between
them.
In the absence of a pan-European capacity scheme, what should member states do?
All member states would benefit from improved pricing in short-term electricity
balancing markets. At present, producers of renewables are held responsible for the
imbalances they create in the system in only 15 member states, and elsewhere many
such producers are ‘free riders’ on the balancing system. What is needed are
balancing markets in which all are held financially responsible for correcting
imbalances at marginal prices that reflect the extent of the imbalance. ‘People who
cause the problem should pay and people who solve it should be rewarded’,
comments an ENTSOE official [11]. The aim is to ensure that price signals reflect the
correct value of electricity at each point of time during the day of delivery (the value
can be very different from moment to moment) something that the traditional day-
ahead trading market cannot provide. Even the UK, which has a relatively efficient
balancing market, is concerned that the averaging of prices in its balancing
mechanism does not provide sufficiently sharp price signals as rewards and penalties,
and it is seeking to reform this. At the moment, however, there is often an impasse in
the development of balancing markets: renewables producers claim they cannot be
held responsible for balancing until liquid balancing markets develop, but such
markets may not emerge until it is clear that all producers (including those of
renewables) will participate.
However, the big issue, from the Commission’s viewpoint, is how to Europeanize
national capacity mechanisms and to ensure that they do not cut across its single
market plan. It would be easy to forbid national hoarding of energy; it would clearly
be illegal, under standard EU internal market rules, for a government to ban any
export of energy to its EU neighbours. It might be possible to pressure member states
23
into preparing the ground for greater mutual dependence through building more cross-
border interconnectors. The Commission could use its state aid powers to make
approval of national capacity mechanisms conditional on member states putting aside
a certain proportion of their capacity subsidy money for the building of such links. EU
governments may have laid themselves open to Commission pressure on this point,
when in their May 2013 special meeting on energy EU leaders agreed, among things,
to take:
… more determined action to meet the target of achieving interconnection of at least 10 per cent of
installed electricity capacity [12].
This 10 per cent figure was set at an EU summit in 2002; it is fairly arbitrary, has
never been reached in the case of islands (UK, Ireland) or peninsulas (Iberia, Italy),
and until it suddenly re-surfaced at the May 2013 summit it was never seen as much
of a commitment. It may, however, regain significance. The Commission could use
internal market and anti-trust rules to insist that governments allow all EU
participants, at least in theory, to bid into their national capacity schemes.
But, in practice, the Commission cannot insist that countries rely on their neighbours,
or that they treat every bid from across the border to provide emergency power as 100
per cent firm and deliverable. In other words, a French or Dutch company might
contract to provide power to the UK, but be unable to deliver it because of
interconnector congestion across the Channel. Because of regional weather patterns,
when one European country experiences a sharp drop in wind and solar power and/or
a sudden increase or decrease in temperature and therefore demand, the likelihood is
that its neighbours will suffer in exactly the same way. So a wide swathe of the
European grid would come under stress simultaneously. These are factors that each
operator of a national capacity scheme will have to take into account, and which
cannot be second-guessed from Brussels.
One solution to doubts, at times of emergency, about the firmness of cross-border
deliveries would be permanent reservation of capacity for them. But such permanent
reservation would subtract from the capacity available for day-to-day trading, and as
shown in the next section, this is already insufficient.

24
4. Infrastructure – stitching the market together, slowly
The rapid deployment of renewables has increased the need for infrastructure. Much
of this infrastructure is within member states, because most new renewables,
especially wind and solar power, tend to be connected to the low-voltage distribution
network rather than to the high-voltage lines that traverse frontiers. The EU has no
real remit over these purely national networks. But the Commission has always
promoted cross-border infrastructure as being the linchpin of its internal energy
market programme. And recently, it has sought to accelerate cross-border
infrastructure development, precisely to counter what it sees as the risk of national
renewable and capacity schemes returning Europe’s semblance of a single energy
market to autarkic national fiefs.
In the past the Commission focused more on the use of energy infrastructure, rather
than on actually contributing to building it; it first sought to abolish monopolies and
then to remove discrimination on networks by means of anti-trust measures and
traditional market-opening legislation – these moves culminated in the 2009 ‘Third
Package’. The Commission has now broken new ground by involving the EU in the
building of new infrastructure, by means of a new regulation which took effect on 1
June 2013. This is aimed at identifying major European ‘projects of common interest’
(PCIs) and at streamlining national permitting procedures and providing some EU
finance for such projects.
In 2011, when the Commission came up with its proposal for this infrastructure
regulation, it estimated that around Euros 210bn needed to be spent by 2020 on
extending electricity and gas grids and upgrading existing ones. This overall figure
was made up of Euros 100bn for high-voltage transmission (Euros 70bn onshore,
Euros 30bn offshore), another Euros 40bn for electricity storage and smart grid
applications, and Euros 70bn for high-pressure gas transmission gas pipelines,
storage, LNG terminals, and reverse-flow infrastructure [13].
The prolonged economic downturn has made it harder to raise private finance for
infrastructure investment. Even in 2011 the Commission conceded that of the Euros
210bn, half:

25
… should be delivered by the market unaided, whereas the other Euros 100bn will require public
action to source and leverage the necessary private capital [14]
Delays in the planning and permitting process – which can take up to eight to ten
years for new transmission lines – are a major reason why infrastructure investment
fails to materialize. Permitting delays add to cost. They also add to uncertainty, which
in turn increases risk, and this may cause financiers to increase their required rate of
return beyond the level a project can produce. Public acceptance is harder to win for
electricity cables, which are three to ten times more expensive to bury than to string
between overhead pylons, whereas gas pipelines are routinely buried.
In recent years, the EU has tried other measures to create some of the missing links in
Europe’s energy networks. These included the appointment of special negotiators, for
example, Mario Monti who successfully concluded a Franco-Spanish negotiation on a
trans-Pyrenean power line – this project had been rejected in 1996, re-started in 2001
and finally concluded in 2011. There was also the Trans-European Networks
programme, or TEN, set up in 1996. The energy part (TEN-E) of this had a tiny
budget (Euros 20m a year), essentially to finance feasibility studies.
At the time it was assumed that only a relatively small initial impulse from Brussels would be
needed to set in motion the market forces that would drive construction of all necessary cross-
border links. [15]
Moreover, the TEN-E list of projects was the sum of every state’s wish list,
amounting in 2011 to a short list of 568 priority projects of European and national
interest.
The Infrastructure Regulation of 2013
Under the new regime, the long list for ‘projects of common interest’ (PCI) starts with
420 projects, and this number will be winnowed down by autumn 2013 to 150 (100
for electricity and 50 for gas). Once a project gets PCI status, it can benefit from a
national permitting process that, under the new EU regulation, should not last longer
than three and a half years. This period is composed of: two years for the project
promoter(s) to make all the necessary applications and carry out environmental
impact assessments; and 18 months for national planning authorities to come to a
decision. The only significant modification made by EU legislators to the
Commission’s draft regulation was to extend the permitting process from three to
three and a half years. It had been thought that the regulation’s requirement that each

26
member state set up a one-stop shop – a body with the power to decide, or at least co-
ordinate, permitting for PCI projects – would pose difficulties to countries with a
federal system. But acceptance was made easier by the fact that federal Germany had
already decided to pass decision-making power on major energy infrastructure to its
network regulator.
The new legislation specifically directs national regulators to take a wider cross-
border view of the costs and benefits of trans-frontier infrastructure, and to allocate
the costs appropriately to match the benefits. To take the example of a planned new
Hungary–Slovakia gas interconnector (most of which has to be constructed in
Slovakia while most of the benefit of improved security of supply will go to
Hungary): it will be up to the Hungarian regulator to ensure that most of the cost will
be borne by Hungarians. PCI projects will have to show that proper cost allocation
has been carried out, before seeking any EU funding.
EU funding for energy infrastructure so far amounts to:
Of the Euros 4bn devoted to energy in the 2009 European Economic Recovery
Programme, Euros 1.36bn went to gas infrastructure, and Euros 904m to
electricity infrastructure.
As part of the Multiannual Financial Framework (MFF) for 2014–20, the
Connecting Europe Facility originally slated Euros 9bn to energy
infrastructure, but in the ongoing MFF negotiations this has been cut to Euros
5bn.
Most of the large sum lent by the European Investment Bank (EIB) to the
energy sector – totalling Euros 11.5bn in 2011 – goes to renewable energy
generation and energy efficiency projects, rather than to infrastructure. But the
EIB is piloting a project bond scheme in 2013 that could eventually leverage
fairly large amounts of private sector lending into infrastructure investment.
The EIB will not issue the project bonds itself. Instead, as part of project bond
operations led by the private sector, the EIB will make loans, or issue loan
guarantees, which would be subordinated to those of senior creditors such as
private investors. The idea is to raise the credit rating of these project bonds,
and so entice investors back into the infrastructure finance that has been more

27
or less deserted by European banks preoccupied with their solvency and
liquidity problems.
These financial initiatives mark an important political step forward for direct EU
involvement in infrastructure, but this EU money is very small when compared to
Europe’s overall needs. Of much greater potential influence is the behaviour of
national regulators. They have the power to conjure new infrastructure into existence,
because they decide the rate of financial return on Europe’s major regulated electricity
and gas transmission grids.
However, regulators are usually under pressure from their governments to keep
transmission tariffs low, and TSOs often find it hard to raise new money for
investment on the capital markets. In electricity, all east and central European TSOs
are majority state-owned, as are some in west European countries such as France and
the Netherlands. In gas, most large east and central European TSOs are majority state-
owned. State-owned or state-controlled TSOs used to have a credit advantage in being
owned by governments because this elevated them to sovereign risk status. These
days, such sovereign risk status can lead to a credit demotion. Even when that is not
the case – which is the situation for the two Dutch state-owned TSOs Gasunie and
TenneT – governments are reluctant to inject more capital into their TSOs, especially
if this is designed to help them in activities outside their national boundaries. TenneT
has expanded into north-western Germany, but has found itself without the resources
to connect up German wind power operators to its electricity grid as fast as they
would wish. For their part, Dutch politicians and taxpayers see no reason to pay to
help Germany meet its renewable energy targets.
Generally, there seem to be enough investors, both to participate in existing
infrastructure projects, and to buy the assets that some energy groups are selling as a
result of EU pressure to unbundle their transmission systems. For instance, E.ON and
RWE found buyers for the electricity and gas grids they wanted to sell. But there
appears to be little investor appetite for new infrastructure at the moment.
One contributory reason for this lack of investor appetite might be the complexity of
the unbundling provisions of the 2009 Third Package of legislation. This was
designed to remove, once and for all, the inherent conflict of interest in companies

28
owning both energy supply businesses and transmission networks that could be used
to favour those energy supply businesses. The solution was to separate supply from
transmission in two ways. One gives member states the option of allowing their
energy supply groups to maintain formal ownership of transmission systems, but
requires the energy groups to put their networks under independent management, with
strict supervision to guarantee this independence of management. The other option for
member states is ownership unbundling, requiring separate ownership of transmission
and supply.
In theory, this second option, which had been the Commission’s preference, involves
far less red tape and supervision, because the elimination of joint transmission/supply
ownership should mean an end to any conflict of interest between the two activities.
In fact, those who own or manage an ‘ownership unbundled’ TSO have to be
constantly on their guard not to give any significant shareholding or control to
investors who have any controlling interests in energy supply businesses. Yet these
totally unbundled TSOs – unless they are owned by governments that can fulfil all
their financial needs – will need access to private capital markets. Independently
owned TSOs, therefore, must be choosy about their investors if they are to be certified
by the Commission as ‘ownership unbundled’. Moreover, they must exercise this care
constantly. Under the terms of the 2009 legislation, once a member state and its TSOs
opt for ownership unbundling status, they cannot go back on this and revert to joint
supply/transmission ownership. There is no evidence yet that the unbundling
provisions of 2009 have actually deterred investment in energy infrastructure, but the
complexities of the legislation hardly encourage expansion of the sector.
By contrast, the 2013 infrastructure regulation was a more straightforward way of
encouraging the expansion of energy interconnectors. It also marked an advance in
the politics of EU energy policy, because it took the EU into new areas of
transmission planning and financing. But, unfortunately for proponents of the
Commission’s single market, the forces of integration, as represented by the building
of cross-border infrastructure, have lagged behind the forces of single market
disruption unleashed by national renewable and capacity subsidy schemes.

29
5. Market coupling, network codes, and other tools of integration
The work of market unification is also being applied to existing infrastructure through
techniques such as market coupling, harmonized trading arrangements, and
agreements on network codes. These are key elements in what is called ‘completing
the internal energy market’. This section aims to describe this technical task with just
enough detail on the main elements to demonstrate that it is a complex, and
necessarily slow, affair. Some of this work, too, has been outpaced – and in the case
of market coupling and price convergence even reversed – by renewables surging
erratically onto the markets of certain countries.
The work of market unification is chiefly carried out by the European groupings of
national energy regulators – the Agency for Cooperation of Energy Regulators
(ACER) and the Council for European Energy Regulators (CEER) – and the
European-level organizations of TSOs – the European Network of Transmission
Systems Operators for Electricity (ENTSOE) and the European Network of
Transmission Systems Operators for Gas (ENTSOG). The plan for the completed
internal EU energy market – to be achieved by 2014 as stated by EU leaders in 2011 –
has been set out in an Electricity Target Model and a Gas Target Model, and agreed
among all stakeholders: Commission, regulators, TSOs, industry associations, energy
exchanges, traders, and consumers. The aim is to harmonize cross-border trading
arrangements and to integrate national markets through efficient use of infrastructure
carrying electricity and gas to where they are valued most.
Crucial to this construction job are network codes that, in a sense, provide the
plumbing to ensure that energy trade can flow, and flow smoothly through the wires
and pipes. These EU network codes – which when adopted by 2014 (under current
assumptions) will supersede national network codes – are being drafted by ENTSOE
and ENTSOG, working under the supervision of the Commission and ACER. It is
unusual to ask one part of an industry to draft rules for the rest of that industry. TSOs,
though now unbundled to various degrees, are still commercial organizations, and
their quasi-legislative role has been queried by some other energy companies.
However, they have been judged to be the only organizations with the expertise to
carry out this technical task.

30
Electricity
Prices
Cross-border price convergence is the standard measure used across all sectors of the
EU economy, to determine the degree and effectiveness of cross-border competition
and trade flows. But it is a measure that cannot be sensibly applied to retail prices.
These are heavily influenced by national governments, both by taxes and, in many
cases, regulation. In 2011 end-user prices for households were regulated in 17
member states, and for non-households in 12 member states, a state of affairs that the
Commission has sharply criticized. EU rules only permit regulated prices in strictly
limited circumstances – to protect poor and vulnerable customers. Moreover, if retail
prices are set below the level of cost recovery, they may depress power generation
and will certainly discourage new investment and new entrants into the market.
Retail end-user prices may therefore be a measure of political integration (or lack of
it) in the sense of member states flouting EU rules. However, because they reflect
more than just supply and demand, they are a much worse guide to market integration
than the convergence of wholesale prices.
As ACER and CEER have shown (see Table 2 below), recent years have seen
convergence in Dutch, Belgian, French, and German wholesale spot power prices in
the Central West Europe (CWE) region, even though within the past year (2012/13)
surges of renewable power, seen particularly in the German market, have often driven
prices apart again. Prices in Spain and Portugal have tended to converge with each
other, and the Iberian average with the CWE level. More erratic is the pattern in the
Nord Pool countries, where reservoir levels affect the price of hydro-electricity.
Increasingly important in this convergence is the mechanism of market coupling,
which has led to an equalization of cross-border prices for longer periods, at least
until recently. However, in 2012 abundant wind and solar power and cheap coal-fired
generation pushed prices in Germany down, while problems with the availability of
French nuclear power pushed prices in France up. It was the first period of wholesale
price divergence, after several years of steady price convergence.

31
Table 2: Annual average price at European spot exchanges – 2005 to 2011
(euro/MWh)
Source: ACER/CEER Annual report on Electricity and Gas Markets, 2012.
Market design
‘Market coupling’ deals with the problem of transmission capacity congestion that so
often occurs at national borders in a system originally designed around nation states.
Among other things, it is aimed at preventing situations in which a seller of power on
one side of the border gets a deal to deliver power to the other side of the border, but
then finds he cannot get the capacity to transport the power. Market coupling allows
buyers and sellers to trade electricity without explicitly having to buy the transmission
capacity needed to make the trade. This works by a power exchange (or usually two,
one on either side of the border) taking all the trans-border transmission capacity that
the TSOs have declared to be available for any period of time, and using a clever
algorithm to automatically allocate this capacity, so that one country will continue to
export to another for as long as the selling price in the first country is below the bid
price in the second. This allocation of transport capacity (paired automatically with
trades in the electricity itself) goes on until prices in the two markets converge, or
until all available cross-border capacity is used up. The system allows transmission
capacity to be used efficiently, and prices to act as a signal for the logical flow of
power – from lower price areas to higher price areas. As a result of market coupling in
the CWE region, what are called ‘adverse flows’ – from higher to lower price areas –
have more or less disappeared. By contrast, these adverse flows of electricity, moving
in ‘the wrong direction’ in a commercial or economic sense, remain frequent in
Central East Europe, where market coupling only exists between two countries that
used to be one – the Czech Republic and Slovakia – and Hungary.
32
This coupling of electricity markets has been proceeding fairly steadily. It was
pioneered by Nord Pool, then in 2006 France, Belgium, and the Netherlands adopted a
‘trilateral’ coupling of markets, and in 2010 Germany and Luxembourg joined in to
form a ‘pentalateral’ market coupling. There are now 17 member states with markets
that are coupled to neighbouring markets, although not all 17 are directly linked to
each other. The next significant milestone will come in November 2013, with the
planned market coupling for day-ahead trading of North West Europe (composed of
the Central West Europe region of Austria, Belgium, France, Germany, Luxembourg,
and the Netherlands plus the four Nordic countries and the UK). Estonia, now linked
to Finland, will probably couple its market at the same time, and Spain and Portugal
soon thereafter.
But, realistically, this is likely to be the full extent of market coupling in 2014, despite
the aims, set out in the Electricity Target Model, that by 2014 there should be:
a single European price for day-ahead trading which would replace all
remaining explicit capacity auctions on cross-border interconnectors.
A single continuous platform for intra-day trading. This is important for
renewable energy suppliers who need to trade as near to ‘gate closure’ (the
time of actual delivery) as possible, in order to take account of the weather-
related variations in their supply and therefore to minimize the imbalances
they can cause.
A single European platform for the allocation of long-term transmission rights,
which market coupling is not designed to cope with.
A flow-based allocation in highly meshed networks. Instead of just involving
whatever spare capacity that TSOs care to declare as available on a particular
border, this flow-based approach to capacity allocation would incorporate all
available capacity in a price-coupled region, not just on its borders. The idea is
to make even more efficient use of existing transmission capacity in a Europe
where the building of new pylons and power lines is taking so long. The flow-
based approach makes particular sense when attempting to maximize available
capacity in and between member states with multiple borders and highly
meshed grids, such as those in the centre of western Europe. For the moment,
this idea is just at the stage of trial simulations in the Central West Europe
region.

33
Network Codes
ENTSOE and ENTSOG were given the difficult task of drafting EU network codes
with a very tight timetable. Each network code (NC) is typically a three-year project
between concept and delivery. This allows ACER six months to produce framework
guidelines for the TSOs. The latter then have 12 months to draft the NC, which ACER
then has three months to assess before either recommending adoption or asking for
more work. If and when that process is over, the NC goes to comitology for the
Commission and member states to write into EU law. Writing law to a deadline is
challenging, and the time for consultation has been short. Some companies, especially
in the electricity sector, have complained that the TSO organizations are imposing
stringent requirements on them without sufficient cost/benefit analysis as justification.
This is a criticism that the TSOs partly accept, but argue that it is inevitable given the
time pressure.
Among the nine main NCs in electricity, the most important are:
Requirements for generation. There used to be some regional codes for
generation in the Nordic area, but most were national, and were not aligned or
harmonized with each other. This had disadvantages for industry, because
manufacturers of turbines had to produce different designs for different
standards. The importance of the new code (which categorizes generators
according to size and connection voltage) for the TSOs, is that it gives them
more technical certainty about how services such as balancing for renewable
energy will be carried out.
Requirements on frequency. This sets common rules on voltage in
synchronous areas (GB–Ireland, Nordic region, the Baltic states, continental
Europe). Generating companies have complained about the cost of
requirements which, unsurprisingly, increase as the size of generator increases.
Some generators also complain about the lack of cost/benefit analysis, but
ENTSOE points to the time pressure from ACER.
Capacity Allocation and Congestion Management. This relates to markets, in
line with the target model of progressive harmonization of trading
arrangements along the time line, starting with day-ahead and moving to

34
continuous trading. It set a rule about the firmness of orders, and what happens
to firm orders if transmission capacity is subsequently constrained. This code
also defines bidding zones as areas within which energy flows without any
congestion. The size of bidding zones helps to determine the degree of
competition and the number of buyers and sellers, to fix prices according to
the proximity of supply to consumption, and, through prices, to send signals
about possible new investment. This NC defines capacity allocation, which
will become more complex with the move towards flow-based allocation that
is important for the more meshed grids of continental Europe. Assessing
capacity is vital for market coupling. This is done through the power
exchanges, which take the available capacity, together with the bids, and use
their algorithms to set the price in a coupled market. This puts power
exchanges, which are non-regulated commercial entities, in a potentially
powerful position, and it has been suggested that power exchanges should be
regulated in some way. For their part, the power exchanges claim they can
regulate each other, because several of them will be running the algorithms,
thereby preventing monopoly power.
Demand connection code. This covers all big electricity users such as
factories. But it also contains a controversial provision that would require
temperature-controlled devices, like refrigerators, to be able to react to
frequency disturbances in order to keep the grid stable. This is a mandatory
requirement for demand-side reduction. But some electricity users argue that
they should be paid for providing this demand-reduction service and that if
they are not to be paid, then this requirement should be legislated through
standard EU law-making procedures and not rushed through in secondary
legislation.
Gas
Prices
Gas prices have increased less than those of oil. This is because recession has reduced
demand for gas, because imports of cheap US coal (displaced by the shale gas glut in
the USA) have displaced gas in power generation, and because more gas is being
traded on a spot basis at European hubs while relatively less is being sold on oil-
indexed contracts (chiefly from Russia). The volume of gas traded in continental

35
Europe on a spot basis rose by 27 per cent between 2010 and 2011, and this has
helped wholesale prices of gas to converge.
Again, retail prices of gas, as of electricity, are not the result of pure supply and
demand forces, but are often the result of considerable state intervention in terms of
taxes and regulation. End-user prices for households are regulated in 16 member
states, though not for industry, and most new member states regulate retail gas prices.
However, because the initial communist-era price level in these countries was so low,
the percentage increase in some of east and central Europe’s regulated prices has been
higher than in some west European countries where there was no regulated cap on
retail gas prices. Nonetheless, there was a wide dispersion in end-user prices in 2011
according to the ACER/CEER monitoring report: a spread of 1:4 in household prices
between Romania (a gas producer itself) at the bottom and Sweden at the top, and of
1:3 in industrial prices between Romania at the bottom and Denmark at the top.
At the wholesale level, gas prices show some degree of convergence (see Figure 8
below). The tightest correlation is between the three main gas hubs in north-west
Europe (NBP, TTF, and Zeebrugge) which have good physical interconnection. This
region is beginning to influence the German gas market, which is moving towards hub
pricing and away from oil-indexed contracts. The Italian PSV hub price (in dark blue)
and the Austria–Slovakia border’s Central European Gas Hub price (in green) have
also started to come into line fairly recently. All hubs showed the sharp price spike
caused by the very cold weather of February 2012. There is still a pricing disconnect
with parts of eastern and southern Europe that suffer from a lack of diversity of
supply, a paucity of connecting pipelines, a scarcity of LNG, and (because of all this)
an absence of trading hubs.
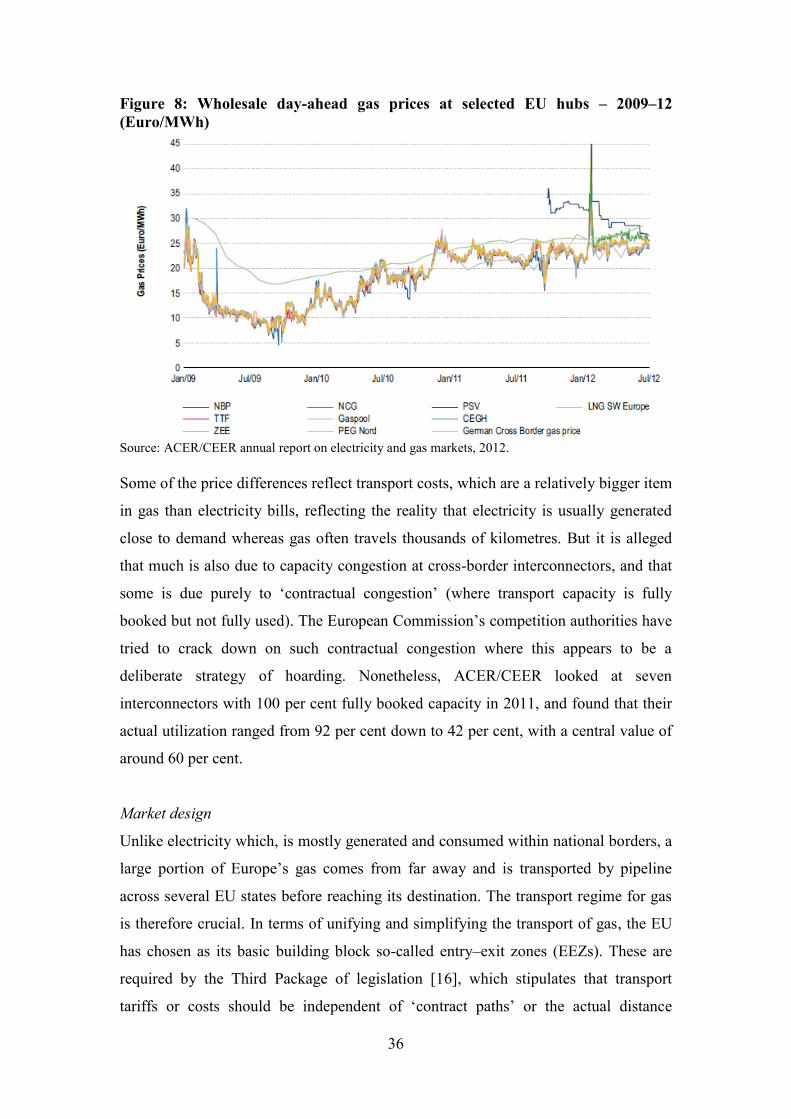
36
Figure 8: Wholesale day-ahead gas prices at selected EU hubs – 2009–12
(Euro/MWh)
Source: ACER/CEER annual report on electricity and gas markets, 2012.
Some of the price differences reflect transport costs, which are a relatively bigger item
in gas than electricity bills, reflecting the reality that electricity is usually generated
close to demand whereas gas often travels thousands of kilometres. But it is alleged
that much is also due to capacity congestion at cross-border interconnectors, and that
some is due purely to ‘contractual congestion’ (where transport capacity is fully
booked but not fully used). The European Commission’s competition authorities have
tried to crack down on such contractual congestion where this appears to be a
deliberate strategy of hoarding. Nonetheless, ACER/CEER looked at seven
interconnectors with 100 per cent fully booked capacity in 2011, and found that their
actual utilization ranged from 92 per cent down to 42 per cent, with a central value of
around 60 per cent.
Market design
Unlike electricity which, is mostly generated and consumed within national borders, a
large portion of Europe’s gas comes from far away and is transported by pipeline
across several EU states before reaching its destination. The transport regime for gas
is therefore crucial. In terms of unifying and simplifying the transport of gas, the EU
has chosen as its basic building block so-called entry–exit zones (EEZs). These are
required by the Third Package of legislation [16], which stipulates that transport
tariffs or costs should be independent of ‘contract paths’ or the actual distance

37
between the source of gas and the point of consumption. In these EEZs gas can enter
at any point or leave at any exit point, at prices which are not directly connected to the
distance that gas may have travelled.
European countries used to have a system that more closely resembled that of the
USA, with inter-state transport and trading of gas being largely governed by long-
term contracts in which transport tariffs are calculated on a point-to-point system,
taking account of the underlying infrastructure costs, with trading taking place at
physical hubs – such as the famous Henry Hub – formed by pipelines coming together
and also providing useful locations for storage and balancing. Underpinning this so-
called point-to-point system were the well-defined property rights to, or long-term
contracts for, transmission capacity that had been crucial to funding the building of
long-distance pipelines within the USA and also between Russia and western Europe.
However, the European Commission concluded that many of these long-term gas
transport contracts were effectively cosy arrangements between Europe’s gas
importers and outside suppliers that cartelized the market against new entrants and
thus helped sustain the increasingly artificial pricing of gas by indexing its price to oil
product prices.
So the EU chose the very different model of EEZs in order to promote new entrants,
competition, and trading at virtual gas hubs that could be at any notional point within
an EEZ. The EEZs, which coincide with the balancing zones, facilitate trading in
several ways and use a simplified commercial model to promote more efficient
market functioning. They expand the trading zones, with usually only one EEZ per
country (as in the UK and Italy, though Germany has two EEZs and France three).
They lower transaction costs because gas is priced and traded regardless of its
location within the EEZ. The cost of transport and network services is separated from
that of the commodity, and ‘socialized’ or spread across all users of the EEZ network.
Trading has become simpler (fewer transactions) and less risky (less worry about
imbalances and mismatched trades) so trading activity has surged at Europe’s hubs
[17]. Liquidity attracts liquidity, as buyers and sellers benefit from always being able
to get a good price, and Europe’s gas consumers and users can be more certain of
purchasing gas that has been bought on a market where large volume makes the price

38
difficult to manipulate. Moreover, it is easy to see the ideological attraction to the
Commission of EEZs, because they are mini-versions of Europe’s single market.
However, there is a trade-off to the size of EEZs. They have to be large enough to
attract buyers, sellers, traders, and shippers, but small enough for any physical
constraints resulting from different gas flows not to generate excessive internal
congestion charges. Distance may have been ‘abolished’ commercially inside the EEZ
for traders, but physical flow of gas still needs to take place as required by the
network users. A TSO will always keep part of its infrastructure capacity out of the
market in order to respond to requests for shipment in and out of any entry or exit
point of the zone.
Therefore the larger the trading zone, the larger the amount of infrastructure that needs to be kept
out of the market to guarantee the greater trade flexibility permitted within the larger trading zone.
[18]
Moreover, the larger the zone the greater the degree of cross-subsidization of
transport costs, with shippers using a lot of transport effectively subsidizing those
who use little.
A further complication is that within the EEZs there are no locational price signals, or
price spikes at particular bottlenecks, to pinpoint congestion and incentivize
investment in new pipelines to resolve the bottlenecks. So, because transport price
signals become blurred inside EEZs, in the opinion of some experts, regulators may
have to take more of a lead in determining new transmission investments both inside
EEZs and particularly between such zones. [19] This is the view of one regulator,
Walter Boltz, head of Austria’s E-Control, who has said that:
… increasingly, regulators will decide what needs to be built because shippers will not commit
themselves to long-term investments in cross-border pipelines.
It is therefore hard to see these EEZs being enlarged much further. Most will probably
remain at the national level in size. Some may stay sub-national. The number of gas
trading/balancing zones has been greatly reduced in Germany – originally 19, down to
six zones, with a further reduction in 2011 to two zones, run by the TSOs, NetConnect
Gas and Gaspool. The German TSOs recently claimed that the cost of merging the
two zones into one would be an extra Euros 395m in the first year after the merger,
for a financial benefit to the market of less than Euros 60m a year, and that the extra
39
investment required to maintain current levels of service in the merged zones would
be nearly Euros 3bn. [20]
In principle, according to the widely accepted Gas Target Model, any gas market that
is smaller than 20 billion cubic metres in annual consumption, and with fewer than
three suppliers, should merge with another. In practice, the only market likely to
acquire a multinational, regional dimension is the Central European Gas Hub, which
announced in January 2013 that it was switching from being a point-to-point trading
hub to being a virtual hub with an entry–exit system. It is already a key hub for
Russian gas flowing into Austria, and thence on to Germany and Italy, and as an EEZ
it could eventually be extended to the Czech Republic, Slovakia, and Hungary. As
yet, few EEZs exist in south and south-east Europe. The upshot is that no one is
predicting the total number of EEZs across Europe will fall below seven.
An alternative suggestion is to improve the links between EEZs by making better use
of cross-border interconnector capacity through market coupling, as in electricity. But
this is not proceeding as fast as in electricity. There is a pilot project to couple gas
zones in France. The Dutch and German gas markets are coupled, through the
common ownership, by Gasunie, of gas grids on both sides of the border. And this
year, 2013, has seen the launch of a proto-European gas capacity booking platform by
19 TSOs from Austria, Belgium, Denmark, France, Germany, Italy, and the
Netherlands, though this will lack the automaticity of real market coupling. [21]
The reason for the relative slowness of market coupling in gas is the strong aversion
that many gas industry players have to the concept. They argue that there are
fundamental differences between gas and electricity. Electricity is generated and
consumed locally, with a bit of spillage to export to, or shortage to import from,
neighbouring countries with often very different prices – so why not develop an
automated process for price comparison between adjacent markets for short-term
trading of fairly small quantities of power in relation to total electricity consumed?
However, many in the gas industry dislike market coupling because the usual
approach in electricity appears to put almost no value on transport, which is a very
important feature of the gas industry. Gas often comes from far away, and the gas
industry, they say, has had to develop longer term arrangements to underwrite
investment in extraction and transport. So gas has been traded on long-term contracts
40
that already incorporate the value/cost of transport, with the end-consumer often
paying for the gas network in several other countries as well as his own. The gas
industry acknowledges that there can be congestion, particularly contractual
congestion, on cross-border interconnectors between EEZs and national markets.
However, the problem should be resolvable in the secondary capacity market.
Concerns about hoarding and market manipulation have triggered reforms via the
congestion management process, including the principle of use-it-or-lose-it-or sell-it
to prevent hoarding. If capacity is congested, then the gas sector rules are designed to
get capacity into the hands of those who want to use it, rather than using some clever
algorithm that is only relevant very close to the time of the actual gas flow.
Network codes
The most important for gas are:
Congestion Management Principles (CMP). This is the procedure for clawing
back capacity that is not being used, and enabling its release to other market
players that might want to flow gas.
Capacity Allocation Methodology (CAM). This governs the way in which,
whenever free capacity is available to the TSO, the TSO has to release it to the
market. So capacity is clawed back by CMP and then put out into the market
by CAM.
Balancing. This sets out how users should be responsible for balancing, and
introduces market-based balancing for day-ahead and intraday trading.
41
6. Conclusion
In setting the early target date of 2014 for ‘completion of the internal energy market’
– and getting successive EU summits to endorse that date – the European Commission
had two hopes in mind.
One hope was that the integrationist drive (attempts to accelerate the coupling of
markets, infrastructure, network codes, and trading practices) might prevent member
states from feeling they need to concoct national capacity (as well as national
renewable) schemes to maintain their energy security. From the Commission energy
directorate’s viewpoint, such national schemes seriously threaten the geographical
unity of the internal energy market, in the creation of which it has invested so much
time and effort. Moreover, since these national schemes concern renewables, or the
consequence of renewables, they add to the irritation of those who, like EU energy
commissioner Günther Oettinger, currently feel that energy policy has come to be
unduly subordinated to climate policy. Yet it was never plausible that there would be
such a degree of cross-border network harmonization and expansion that member
states would feel happy to rely primarily on each other for security of supply, and so
minimize or forego national capacity schemes. Depending solely on foreigners, even
close EU neighbours, to provide emergency back-up to keep the lights on is simply
not good politics for national politicians.
The other hope is that advances towards a single energy market will bring down
energy prices – if not in absolute terms then at least to a level below what they would
otherwise be in the absence of cross-border competition in a liberalized market.
Although this hope is a perennial one in Brussels, it is felt more acutely in times of
recession, when households and companies tend to make price a priority over
environmental considerations and therefore look for benefits from the EU single
market primarily in terms of lower prices.
So, in an energy briefing paper for the May 2013 EU summit on energy, the
Commission claimed that current EU energy policy was keeping prices in check. It
argued that during the 2002–12 period, primary energy commodity prices (which are
largely or wholly determined outside the EU) had increased on average by 14 per cent
a year for oil, by almost 10 per cent a year for gas, and by 8 per cent a year for coal,

42
while the same figure for wholesale electricity prices in the EU was 3.4 per cent. At
the level of wholesale prices, this is a perfectly good argument. The problem,
however, is that the prices seen by households and most companies are retail end-user
prices, which are increased and distorted by all manner of national taxes and
regulations over which the Commission has little or no control. It is therefore difficult
to make a politically effective argument for the price benefits of the single market.
Moreover, such an argument involves gauging the counter-factual about what would
have happened in the absence of an internal energy market or the attempt to create an
internal energy market, which is impossible to prove.
Despite Brussels’ frustrations in getting its price arguments across to the European
public, recession has had the effect of returning the Commission energy directorate’s
prime focus to its traditional single market policies of liberalizing and creating
competitive cross-border trade in energy. The Commission briefing to EU leaders was
that ‘the right policies are in place, but implementation is too slow’. But these policies
were designed primarily for ‘energy only’ markets, where a generator’s revenue
depended entirely on the price he could get on the power exchange for his electricity.
Today’s markets are ‘subsidy partly’, where producers of renewable energy can rely
on subsidies mainly or wholly independent of market price. The old order is changing.
These days, downward pressure on prices is exerted less by market liberalization than
by renewables surging on to the exchanges, and because these surges are intermittent,
they no longer provide reliable price signals for investment.
This is no reason to abandon the goal of a unified European energy market. Market
unification provides scale, and scale is the EU’s main gift to its member states, in
every sector of the economy. Scale has, to some extent, promoted wider competition,
and through competition has come convergence in some regions on a more efficient
price level. Climate goals and their consequences are proving disruptive in the
electricity sector, but it is worth remembering that the EU has created more of a
common electricity market template for its 28 member states than exists for the 50 US
states. Scale also provides security for Europe, through diversity of energy source and
supply, as well as a critical mass of low-carbon investment, and at least the potential
to make a political difference in international climate negotiations.
43
But the single market mindset needs to take greater account of climate policy
complexities. The Commission says it is already taking account of these complexities.
In its March 2013 Green Paper on future energy and climate policy, it admitted that,
in designing the 2009 energy and climate package, it ‘underestimated’ the impact of
the 27 different national renewable support schemes, and ‘did not address’ the issue of
the need for subsidized back-up for ever-larger renewable energy volumes. In an
attempt to redress these omissions, the European Commission is aiming to produce
guidelines in 2013 that would seek to ‘Europeanize’ national renewable and capacity
support schemes and make them compatible with the single market.
However, if Brussels is to maintain an integrated energy and climate policy, it will
have to come to a new view about the acceptable or necessary degree of public
intervention in the single market. For the EU has arrived at a contradiction between its
former policy of liberalizing and freeing Europe’s energy market and its future
ambition to de-carbonize its energy system. It is becoming increasingly obvious that
companies will not invest in low-carbon generation unless member states, or the EU
itself, either forces them to do so, or rewards them for doing so with subsidies, or does
both. This is the inescapable conclusion that the UK has reached; this apostle of free
energy markets is now proposing a series of state interventions to underpin low-
carbon investment, both renewable and nuclear.
Up to now, liberalization has been considered the best means to achieve a unified EU
energy market. If liberalization cannot deliver de-carbonization as well as integration,
then policies will have to be modified to allow an increasing measure of state
intervention. But who is the state in this case? It cannot be the EU. De-carbonization
relates to altering the energy mix, which is a national prerogative. So if EU member
states are to de-carbonize in an integrated manner, they will all have to intervene in
the same way and to the same extent in their respective energy markets. Orchestrating
similar state interventions will be harder than relying on the hidden hand of the
market to be the conductor.
The policy strains examined in this paper underscore the difficulty for the EU, or its
member governments, of balancing the three energy policy goals of competitiveness,
security of supply, and decarbonization. Politicians, who are paid to worry about
maintaining employment, keeping the lights on, and (in Europe) caring about climate
44
change, like to pretend that the three goals are perfectly compatible. They are not. No
energy policy, except for actual energy saving, can serve all three goals equally.
Trade-offs have to be made. The EU needs to re-think the trade-offs between its three
energy policy goals, or at least whether its energy market can be better organized to
accommodate these goals.
A hiatus in EU policy making approaches. In spring 2014 the current European
Commission will come to the end of its mandate and the current European Parliament
will be dissolved, and their successor bodies will only take office in autumn 2014.
This creates a political pause. It could be used for much-needed reflection.
45
References
[1] ‘A 2030 framework for climate and energy policies’, European Commission
Green Paper, COM (2013) 169 final. .
[2] ‘Can unconventional gas be a game changer in European gas markets?’, Florence
Gény, OIES, 2010.
[3] Renewable energy and biofuel sustainability, Ecofys et al., 2012.
[4] Status Review of Renewable and Energy Efficiency Schemes in Europe, CEER,
2013.
[5] CEER annual conference 2013.
[6] ‘The EU Target Model for electricity markets – fit for purpose?’, Malcolm Keay,
OIES, May 2013.
[7] Quoted in Platts Power in Europe, 10 December 2012.
[8] CEER response to Commission consultation on generation adequacy, 2013.
[9] Green Paper on 2030 framework for climate and energy policies, COM(2013)169.
[10] ‘UK Electricity Market Reform and the EU’, Malcolm Keay, OIES, March 2013.
[11] Comment to author, March 2013.
[12] European Council conclusions, 22 May 2013, page 3, EUCO75/1/13.
[13] Commission staff working paper, SEC(2010) 1395.
[14] Commission proposal for the 2014–2020 Multiannual Financial Framework,
COM(2011) 500/II, page 55.
[15] ‘Expanding the European dimension in energy policy: the Commission’s latest
initiatives’, David Buchan, OIES October 2011.
[16] For a fuller discussion of this, see Katja Yafimava’s ‘The EU Third Package for
Gas and the Gas Target Model: major contentious issues inside and outside the
EU’, OIES, April 2013.
[17] For a fuller discussion of this, see Patrick Heather’s ‘Continental European Gas
Hubs: Are They Fit for Purpose?’, OIES, June 2012.
[18] ‘Designing the European Gas Market: More Liquid & Less Natural?’, Miguel
Vazquez, Michelle Hallack, and Jean-Michel Glachant, Economics of Energy &
Environmental Policy, Vol 1 Issue 3, page 30.
[19] ibid, page 36.
[20] European Spot Gas Markets, 8 November 2012.

46
[21] ‘Major European TSOs launch new company PRISMA European Capacity
Platform, press release, Leipzig, 4 December 2012. Available at:www.open-grid-
europe.com/cps/rde/xbcr/SID-49868E1A-4CB2CCE1/open-grid-europe-
internet/2012-12-04_Press_Release_PRISMA.pdf.