Embed Size (px)
Citation preview
Why do we need to model theLower Passaic – Newark Bay?
Ed Garland1, Eugenia Naranjo2
1- HDR|HydroQual 2-USEPA
December 19, 2011
Models1. Why do we need them?
– For sediment sites, for Passaic2. What are they doing?3. Why does modeling take so long?3. Why does modeling take so long?4. Initial results of Lower Passaic Modeling
study
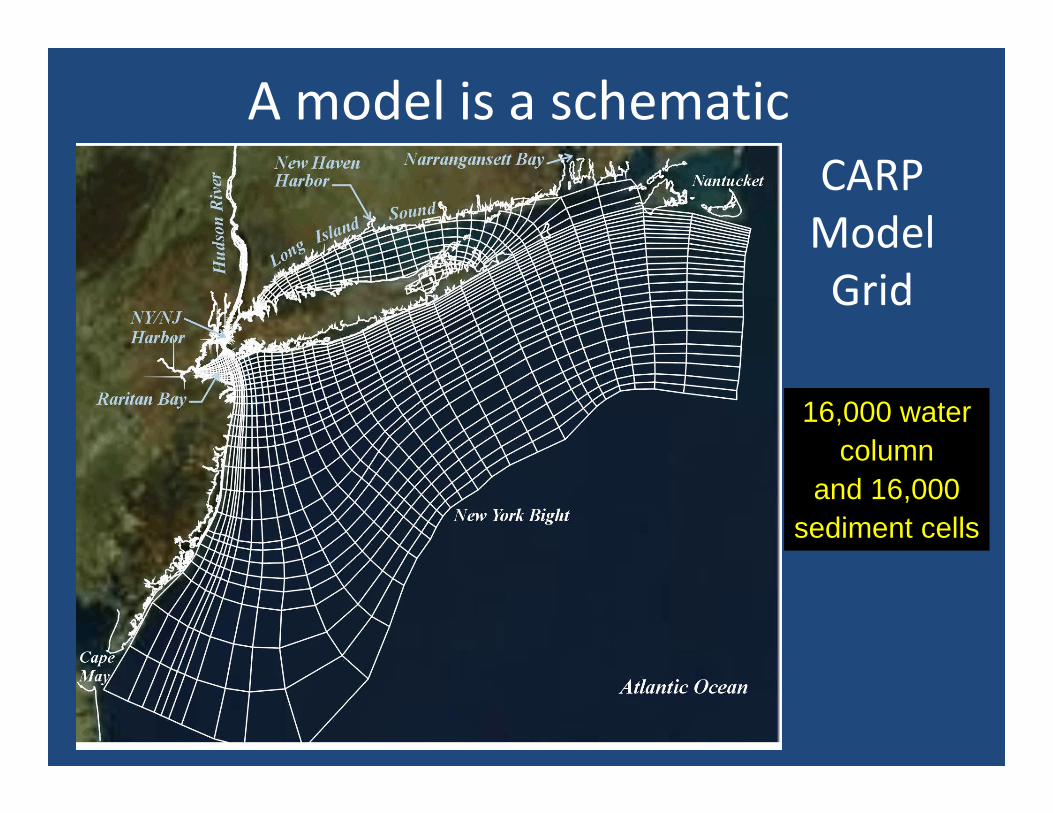
CARPModelGrid
16,000 water
A model is a schematic
16,000 water column
and 16,000sediment cells
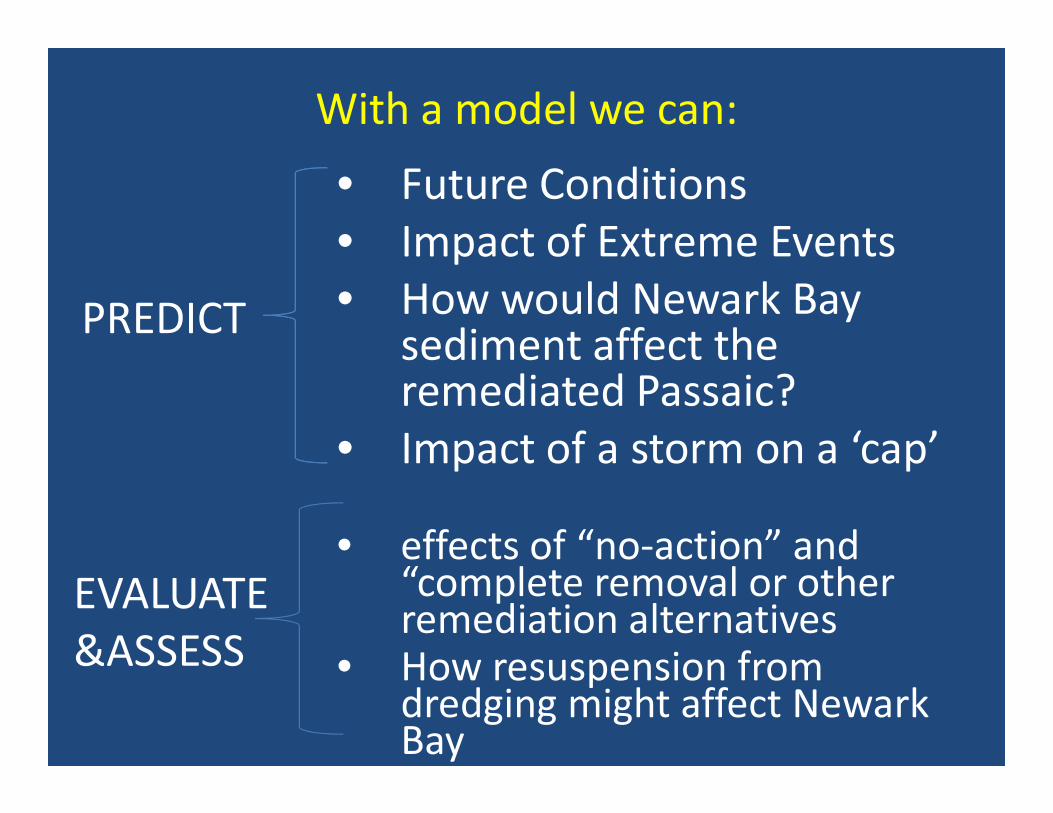
• Future Conditions• Impact of Extreme Events• How would Newark Bay
sediment affect the remediated Passaic?
With a model we can:
PREDICTremediated Passaic?
• Impact of a storm on a ‘cap’
EVALUATE&ASSESS
• effects of “no-action” and “complete removal or other remediation alternatives• How resuspension from dredging might affect Newark Bay
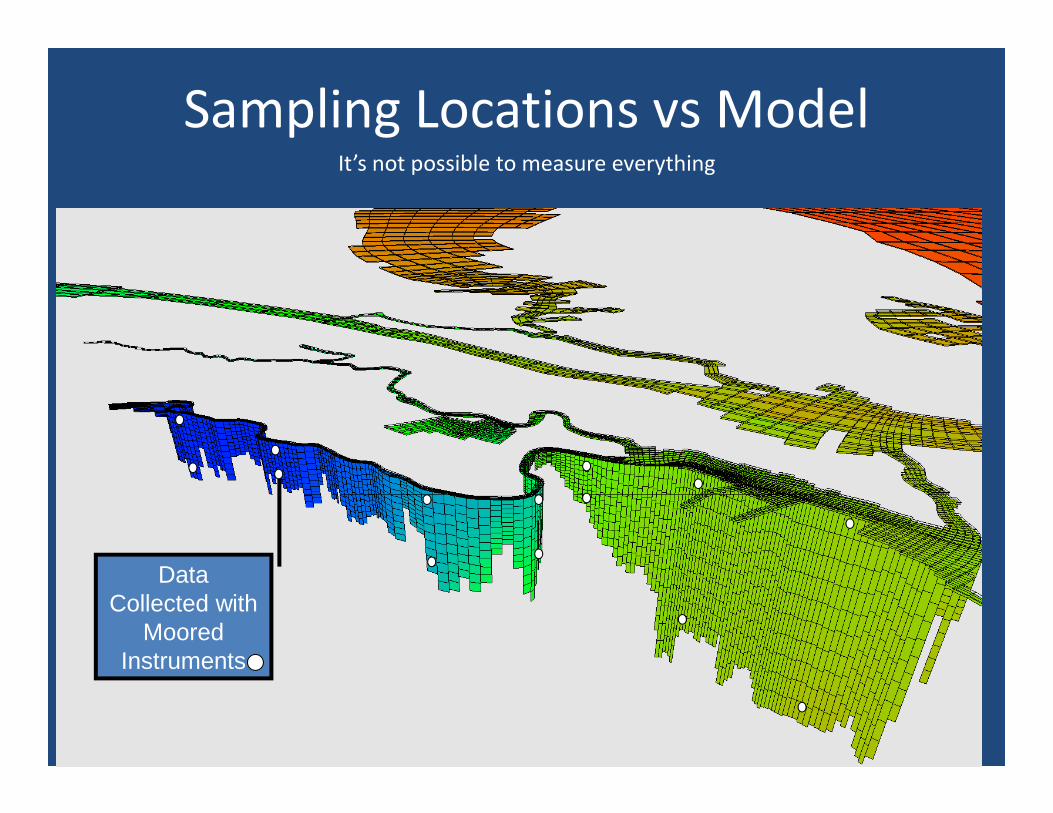
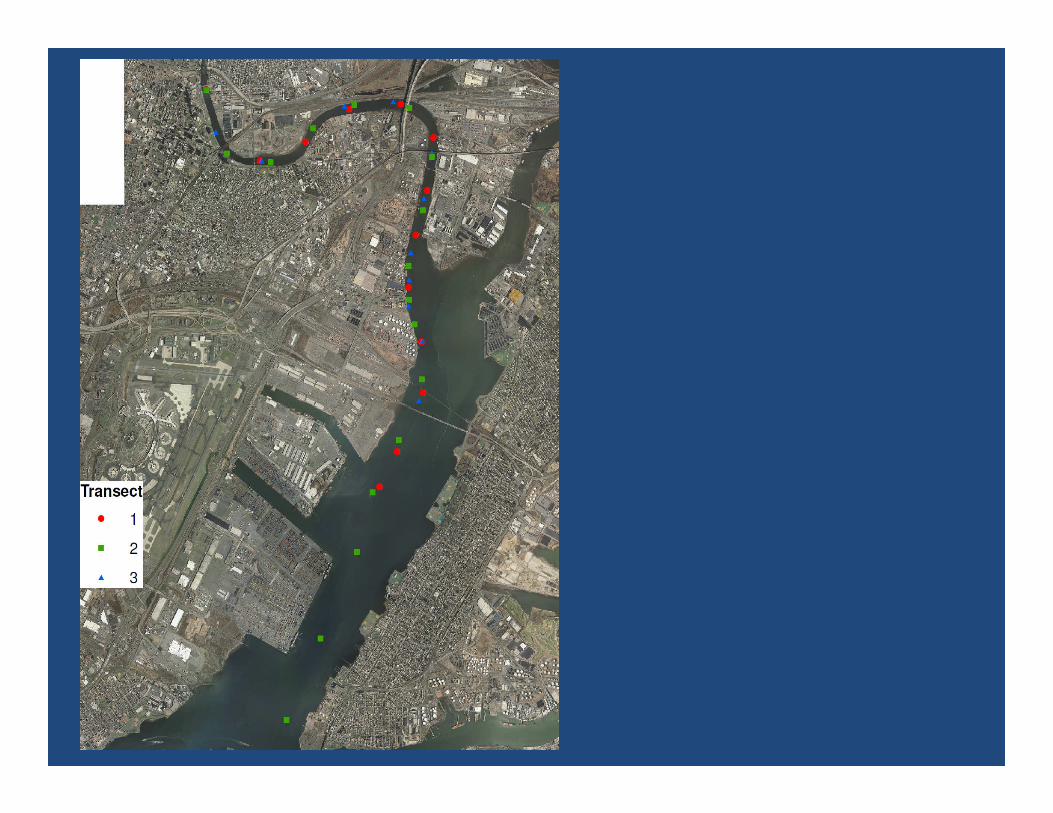
Sampling Locations vs ModelIt’s not possible to measure everything
Data Collected with
Moored Instruments
What if we don’t use a model?• We would not be able to show what be
may achieved after millions of $$ are spent
• We would not be able to predict what would happen to the environment if we would happen to the environment if we do nothing
• All of this uncertainty increases the likelihood that the clean-up plan will be challenged in court

Modeling FrameworkHydrodynamics
Sediment Transport
WATER movement
Particles movement
Risk Assessment
Contaminant Transport & Fate
RCATOX
Contaminants attached to particles

Passaic,Passaic,Hackensack,Hackensack,Newark Bay,Newark Bay,
NYNY--NJ HarborNJ Harbor
Sediment Transport Sediment Transport 44 x 24344 x 243
(10,692 grid cells)(10,692 grid cells)Top Active zone Top Active zone Top Active zone Top Active zone
divided into 10 layersdivided into 10 layers
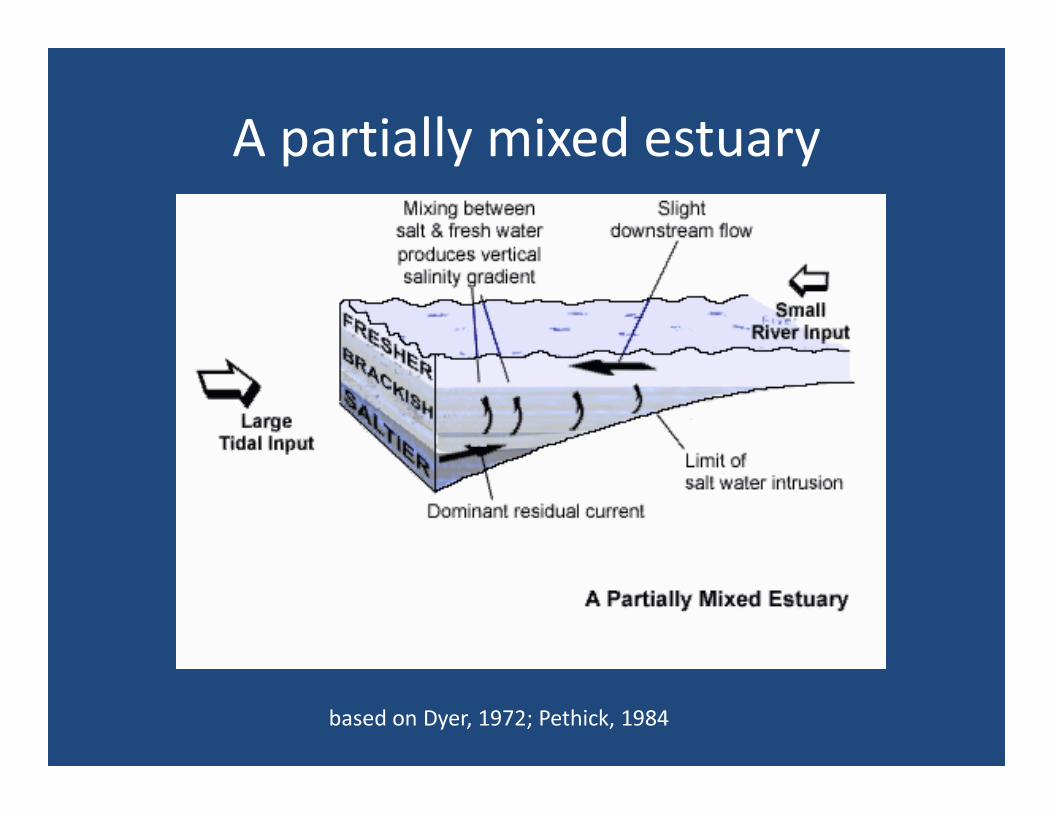
A partially mixed estuary
based on Dyer, 1972; Pethick, 1984

Low River Flow
Newark BayDundee DamRange of Salinity
Front Location
Erosion and Deposition (Mixing) of Material
Due to Estuarine Processes
Lower Energy Region – Less Erosion and
Deposition
Estuarine Exchange
Low Flow Input from Passaic River
with Newark Bay
from Passaic River Downstream Transport of
River Material
Net Upstream Transport of Bay
Material

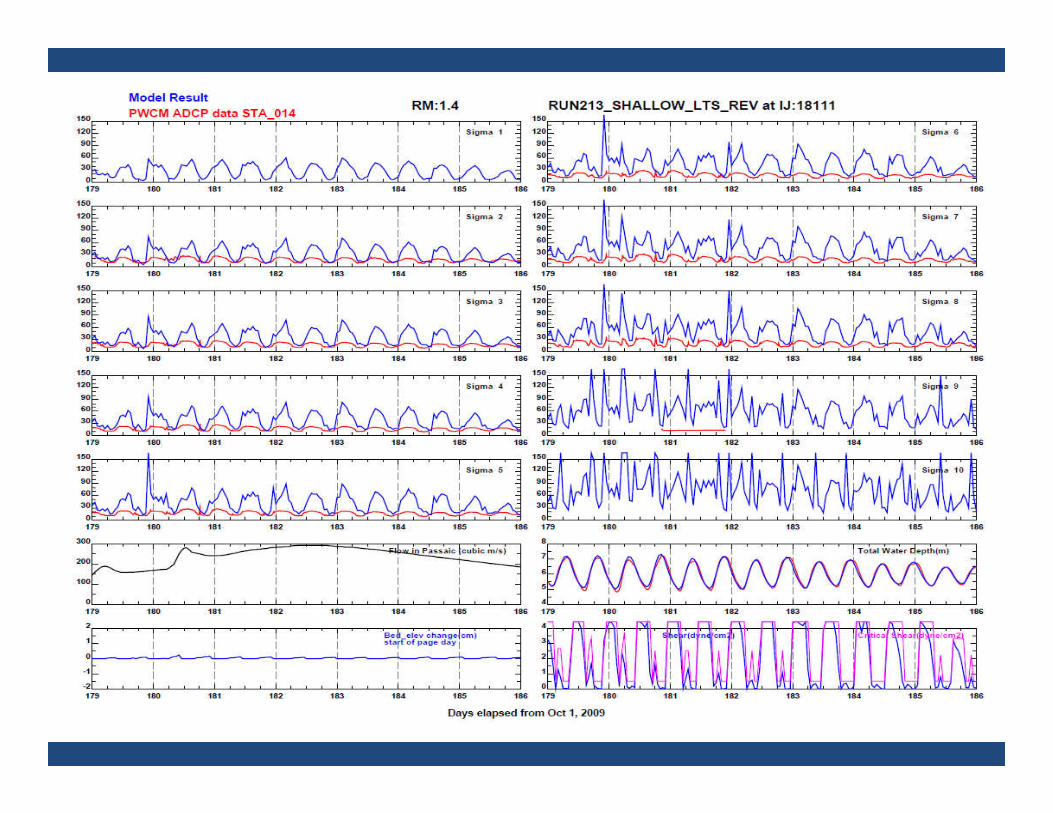
Physical Water Column Physical Water Column Monitoring Period Monitoring Period
Model Data ComparisonsModel Data ComparisonsModel Data ComparisonsModel Data Comparisons

Movement of Salt Front
SHOW SALINITY SALINITY MOVIE
Depth_TSS_Salt.exe
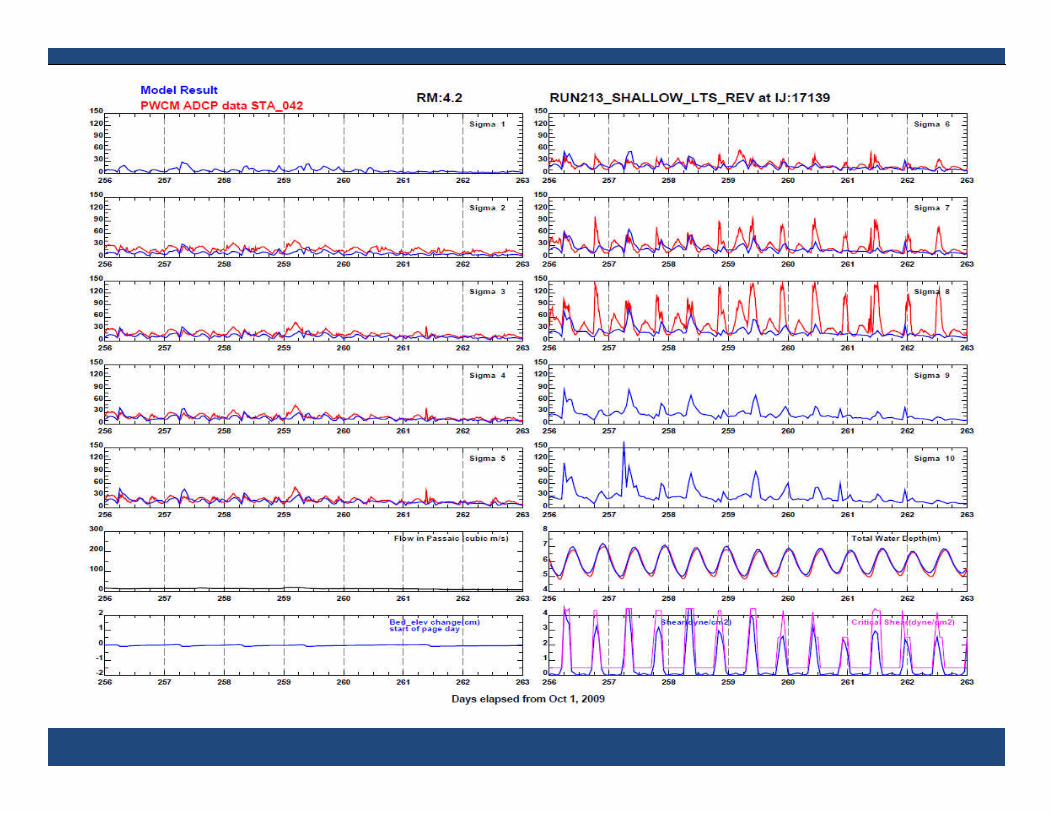
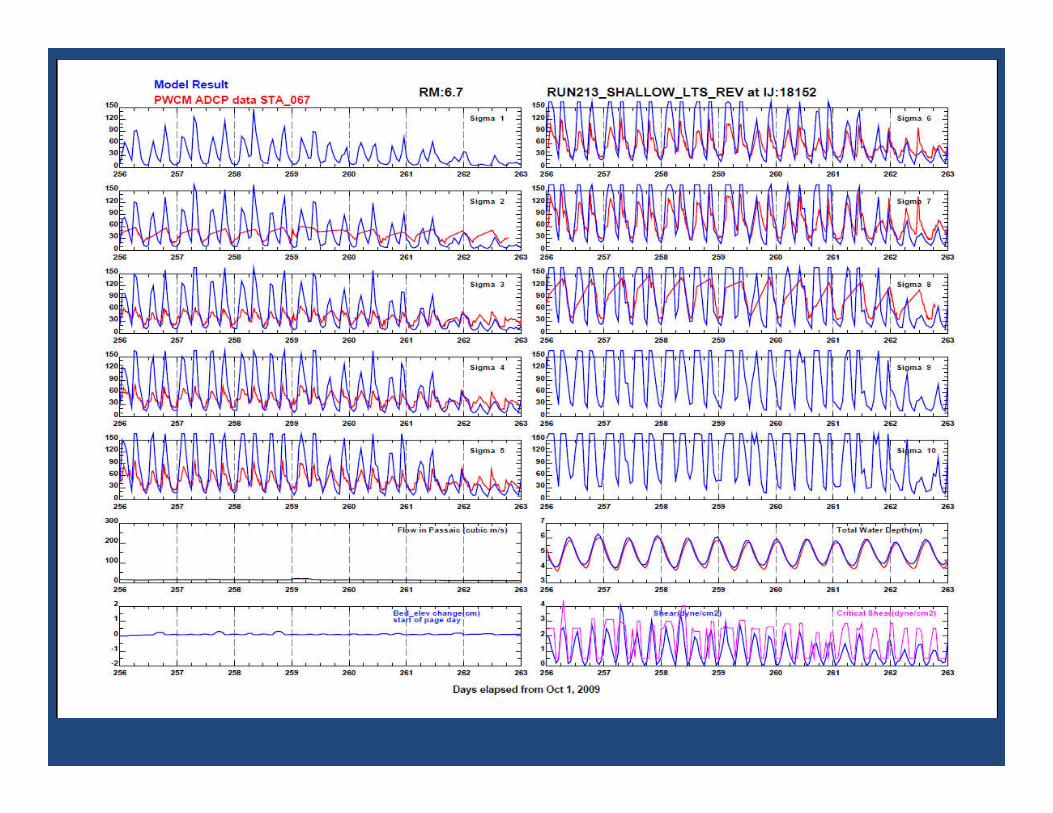
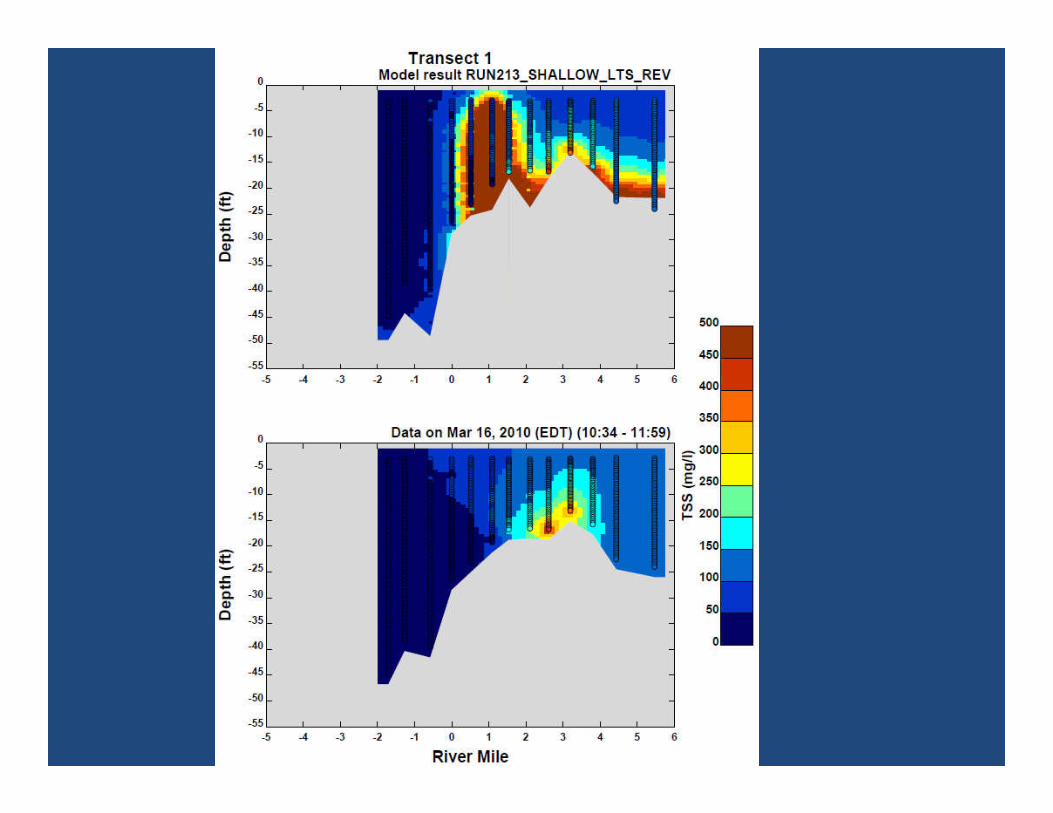
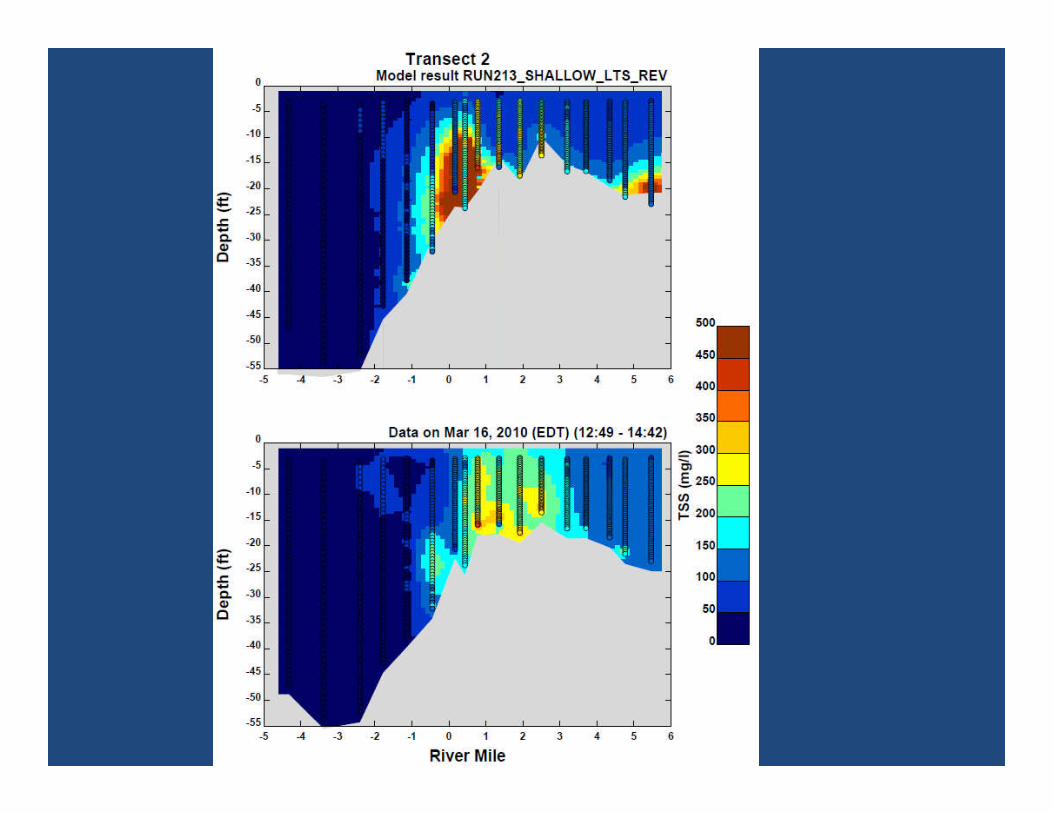
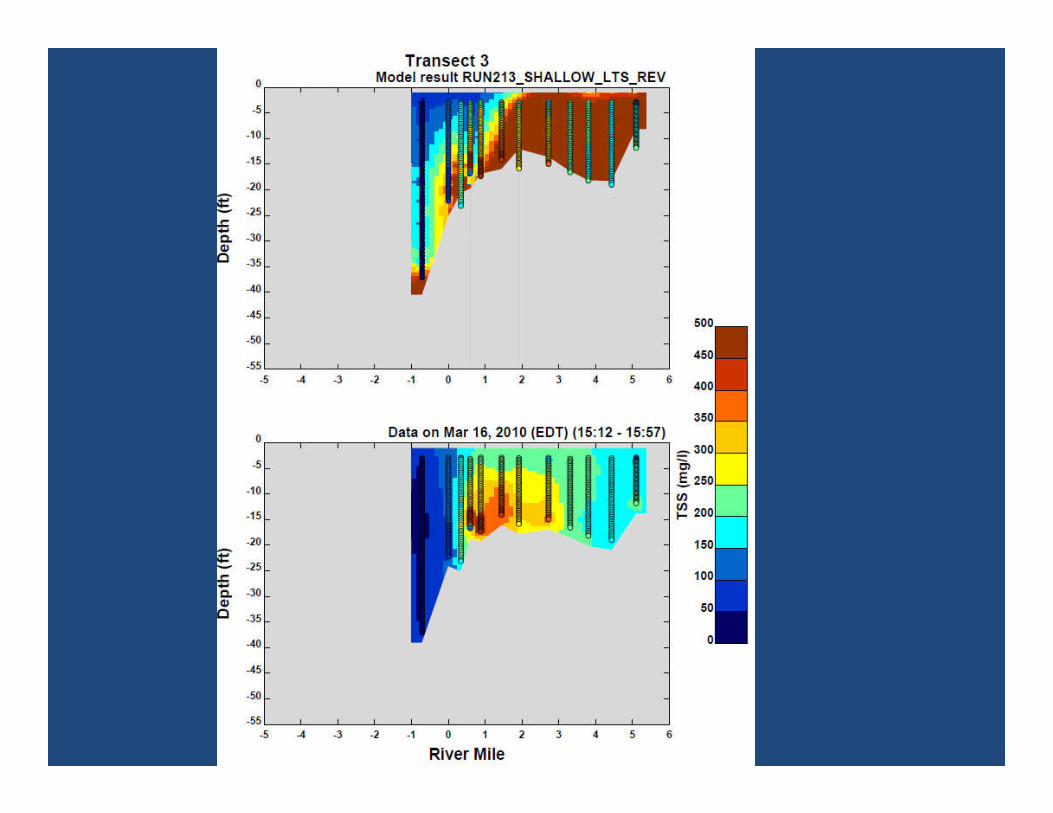
March 2010 High Flow: March 2010 High Flow: Comparing model results to dataComparing model results to dataComparing model results to dataComparing model results to data
Sediment Bed Elevation Changes:Sediment Bed Elevation Changes:Comparing model results to dataComparing model results to dataComparing model results to dataComparing model results to data


3) Why does it take so long• To correctly develop and apply a model is time
consuming• A model is not reality, the modeler is trying to
reproduce what is happening in the real world– Model calibration– Needs to understand the data– Needs to understand the data– Create a or understanding of the system with the data– Needs to “translate” data into “model language– Long process
Despite super fast computers, heavy computations per grid/layer
We are making long term calculations/predictions

Now what?How does this information get transferred?
Hydrodynamic Model Sediment Transport Model Contaminant Fate Model
Information TransferFlow Sediments
Organic Carbon
Chemical Loads
TidesCurrent Velocity
Salinity
Suspended Solids Concentration
Deposition Scour
Burial
Particulate andDissolvedChemical
Concentrations
Part and DissChemical
Concentrations
Sediment Bed

QUESTIONS