Embed Size (px)
Citation preview
Why do we invest ethically?
Diana J. Beal, Associate Professor, Faculty of Business,
University of Southern Queensland, Toowoomba, Australia
Michelle Goyen, Lecturer, Faculty of Business, University of Southern Queensland
Peter Phillips, Lecturer, Faculty of Business, University of Southern Queensland
Corresponding Author: Michelle Goyen ([email protected])
2
Why do we invest ethically?
Abstract
Analysis in this paper has proposed three potential motives for ethical investment –
financial returns, non-wealth returns and social change. The motives are developed from
the literature and illustrated in the context of a ‘best of sector’ fund and a socially
screened fund. We find that the proposed motives are neither exhaustive nor exclusive
and one single motive will not explain the behaviour of all ethical investors. There may
be a trade-off between financial and psychic returns for some investors. The trade-off for
consumption-investors is expected to be close to zero (total utility is maximised with
small levels of ethical investment in the fun of participation model) and is expected to
vary with the ethical intensity of investment-investors, as shown when we include ethical
intensity into the investor’s utility function. Psychic return can also be viewed as an
increase in happiness and this approach would lend itself to empirical testing to increase
our understanding of why we invest ethically.
1. Introduction
Understanding investor behaviour is a difficult task. The capriciousness of human nature
generates a seemingly endless variety of behaviours that manifest themselves in
interesting ways when individuals pit themselves against the markets. One particular type
of behaviour that has emerged over the last twenty years or so is the desire to invest
ethically. In this paper, we address the question, “Why do we invest ethically?” Our
answers go some way towards advancing our understanding of ethical investor behaviour.
The empirical contribution of this paper is a survey of both shareholders and prospectus
applicants (who did not complete purchases) of Earth Sanctuaries Ltd (see Beal and
Goyen, 1998a or 1998b for a description of the company). With a stated objective of
conservation and a financial focus on stability rather than maximising shareholder
returns, ESL provided an ideal opportunity to gather data to aid our understanding of

3
ethical investor behaviour. At the time the sample for this study was being selected
(1999), there were about 7,000 prospectus applicants/shareholders of ESL. A random
sample of 1400 (or 20%) was selected. Corporations and overseas investors were
excluded from the sample. In all, 943 responses were returned, 788 from the current
shareholders and 155 from prospectus applicants giving a net response rate of 67%.
This paper is organised as follows. In the next section, we briefly review the literature
pertaining to the traditional view of investor motives, individual investor needs and the
ethical investment phenomenon. We then examine the evidence for each of three
potential explanations of ethical investment. In the final section, we develop utility curves
for investors that explain observed ethical investor behaviour.
2.0 Investor Motivation - A Brief Review of Literature
There is a growing body of literature that acknowledges that investors don’t behave in the
fashion typically assumed by traditional finance theory. Specifically, we discuss evidence
that suggests individuals do not always act as if they were homogeneous with respect to
mean-variance optimisation. We then look at some systematic differences in the way
investors behave. Some of the burgeoning literature on ethical investment, a specific
niche in markets, is then discussed.
2.1 Recognition of the Non-Rational Investor
Since the early 1960s, individual investors have been deemed to be rational. Indeed, as
Statman (2004a) affirmed, rationality on the part of investors is the first foundation block
of modern finance. The finance discipline of the last four decades has developed the
bases that investors are rational, they prefer more to less, they juggle risk and return and
they demand higher returns to compensate them for assuming greater risk. In short, the
traditional theory does not allow for any influences on the investment decision apart from
maximising returns given the constraint of the individual’s particular level risk aversion.
This state of affairs came about through the publication of work by several influential
authors. The early work by Miller and Modigliani (1961) on dividend policy
complemented Markowitz’s (1959) development of mean-variance portfolio theory that
4
saw investors as being focused entirely on the expected returns and risk of their whole
portfolios. As Statman (2004a) noted, Markowitz’s investors are never reluctant to realize
losses on stocks, when tax savings are available and add to their wealth, and they do not
care about dividend policy nor about the social responsibility of the companies, of which
they are part owners, so long as risk and expected returns are unaffected. Rational
investors do not reject investment in firms that operate in areas or with methods which
contravene their personal value sets – put simply, personal values are irrelevant to the
investment decision.
However, Statman (2004a) argued that investors, before finance became overwhelmed by
the notion of rationality, were seen as ‘normal’ in that they exhibited the warm-hearted
(soft-headed?) foibles of human nature, rather than the cold calculation of the rationalists.
Statman (2004a) drew on early work by Snyder (1957) who highlighted that the ‘normal’
investors of the day could in fact increase their wealth by realizing losses and claiming
tax benefits, if only they could overcome their reluctance to crystallize the losses.
Snyder’s investors held on to loss-making investments in the hope that one day they
would recover their values, and thus they were not indifferent between unrealized and
realized losses. In addition, by their behaviour, they showed that they did not prefer more
to less, as they eschewed the chance to increase total wealth by claiming tax benefits
from the capital losses. Odean (1998a) reported similar findings in relation to losses, four
decades later.
If investors actually behave as traditional finance theory assumes, ethical investment
would only exist because it provides the opportunity for equivalent return at relatively
lower risk or provides higher returns for the same level of risk as ‘standard’ funds.
Hence, our first proposed motivation for ethical investment is that investors are looking
for superior financial performance. We will return to this issue in Section 3.
The concept of rationality has dominated finance for four decades but, in the last two of
those decades, authors have taken delight in pointing out comprehensively that investors
do not uniformly exhibit cool rationality. Workers in the emergent area of behavioural
5
finance have drawn on concepts and evidence from the psychology literature in an effort
to propose better explanations for finance phenomena. For example, well documented in
psychology is the tendency of decision-makers to be over-optimistic, to over-estimate
their own abilities and to be generally over-confident. Men appear to suffer from these
traits more so than do women. In the finance realm, over-confidence is manifest in
excessive trading (Odean, 1998b). Barber and Odean (2000) showed that net returns fall
as trading activity increases, and that the men in their sample traded 45% more than the
women.
Other examples are confirmation bias (the tendency to find information which reinforces
the original view and to reject other information), conservatism (inability to react or slow
reaction to unfolding events), anchoring and framing. Anchoring occurs when a person
who is asked to make a quantitative assessment can be influenced by irrelevant
suggestions made at the same time. Tversky and Kahneman (1974) reported an influential
experiment showing this phenomenon; many variations have been reported in the years
since with unchanged results. Framing refers to the way a proposition is presented: the
context of the proposition influences the resultant decision. Slovic (1995) summarised
nearly three decades of empirical evidence which showed comprehensively that framing
changes decisions.
Research in the developing area of behavioural finance has illuminated many facets of
individual investor behaviour. Thaler (1993) in an edition of selected influential papers
focused on noise in financial markets, price volatility, overreaction in markets, corporate-
finance effects (e.g. preference for cash dividends over capital gains) and individual
behaviours. Noise is the opposite of news, and noise makes up much of the information
that fuels markets. Rational investors may be stimulated to trade on news, but for every
buyer there must be a seller. If potential buyers and sellers have the same information,
then one side must be contemplating a trade which will prove to be an error and a trade
made on noise. Why do people trade on noise? Black (1986) asserted two reasons: firstly,
they trade because they like trading and, secondly, they don’t know they are trading on
noise, they think they are trading on information. Peterson (2002) drew on the

6
psychology literature to show that anticipation of reward (price appreciation) generates a
positive affect (emotion, mood or attitude) which drives increased risk-taking behaviour
and buy trading. In contrast, following the anticipated event or news, there is a decrease
in positive affect which produces more risk-averse behaviour and drives sell trading.
The volatility in prices of stocks cannot be explained merely by changes in the present
value of future dividends. Cutler, Poterba and Summers (1989) showed that large price
movements occur in the absence of important news and, conversely, not all potentially
price-significant news results in price changes. Overreaction (and underreaction) in
markets is concerned with announcement effects and the tendency of investors to over-
weight recent information and underweight information received previously. De Bondt
and Thaler (1986) found stocks which had shown extreme performance over an extended
period were likely to subsequently underperform (winners) and outperform (losers). This
paper proved controversial in the prevailing rationalist climate.
Shefrin and Statman (1985) highlighted that cognitive biases and emotion affect
investors, thus detracting from the traditionally assumed rational behaviour. Normal
investors often manage their stocks individually rather than as portfolios, they are
reluctant to realize losses, as Snyder observed almost 30 years previously, possibly
because they use ‘mental accounts’ and selling a stock at a loss closes each account with
a finality which allows no recovery of value and causes emotional distress.
2.2 Individual Investor Needs
Early research by Lease, Lewellen and Schlarbaum (1976) reported that market
segmentation, contrary to mainstream expectations at the time, did exist to the extent that
individual preferences could hinder the free flow of capital and interfere with the
establishment of coherent risk-return relationships among securities. They isolated five
different investor groups with different investment goals, investment approaches and
portfolio compositions. The following year, the same authors [Lewellen, Lease and
Schlarbaum (1977)] found that age, sex, income and education affect investor preference
for capital gains, dividend yield and overall return. Warren, Stevens and McConkey
7
(1990) again reported lifestyle and demographic factors influenced choices among the
asset classes.
Nagy and Obenberger (1994) investigated the investment-decision processes of equity
investors with substantial holdings of US Fortune 500 firms and found seven summary
factors that captured the major investor concerns. Investors were asked to rank 34
variables which had been identified as potentially affecting investment decisions as
significant, considered or ignored in the decision process. They found that most of the
variables which impacted on decisions were the traditional wealth-maximization criteria
such as those concerned with earnings, diversification, risk, etc. Interestingly, the highest
ranked wealth-maximizing criterion (expected corporate earnings) was ranked as
significant by less than half the sample (46.6%). Thus, no wealth-maximizing criterion
was considered important by more than half the sample. Indeed, the variable coming third
in the list of significant factors, ‘feelings for firm’s products and services’, was decidedly
an emotional and non-rational decision driver. These authors concluded that investors
‘use diverse criteria’ and ‘do not approach investment decisions in a normative fashion’
(Nagy and Obenberger, 1994: 65).
Finally, for this section, Statman (2004b) drew an analogy between food consumption
choices and investment choices. Both offer utilitarian and expressive benefits. The
utilitarian benefits of food involve nutrition and flavours while the most-favoured
utilitarian benefits of investment choices are high expected returns and low risk.
Expressive benefits allow people to define and express their values, social class and
lifestyle choices to themselves and others. It is readily acknowledged that foods, food
supply establishments and in-situ food consumption places (restaurants) all offer
expressive benefits to consumers as well as vital nutrition. Statman (2004b) contended
that investments also supply expressive benefits and that most of argument over
rationality and irrationality in investment decisions stems from the rationalists’ being
unwilling to acknowledge the existence and influence of expressive benefits. Further,
Statman considered that mean-variance optimizers (rational investors) view their
portfolios as a whole, whereas non-rationalists build distinct layers into their pyramidal
8
portfolios, with low-risk safety assets forming the base with more risky and assets
fulfilling other purposes occupying the upper layers. Our data supports Statman’s
assertion. We found about 30% of our respondents considered that ethical investments
constituted 20% or less of their equities portfolios. A further 10% considered their
portfolios to be 100% ethical, but the majority of these respondents only held shares in
Earth Santuaries.
Social responsibility is one such ‘other purpose’. While socially responsible portfolios are
generally private matters and not proclaimed to the world, they still offer self-signalling
benefits, where investors reinforce their feelings of social responsibility and generate
personal emotional benefits from their feelings of having financially supported good
things and having ‘put their money where their mouths are’. This rationale leads to our
second proposed motivation for ethical investment – non-wealth returns. We investigate
this matter in Section 2.
2.3 Ethical or Socially-Responsible Investment
Ethical or socially-responsible investment (SRI) has emerged in the last decade or so as a
reasonably legitimate focus of discussion about investor choice. During the 1980s, SRI
was confined to the margins of the investment world and publicly manifested itself only
in the establishment of a few retail unit trust (mutual) funds, popularly characterised as
being supported by the ‘loony left’. Since that time, this force in investment has grown
rapidly in importance and has been characterised by an expansion in the forms of its
expression to encompass retail funds, shareholder activism at AGMs and SRI streams
within superannuation (pension) funds.
Concomitant with the growth in investor support for SRI has been the development of
academic interest in the phenomenon. A decade or so of academic interest has produced
possibly some thousands of studies in the USA, UK, Canada, France, Germany, Australia
and other countries around the world. These studies have been concerned with:
• The definition of SRI;
• The processes of SRI or the use of screens;

9
• The historical returns from SRI mutual funds versus conventional funds;
• The effect of SRI on corporate behaviour;
• Who are the SRI investors and
• why do people choose SRI.
The last is the issue of concern in this paper.
Rosen and Sandler (1991) reported an early US study of investors in two socially-
screened mutual funds. They found the SRI investors in their sample, when compared
with other mutual fund investors (MFI), were younger, white-collar employed, better
educated and lower salaried than MFI. On average, SRI investors were 13 years younger
(39 years compared with 52 years), with 60% having graduate degrees, but currently
earning 15% less than the incomes of the MRIs, possibly due to their earlier stages in
their careers. SRI accounted for only 49% of their investments.
Beal and Goyen (1998a) studied investors in an Australian company (ESL) which openly
acknowledged that it had replaced wealth maximization with nature conservation as its
primary motivation. They found ESL shareholders are more likely to be female, to be
educated to a tertiary level and probably to postgraduate degree level than typical
shareholders of companies listed on the Australian Stock Exchange (ASX). They are
professionally employed or retired, likely to have a lower household income, high
household assets and a share portfolio containing more than 11 stocks.
In further research, Beal and Goyen (1998b) investigated whether investors in ESL with
its unconventional mission could really be considered to be donors rather than investors.
Drawing on Cullis, Lewis and Winnett’s (1992) findings that a distinction may be drawn
between ‘consumption-investors’ who gain utility from investing ethically and
‘investment-investors’ who gain utility from the financial outcomes of their investments,
Beal and Goyen (1998b: 219) found the vast majority of their shareholder respondents
met the definition of ‘investment-investors’ – they derived significant benefit from the
conservation activities of the company. These authors concluded that ‘investors are far
more complex creatures than the current state of theory would suggest’. Further, investors
10
apply many criteria in the decision-making process, although each investor weighs the
criteria differently.
Lewis and Mackenzie (2000a) studied the motivation of more than 1000 UK ethical
investors. They found ethical investors to be middle-aged, middle-income activists (in
politics, community and church) with a vast majority holding mixed portfolios. Only 20%
held ethical investments exclusively. In concert with the Australian findings of Beal and
Goyen (1998b), this UK research found ethical investors to be not extremists, but merely
one arm of the investment community.
A consistent theme of the literature which has reported SRI investor characteristics and
the rapid growth of SRI in many countries around the globe is the importance of the
movement of women into higher-paying jobs (and thus to become savers and investors in
ever increasing numbers) and the influence of higher education. Schueth (2003)
complemented the above-mentioned Australian and UK findings with the argument from
the US that the rapidly growing SRI industry there is fuelled by better education, the
appointment of women as senior executives and directors giving them access to power
and also the ability to invest personally, and the realization that socially-screened
portfolios do not necessarily underperform the market. It is estimated that, in the US,
about 60% of SRI investors are women, a far greater proportion than in the general
investor population.
3.0 Motivations for ethical investment
Based on traditional finance theory and the ethical investment literature, there are three
potential reasons why people may invest some or all of their funds ethically:
(1) For superior financial returns;
(2) For non-wealth returns
(3) To contribute to social change
11
These motivations are neither exclusive nor exhaustive, but offer a starting point for
advancing our understanding of ethical investors and the choices they make. In this
section we develop these three proposed motivations for ethical investment.
3.1 Is ethical investing a fair game?
In this section, we examine the issue of the over- or underperformance of SRI
investments. If, on balance, the risk-return profiles of SRI funds are the same as those for
ordinary funds, ethical investment can be considered to be a fair game.
Discussion of a posited relationship between the level of social responsibility of a firm
and its financial performance has been a contentious topic in academic (see, for example,
Ali and Gold 2002; Bauer, Koedijk and Otten 2002,) and professional literature (see, for
example, Chan 2003; Rothchild 1996) as well as the popular press (Emery 2001;
Johnson 2001). To advance this thorny issue of the relationship between corporate social
performance and corporate financial performance, Orlitzky, Schmidt and Rynes (2003)
conducted a meta-analysis of 52 studies. They concluded that, after considering
methodological and measurement issues, previous empirical analyses do suggest socially
responsible firms outperform financially.
Ali and Gold (2002) approached the issue of the relative performance of SRI by assessing
the impact of excluding sin stocks on portfolio returns. They found portfolio returns on
Australian stocks would have increased via the inclusion of alcohol and gambling stocks
during the period from 1995 to 2001. Bauer, Otten and Tourani-Rad (2004) used
Australian funds data from 1992 to 2003 and found the returns for SRI funds were not
significantly different from the returns on market index.
The empirical analysis of returns and social responsibility has yet to provide a convincing
causal link between the two factors. A reasonable conclusion, based on the prior research,
is that SR investments neither over- nor under-perform their non-SRI counterparts. The
single objective of generating financial returns cannot, therefore, explain ethical
investment.
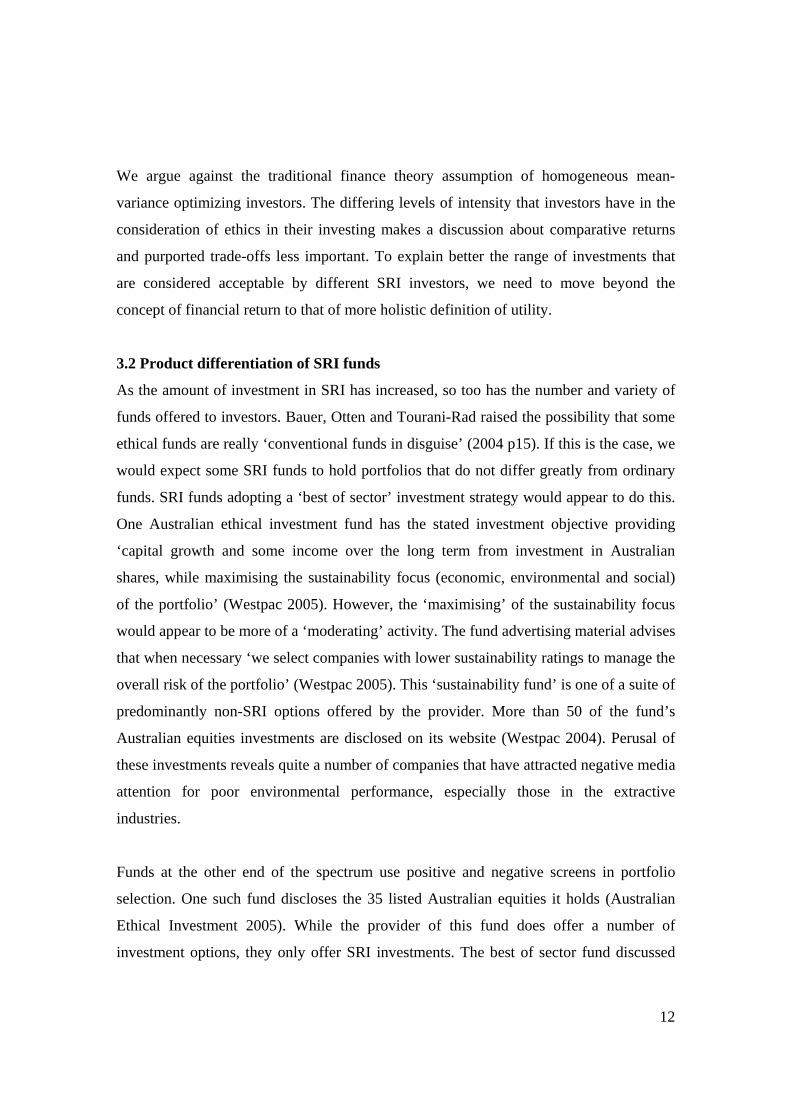
12
We argue against the traditional finance theory assumption of homogeneous mean-
variance optimizing investors. The differing levels of intensity that investors have in the
consideration of ethics in their investing makes a discussion about comparative returns
and purported trade-offs less important. To explain better the range of investments that
are considered acceptable by different SRI investors, we need to move beyond the
concept of financial return to that of more holistic definition of utility.
3.2 Product differentiation of SRI funds
As the amount of investment in SRI has increased, so too has the number and variety of
funds offered to investors. Bauer, Otten and Tourani-Rad raised the possibility that some
ethical funds are really ‘conventional funds in disguise’ (2004 p15). If this is the case, we
would expect some SRI funds to hold portfolios that do not differ greatly from ordinary
funds. SRI funds adopting a ‘best of sector’ investment strategy would appear to do this.
One Australian ethical investment fund has the stated investment objective providing
‘capital growth and some income over the long term from investment in Australian
shares, while maximising the sustainability focus (economic, environmental and social)
of the portfolio’ (Westpac 2005). However, the ‘maximising’ of the sustainability focus
would appear to be more of a ‘moderating’ activity. The fund advertising material advises
that when necessary ‘we select companies with lower sustainability ratings to manage the
overall risk of the portfolio’ (Westpac 2005). This ‘sustainability fund’ is one of a suite of
predominantly non-SRI options offered by the provider. More than 50 of the fund’s
Australian equities investments are disclosed on its website (Westpac 2004). Perusal of
these investments reveals quite a number of companies that have attracted negative media
attention for poor environmental performance, especially those in the extractive
industries.
Funds at the other end of the spectrum use positive and negative screens in portfolio
selection. One such fund discloses the 35 listed Australian equities it holds (Australian
Ethical Investment 2005). While the provider of this fund does offer a number of
investment options, they only offer SRI investments. The best of sector fund discussed

13
above and this screened fund hold only four equities in common. This overlap is small,
especially given that there only around 1 700 companies listed in the Australian market.
The opportunity for diversity is significantly lower in Australia than it would be in the
US where there are many more listed companies. Why would fund managers offer such a
range of SRI funds?
Cowton (2004: 249) considered ethical funds to be ‘retail financial products that
specifically add social or ethical goals or constraints to normal financial criteria’.
Products are marketed to attract customers and the customers of SRI funds are ethical
investors. Viewing SRI funds as products can help us understand the large differences in
the investment styles of the screened and best of sector funds and why there is demand
for both. Consider a best of sector fund where the equities held in the ‘ethical’ portfolio
are not significantly different from those held in an ordinary fund. One would expect that
the primary difference between these funds would be the higher transaction costs
associated with holding the ‘ethical’ fund. So although the risk-adjusted returns would be
similar on both portfolios, the ethical investor will receive a lower return net of
transaction costs.
Bateman, Fraedrich and Iyer (2001) stated that consumers use rule-based (or heuristic)
processes when making decisions that are similar to prior situations. Thus, in a world of
mean-variance optimisers (with no first-time investors) who make their investment
choices on the basis of risk and return, there would be no demand for the ‘ethical’ fund
because investors chose the fund with the higher net return. For unfamiliar decision
situations, consumers use a cost-benefit (or utilitarian reasoning) process to make the
decision (Bateman, Fraedrick and Iyer 2001). Again, we are left with zero demand for the
‘ethical’ fund because the financial benefits are lower than they would be from the
standard fund.
This leads us to ask why investors would support an additional goal in the investment
decision. Auger et al. (2003) used a structured choice experiment to elicit the willingness
to pay for the social product features of soap and running shoes and found some
14
consumers were willing to pay a significantly higher amount for an ethical product. The
size of the ethical premium was related to the demographic characteristics of the
participants. If we view SRI funds as products it is reasonable to extend the findings of
Auger et al (2003) to SRI funds. Non-wealth motivations for ethical investment are the
most likely explanation for the observed demand for best of sector ‘ethical funds’. To pay
higher transaction costs for what is essentially the same product, these customers must
derive an incremental benefit solely from the fund’s branding as a SR investment. The
incremental benefit is a psychic return (or expressive benefit in Statman’s terms). This
psychic return bridges the gap between financial return and utility. Cullis, Lewis and
Winnett (1992: 7) stated the ‘extent of an individual’s ethical investment activity is
dependent on the size of the marginal benefits, which may be psychic or more tangible,
relative to the marginal costs of such actions’
Some would argue that an ‘ethical’ fund that is not substantially different from the market
index could not be counted as an SRI investment at all. Sparkes (2001: 203) considered
that funds ‘…not fulfilling generally accepted notions of ethics, are at least attempting to
meet the ethical concerns of the underlying investors’. No matter how small the ethical
component of the fund’s investment selection, there are apparently investors who receive
sufficient psychic return to create demand. Investors willing to purchase best of sector
funds fit Cullis, Lewis and Winnett’s definition of consumption investors – ‘those who
gain direct utility from investing ethically’ (1992 p 9). Consumption investors may be
motivated simply by fashion – they feel good because they are engaging in an activity
that is viewed as desirable by their peer group. Ethical investors in this category are
motivated by a combination of financial returns and non-wealth factors.
3.3 Investing to improve the world
Our final proposed motivation for ethical investment is an objective of achieving social
change. In contrast to the consumption-investors discussed above, those with an objective
of achieving social change can be identified as ‘investment-investors’. Investment-
investors gain their psychic returns indirectly from the real outcomes of the activities of
the firms in which they invest (Cullis, Lewis and Winnett 1992).

15
It has been argued that SRI provides a vehicle for social change (cf Heinkel, Kraus and
Zechner 2001; Kreander, McPhail and Molyneaux 2004; Lewis and Mackenzie 2000b).
We are unaware of any research that documents systemic social change attributed to SRI
funds. Shareholder activism is increasing in the first world nations (Ethical Investment
Association 2004) and has achieved some significant outcomes. Rehbein, Waddock and
Graves (2004) found that shareholder activists are most likely to target large companies
and deal with specific issues. While some SRI funds are well placed for shareholder
advocacy with their investments in large firms, the fund managers are unlikely to seek or
receive consensus on which social issues the investors wish to pursue or with how much
vigour such issues should be pursued. Further, Haigh and Hazelton (2004) concluded
that the focus of shareholder activism has not been one of systemic change.
While one shareholder alone cannot cause social change, shareholders acting in concert
with others can. We see this in the formation of ethical shareholder groups in some large
companies (BHP shareholders for social responsibility and Boral green shareholders, for
example). This track to achieving social change is unpalatable to some as it involves
generating financial return from the activities they oppose. An alternate route to social
change is by supporting a non-governmental organisation (NGO) to act on your behalf.
Guay, Doh and Sinclair (2004) noted the increasing level of activity of NGOs designed to
effect social change via investing. Greenpeace, for example, has sought the backing of
individual shareholders and fund managers for resolutions that reduce environmental
damage. The major dichotomy with these two alternate routes to achieving social change
is the number of social issues that can be addressed by each approach. The SRI fund’s
objectives could be viewed as achieving some social change across a range of issues,
while the NGOs tend to focus on one issue (eg Greenpeace and the environment). Thus,
the objective of social change is not met in a direct sense by investment in an SRI fund.
However, the joint objectives of financial returns and some reduction in damaging
corporate activities can be met through SRI funds.

16
Haigh and Hazelton (2004) argued that both shareholder advocacy and investment in SRI
funds are incapable of inducing significant corporate change. We conclude that the main
benefits derived by SRI fund investors from the social change aspect of their investment
is one of psychic return – feeling good about not supporting undesirable activities – rather
than any tangible external benefit from making significant change. Therefore, these
investors are motivated by all three of our proposed objectives, with the social change
factor being the least important in the decision to invest in an SRI fund.
We conclude that a range of SRI products helps to meet the varying levels of satisfaction
obtained by individuals from investing ‘ethically’. Our data show considerable
heterogeneity in the way ethical investors make investment decisions. We asked
respondents if they always considered social factors in their analysis of investments.
Ethical aspects were always considered by about 24% of respondents, never considered
by a further 14% while the majority (62%) considered them ‘sometimes’.
We also found considerable disparity in judgements of company environmental
performance by our respondents. These two questions were structured with open
responses to avoid disclosing our opinions. Respondents identified 273 ‘good’ companies
and 114 ‘bad’ companies. Many of the companies were rated by only one or two
respondents, demonstrating that not all investors looking for environmentally sound
investments are looking for the same type of thing. More interesting was the tendency for
some respondents to rate companies as good environmental performers while those same
companies were identified as bad performers by a greater number of respondents. This
phenomenon was particularly strong for mining companies. BHP Billiton, for example,
was classified as a good environmental performer by 10 respondents while 189 thought
this company was a bad environmental performer. BHP is held by the best of sector
sustainability fund discussed earlier, but is not held by the screened fund. North Ltd,
which through its subsidiary ERA owned a uranium mine whose tailings dam was
leaking into the Kakadu National Park, was rated by 9 respondents as a good
environmental performer and bad by a further 138.

17
4.0 The utility of ethical investment
This section of the paper develops utility curves that can be used to accommodate the
expanded investment objectives of ethical investors. As discussed in Section 3, ethical
investment provides SR investors with more than financial return. Investing in an ethical
company or ethical fund is, to a certain extent, like investing in fine art – in addition to
financial returns, the investment yields a flow of pleasure and even social status. In this
section some tentative first steps are made towards incorporating this aspect of ethical
investing into a theoretical economic framework.
There are three ways that one might approach the task of placing ethical investing within
a theoretical economic framework.
(1) By treating the psychic returns from ethical investing as equivalent to a gambler’s
‘fun of participation’.
(2) By including the perceived level of ethicalness of an investment in the investor’s
utility function; and
(3) By treating the psychic returns from ethical investing as equivalent to the
happiness or well-being derived from other pleasurable activities. In this case, we
can make use of the tools developed by happiness researchers.
We examine each of these in the following sections.
4.1 Fun of participation
The psychic returns from ethical investments are somewhat analogous to the ‘fun of
participation’ that some gamblers may derive from participating in a game of chance.
Casual observation reveals that some individuals who participate in small gambles
(compared to their overall level of wealth) are quite satisfied with the experience
regardless of whether they win or lose. Winning is an added bonus. The fun of
participating in a fair game generates a higher level of utility than would be derived from
the financial return on the gamble. The additional utility gained from the fun of
participation is independent of the outcome of the gamble itself. Applied to ethical

18
investing, we could say that the utility derived from an ethical investment is the expected
financial returns of the risky investment outcomes plus the utility of investing ethically
and that the latter is independent of the former. Assuming that ethical investors display
some degree of risk aversion, simple geometry can be used to display the ethical
investor’s utility functions:
Figure 1: Ethical Investor’s Utility Function
Wealth
Utility
W1 W0 W2
Utility of not investing
Utility of a certain outcome
Utility of ethical investment
Utility of unethical investment
In this diagram a risk-averse individual with initial wealth W0 faces an investment in a
fair game gamble that results in wealth of W2 if won and W1 if lost. The utility that the
investor derives from participating in the investment depends on whether the investment
is perceived as ethical or unethical. If the investment cannot be viewed as ethical, the SR
investor will derive less utility from the investment than he or she would derive from
avoiding it. That is, the fun of participation is negative and outweighs the expected
financial return. On the other hand, the investor receives more utility from an ethical
19
investment than he or she would derive from avoiding the investment. That is, the fun of
participation is positive and is added to the expected financial payoff. An important
implication of this model as it stands is that the expected utility of the investment
increases as the amount at stake diminishes. Imagine that W1 and W2 move inwards and
approach W0. At the limit, where W1 and W2 are extremely close to W0, the expected
utility of the ethical investment is highest. This analysis implies that the ethical investor
experiences more utility, the less money is at stake in such investments.
This simple model captures the ‘psychic’ augmentation to total utility derived by the
ethical investor independently of the investment outcome. To determine whether or not
the model has explanatory power—to determine whether it explains some of the
observable behaviour of ethical investors—we must compare the main prediction of the
model with observed behaviour. The central prediction of this model is that utility
maximising ethical investors will invest nominal sums (compared to their total wealth) in
their ethical investments. This does appear to accord with the observed behaviour of our
sample with about 30% of respondents classifying the proportion of ethical investments
in their portfolios at 20% or less. It is also consistent with the U.K. results of Lewis and
Mackenzie (2000a) and Rosen and Sandler (1991) in the U.S. Our fun of participation
model provides a good depiction of the consumption-investors utility function, where the
investor’s objective is to achieve close to a market rate of return with the additional feel-
good factor from the label ‘ethical investor’.
4.2 Including ethical intensity in the utility function
A second way that the task of placing ethical investment within a theoretical economic
framework may be approached is to make an adjustment to the utility function that is
usually assigned to investors in modern finance theory. In finance, the standard treatment
of investor behaviour is to assign a utility function to the investor in which the two
arguments in the function are expected return and risk (the standard deviation of the
possible divergence of actual investment outcomes from expected investment outcomes):
),( RREfU σ= (1)
20
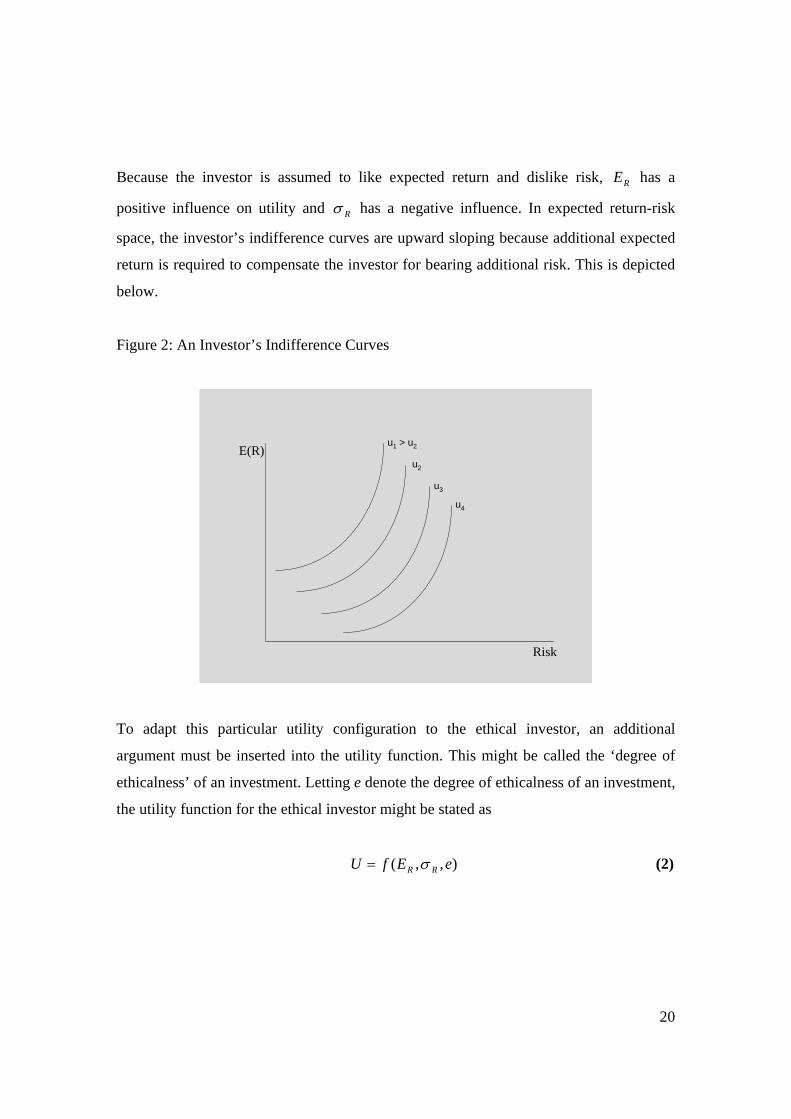
Because the investor is assumed to like expected return and dislike risk, RE has a
positive influence on utility and Rσ has a negative influence. In expected return-risk
space, the investor’s indifference curves are upward sloping because additional expected
return is required to compensate the investor for bearing additional risk. This is depicted
below.
Figure 2: An Investor’s Indifference Curves
E(R)
Risk
u1 > u2
u2
u3
u4
To adapt this particular utility configuration to the ethical investor, an additional
argument must be inserted into the utility function. This might be called the ‘degree of
ethicalness’ of an investment. Letting e denote the degree of ethicalness of an investment,
the utility function for the ethical investor might be stated as
),,( eEfU RR σ= (2)
21
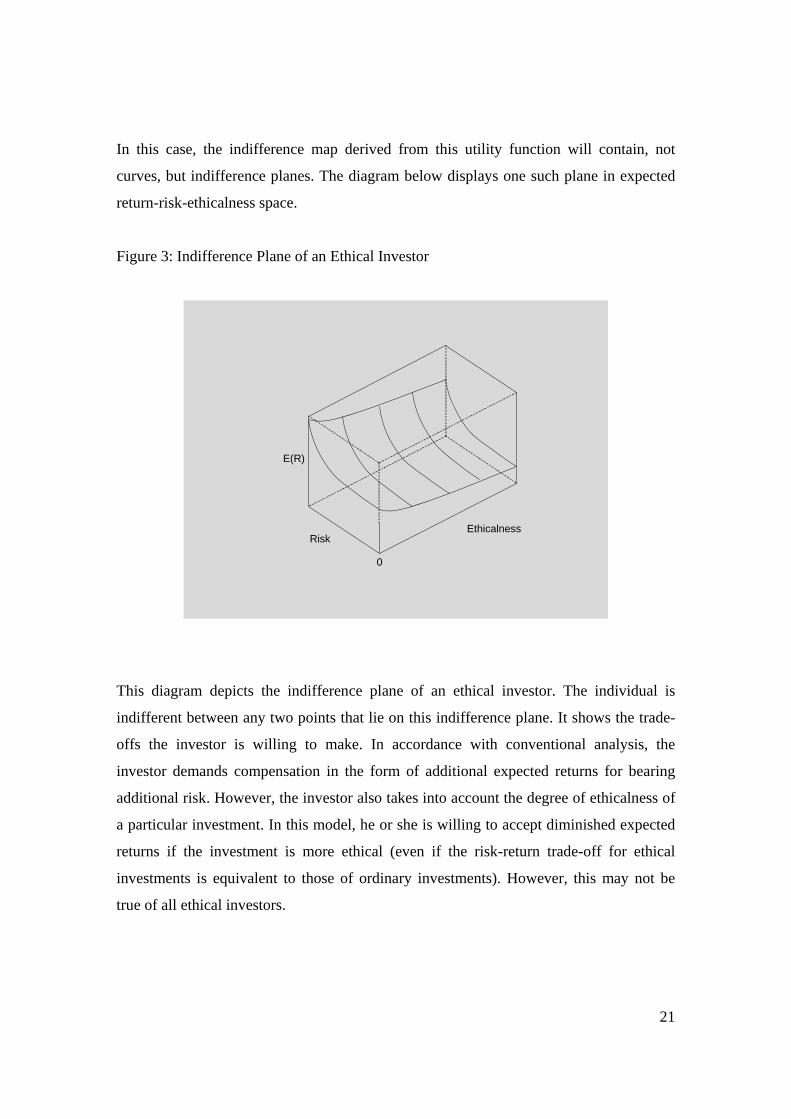
In this case, the indifference map derived from this utility function will contain, not
curves, but indifference planes. The diagram below displays one such plane in expected
return-risk-ethicalness space.
Figure 3: Indifference Plane of an Ethical Investor
E(R)
RiskEthicalness
0
This diagram depicts the indifference plane of an ethical investor. The individual is
indifferent between any two points that lie on this indifference plane. It shows the trade-
offs the investor is willing to make. In accordance with conventional analysis, the
investor demands compensation in the form of additional expected returns for bearing
additional risk. However, the investor also takes into account the degree of ethicalness of
a particular investment. In this model, he or she is willing to accept diminished expected
returns if the investment is more ethical (even if the risk-return trade-off for ethical
investments is equivalent to those of ordinary investments). However, this may not be
true of all ethical investors.

22
If ethical investors are unwilling to make any concessions regarding the ethicalness of
their investments, regardless of how much additional return they could procure, we
remove the trade-off between return and ethicalness and make certain parts of the
indifference plane ‘off-limits’. With these changes it is possible to consider a wide range
of behaviour within this framework. For example, an investor uninterested in the
ethicalness of his or her investments (14% of respondents in our sample) will inhabit the
front edge of the indifference plane, just like the orthodox investor in modern finance.
Investment-investors will restrict themselves to parts of the indifference plane that
correspond with the level of ethicalness they are willing to accept and the level of
ethicalness they can obtain given the current set of investment options. This is displayed
geometrically in the following diagram.
Figure 4: Indifference Planes for a Range of Investor Types
E(R)
Risk
Ethicalness
0
A
B
C
D
E
In this diagram, the orthodox investor who is uninterested in ethicalness again inhabits
the edge of the indifference plane (line 0, E). The consumption-investor will lie a little
further into the plane, but close to the orthodox investor. The investment-investor may
choose some minimum level of ethicalness, say A. In this case the relevant portion of the

23
indifference plane would be the area ABCD. Investors whose objectives fall somewhere
between those of consumption investors and investment-investors may choose some level
of ethicalness that they are willing to accept, say A. In this case, the relevant portion of
the indifference plane will be line AB. It is a simple exercise in geometry to account for a
variety of different combinations.
It is clear that this model is flexible enough to account for a variety of the observed
behaviour of ethical investors. By altering the shape of the indifference plane one could
consider the actions of ethical investors who are (1) interested in return, risk and
ethicalness and willing to make tradeoffs between all three (the 62% of our respondents
who ‘sometimes’ consider ethical performance in their investment decisions); (2)
interested in return, risk and ethicalness but are unwilling to make tradeoffs between
return and ethicalness (the 84% of our sample who considered some companies were too
bad to invest in); and (3) uninterested in return or risk (NGO activists, for example). For
this last possibility we could remove return and risk from the utility function entirely. In
which case, the investor would attempt to maximise the ethicalness of his or her
investments (subject to any income or budgetary constraints). The model just described is
flexible and provides a useful framework for thinking about different types of ethical
investors and their behaviours. The downside of this particular type of analysis is its
abstractness. It does not shed any light on how the psychic utility derived from ethical
investing might be quantified or measured. In order to develop a model where the utility
from the ethicalness of the investment can be quantified and measured we must take a
further step away from conventional economic analysis of investor behaviour.
4.3 Incorporating happiness into the model
Another and certainly more revolutionary way of modelling the behaviour of ethical
investors is through the deployment of the new methods of ‘happiness’ research. In both
of the models developed above, the type of utility under consideration is decision utility.
According to Kahneman, (1997: 375), ‘Decision utility is the weight of an outcome in a
decision’. This means that the investor assesses the possible outcomes of a decision and
accords them weights in his or her investment decision. Decision utility is inferred from

24
observing the choices of economic agents and is then used to explain these choices
(Kahneman, Wakker and Sarin 1997: 375). Happiness researchers have made use of
another type of utility. This is called experienced utility. Experienced utility is subjective
in nature. It refers to the flow of pleasure (or displeasure) that the individual experiences
whilst engaged in a particular activity. We can make use of this ‘experienced utility’
concept in our attempt to place ethical investing within a theoretical economic
framework.
One particular advantage of experienced utility is that it may be measured directly and
does not have to be inferred from observation of investor behaviour. Recent advances in
measuring experienced utility have been found to yield accurate and consistent results
(Kahneman, Krueger, Schkade, Schwarz and Stone, 2004). One measure of experienced
utility that may be particularly useful for research into the behaviour of ethical investors
is net affective experience. Net affective experience is the name given to the result
generated by a survey-type instrument deployed in the aim of extracting a measure of the
well-being that individuals attribute to various activities and events. To obtain a value for
net affective experience, psychologists use a method called Experience Sampling Method
(ESM). According to Kahneman et al. (2004:431),
ESM is carried out by supplying subjects with an electronic diary (e.g. a
specially programmed palm pilot) that beeps at random times of the day and
asks respondents to describe what they were doing just before the prompt. The
electronic diary also asks respondents to indicate the intensity of various feelings
(e.g. happy, frustrated etc.). These may be averaged to produce a metric
reflecting actual daily experience. …Net affective experience is defined as the
average of the positive adjectives less the average of the negative adjectives, for
individuals engaged in each activity.
The key problem at hand is, of course, how to incorporate these ideas into a model of
ethical investor behaviour. Actually, the problem is solved very easily. Assume first of all
that ethical investments yield their owners a flow of pleasure (happiness, psychic return
or experienced utility) over time and that that flow of pleasure is measured by net

25
affective experience. The utility derived from this flow of pleasure over the course of the
investment is equal to the sum of the product of the investment period and the net
affective experience associated with the ownership of the ethical investment:
ijijji hu μΣ= (3)
In this function ijh is the amount of time an individual i is engaged in a particular activity
j, ijμ is the net affective experience of activity j (see Kahneman et al. 2004:432). Now
assume that, additional to this flow of pleasure, the individual also derives utility from the
expected return associated with the investment and disutility from the risk associated with
the investment. In accordance with standard analysis, this part of the utility derived from
the investment can be represented by a quadratic function of the form
22)1( RRRi cbEEbu σ−++= (4)
RE and 2Rσ denote the expected financial return and the variance of returns respectively.
b is a parameter that adheres to the restriction – 1 < b < 0 when investors are risk averse
and c is a parameter that adheres to the restriction 0 < c < 1 (see Tobin (1958:76) for the
caveats associated with the use of this particular quadratic function).
The total utility, Ui, derived from an ethical investment may therefore be represented by
the following function that aggregates both the experienced and decision utility
associated with the ethical investment:
])1[( 22RRRijijji cbEEbhU σμ −+++Σ= (5)
This function is derived by assuming that the ethical investor wishes to maximise utility.
Total utility is represented by a quadratic function of the rate of return on the investment
with decreasing marginal utility plus the net affective experience during the period of
ethical investment. For those who are unconcerned with the risk and return of the

26
investment, the function reduces to equation (3). For the orthodox investor uninterested in
ethics, the function reduces to equation (4). Variations in the level of ethical intensity will
be accounted for somewhere between these two extremes by equation (5). This function
captures the essential characteristics of ethical investing as an economic behaviour.
Furthermore, the subjective utility derived from the ethical investment, identified here as
experienced utility, can be measured and quantified. Hence, our first steps towards a
theoretical economic framework for ethical investing has led us to a combination of
psychology and happiness research with orthodox financial economics.
4.0 Conclusions
In this paper, we addressed the question, “Why do we invest ethically?” We proposed
that there are three motivations for ethical investment: financial returns, non-wealth
returns and social change. These motives are neither exhaustive nor exclusive and one
single motive will not explain the behaviour of all ethical investors. The requirement for
some financial return is necessary for the activity to be considered an investment. There
may be a trade-off between financial and psychic returns for some investors. The trade-
off for consumption-investors is expected to be close to zero (total utility is maximised
with small levels of ethical investment in the fun of participation model) and is expected
to vary with the ethical intensity of investment-investors, as shown when we include
ethical intensity into the investor’s utility function. Psychic return can also be viewed as
an increase in happiness and this approach would lend itself to empirical testing to
increase our understanding of why we invest ethically.

27
References
Ali, P. and Gold, M. (2002), An appraisal of socially responsible investments and implications for trustees and other investment fiduciaries Centre for Corporate Law and Securities Regulation, University of Melbourne [Online] http://cclsr.law.unimelb.edu.au/research-papers/Monograph%20Series/SRI%20final%20report.pdf Accessed 31/01/05
Anand P. and Cowton, C. (1993) ‘The ethical investor – exploring dimensions of investor
behaviour’, Journal of Economic Psychology, 14(2): 377-385. Auger, P., Burke, P., Devinney, T. and Louviere, J. (2003), ‘What ill consumers pay for
social product features?’, Journal of Business Ethics, 42: 281-304. Australian Ethical Investments (2005) ‘Australian ethical equities trust, 30 Nov 2004’
[Online] Available http://www.austethical.com.au/howWeInvestYourFunds/portfolio_listings/ Accessed 31/01/05, last updated 28/01/05
Barber, B. and Odean, T. (2000), ‘Trading is Hazardous to your Wealth’, Journal of
Finance, LV: 773-806. Bateman, C., Fraedrich, J. and Iyer, R. (2001), ‘Framing effects within the ethical
decision making process of consumers’, Journal of Business Ethics, 36: 119-140. Bauer, Rob, Otten, Roger and Tourani-Rad, Alireza, (2004), ‘Ethical Investing in
Australia: Is there a Financial Penalty?’. EFA 2004 Maastricht Meetings Paper No. 1224; EFMA 2004 Basel Meetings Paper. [Online] Available http://ssrn.com/abstract=567127 Accessed 26/06/04
Bauer, R., Koedijk, K. and Otten, R. (2002), International evidence on ethical mutual
fund performance and investment style [Online] Available http://www.socialinvest.org/areas/research/Moskowitz_versie.pdf Accessed 09/01/03
Beal, D. and Goyen, M. (1998a), ‘Putting Your Money Where Your Mouth Is: A Profile
of Ethical Investors’, Financial Services Review, 7(2): 129-143. Beal, D. and Goyen, M. (1998b), ‘Are Ethical Investors Real?’ in Bruce, B.R. (ed.), The
Investment Research Guide to Socially Responsible Investing, The Colloquium on Socially Responsible Investing, Plano, Texas.
Black, F. (1986), ‘Noise’, Journal of Finance, XLI: 529-543. Chan, F. M. (2003), ‘Doing good’ Forbes, 3/17/2003, 171(6): 170 [Online]
EBSCOHOST database Accessed 15/01/05

28
Cowton, C. (2004), ‘Managing financial performance at an ethical investment fund’, Accounting, Auditing and Accountability Journal, 17(2): 249-275.
Cullis, J.G., Lewis, A. and Winnett, A. (1992), ‘Paying to be Good. UK Ethical
Investments’, Kyklos, 45(1): 3-24. Cutler, D.M., Poterba, J. and Summers, L. (1989), ‘What Moves Stock Prices?’ Journal
of Portfolio Management, 4-12. De Bondt, W.F.M. and Thaler, R.H. (1986), ‘Does the Stock Market Overreact?’, Journal
of Finance, XL: 793-807. Ethical Investment Association (2004), Socially responsible investment in Australia –
2004 [Online] http://www.eia.org.au/files/MNJLXB5Z5K/2004%20SRI%20benchmarking.pdf Accessed 7/01/05
Emery, C. (2001), Stock picker – the latest in green investing – shorting ‘dirties’ [Online]
http://www.planetark.com/dailynewsstory.cfm?newsid=10836andnewsdate=16-May-2001 Accessed 15/01/05
Guay, T., Doh, J. and Sinclair, G. (2004), 'Non-Governmental Organizations, Shareholder Activism, and Socially Responsible Investments: Ethical, Strategic, and Governance Implications', Journal of Business Ethics, 52(1): 125-139.
Haigh, M. and Hazelton, J. (2004), ‘Financial markets: A tool for social responsibility?’ Journal of Business Ethics, 52(1): 59-71.
Heinkel, R., Kraus, A. and Zechner, J. (2001), ‘The effect of green investment on
corporate behavior’, Journal of Financial and Quantitative Analysis, 36(4): 431-449.
Johnson, S. (2001), Inside track – bewildering choices for investors with consciences
[Online] http://www.planetark.com/dailynewsstory.cfm?newsid=11714andnewsdate=23-July-2001 Accessed 15/01/05
Kahneman, D., Krueger, A., Schkade, D., Schwarz, N. and Stone, A. (2004), ‘Towards
National Well-Being Accounts’ American Economic Review, 94(2): 429-434. Kahneman, D., Wakker, P. and Sarin, R. (1997), ‘Back to Bentham? Explorations of
Experienced Utility’ Quarterly Journal of Economics, 112(2): 375-406.
29
Kreander, N., McPhail, K. and Molyneaux, D. (2004), ‘God's fund managers: A critical study of stock market investment practices of the Church of England and UK Methodists’, Accounting, Auditing and Accountability Journal, 17(3): 408-441.
Lease, R.C., Lewellen, W.G. and Schlarbaum G.G. (1976), ‘Market Segmentation:
Evidence on the Individual Investor’, Financial Analysts Journal, 32(5): 53-60. Lewellen, W.G., Lease, R.C. and Schlarbaum G.G. (1977), ‘Patterns of Investment
Strategy and Behavior among Individual Investors’, Journal of Business, 50: 296-333.
Lewis, A. and Mackenzie, C. (2000a), ‘Morals, Money, Ethical Investing and Economic
Psychology’, Human Relations, 53(2): 179-191. Lewis, A., and Mackenzie, C. (2000b), ‘Support for investor activism among UK ethical
investors’, Journal of Business Ethics, 24: 215-222. Markowitz, H. (1959), Portfolio Selection, Yale University Press, New Haven.
Miller, M. and Modigliani, F. (1961), ‘Dividend Policy, Growth and the Valuation of
Shares’, Journal of Business, 34(4): 411-433. Nagy, R.A. and Obenberger, R.W. (1994), ‘Factors influencing Individual Investor
Behaviour’, Financial Analysts Journal, 50(4): 63-68. Odean, T. (1998a), ‘Are Investors Reluctant to Realize Their Losses, Journal of Finance,
LIII: 1775-1798. Odean, T. (1998b), ‘Volume, Volatility, Price and Profit when all Traders are Above
Average’, Journal of Finance, LIII: 1887-1934.
Orlitzky, M., Schmidt, F. and Rynes, S. (2004), 'Corporate Social and Financial Performance: A Meta-Analysis', Organization Studies, 24: 403-441.
Peterson, R.L. (2002), ‘“Buy on the Rumor”: Anticipatory Affect and Investor Behavior’, Journal of Psychology and Financial Markets, 3(4): 218-226.
Rehbein, K., Waddock, S. and Graves, S. (2004), ‘Understanding Shareholder Activism:
Which Corporations are Targeted?’ Business and Society Review 43(3): 239-267 Rothchild, J. (1996) ‘Why I invest with sinners’ Fortune, May13 133(9): 197 [Online]
EBSCOHOST Rosen, B.N. and Sandler, D.M. (1991), ‘Social Issues and Socially Responsive
Investment Issues: A Preliminary Empirical Investigation’, Journal of Consumer Affairs, 25(2): 221-235.
30
Schueth, S. (2003), ‘Socially Responsible Investing in the United States’, Journal of
Business Ethics, 43: 189-194.
Shefrin, H. and Statman, M. (1985), ‘The Disposition to Sell Winners too Early and Ride Losers too Long: Theory and Evidence’, Journal of Finance, XL: 777-792.
Slovic, P. (1995), ‘The Construction of Preference’, American Psychologists, 50(5): 364-
371.
Snyder, H. (1957), ‘How to Take a Loss and Like It’, Financial Analysts Journal, 13(2): 115-116.
Sparkes, R. (2001), ‘Ethical investment: whose ethics, which investment?’ Business
Ethics: A European Review, 10(3): 194-205. Statman, M. (2004a), ‘Normal Investors, Then and Now’, [Online] Social Sciences
Research Network (SSRN), http://papers.ssrn.com/paper.taf?abstract id=603683, accessed 29 November 2004.
Statman, M. (2004b), ‘What do Investors Want?, [Online] Social Sciences Research
Network (SSRN), http://papers.ssrn.com/paper.taf?abstract id=603684, accessed 15 November 2004.
Thaler, R.H. (ed.) (1993), Advances in Behavioral Finance, Russell Sage Foundation,
New York. Tobin, J. (1958), ‘Liquidity Preference as Behavior Towards Risk,’ Review of Economic
Studies, 67, February: 65-86. Tversky, A. and Kahneman, D. (1974), ‘Judgement under Uncertainty: Heuristics and
Biases’, Science, 185: 1124-1131. Warren, W.E., Stevens, R.E. and McConkey, C.W. (1990), ‘Using Demographic and
Lifestyle Analysis to Segment Individual Investors’, Financial Analysts Journal, 46(2): 74-77.
Westpac (2005), ‘Westpac Australian sustainability share fund’ [Online] Available
http://www.westpac.com.au/internet/publish.nsf/Content/CBIVMISR+Westpac+Australian+Sustainability+Share+Fund Accessed 31/01/05
Westpac (2004), ‘BT institutional Australian sustainability share fund’ [Online]
Available http://www.westpac.com.au/internet/publish.nsf/F7F0CE519267BA42CA256B74000BC363/$File/AustSustShareFundSept04.pdf Accessed 31/01/05