Embed Size (px)
Citation preview
www.eprg.group.cam.ac.uk
Why Do More British Consumers Not Switch Energy Suppliers? The Role of Individual Attitudes EPRG Working Paper 1515
Cambridge Working Paper in Economics 1525
Xiaoping He and David Reiner Abstract Consumers’ activities play an important role in determining the extent to which any market may become competitive. Although energy prices and switching tariffs and suppliers become very salient politically over 2013-14 in the UK and the number and share of small suppliers increased dramatically over that period, relatively fewer customers switched suppliers in UK electricity and gas markets despite the potential for financial gains, suggesting that non-price factors may affect switching decisions. Using a unique nation-wide British survey, we investigate the determinants of consumers’ switching behavior in electricity and gas markets, by emphasizing the effects of individual attitudes towards energy issues as well as perception of switching cost and benefit. We find that the complexity of household energy tariffs, consumers’ lack of attention to issue of energy prices, expectation on the costs of switching process and lack of switching experience discourage switching. Political allegiance also appears to play a role as Labour Party voters are more likely to switch. Few demographic factors are found to affect the likelihood of switching. Higher education qualifications are related to increased activity in energy markets. Households paying by direct debit are more likely to switch than those paying by other ways. Financial hardship a household suffers does not matter for switching decisions, suggesting there is no clear relationship between switching and income. We conclude that policies which emphasize simplification of energy tariffs, increasing convenience of switching, improving consumers’ concerns about energy issues, improving consumers’ confidence to exercise switch are likely to increase consumer activity. Keywords Energy markets; switching supplier; household behaviors; logit model JEL Classification C25, D21, Q49, R29
Contact [email protected]; [email protected] Publication September 2015 Financial Support National Natural Science Foundation of China and
Fundamental Research Funds for the Central Universities
1
Why Do More British Consumers Not Switch Energy Suppliers?
The Role of Individual Attitudes*
Xiaoping He 1 David Reiner 2
Abstract: Consumers’ activities play an important role in determining the extent to which any
market may become competitive. Although energy prices and switching tariffs and suppliers
become very salient politically over 2013-14 in the UK and the number and share of small
suppliers increased dramatically over that period, relatively fewer customers switched suppliers in
UK electricity and gas markets despite the potential for financial gains, suggesting that non-price
factors may affect switching decisions. Using a unique nation-wide British survey, we investigate
the determinants of consumers’ switching behavior in electricity and gas markets, by emphasizing
the effects of individual attitudes towards energy issues as well as perception of switching cost and
benefit. We find that the complexity of household energy tariffs, consumers’ lack of attention to
issue of energy prices, expectation on the costs of switching process and lack of switching
experience discourage switching. Political allegiance also appears to play a role as Labour Party
voters are more likely to switch. Few demographic factors are found to affect the likelihood of
switching. Higher education qualifications are related to increased activity in energy markets.
Households paying by direct debit are more likely to switch than those paying by other ways.
Financial hardship a household suffers does not matter for switching decisions, suggesting there is
no clear relationship between switching and income. We conclude that policies which emphasize
simplification of energy tariffs, increasing convenience of switching, improving consumers’
concerns about energy issues, improving consumers’ confidence to exercise switch are likely to
increase consumer activity.
Key words: Energy markets; switching supplier; household behaviors; logit model
JEL: C25, D21, Q49, R29
* XH gratefully acknowledges supports from the National Natural Science Foundation of China (No.71203187; 71573217) and the Fundamental Research Funds for the Central Universities (No. 20720151028; No. 20720151039). 1 Xiaoping He: Collaborative Innovation Center for Energy Economics and Energy Policy, School of Economics, Xiamen University. Email: [email protected]. 2 David Reiner: Energy Policy Research Group, Judge Business School, University of Cambridge. Email: [email protected].
2
I. Introduction
A major aim of deregulation for energy markets is to increase competition among retailers and
thereby enrich consumer choice. The opening to competition into retail supply constitutes one of
the key components of well-functioning competitive markets for electricity (Joskow, 2008).
Although electricity (or gas) is considered a homogenous product, retailers differentiate
themselves through customer loyalty bonuses, green products, level of service and customer
satisfaction, discounts or price caps. In this sense, product differentiation exists among electricity
(or gas) retailers. Since UK energy markets were deregulated in the late 1990s, electricity and gas
suppliers have been permitted to enter any market and compete with the original regional
incumbent. Although initially few new suppliers entered, many regional incumbents used the
opportunity to enter regions in which they had not been incumbent (Flores and Waddams Price,
2013).
Electricity and gas markets in UK are now fully open to new entrants and include provisions
to encourage smaller fringe suppliers. Households have been able to switch suppliers by giving 28
days’ notice, and efforts have been made to increase the speed so that as of 2015, switching is now
possible within 3 days (plus a 14 day ‘cooling off’ period). Customer switching is often cited as
one measure of the extent to which any market may become competitive, although Littlechild
(2000) has argued that the success of retail competition should not be judged by the share of
customers who have switched supplier. The UK energy regulator, Ofgem, has introduced a range
of restrictions on tariffs with the goal of enabling consumers to make better choices for themselves
(Ofgem, 2011; Richards and White, 2014), but these reforms have been criticized for actually
undermining retail competition (Littlechild, 2012; Pollitt and Brophy Haney, 2014). Despite
government interventions to promote consumer activity, consumers often fail to take advantage of
the potential benefits available from changing providers in liberalized energy markets (EC, 2010).
Giulietti et al. (2010) indicate that there remain significant potential benefits to consumers from
searching alternative suppliers. Ofgem (2014a) estimates that the average savings available from
switching from the regional incumbent to the best tariff and provider available is roughly £100 per
year and that this savings has remained roughly constant from 2008 through 2014.
Changing energy suppliers can be one of the easiest ways to save money on gas and electricity
3
bills. British customers now have greater choice of supplier as many electricity and gas retailers
offer a wide range of deals and as the number of suppliers in the market has increased dramatically
in recent years. Fringe suppliers (beyond the traditional ‘Big Six’ firms) only amounted to 0.2% of
residential customers in 2009 rising to 2% in January 2013 and then to 8% in September 2014.
Since January 2013, some 50% of switchers have gone to smaller firms (DECC, 2014).
There are a few different ways for consumers to find out about better energy deals. It is
possible to visit the website of the supplier he or she would like to switch to, or phone them to find
out about their tariffs. A number of internet comparison sites are available for looking into the best
possible deal and take no more than a few minutes to complete. Given all these facts, it is
noteworthy that so many households have still not switched suppliers.
The residential gas market in the UK had been gradually opened since 1996 and retail
competition in the residential electricity sector began in 1999 (Littlechild, 2009). Liberalization is
often seen as a precursor to liberalization undertaken in many other EU member states and beyond
(Jamasb and Pollitt, 2005). By June 2002, some 36% of gas and 34% of electricity domestic
consumers had switched from their incumbent supplier (DTI, 2003). By the end of September
2014, DECC (2014) estimates that 63% of domestic electricity customers in Great Britain were no
longer with their home supplier. This figure does not include most small suppliers and so
underestimates the overall level of switching. Only in North Scotland did more than half of
consumers remain with their regional incumbent.
Still, an assessment carried out by the energy regulator Ofgem, the Office of Fair Trading and
the Competition and Markets Authority (CMA) found that competition in retail energy markets
“may not be achieving good outcomes for all consumers and small businesses” and identified
“weak competition between incumbent suppliers, […] barriers to entry and expansion (including
vertical integration) and weak customer pressure.” (Ofgem, 2014a: 11). This led to Ofgem referring
the GB energy market to the CMA, which carried out its investigation between June 2014 and June
2015.
Our survey was conducted at the end of January 2014 at a time of great volatility in British
energy markets, in terms of policy proposals, media coverage and switching levels. In comparison
with a larger scale survey by Ofgem (2014b), our survey paid more attention to psychological
factors, especially consumer attitudes towards the energy market and the contemporary policy
4
proposals. The UK gas and electricity sector is among the most poorly rated both relative to other
energy sectors in the European Union and across some 30 other domestic service markets in the
UK (EC, 2014, p. 235) and as a result politicians had increasingly sought to highlight their
proposals to reform energy markets. Most notably, at the Labour Party conference in September
2013, Ed Miliband, the Leader of the Opposition, pledged to freeze energy prices for 20 months after
the next UK general election.
There was a notable peak in customer switching in Q4 2013 at the same time as the Miliband
speech and resulting media attention, but switching had actually been down significantly relative to
pre-2011 levels. For example, from 2005 to 2010, quarterly switching of electricity averaged some
1.25 million households per quarter (roughly 4.5%), dropping to just over 1 million households in
2011 and to less than 800,000 in 2012 and the first three quarters of 2013, before rebounding to 1.3
million in Q4 2013 (only slightly above the average level for 2005-2010). Since then, figures for
2014 put switching back at 2012 levels of under 800,000 per quarter (DECC, 2014).
By European standards, choice and switching is relatively high, but trust in utilities and overall
consumer satisfaction are some of the lowest in Europe and have been declining since 2010;
consumer complaints, including complaints to third parties is at or near the top in the EU (EC 2014,
p. 285). Moreover, this cross-national study concludes that regardless of the true level of switching,
many consumers feel they are inactive in the market. According to our survey, in the previous year, 2013, 18% of British gas and electricity
residential consumers switched and an additional 24% shifted suppliers between 2009 and 2012.
According to a larger scale survey (n=8504) conducted at roughly the same time (some two
months later), Ofgem (2014b) found that some 60% of bill payers claim to have switched their
electricity supplier, of whom 14% claim to have switched in the past year, 30% last switched 1 to 5
years ago, and 14% more than 5 years ago. Our figures for switching over 2009-13 are therefore
consistent with the Ofgem (2014b) data.
The active participation of consumers plays a crucial role in enabling competition. While the
proportion of active consumers has been rather limited in many countries where retail competition
has been introduced (Defeuilley, 2009), Littlechild (2009) argues that “where retail competition is
allowed to develop, customers are remarkably disposed to change”. In the UK, there is growing
concern that retail competition has not worked well, despite the energy regulator’s promotion of
5
consumer empowerment and activity (Flores and Waddams Price, 2013). The fact that many
consumers have never switched suppliers is, according to some, evidence of barriers to
competition.
Knowledge of what motivates consumer decisions, and how this varies between consumers, is
essential to design policy interventions that target consumer activity. Consumers’ switching
behaviors prove less simple than they appear. The decision-making processes arise from the
preferences expressed by consumers and the decision protocols they use to make their choice
(Defeuilley, 2009). Here we investigate how consumers’ switching behavior relates to
psychological and economic factors and policy preferences, by using a large survey dataset of
British adults. We seek to discover the key determinants for explaining consumer decision on
switching energy provider, and reveal the role of non-price factors. The most important
contribution of our study lies in examining the impact of consumers’ psychological factors,
especially the role of attitudes towards energy issues. Based on our results obtained, we discuss the
implications for policy.
II. The economics and psychology of switching behavior
A number of factors may explain consumer-switching behaviors. Keaveney’s (1995)
theoretical framework is among the earliest studies of consumers’ switching decisions and
proposed eight causal factors for customers' switching services. However, this framework adopted
the perspective of service firms, neglecting the importance of individual consumers in the decision
making process, such as consumer psychology and demographic characteristics. Bansal and
Taylor (1999) extended Keaveney’s (1995) model and established a service provider switching
model (SPSM) in which five elements for explanation of switching behavior were introduced:
service quality, service satisfaction, switching costs, attitudes towards switching and the influence
of significant others. Given the challenges in defining what is meant by competitiveness of in retail
energy market and the difficulty in assessing what is meant by a well-functioning market, Hviid and
Waddams Price (2014) call for the need “to recognise the potentially positive contribution of
‘behavioural’ consumers in such a market, and to devise appropriate policies for ensuring that the
costs and benefits are distributed appropriately.”
6
Factors influencing switching decisions can be divided into two categories; economic and
psychological (and behavioral) factors. Bansal et al. (2005) summarize the litany of variables
which might influence switching behaviors.
Economic factors represent a cost or benefit to consumers. Each consumer makes a specific
investment when entering into a relationship with an alternative supplier, resulting in switching
costs. For example, search costs (the time taken to search for which retailer offers the best deal and
deciding whether to switch or not), the learning and transaction costs borne when moving to a new
supplier (contracting, negotiating), the cost of substitution between suppliers (such as product
differences between the suppliers, loyalty bonuses, termination fees), and the costs of any new
equipment that needs to be installed. Switching suppliers is likely to occur when consumers perceive the benefits of switching as
exceeding the costs. Conversely, if the costs outweigh the benefits that could be obtained it would
be rational not to switch. Flores and Waddams Price (2013) found the strongest driver of consumer
activity to be the anticipated gains from switching: the more consumers believe they can gain by
switching, the more active they will be. According to McDaniel and Groothuis (2012), there is a
lower bound on required savings needed to encourage households to switch suppliers. According
to a recent survey by Ofgem (2014a), the minimum amount of money the average consumer would
have to save to encourage them to switch gas or electricity suppliers was £94 per year, which is
almost exactly equal to the average savings available. Of course, this does not account for search
costs or uncertainty over prices. A study of deregulated Swedish markets (Gamble et al., 2009)
found the perceived economic benefits from switching were relatively low in the markets for
electricity, landline telecoms, and home insurance. As Littlechild (2000) has stated “the benefits of
switching have to be large enough to induce customers to make the effort to switch.”
Consumer expectations play an important role in switching decisions. Ek and Söderholm
(2008) showed that households anticipating significant economic benefits are more likely to
change suppliers and/or renegotiate contracts. However, a study of the UK gas market by Giulietti
et al. (2005) found that consumer switching decisions appear unrelated to the monetary gains
available from doing so, particularly if consumers expect transitory price differences.
Some costs and benefits related to switching may be instantaneous and/or intuitive to
understand while others may not. Consumers may not always correctly perceive and analyze the
information obtained. Economides et al. (2006) found that in the telephone market in New York
state, 42% of consumers switched to a more expensive supplier, resulting in an average loss of
7
$4.33 per month and according to Wilson and Waddams Price (2010) 20-32% of consumers who
switched electricity suppliers lost an average £14- 35 per year (in addition to any other switching
costs incurred). Giulietti et al. (2005) claim that most customers will tolerate having incumbent prices
substantially above entrant prices, in part because search costs are misperceived as higher than
they actually are and benefits of switching are perceived as lower. Differences in perceptions about
how the market functions, from a competition point-of-view, have a relatively large impact on the
likelihood that an average individual will change electricity supplier (Ek and Söderholm, 2008).
DellaVigna (2009) suggests that biases in consumer’s behaviors are a common feature in many
markets. Wilson and Waddams Price (2010) explained these consumer errors (e.g. choosing a more
expensive supplier) were best described as pure decision error.
Psychological factors may prevent consumers from switching, even when it appears rational to
do so. Customers’ perceptions are often thought to act as behavioral barriers to switching.
Although financial (or economic) factors are relatively straightforward in any analysis of
consumer decisions, psychological (or behavioral) factors, which relate to customer perceptions
and worldviews rather than to the underlying economics of switching, are relatively complex.
Many psychological factors may affect switching decisions, such as consumer preferences (e.g.,
satisfaction with attributes of the incumbent), perceptions of market conditions, social influences
(e.g., peer effects), and so on. We also include attitudes towards policies to provide additional
insight into consumer decision-making,
Studies have found that greater consumer loyalty increases consumer satisfaction and reduces
intent to switch (Szymanski and Henard, 2001). Gamble et al. (2009) concluded that attitudes
towards switching suppliers was more negative in the electricity market than in other markets, and
that such negative attitudes increase with loyalty and information search costs and decreases as
expected economic benefits rise. Sitzia et al. (2012) provided experimental evidence that enabling
easier comparisons may remove some barriers to switch, whereas consumer’s inattention is
essential to increasing switching performance. Similarly, Yang (2014) argued that in spite of low
switching rates in Denmark, many ‘potential switchers’ could be encouraged to switch if
psychological switching barriers were to be removed by better informing consumers about the
consequences of switching and demonstrating the process.
Past studies have shown that some household demographic factors are often found in previous
studies to have significant effects on switching decisions. For example, higher education levels
have been found to increase the level of household activity in the electricity market (Ek and
8
Söderholm, 2008; McDaniel and Groothuis, 2012). Older, poorer people are least comfortable with
the opportunity to switch electricity supplier (Littlechild, 2000). The customers who move
between suppliers in other markets and find these opportunities beneficial are likely to switch in
the electricity market (McDaniel and Groothuis, 2012). Defeuilley (2009) indicate that consumers’
learning process to find out how to compare offers and choose the best supplier should have led to
a decrease of the switching costs, but this learning effect is not functioning as expected. Flores and
Waddams Price (2013) suggest that experience in other markets affects switching behavior only
among certain groups. In some past studies, men tended to be more positive towards switching
than women (Gamble et al., 2009), which might be interpreted as males being somewhat more
likely to favor competition than females (McDaniel and Groothuis, 2012).
Income is usually identified as an important determinant in switching decisions, but previous
work has not reached a consistent verdict. Some studies have found that higher-income households
were more positive towards switching than lower-income households and are more likely to be
active in the market (e.g., Ek and Söderholm, 2008; Gamble et al., 2009). However, if opportunity
costs of searching are considered, the conclusions about the influence of income on switching may
shift. The value of an individual’s time may differ – higher income households will place a greater
value on their time (Waddams Price et al., 2013). Giulietti et al. (2005) found evidence of an
inverted U-shaped relationship between income and search costs, and that more low-income
households were considering switching.
To summarize, there is a growing volume of research which points to individual psychological
factors, in addition to economic and demographic factors, as influencing consumer switching
decisions. By explicitly exploring the influence of economic/demographic characteristics and
psychological motivations on switching decisions from both, we assess how the importance of
attitudes varies depending on these other characteristics. Thus, to gain further knowledge on roles
of attitudinal factors will improve the possibilities for adequate choice of policy instrument and
targeting of relevant groups of consumers.
III. Modelling and empirical data In this section we first describe the survey and then explain the methodology adopted for
modelling switching behavior.
3.1. Survey and data Which factors in the British energy markets are currently reducing the propensity to switch?
To answer this question we investigated actual switching behaviors by administering a specifically
9
designed online survey to identify the characteristics of households that have switched gas and
electricity suppliers.
3.1.1. The survey
The survey was conducted by YouGov plc for the Energy Policy Research Group (EPRG) at
the University of Cambridge between 29th and 30th January 2014. 1942 randomly selected adults
(aged 18 or over) across Great Britain responded, drawn from the YouGov plc panel of more than
185,000 individuals. The survey included questions on a large selection of topics such as politics,
switching behavior, views and beliefs about the residential energy market, in addition to household
socio-economic characteristics.
More specifically, the questionnaire consists of three modules: (i) socio-demographic factors
including age, sex, education, housing conditions, region, voting intention and household
economic data (such as electricity consumption and household income); (ii) attitudes, knowledge
and decisions related to switching electricity/gas suppliers; (iii) beliefs and views related to the
energy market and the economy.
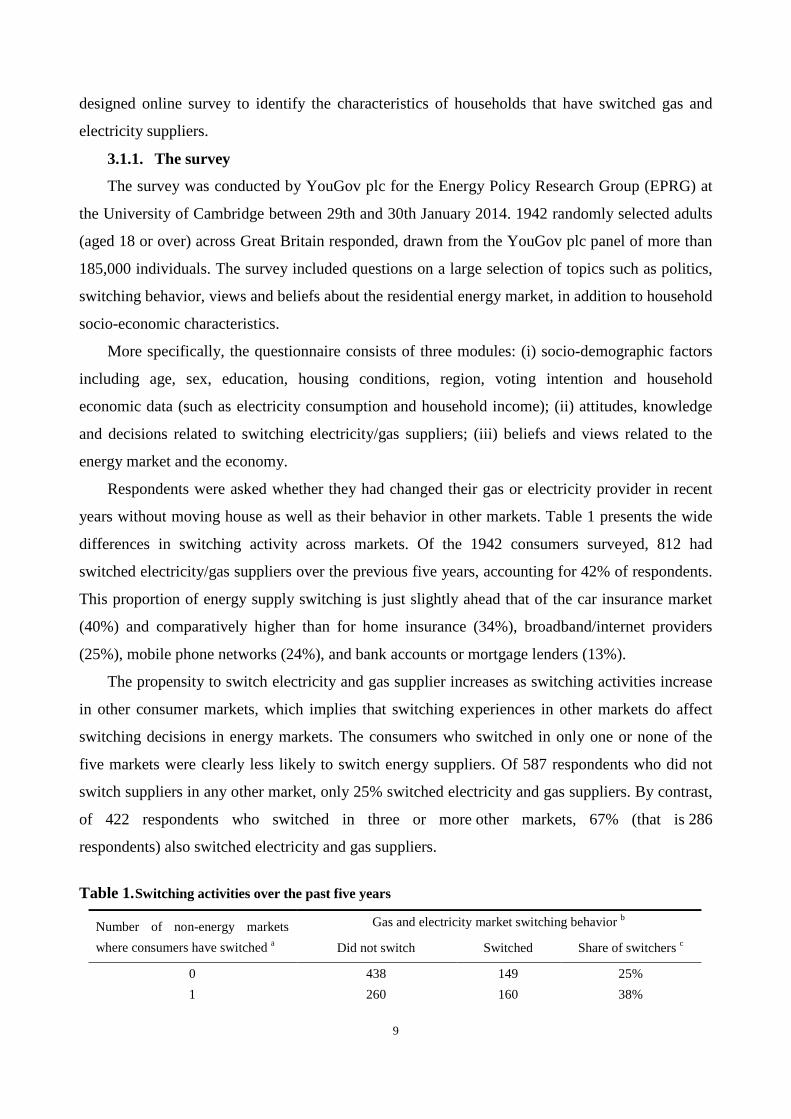
Respondents were asked whether they had changed their gas or electricity provider in recent
years without moving house as well as their behavior in other markets. Table 1 presents the wide
differences in switching activity across markets. Of the 1942 consumers surveyed, 812 had
switched electricity/gas suppliers over the previous five years, accounting for 42% of respondents.
This proportion of energy supply switching is just slightly ahead that of the car insurance market
(40%) and comparatively higher than for home insurance (34%), broadband/internet providers
(25%), mobile phone networks (24%), and bank accounts or mortgage lenders (13%).
The propensity to switch electricity and gas supplier increases as switching activities increase
in other consumer markets, which implies that switching experiences in other markets do affect
switching decisions in energy markets. The consumers who switched in only one or none of the
five markets were clearly less likely to switch energy suppliers. Of 587 respondents who did not
switch suppliers in any other market, only 25% switched electricity and gas suppliers. By contrast,
of 422 respondents who switched in three or more other markets, 67% (that is 286
respondents) also switched electricity and gas suppliers.
Table 1. Switching activities over the past five years
Number of non-energy markets where consumers have switched a
Gas and electricity market switching behavior b
Did not switch Switched Share of switchers c
0 438 149 25% 1 260 160 38%
10
2 156 217 58% 3 94 182 66% 4 38 82 68% 5 4 22 85%
obs. 990 812
Source: calculated based on the survey conducted by YouGov plc for EPRG. a The other five markets in the survey were: car insurance, home insurance, mobile phone, network broadband/internet, and bank
account / mortgage markets. b Of the 1942 observations, 140 answered “don't know” to the question regarding switching behavior in gas and electricity markets,
therefore the total number of observations is 1802. c The last column is the ratio of Column 3 relative to the sum of Column 2 and Column 3.
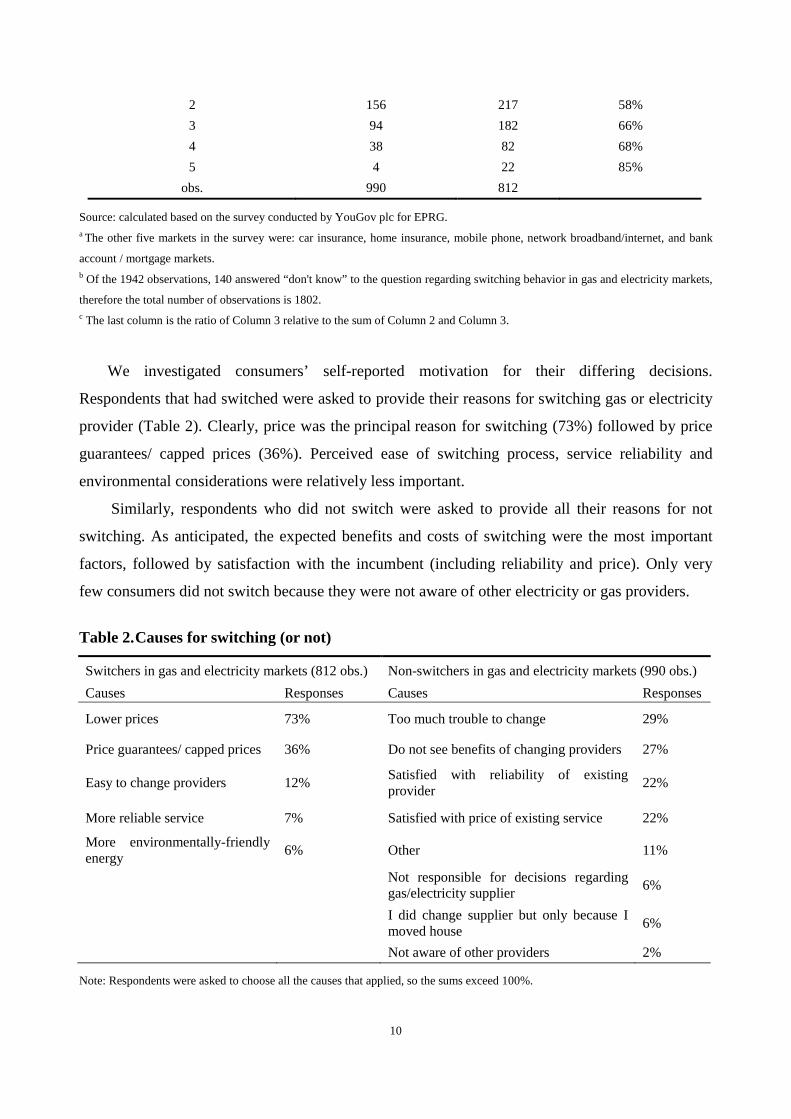
We investigated consumers’ self-reported motivation for their differing decisions.
Respondents that had switched were asked to provide their reasons for switching gas or electricity
provider (Table 2). Clearly, price was the principal reason for switching (73%) followed by price
guarantees/ capped prices (36%). Perceived ease of switching process, service reliability and
environmental considerations were relatively less important.
Similarly, respondents who did not switch were asked to provide all their reasons for not
switching. As anticipated, the expected benefits and costs of switching were the most important
factors, followed by satisfaction with the incumbent (including reliability and price). Only very
few consumers did not switch because they were not aware of other electricity or gas providers.
Table 2. Causes for switching (or not)
Switchers in gas and electricity markets (812 obs.) Non-switchers in gas and electricity markets (990 obs.) Causes Responses Causes Responses
Lower prices 73% Too much trouble to change 29%
Price guarantees/ capped prices 36% Do not see benefits of changing providers 27%
Easy to change providers 12% Satisfied with reliability of existing provider 22%
More reliable service 7% Satisfied with price of existing service 22%
More environmentally-friendly energy 6% Other 11%
Not responsible for decisions regarding gas/electricity supplier 6%
I did change supplier but only because I moved house 6%
Not aware of other providers 2%
Note: Respondents were asked to choose all the causes that applied, so the sums exceed 100%.

11
To better understand whether psychological factors, such as consumer attitudes towards
energy issues, would make any difference, we analyze consumers’ switching decisions
econometrically in a binary choice framework, by directly incorporating individual attitudes.
12
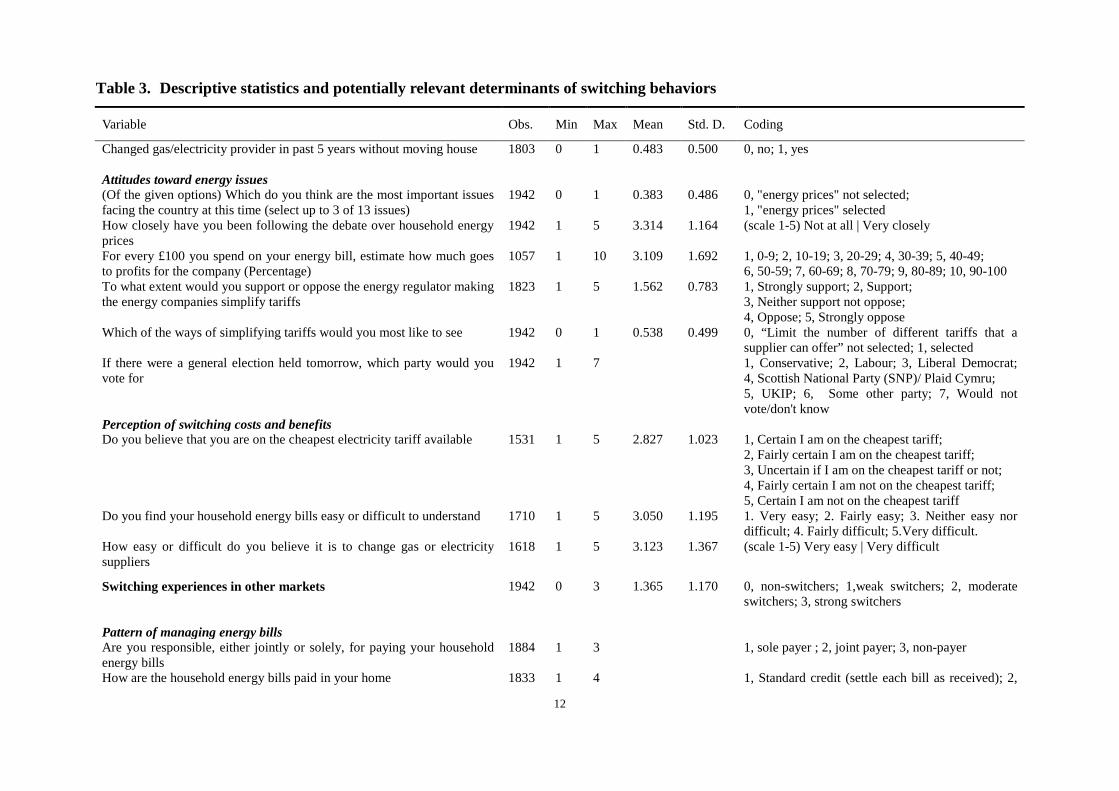
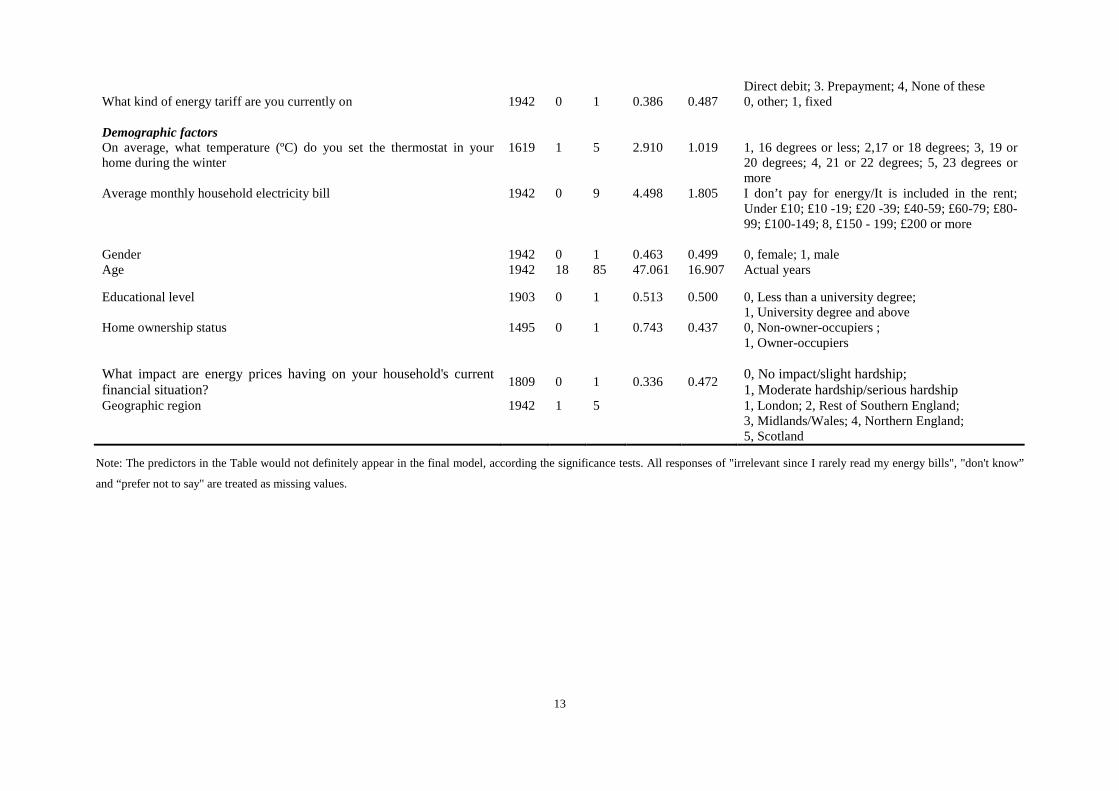
Table 3. Descriptive statistics and potentially relevant determinants of switching behaviors
Variable Obs. Min Max Mean Std. D. Coding
Changed gas/electricity provider in past 5 years without moving house 1803 0 1 0.483 0.500 0, no; 1, yes
Attitudes toward energy issues (Of the given options) Which do you think are the most important issues facing the country at this time (select up to 3 of 13 issues)
1942 0 1 0.383 0.486 0, "energy prices" not selected; 1, "energy prices" selected
How closely have you been following the debate over household energy prices
1942 1 5 3.314 1.164 (scale 1-5) Not at all | Very closely
For every £100 you spend on your energy bill, estimate how much goes to profits for the company (Percentage)
1057 1 10 3.109 1.692 1, 0-9; 2, 10-19; 3, 20-29; 4, 30-39; 5, 40-49; 6, 50-59; 7, 60-69; 8, 70-79; 9, 80-89; 10, 90-100
To what extent would you support or oppose the energy regulator making the energy companies simplify tariffs
1823 1 5 1.562 0.783 1, Strongly support; 2, Support; 3, Neither support not oppose; 4, Oppose; 5, Strongly oppose
Which of the ways of simplifying tariffs would you most like to see 1942 0 1 0.538 0.499 0, “Limit the number of different tariffs that a supplier can offer” not selected; 1, selected
If there were a general election held tomorrow, which party would you vote for
1942 1 7 1, Conservative; 2, Labour; 3, Liberal Democrat; 4, Scottish National Party (SNP)/ Plaid Cymru; 5, UKIP; 6, Some other party; 7, Would not vote/don't know
Perception of switching costs and benefits Do you believe that you are on the cheapest electricity tariff available 1531 1 5 2.827 1.023 1, Certain I am on the cheapest tariff;
2, Fairly certain I am on the cheapest tariff; 3, Uncertain if I am on the cheapest tariff or not; 4, Fairly certain I am not on the cheapest tariff; 5, Certain I am not on the cheapest tariff
Do you find your household energy bills easy or difficult to understand 1710 1 5 3.050 1.195 1. Very easy; 2. Fairly easy; 3. Neither easy nor difficult; 4. Fairly difficult; 5.Very difficult.
How easy or difficult do you believe it is to change gas or electricity suppliers
1618 1 5 3.123 1.367 (scale 1-5) Very easy | Very difficult
Switching experiences in other markets 1942 0 3 1.365 1.170 0, non-switchers; 1,weak switchers; 2, moderate switchers; 3, strong switchers
Pattern of managing energy bills Are you responsible, either jointly or solely, for paying your household energy bills
1884 1 3 1, sole payer ; 2, joint payer; 3, non-payer
How are the household energy bills paid in your home 1833 1 4 1, Standard credit (settle each bill as received); 2,
13
Direct debit; 3. Prepayment; 4, None of these What kind of energy tariff are you currently on 1942 0 1 0.386 0.487 0, other; 1, fixed Demographic factors On average, what temperature (ºC) do you set the thermostat in your home during the winter
1619 1 5 2.910 1.019 1, 16 degrees or less; 2,17 or 18 degrees; 3, 19 or 20 degrees; 4, 21 or 22 degrees; 5, 23 degrees or more
Average monthly household electricity bill 1942 0 9 4.498 1.805 I don’t pay for energy/It is included in the rent; Under £10; £10 -19; £20 -39; £40-59; £60-79; £80- 99; £100-149; 8, £150 - 199; £200 or more
Gender 1942 0 1 0.463 0.499 0, female; 1, male Age 1942 18 85 47.061 16.907 Actual years
Educational level 1903 0 1 0.513 0.500 0, Less than a university degree; 1, University degree and above
Home ownership status 1495 0 1 0.743 0.437 0, Non-owner-occupiers ; 1, Owner-occupiers
What impact are energy prices having on your household's current financial situation? 1809 0 1 0.336 0.472 0, No impact/slight hardship;
1, Moderate hardship/serious hardship Geographic region 1942 1 5 1, London; 2, Rest of Southern England;
3, Midlands/Wales; 4, Northern England; 5, Scotland
Note: The predictors in the Table would not definitely appear in the final model, according the significance tests. All responses of "irrelevant since I rarely read my energy bills", "don't know”
and “prefer not to say" are treated as missing values.
14
3.1.2. Potentially relevant determinants
The sample was specifically surveyed with regard to their attitudes towards a range of
energy-related subjects, including the saliency of energy issues, views on energy policies,
satisfaction with the services provided by their providers, perceived ease of switching and so on.
Table 3 provides the summary and the descriptive statistics for various statements or questions
considered to be potentially relevant for explaining households’ switching decisions in the
markets.
The nine questions used to capture consumers’ psychology of switching are broadly
grouped into two categories: (a) questions regarding attitudes towards energy issues; (b) questions
regarding perceptions of the costs and benefits of switching. Percent variance accounted for in
principal component analyses and reliability coefficients suggest that it is impossible to construct
any reliable indicator that aggregates across the different influences. Therefore, all nine questions
are included in the model independently.
Meanwhile, a few important factors that represent households’ pattern of managing their
energy bills (e.g., paying and sharing bills), switching activities in other industrial markets, and
demographic characteristics are considered, as control variables.
3.1.2.1. Attitudes and perceptions
To capture the importance of energy issues in consumers’ awareness, two indicators were
respectively generated from the statements: a) Which do you think are the most important issues
facing the country at this time, and; b) how closely, if at all, have you been following the debate
over household energy prices? For question a, respondents were asked to choose up to three
options from thirteen options in terms of specific economic, social or political topics. The indicator
for the question is valued as a 1, if "energy prices" was selected, otherwise 0. Responses to
question b seek to capture the attention consumers pay to household energy prices. The
corresponding indicator enters our model as an ordered variable with a scale from 1 (not at all) to 5
(very closely).
To reflect attitudes towards energy companies, we use the question, “for every £100 you spend
on your energy bill, estimate how much goes to company profits”, which we divide into £10
increments (equivalent to percentage of bills profits). The attitudinal variable thereby enters as an
ordered variable, to reflect households’ views on market power of energy companies.
Two questions are taken into account to capture attitudes towards energy policies: (a) “To
what extent would you support or oppose the energy regulator making the energy companies
simplify their tariffs”, and; (b) “Which of the ways of simplifying tariffs would you most like to
see”. For statement a, respondents were asked to mark their opinion by selecting a number on a

15
scale from 1 (strongly support) to 5 (strongly oppose). For the statement b, respondents were asked
to select among ten options: if the option “Limit the number of different tariffs that a supplier can
offer” was selected, the indicator is valued with 1, otherwise 0.
The last attitudinal variable reflects party affiliation or political inclination, and was generated
from the question “If there were a general election held tomorrow, which party you would vote
for?” The results show that Labour Party voters are most popular with a support rate of 32.3%,
followed by the Conservative Party with a rate of 25.1%. We introduce an indicator of vote
intention to capture the impact of political intention, and the variable enters as a categorical
variable, with the Labour voters as the reference category.
As for perception of switching cost and benefit, we mainly investigate the potential gains from
moving to a new supplier and perceived cost of switching process. Three questions touch on the
benefits and costs of switching: (1) “Do you believe that you are on the cheapest electricity tariff
available”, which seeks to understand whether consumers expect to see energy bill savings from
changing energy providers; (2) “How easy or difficult do you believe it is to change gas or
electricity suppliers”, reflecting expected transaction costs associated with searching, learning and
dealing; and (3) “Do you find your household energy bills easy or difficult to understand,”
reflecting the capability to appreciate the potential for savings on one’s energy bill. For each
statement, the respondents were asked to provide their opinion from 1 (very easy) to 5 (very
difficult). All three indicators enter separately as ordered variables.
3.1.2.2. Control variables
As discussed earlier, the likelihood of switching energy suppliers appears to be related to
switching in other markets; therefore a variable of experience is used to distinguish between
non-switchers and switchers, in terms of activities in other industrial markets. Observations of the
sample therefore fall into four categories according to the experience, and the variable enters as
categorical, being assigned with 0 for non-switchers in other markets, 1 for weak switchers who
only switched providers in one of the other markets, 2 for moderate switchers who switched in two
markets and 3 for strong switchers who switched in three or more markets.
The impacts that patterns of energy bill payment are controlled by three variables, indicating
the way bills are shared (“are you responsible, either jointly or solely, for paying your household
energy bills”), paid (“how are the household energy bills paid in your home”) and the type of
energy tariff (“what kind of energy tariff are you currently on”). For the last statement, respondents
were asked to choose all that applied among ten given options, roughly 35%, the largest
percentage of responses chose the option “Fixed”. In our analysis, if a “Fixed” tariff is selected as
one of the options, the indicator is given the value 1, otherwise 0.
16
Demographic variables that might affect household switching behaviors include: thermostat
setting during winter, household electricity bill, household income, gender, age, educational
qualification, home ownership status and geographic region. These variables are binary, ordered or
categorical, except that the variable of age enters in terms of actual years.
The income indicator requires further exposition. In our survey, respondents reported their
gross monthly income by decile. As is common in most public surveys, a relatively high
percentage (29%) of households refused to provide an answer. Of those who did answer, the top
three deciles are poorly represented, which may reflect either a bias in the underlying sample or in
the willingness of wealthier respondents to respond to the income question. Therefore, we use a
binary “hardship” indicator as a proxy for income, as individual’s subjective feelings of hardship
can indirectly reflect the income level; moreover, it would result in a much larger number of valid
observations. The hardship question asked respondents “what impact, if any, are energy prices
having on your household's current financial situation?” The indicator is assigned a 0 for a
response of either “No impact” or “slight hardship”, and a 1 for either “moderate hardship” or
“serious hardship”. 1
A few indicators have been changed from the format used in the survey in terms of number of
items and response scales. For education level, there were 18 categories offered in the
questionnaire, going into great detail in terms of specific qualification, degree or certification. To
simplify the analysis, a binary dummy is used for education and assigned a 0 for respondents with
less than a university degree and 1 for those with a university degree and above. Similarly, housing
ownership status is simplified to two categories, owner-occupiers and non-owner-occupiers, rather
than the initial five categories.
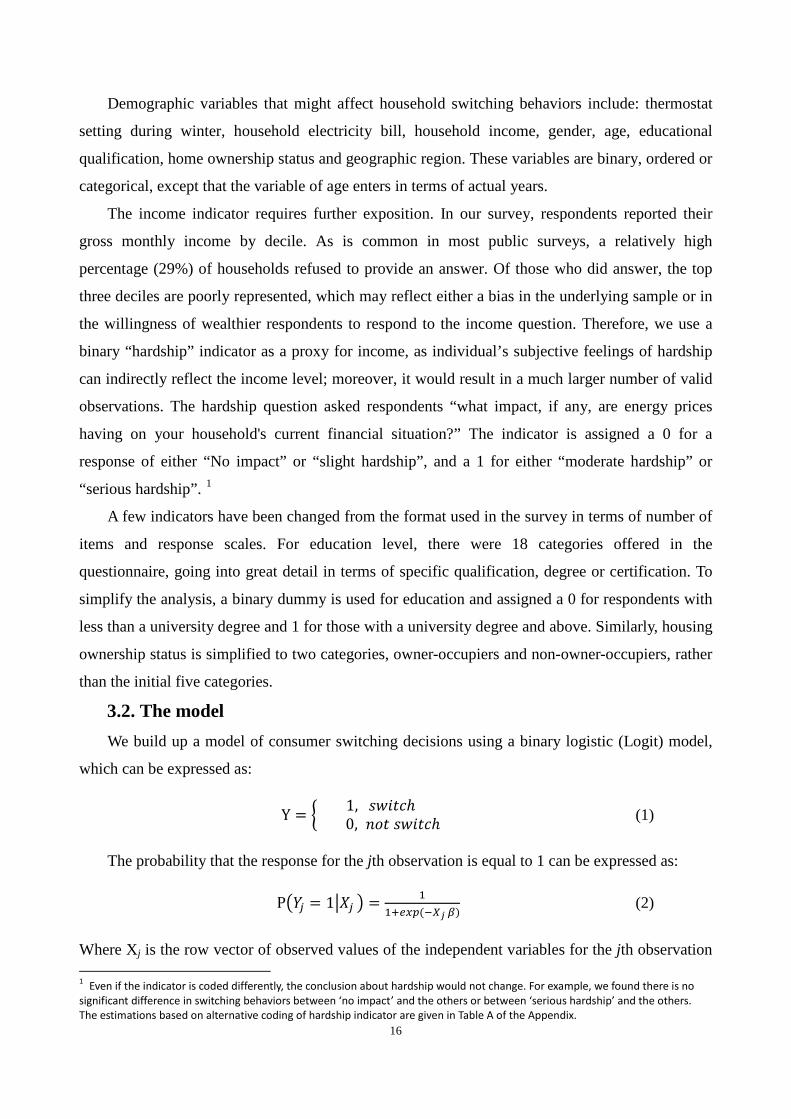
3.2. The model We build up a model of consumer switching decisions using a binary logistic (Logit) model,
which can be expressed as:
Y = � 1, 𝑠𝑠𝑠𝑠𝑠𝑠𝑠𝑠𝑠𝑠ℎ 0, 𝑛𝑛𝑛𝑛𝑠𝑠 𝑠𝑠𝑠𝑠𝑠𝑠𝑠𝑠𝑠𝑠ℎ (1)
The probability that the response for the jth observation is equal to 1 can be expressed as:
P�𝑌𝑌𝑗𝑗 = 1�𝑋𝑋𝑗𝑗 � = 11+𝑒𝑒𝑒𝑒𝑒𝑒(−𝑋𝑋𝑗𝑗 𝛽𝛽)
(2)
Where Xj is the row vector of observed values of the independent variables for the jth observation 1 Even if the indicator is coded differently, the conclusion about hardship would not change. For example, we found there is no significant difference in switching behaviors between ‘no impact’ and the others or between ‘serious hardship’ and the others. The estimations based on alternative coding of hardship indicator are given in Table A of the Appendix.
17
and β is the coefficient vector for the outcome Y=1. The outcome Y=0 is treated as the “base
outcome”. The parameter estimates of the Logit therefore express differences compared to the base
outcome. The Logit is intrinsically linear and can be re-expressed in Log odds form:
𝑙𝑙𝑛𝑛 � P�𝑌𝑌𝑗𝑗=1�𝑋𝑋𝑗𝑗 �1−𝑃𝑃�𝑌𝑌𝑗𝑗=1�𝑋𝑋𝑗𝑗 �
� = 𝑋𝑋𝑗𝑗 𝛽𝛽 (3)
Where the log odds of Y=1 is expressed in the Logit as a linear function of the independent
variables, and P(𝑌𝑌=1|𝑋𝑋)1−𝑃𝑃(𝑌𝑌=1|𝑋𝑋) is called the odds of event X.
IV. Results and discussions In this section we present the results of the econometric analyses. We consider a binary
outcome (yes or no) of switching behavior in energy markets over the past five years (i.e., “have
you changed your gas or electricity provider in recent years without moving house?”).
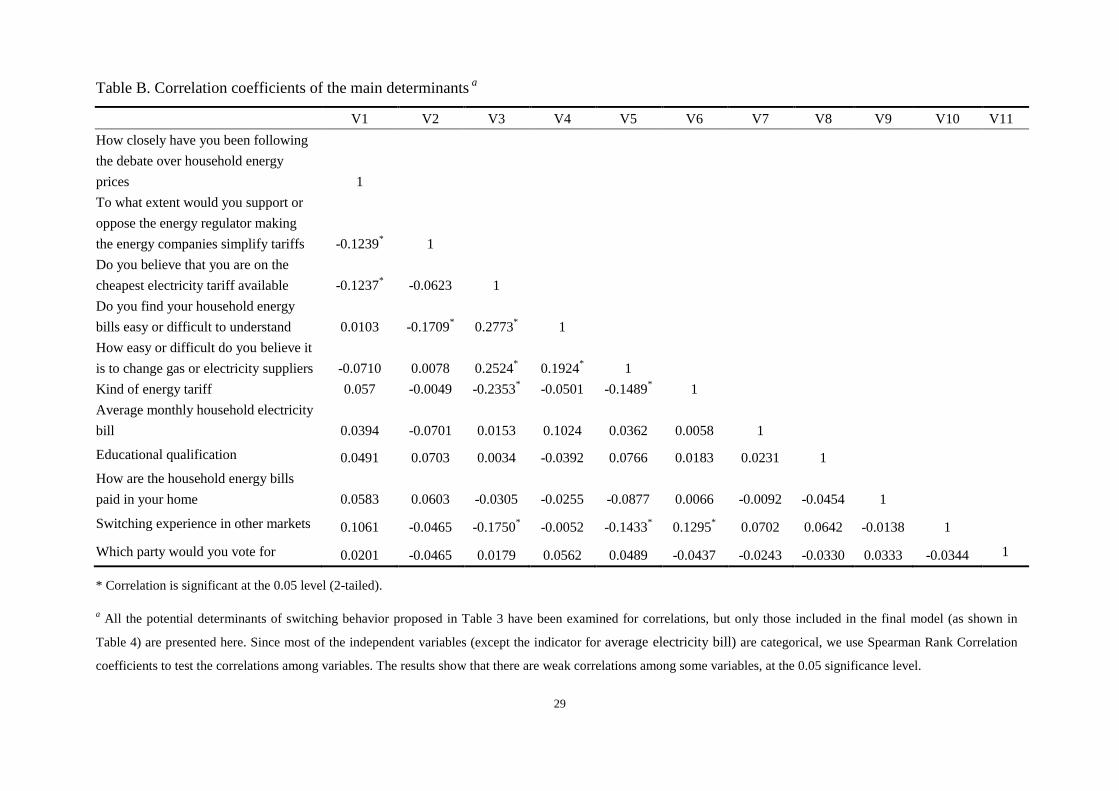
Correlation analysis and eigenvalue analysis are used for collinearity diagnostics. The
correlation coefficients among independent variables are largely insignificant, while those
significant coefficients only show weak correlation (the coefficient is smaller than 0.3), implying a
low probability of multicollinearity. The correlation matrix for the group of main determinants is
given in Table B of the Appendix. Meanwhile, the eigenvector from the independent matrix
satisfies 0<ki<10, where ki denotes the Condition Index of the ith eigenvalue. These results provide
support for our assumption that there is no collinearity among the independent variables.
Given that a few independent variables are categorical, the findings should be interpreted as
the effect of the given category relative to the reference category. For all questions used in the
analysis, responses of “don’t know” or “prefer not to say” are treated throughout as missing
values.
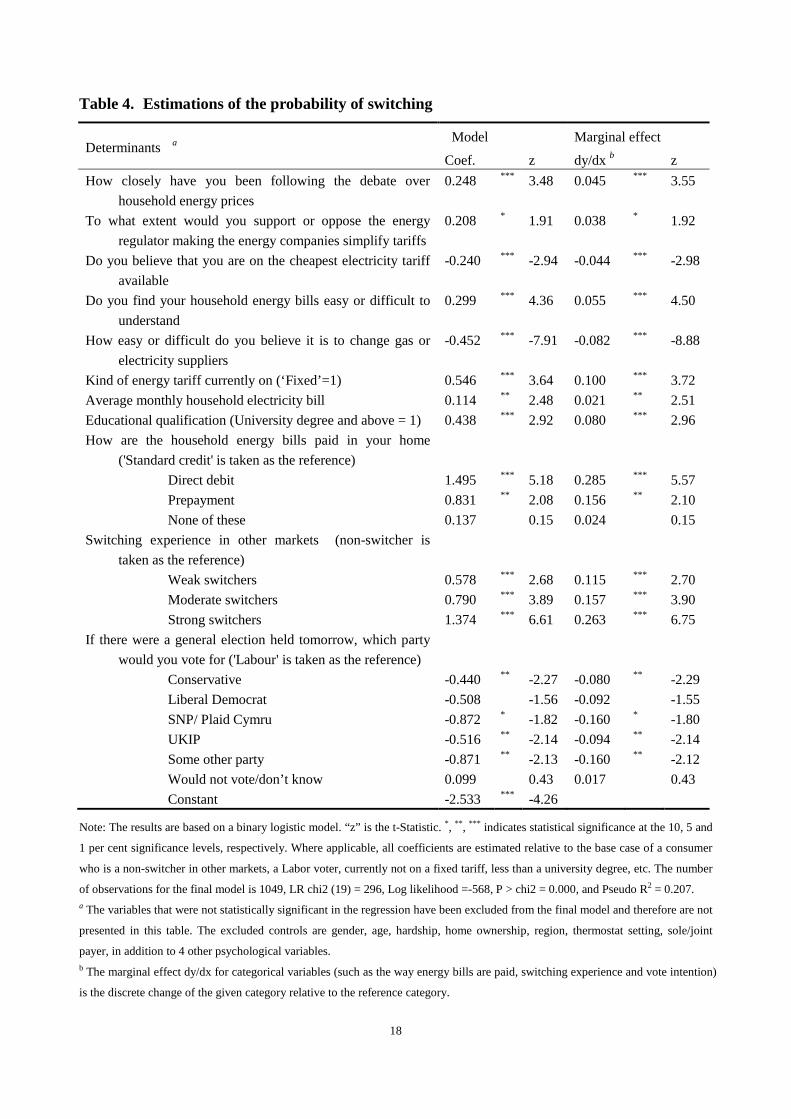
4.1. Estimation of the model The final estimation results are presented in Table 4. There are two parts in the table, labeled
“Model” and “Marginal effects” respectively. The potential determinants that were assumed
relevant to switching behavior but not statistically significant in the regression have been excluded
from the final model. Based on the log-likelihood measures, the null hypothesis for the model that
all the parameters equal zero can be rejected, at the 1% significance level.
18
Table 4. Estimations of the probability of switching
Determinants a Model Marginal effect
Coef. z dy/dx b z How closely have you been following the debate over
household energy prices 0.248 *** 3.48 0.045 *** 3.55
To what extent would you support or oppose the energy regulator making the energy companies simplify tariffs
0.208 * 1.91 0.038 * 1.92
Do you believe that you are on the cheapest electricity tariff available
-0.240 *** -2.94 -0.044 *** -2.98
Do you find your household energy bills easy or difficult to understand
0.299 *** 4.36 0.055 *** 4.50
How easy or difficult do you believe it is to change gas or electricity suppliers
-0.452 *** -7.91 -0.082 *** -8.88
Kind of energy tariff currently on (‘Fixed’=1) 0.546 *** 3.64 0.100 *** 3.72 Average monthly household electricity bill 0.114 ** 2.48 0.021 ** 2.51 Educational qualification (University degree and above = 1) 0.438 *** 2.92 0.080 *** 2.96 How are the household energy bills paid in your home
('Standard credit' is taken as the reference)
Direct debit 1.495 *** 5.18 0.285 *** 5.57 Prepayment 0.831 ** 2.08 0.156 ** 2.10 None of these 0.137 0.15 0.024 0.15
Switching experience in other markets (non-switcher is taken as the reference)
Weak switchers 0.578 *** 2.68 0.115 *** 2.70 Moderate switchers 0.790 *** 3.89 0.157 *** 3.90 Strong switchers 1.374 *** 6.61 0.263 *** 6.75
If there were a general election held tomorrow, which party would you vote for ('Labour' is taken as the reference)
Conservative -0.440 ** -2.27 -0.080 ** -2.29 Liberal Democrat -0.508 -1.56 -0.092 -1.55 SNP/ Plaid Cymru -0.872 * -1.82 -0.160 * -1.80 UKIP -0.516 ** -2.14 -0.094 ** -2.14 Some other party -0.871 ** -2.13 -0.160 ** -2.12 Would not vote/don’t know 0.099 0.43 0.017 0.43 Constant -2.533 *** -4.26
Note: The results are based on a binary logistic model. “z” is the t-Statistic. *, **, *** indicates statistical significance at the 10, 5 and
1 per cent significance levels, respectively. Where applicable, all coefficients are estimated relative to the base case of a consumer
who is a non-switcher in other markets, a Labor voter, currently not on a fixed tariff, less than a university degree, etc. The number
of observations for the final model is 1049, LR chi2 (19) = 296, Log likelihood =-568, P > chi2 = 0.000, and Pseudo R2 = 0.207. a The variables that were not statistically significant in the regression have been excluded from the final model and therefore are not
presented in this table. The excluded controls are gender, age, hardship, home ownership, region, thermostat setting, sole/joint
payer, in addition to 4 other psychological variables. b The marginal effect dy/dx for categorical variables (such as the way energy bills are paid, switching experience and vote intention)
is the discrete change of the given category relative to the reference category.
19
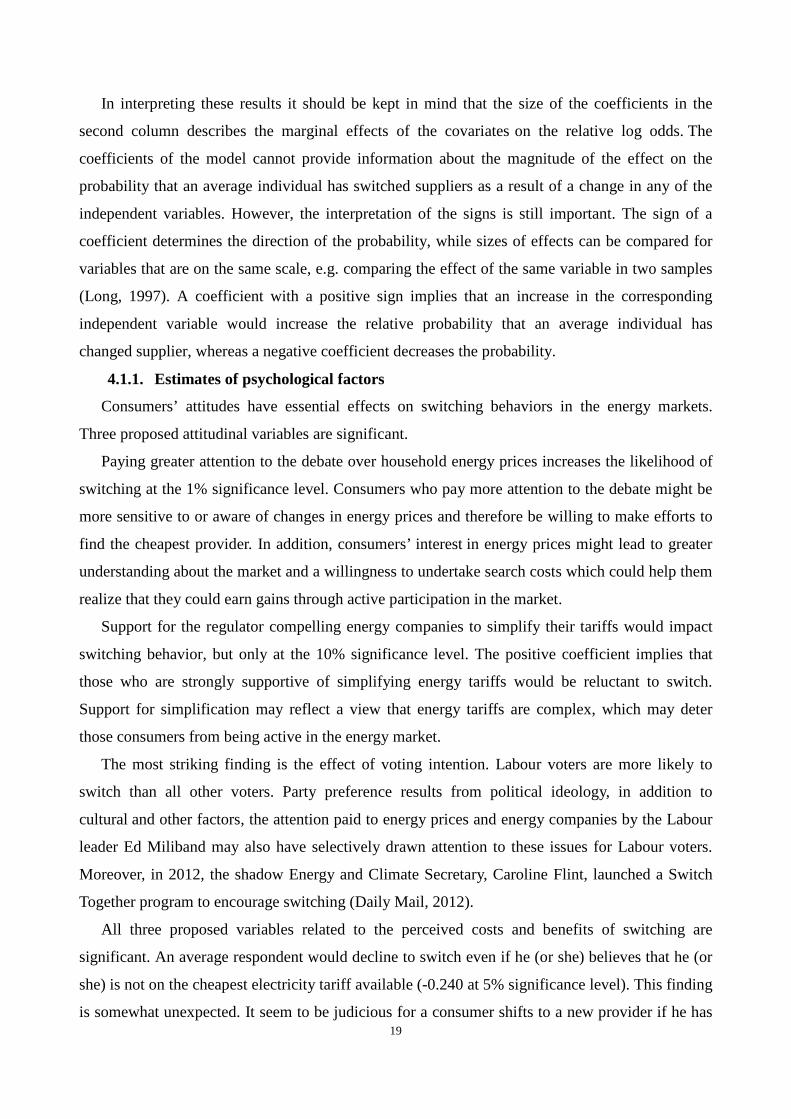
In interpreting these results it should be kept in mind that the size of the coefficients in the
second column describes the marginal effects of the covariates on the relative log odds. The
coefficients of the model cannot provide information about the magnitude of the effect on the
probability that an average individual has switched suppliers as a result of a change in any of the
independent variables. However, the interpretation of the signs is still important. The sign of a
coefficient determines the direction of the probability, while sizes of effects can be compared for
variables that are on the same scale, e.g. comparing the effect of the same variable in two samples
(Long, 1997). A coefficient with a positive sign implies that an increase in the corresponding
independent variable would increase the relative probability that an average individual has
changed supplier, whereas a negative coefficient decreases the probability.
4.1.1. Estimates of psychological factors
Consumers’ attitudes have essential effects on switching behaviors in the energy markets.
Three proposed attitudinal variables are significant.
Paying greater attention to the debate over household energy prices increases the likelihood of
switching at the 1% significance level. Consumers who pay more attention to the debate might be
more sensitive to or aware of changes in energy prices and therefore be willing to make efforts to
find the cheapest provider. In addition, consumers’ interest in energy prices might lead to greater
understanding about the market and a willingness to undertake search costs which could help them
realize that they could earn gains through active participation in the market.
Support for the regulator compelling energy companies to simplify their tariffs would impact
switching behavior, but only at the 10% significance level. The positive coefficient implies that
those who are strongly supportive of simplifying energy tariffs would be reluctant to switch.
Support for simplification may reflect a view that energy tariffs are complex, which may deter
those consumers from being active in the energy market.
The most striking finding is the effect of voting intention. Labour voters are more likely to
switch than all other voters. Party preference results from political ideology, in addition to
cultural and other factors, the attention paid to energy prices and energy companies by the Labour
leader Ed Miliband may also have selectively drawn attention to these issues for Labour voters.
Moreover, in 2012, the shadow Energy and Climate Secretary, Caroline Flint, launched a Switch
Together program to encourage switching (Daily Mail, 2012).
All three proposed variables related to the perceived costs and benefits of switching are
significant. An average respondent would decline to switch even if he (or she) believes that he (or
she) is not on the cheapest electricity tariff available (-0.240 at 5% significance level). This finding
is somewhat unexpected. It seem to be judicious for a consumer shifts to a new provider if he has

20
sensed the current provider does not offer him the cheapest tariff. However, our finding is
consistent with Giulietti et al. (2005) that most customers will tolerate having incumbent prices
above entrant prices, and with Defeuilley (2009) that inactive consumers do not respond to price
signals. To an extent, this finding confirms that non-price factors play a dominant role in switching
behavior.
The more difficult an average individual finds it to understand his or her household energy bills,
the more likely he or she is to switch. If consumers find it difficult to understand their energy bills,
their ability to appreciate the potential gains from switching may be restricted. They may find it
difficult to assess the gains from switching, but it is difficult to know whether this would lead them
to overestimate or underestimate the potential benefits. Further, these difficulties may lead to
consumer dissatisfaction with existing services or even mistrust of the current provider, thereby
encouraging them to switch. The coefficient is 0.299 at the 1% significance level, suggesting that
those who have trouble understanding their energy bills are more likely to switch.
As one might expect, those who perceive it to be difficult to change energy suppliers are less
likely to switch (significant coefficient of - 0.452). A perception of costs of switching process is an
essential obstacle. The costs may take the form of the time and effort needed for searching,
learning and dealing to get the best provider. These costs are often considered to be reflected by
the value of an individual’s time and increase with income (Giulietti et al., 2005; Waddams Price
et al., 2013). However, our study provides evidence that these costs are not simply a function of
income since the impact of the perceived costs of switching process is still significant even if
income has already been controlled by a ‘hardship’ variable. 1
As expected, experience of switching in other markets significantly affects consumers’
switching behaviors in the electricity and gas markets, the estimates of the coefficient for all
categories of switchers examined are significant and positive. Compared to those with no
switching experience in other markets, the probability of experienced switchers to change energy
providers is clearly higher. This builds on the finding by McDaniel and Groothuis (2012) that
those who switched their suppliers in other markets would be more likely to switch supplier in
energy markets.
4.1.2. Estimates of control variables
Patterns of payment for energy bills significantly affect switching behavior. Households on
fixed tariffs are more likely to switch. These households will already have needed to shift to a
fixed tariff and so it is not surprising that they will be more aggressive in their switching behavior.
1 We tried various indicators to measure the impact of income in regression to see whether finding about income would change. The results show the conclusion that income is insignificant is robust (see Table A in the Appendix for details).
21
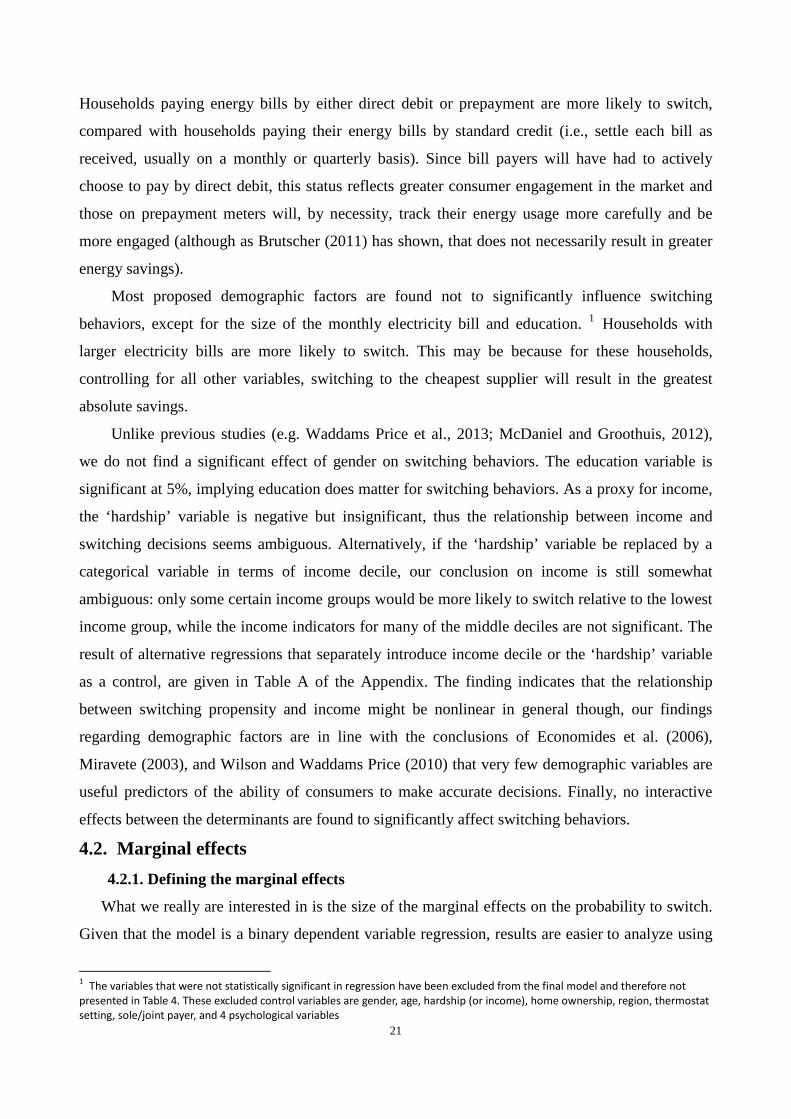
Households paying energy bills by either direct debit or prepayment are more likely to switch,
compared with households paying their energy bills by standard credit (i.e., settle each bill as
received, usually on a monthly or quarterly basis). Since bill payers will have had to actively
choose to pay by direct debit, this status reflects greater consumer engagement in the market and
those on prepayment meters will, by necessity, track their energy usage more carefully and be
more engaged (although as Brutscher (2011) has shown, that does not necessarily result in greater
energy savings).
Most proposed demographic factors are found not to significantly influence switching
behaviors, except for the size of the monthly electricity bill and education. 1 Households with
larger electricity bills are more likely to switch. This may be because for these households,
controlling for all other variables, switching to the cheapest supplier will result in the greatest
absolute savings.
Unlike previous studies (e.g. Waddams Price et al., 2013; McDaniel and Groothuis, 2012),
we do not find a significant effect of gender on switching behaviors. The education variable is
significant at 5%, implying education does matter for switching behaviors. As a proxy for income,
the ‘hardship’ variable is negative but insignificant, thus the relationship between income and
switching decisions seems ambiguous. Alternatively, if the ‘hardship’ variable be replaced by a
categorical variable in terms of income decile, our conclusion on income is still somewhat
ambiguous: only some certain income groups would be more likely to switch relative to the lowest
income group, while the income indicators for many of the middle deciles are not significant. The
result of alternative regressions that separately introduce income decile or the ‘hardship’ variable
as a control, are given in Table A of the Appendix. The finding indicates that the relationship
between switching propensity and income might be nonlinear in general though, our findings
regarding demographic factors are in line with the conclusions of Economides et al. (2006),
Miravete (2003), and Wilson and Waddams Price (2010) that very few demographic variables are
useful predictors of the ability of consumers to make accurate decisions. Finally, no interactive
effects between the determinants are found to significantly affect switching behaviors.
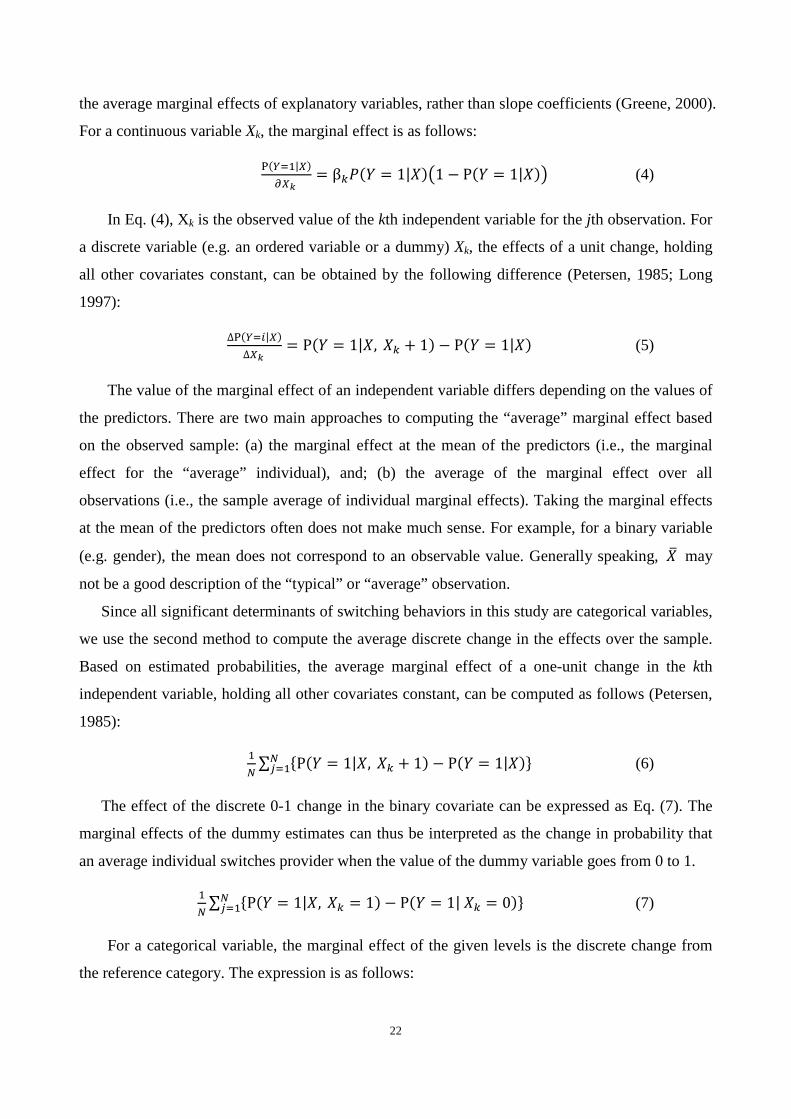
4.2. Marginal effects 4.2.1. Defining the marginal effects
What we really are interested in is the size of the marginal effects on the probability to switch.
Given that the model is a binary dependent variable regression, results are easier to analyze using
1 The variables that were not statistically significant in regression have been excluded from the final model and therefore not presented in Table 4. These excluded control variables are gender, age, hardship (or income), home ownership, region, thermostat setting, sole/joint payer, and 4 psychological variables
22
the average marginal effects of explanatory variables, rather than slope coefficients (Greene, 2000).
For a continuous variable Xk, the marginal effect is as follows:
P(𝑌𝑌=1|𝑋𝑋)𝜕𝜕𝑋𝑋𝑘𝑘
= β𝑘𝑘𝑃𝑃(𝑌𝑌 = 1|𝑋𝑋)�1 − P(𝑌𝑌 = 1|𝑋𝑋)� (4)
In Eq. (4), Xk is the observed value of the kth independent variable for the jth observation. For
a discrete variable (e.g. an ordered variable or a dummy) Xk, the effects of a unit change, holding
all other covariates constant, can be obtained by the following difference (Petersen, 1985; Long
1997):
∆P(𝑌𝑌=𝑖𝑖|𝑋𝑋)∆𝑋𝑋𝑘𝑘
= P(𝑌𝑌 = 1|𝑋𝑋, 𝑋𝑋𝑘𝑘 + 1) − P(𝑌𝑌 = 1|𝑋𝑋) (5)
The value of the marginal effect of an independent variable differs depending on the values of
the predictors. There are two main approaches to computing the “average” marginal effect based
on the observed sample: (a) the marginal effect at the mean of the predictors (i.e., the marginal
effect for the “average” individual), and; (b) the average of the marginal effect over all
observations (i.e., the sample average of individual marginal effects). Taking the marginal effects
at the mean of the predictors often does not make much sense. For example, for a binary variable
(e.g. gender), the mean does not correspond to an observable value. Generally speaking, 𝑋𝑋� may
not be a good description of the “typical” or “average” observation.
Since all significant determinants of switching behaviors in this study are categorical variables,
we use the second method to compute the average discrete change in the effects over the sample.
Based on estimated probabilities, the average marginal effect of a one-unit change in the kth
independent variable, holding all other covariates constant, can be computed as follows (Petersen,
1985):
1𝑁𝑁∑ {P(𝑌𝑌 = 1|𝑋𝑋, 𝑋𝑋𝑘𝑘 + 1) − P(𝑌𝑌 = 1|𝑋𝑋)}𝑁𝑁𝑗𝑗=1 (6)
The effect of the discrete 0-1 change in the binary covariate can be expressed as Eq. (7). The
marginal effects of the dummy estimates can thus be interpreted as the change in probability that
an average individual switches provider when the value of the dummy variable goes from 0 to 1.
1𝑁𝑁∑ {P(𝑌𝑌 = 1|𝑋𝑋, 𝑋𝑋𝑘𝑘 = 1) − P(𝑌𝑌 = 1| 𝑋𝑋𝑘𝑘 = 0)}𝑁𝑁𝑗𝑗=1 (7)
For a categorical variable, the marginal effect of the given levels is the discrete change from
the reference category. The expression is as follows:
23
1𝑁𝑁∑ �P�𝑌𝑌 = 1�𝑋𝑋, 𝑋𝑋𝑘𝑘 = 𝑋𝑋𝑘𝑘𝑔𝑔𝑖𝑖𝑔𝑔𝑒𝑒𝑔𝑔� − P�𝑌𝑌 = 1� 𝑋𝑋𝑘𝑘 = 𝑋𝑋𝑘𝑘𝑟𝑟𝑒𝑒𝑟𝑟��𝑁𝑁𝑗𝑗=1 (8)
4.2.2. Results of the marginal effects
The marginal effects of the covariates on the probability of switching are displayed on
the right-hand side of Table 4. The first eight variables in the table can be interpreted as the
marginal change in the probability that the average individual switched energy supplier, given the
independent variable increased by one unit. For the following three categorical variables, the
marginal effects measure the difference in the probability of switching between category j and the
reference category.
In terms of size, political party preference is the most powerful attitudinal predictor of
switching behavior. The average marginal effects differ by voting preference, ranging from -0.160
to -0.080, which implies that a shift from the Labour Party could cause a decrease in the propensity
to switch energy provider. Specifically, when an average consumer switches from supporting the
Labour Party to supporting the Conservative Party, the probability of changing energy provider
would decrease by 8%. A shift from the Labour Party to the nationalist parties (SNP or Plaid
Cymru) would reduce the probability of switching still further by 16%, a large change but only at a
significance level of 10%. Notably, the marginal effect of a change in voting intention from the
Labour Party to the UK Independence Party (UKIP) or to some other party, respectively being -0.094
and -0.160, are both significant at the 5% level.
Switching experiences in other markets have significant marginal impacts on the likelihood of
changing energy providers. Compared to a non-switcher in other markets, the probability of
changing energy providers would increase by 11.5 % for a weak switcher, 15.7% for a moderate
switcher, and 26.3% for a strong switcher. The confidence and capability of consumers to switch
energy providers can be increased by previous active participation in other markets. Our sample
shows a negative correlation between switching experience and perceived difficulty in switching
energy suppliers, although the correlation coefficient is not significant (-0.127). Our findings
confirm the conclusion of Giulietti et al. (2005) that previous switching in other markets such as
telecoms, car and household insurance has a cumulative effect on switching suppliers.
4.3. Group switching probability We are also interested in the probability of switching, as well as any differences across groups.
To explore these questions, the probability of switching energy provider for an “average” group of
given level of switching experience, of particular voting intention, and using particular payment of
energy bills is separately computed, by holding all other variables to their median values. The
results, displayed in Table 5, will help to further explore the key barriers to switching.
24
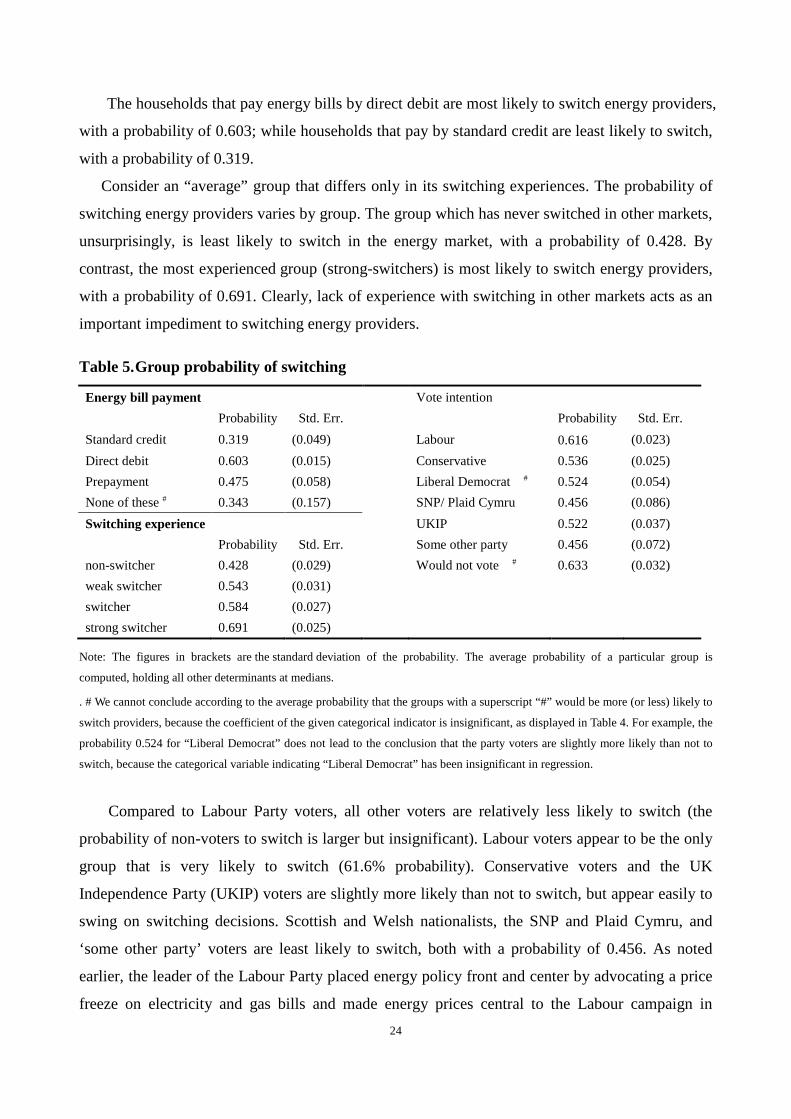
The households that pay energy bills by direct debit are most likely to switch energy providers,
with a probability of 0.603; while households that pay by standard credit are least likely to switch,
with a probability of 0.319.
Consider an “average” group that differs only in its switching experiences. The probability of
switching energy providers varies by group. The group which has never switched in other markets,
unsurprisingly, is least likely to switch in the energy market, with a probability of 0.428. By
contrast, the most experienced group (strong-switchers) is most likely to switch energy providers,
with a probability of 0.691. Clearly, lack of experience with switching in other markets acts as an
important impediment to switching energy providers.
Table 5. Group probability of switching
Energy bill payment Vote intention
Probability Std. Err.
Probability Std. Err.
Standard credit 0.319 (0.049)
Labour 0.616 (0.023) Direct debit 0.603 (0.015)
Conservative 0.536 (0.025)
Prepayment 0.475 (0.058)
Liberal Democrat # 0.524 (0.054) None of these # 0.343 (0.157)
SNP/ Plaid Cymru 0.456 (0.086)
Switching experience
UKIP 0.522 (0.037)
Probability Std. Err.
Some other party 0.456 (0.072)
non-switcher 0.428 (0.029)
Would not vote # 0.633 (0.032) weak switcher 0.543 (0.031)
switcher 0.584 (0.027)
strong switcher 0.691 (0.025)
Note: The figures in brackets are the standard deviation of the probability. The average probability of a particular group is
computed, holding all other determinants at medians.
. # We cannot conclude according to the average probability that the groups with a superscript “#” would be more (or less) likely to
switch providers, because the coefficient of the given categorical indicator is insignificant, as displayed in Table 4. For example, the
probability 0.524 for “Liberal Democrat” does not lead to the conclusion that the party voters are slightly more likely than not to
switch, because the categorical variable indicating “Liberal Democrat” has been insignificant in regression.
Compared to Labour Party voters, all other voters are relatively less likely to switch (the
probability of non-voters to switch is larger but insignificant). Labour voters appear to be the only
group that is very likely to switch (61.6% probability). Conservative voters and the UK
Independence Party (UKIP) voters are slightly more likely than not to switch, but appear easily to
swing on switching decisions. Scottish and Welsh nationalists, the SNP and Plaid Cymru, and
‘some other party’ voters are least likely to switch, both with a probability of 0.456. As noted
earlier, the leader of the Labour Party placed energy policy front and center by advocating a price
freeze on electricity and gas bills and made energy prices central to the Labour campaign in
25
advance of the May 2015 U.K. general election.
V. Conclusions and implications Non-price factors may prevent consumers from switching even it appears rational.
Understanding and addressing these factors are challenging, because most of them are
psychological factors that are not based on price as they respond to consumer’s subjective attitudes.
In this article, what motivates consumers to switch energy supplier has been analyzed
econometrically within a binary choice framework, by using a unique nation-wide British data set
incorporating consumers’ psychological factors, specifically, consumers’ attitudes towards energy
issues and perception of costs and benefits of switch.
We find that part of the variations in consumers’ decisions on switching energy providers can
be interpreted by psychological factors. The relevant results prove that consumers’ lack of
attention to the issue of energy prices and the complexity of household energy tariffs deter them
from being active in the market. Of all the political parties, Labour voters would be the most likely
to switch, which is perhaps related to the attention paid to the issue of energy bills by the Labour
Party at the time of our survey.
The perceived costs and benefits of switching are associated with three key variables: (i)
whether consumers believe they are currently on the cheapest tariff, (ii) whether they have
difficulty in understanding their energy bill; and (iii) the perceived difficulty of switching.
Perceived complexity of energy tariffs could prevent consumers from realizing the potential gains
of switching, while the cost of the switching process itself will also act as a deterrent. Improving
the convenience of switching and making it easier to understand both the costs and benefits of
switching is essential for removing some of the obstacles to switching.
We find that the probability of switching energy providers increases with experience of
switching in other markets, which confirms the findings of previous studies. The way households
choose to pay their energy bills affects switching behavior. Those paying by standard credit are
most unlikely to switch whereas those paying by direct debit are most likely to switch.
The results of the study differ from the results of some other studies insofar as age and gender
tend to be irrelevant to switching behaviors. Education is found to have significant but relatively
minor effect on switching behaviors. The earlier finding that higher education qualification
increases the level of household activity in the electricity market is confirmed by this study. A
binary hardship indicator, as a proxy for income does not impact switching behaviors, and the only
significant role of income is that the highest deciles tend to switch more and lowest deciles switch

26
less.
Energy policy-makers need to identify different motivations if they are to develop effective
instruments to stimulate greater consumer activity in electricity and gas markets. One approach
would be to focus on those consumers that are already switching in other markets. Finding ways to
increase the saliency of energy issues may also encourage market participation. Policy can also
learn from the role of consumers’ expectations of switching costs which suggests some
supplementary measures would be needed to increase switching convenience, such as reducing
switching time, improving consumers’ trust for providers by more transparent and simpler energy
bills. Finally, our results show differences in switching propensity among groups with different
experiences of switching, voting intentions and payment patterns. Inexperienced households,
standard credit users and non-Labour voters are least active in energy markets. Policy makers
should be targeting those inactive groups, for example, by encouraging greater awareness of the
benefits of switching across many different markets.
27
Appendix
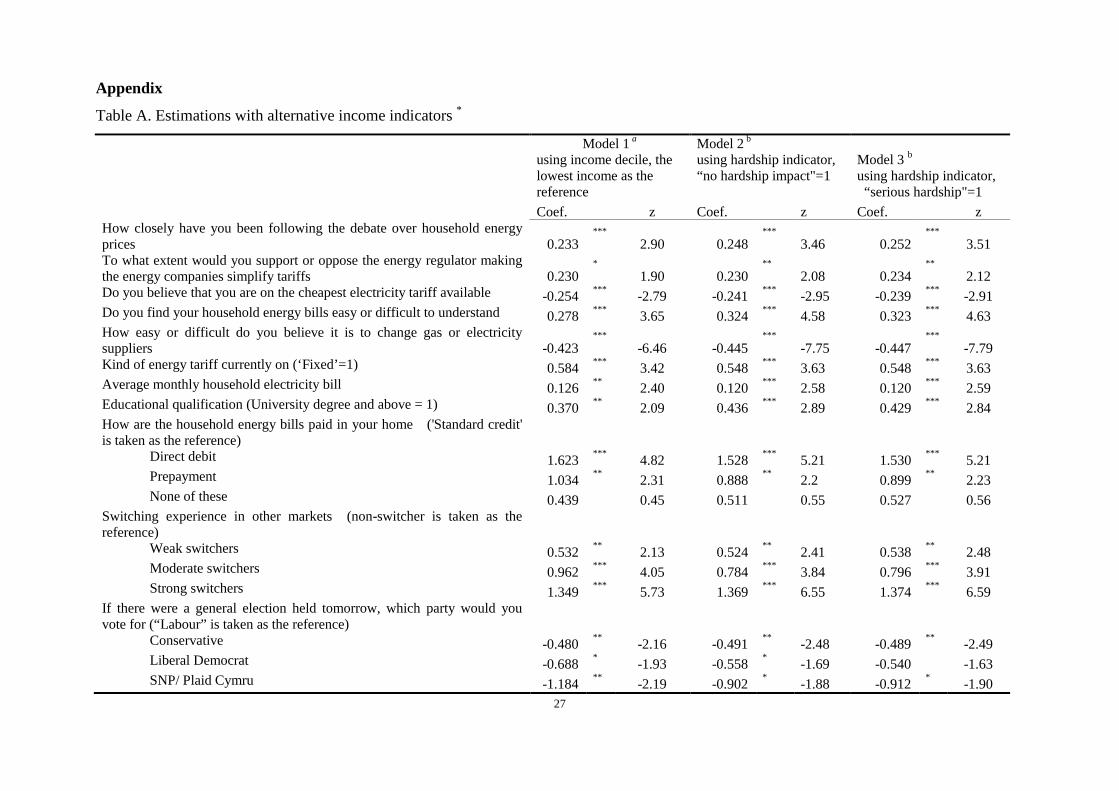
Table A. Estimations with alternative income indicators *
Model 1 a using income decile, the lowest income as the reference
Model 2 b
using hardship indicator, “no hardship impact"=1
Model 3 b using hardship indicator, “serious hardship"=1
Coef. z Coef. z Coef. z How closely have you been following the debate over household energy prices 0.233
*** 2.90 0.248 *** 3.46 0.252
*** 3.51 To what extent would you support or oppose the energy regulator making the energy companies simplify tariffs 0.230
* 1.90 0.230 ** 2.08 0.234
** 2.12 Do you believe that you are on the cheapest electricity tariff available -0.254 *** -2.79 -0.241 *** -2.95 -0.239 *** -2.91 Do you find your household energy bills easy or difficult to understand 0.278 *** 3.65 0.324 *** 4.58 0.323 *** 4.63 How easy or difficult do you believe it is to change gas or electricity suppliers -0.423
*** -6.46 -0.445 *** -7.75 -0.447
*** -7.79 Kind of energy tariff currently on (‘Fixed’=1) 0.584 *** 3.42 0.548 *** 3.63 0.548 *** 3.63 Average monthly household electricity bill 0.126 ** 2.40 0.120 *** 2.58 0.120 *** 2.59 Educational qualification (University degree and above = 1) 0.370 ** 2.09 0.436 *** 2.89 0.429 *** 2.84 How are the household energy bills paid in your home ('Standard credit' is taken as the reference)
Direct debit 1.623 *** 4.82 1.528 *** 5.21 1.530 *** 5.21 Prepayment 1.034 ** 2.31 0.888 ** 2.2 0.899 ** 2.23 None of these 0.439
0.45 0.511
0.55 0.527
0.56
Switching experience in other markets (non-switcher is taken as the reference)
Weak switchers 0.532 ** 2.13 0.524 ** 2.41 0.538 ** 2.48 Moderate switchers 0.962 *** 4.05 0.784 *** 3.84 0.796 *** 3.91 Strong switchers 1.349 *** 5.73 1.369 *** 6.55 1.374 *** 6.59
If there were a general election held tomorrow, which party would you vote for (“Labour” is taken as the reference)
Conservative -0.480 ** -2.16 -0.491 ** -2.48 -0.489 ** -2.49 Liberal Democrat -0.688 * -1.93 -0.558 * -1.69 -0.540 -1.63 SNP/ Plaid Cymru -1.184 ** -2.19 -0.902 * -1.88 -0.912 * -1.90

28
UKIP -0.585 ** -2.17 -0.537 ** -2.22 -0.528 ** -2.19 Some other party -1.040 ** -2.26 -0.882 ** -2.15 -0.902 ** -2.20 Would not vote 0.039 0.15 0.092 0.40 0.079 0.34 Income decile (or Hardship) Income decile Hardship
Hardship
0.960 *** 2.65 0.114 0.65 -0.296 -1.07 0.981 *** 2.73
0.452 1.27
0.973 *** 2.84
0.163 0.43
0.438 1.20
0.531 1.32
1.594 *** 3.29
1.478 ** 2.39
We tried various income indicators in regression to see whether finding about income variable would change because of using alternative indicator or coding method. The
results in the above table show that impact of income on switching behaviors might be non-linear (by Model 1) and insignificant (by Model 2 and 3). The results are based on
a binary logistic model. “z” is the t-Statistic. *, **, *** indicates statistical significance at the 10, 5 and 1 per cent significance levels, respectively. Estimates of the
constant in regression equation have been omitted. a Model 1 includes a categorical indicator in terms of income decile to control the effect of income on switching, where the variable is coding from 1 to 10, with the lowest
income group being assigned with 1 and taken as the reference category. b Model 2 and Model 3 use a hardship indicator as a proxy for income, and the indicator is based on the hardship question “what impact, if any, are energy prices having on
your household's current financial situation?” There were 4 types of responses , including “No Impact”, “Slight hardship” ,”Moderate hardship” and “Serious hardship”. The
two models are different in hardship indicator coding: for Model 2, the indicator is valued with 1for a response of “No impact”, otherwise 0; for Model 3, it is assigned a 1 for
a response of “serious hardship”, otherwise 0.
29
Table B. Correlation coefficients of the main determinants a
V1 V2 V3 V4 V5 V6 V7 V8 V9 V10 V11 How closely have you been following the debate over household energy prices 1
To what extent would you support or oppose the energy regulator making the energy companies simplify tariffs -0.1239* 1
Do you believe that you are on the cheapest electricity tariff available -0.1237* -0.0623 1
Do you find your household energy bills easy or difficult to understand 0.0103 -0.1709* 0.2773* 1
How easy or difficult do you believe it is to change gas or electricity suppliers -0.0710 0.0078 0.2524* 0.1924* 1
Kind of energy tariff 0.057 -0.0049 -0.2353* -0.0501 -0.1489* 1
Average monthly household electricity bill 0.0394 -0.0701 0.0153 0.1024 0.0362 0.0058 1
Educational qualification 0.0491 0.0703 0.0034 -0.0392 0.0766 0.0183 0.0231 1
How are the household energy bills paid in your home 0.0583 0.0603 -0.0305 -0.0255 -0.0877 0.0066 -0.0092 -0.0454 1
Switching experience in other markets 0.1061 -0.0465 -0.1750* -0.0052 -0.1433* 0.1295* 0.0702 0.0642 -0.0138 1 Which party would you vote for 0.0201 -0.0465 0.0179 0.0562 0.0489 -0.0437 -0.0243 -0.0330 0.0333 -0.0344 1
* Correlation is significant at the 0.05 level (2-tailed).
a All the potential determinants of switching behavior proposed in Table 3 have been examined for correlations, but only those included in the final model (as shown in
Table 4) are presented here. Since most of the independent variables (except the indicator for average electricity bill) are categorical, we use Spearman Rank Correlation
coefficients to test the correlations among variables. The results show that there are weak correlations among some variables, at the 0.05 significance level.
30
References [1] Bansal, H.S. and S.F. Taylor, 1999. "The Service-Provider Switching Model (SPSM): A Model of
Consumer Switching Behavior in the Services Industry?” Journal of Service Research 2: 200-218.
[2] Bansal, H. S., S.F. Taylor and Y. St. James, 2005. “‘Migrating’ to new service providers: toward a
unifying framework of consumers’ switching behaviors”, Journal of the Academy of Marketing
Science, 33 (1): 96-115.
[3] Brutscher, P.-N. 2011. “Payment Matters? - An Exploratory Study into Pre-Payment Electricity
Metering”, Electricity Policy Research Group, University of Cambridge, EPRG Working Paper 1108.
[4] DellaVigna, S. 2009. “Psychology and Economics: Evidence from the Field.” Journal of Economic Literature, 47(2): 315-72.
[5] Daily Mail, 2012. Miliband promises to get tough on gas and electricity firms as households face soaring
bills this winter, Daily Mail, 29 September.
http://www.dailymail.co.uk/news/article-2210379/Miliband-promises-tough-gas-electricity-firms-hous
eholds-face-soaring-bills-winter.html
[6] DECC, 2014. Quarterly domestic energy switching statistics: Transfer statistics in the domestic gas and
electricity markets in Great Britain, 18 December. London: Department for Energy and Climate
Change
https://www.gov.uk/government/statistical-data-sets/quarterly-domestic-energy-switching-statistics
[7] DTI, 2003. Energy White Paper: Our energy future – creating a low carbon economy. The Stationery
Office, Department of Trade and Industry. London: Department of Trade and Industry,
[8] Defeuilley, C. 2009. Retail competition in electricity markets. Energy Policy, 37(2), 377-386.
[9] Economides N., Seim K. and V.B. Viard, 2006. “Quantifying the Benefits of Entry into Local Phone
Service”, NET Institute Working Paper, August.
[10] Ek, K. and P. Söderholm, 2008. "Households' switching behavior between electricity suppliers in
Sweden," Utilities Policy, 16(4): 254-261.
[11] European Commission (EC), 2010. “The functioning of the retail electricity markets for consumers in
the European Union”, Commission Staff Working Paper.
[12] European Commission (EC), 2014. “Progress towards completing the Internal Energy Market.”
Commission Staff Working Document, Country Reports, SWD (2014) 311 final. Luxembourg:
Publications Office of the European Union.
[13] Flores, M., Waddams Price, C., 2013. “Consumer behavior in the British retail electricity market”.
CCP Working Paper 13-10, October, Centre for Competition Policy, Norwich, UK: University of East
Anglia.
[14] Gamble, A., E.A. Juliusson, and T. Gärling, 2009. “Consumer attitudes towards switching supplier in
three deregulated markets.” Journal of Behavioral and Experimental Economics (formerly The Journal
of Socio-Economics), vol. 38(5): 814-819.
31
[15] Greene, W. H., 2000. Econometric Analysis, 4th ed. p.851-852. Englewood Cliffs, N.J.: Prentice–Hall.
[16] Giulietti, M., C. Waddams Price, and M. Waterson, 2005. “Consumer choice and competition policy: a
study of UK energy markets.” Economic Journal, 115 (506): 949-968.
[17] Giulietti, M., Waddams-Price, C., Waterson, C., 2010. "Pricing behaviour under competition in the UK
electricity supply industry," Oxford Economic Papers, Oxford University Press, 62(3), 478-503.
[18] Hviid, M., and C. Waddams Price, 2014. “Well-Functioning Markets in Retail Energy”, European Competition Journal, 10(1): 167-179,
[19] Jamasb, T. and M.G. Pollitt, 2005. “Electricity market reform in the European Union: review of progress toward liberalization and integration.” The Energy Journal, 11-41.
[20] Joskow P. L., 2008. Lessons learned from electricity market liberalization. The Energy Journal, 29(2): 9-42.
[21] Keaveney, S.M., 1995. “Customer switching behavior in service industries: an exploratory study.”
Journal of Marketing 59, pp.71–82.
[22] Littlechild, S.C., 2000. "Why We Need Electricity Retailers: A Reply to Joskow on Wholesale Spot
Price pass-through," Cambridge Working Papers in Economics 0008, Faculty of Economics,
University of Cambridge.
[23] Littlechild, S.C., 2009. “Retail competition in electricity markets — expectations, outcomes and
economics,” Energy Policy, 37(2): 759-763
[24] Littlechild, S.C., 2012. Ofgem and the Philosopher’s Stone, London: Institute of Economic Affairs, 12
November.
[25] Long, J.S., 1997. Regression Models for Categorical and Limited Dependent Variables. Thousand
Oaks, CA: Sage
[26] McDaniel, T.M. and P.A. Groothuis, 2012. “Retail competition in electricity supply—Survey results in
North Carolina”. Energy Policy, 48: 315–321.
[27] Miravete, E.J., 2003. “Choosing the wrong calling plan? Ignorance and learning,” American Economic
Review, 93 (1): 297-310.
[28] Ofgem, 2011. The Retail Market Review: Domestic Proposals, London: Office of Gas and Electricity
Markets.
[29] Ofgem, 2014a. State of the Market Assessment 2014. Office of Fair Trading, Competition and Markets
Authority and Office of Gas and Electricity Markets.
https://www.ofgem.gov.uk/ofgem-publications/86804/assessmentdocumentpublished.pdf
[30] Ofgem, 2014b. Retail Market Review 2014 Baseline Consumer Survey report by TNS BMRB –
dataset, London: Office of Gas and Electricity Markets.
https://www.ofgem.gov.uk/ofgem-publications/89748/rmrbaseliningsurveydatatables2014.pdf
[31] Petersen, T., 1985. "A Comment in Presenting Results from Logit and Probit Models.” American
Sociological Review 50(1): 130-131.
[32] Pollitt, M.G., and A. Brophy Haney, 2014. “Dismantling a competitive retail electricity market:
residential market reforms in Great Britain.” The Electricity Journal 27 (1): 66-73.
32
[33] Richards, P. and E. White, 2014. “Simplifying Energy Tariffs”, House of Commons Library, Note SNSC-6440.
[34] Sitzia, S., J. Zheng, D. Zizzo, 2012. “Complexity and smart nudges with inattentive consumers”, CCP
Working Papers 12-13. Norwich, UK: University of East Anglia.
[35] Szymanski, D.M., D.H. Henard, 2001. “Customer satisfaction: a meta-analysis of the empirical
evidence”. Journal of the Academy of Marketing Science, 29: 16–35.
[36] Waddams Price, C., 2005. "The effect of liberalizing UK retail energy markets on consumers." Oxford Review of Economic Policy 21 (1): 128-144.
[37] Waddams Price, C., C. Webster and M. Zhu, 2013. “Searching and switching: empirical estimates of
consumer behavior in regulated markets.” CCP Working Paper 13-11 , ESRC Centre for Competition
Policy, University of East Anglia
[38] Wilson, C.M. and C. Waddams Price, 2010. “Do consumers switch to the best supplier?” Oxford
Economic Papers 62 (4): 647-668, doi: 10.1093/oep/gpq006
[39] Yang, Y., 2014."Understanding household switching behavior in the retail electricity market," Energy
Policy, 69(C): 406-414.