Embed Size (px)
Citation preview

Why Are You Not Getting Fiber?
2
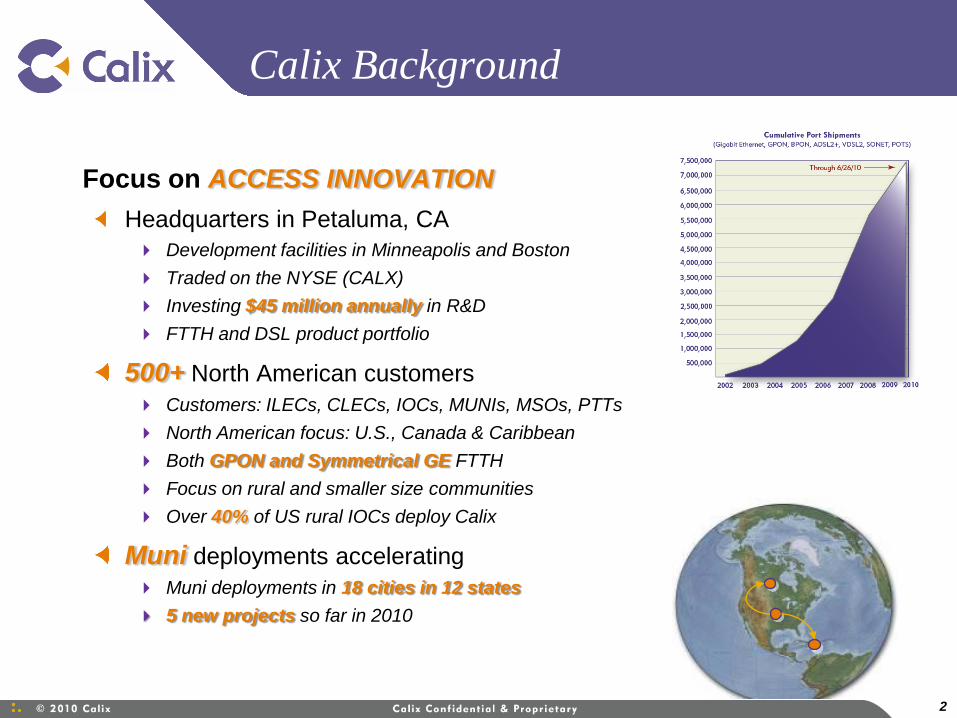
Calix Background
Focus on ACCESS INNOVATION
Headquarters in Petaluma, CA
Development facilities in Minneapolis and Boston
Traded on the NYSE (CALX)
Investing $45 million annually in R&D
FTTH and DSL product portfolio
500+ North American customers
Customers: ILECs, CLECs, IOCs, MUNIs, MSOs, PTTs
North American focus: U.S., Canada & Caribbean
Both GPON and Symmetrical GE FTTH
Focus on rural and smaller size communities
Over 40% of US rural IOCs deploy Calix
Muni deployments accelerating
Muni deployments in 18 cities in 12 states
5 new projects so far in 2010

3
The Bandwidth Challenge
Proliferation of consumer devices, HDTV and internet based services will continue to drive consumer bandwidth demand
Home networks operating at less than100 Mbps today will migrate to Gigabit Ethernet (GE)
Average access bandwidths will grow to 100 Mbps and beyond
The National Broadband Plan goal: 100 million homes with 100 Mbps
100 million homes is 76% of all US housing units
Aggregation Point
WiFi
Video and Internet Based Services
Driving Broadband Bandwidth
Access Network
4
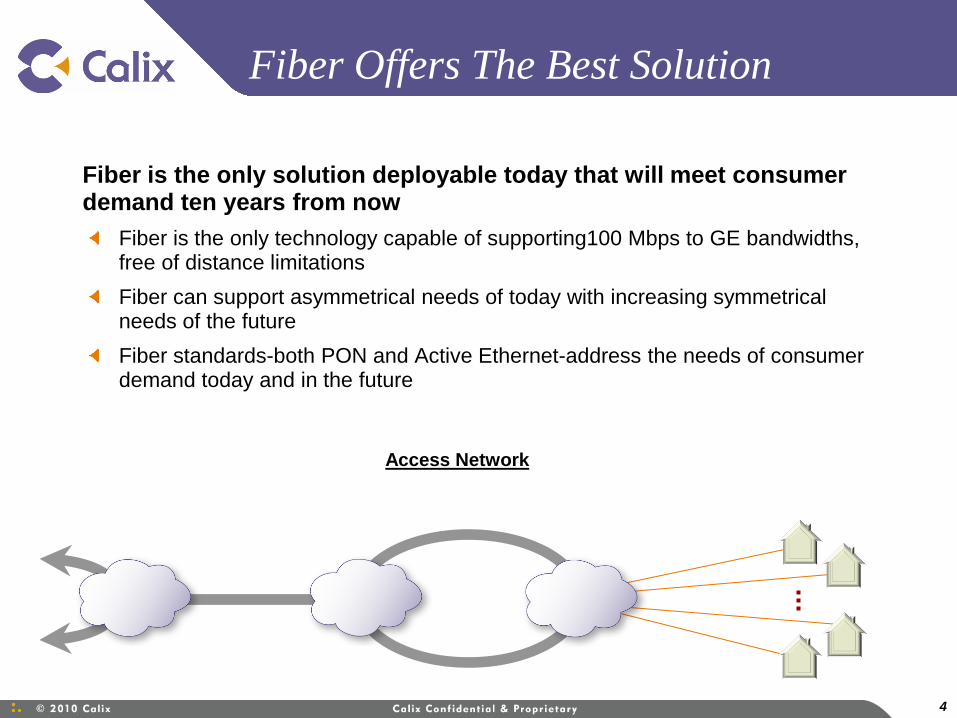
Fiber Offers The Best Solution
Fiber is the only solution deployable today that will meet consumer demand ten years from now
Fiber is the only technology capable of supporting100 Mbps to GE bandwidths, free of distance limitations
Fiber can support asymmetrical needs of today with increasing symmetrical needs of the future
Fiber standards-both PON and Active Ethernet-address the needs of consumer demand today and in the future
Access Network
5
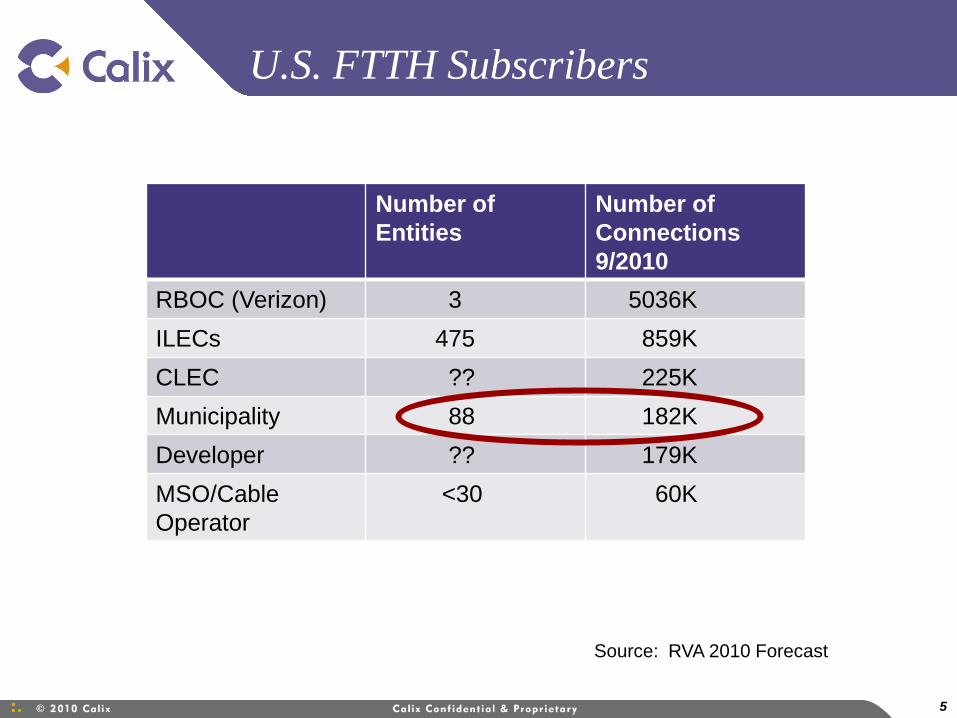
U.S. FTTH Subscribers
Number of
Entities
Number of
Connections
9/2010
RBOC (Verizon) 3 5036K
ILECs 475 859K
CLEC ?? 225K
Municipality 88 182K
Developer ?? 179K
MSO/Cable
Operator
<30 60K
Source: RVA 2010 Forecast
6
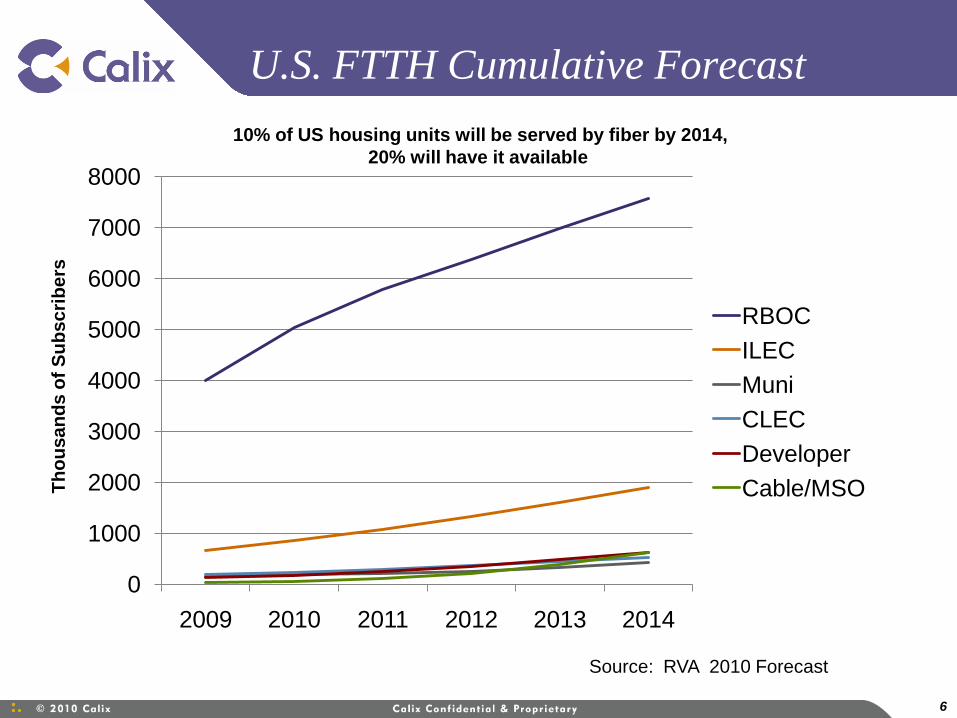
U.S. FTTH Cumulative Forecast
0
1000
2000
3000
4000
5000
6000
7000
8000
2009 2010 2011 2012 2013 2014
RBOC
ILEC
Muni
CLEC
Developer
Cable/MSO
Source: RVA 2010 Forecast
10% of US housing units will be served by fiber by 2014,
20% will have it available
Th
ou
sa
nd
s o
f S
ub
sc
rib
ers

7
Non-RBOC U.S. FTTH Cumulative Forecast
0
200
400
600
800
1000
1200
1400
1600
1800
2000
2009 2010 2011 2012 2013 2014
ILEC
Muni
CLEC
Developer
Cable/MSO
Source: RVA 2010 Forecast
A net add of only 200,000 municipal FTTH subscribers in 4 years
Th
ou
sa
nd
s o
f S
ub
sc
rib
ers
8
Municipal FTTH Market Status
Out of 34,000 municipalities in the U.S
88 cities offer communications services over FTTH
Over 350 offer some form of telecom service
2,000 own their electric utility
Municipal electrics account for most of the FTTH Muni projects
Municipal utilities serve 9 million housing units in states that do not prohibit or discourage Muni’s from offering broadband services
Why has the market been slow to develop?
State restrictions, legal and political opposition
Many cities have waited-hoping incumbents will build out
Difficulty making the business case
Lack of operational expertise; knowledge base
9
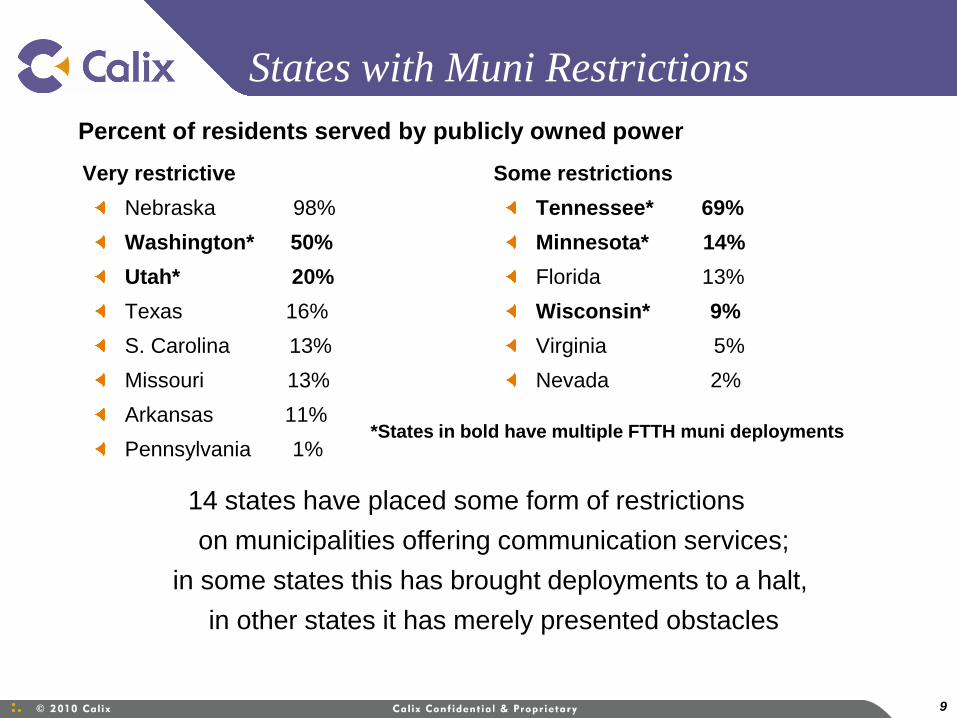
States with Muni Restrictions
Very restrictive
Nebraska 98%
Washington* 50%
Utah* 20%
Texas 16%
S. Carolina 13%
Missouri 13%
Arkansas 11%
Pennsylvania 1%
Some restrictions
Tennessee* 69%
Minnesota* 14%
Florida 13%
Wisconsin* 9%
Virginia 5%
Nevada 2%
14 states have placed some form of restrictions
on municipalities offering communication services;
in some states this has brought deployments to a halt,
in other states it has merely presented obstacles
*States in bold have multiple FTTH muni deployments
Percent of residents served by publicly owned power
10
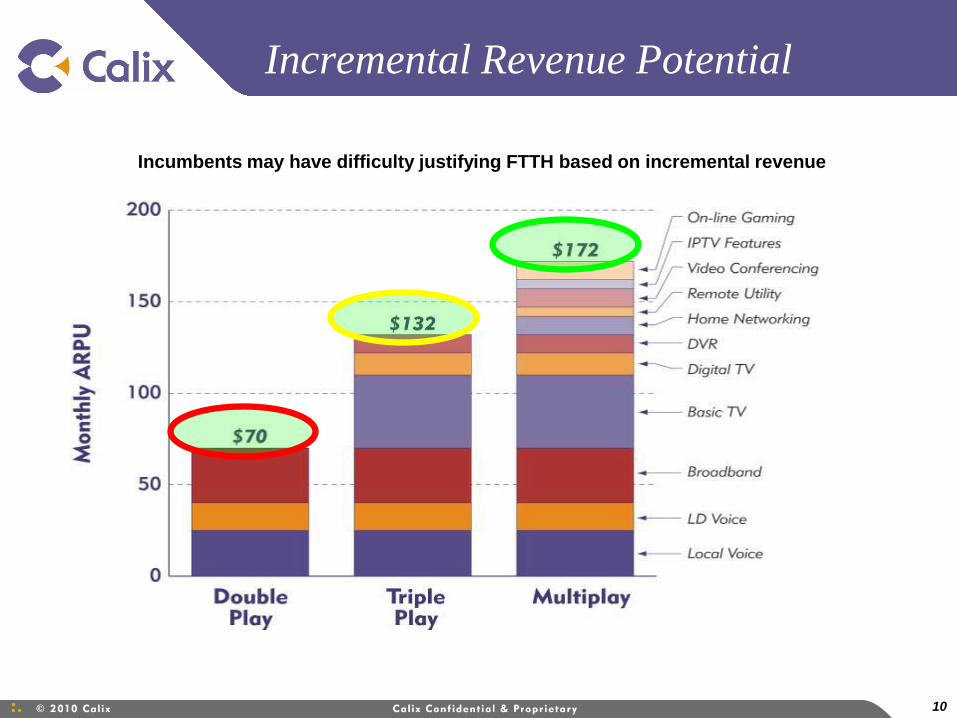
Incremental Revenue Potential
Incumbents may have difficulty justifying FTTH based on incremental revenue
11
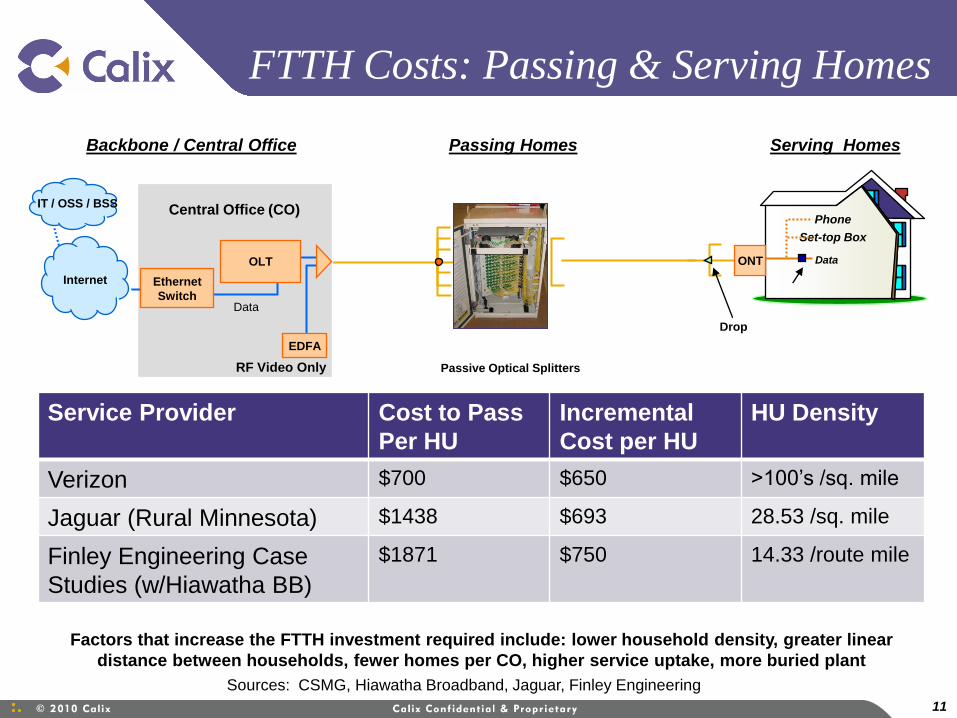
Backbone / Central Office Passing Homes Serving Homes
FTTH Costs: Passing & Serving Homes
Sources: CSMG, Hiawatha Broadband, Jaguar, Finley Engineering
Factors that increase the FTTH investment required include: lower household density, greater linear
distance between households, fewer homes per CO, higher service uptake, more buried plant
Passive Optical Splitters
Central Office (CO)
Data
Ethernet
Switch
Internet
OLT
EDFA
IT / OSS / BSS
Drop
Set-top Box
Phone
ONT Data
RF Video Only
Service Provider Cost to Pass
Per HU
Incremental
Cost per HU
HU Density
Verizon $700 $650 >100’s /sq. mile
Jaguar (Rural Minnesota) $1438 $693 28.53 /sq. mile
Finley Engineering Case
Studies (w/Hiawatha BB)
$1871 $750 14.33 /route mile

12
Verizon’s Cost Per Home Served
30% Take Rate 50% Take Rate 100% Take Rate
Cost per Home
Passed $700 $700 $700
Incremental
Cost per Home
Served $650 $650 $650
Actual Cost per
Home Served $2983 $2050 $1350
Actual cost per home served at a 30% take rate for 1000 homes is $2,983
Verizon’s average revenue per year/per FiOS sub is over $1500 per year
13
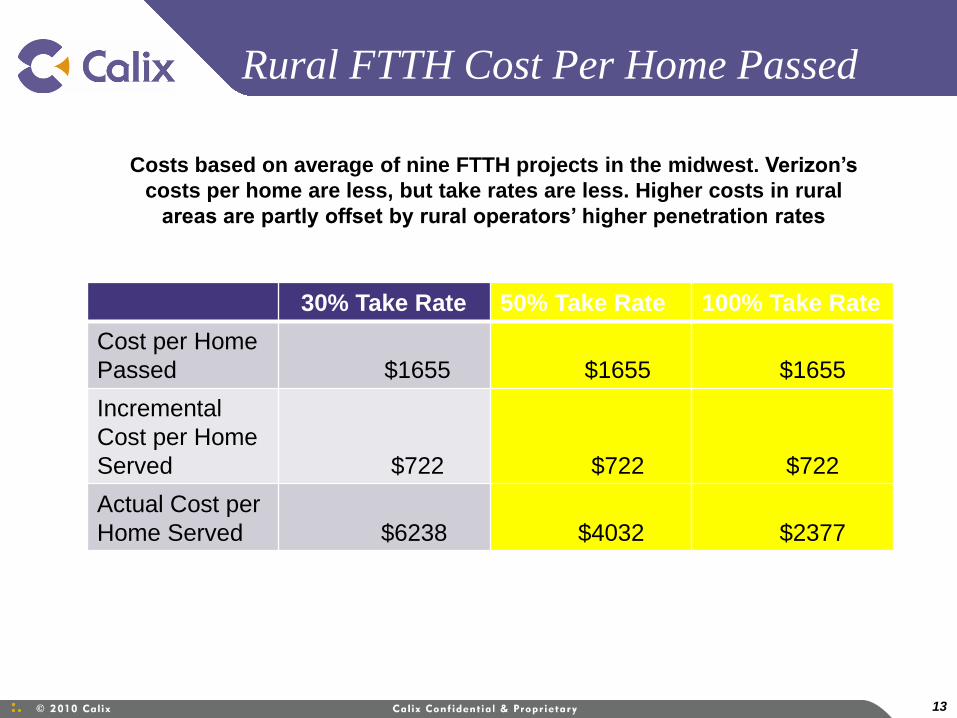
Rural FTTH Cost Per Home Passed
30% Take Rate 50% Take Rate 100% Take Rate
Cost per Home
Passed $1655 $1655 $1655
Incremental
Cost per Home
Served $722 $722 $722
Actual Cost per
Home Served $6238 $4032 $2377
Costs based on average of nine FTTH projects in the midwest. Verizon’s
costs per home are less, but take rates are less. Higher costs in rural
areas are partly offset by rural operators’ higher penetration rates
14
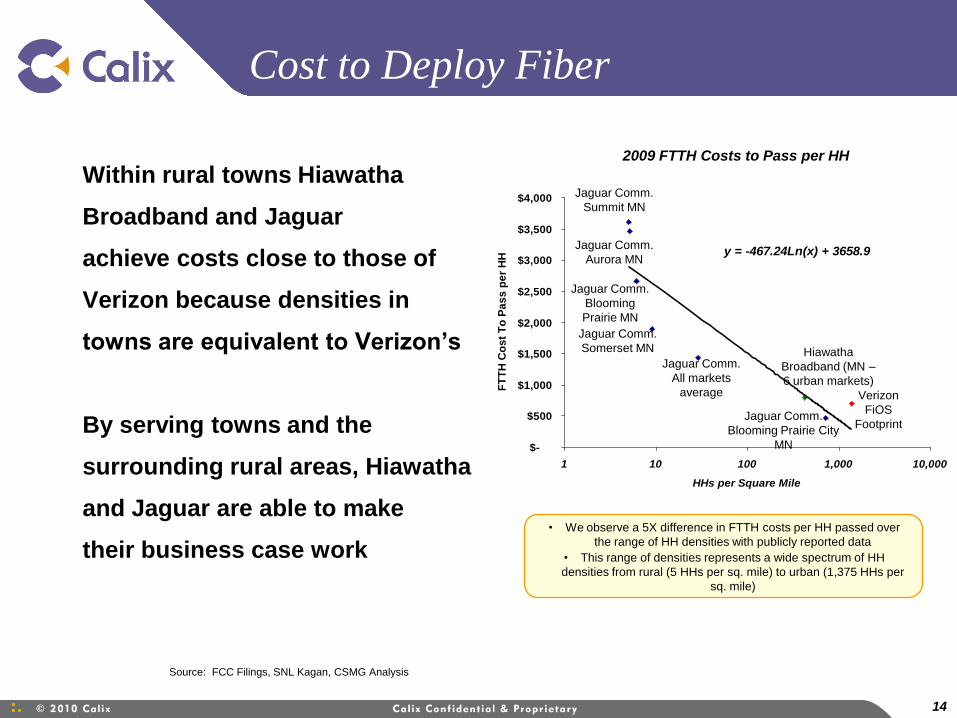
Within rural towns Hiawatha
Broadband and Jaguar
achieve costs close to those of
Verizon because densities in
towns are equivalent to Verizon’s
By serving towns and the
surrounding rural areas, Hiawatha
and Jaguar are able to make
their business case work
y = -467.24Ln(x) + 3658.9
$-
$500
$1,000
$1,500
$2,000
$2,500
$3,000
$3,500
$4,000
1 10 100 1,000 10,000
HHs per Square Mile
FT
TH
Co
st
To
Pa
ss
pe
r H
H
Cost to Deploy Fiber
• We observe a 5X difference in FTTH costs per HH passed over
the range of HH densities with publicly reported data
• This range of densities represents a wide spectrum of HH
densities from rural (5 HHs per sq. mile) to urban (1,375 HHs per
sq. mile)
Source: FCC Filings, SNL Kagan, CSMG Analysis
Hiawatha
Broadband (MN –
6 urban markets)
Verizon
FiOS
Footprint
2009 FTTH Costs to Pass per HH
Jaguar Comm.
Blooming Prairie City
MN
Jaguar Comm.
All markets
average
Jaguar Comm.
Somerset MN
Jaguar Comm.
Blooming
Prairie MN
Jaguar Comm.
Summit MN
Jaguar Comm.
Aurora MN
15
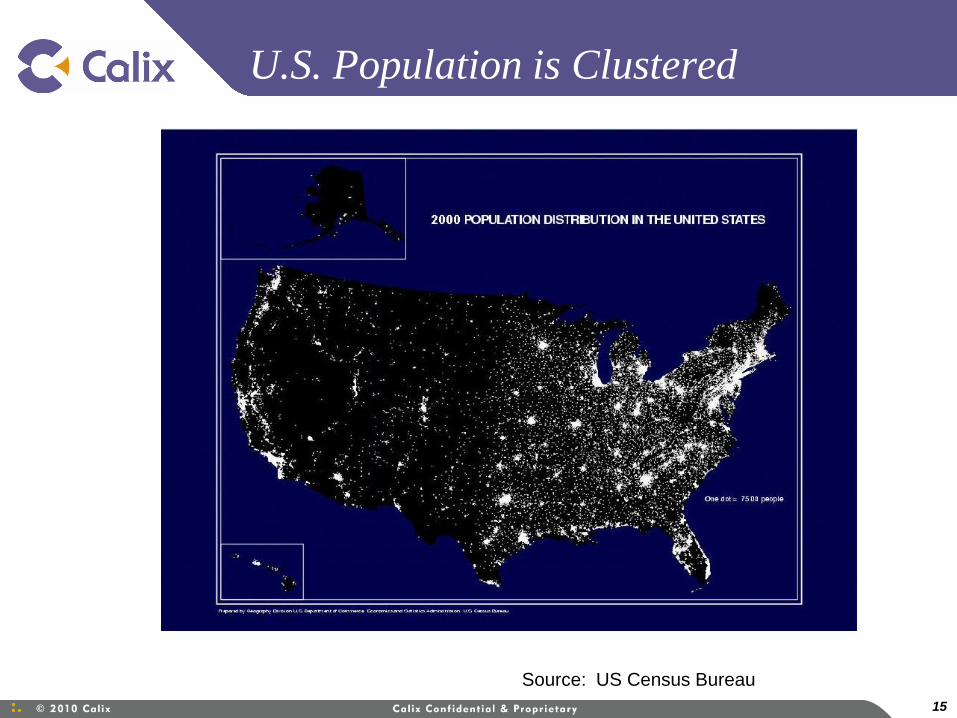
U.S. Population is Clustered
Source: US Census Bureau

16
Housing is Concentrated
County Name
County HH
Density
Burwell, NE Lancaster, NH Jamestown, TN
Garfield County, Nebraska
1.4 HHs per sq. mi.
Coos County, New Hampshire
7.8 HHs per sq. mi.
Fentress County, Tennessee
13.4 HHs per sq. mi.
Example
Locality
Example Rural Localities & Household Density
• Broad classifications of locality type (rural vs. urban) and
density metrics may be poor indicators of the investment
required to deploy FTTH to a community, as population and
households can exhibit differing levels of clustering
Source: Google Earth, US Census Bureau, CSMG Analysis
17
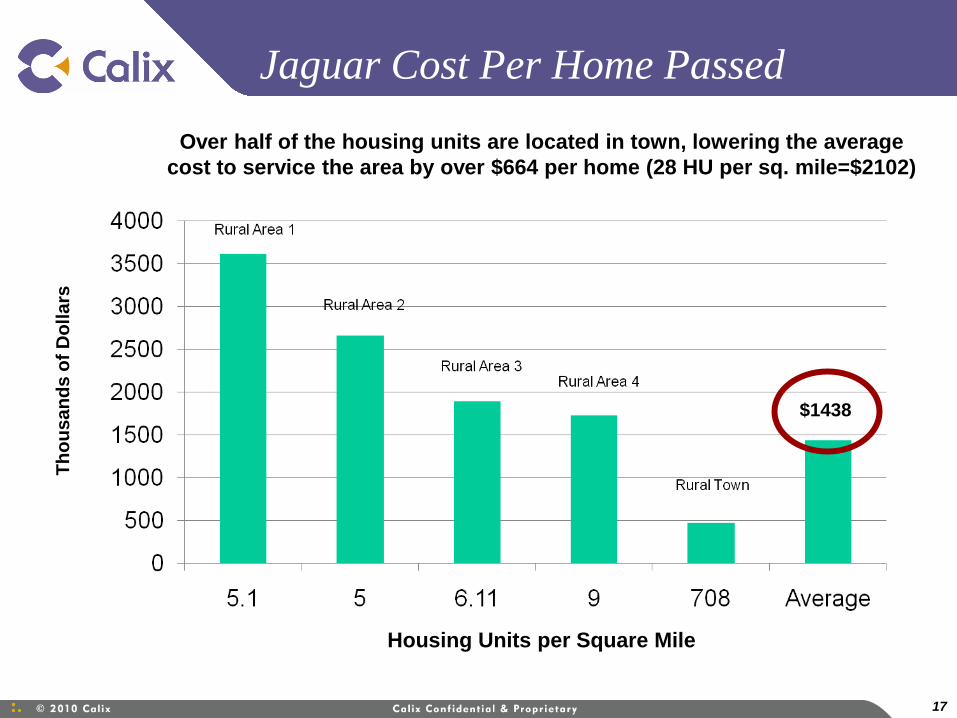
Jaguar Cost Per Home Passed
Housing Units per Square Mile
$1438
Over half of the housing units are located in town, lowering the average
cost to service the area by over $664 per home (28 HU per sq. mile=$2102)
Th
ou
san
ds o
f D
oll
ars
18
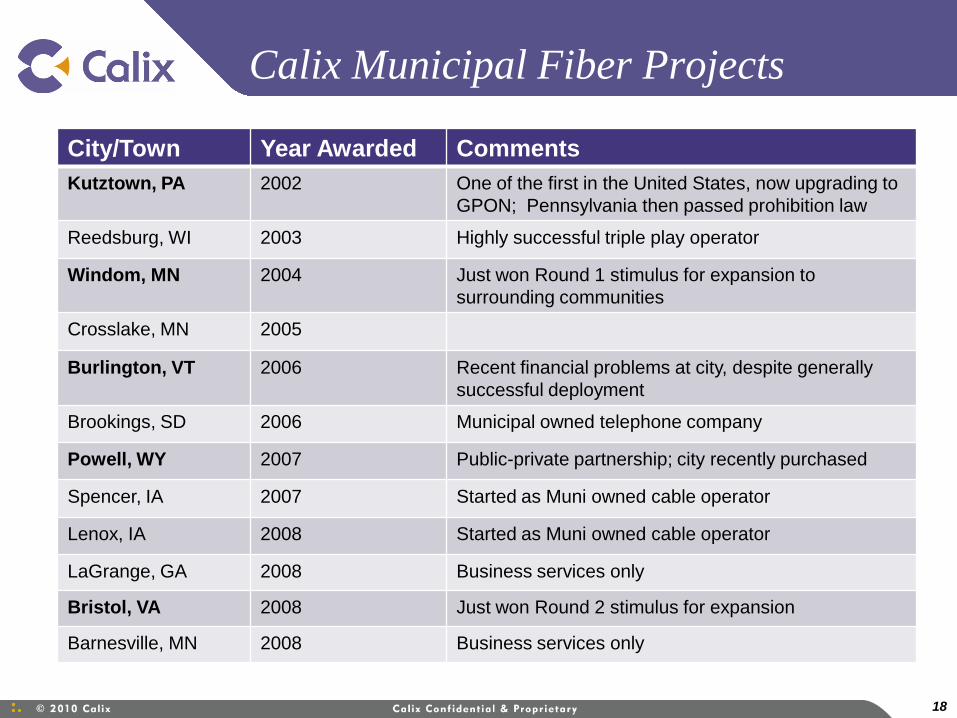
Calix Municipal Fiber Projects
City/Town Year Awarded Comments
Kutztown, PA 2002 One of the first in the United States, now upgrading to
GPON; Pennsylvania then passed prohibition law
Reedsburg, WI 2003 Highly successful triple play operator
Windom, MN 2004 Just won Round 1 stimulus for expansion to
surrounding communities
Crosslake, MN 2005
Burlington, VT 2006 Recent financial problems at city, despite generally
successful deployment
Brookings, SD 2006 Municipal owned telephone company
Powell, WY 2007 Public-private partnership; city recently purchased
Spencer, IA 2007 Started as Muni owned cable operator
Lenox, IA 2008 Started as Muni owned cable operator
LaGrange, GA 2008 Business services only
Bristol, VA 2008 Just won Round 2 stimulus for expansion
Barnesville, MN 2008 Business services only
19
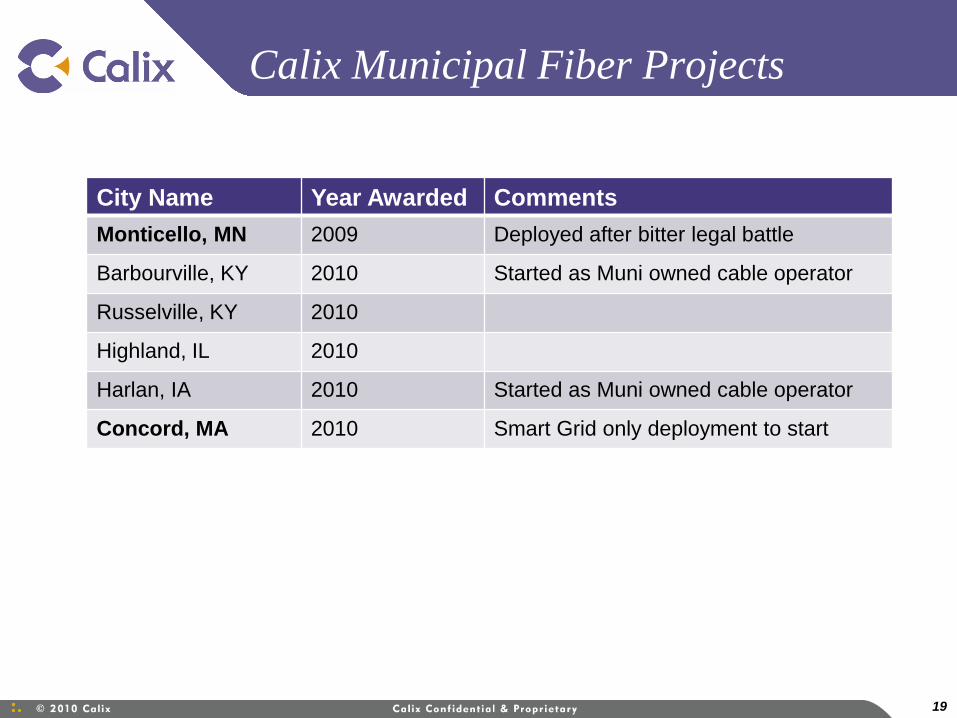
Calix Municipal Fiber Projects
City Name Year Awarded Comments
Monticello, MN 2009 Deployed after bitter legal battle
Barbourville, KY 2010 Started as Muni owned cable operator
Russelville, KY 2010
Highland, IL 2010
Harlan, IA 2010 Started as Muni owned cable operator
Concord, MA 2010 Smart Grid only deployment to start
20
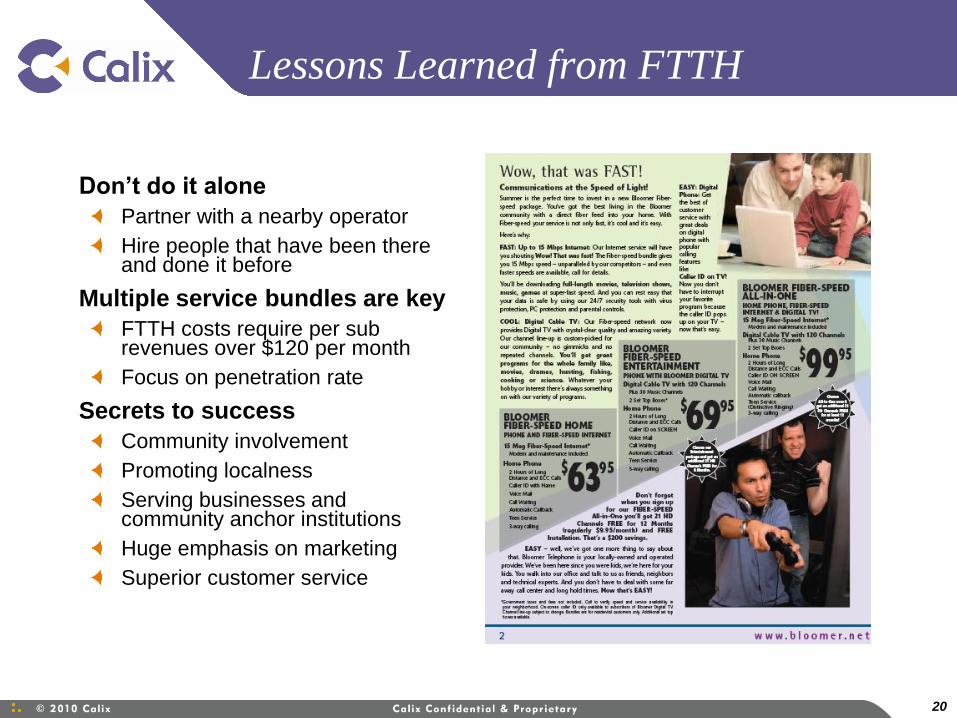
Lessons Learned from FTTH
Don’t do it alone
Partner with a nearby operator
Hire people that have been there and done it before
Multiple service bundles are key
FTTH costs require per sub revenues over $120 per month
Focus on penetration rate
Secrets to success
Community involvement
Promoting localness
Serving businesses and community anchor institutions
Huge emphasis on marketing
Superior customer service
21
Your Role As The Change Agent
Focus on economic growth
Fiber is a development tool
Fiber towns grow faster
Find a community leader
One strong public official at the core of every fiber build
Your job: Inform the champion
Can you pass the fiber test?
What is fiber?
Benefit to the economy
Regulatory barriers?
Understand the opposition
Organize community support
Thank You