Embed Size (px)
Citation preview
NBER WORKING PAPER SERIES
WHY ARE IMMIGRANTS' INCARCERATION RATES SO LOW? EVIDENCE ONSELECTIVE IMMIGRATION, DETERRENCE, AND DEPORTATION
Kristin F. ButcherAnne Morrison Piehl
Working Paper 13229http://www.nber.org/papers/w13229
NATIONAL BUREAU OF ECONOMIC RESEARCH1050 Massachusetts Avenue
Cambridge, MA 02138July 2007
We appreciate the excellent research assistance of Yonita Grigorova and Kyung Park. We thank DavidCard, Karen Humes, Jennifer Hunt, Francesca Mazzolari, J. Gregory Robinson, and participants inpresentations at the CReAM conference on Immigration, Maryland Workshop on the Economics ofCrime, Colby College, University of Connecticut, Federal Reserve Bank of Philadelphia, the FederalReserve Bank of Chicago, Rutgers University, the Myron Weiner Seminar Series on InternationalMigration, the NBER Summer Institute, and the annual meetings of the Society of Labor Economists,APPAM, and the American Law and Economics Association for helpful discussions. The views expressedherein are those of the author(s) and do not necessarily reflect the views of the National Bureau ofEconomic Research.
© 2007 by Kristin F. Butcher and Anne Morrison Piehl. All rights reserved. Short sections of text,not to exceed two paragraphs, may be quoted without explicit permission provided that full credit,including © notice, is given to the source.
Why are Immigrants' Incarceration Rates so Low? Evidence on Selective Immigration, Deterrence,and DeportationKristin F. Butcher and Anne Morrison PiehlNBER Working Paper No. 13229July 2007JEL No. J1,J2,K4
ABSTRACT
The perception that immigration adversely affects crime rates led to legislation in the 1990s that particularlyincreased punishment of criminal aliens. In fact, immigrants have much lower institutionalization (incarceration)rates than the native born - on the order of one-fifth the rate of natives. More recently arrived immigrantshave the lowest relative incarceration rates, and this difference increased from 1980 to 2000. We examinewhether the improvement in immigrants' relative incarceration rates over the last three decades is linkedto increased deportation, immigrant self-selection, or deterrence. Our evidence suggests that deportationdoes not drive the results. Rather, the process of migration selects individuals who either have lowercriminal propensities or are more responsive to deterrent effects than the average native. Immigrantswho were already in the country reduced their relative institutionalization probability over the decades;and the newly arrived immigrants in the 1980s and 1990s seem to be particularly unlikely to be involvedin criminal activity, consistent with increasingly positive selection along this dimension.
Kristin F. ButcherDepartment of EconomicsWellesley College106 Central StreetWellesley, MA [email protected]
Anne Morrison PiehlDepartment of EconomicsRutgers, The State University of New JerseyNew Jersey Hall75 Hamilton StreetNew Brunswick, NJ 08901-1248and [email protected]
Much of the concern that immigration to the United States adversely affects crime derives from
the fact that immigrants tend to have characteristics in common with native-born populations that
are disproportionately incarcerated. That is, immigrants have low average levels of education and
very low average wages, and many are young, male, and Hispanic. For similar reasons, there are
general concerns that immigration adds to the “underclass” in the United States by increasing
dependence on cash assistance and subsidized medical care, decreasing homeownership, and
creating pockets of entrenched poverty with adverse social outcomes.1 During the 1990s, when
immigration rates were high and crime rates were high and rising, observers feared a link
between immigration and crime, and several significant pieces of federal legislation increased
criminal penalties for noncitizens.
Economic theories tend to support the concern about a link between immigration and
crime. The economic model of crime (Becker 1968), for example, posits that those who have
poor labor market outcomes—and thus low opportunity costs from giving up activities in the
legal sector—will be more likely to engage in criminal activity. Many studies have documented
immigrants’ poor labor market outcomes (see, for example, Borjas 2004). These outcomes are
due in part to the low skills that many immigrants bring with them, and in part to immigrants’
loss of other elements of human capital (such as language and social networks) that enable
individuals to make full use of their skills. A one-dimensional model of skills would lead one to
1 Research on the criminal justice outcomes of immigrants is limited (Mears 2002). However, research on other outcomes shows that immigrants are less likely to use welfare than similar natives (Butcher and Hu 2000). Immigrants are less likely to own homes than the native-born, and this gap widened between 1980 and 2000. However, this gap is mainly driven by location choice and immigrants’ country of origin. Future increases in immigrant enclaves may be expected to increase demand for owner-occupied housing (Borjas 2002). Other research has examined the participation of immigrants in mainstream financial institutions. Recent evidence suggests that immigrants are less likely to participate in financial markets, that these differences tend to persist, and that they may be driven by immigrants’ experience with financial institutions in their countries of origin (Osili and Paulson 2004a, b).
expect that a population with poor labor market outcomes would also have poor outcomes in
other arenas such as crime, health, and family life.
In this paper, we examine immigrants’ institutionalization rates as a proxy for
incarceration, and thus their involvement in criminal activity. Contrary to what one might expect
from labor market studies, immigrants have very low rates of institutionalization compared with
the native born. What’s more, immigrants’ relative rates of institutionalization have fallen over
the last three decades. More recent cohorts also have better criminal-justice outcomes than
earlier cohorts, and synthetic cohort analyses show that immigrants’ relative rates of
institutionalization tend to decline with time in the country. If one assumed that the relationship
between “skills” and outcomes is the same among immigrants and the native born, this is
precisely the opposite of what one would have predicted from most synthetic cohort analyses of
immigrants’ labor market outcomes.
Important laws enacted in the 1990s increased penalties for criminal noncitizens by
broadening the crimes for which they could be deported. Did this mechanically lower
immigrants’ institutionalization rates by ensuring that criminal aliens were deported? Or did the
greater punishment change immigrants’ criminal activity in the U.S.? Beyond laws specifically
increasing punishments for criminal aliens, the 1980s and 1990s saw increased punishment for
crimes more generally. Did these changes affect immigrants’ behavior more than the native
born? Or did increased punishment for criminal activity combined with welfare reform—which
decreased immigrants’ access to social welfare programs—change the type of person who self-
selects to immigrate to the United States?
We present a variety of tests of these potential explanations. We rule out deportation as
an important mechanical factor for the observed differences in institutionalization. Instead, the
2
evidence is consistent with a model of multiple dimensions regarding who self-selects to
immigrate to the United States. That is, the type of person who chose to immigrate to the United
States in the 1990s shifted toward those who are less criminally active. The results also suggest
that immigrants are more responsive to criminal punishment than the average native, and
decreased their criminal activity in response to harsher criminal penalties imposed during the
1980s and 1990s.
Immigrant Skill Levels and Self-Selection
The last four decades have seen striking changes in immigration to the United States.
Borjas (2004) provides a thorough accounting of the experience of immigrants in the U.S. labor
market. Male immigrants have slightly lower employment rates but wage rates that are
substantially below those of the native born. While in 1960 immigrants’ wages were 6.5% above
those of natives, by 2000 they were 19% lower. Those who have been in the U.S. for the
shortest period have larger deficits: in 1960 those who had arrived recently earned 9% less than
natives, but that gap expanded to 38% in 1990. Because they begin at lower earnings rates,
immigrant cohorts arriving after 1970 are not expected to fully assimilate to higher native
earnings rates.
Borjas (1987, 1994) provides a framework for understanding these changes in
immigrants’ labor market outcomes over time. He adapts a version of the Roy (1951) model to
immigrant self-selection. Under the assumption that migration costs are the same across
individuals, he shows that low-skilled individuals will have an incentive to migrate to countries
where the distribution of earnings is more equal than in their own country. As U.S. immigration
policy changed, allowing more individuals from countries with very unequal earnings
3
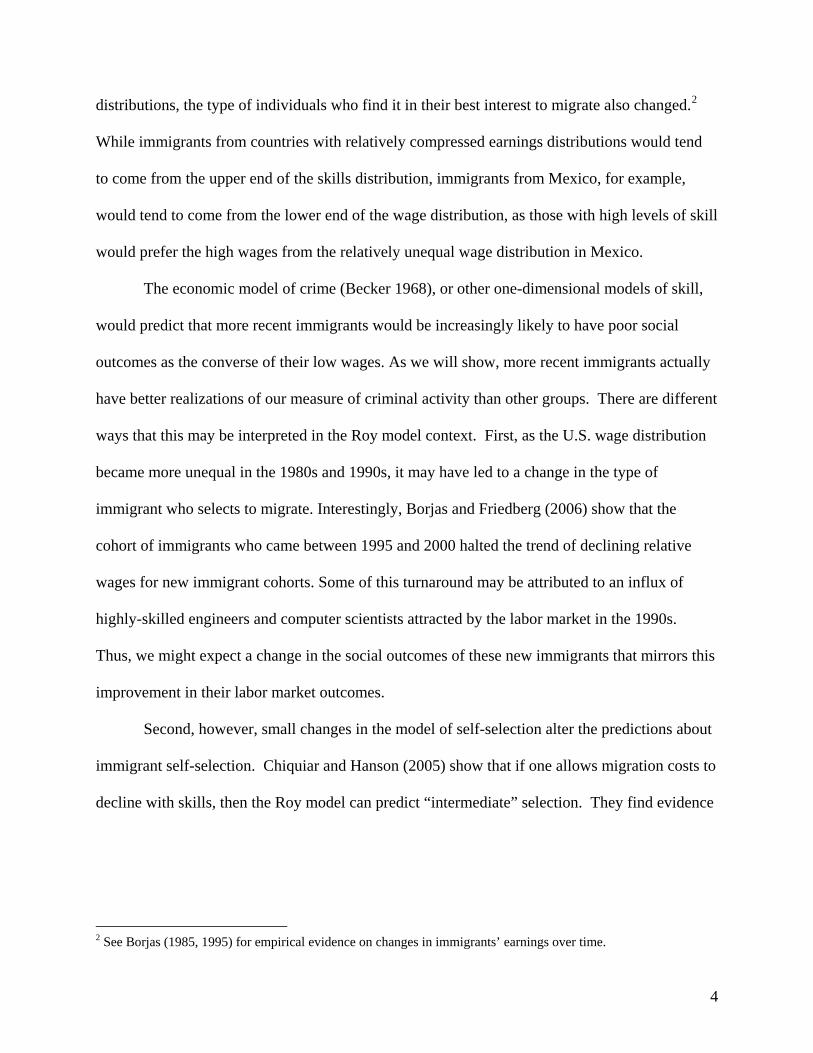
distributions, the type of individuals who find it in their best interest to migrate also changed.2
While immigrants from countries with relatively compressed earnings distributions would tend
to come from the upper end of the skills distribution, immigrants from Mexico, for example,
would tend to come from the lower end of the wage distribution, as those with high levels of skill
would prefer the high wages from the relatively unequal wage distribution in Mexico.
The economic model of crime (Becker 1968), or other one-dimensional models of skill,
would predict that more recent immigrants would be increasingly likely to have poor social
outcomes as the converse of their low wages. As we will show, more recent immigrants actually
have better realizations of our measure of criminal activity than other groups. There are different
ways that this may be interpreted in the Roy model context. First, as the U.S. wage distribution
became more unequal in the 1980s and 1990s, it may have led to a change in the type of
immigrant who selects to migrate. Interestingly, Borjas and Friedberg (2006) show that the
cohort of immigrants who came between 1995 and 2000 halted the trend of declining relative
wages for new immigrant cohorts. Some of this turnaround may be attributed to an influx of
highly-skilled engineers and computer scientists attracted by the labor market in the 1990s.
Thus, we might expect a change in the social outcomes of these new immigrants that mirrors this
improvement in their labor market outcomes.
Second, however, small changes in the model of self-selection alter the predictions about
immigrant self-selection. Chiquiar and Hanson (2005) show that if one allows migration costs to
decline with skills, then the Roy model can predict “intermediate” selection. They find evidence
2 See Borjas (1985, 1995) for empirical evidence on changes in immigrants’ earnings over time.
4
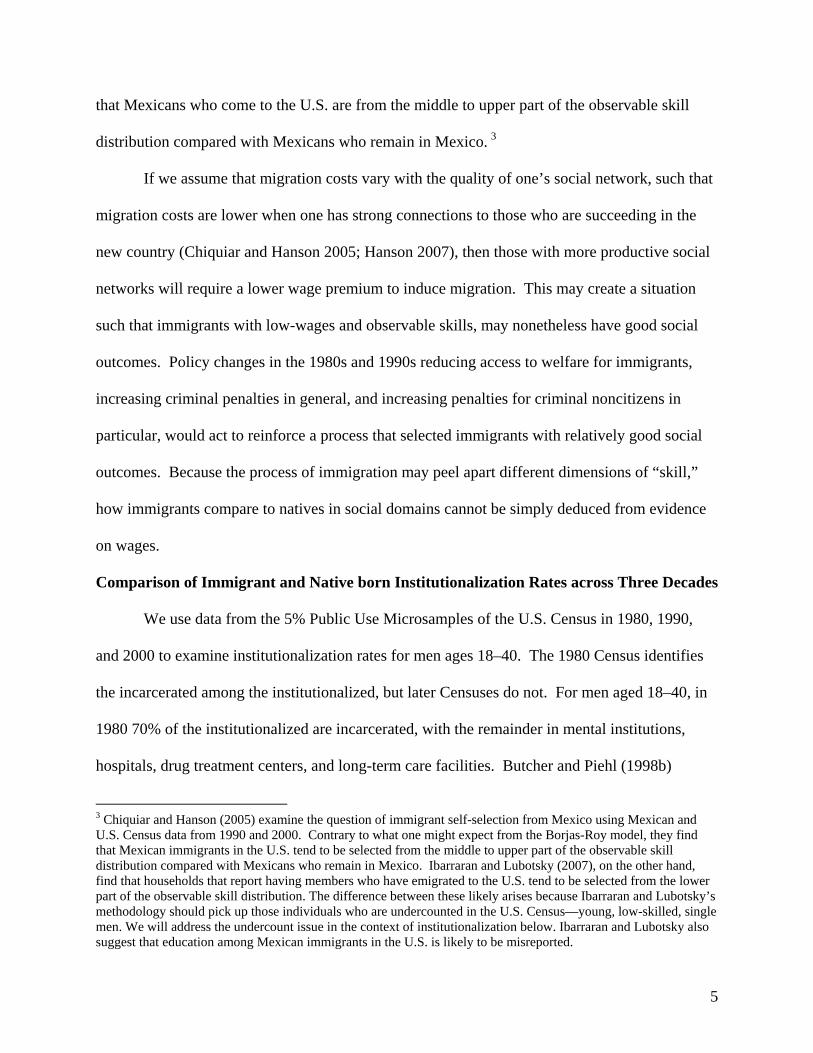
that Mexicans who come to the U.S. are from the middle to upper part of the observable skill
distribution compared with Mexicans who remain in Mexico. 3
If we assume that migration costs vary with the quality of one’s social network, such that
migration costs are lower when one has strong connections to those who are succeeding in the
new country (Chiquiar and Hanson 2005; Hanson 2007), then those with more productive social
networks will require a lower wage premium to induce migration. This may create a situation
such that immigrants with low-wages and observable skills, may nonetheless have good social
outcomes. Policy changes in the 1980s and 1990s reducing access to welfare for immigrants,
increasing criminal penalties in general, and increasing penalties for criminal noncitizens in
particular, would act to reinforce a process that selected immigrants with relatively good social
outcomes. Because the process of immigration may peel apart different dimensions of “skill,”
how immigrants compare to natives in social domains cannot be simply deduced from evidence
on wages.
Comparison of Immigrant and Native born Institutionalization Rates across Three Decades
We use data from the 5% Public Use Microsamples of the U.S. Census in 1980, 1990,
and 2000 to examine institutionalization rates for men ages 18–40. The 1980 Census identifies
the incarcerated among the institutionalized, but later Censuses do not. For men aged 18–40, in
1980 70% of the institutionalized are incarcerated, with the remainder in mental institutions,
hospitals, drug treatment centers, and long-term care facilities. Butcher and Piehl (1998b)
3 Chiquiar and Hanson (2005) examine the question of immigrant self-selection from Mexico using Mexican and U.S. Census data from 1990 and 2000. Contrary to what one might expect from the Borjas-Roy model, they find that Mexican immigrants in the U.S. tend to be selected from the middle to upper part of the observable skill distribution compared with Mexicans who remain in Mexico. Ibarraran and Lubotsky (2007), on the other hand, find that households that report having members who have emigrated to the U.S. tend to be selected from the lower part of the observable skill distribution. The difference between these likely arises because Ibarraran and Lubotsky’s methodology should pick up those individuals who are undercounted in the U.S. Census—young, low-skilled, single men. We will address the undercount issue in the context of institutionalization below. Ibarraran and Lubotsky also suggest that education among Mexican immigrants in the U.S. is likely to be misreported.
5

demonstrates that limiting the 1980 analysis to only those who are incarcerated does not
substantively change the results.4
Before we proceed, a note about our definition of “immigrant.” In many contexts, the law
distinguishes between the foreign born who intend to become permanent residents and those who
are more transient. For example, permanent resident aliens typically have the right to work in the
U.S., while those on a student visa do not. In these data, however, we do not have information on
visa status, and “immigrant” is equivalent to “foreign born.”5 The important distinction in terms
of the legal treatment of criminal aliens is between immigrants who have naturalized and those
who have not, since the latter are subject to deportation. Later in the study we will pay close
attention to citizenship status and how this has changed over time.
The immigrant population in the United States rose substantially between 1980 and 2000.
Figure 1 shows the fraction immigrant inside and outside institutions for 18–40-year-old men for
all three censuses. The fraction immigrant outside institutions nearly tripled over this period,
rising from around 6% to 17% of the population. The fraction immigrant inside institutions, on
the other hand, actually fell between 1990 and 2000, despite the increase in the overall
immigrant population.
Table 1 presents summary statistics for demographic characteristics by nativity.6 As
well-documented elsewhere, immigrant and native-born populations differ greatly in education
and race/ethnicity distributions. Between 1980 and 2000, the fraction of the native-born
population with some college education or more rose 25 percent, while among immigrants this
4 Expansions of the prison population since 1980 likely increased the proportion in our sample of the institutionalized who are incarcerated. 5 We omit those born in outlying areas of the United States and those born abroad to U.S. citizens. 6 Throughout the paper, we reported estimates using the person weight reported by the Census (there are no weights in 1980).
6
group held steady. Similarly, the fraction of the immigrant population that is Hispanic rose
substantially over this period; by 2000, nearly 60 percent of all immigrants describe themselves
as Hispanic.
Table 2 reports the institutionalization rates by nativity and other demographic
characteristics. Overall, institutionalization rates more than doubled over the period of study,
from 1.3% to 3.0% of young men at a point in time. These unadjusted rates are much lower for
the foreign born than for the native born in all three Census years. In addition,
institutionalization is strongly correlated with educational attainment, race, and ethnicity.
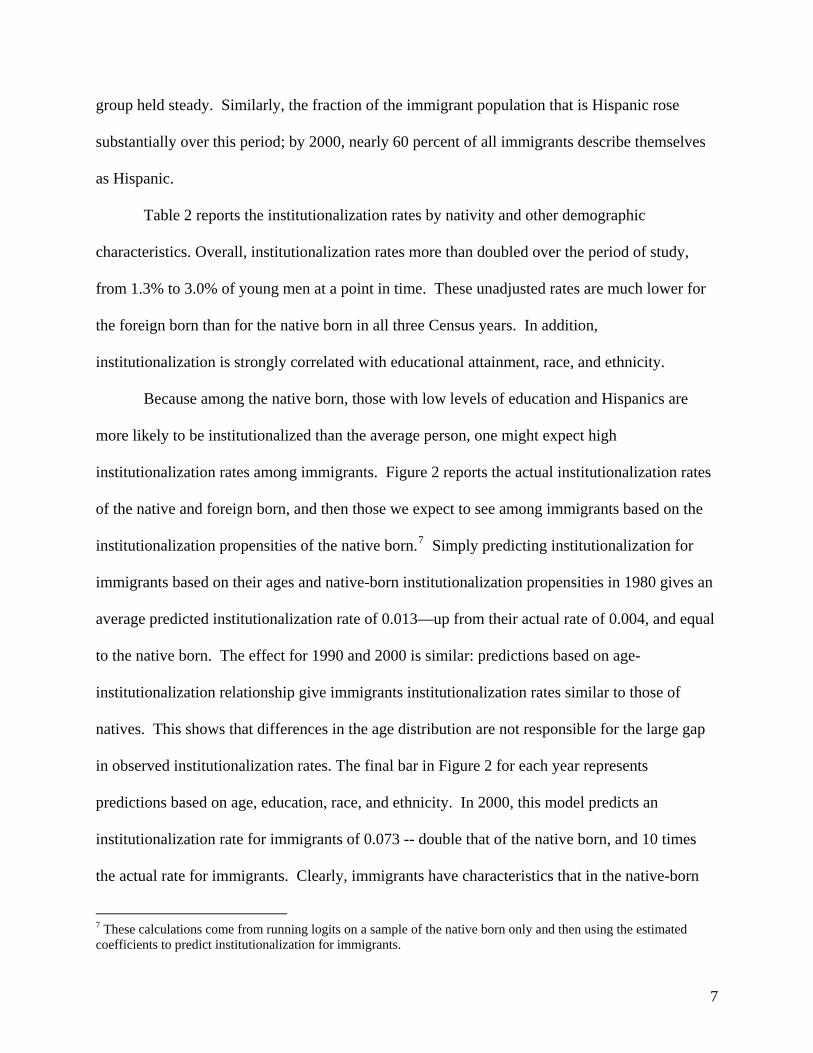
Because among the native born, those with low levels of education and Hispanics are
more likely to be institutionalized than the average person, one might expect high
institutionalization rates among immigrants. Figure 2 reports the actual institutionalization rates
of the native and foreign born, and then those we expect to see among immigrants based on the
institutionalization propensities of the native born.7 Simply predicting institutionalization for
immigrants based on their ages and native-born institutionalization propensities in 1980 gives an
average predicted institutionalization rate of 0.013—up from their actual rate of 0.004, and equal
to the native born. The effect for 1990 and 2000 is similar: predictions based on age-
institutionalization relationship give immigrants institutionalization rates similar to those of
natives. This shows that differences in the age distribution are not responsible for the large gap
in observed institutionalization rates. The final bar in Figure 2 for each year represents
predictions based on age, education, race, and ethnicity. In 2000, this model predicts an
institutionalization rate for immigrants of 0.073 -- double that of the native born, and 10 times
the actual rate for immigrants. Clearly, immigrants have characteristics that in the native-born
7 These calculations come from running logits on a sample of the native born only and then using the estimated coefficients to predict institutionalization for immigrants.
7
population are highly correlated with institutionalization. This exercise reveals just how low the
observed rates of institutionalization for immigrants are, considering their lower educational
attainment and other characteristics.
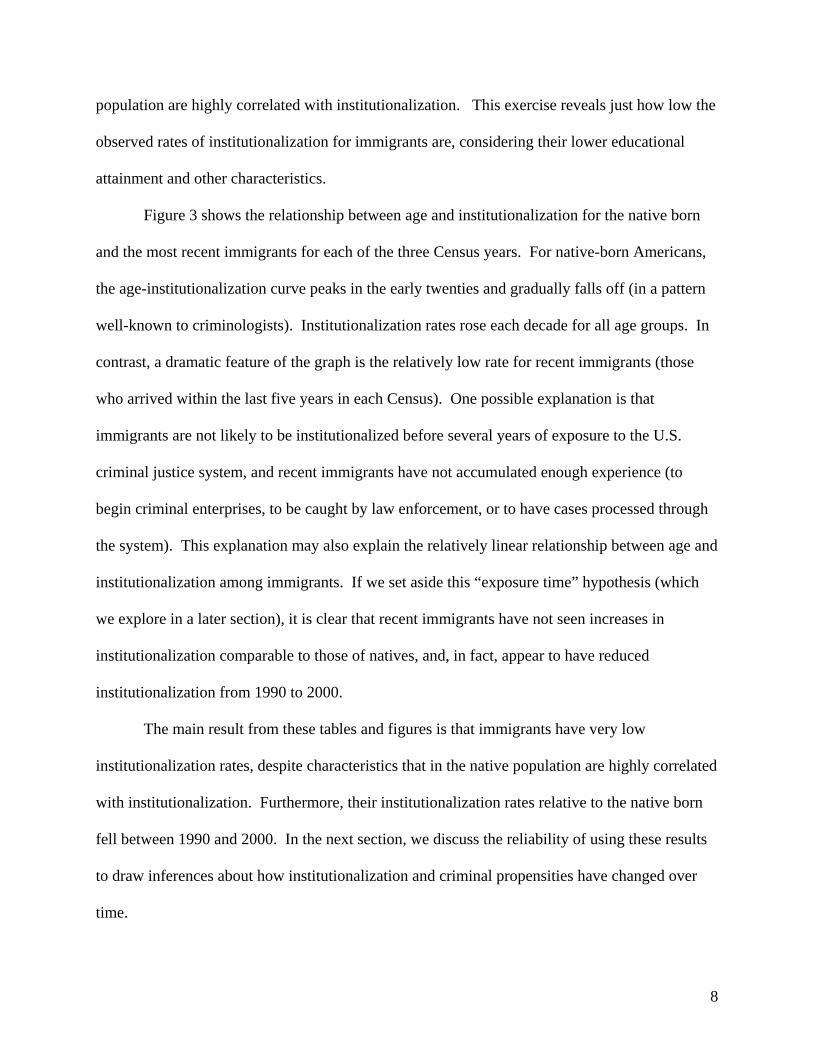
Figure 3 shows the relationship between age and institutionalization for the native born
and the most recent immigrants for each of the three Census years. For native-born Americans,
the age-institutionalization curve peaks in the early twenties and gradually falls off (in a pattern
well-known to criminologists). Institutionalization rates rose each decade for all age groups. In
contrast, a dramatic feature of the graph is the relatively low rate for recent immigrants (those
who arrived within the last five years in each Census). One possible explanation is that
immigrants are not likely to be institutionalized before several years of exposure to the U.S.
criminal justice system, and recent immigrants have not accumulated enough experience (to
begin criminal enterprises, to be caught by law enforcement, or to have cases processed through
the system). This explanation may also explain the relatively linear relationship between age and
institutionalization among immigrants. If we set aside this “exposure time” hypothesis (which
we explore in a later section), it is clear that recent immigrants have not seen increases in
institutionalization comparable to those of natives, and, in fact, appear to have reduced
institutionalization from 1990 to 2000.
The main result from these tables and figures is that immigrants have very low
institutionalization rates, despite characteristics that in the native population are highly correlated
with institutionalization. Furthermore, their institutionalization rates relative to the native born
fell between 1990 and 2000. In the next section, we discuss the reliability of using these results
to draw inferences about how institutionalization and criminal propensities have changed over
time.
8
Enumeration
Our institutionalization rates are measures of the number of individuals in institutions
divided by the number of individuals overall. Mismeasurement of either the numerator or the
denominator would result in poor estimates of institutionalization rates. For the analyses we will
conduct, we are particularly concerned with whether any mismeasurement differs systematically
between the native-born and immigrant populations, and whether mismeasurement of the
institutionalized population changes over time.
A. The Numerator
The institutionalized population is a subset of the “special populations” category in the
U.S. Census. The Census has separate questionnaires and procedures for those housed in group
quarters, including institutions. Many of those living in institutions, including prisons and jails,
are deemed unable to fill out their own questionnaires, in which case Census enumerators fill out
these forms over several weeks using administrative data. (See the data appendix for a more
detailed description of Census enumeration procedures in special populations.) Thus, the Census
records for the incarcerated population should be as good as the administrative data on which
they are based. Administrators of prisons and jails have large incentives to accurately count their
inmates, as keeping track of inmates is their foremost responsibility. And administrative data are
verified during the processing of criminal cases. Thus, we would expect this population to be
accurately counted relative to the rest of the population.
The next question is whether the counting of immigrants and the native born differs
systematically, and whether any differences changed over time. While all the foreign born may
not be properly identified, criminal justice administrators have incentives to identify them,
particularly those who are not citizens. The incentives to identify noncitizen aliens increased
9
over this period, as the federal government became more active in managing criminal aliens
(Butcher and Piehl 2000; Legomsky 1999). Thus, if anything, we would expect any undercount
of institutionalized immigrants to decrease relative to the native born over the time period. Such
a change in mismeasurement would be expected to increase the measured institutionalization rate
of immigrants relative to the native born.
We have no reason to believe that the mismeasurement in the institutionalized population
changed over the period considered in this study. Differences in enumeration practice are more
likely to have occurred for the noninstitutionalized than for the institutionalized. We turn to that
population now.
B. The Denominator
A second source of mismeasurement comes from the “undercount” of the overall
population. The undercount arises when the Census does not enumerate some individuals. This
is thought to be more likely in certain populations, particularly those that are more likely to be
transient. The 2000 Census is widely reputed to have improved the undercount problem relative
to the 1990 Census. We are not necessarily concerned if the undercount improved for all
populations in the same way. However, if immigrants are more likely to be undercounted than
the general population, and the undercount improved for them, we could find a spurious decrease
in the institutionalization rates of immigrants between 1990 and 2000 relative to the native born.
The data appendix provides more details on the potential impact of changes in the
undercount on our estimates of immigrant institutionalization rates. Our simulations show that
our estimates are unlikely to be driven purely by changes in the undercount. Suppose that the
institutionalization rate for immigrants in 1990 and 2000 was actually the same, but the 1990
Census differentially miscounted immigrants in the civilian population. For changes in the
10

undercount to generate the estimates of institutionalization observed in the data (see Table 2), the
undercount of immigrants relative to the native born would have to be 37:1 (that is, the Census
missed 37 immigrants for every 1 missed native) in the 1990 Census.
Incarceration and Its Relationship to Crime Commission
A second important question is whether we can use institutionalization rates to make
inferences about immigrants’ commission of crime in the United States. If Census measures of
institutionalization are poor measures of true incarceration rates, then these measures would not
tell us much about how immigration affects public safety. Alternatively, if immigrants are less
likely than the native born to be caught for a given criminal act (for example, because they evade
police by slipping across the border), immigrants will have lower institutionalization rates.
However, areas with large immigrant populations will have higher crime rates.8
We can use information on Metropolitan Area (MA) crime rates and immigrant density to
provide some evidence on the relationship between immigration and crime.9 Figure 4 shows the
change in MA crime rates graphed against the change in fraction immigrant for 1990 to 2000 for
the 20 largest MAs.10 Areas with the largest increases in their fraction immigrant had the largest
decreases in their crime rates. This analysis corroborates the results from the individual-level
8 Some might argue that immigrants are less likely to report crimes. The nationally representative study of criminal victimization does not allow analysis of reporting rates by immigrant status. However, there is no consistent pattern between Hispanics and non-Hispanics regarding the propensity to report crimes to police (Catalano 2005). 9 There is a sizeable literature on the labor market impacts of immigration that uses cross-MA variation to examine the issue. Many of the concerns around interpretation there also pertain for the impact of immigration on crime rates. See Card (2001) and Borjas (2003) for examples and discussion. 10 Data are from the Uniform Crime Reports (see table notes for details). Four of the 24 largest MAs had to be dropped because data were unavailable.
11
Census data reported here: immigrants’ criminality improved relative to that of the native born
between 1990 and 2000.11
What Explains the Low Institutionalization Rates of Immigrants?
Having established that immigrants have low institutionalization rates relative to the
native born in the U.S., we now turn to the potential causes. We begin this section with a
baseline multivariate model. Then we discuss the competing hypotheses and our empirical
strategy for testing them.
A. Baseline Specification
In Table 3 we present the results of logit models to explain institutionalization, with all
three Censuses stacked together.12 Each specification includes a full set of age dummies, year
dummies, and controls for the length of time in the U.S. for immigrants, as in equation (1)
below:
(1) ( ) ( ) ( ) ( )
( ) ( ) ( ) ( ) ( )96 00 2 91 95 3 85 90 10 40 50
21 2 1 2
...
1980 1990iI c c c c
yearsUS yearsUS X1 − − − −= α +β +β +β + +β
+δ + δ + γ + γ +ϕ + ε
The table reports the marginal effects evaluated at the sample means, not the logit coefficients.
The first model in Table 3 shows that immigrants have a 2.5-percentage-point lower
probability of being institutionalized, controlling for year, age, and time in the U.S. As the
length of time immigrants are in the U.S. grows, institutionalization rates fall—the opposite of
assimilation. Column (1) shows that the immigrant effect varies by cohort, with more recent
cohorts having lower institutionalization rates (relative to natives) than earlier cohorts. Note that
some cohorts appeared in just one or two of the Census years, and that time in the U.S. is highly
11 Other researchers have documented a non-relationship between immigration and crime: Butcher and Piehl (1998a), which analyzed changes in city crime rates and immigration patterns between 1980 and 1990, Hagan and Palloni (1999), which compared crime rates of border to non-border cities, and Martinez and Rosenfeld (2001), which compared crimes rates at the neighborhood level in Miami, El Paso, and San Diego.
12
correlated with cohort, especially because of the age limitations on our sample.13 In later
specifications, we free up the coefficients to vary by Census year. In those specifications, the
meaning of a particular cohort is clearer. For now, it is enough to note these issues affect
interpretation of the estimates.
Model (2) adds education, model (3) further adds race and ethnicity, and model (4) adds
an indicator of U.S. citizenship (for the foreign born) to the earlier controls. All these variables
are strongly statistically significant predictors of institutionalization. In particular, the addition
of education attenuates all the measured effects in the earlier models, including the cohort
indicators and year dummies. The main qualitative description of the cohort pattern persists,
though with a more modest quantitative difference between immigrants and the native born.
Lubotsky (2000) points out that the Census may misclassify reentering immigrants as
recent arrivals. Indeed, he finds that many of the studies focusing on immigrant wage
assimilation overstate the secular decline in earnings across immigrant cohorts, because these
mostly low-wage entrants are misclassified as “recent immigrants.” It is less clear how this
misclassification may affect our results. If some in the “recent immigrant” category are these
reentrants with very low skills, then we might expect, as a corollary to the wage studies, to find
this group more likely to be incarcerated. This would work against our finding that recent
immigrants have particularly low incarceration rates. On the other hand, the fact that they are
reentrants may suggest a certain fluidity of movement that allows them to escape detection, and
thus to have lower institutionalization rates for a given level of criminal activity. However, if this
12 To estimate this model, we randomly dropped 75% of the native born and adjusted the weights accordingly. 13 Age-at-arrival will also systematically vary across cohorts since the people who arrived in earlier cohorts would on average have had to arrive younger in order to still be under 40 and in our sample. Friedberg (1992) shows the importance of age-at-arrival for labor market outcomes. Here, we find substantively similar results if we split the sample between those who arrived as young children (under 12) and those who arrived at older ages.
13
were the case, we would expect that an increase in the immigrant population would increase
crime rates, and Figure 4 shows the opposite.
Another source of misclassification may come from efforts by the Census Bureau to fill
in missing information. If the Bureau is more likely to allocate incorrect data to immigrants than
to the native born, that might affect our results. There is evidence that immigrants are more
likely to have allocated education data than are the native born, for example (Ibarraran and
Lubotsky 2007). In our sample, immigrants are one and a half times as likely as natives to have
any of our variables of interest allocated (22% versus 14%). Of particular concern is that 14% of
our sample immigrants in 2000 have their year of arrival allocated (the rate is under 6% in 1990
and 1980). We have reestimated our model after dropping all observations with any allocated
variables and find qualitatively similar results, though the estimated cohort effects are less
negative.14 From here forward we rely on the full sample for analysis. 15
B. Three Hypotheses
We hypothesize three types of causes of the institutionalization patterns documented
above: deportation, deterrence, and selection. Changes in the policies toward criminals during
the 1980s and 1990s, toward criminal noncitizens in particular in the 1990s, and toward those
who were likely to be less successful in the labor market in the 1980s and 1990s may have
14 Results available upon request. 15 We also examined how sensitive the results are to the choice of where to evaluate the marginal effects. The non-linear nature of the logit means that the marginal effects may differ, depending on where along the function they are calculated. Appendix Table 2 presents estimates analogous to those in Table 3 evaluated for a 25-year-old Hispanic with a high school degree. The estimates are qualitatively similar to those in Table 3—namely, that the more recent cohorts have lower institutionalization rates than earlier cohorts, and that there is no evidence that immigrants are assimilating toward the higher institutionalization rates of the native born with time in the country. However, the marginal effects are nearly twice as large, suggesting even lower institutionalization rates for immigrants. Note that when we evaluate at the mean of the sample, we are comparing immigrants to the average native, who has an ever-higher education level. When we evaluate the results for a 25-year-old Hispanic with a high school degree, we are comparing institutionalization rates for immigrants and natives with those characteristics. We continue with the more conservative estimate, evaluating the logits at the sample mean, but we note that our comparisons are much larger when we evaluate at the average characteristics for immigrants.
14
operated through all three mechanisms to dramatically reduce incarceration rates among
immigrants by 2000. Penalties for criminal activity tightened in the 1980s and 1990s (Travis
2005). The Violent Crime Act of 1994 and the Anti-Terrorism and Effective Death Penalty Act
of 1996 expanded the list of crimes for which noncitizen immigrants can be deported (Legomsky
1999), and applied this change retroactively to noncitizen immigrants. This greater emphasis on
deportation may have mechanically decreased the probability that a criminal alien would be
incarcerated. Because noncitizens must complete their sentences before being deported, the
higher probability of deportation acts as an additional punishment. The increase in punishment
may have deterred some immigrants from committing crimes in the U.S.
The Personal Responsibility and Work Reconciliation Act of 1996 (welfare reform) also
made it more difficult for noncitizens to receive welfare benefits.16 This, combined with the
added punishment for criminal noncitizens, may have given immigrants with poor social
outcomes an incentive to naturalize to obtain the protection citizenship provides.17 Anecdotes at
the time suggested that immigrants were lining up to apply for citizenship as the atmosphere
changed in the mid-1990s.
Alternatively, these policy changes, coupled with economic conditions attractive to high-
skilled immigrants, may have undercut the attraction of the U.S. to potential immigrants likely to
interact with the criminal justice or welfare systems. Thus, these policy changes may have had a
deterrent effect on the intensive margin, changing the behavior of immigrants already in the U.S.,
16 As originally passed, the welfare reform bill barred non-naturalized immigrants from receipt of most forms of welfare; as revised, only immigrants who arrived after the law are subject to the ban. States had the option to use state funds to extend benefits to immigrants left out of the federal statute. Many, especially those with large immigrant populations chose to do so. 17 In general, the better-off immigrants become citizens. Fix et al. (2003) reports that immigrants with the least English language proficiency, lower education, and lower incomes are less likely to become naturalized citizens.
15
and on the extensive margin, changing the pool of self-selected immigrants to a less criminally
active one.
Changes in policies toward criminals, immigrants, and criminal immigrants during the
1980s and 1990s may have operated through all three of these mechanisms: deportation,
deterrence, and selection. Although the mechanisms are not mutually exclusive, they generate
testable implications that allow distinctions among them.
Results
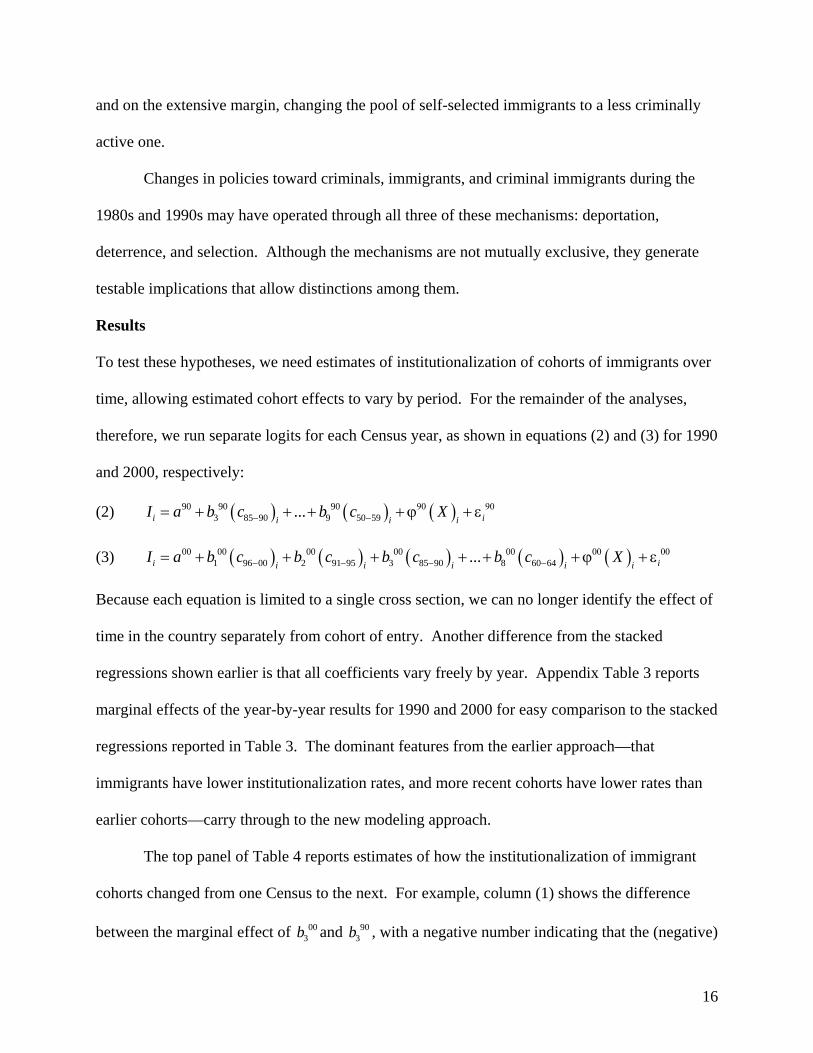
To test these hypotheses, we need estimates of institutionalization of cohorts of immigrants over
time, allowing estimated cohort effects to vary by period. For the remainder of the analyses,
therefore, we run separate logits for each Census year, as shown in equations (2) and (3) for 1990
and 2000, respectively:
(2) ( ) ( ) ( )90 90 903 85 90 9 50 59...i ii i
I a b c b c Xi
90 9− −= + + + +ϕ + ε 0
(3) ( ) ( ) ( ) ( ) ( )00 00 00 00 001 96 00 2 91 95 3 85 90 8 60 64...i ii i i i i
I a b c b c b c b c X00 00− − − −= + + + + + +ϕ + ε
Because each equation is limited to a single cross section, we can no longer identify the effect of
time in the country separately from cohort of entry. Another difference from the stacked
regressions shown earlier is that all coefficients vary freely by year. Appendix Table 3 reports
marginal effects of the year-by-year results for 1990 and 2000 for easy comparison to the stacked
regressions reported in Table 3. The dominant features from the earlier approach—that
immigrants have lower institutionalization rates, and more recent cohorts have lower rates than
earlier cohorts—carry through to the new modeling approach.
The top panel of Table 4 reports estimates of how the institutionalization of immigrant
cohorts changed from one Census to the next. For example, column (1) shows the difference
between the marginal effect of and , with a negative number indicating that the (negative) 003b 90
3b
16
gap between that immigrant cohort and the native born widened. That is, the first entry in the
table means that the gap between the institutionalization of the cohort arriving between 1985 and
1990 and natives grew more negative by 0.0074 between 1990 and 2000. This represents an
enormous shift compared with the base institutionalization rate among natives in 1990 (0.022),
or among that immigrant cohort in 1990 (0.007).
The rest of the columns in the table contain the results of adding further control variables.
As in the earlier table, column (1) controls only for age, column (2) adds education controls,
column (3) adds race and ethnicity, and column (4) adds citizenship to all the previous controls.
Between 1990 and 2000, all the cohorts decreased their relative institutionalization rates,
regardless of which controls are included. For example, these estimates suggest a 0.36–0.86-
percentage-point decline in relative institutionalization for the 1985–1990 and 1980–1984
cohorts between 1990 and 2000. Between 1980 and 1990, the 1975–1979 and 1970–1974
cohorts decreased their relative institutionalization rates once education is included in the
controls. Immigrants appear to have improved relative to natives with time in the country, and
this improvement was greater from 1990 to 2000 than it was from 1980 to 1990.
These results are consistent with a mechanical decrease in the institutionalized population
of immigrants due to deportation, which would have had a bigger effect from 1990 to 2000 than
from 1980 to 1990. However, the results are also consistent with a deterrent effect due to
increased penalties for criminal activity that either selects immigrants with lower criminality or
to which immigrants are more responsive than the average native. We examine each of these
explanations for the cohort pattern in our results in turn.
17
A. Deportation
First, we consider the mechanical effect of deportation on incarceration. The number of
immigrants deported (both voluntary departures and formal removals) rose over the three
decades we examine. From 1971 to 1980, about 7.5 million immigrants were expelled (Yearbook
of Immigration Statistics 2002); from 1981 to 1990, about 10.2 million immigrants were
expelled; and from 1991 to 2000, about 14.5 million immigrants were expelled (Immigration
Statistics Reports 2002).18 Among those deported, not simply excluded, the most common
administrative reasons given during the 1990s were “attempted entry without proper documents”
(35%) and “criminal activity” (31%).
This increase in deportation might be expected to decrease immigrants’ relative
institutionalization rates.19 However, the countervailing effects of this policy may increase the
probability that an immigrant will be institutionalized. First, the Anti-Terrorism and Effective
Death Penalty Act increased the list of criminal acts for which noncitizens must be detained.
Legomsky (1999) reports that “mandatory detention now applies to almost all noncitizens who
are inadmissible or deportable on crime-related grounds—not just to those convicted of
aggravated felonies (p. 532).” Second, the speed of removal of deportable aliens may critically
affect immigrants’ institutionalization rates. Shuck and Williams (1999) estimate that the
Immigration and Naturalization Service (INS) had removed “fewer than twenty percent of the
nearly 300,000 criminal aliens estimated to be already under law enforcement supervision.”
18 The vast majority of these expulsions are voluntary departures. For example, from 1991 to 2000, only 939,749 of the expulsions were formal removals. 19 Note that because immigrants serve their sentences and then are deported, deportation should not decrease incarceration probabilities for a given offence, but only for subsequent offences, since immigrants would no longer be in the country to commit these offences. However, even that may be in doubt. A recent New York Times investigation reported that city sanctuary policies, such as the one in Los Angeles that prohibits police from inquiring about immigration status unless there is a formal charge of a crime, mean that those who have been deported can frequently return to the U.S. and resume their lives (LeDuff 2005).
18
Butcher and Piehl (2000) showed that immigrants under a deportation order spent more time
incarcerated for a given sentence than similar natives—perhaps because backlogs in the system
meant that immigrants awaiting deportation waited in prison until the INS could clear their cases.
These effects would tend to inflate immigrants’ relative incarceration rates.
We would like to know the extent to which the added emphasis on deportation in the
1990s influenced estimated institutionalization rates of immigrants. Secondary sources on the
number of immigrants deported are of little use because although deportation increased, so did
the population of immigrants. Thus, we take a different approach, beginning with the fact that
naturalized citizens are not subject to deportation. If growing deportation of criminal aliens
represents an important risk to immigrants, we would expect to see differences in the
institutionalization of citizen and noncitizen immigrants in the 2000 Census, as the mechanical
impact of increasing deportation must occur for all the noncitizens. We use the sample of
citizens (native born and naturalized) to examine how institutionalization patterns changed over
time for immigrants who are not subject to the greater threat of deportation from legislation
enacted in the 1990s.
The second panel in Table 4 shows the results of this exercise. Here we see that the
decline in relative institutionalization rates is at least as large for immigrants who cannot be
deported as for immigrants overall. Thus, the decline in the relative institutionalization rates in
the top panel of Table 4 cannot all be driven by deportation.
This test is predicated on the assumption that a great shift in naturalization over this
period did not occur. If immigrants who were criminally active became more likely to naturalize,
then this could inflate the relative incarceration rates of citizen immigrants. Because the relative
incarceration rates for naturalized citizens fell by more than for immigrants as a whole, this
19
seems unlikely. However, we examined rates of naturalization directly to see whether the policy
changes in the 1990s that would seem to give immigrants an incentive to naturalize had a
detectable effect. Table 1 shows the fraction of immigrants who are citizens in each cohort. Not
surprisingly, the fraction citizen is higher in earlier cohorts. However, the probability of
naturalizing for a cohort with a given number of years in the U.S. did not rise between 1990 and
2000. For example, 7% of immigrants who had been in the country for less than 5 years in 1990
were citizens; in 2000, 4% of recent arrivals were citizens. This pattern holds up when we run
logit models that control for changes in immigrant characteristics as well.20
B. Deterrence
The 1980s and 1990s saw the adoption of many policies that increased criminal penalties
and thus had the potential to deter criminal activity of both immigrants and the native born. If
migration selects individuals who are particularly responsive to incentives, we might see more of
a deterrent effect for this group than for the native born, on average. If immigrants are
responding to this general deterrence, we would expect to see naturalized citizens reducing their
incarceration probabilities as well, not simply noncitizens who face the increased threat of
deportation. As we saw in the second panel of Table 4, naturalized citizens reduced their
incarceration rates relative to the native born. The effect is larger than for immigrants overall,
suggesting immigrants are responding to a deterrent effect from the general increase in
punishment, rather than to the specific threat of deportation.
If migration selects individuals who are particularly responsive to incentives, we would
further expect that, just like immigrants, native-born migrants -- defined as those who live
20 Available upon request.
20
outside their state of birth21 -- would have reduced their incarceration probabilities over time as
well.22 This is, in fact, what happened. In 1980, native-born movers were 0.04 percent less
likely than nonmovers to be institutionalized. By 1990, this difference had risen to 0.2%, and by
2000 to 0.3%.23
Native-born movers and immigrants appear to have responded to the harsher criminal
penalties in the 1980s and 1990s. The bottom panel of Table 4 compares immigrants to native-
born movers, and shows that the decline in immigrants’ relative institutionalization rates is much
smaller here. This suggests a general deterrence effect, with both immigrants and native-born
movers responding to the incentives of new policies toward criminals in similar ways.
C. Changes in Immigrant Selection
Changes in the legal, economic, and social environment during the 1980s and 1990s may
have affected the type of immigrant who self-selects to come to the United States.24 The laws
increasing penalties for criminal aliens passed in 1994 and 1996, so we would expect the biggest
impact for the cohort arriving between 1996 and 2000. To see whether selection has changed
over time, we compare the cohorts who arrived just before the 2000 Census to the outcomes of
cohorts who had been in the country a comparable amount of time in previous Censuses. With
this strategy, we will see whether the most recent immigrants in 2000 appear more positively
21 This measure is somewhat problematic since one reason a person may live outside his state of birth is if he is sent to a federal prison in another state. This would tend to increase the institutionalization rates of native born movers. This bias is likely to be small, however, as federal prisoners are a small fraction of all prisoners. 22 Butcher (1994) compared labor market outcomes for immigrant and native-born blacks, finding that immigrant blacks had better labor market outcomes than the native-born. However, when the native-born who had moved from their state of birth were used as the comparison group, outcomes were very similar, suggesting that movers, whether native-born or immigrant, are similar. 23 These results come from logits controlling for a full set of age dummies, available upon request. Once education is controlled, native movers have higher institutionalization rates than nonmovers. 24 Welfare reform and changes in the labor market in the 1990s may also have contributed to the changes in the type of immigrant who came to the U.S. in the 1990s.
21
selected (conditional on various sets of controls) relative to natives than earlier cohorts, holding
constant the time exposed to the U.S. criminal justice system.
Table 5 shows the change in relative institutionalization rates, holding time in the U.S.
constant, for the two most recent arrival cohorts. The numbers in the top panel of Table 5 are
calculated by subtracting the marginal effects in equations 2 and 3, , for example.00 901 3b b− 25
This comparison limits the bias that may arise from selective return migration—the most
recently arrived cohorts will not have lost as many return migrants as those who have been in the
U.S. longer. The results show that the most recently arrived cohort in 2000 was 1.1 percentage
points less likely to be institutionalized than the most recently arrived cohort was in 1990
(column 1, top panel). The fact that the results are similar when we limit the sample to citizens
again suggests that increased deportation is not mechanically driving this result.
Although the evidence in Table 5 suggests that the type of immigrant who came to the
U.S. was changing over these decades toward those who were less crime-prone, there is less
evidence for a specific effect of the legislation passed in the mid 1990s. For example, the
decrease in the relative incarceration rate is as big for the cohort arriving 5–10 years ago as for
those with fewer than 5 years in the U.S.26
The comparison to native-born movers, as before, shows changes that are smaller in
magnitude, because native-born movers have lower incarceration rates than the rest of the native
born. Again, there does not appear to be a particularly large effect for the cohort of immigrants
whose decision should have been most affected by the harsher environment toward noncitizens
in the U.S. beginning in the mid-1990s.
25 See Appendix Table 3 for the marginal effects from which these numbers are calculated. 26 The change in the gap is similar for those arriving 10 to 15 years before each Census. The comparison is not shown here, but may be calculated from Appendix Table 3.
22
It is quite possible that those who arrived most recently are most likely to be
undocumented, giving them the greatest incentive to avoid contact with law enforcement for
even minor offenses, as such contact is likely to increase the likelihood that their illegal status is
revealed. It is not possible to distinguish the documented from undocumented in the Census in
order to test for such an effect. Moreover, it is likely that the most recently arrived in 2000 are
even more likely to be undocumented than the recent arrivals in 1990 were, given the large flows
of immigrants in the 1990s and the possibility that the Immigration Reform and Control Act
(IRCA) amnesty may have allowed those who arrived in the late 1980s to adjust their status. If
this is the case, then it offers another potential explanation for the particularly good outcomes of
the recent arrivals in 2000.
Robustness
Finally, we assess the sensitivity of the substantive conclusions to the choice of the
reference group. Over the study period, the incarceration of natives greatly increased, but this
increase was not shared evenly across demographic groups. Because the analysis emphasizes
changes, it might be particularly important to have a comparison group that is comparable in
levels in the pre period.
Limiting the reference native population to those with lower incarceration rates leads,
naturally, to a reduction in the extent to which immigrants get relatively better over time.
However, the magnitudes are not much smaller than those in the main models when the
specifications include control variables. For example, restricting the native reference group to
the racial/ethnic group with the lowest institutionalization rate, white non-Hispanics, yields no
change in the qualitative conclusions.
23
Alternatively, it is possible that a better estimate would result from limiting both groups
to provide a more homogeneous comparison. Limiting both groups to dropouts, again the
original results carry through. In contrast to the above robustness check, in this case the
differences in levels within Census are huge. But just as above, once we turn to the changes over
time, shifting the base group does not change the qualitative conclusions of this paper.
Conclusion
Using the 1980, 1990, and 2000 Censuses, we show that 18-40 year-old male immigrants
have lower institutionalization rates than the native born in each year. The gap in these
institutionalization rates widens over the decades, and by 2000 immigrants have
institutionalization rates that are one-fifth those of the native born.
The fact that immigrants have lower relative incarceration rates in 2000 than in earlier
years may be due to several factors. Legislation passed in the 1980s and 1990s raised penalties
for criminal activity; and legislation passed in the 1990s increased penalties for criminal
noncitizens in particular. The 1990s legislation may have increased the probability that
immigrants are deported for their crimes, thus mechanically lowering their incarceration rates.
Alternatively, immigrants’ criminal behavior may have changed in response to the general
deterrence from increased criminal penalties. Or, the type of person choosing to immigrate to
the U.S. may have changed in response to these general increases in penalties for criminal
activity, or in response to the specific penalties (deportation after serving one’s sentence) that
apply to noncitizens. We exploit the fact that some of these effects will pertain for some groups
and not others to distinguish among these explanations.
We find that deportation is not driving the decline in relative institutionalization rates of
immigrants, because naturalized citizens, who are not subject to deportation, also reduced their
24
relative institutionalization rates. There is evidence that the process of migration selects
individuals who have lower criminal propensity or are more responsive to deterrent effects than
the average native. Similar to the foreign born, the native born who live outside their state of
birth also reduced their relative institutionalization rates over time. Immigrants who were
already in the country reduced their relative institutionalization probability over the decades; and
the newly arrived immigrants in the 1980s and 1990s seem to be particularly unlikely to be
involved in criminal activity, consistent with increasingly positive selection along this
dimension. However, we find little evidence of a dramatic change in the 1996–2000 cohort, the
only cohort for which the decision to migrate may have been affected by the increased penalties
specific to criminal aliens.
25
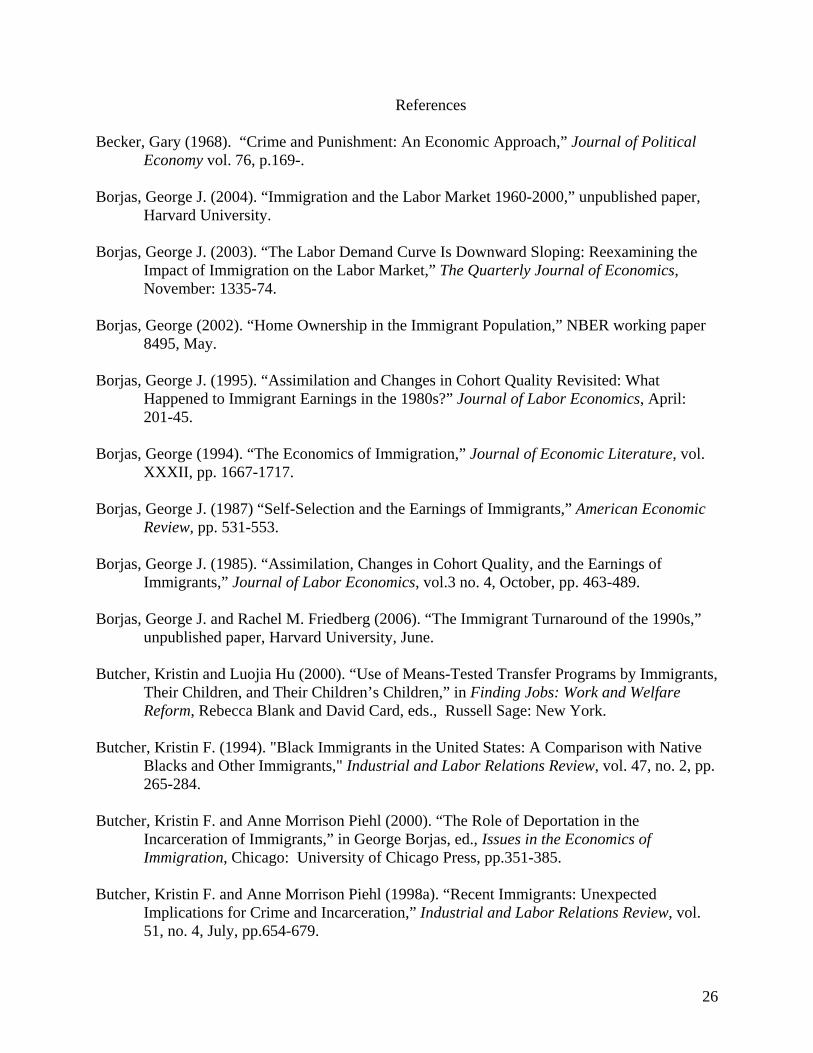
References
Becker, Gary (1968). “Crime and Punishment: An Economic Approach,” Journal of Political Economy vol. 76, p.169-.
Borjas, George J. (2004). “Immigration and the Labor Market 1960-2000,” unpublished paper,
Harvard University. Borjas, George J. (2003). “The Labor Demand Curve Is Downward Sloping: Reexamining the
Impact of Immigration on the Labor Market,” The Quarterly Journal of Economics, November: 1335-74.
Borjas, George (2002). “Home Ownership in the Immigrant Population,” NBER working paper
8495, May. Borjas, George J. (1995). “Assimilation and Changes in Cohort Quality Revisited: What
Happened to Immigrant Earnings in the 1980s?” Journal of Labor Economics, April: 201-45.
Borjas, George (1994). “The Economics of Immigration,” Journal of Economic Literature, vol.
XXXII, pp. 1667-1717. Borjas, George J. (1987) “Self-Selection and the Earnings of Immigrants,” American Economic
Review, pp. 531-553. Borjas, George J. (1985). “Assimilation, Changes in Cohort Quality, and the Earnings of
Immigrants,” Journal of Labor Economics, vol.3 no. 4, October, pp. 463-489. Borjas, George J. and Rachel M. Friedberg (2006). “The Immigrant Turnaround of the 1990s,”
unpublished paper, Harvard University, June. Butcher, Kristin and Luojia Hu (2000). “Use of Means-Tested Transfer Programs by Immigrants,
Their Children, and Their Children’s Children,” in Finding Jobs: Work and Welfare Reform, Rebecca Blank and David Card, eds., Russell Sage: New York.
Butcher, Kristin F. (1994). "Black Immigrants in the United States: A Comparison with Native
Blacks and Other Immigrants," Industrial and Labor Relations Review, vol. 47, no. 2, pp. 265-284.
Butcher, Kristin F. and Anne Morrison Piehl (2000). “The Role of Deportation in the
Incarceration of Immigrants,” in George Borjas, ed., Issues in the Economics of Immigration, Chicago: University of Chicago Press, pp.351-385.
Butcher, Kristin F. and Anne Morrison Piehl (1998a). “Recent Immigrants: Unexpected
Implications for Crime and Incarceration,” Industrial and Labor Relations Review, vol. 51, no. 4, July, pp.654-679.
26
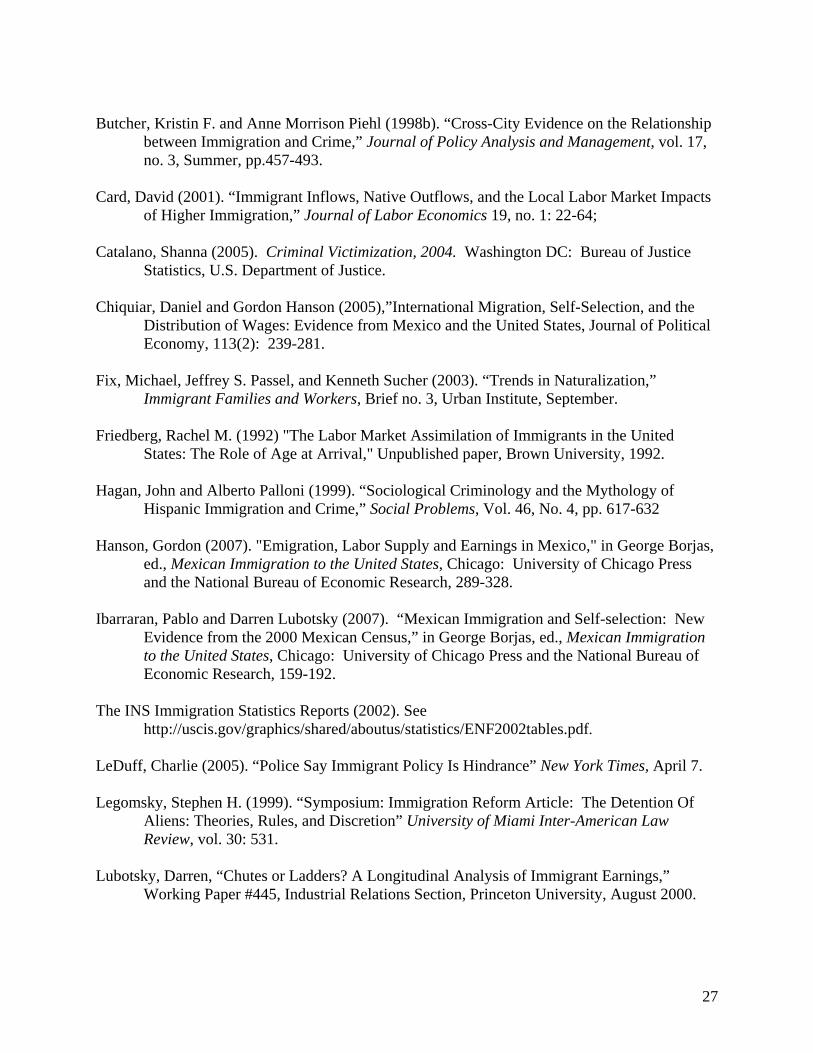
Butcher, Kristin F. and Anne Morrison Piehl (1998b). “Cross-City Evidence on the Relationship
between Immigration and Crime,” Journal of Policy Analysis and Management, vol. 17, no. 3, Summer, pp.457-493.
Card, David (2001). “Immigrant Inflows, Native Outflows, and the Local Labor Market Impacts
of Higher Immigration,” Journal of Labor Economics 19, no. 1: 22-64; Catalano, Shanna (2005). Criminal Victimization, 2004. Washington DC: Bureau of Justice
Statistics, U.S. Department of Justice. Chiquiar, Daniel and Gordon Hanson (2005),”International Migration, Self-Selection, and the
Distribution of Wages: Evidence from Mexico and the United States, Journal of Political Economy, 113(2): 239-281.
Fix, Michael, Jeffrey S. Passel, and Kenneth Sucher (2003). “Trends in Naturalization,”
Immigrant Families and Workers, Brief no. 3, Urban Institute, September. Friedberg, Rachel M. (1992) "The Labor Market Assimilation of Immigrants in the United
States: The Role of Age at Arrival," Unpublished paper, Brown University, 1992. Hagan, John and Alberto Palloni (1999). “Sociological Criminology and the Mythology of
Hispanic Immigration and Crime,” Social Problems, Vol. 46, No. 4, pp. 617-632 Hanson, Gordon (2007). "Emigration, Labor Supply and Earnings in Mexico," in George Borjas,
ed., Mexican Immigration to the United States, Chicago: University of Chicago Press and the National Bureau of Economic Research, 289-328.
Ibarraran, Pablo and Darren Lubotsky (2007). “Mexican Immigration and Self-selection: New
Evidence from the 2000 Mexican Census,” in George Borjas, ed., Mexican Immigration to the United States, Chicago: University of Chicago Press and the National Bureau of Economic Research, 159-192.
The INS Immigration Statistics Reports (2002). See
http://uscis.gov/graphics/shared/aboutus/statistics/ENF2002tables.pdf. LeDuff, Charlie (2005). “Police Say Immigrant Policy Is Hindrance” New York Times, April 7. Legomsky, Stephen H. (1999). “Symposium: Immigration Reform Article: The Detention Of
Aliens: Theories, Rules, and Discretion” University of Miami Inter-American Law Review, vol. 30: 531.
Lubotsky, Darren, “Chutes or Ladders? A Longitudinal Analysis of Immigrant Earnings,”
Working Paper #445, Industrial Relations Section, Princeton University, August 2000.
27

Martinez, Ramiro and Richard Rosenfeld (2001). “Does Immigration Increase Homicide? Negative Evidence from Three Border Cities” Sociological Quarterly, vol. 42: 559-.
Mears, Daniel P. (2002). “Immigration and Crime: What’s the Connection?” Federal
Sentencing Reporter, vol. 14, no. 5: 284-88. Osili, Una and Anna Paulson (2004a). “Institutional Quality and Financial Market Development:
Evidence from International Migrants in the U.S.,” Federal Reserve Bank of Chicago working paper number 2004-19.
Osili, Una and Anna Paulson (2004b). “Prospects for Immigrant-Native Wealth Assimilation:
Evidence from Financial Market Participation,” Federal Reserve Bank of Chicago working paper number 2004-18.
Robinson, J. Gregory, Arjun Adlakha, and Kristen K. West (2002). “Coverage of Population in
Census 2000: Results from Demographic Analysis,” mimeo, prepared for the 2002 Annual Meeting of the Population Association of America.
Roy, A. (1951). “Some Thoughts on the Distribution of Earnings,” Oxford Economic Papers,
vol. 3, pp.135-146. Schuck, Peter A. (1997). “INS Detention and Removal: A White Paper,” Georgetown
Immigration Law Journal, vol. 11: 667. Schuck, Peter A. and John Williams (1999). “Removing Criminal Aliens: The Pitfalls and
Promises o Federalism” Harvard Journal of Law & Public Policy, vol. 22: 367-. Travis, Jeremy (2005). But They All Come Back: Facing the Challenges of Prisoner Reentry,
Washington DC: Urban Institute Press. Yearbook of Immigration Statistics (Fiscal Year 2002). See
http://uscis.gov/graphics/shared/aboutus/statitstics/ENF2002list.htm.
28
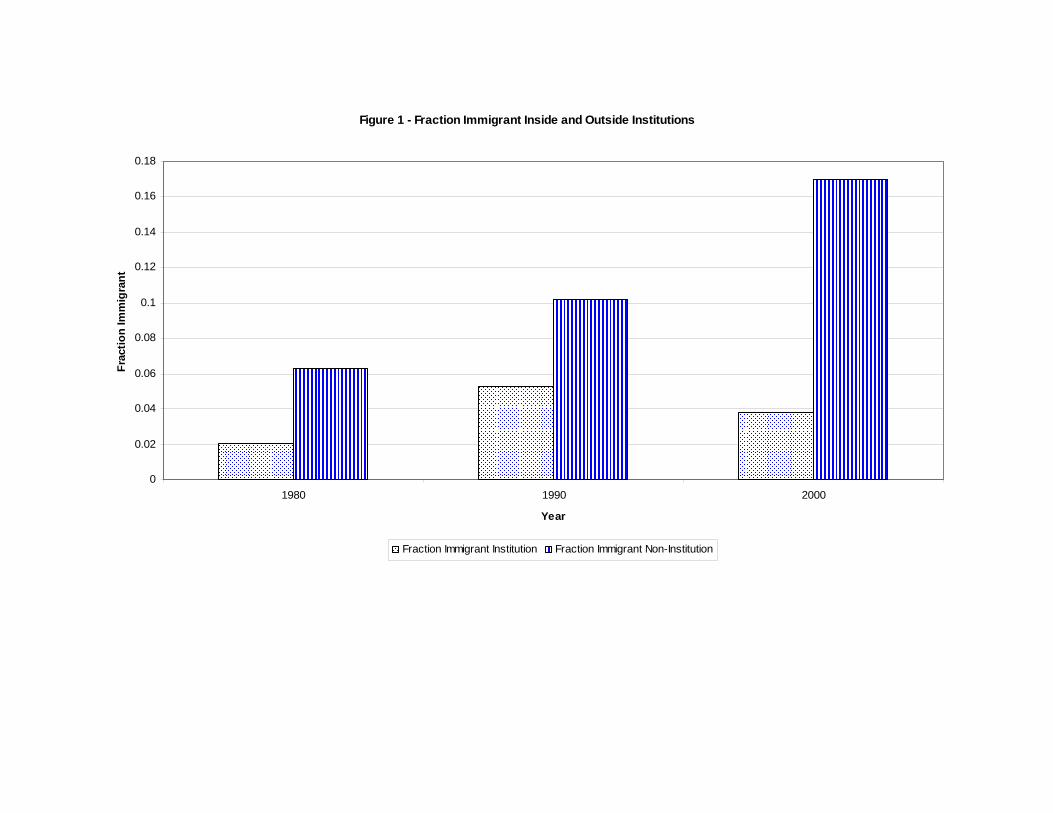
Figure 1 - Fraction Immigrant Inside and Outside Institutions
0
0.02
0.04
0.06
0.08
0.1
0.12
0.14
0.16
0.18
1980 1990 2000
Year
Frac
tion
Imm
igra
nt
Fraction Immigrant Institution Fraction Immigrant Non-Institution
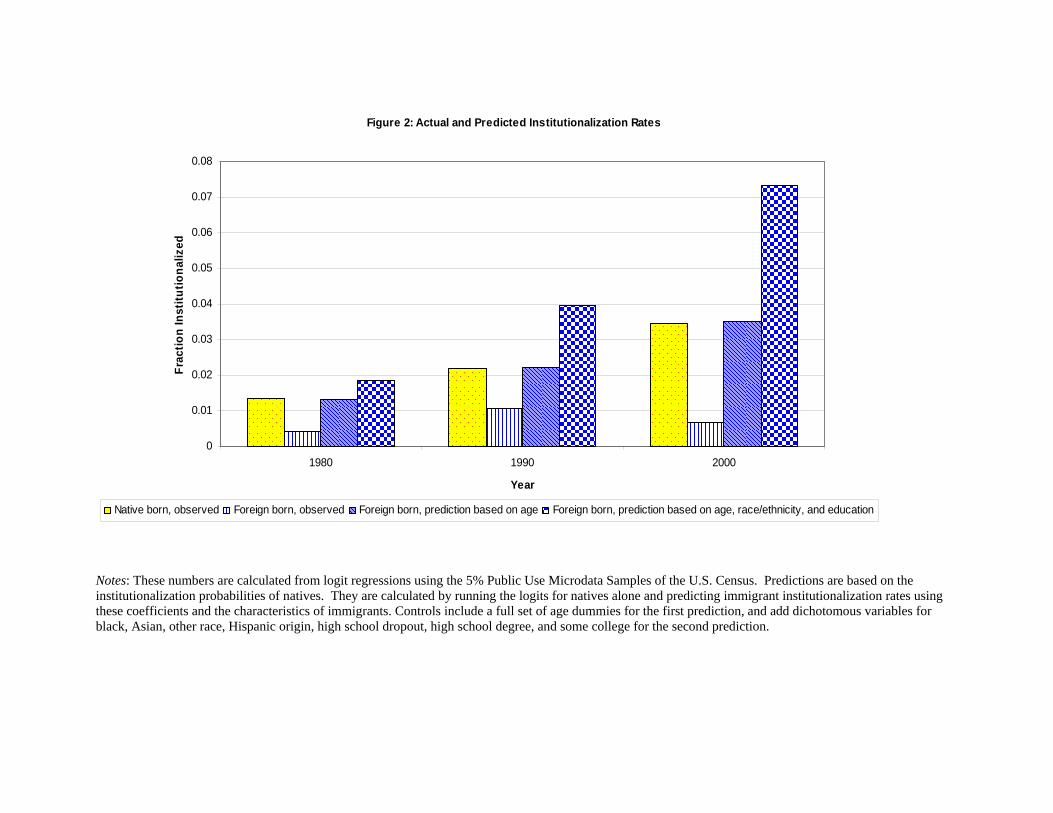
Figure 2: Actual and Predicted Institutionalization Rates
0
0.01
0.02
0.03
0.04
0.05
0.06
0.07
0.08
1980 1990 2000
Year
Frac
tion
Inst
itutio
naliz
ed
Native born, observed Foreign born, observed Foreign born, prediction based on age Foreign born, prediction based on age, race/ethnicity, and education
Notes: These numbers are calculated from logit regressions using the 5% Public Use Microdata Samples of the U.S. Census. Predictions are based on the institutionalization probabilities of natives. They are calculated by running the logits for natives alone and predicting immigrant institutionalization rates using these coefficients and the characteristics of immigrants. Controls include a full set of age dummies for the first prediction, and add dichotomous variables for black, Asian, other race, Hispanic origin, high school dropout, high school degree, and some college for the second prediction.
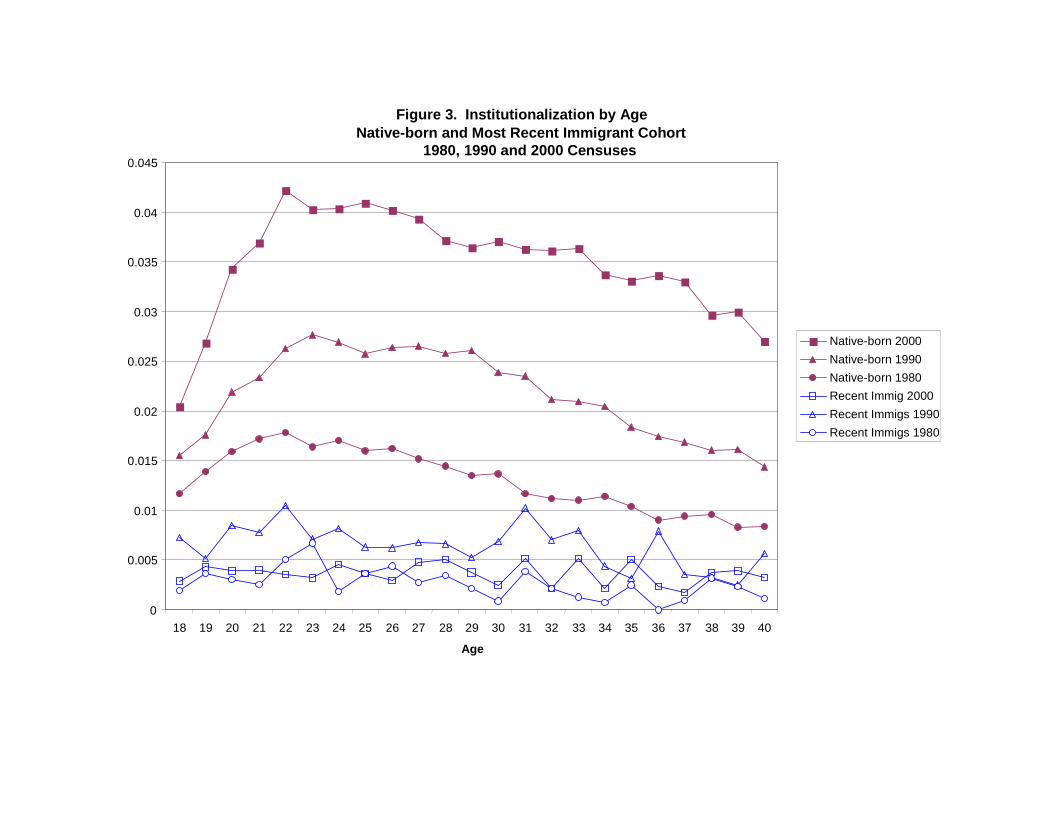
Figure 3. Institutionalization by Age Native-born and Most Recent Immigrant Cohort
1980, 1990 and 2000 Censuses
0
0.005
0.01
0.015
0.02
0.025
0.03
0.035
0.04
0.045
18 19 20 21 22 23 24 25 26 27 28 29 30 31 32 33 34 35 36 37 38 39 40
Age
Native-born 2000Native-born 1990Native-born 1980Recent Immig 2000Recent Immigs 1990Recent Immigs 1980
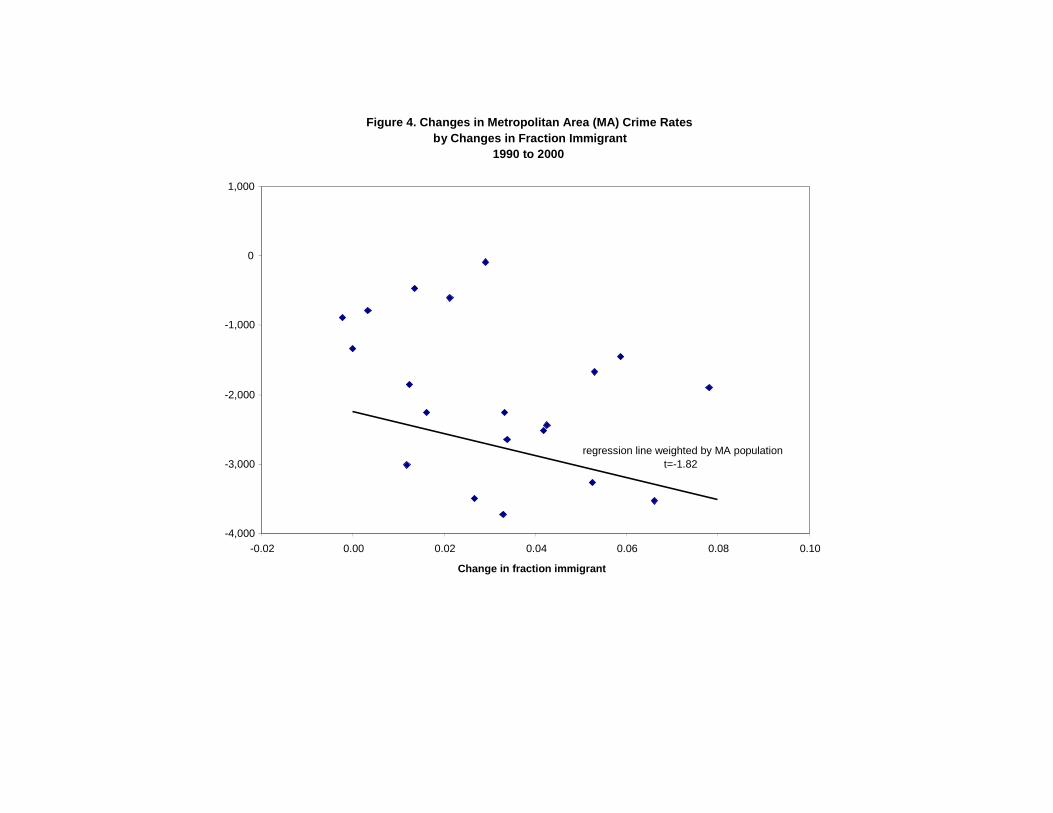
Figure 4. Changes in Metropolitan Area (MA) Crime Rates
by Changes in Fraction Immigrant 1990 to 2000
-4,000
-3,000
-2,000
-1,000
0
1,000
-0.02 0.00 0.02 0.04 0.06 0.08 0.10
Change in fraction immigrant
regression line weighted by MA populationt=-1.82
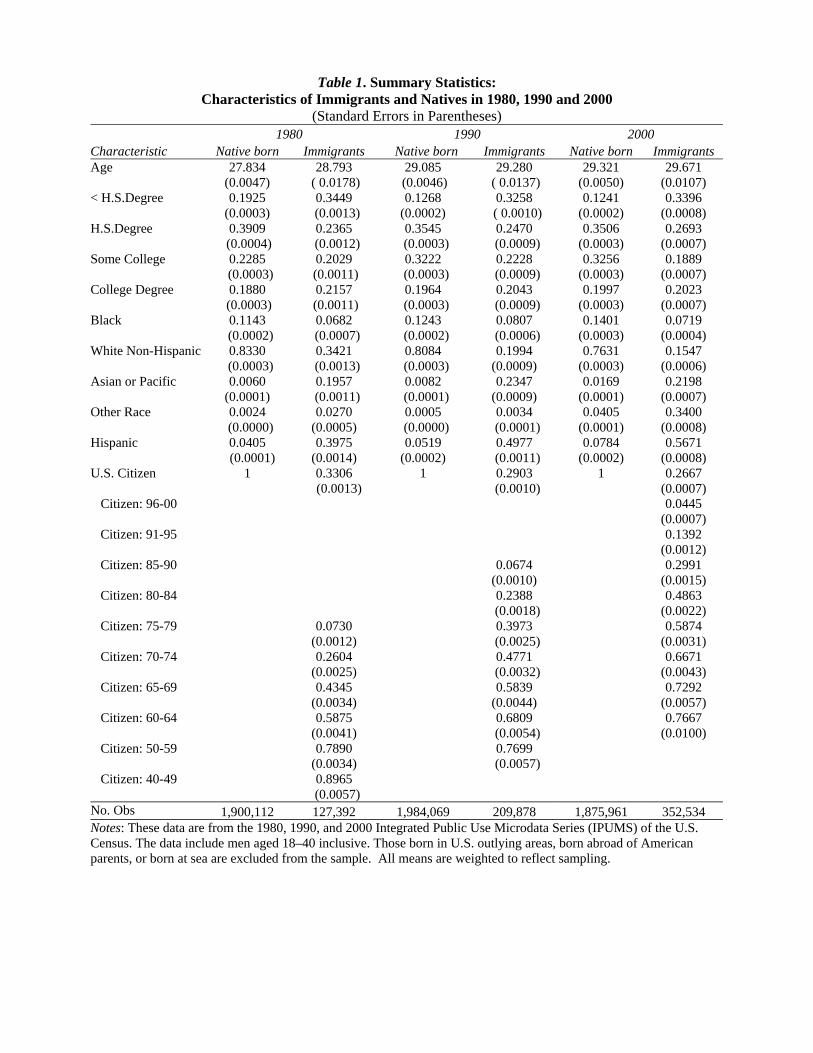
Table 1. Summary Statistics: Characteristics of Immigrants and Natives in 1980, 1990 and 2000
(Standard Errors in Parentheses) 1980 1990 2000 Characteristic Native born Immigrants Native born Immigrants Native born Immigrants Age 27.834
(0.0047) 28.793
( 0.0178) 29.085
(0.0046) 29.280
( 0.0137) 29.321
(0.0050) 29.671
(0.0107) < H.S.Degree 0.1925
(0.0003) 0.3449
(0.0013) 0.1268
(0.0002) 0.3258
( 0.0010) 0.1241
(0.0002) 0.3396
(0.0008) H.S.Degree 0.3909
(0.0004) 0.2365
(0.0012) 0.3545
(0.0003) 0.2470
(0.0009) 0.3506
(0.0003) 0.2693
(0.0007) Some College 0.2285
(0.0003) 0.2029
(0.0011) 0.3222
(0.0003) 0.2228
(0.0009) 0.3256
(0.0003) 0.1889
(0.0007) College Degree 0.1880
(0.0003) 0.2157
(0.0011) 0.1964
(0.0003) 0.2043
(0.0009) 0.1997
(0.0003) 0.2023
(0.0007) Black 0.1143
(0.0002) 0.0682
(0.0007) 0.1243
(0.0002) 0.0807
(0.0006) 0.1401
(0.0003) 0.0719
(0.0004) White Non-Hispanic 0.8330
(0.0003) 0.3421
(0.0013) 0.8084
(0.0003) 0.1994
(0.0009) 0.7631
(0.0003) 0.1547
(0.0006) Asian or Pacific 0.0060
(0.0001) 0.1957
(0.0011) 0.0082
(0.0001) 0.2347
(0.0009) 0.0169
(0.0001) 0.2198
(0.0007) Other Race 0.0024
(0.0000) 0.0270
(0.0005) 0.0005
(0.0000) 0.0034
(0.0001) 0.0405
(0.0001) 0.3400
(0.0008) Hispanic 0.0405
(0.0001) 0.3975
(0.0014) 0.0519
(0.0002) 0.4977
(0.0011) 0.0784
(0.0002) 0.5671
(0.0008) U.S. Citizen 1
0.3306
(0.0013) 1
0.2903 (0.0010)
1
0.2667 (0.0007)
Citizen: 96-00
0.0445 (0.0007)
Citizen: 91-95
0.1392 (0.0012)
Citizen: 85-90
0.0674 (0.0010)
0.2991 (0.0015)
Citizen: 80-84
0.2388 (0.0018)
0.4863 (0.0022)
Citizen: 75-79
0.0730 (0.0012)
0.3973 (0.0025)
0.5874 (0.0031)
Citizen: 70-74
0.2604 (0.0025)
0.4771 (0.0032)
0.6671 (0.0043)
Citizen: 65-69
0.4345 (0.0034)
0.5839 (0.0044)
0.7292 (0.0057)
Citizen: 60-64
0.5875 (0.0041)
0.6809 (0.0054)
0.7667 (0.0100)
Citizen: 50-59
0.7890 (0.0034)
0.7699 (0.0057)
Citizen: 40-49
0.8965 (0.0057)
No. Obs 1,900,112 127,392 1,984,069 209,878 1,875,961 352,534 Notes: These data are from the 1980, 1990, and 2000 Integrated Public Use Microdata Series (IPUMS) of the U.S. Census. The data include men aged 18–40 inclusive. Those born in U.S. outlying areas, born abroad of American parents, or born at sea are excluded from the sample. All means are weighted to reflect sampling.
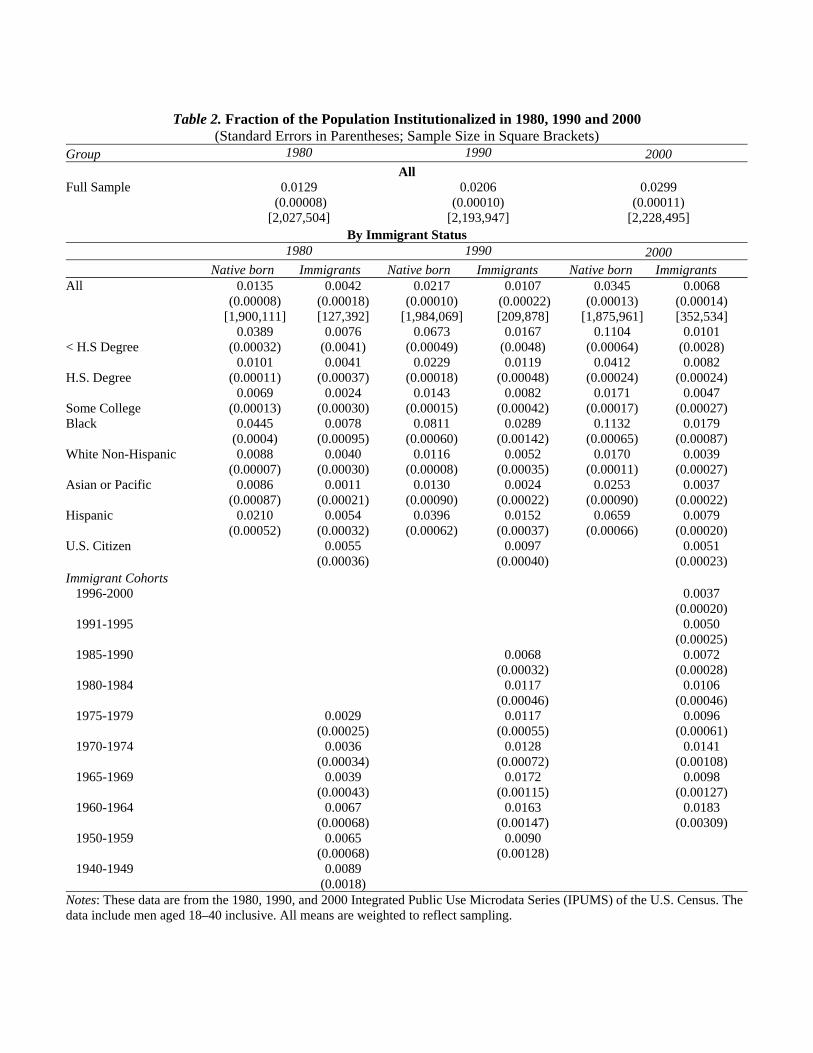
Table 2. Fraction of the Population Institutionalized in 1980, 1990 and 2000 (Standard Errors in Parentheses; Sample Size in Square Brackets)
Group 1980 1990 2000 All
Full Sample
0.0129 (0.00008)
[2,027,504]
0.0206 (0.00010)
[2,193,947]
0.0299 (0.00011)
[2,228,495] By Immigrant Status
1980 1990 2000 Native born Immigrants Native born Immigrants Native born Immigrants All
0.0135 (0.00008)
[1,900,111]
0.0042 (0.00018) [127,392]
0.0217 (0.00010)
[1,984,069]
0.0107 (0.00022) [209,878]
0.0345 (0.00013)
[1,875,961]
0.0068 (0.00014) [352,534]
< H.S Degree 0.0389
(0.00032) 0.0076
(0.0041) 0.0673
(0.00049) 0.0167
(0.0048) 0.1104
(0.00064) 0.0101
(0.0028)
H.S. Degree 0.0101
(0.00011) 0.0041
(0.00037) 0.0229
(0.00018) 0.0119
(0.00048) 0.0412
(0.00024) 0.0082
(0.00024)
Some College 0.0069
(0.00013) 0.0024
(0.00030) 0.0143
(0.00015) 0.0082
(0.00042) 0.0171
(0.00017) 0.0047
(0.00027) Black
0.0445 (0.0004)
0.0078 (0.00095)
0.0811 (0.00060)
0.0289 (0.00142)
0.1132 (0.00065)
0.0179 (0.00087)
White Non-Hispanic
0.0088 (0.00007)
0.0040 (0.00030)
0.0116 (0.00008)
0.0052 (0.00035)
0.0170 (0.00011)
0.0039 (0.00027)
Asian or Pacific 0.0086 (0.00087)
0.0011 (0.00021)
0.0130 (0.00090)
0.0024 (0.00022)
0.0253 (0.00090)
0.0037 (0.00022)
Hispanic
0.0210 (0.00052)
0.0054 (0.00032)
0.0396 (0.00062)
0.0152 (0.00037)
0.0659 (0.00066)
0.0079 (0.00020)
U.S. Citizen
0.0055 (0.00036)
0.0097 (0.00040)
0.0051 (0.00023)
Immigrant Cohorts 1996-2000
0.0037 (0.00020)
1991-1995
0.0050 (0.00025)
1985-1990
0.0068 (0.00032)
0.0072 (0.00028)
1980-1984
0.0117 (0.00046)
0.0106 (0.00046)
1975-1979
0.0029 (0.00025)
0.0117 (0.00055)
0.0096 (0.00061)
1970-1974
0.0036 (0.00034)
0.0128 (0.00072)
0.0141 (0.00108)
1965-1969
0.0039 (0.00043)
0.0172 (0.00115)
0.0098 (0.00127)
1960-1964
0.0067 (0.00068)
0.0163 (0.00147)
0.0183 (0.00309)
1950-1959
0.0065 (0.00068)
0.0090 (0.00128)
1940-1949
0.0089 (0.0018)
Notes: These data are from the 1980, 1990, and 2000 Integrated Public Use Microdata Series (IPUMS) of the U.S. Census. The data include men aged 18–40 inclusive. All means are weighted to reflect sampling.
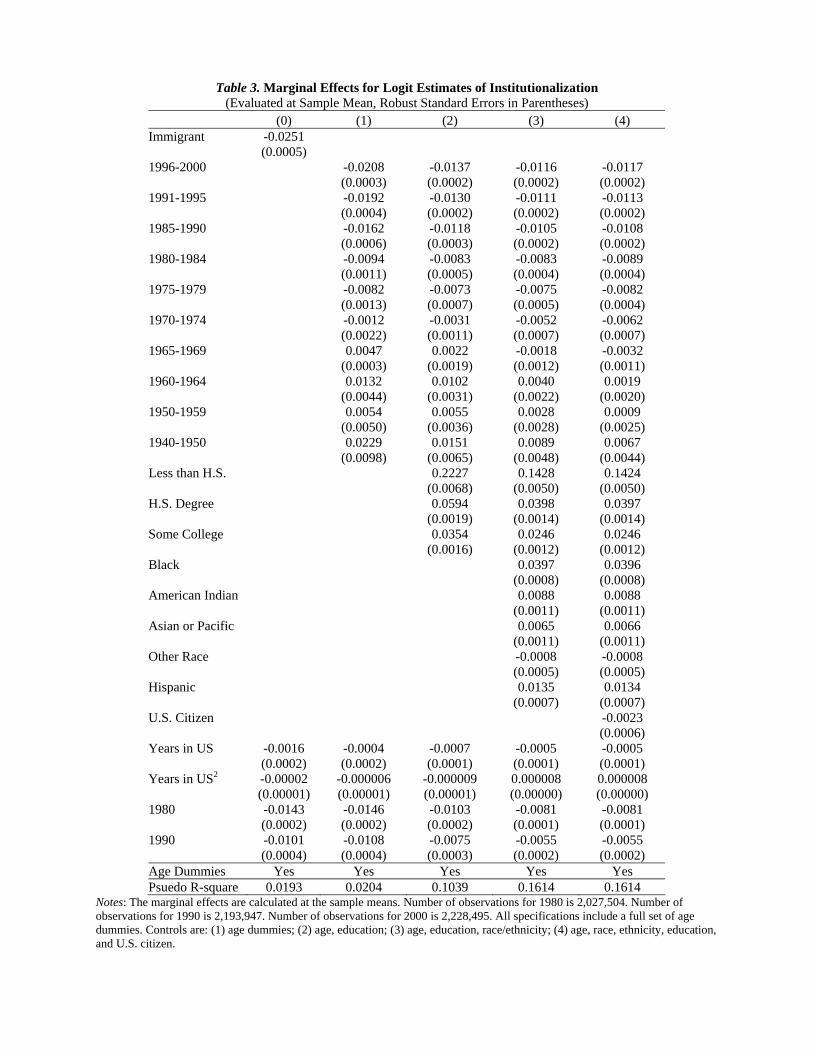
Table 3. Marginal Effects for Logit Estimates of Institutionalization (Evaluated at Sample Mean, Robust Standard Errors in Parentheses)
(0) (1) (2) (3) (4) Immigrant -0.0251 (0.0005) 1996-2000 -0.0208 -0.0137 -0.0116 -0.0117 (0.0003) (0.0002) (0.0002) (0.0002) 1991-1995 -0.0192 -0.0130 -0.0111 -0.0113 (0.0004) (0.0002) (0.0002) (0.0002) 1985-1990 -0.0162 -0.0118 -0.0105 -0.0108 (0.0006) (0.0003) (0.0002) (0.0002) 1980-1984 -0.0094 -0.0083 -0.0083 -0.0089 (0.0011) (0.0005) (0.0004) (0.0004) 1975-1979 -0.0082 -0.0073 -0.0075 -0.0082 (0.0013) (0.0007) (0.0005) (0.0004) 1970-1974 -0.0012 -0.0031 -0.0052 -0.0062 (0.0022) (0.0011) (0.0007) (0.0007) 1965-1969 0.0047 0.0022 -0.0018 -0.0032 (0.0003) (0.0019) (0.0012) (0.0011) 1960-1964 0.0132 0.0102 0.0040 0.0019 (0.0044) (0.0031) (0.0022) (0.0020) 1950-1959 0.0054 0.0055 0.0028 0.0009 (0.0050) (0.0036) (0.0028) (0.0025) 1940-1950 0.0229 0.0151 0.0089 0.0067 (0.0098) (0.0065) (0.0048) (0.0044) Less than H.S. 0.2227 0.1428 0.1424 (0.0068) (0.0050) (0.0050) H.S. Degree 0.0594 0.0398 0.0397 (0.0019) (0.0014) (0.0014) Some College 0.0354 0.0246 0.0246 (0.0016) (0.0012) (0.0012) Black 0.0397 0.0396 (0.0008) (0.0008) American Indian 0.0088 0.0088 (0.0011) (0.0011) Asian or Pacific 0.0065 0.0066 (0.0011) (0.0011) Other Race -0.0008 -0.0008 (0.0005) (0.0005) Hispanic 0.0135 0.0134 (0.0007) (0.0007) U.S. Citizen -0.0023 (0.0006) Years in US -0.0016 -0.0004 -0.0007 -0.0005 -0.0005 (0.0002) (0.0002) (0.0001) (0.0001) (0.0001) Years in US2 -0.00002 -0.000006 -0.000009 0.000008 0.000008 (0.00001) (0.00001) (0.00001) (0.00000) (0.00000) 1980 -0.0143 -0.0146 -0.0103 -0.0081 -0.0081 (0.0002) (0.0002) (0.0002) (0.0001) (0.0001) 1990 -0.0101 -0.0108 -0.0075 -0.0055 -0.0055 (0.0004) (0.0004) (0.0003) (0.0002) (0.0002) Age Dummies Yes Yes Yes Yes Yes Psuedo R-square 0.0193 0.0204 0.1039 0.1614 0.1614
Notes: The marginal effects are calculated at the sample means. Number of observations for 1980 is 2,027,504. Number of observations for 1990 is 2,193,947. Number of observations for 2000 is 2,228,495. All specifications include a full set of age dummies. Controls are: (1) age dummies; (2) age, education; (3) age, education, race/ethnicity; (4) age, race, ethnicity, education, and U.S. citizen.
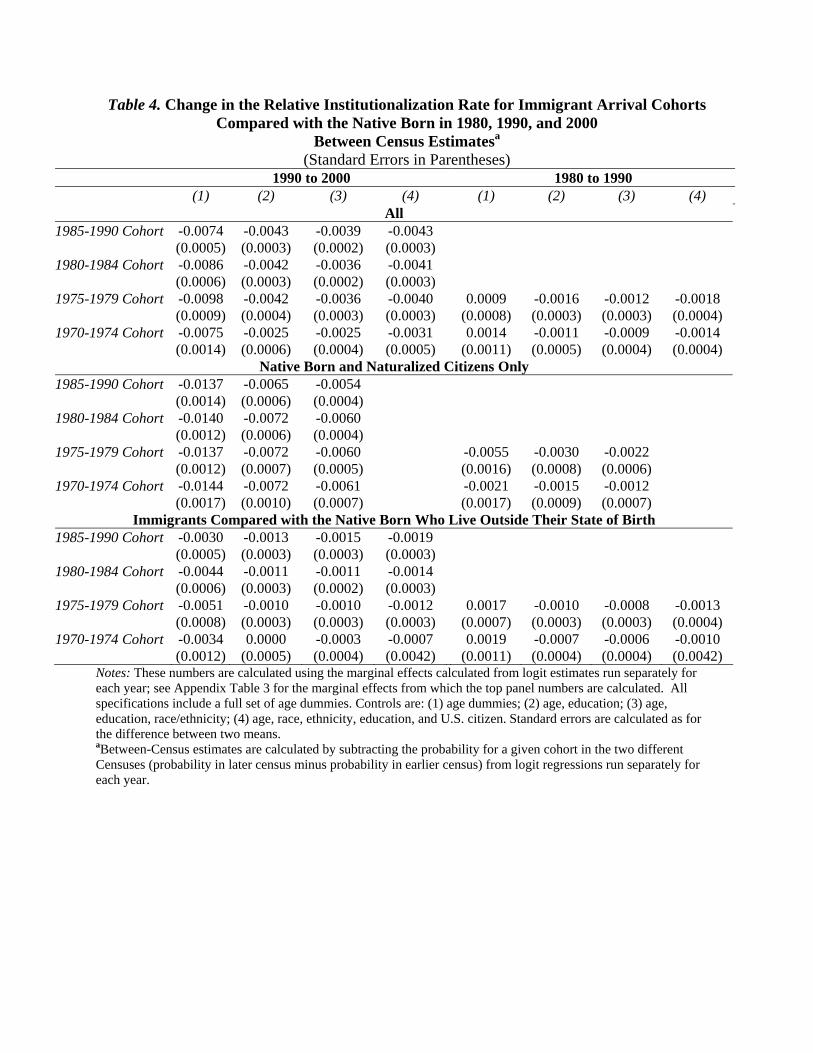
Table 4. Change in the Relative Institutionalization Rate for Immigrant Arrival Cohorts
Compared with the Native Born in 1980, 1990, and 2000 Between Census Estimatesa
(Standard Errors in Parentheses) 1990 to 2000 1980 to 1990 (1) (2) (3) (4) (1) (2) (3) (4)
All 1985-1990 Cohort -0.0074 -0.0043 -0.0039 -0.0043 (0.0005) (0.0003) (0.0002) (0.0003) 1980-1984 Cohort -0.0086 -0.0042 -0.0036 -0.0041 (0.0006) (0.0003) (0.0002) (0.0003) 1975-1979 Cohort -0.0098 -0.0042 -0.0036 -0.0040 0.0009 -0.0016 -0.0012 -0.0018 (0.0009) (0.0004) (0.0003) (0.0003) (0.0008) (0.0003) (0.0003) (0.0004) 1970-1974 Cohort -0.0075 -0.0025 -0.0025 -0.0031 0.0014 -0.0011 -0.0009 -0.0014
(0.0014) (0.0006) (0.0004) (0.0005) (0.0011) (0.0005) (0.0004) (0.0004) Native Born and Naturalized Citizens Only
1985-1990 Cohort -0.0137 -0.0065 -0.0054 (0.0014) (0.0006) (0.0004) 1980-1984 Cohort -0.0140 -0.0072 -0.0060 (0.0012) (0.0006) (0.0004) 1975-1979 Cohort -0.0137 -0.0072 -0.0060 -0.0055 -0.0030 -0.0022 (0.0012) (0.0007) (0.0005) (0.0016) (0.0008) (0.0006) 1970-1974 Cohort -0.0144 -0.0072 -0.0061 -0.0021 -0.0015 -0.0012
(0.0017) (0.0010) (0.0007) (0.0017) (0.0009) (0.0007) Immigrants Compared with the Native Born Who Live Outside Their State of Birth
1985-1990 Cohort -0.0030 -0.0013 -0.0015 -0.0019 (0.0005) (0.0003) (0.0003) (0.0003) 1980-1984 Cohort -0.0044 -0.0011 -0.0011 -0.0014 (0.0006) (0.0003) (0.0002) (0.0003) 1975-1979 Cohort -0.0051 -0.0010 -0.0010 -0.0012 0.0017 -0.0010 -0.0008 -0.0013 (0.0008) (0.0003) (0.0003) (0.0003) (0.0007) (0.0003) (0.0003) (0.0004) 1970-1974 Cohort -0.0034 0.0000 -0.0003 -0.0007 0.0019 -0.0007 -0.0006 -0.0010
(0.0012) (0.0005) (0.0004) (0.0042) (0.0011) (0.0004) (0.0004) (0.0042) Notes: These numbers are calculated using the marginal effects calculated from logit estimates run separately for each year; see Appendix Table 3 for the marginal effects from which the top panel numbers are calculated. All specifications include a full set of age dummies. Controls are: (1) age dummies; (2) age, education; (3) age, education, race/ethnicity; (4) age, race, ethnicity, education, and U.S. citizen. Standard errors are calculated as for the difference between two means. aBetween-Census estimates are calculated by subtracting the probability for a given cohort in the two different Censuses (probability in later census minus probability in earlier census) from logit regressions run separately for each year.
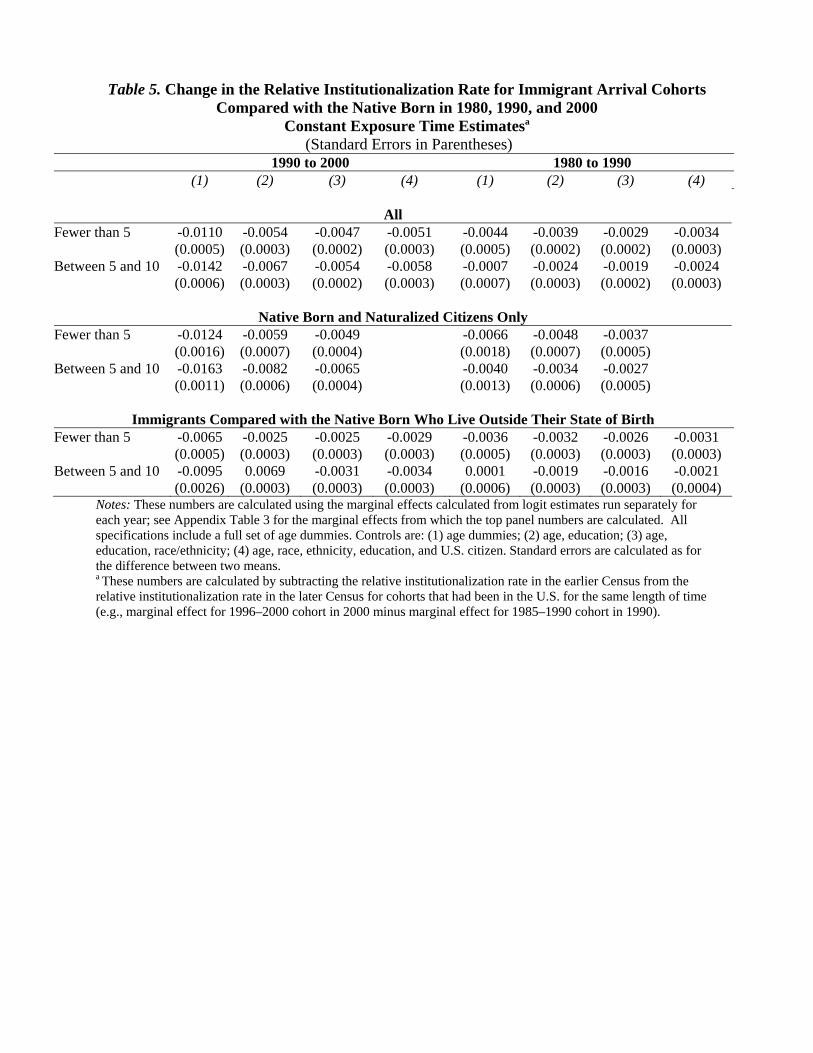
Table 5. Change in the Relative Institutionalization Rate for Immigrant Arrival Cohorts Compared with the Native Born in 1980, 1990, and 2000
Constant Exposure Time Estimatesa (Standard Errors in Parentheses)
1990 to 2000 1980 to 1990 (1) (2) (3) (4) (1) (2) (3) (4)
All
Fewer than 5 -0.0110 -0.0054 -0.0047 -0.0051 -0.0044 -0.0039 -0.0029 -0.0034 (0.0005) (0.0003) (0.0002) (0.0003) (0.0005) (0.0002) (0.0002) (0.0003) Between 5 and 10 -0.0142 -0.0067 -0.0054 -0.0058 -0.0007 -0.0024 -0.0019 -0.0024 (0.0006) (0.0003) (0.0002) (0.0003) (0.0007) (0.0003) (0.0002) (0.0003)
Native Born and Naturalized Citizens Only
Fewer than 5 -0.0124 -0.0059 -0.0049 -0.0066 -0.0048 -0.0037 (0.0016) (0.0007) (0.0004) (0.0018) (0.0007) (0.0005) Between 5 and 10 -0.0163 -0.0082 -0.0065 -0.0040 -0.0034 -0.0027 (0.0011) (0.0006) (0.0004) (0.0013) (0.0006) (0.0005)
Immigrants Compared with the Native Born Who Live Outside Their State of Birth Fewer than 5 -0.0065 -0.0025 -0.0025 -0.0029 -0.0036 -0.0032 -0.0026 -0.0031 (0.0005) (0.0003) (0.0003) (0.0003) (0.0005) (0.0003) (0.0003) (0.0003) Between 5 and 10 -0.0095 0.0069 -0.0031 -0.0034 0.0001 -0.0019 -0.0016 -0.0021 (0.0026) (0.0003) (0.0003) (0.0003) (0.0006) (0.0003) (0.0003) (0.0004)
Notes: These numbers are calculated using the marginal effects calculated from logit estimates run separately for each year; see Appendix Table 3 for the marginal effects from which the top panel numbers are calculated. All specifications include a full set of age dummies. Controls are: (1) age dummies; (2) age, education; (3) age, education, race/ethnicity; (4) age, race, ethnicity, education, and U.S. citizen. Standard errors are calculated as for the difference between two means. a These numbers are calculated by subtracting the relative institutionalization rate in the earlier Census from the relative institutionalization rate in the later Census for cohorts that had been in the U.S. for the same length of time (e.g., marginal effect for 1996–2000 cohort in 2000 minus marginal effect for 1985–1990 cohort in 1990).

Appendix Two potential problems with Census data could affect our results. The first is the
“undercount”—that is, failing to enumerate individuals, a problem typically considered more serious in poor and minority communities. The second potential problem concerns how the Census counts special populations, such as those in institutions. For example, if a high fraction of those under correctional supervision are in transition (being transferred from one place to another), the population count may miss them. Thus, it is worth understanding how the Census collects data for special populations.
1) Data Collection in Special Populations Data collection in special populations—like that in the institutionalized population—may
present particular challenges. For example, many people in institutions may be unable or unwilling to fill out Census forms. In the case of prisoners, people may also frequently be moved between institutions, creating difficulty in counting them.
The Census has developed a different form for people living in group quarters, and
additional forms for those in military quarters and onboard ships. As mentioned in the data section, some types of group quarters are designated as “institutions.” Jails and prisons fall into this category. Although the PUMS data does not separately identify this population, we can infer that a very high fraction of the institutionalized population is in correctional facilities by limiting our sample to men aged 18-40 (confirmed by comparisons to the 1980 Census, where type of institution is identifiable).
In the 2000 Census, about half of those living in group quarters were unable to fill out
Census forms (personal correspondence with Karen Humes, Special Populations Division, U.S. Census Bureau). A disproportionate share of these individuals is in an institution (jail, prison, or mental institution, for example). In this case, Census enumerators fill out the forms using the institutions’ administrative records.
The enumeration procedure for group quarters occurs over several weeks. Census
enumerators ask where an inmate was on April 1. If inmates who are in transit on April 1 reach their final destination that day, they are counted at the final destination. If they are in transit, they are counted at their originating location.
Under these circumstances, then, the institutionalized population is likely to be well-
counted, as the institutions are likely to keep accurate administrative records that document the number of inmates. Thus, the “undercount” of the institutionalized population is likely much less severe than that of the overall population. The demographic information on inmates of correctional institutions is also likely to be about as good as the administrative records themselves. Since there was more pressure and more incentive for correctional institutions to identify (non-naturalized) immigrants in their inmate populations in 2000 than in 1990, we would expect that a higher fraction of immigrants would be identified in 2000 than in 1990. Thus, any “undercount” of institutionalized immigrants would likely be higher in 1990 than in 2000.
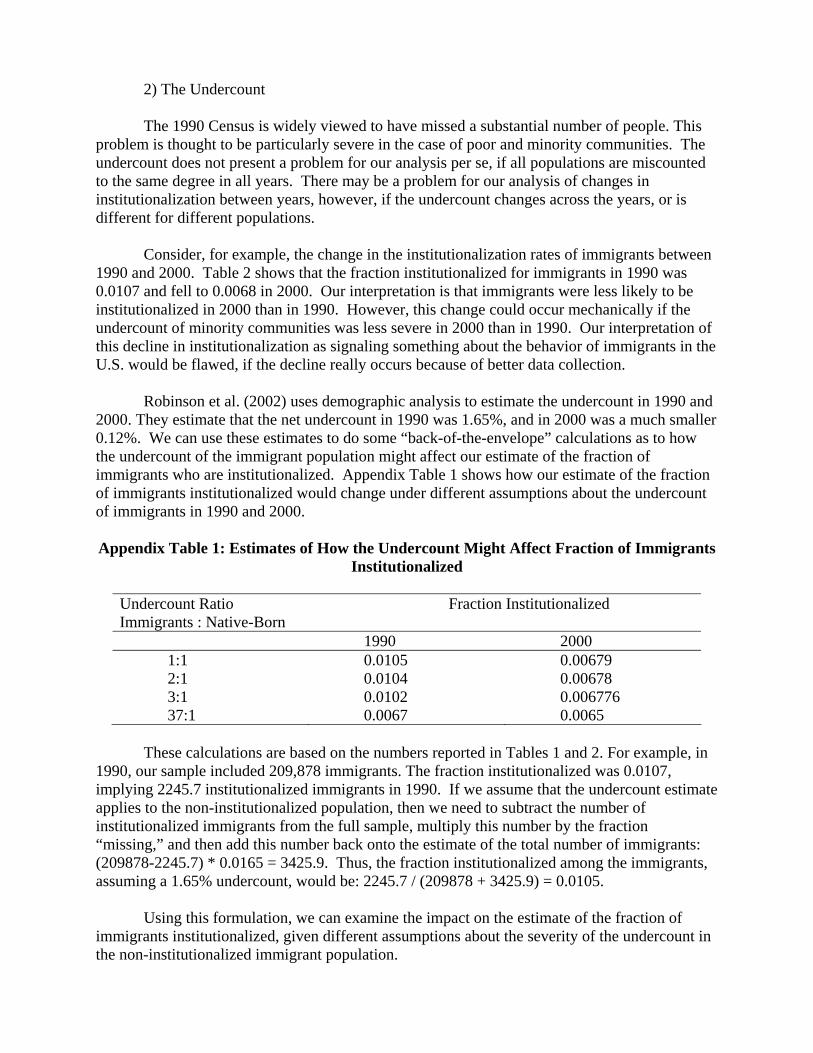
2) The Undercount The 1990 Census is widely viewed to have missed a substantial number of people. This
problem is thought to be particularly severe in the case of poor and minority communities. The undercount does not present a problem for our analysis per se, if all populations are miscounted to the same degree in all years. There may be a problem for our analysis of changes in institutionalization between years, however, if the undercount changes across the years, or is different for different populations.
Consider, for example, the change in the institutionalization rates of immigrants between
1990 and 2000. Table 2 shows that the fraction institutionalized for immigrants in 1990 was 0.0107 and fell to 0.0068 in 2000. Our interpretation is that immigrants were less likely to be institutionalized in 2000 than in 1990. However, this change could occur mechanically if the undercount of minority communities was less severe in 2000 than in 1990. Our interpretation of this decline in institutionalization as signaling something about the behavior of immigrants in the U.S. would be flawed, if the decline really occurs because of better data collection.
Robinson et al. (2002) uses demographic analysis to estimate the undercount in 1990 and
2000. They estimate that the net undercount in 1990 was 1.65%, and in 2000 was a much smaller 0.12%. We can use these estimates to do some “back-of-the-envelope” calculations as to how the undercount of the immigrant population might affect our estimate of the fraction of immigrants who are institutionalized. Appendix Table 1 shows how our estimate of the fraction of immigrants institutionalized would change under different assumptions about the undercount of immigrants in 1990 and 2000.
Appendix Table 1: Estimates of How the Undercount Might Affect Fraction of Immigrants
Institutionalized
Undercount Ratio Immigrants : Native-Born
Fraction Institutionalized
1990 2000 1:1 0.0105 0.00679 2:1 0.0104 0.00678 3:1 0.0102 0.006776 37:1 0.0067 0.0065
These calculations are based on the numbers reported in Tables 1 and 2. For example, in
1990, our sample included 209,878 immigrants. The fraction institutionalized was 0.0107, implying 2245.7 institutionalized immigrants in 1990. If we assume that the undercount estimate applies to the non-institutionalized population, then we need to subtract the number of institutionalized immigrants from the full sample, multiply this number by the fraction “missing,” and then add this number back onto the estimate of the total number of immigrants: (209878-2245.7) * 0.0165 = 3425.9. Thus, the fraction institutionalized among the immigrants, assuming a 1.65% undercount, would be: 2245.7 / (209878 + 3425.9) = 0.0105.
Using this formulation, we can examine the impact on the estimate of the fraction of immigrants institutionalized, given different assumptions about the severity of the undercount in the non-institutionalized immigrant population.

Assuming that the undercount is three times larger for immigrants than for the overall population (that is, there are three “missing” immigrants for every “missing” person overall), we would still find that the fraction institutionalized among immigrants was over 1.5 times higher in 1990 than in 2000. For the undercount to be the only reason for the decline in the fraction institutionalized among immigrants between 1990 and 2000, we would have to think that the undercount was about 37 times larger for immigrants than for the population overall.
In sum, neither the improvement in the undercount of the overall population between
1990 and 2000, nor undercount problems that pertain to the institutionalized population, would be likely to mechanically generate our finding that the fraction of immigrants institutionalized between 1990 and 2000 substantially declined.
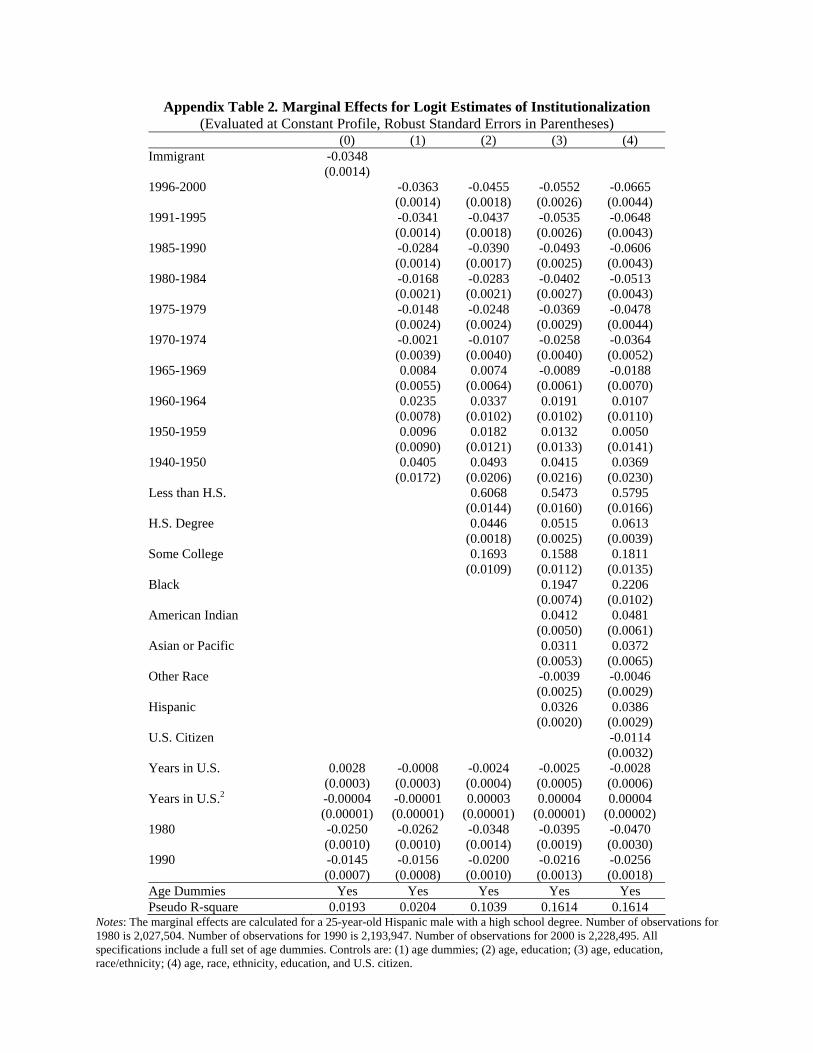
Appendix Table 2. Marginal Effects for Logit Estimates of Institutionalization
(Evaluated at Constant Profile, Robust Standard Errors in Parentheses) (0) (1) (2) (3) (4) Immigrant -0.0348 (0.0014) 1996-2000 -0.0363 -0.0455 -0.0552 -0.0665 (0.0014) (0.0018) (0.0026) (0.0044) 1991-1995 -0.0341 -0.0437 -0.0535 -0.0648 (0.0014) (0.0018) (0.0026) (0.0043) 1985-1990 -0.0284 -0.0390 -0.0493 -0.0606 (0.0014) (0.0017) (0.0025) (0.0043) 1980-1984 -0.0168 -0.0283 -0.0402 -0.0513 (0.0021) (0.0021) (0.0027) (0.0043) 1975-1979 -0.0148 -0.0248 -0.0369 -0.0478 (0.0024) (0.0024) (0.0029) (0.0044) 1970-1974 -0.0021 -0.0107 -0.0258 -0.0364 (0.0039) (0.0040) (0.0040) (0.0052) 1965-1969 0.0084 0.0074 -0.0089 -0.0188 (0.0055) (0.0064) (0.0061) (0.0070) 1960-1964 0.0235 0.0337 0.0191 0.0107 (0.0078) (0.0102) (0.0102) (0.0110) 1950-1959 0.0096 0.0182 0.0132 0.0050 (0.0090) (0.0121) (0.0133) (0.0141) 1940-1950 0.0405 0.0493 0.0415 0.0369 (0.0172) (0.0206) (0.0216) (0.0230) Less than H.S. 0.6068 0.5473 0.5795 (0.0144) (0.0160) (0.0166) H.S. Degree 0.0446 0.0515 0.0613 (0.0018) (0.0025) (0.0039) Some College 0.1693 0.1588 0.1811 (0.0109) (0.0112) (0.0135) Black 0.1947 0.2206 (0.0074) (0.0102) American Indian 0.0412 0.0481 (0.0050) (0.0061) Asian or Pacific 0.0311 0.0372 (0.0053) (0.0065) Other Race -0.0039 -0.0046 (0.0025) (0.0029) Hispanic 0.0326 0.0386 (0.0020) (0.0029) U.S. Citizen -0.0114 (0.0032) Years in U.S. 0.0028 -0.0008 -0.0024 -0.0025 -0.0028 (0.0003) (0.0003) (0.0004) (0.0005) (0.0006) Years in U.S.2 -0.00004 -0.00001 0.00003 0.00004 0.00004 (0.00001) (0.00001) (0.00001) (0.00001) (0.00002) 1980 -0.0250 -0.0262 -0.0348 -0.0395 -0.0470 (0.0010) (0.0010) (0.0014) (0.0019) (0.0030) 1990 -0.0145 -0.0156 -0.0200 -0.0216 -0.0256 (0.0007) (0.0008) (0.0010) (0.0013) (0.0018) Age Dummies Yes Yes Yes Yes Yes Pseudo R-square 0.0193 0.0204 0.1039 0.1614 0.1614
Notes: The marginal effects are calculated for a 25-year-old Hispanic male with a high school degree. Number of observations for 1980 is 2,027,504. Number of observations for 1990 is 2,193,947. Number of observations for 2000 is 2,228,495. All specifications include a full set of age dummies. Controls are: (1) age dummies; (2) age, education; (3) age, education, race/ethnicity; (4) age, race, ethnicity, education, and U.S. citizen.
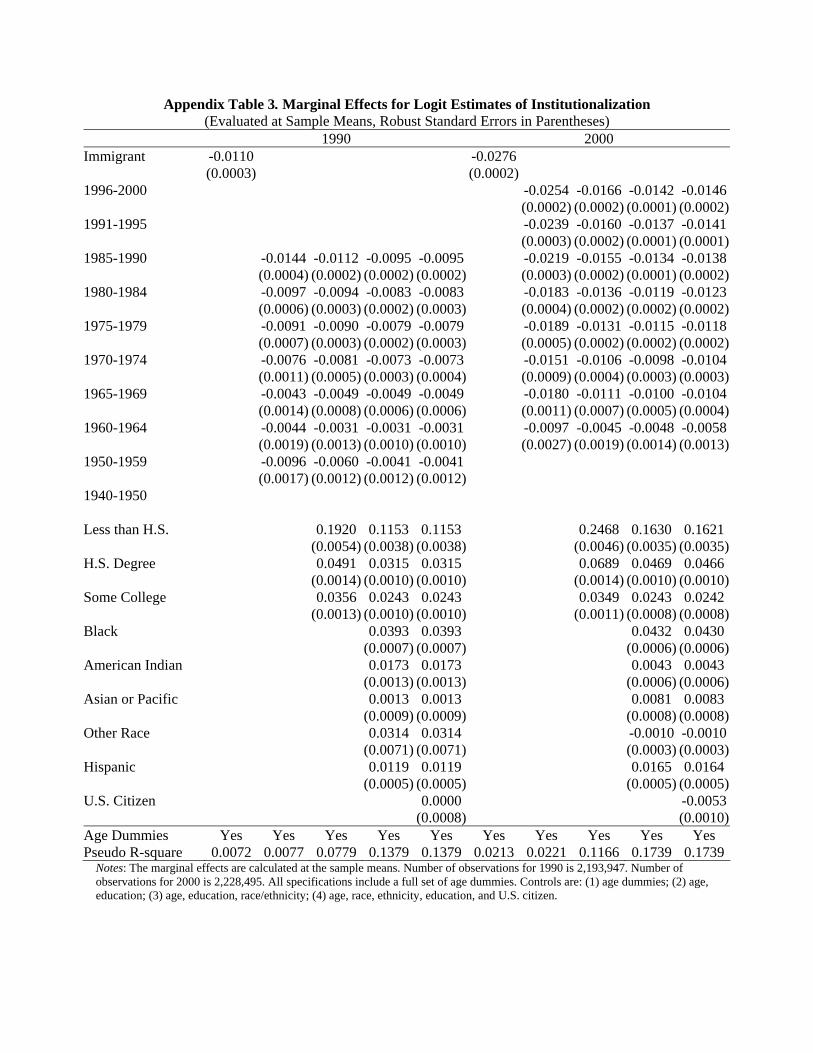
Appendix Table 3. Marginal Effects for Logit Estimates of Institutionalization (Evaluated at Sample Means, Robust Standard Errors in Parentheses)
1990 2000 Immigrant -0.0110 -0.0276 (0.0003) (0.0002) 1996-2000 -0.0254 -0.0166 -0.0142 -0.0146 (0.0002) (0.0002) (0.0001) (0.0002)1991-1995 -0.0239 -0.0160 -0.0137 -0.0141 (0.0003) (0.0002) (0.0001) (0.0001)1985-1990 -0.0144 -0.0112 -0.0095 -0.0095 -0.0219 -0.0155 -0.0134 -0.0138 (0.0004) (0.0002) (0.0002) (0.0002) (0.0003) (0.0002) (0.0001) (0.0002)1980-1984 -0.0097 -0.0094 -0.0083 -0.0083 -0.0183 -0.0136 -0.0119 -0.0123 (0.0006) (0.0003) (0.0002) (0.0003) (0.0004) (0.0002) (0.0002) (0.0002)1975-1979 -0.0091 -0.0090 -0.0079 -0.0079 -0.0189 -0.0131 -0.0115 -0.0118 (0.0007) (0.0003) (0.0002) (0.0003) (0.0005) (0.0002) (0.0002) (0.0002)1970-1974 -0.0076 -0.0081 -0.0073 -0.0073 -0.0151 -0.0106 -0.0098 -0.0104 (0.0011) (0.0005) (0.0003) (0.0004) (0.0009) (0.0004) (0.0003) (0.0003)1965-1969 -0.0043 -0.0049 -0.0049 -0.0049 -0.0180 -0.0111 -0.0100 -0.0104 (0.0014) (0.0008) (0.0006) (0.0006) (0.0011) (0.0007) (0.0005) (0.0004)1960-1964 -0.0044 -0.0031 -0.0031 -0.0031 -0.0097 -0.0045 -0.0048 -0.0058 (0.0019) (0.0013) (0.0010) (0.0010) (0.0027) (0.0019) (0.0014) (0.0013)1950-1959 -0.0096 -0.0060 -0.0041 -0.0041 (0.0017) (0.0012) (0.0012) (0.0012) 1940-1950 Less than H.S. 0.1920 0.1153 0.1153 0.2468 0.1630 0.1621 (0.0054) (0.0038) (0.0038) (0.0046) (0.0035) (0.0035)H.S. Degree 0.0491 0.0315 0.0315 0.0689 0.0469 0.0466 (0.0014) (0.0010) (0.0010) (0.0014) (0.0010) (0.0010)Some College 0.0356 0.0243 0.0243 0.0349 0.0243 0.0242 (0.0013) (0.0010) (0.0010) (0.0011) (0.0008) (0.0008)Black 0.0393 0.0393 0.0432 0.0430 (0.0007) (0.0007) (0.0006) (0.0006)American Indian 0.0173 0.0173 0.0043 0.0043 (0.0013) (0.0013) (0.0006) (0.0006)Asian or Pacific 0.0013 0.0013 0.0081 0.0083 (0.0009) (0.0009) (0.0008) (0.0008)Other Race 0.0314 0.0314 -0.0010 -0.0010 (0.0071) (0.0071) (0.0003) (0.0003)Hispanic 0.0119 0.0119 0.0165 0.0164 (0.0005) (0.0005) (0.0005) (0.0005)U.S. Citizen 0.0000 -0.0053 (0.0008) (0.0010)Age Dummies Yes Yes Yes Yes Yes Yes Yes Yes Yes Yes Pseudo R-square 0.0072 0.0077 0.0779 0.1379 0.1379 0.0213 0.0221 0.1166 0.1739 0.1739
Notes: The marginal effects are calculated at the sample means. Number of observations for 1990 is 2,193,947. Number of observations for 2000 is 2,228,495. All specifications include a full set of age dummies. Controls are: (1) age dummies; (2) age, education; (3) age, education, race/ethnicity; (4) age, race, ethnicity, education, and U.S. citizen.
![Mortality in first- and second-generation immigrants to ...Swedes, first-generation immigrants with ≤ 24 years in Sweden (0.55 [0.51, 0.60]) displayed lower ACM rates than those](https://img.pdfslide.us/doc/110x75/6024b1a6cb611d6a48268377/mortality-in-first-and-second-generation-immigrants-to-swedes-first-generation.jpg)