Embed Size (px)
Citation preview

Reducing recidivism
For years, elected state officials responded to the public’s frustration with high crime rates by making incarceration the centerpiece of their crime policy. Suggesting that “nothing works” to rehabilitate individuals incarcerated in prisons and jails,
policymakers across the political spectrum saw high rates of reoffense as inevitable, and keeping people who committed crimes behind bars was seen as the best way to ensure public safety.1
Over the last 15 years, a series of developments has contributed to a seismic shift in that mindset. Among these developments was a body of research that began to emerge demonstrating that certain programs and approaches to supervision can change some people’s criminal behaviors and help them succeed upon release
from incarceration. Encouraged by this research and the success that programs were experiencing in their communities, in 2008, Congress passed the Second Chance Act, which established grant programs to stimulate further innovation at the state and local level.
Today, improved reentry and recidivism reduction are cornerstones of state and local crime policies across the country. Governors routinely highlight the importance of reducing recidivism in their state of the state addresses,2 and mayors, sheriffs, and other local leaders across the country have established task forces focusing on reentry in their cities and counties.3
Compelling evidence is now emerging that shows that recidivism rates for an entire state can indeed change. In 2012, the National Reentry Resource
StatesDeliverResults
June 2014
Colorado 2007 52.0% 2010 49.0% -3.0% -5.8%
Connecticut 2007 43.9% 2010 40.0% -3.9% -8.9%
Georgia 2007 28.9% 2010 26.0% -2.9% -10.0%
North Carolinai 2006 35.8% 2010 28.9% -6.9% -19.3%
Pennsylvania 2007 43.9% 2010 40.8% -3.1% -7.1%
Rhode Islandii 2004 54.0% 2010 48.9% -5.1% -9.4%
South Carolina 2007 33.5% 2010 27.5% -6.0% -17.9%
Wisconsin 2007 56.2% 2010 51.1% -5.1% -9.1%
Three-Year Returns to Prison
Release Cohort
Recidivism Rate
Release Cohort
Recidivism Rate
Percentage- Point Change
Percent Change
i In North Carolina, the Sentencing and Policy Advisory Commission computes recidivism rates on a biannual basis for the state. The most recent rates were reported for 2009 and 2011 release cohorts, computed for one-year and two-year intervals. Prior to adopting this newer protocol of two-year intervals, the Sentencing Commission computed three-year recidivism rates for a FY2006 release cohort. It was decided to use the FY2006 three-year rate for this report, so that a similar follow-up period was available for all states. Moreover, the North Carolina Department of Public Safety computed the three-year rates for a 2010 release cohort on request for this report.ii Rhode Island computes its rates approximately every five years; the most recent recidivism reports computed rates for 2004 release cohorts and 2009 release cohorts. Thus, there was not an available data point for 2007 against which to compare the 2010 rates. It was decided to compare the 2004 recidivism rates with rates for 2010, which were computed on request for this report, to provide a longer timeframe of analysis.

2 I ReduCING ReCidivism
Colorado -3.0% -5.8% 11,033 331
Connecticut -3.9% -8.9% 15,536 606
Georgia -2.9% -10.0% 21,874 634
North Carolina -6.9% -19.3% 25,467 1,757
Pennsylvania -3.1% -7.1% 18,417 571
Rhode Island -5.1% -9.4% 2,596 132
South Carolina -6.0% -17.9% 12,744 765
Wisconsin -5.1% -9.1% 15,237 777
Recidivism Reductions
Percentage-Point Change in Three- Year Recidivism Rates
Percentage Change in Three- Year Recidivism Rates
Number of inmates Released in 2010
Number Fewer Returned to Prison for the 2010 Release Group
The declines in recidivism rates highlighted in this report have occurred while these states have each experienced
declines in incarceration rates and crime rates. (See appendix for incarceration and crime data.)
Center (NRRC) highlighted seven states that had achieved reductions in three-year recidivism rates for 2005 to 2007 releases.4 In this report, the NRRC highlights eight additional states that have lowered their recidivism rates: Colorado, Connecticut, Georgia, North Carolina, Pennsylvania, Rhode Island, South Carolina, and Wisconsin.
This report focuses on statewide recidivism data for adults released in 2007 and 2010 with a three-year follow-up period, offering a current snapshot of criminal justice outcomes in these states. The data are as reported by the states to the Council of State Governments Justice Center following various methodologies used by the states as noted below. The data highlighted from these states do not represent a statistical sampling and cannot be used to propose findings related to national recidivism rates.
The information presented here, however, has national value for three reasons. First, the data in
this report (which follows release cohorts through 2013) are more recent than those in any other report examining recidivism in multiple states. For example, the most recent federal reports on recidivism analyzed outcomes for adults released in 2005 and followed them through 2010.5 Second, the report highlights an interesting cross-section of states representing different regions of the United States, sizes of prison populations, and correctional systems (two of the states have a unified system, combining what are traditionally separate state prison and county jail systems into one system operated at the state level). Third, the data presented here and in the NRRC’s 2012 report demonstrate that it is possible for states to achieve significant statewide reductions in their recidivism rates. While these reports focus on recidivism reductions in the past six years, a comparison of recidivism rates for at least some of these states over a longer period of time would demonstrate even larger reductions.

ReduCING ReCidivism I 3
Data provided in this report compare the change in an individual state’s recidivism rate from one period to another. This brief does not compare one state’s recidivism rate to another state’s recidivism rate for several reasons. First, each state has its own definition of recidivism and its own methodology for calculating recidivism.6 For example, some state measurements of recidivism account only for reincarceration, while others include reconvictions that do not result in a prison or jail sentence. Furthermore, states differ in their definitions of “reincarceration.” For example, Pennsylvania and South Carolina both define recidivism as a return to the custody of the state Department of Corrections. In Pennsylvania, however, state custody may include prison, county jail, or a Parole Violator Center, whereas state custody in South Carolina is defined as a prison sentence of more than 90 days. (See citations throughout this report for each state’s definition of and methodology for calculating recidivism.)
Another factor that makes comparing recidivism rates across states problematic is the distinct composition of each state’s prison population. For instance, a state that sentences to prison large numbers of people who are at low risk of reoffending will logically have a lower recidivism rate than a state that uses its prison facilities for people who are at higher risk of reoffending.
The organization of a state’s correctional system can also influence its recidivism rates, as is the case for Connecticut and Rhode Island, which operate unified correctional systems where all individuals are under the state's jurisdiction rather than separate state prison and county jail systems.
Because of these and other factors, comparing recidivism rates from state to state is discouraged.
comparing recidivism rates
52.0 percent 49.0 percent 5.8 percent
2007 2008 2009 2010 2011 2012 2013
Prison Population 22,519 22,989 23,186 22,860 22,610 21,037 20,134
Admissions to Prison 10,625 11,038 10,992 10,704 9,935 9,116 9,620
Releases from Prison 10,110 10,565 10,803 11,033 10,161 10,657 10,506
Three-year recidivism rate for 2007 prison releases
Three-year recidivism rate for 2010 prison releases
Percent decline in recidivism rate
In 2007, Colorado was experiencing high rates of recidivism and one of the fastest-growing corrections populations in the United States. To address these and other concerns, state lawmakers established the Colorado Commission on Criminal and Juvenile Justice (CCJJ) to conduct a comprehensive analysis of the state’s sentencing and corrections policies, with
reentry as one of its primary initiatives. The CCJJ issued a report in 20088 based on its findings, and many of the commission’s policy recommendations have since been enacted. The work of the commission now focuses on evidence-based recidivism-reduction initiatives in addition to promoting the cost-effective use of criminal justice funds. State agencies have
Colorado7

4 I ReduCING ReCidivism
Research has shown that certain practices and policies can reduce recidivism, including:
Using risk and need assessments to inform case management.
Research shows that correctional programs with the greatest impact on recidivism sort individuals based on their risk of reoffending. Risk and need assessment tools examine both static (historical and/or demographic) and dynamic (changeable) criminogenic needs (also known as criminogenic risk factors) that research has shown to be associated with criminal behavior and make someone more likely to reoffend. The assessment produces a risk score that allows programs to sort individuals based on risk levels in a consistent and reliable manner, tailor interventions, and prioritize resources for those who are at higher risk of reoffending.
Establishing programs that have been shown to reduce recidivism and ensuring they are implemented with fidelity.
While specific approaches may vary across states, programs should be based on the best available science and research. Interventions that address criminogenic needs and take into account an individual’s responsivity factors—such as motivation for change, learning styles, and mental health needs—are more
WhAT WoRks To ReduCe ReCidivism
received a total of eight Second Chance Act awards to further support reentry initiatives.
State officials point to these and other efforts that incorporated the following strategies and have contributed to the state’s reduction in recidivism:
■ Investing in community-based treatment. In 2010, the state reclassified certain substance use and possession offenses, reducing the length of sentence associated with these offenses. The first year this law went into effect, it generated $1.4 million in savings for the Colorado Department of Corrections (CDOC), which the state reinvested in mental health and substance use treatment programs in the state. That same year, lawmakers reduced the length of time that certain adults under parole supervision (including those at low or medium risk of reoffense) can serve in prison when they violate the conditions of their parole. More than $4.5 million in savings generated through this change in policy was invested into mental health and substance use treatment and other individualized services for people on parole.
■ Promoting continuity of care from incarceration to the community. CDOC continues to work toward ensuring that individuals in administrative segregation are not released directly to the community and, instead, move through a step-down process and receive services to promote a successful transition.
■ Tailoring approaches to individual needs. Colorado State Board of Parole members receive training in motivational interviewing and apply these skills in parole hearings. An evidence-based practice, motivational interviewing focuses on decreasing resistance and promoting an individual’s readiness for change and commitment to programming.
■ Providing incentives for participation in programs designed to reduce likelihood of a person reoffending. State law allows adults who are incarcerated and convicted of certain crimes to earn as much as 12 days per month off their sentence by complying with rules and participating in correctional programs such as cognitive-behavioral therapy, mental health or substance use treatment, educational classes, and vocational training.

ReduCING ReCidivism I 5
43.9 percent 40.0 percent 8.9 percent
2007 2008 2009 2010 2011 2012 2013
Prison Population 14,998 14,745 13,876 13,578 12,955 12,104 12,417
Admissions to Prison 10,532 9,222 9,154 8,514 8,218 7,874 7,411
Releases from Prison 16,371 16,295 16,317 15,536 15,515 14,784 13,533
Three-year recidivism rate for 2007 prison releases
Three-year recidivism rate for 2010 prison releases
Percent decline in recidivism rate
Connecticut13
The state of Connecticut operates a unified correctional system, meaning that all offenders (i.e., those awaiting trial and those sentenced to incarceration) in the state are under the jurisdiction of the Connecticut Department of Correction (CTDOC). Connecticut does not have county jails; therefore, offenders sentenced to any length of stay, even short-term “jail” sentences, are housed in a CTDOC facility. Data above reflect the sentenced population; pretrial detainees have been excluded from these numbers.
likely to impact recidivism than those that do not. Programs should also establish desired outcomes and ensure means for measuring progress, such as regular quality assessments and evaluations. Studies show that implementing evidence-based programs and practices can reduce reoffense rates by 10 to 20 percent.9
Implementing community supervision policies and practices that promote successful reentry.10
Improved community supervision to provide greater support and access to services is critical to efforts to reduce recidivism. Supervision conditions and programs should be informed by an individual’s risk and needs, focusing resources on those who are assessed to be at higher risk. Parole and probation officers should also have a range of options for swift and certain sanctions and incentives that are proportionate to the event and appropriate for the individual under supervision.
The Council of State Governments Justice Center outlined these practices in The National Summit on Justice Reinvestment and Public Safety: Addressing Recidivism, Crime, and Corrections Spending,11 a report summarizing the innovative strategies discussed over the course of a summit of state leaders, federal officials, practitioners, and researchers in 2010. In 2012, the Council of State Governments Justice Center and the National Reentry Resource Center released a series of user-friendly checklists specifically designed to help executive and legislative policymakers, state corrections administrators, and state reentry coordinators implement these proven strategies in their states.12
When Connecticut state leaders employed a justice reinvestment approach in 2004 to determine why their state had the third-fastest-growing prison population in the country, they found that a significant percentage of their admissions to prison were for probation violations. As a result, state leaders enacted a legislative package designed to reverse this trend. Between July 2003 and
September 2005, the number of adults on probation returned to prison declined by 50 percent,14 which enabled the state to bring inmates being housed out of state back to Connecticut, generating nearly $50 million in cost savings, some of which was reinvested into mental health and substance use treatment services, community-based pilot projects, and other

6 I ReduCING ReCidivism
programs. In 2007, two parolees (whose circumstances had nothing to do with reforms implemented in 2004) invaded a home and committed a triple homicide, rocking the state. The prison population spiked, and lawmakers made additional changes to policy to improve the parole decision-making process.
Today, state leaders point to legislation enacted in 2004 and 2008, along with additional subsequent improvements to policy, as being instrumental in the state’s declining recidivism rates: ■ Reentry planning and intensive supervision. The legislation enacted in 2004 created an intensive probation supervision program for high-risk individuals who will be released to probation as part of a split sentence. Within 90 days prior to their release, program staff meet with participants to discuss their probation terms and develop a reentry plan that incorporates needs such as housing, employment, or substance use treatment. Upon release, they receive up to four months of intensive probation supervision, followed by standard probation supervision.
■ Improving the response to people who violate conditions of probation. Individuals who violate the terms of their probation receive up to 120 days of
intensive supervision and services as an alternative to incarceration. At the start of this supervision period, individuals are assessed for risk and need and receive appropriate services; they are also required to meet with their probation officer at least once each week. Intensive supervision is followed by standard probation if the person has complied with the terms of supervision.
■ Providing continuity of care to people with mental health needs released from prison. The Connecticut Department of Correction (CTDOC) and the University of Connecticut’s Correctional Managed Health Care partnered in 2006 to establish a licensed medical and mental health position in prisons and jails to assist in discharge planning and ensure continuity of care for individuals with mental disorders being released to the community.
■ Data collection and performance measurement. The state made a priority of holding community-based programs—and community supervision agencies—accountable for delivering results. To that end, CTDOC upgraded its data tracking system and created a Best Practices Unit in 2011 to measure the agency’s performance and promote evidence-based policies and practices within the agency.
Justice reinvestment is a data-driven approach to improve public safety, reduce corrections spending, and reinvest savings in strategies that can decrease crime and reduce recidivism. In the process, policymakers, experts, and stakeholders work together to analyze a variety of state-specific data to develop practical policies that are based on the best available data and research and are tailored to the distinct public safety needs of the jurisdiction. These policies are designed to generate cost savings, a portion of which can then be reinvested in correctional and community-based programs aimed at further reducing crime and recidivism, such as treatment for mental health and substance use disorders.
To date, the U.S. Department of Justice’s Bureau of Justice Assistance (BJA), The Pew Charitable Trusts, and other organizations have supported justice reinvestment efforts in 31 states. Connecticut, Georgia, North Carolina, Pennsylvania, Rhode Island, South Carolina, and Wisconsin are among the states that have both adopted the justice reinvestment approach and lowered recidivism rates.
Using a JUstice reinvestment approach
ReduCING ReCidivism I 7
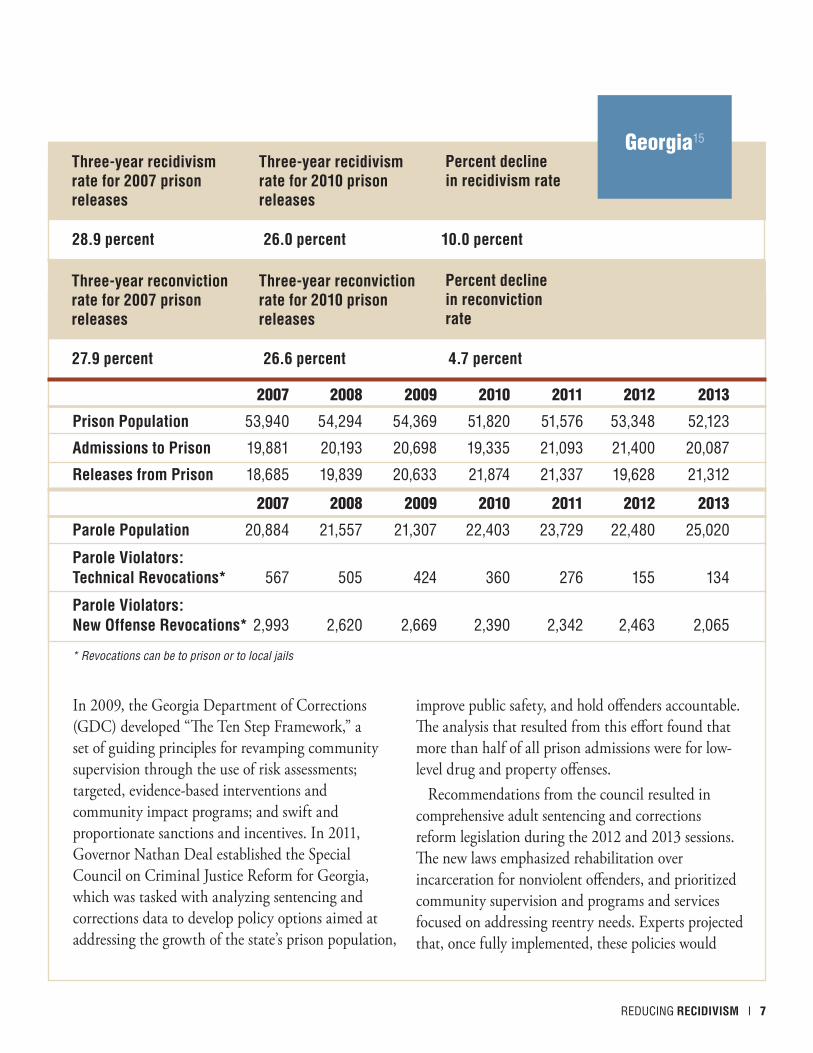
28.9 percent 26.0 percent 10.0 percent
27.9 percent 26.6 percent 4.7 percent
Three-year recidivism rate for 2007 prison releases
Three-year reconviction rate for 2007 prison releases
Three-year recidivism rate for 2010 prison releases
Three-year reconviction rate for 2010 prison releases
Percent decline in recidivism rate
Percent decline in reconviction rate
Georgia15
2007 2008 2009 2010 2011 2012 2013
Prison Population 53,940 54,294 54,369 51,820 51,576 53,348 52,123
Admissions to Prison 19,881 20,193 20,698 19,335 21,093 21,400 20,087
Releases from Prison 18,685 19,839 20,633 21,874 21,337 19,628 21,312
2007 2008 2009 2010 2011 2012 2013
Parole Population 20,884 21,557 21,307 22,403 23,729 22,480 25,020
Parole violators: Technical Revocations* 567 505 424 360 276 155 134
Parole violators: New offense Revocations* 2,993 2,620 2,669 2,390 2,342 2,463 2,065
In 2009, the Georgia Department of Corrections (GDC) developed “The Ten Step Framework,” a set of guiding principles for revamping community supervision through the use of risk assessments; targeted, evidence-based interventions and community impact programs; and swift and proportionate sanctions and incentives. In 2011, Governor Nathan Deal established the Special Council on Criminal Justice Reform for Georgia, which was tasked with analyzing sentencing and corrections data to develop policy options aimed at addressing the growth of the state’s prison population,
improve public safety, and hold offenders accountable. The analysis that resulted from this effort found that more than half of all prison admissions were for low-level drug and property offenses.
Recommendations from the council resulted in comprehensive adult sentencing and corrections reform legislation during the 2012 and 2013 sessions. The new laws emphasized rehabilitation over incarceration for nonviolent offenders, and prioritized community supervision and programs and services focused on addressing reentry needs. Experts projected that, once fully implemented, these policies would
* Revocations can be to prison or to local jails

8 I ReduCING ReCidivism
reduce the prison population by nearly 5,000 over 5 years, saving the state at least $264 million.
In 2013, Governor Deal established the Governor’s Office of Transition, Support and Reentry to promote successful transition to the community after incarceration, reduce recidivism, enhance collaboration among stakeholders, and ensure that cost savings from justice reforms are reinvested in evidence-based, community-focused services. Georgia officials have received two Second Chance Act Statewide Recidivism Reduction grants and are pursuing several other grants to support the continued development of reentry policies and practices focused on lowering recidivism among people at highest risk of reoffending.
Georgia officials cite various aspects of the above initiatives that have contributed to the statewide reductions in reincarceration rates for people released from prison: ■ Improved probation and parole supervision. A partnership between the GDC and the State Board of Pardons and Parole has resulted in the movement of certain offenders, who would otherwise max out their prison sentence with no community supervision, from prison to transitional centers. These individuals are paired with parole officers who help connect them
to housing, employment, and treatment programs in the community. Additionally, probation officers have been given the authority to impose community-based graduated sanctions for probation violators rather than recommending a prison sentence.
■ Accountability courts. Reforms in 2012 significantly expanded the use of accountability courts, requiring that those courts use validated risk and need assessments to guide decisions about treatment and supervision, as well as incorporate programs addressing criminogenic risk factors. Over $10 million was appropriated by the state legislature to support and encourage the accountability courts as they incorporate the new standards and establish additional courts. Accountability courts have expanded to better address mental health and substance use needs, as well as the unique needs of veterans.
■ Alternatives to incarceration. State officials have created and expanded day reporting centers, residential substance abuse treatment centers, and integrated treatment facilities in order to provide the courts with viable community-based alternatives to prison for individuals with mental health or substance use disorders.
We think one of the most important parts of [our state’s reforms] is the data collection and evidence-
based practices, essentially making sure we’re spending money where results are predictable and
the best results will be achieved.
GeorGia Governor nathan Deal

ReduCING ReCidivism I 9
To address rising incarceration rates and corrections costs, North Carolina policymakers began a justice reinvestment process in 2009 that revealed that probation revocations accounted for 50 percent of prison admissions that year, and of those admissions, 76 percent did not involve a new offense. In 2011, policymakers enacted sweeping legislation focused on strengthening community supervision and reducing revocations. These improvements and resulting cost savings have enabled the state to close 9 correctional facilities, fund 175 additional probation officers, and support community-based treatment programs.
State officials point to elements of this law, along with other improvements to policy and practice, that they believe contribute to declines in recidivism, including:
■ Increased emphasis on individualized case planning. Risk and need assessments during incarceration and community supervision inform case plans to ensure that people receive supervision and services aimed at reducing their likelihood of reoffending, prioritizing those assessed to have high risk and high need.
■ Ensuring fidelity to evidence-based practices. Probation officers receive monthly trainings to support and advance competencies in evidence-based practices, such as using risk and need assessments to inform case plans, building effective alliances to increase motivation for change, and applying incentives and sanctions.
35.8 percent 28.9 percent 19.3 percent
Three-year recidivism rate for 2006 prison releases
Three-year recidivism rate for 2010 prison releases
Percent decline in recidivism rate
North Carolina16
2007 2008 2009 2010 2011 2012 2013
Prison Population 38,423 39,326 40,824 40,102 41,030 38,385 37,469
Admissions to Prison 27,934 28,535 30,350 28,164 28,975 24,036 21,538
Releases from Prison 26,986 27,637 28,860 28,889 28,048 26,685 22,455
2007 2008 2009 2010 2011 2012 2013
Probation Population 113,376 113,027 109,820 107,696 104,095 98,752 99,089
Probation violators: Technical Revocations* 17,555 18,059 19,540 19,045 19,455 15,588 9,458
Probation violators: New offense Revocations* 3,627 4,053 4,221 4,168 4,140 4,131 3,496
Probation violators: Graduated sanctions - - - - - 1,974 8,240
* Revocations can be to prison or to local jails

10 I ReduCING ReCidivism
■ Graduated sanction options. Statewide, probation officers are utilizing “delegated authority” that allows them to impose certain sanctions without requiring an appearance before a judge. These sanctions—such as two- to three-day stays in local jails for recurring supervision violations—allow probation officers to respond quickly to these violations and provide a practical alternative to lengthier and more disruptive sanctions in prison.
■ The establishment of five local reentry councils across the state. State funds support a dedicated coordinator for each council who builds relationships with service providers, probation and parole agencies, and other stakeholders. Through these councils, state officials maintain close connections with local organizations engaged in reentry initiatives in their community, and provide resources to adults released from prison who are seeking services to aid them in their transition to the community.
Reducing recidivism is about changing the behavior of people who have committed crimes in the past. It is also about changing the business of the people who supervise, treat, and support people who are incarcerated and released to the community. Accordingly, anyone seeking to make sure recidivism reduction strategies are increasing public safety will need to look beyond reincarceration rates, which are driven by two factors: people returning to prison because of a sentence for a new crime; and/or people returning to prison because they violated a condition of their community supervision.
To what extent are reductions in recidivism highlighted in this report achieved by changes in rates at which people released from prison reoffend—as opposed to just tolerating more instances of non-compliance among people released from prison? Data immediately available from Georgia, North Carolina, Rhode Island, and Wisconsin describing felony conviction rates for people released from prison suggest success in changing the behaviors of people released from prison. Reconviction data, however, capture only instances of more serious felony offenses for which a prison sentence was deemed appropriate by the sentencing judge. Using all reconvictions or arrests as a measure of recidivism offers an opportunity to measure criminal justice involvement that may be more reflective of criminal behavior. The three-year reconviction rate (that is, reconviction for any crime, not only those that resulted in a return to prison) declined by 4.7 percent in Georgia and 9.8 percent in Wisconsin from 2007 to 2009. In addition to reconviction data, some states, such as Pennsylvania, match arrest data to prison release cohorts. Pennsylvania reported a 7-percent decline in one-year rearrest rates and a 2-percent decline in two-year rearrest rates from 2007–2011 release cohorts.
does a decline in reincarceration rates eqUate to increased pUblic safety?

ReduCING ReCidivism I 11
43.9 percent 40.8 percent 7.1 percent
Three-year recidivism rate for 2007 prison releases
Three-year recidivism rate for 2010 prison releases
Percent decline in recidivism rate
Pennsylvania17
2007 2008 2009 2010 2011 2012 2013
Prison Population 46,028 49,307 51,487 51,321 51,638 51,184 51,512
Admissions to Prison 18,601 19,049 18,859 18,518 19,960 20,238 21,816
Releases from Prison 16,832 15,591 16,331 18,417 19,364 20,439 21,815
2007 2008 2009 2010 2011 2012 2013
Parole Population 22,615 24,164 22,622 24,043 25,914 27,287 29,442
Parole violators: Technical Revocations* 3,371 2,947 3,161 2,869 2,516 3,386 3,161
Parole violators: New offense Revocations* 1,696 1,802 1,983 1,931 1,836 1,990 2,060
Parole violators: Graduated sanctions 1,875 2,050 1,864 1,770 1,852 1,695 2,823
Since 2006, Pennsylvania officials have made concerted efforts to address high recidivism rates and corrections costs by using evidence-based practices with correctional populations, such as risk assessment to inform interventions. Four Second Chance Act grants have been awarded to state agencies since 2009 to enhance reentry programs, including a Statewide Recidivism Reduction planning grant for the Pennsylvania Department of Corrections (PDOC) in 2012. In the same year, policymakers undertook a justice reinvestment approach and enacted sweeping legislation to reduce inefficiencies in the current corrections and parole systems and establish more cost-effective approaches to reduce recidivism among parolees. State officials point to various aspects of these initiatives as having contributed to the statewide reduction in recidivism, including the following:
■ Targeted reentry services. PDOC has adopted a wide range of evidence-based programs, including Thinking for a Change to address criminal thinking and behaviors; violence prevention programs; and prison-based therapeutic communities, which offer a therapeutic culture and environment in which individuals with substance use disorders receive treatment and other services in a housing area separated from the rest of the incarcerated population. Second Chance Act grants have supported many of these services, including a pilot program providing medical treatment for alcohol and opiate dependence, which PDOC plans to expand. Participants receive comprehensive case management and services and are connected to treatment in the community upon release.
* Revocations can be to prison or to local jails

12 I ReduCING ReCidivism
As policymakers intensify their focus on recidivism rates, states are finding that they need to build or expand capacity to collect and analyze corrections, probation, and parole data. In order to gain an accurate and meaningful picture of recidivism, states should incorporate the following in their practices to collect and report recidivism data:
1. A primary definition of recidivism; a common definition is a return to prison for a new offense or a technical violation within three years of release.
2. Various recidivism measures, including returns to prison, arrests, convictions, and violations of probation or parole conditions.
3. Information about the recidivism event, including whether it was a new offense or a technical violation, the offense type, and the geographic region.
4. Information about the offender, including risk level, age, gender, prior criminal histories, and behavioral health needs.
5. Consistent follow-up periods of one, two, and three years post-release.
6. Annual recidivism calculations.
7. Calculations based on all releases if computerized data are available (rather than a representative sample of releases).
TRACkiNG ANd RePoRTiNG ReCidivism
■ Incentives and sanctions. In PDOC’s Recidivism Risk Reduction Incentive program created in 2008, certain individuals convicted of nonviolent offenses can reduce their sentences through good behavior and participation in programs that target criminogenic risk factors. Additionally, the state uses a graduated sanctioning grid to respond to parole violations and is exploring a similar sanctioning system for probation.
■ Data collection and performance measurement. About 75 percent of halfway houses in the state are operated by private contractors. After studies found that individuals who had transitioned to the community
through the halfway houses had higher rates of recidivism than those who did not, PDOC implemented a performance incentive funding model in which contractors work with PDOC to establish baseline recidivism rates and then to review their recidivism rates every six months. Contractors can receive additional funds if they reduce recidivism below the baseline, or are at risk of having their contracts revoked if recidivism is above the baseline. Results from the first reporting period indicate a 16-percent reduction in recidivism among the contractors. To support continued progress, PDOC has provided training in cognitive-behavioral interventions to the contractors and is planning additional trainings.

ReduCING ReCidivism I 13
2007 2008 2009 2010 2011 2012 2013
Probation Population 25,302 26,201 25,360 25,049 24,097 23,546 22,658
Probation violators: Technical Revocations 650 307 200 247 193 300 434
Probation violators: New offense Revocations 993 823 860 754 713 867 940
The probation population refers to both felony and misdemeanor probation cases.
The State of Rhode Island operates a unified correctional system, meaning that all offenders (i.e., those awaiting trial, sentenced, and under community supervision) in the state are under the jurisdiction of the Rhode Island Department of Corrections (RIDOC). Rhode Island does not have county jails; therefore, offenders sentenced to any length of stay are housed at RIDOC’s Adult Correctional Institutions. The data in this table refer to the felony-level population and individuals with sentence lengths of one year or more; these numbers do not reflect the entire RIDOC inmate population.
54.0 percent 48.9 percent 5.1 percent
Three-year recidivism rate for 2004 prison releases
Three-year recidivism rate for 2010 prison releases
Percent decline in recidivism rate
2007 2008 2009 2010 2011 2012 2013
Prison Population 2,777 2,782 2,466 2,277 2,202 2,143 2,221
Admissions to Prison 2,483 2,379 2,404 2,151 2,015 1,927 1,875
Releases from Prison 2,467 2,545 2,723 2,596 2,324 2,106 1,884
In its entirety, this list does not represent current practices in most states; rather, it is a set of measures and standards that states should strive to incorporate. Maintaining reliable and useful systems of data collection requires considerable time and resources, and practices vary widely from state to state. Some states have changed how they define recidivism over time. As a result of these challenges and variations, many states are unable to calculate statewide recidivism rates or to analyze trends. Yet investments to track a variety of information in a consistent manner will help states understand trends, identify drivers, and inform new policies to effectively reduce recidivism.
A 2004 Executive Order from then-Governor Donald Carcieri created Rhode Island’s Steering Committee on Corrections Reform and Prisoner Reentry, which included directors, managers, and front-line workers from key state agencies representing corrections, labor, housing, human services, and youth and family services, among others. The committee initiated many
reforms in the state, including the expansion of the use of validated risk assessment tools in the Rhode Island Department of Corrections (RIDOC).
In 2007, state policymakers began a justice reinvestment process to develop further policy options addressing incarceration rates and corrections costs, some of which were enacted through legislation passed
Rhode Island18

14 I ReduCING ReCidivism
Safe, secure, orderly prisons—those are bedrock. But we can truly deliver on our commitment to the
safety of our citizens by also assuming leadership in implementing principles and practices that reduce
post-release recidivism.
a.t. Wall, Director, rhoDe islanD Department of corrections
in 2008. Since then, RIDOC’s population has seen a significant drop in commitment and releases, causing an overall population decrease of 18 percent. Supported by a 2012 Second Chance Act Statewide Recidivism Reduction grant, RIDOC is pursuing a variety of initiatives to build on the state’s progress, including expanding the implementation of evidence-based practices, strengthening the staff’s capabilities in the new practices, and adopting systems of quality assurance.
These various initiatives changed the state’s approach to prisoner reentry. State officials highlight these reforms in particular as contributing to the state’s reduction in recidivism:
■ Risk and need assessments. Reentry plans are created during an individual’s incarceration based on their assessed level of risk and need. RIDOC staff are trained in the Risk-Need-Responsivity (RNR) model of applying the three principles in case management and programs.19 Additionally, the policy changes enacted in 2008 required the use of risk assessments to inform parole release decisions.
■ Incentivizing compliance and participation in reentry programs. The 2008 legislation standardized RIDOC’s system of incentives for
behavior and added a component based on program participation. Depending on their crime, individuals incarcerated in RIDOC facilities may now earn up to 10 days per month of earned time toward their sentence for good behavior and additional time for participating in rehabilitation or work programs.
■ Targeted reentry programming. Individuals may receive a number of services—including education and employment programs, substance use treatment, and family support—to address needs and assist in their transition upon release. RIDOC is currently working to incorporate interventions to address criminal thinking, such as the evidence-based Thinking for a Change program.
■ Collaborating with local partners. RIDOC coordinates with local stakeholders through the state’s regional reentry councils, composed of elected local officials, community and faith-based organizations, law enforcement, service providers, and business leaders. The department is working to create standard operating procedures for referrals of high-risk individuals to the local councils, which help facilitate successful transitions to the community.

ReduCING ReCidivism I 15
33.5 percent 27.5 percent 17.9 percent
2007 2008 2009 2010 2011 2012 2013
Prison Population 23,430 24,598 24,460 24,400 23,306 22,160 22,167
Admissions to Prison 13,906 13,950 13,199 12,586 10,888 10,170 9,569
Releases from Prison 13,499 12,807 13,454 12,744 12,024 11,409 9,623
Three-year recidivism rate for 2007 prison releases
Three-year recidivism rate for 2010 prison releases
Percent decline in recidivism rate
To address high crime rates and corrections costs, the South Carolina legislature established the Sentencing Reform Commission in 2008 to review sentencing and corrections policies. Based on data from multiple agencies and input from a broad range of stakeholders, the commission recommended significant changes that were enacted in the Omnibus Crime Reduction and Sentencing Reform Act of 2010. The legislation created alternatives to incarceration for technical violations and ensured that more people receive supervision and support upon release from prison. The bill also designated a committee to produce annual reports on reductions in revocations and new felony convictions for people under probation or parole supervision. The reforms have resulted in cost savings for the state—in 2013, the state attributed a savings of more than $5 million to the new practices.
State officials highlight the following as key components of their efforts to reduce recidivism:
■ Expanding the use of risk assessments. Probation and parole agents of the South Carolina Department of Probation, Parole, and Pardon Services (SCDPPPS) must use a risk and need assessment to guide decisions about supervision and services. The South Carolina Department of Corrections (SCDC) has developed and fully implemented a risk assessment instrument specifically designed for the youthful offender population (ages 17 to 25). This instrument has been further developed, adapted, and piloted to meet the unique needs of SCDC’s female population, and will be expanded throughout all SCDC institutions this year.
South Carolina20
Admissions due to Probation Revocations 1,869 1,884 1,856 1,766 1,497 1,213 1,008 -46.1%
Admissions due to Parole Revocations 1,185 1,175 1,064 999 835 746 638 -46.2%
Admissions due to Community supervision Revocations 325 336 285 269 215 192 109 -66.5%
Revocations as a Percent of Admissions 24.3% 24.3% 24.3% 24.1% 23.4% 21.2% 18.3% -24.5%
2007 2008 2009 2010 2011 2012 2013Percent Change

16 I ReduCING ReCidivism
Since 2008, the Second Chance Act has advanced the reentry field by incubating a broad range of reentry programs. The landmark, bipartisan legislation authorized federal grants to support vital services—including employment training and assistance, substance use treatment, education, housing, family programming, mentoring, victims support, and other services—to make a person’s transition from prison or jail safer and more successful. As of September 2013, Second Chance Act programs had served nearly 90,000 individuals across 49 states and the District of Columbia.21
The Bureau of Justice Assistance has also used grant programs authorized under the Second Chance Act to position states not just to design or expand a reentry program, but also to change policies and build infrastructure that enables them to have an impact on recidivism rates across the entire state. Through the Second Chance Act Comprehensive Statewide Adult Recidivism Reduction Program, states have received millions of dollars in funding support toward system-wide reforms related to risk- and need-driven case planning and programming, as well as community supervision policies that research has shown can lead to reductions in recidivism. States participating in this grant program set specific recidivism reduction targets and track progress toward these goals. The grant program was created in direct response to challenges that leaders from all 50 states identified during a forum hosted by the National Reentry Resource Center in 2011. Georgia, Pennsylvania, and Rhode Island are among the 16 states that have received these specialized grants.
The seCoNd ChANCe ACT: iNvesTiNG iN PRoGRAm iNNovATioN ANd sYsTem-LeveL ChANGe
■ Training in effective supervision practices. Probation and parole agents receive regular trainings in core correctional skills, including the Effective Practices in Correctional Settings (EPICS) module. Developed by the University of Cincinnati, EPICS helps staff apply principles based on the RNR model. Funds from the Justice Reinvestment Initiative and Second Chance Act grant programs have supported these trainings, among other activities.
■ Focus on high-risk youth and young adults. In response to high rates of recidivism among youthful offenders, SCDC provides these individuals with intensive community supervision and services to help reduce technical violations of conditions of parole and ultimately reduce the rate of recidivism. Services to address family relationships, education,
employment, mental health, and substance use are among those available. All youthful offenders released from SCDC initially receive intensive supervision but, over time, may be reduced to a moderate level of supervision based upon their progress with their case plan and reassessments of their risk, needs, and strengths.
■ Addressing individual needs and responsivity factors. SCDC is expanding the use of telemedicine and telepsychiatry in its facilities in order to better address individuals’ health and behavioral health needs pre-release. Additionally, SCDC will soon start a virtual visitation program inside facilities to help maintain family and social relationships, fostering the support network that can be critical to a successful return to the community.

ReduCING ReCidivism I 17
56.2 percent 51.1 percent 9.1 percent
32.8 percent 29.6 percent 9.8 percent
Three-year return-to-prison rate for 2007 releases
Three-year reconviction rate for 2007 prison releases
Three-year return-to-prison rate for 2010 releases
Three-year reconviction rate for 2010 prison releases
Percent decline in return-to-prison rate
Percent decline in reconviction rate
Wisconsin22
2007 2008 2009 2010 2011 2012 2013
Prison Population 23,542 23,219 23,007 22,571 22,521 22,494 22,469
Admissions to Prison 14,249 14,739 14,651 14,758 13,659 12,607 12,674
Releases from Prison 13,976 15,107 14,903 15,237 13,763 12,668 12,725
2007 2008 2009 2010 2011 2012 2013
Probation Population 53,056 50,273 47,666 46,504 46,794 46,689 47,328
Probation violators: Technical Revocations* 2,172 2,001 1,858 1,663 1,481 1,395 1,501
Probation violators: New offense Revocations* 632 639 549 616 548 511 588
Parole Population 16,683 18,049 18,838 19,663 19,784 19,733 19,952
Parole violators: Technical Revocations* 3,269 2,904 3,055 2,876 2,739 2,665 2,548
Parole violators: New offense Revocations* 560 675 636 455 376 383 422
Wisconsin policymakers initiated a justice reinvestment process in 2008 to address projected growth in their prison population, driven by a 40-percent increase from 2000 to 2007 in the number of people admitted to prison because their community supervision was revoked. The following year, legislators established and funded an array of initiatives under the Becky Young Community Services to Reduce Recidivism appropriations law, which required the use of risk and need assessments,
intermediate sanctions, cognitive-behavioral interventions, and other evidence-based practices. Since 2009, state leaders have continued to invest in a wide range of correctional programs, policy changes, and partnerships to ensure that planning for reentry begins at intake and individuals receive the support needed to reduce their likelihood to reoffend. Corrections officials identified the following as examples of initiatives having an impact on recidivism in the state:
* Revocations to prison

18 I ReduCING ReCidivism
Established by the Second Chance Act, the National Reentry Resource Center (NRRC) provides education, training, and technical assistance to states, tribes, territories, local governments, community-based service providers, nonprofit organizations, and corrections institutions involved with prisoner reentry. The NRRC’s mission is to advance the reentry field by disseminating information to and from policymakers, practitioners, and researchers and by promoting evidence-based principles and best practices.
The NRRC is administered by the U.S. Department of Justice’s Bureau of Justice Assistance and is a project of the Council of State Governments Justice Center, in cooperation with the Urban Institute, the Association of State Correctional Administrators, the American Probation and Parole Association, the National Association of Counties, and other key partner organizations.
The NATioNAL ReeNTRY ResouRCe CeNTeR
Recidivism Reduction in CaliforniaIt is impossible to consider national trends in corrections and recidivism without accounting for the oversized impact the state of California has on these trends. The size of its prison population and high reincarceration rate among people released from prison put the state in a category of its own. Coupling the sheer dimensions of the California system with the scope of the reforms that the state has enacted in recent years, the transformation of California’s corrections system is on a scale unlike what any other state has experienced.
Until relatively recently, California incarcerated more adults in prison than any other state in the U.S.i Prisons in the state were notoriously crowded. Report after report pointed to the state’s failure to supervise parolees effectively; a 2003 report
■ Case planning and risk assessment. The Wisconsin Department of Corrections (WIDOC) uses an automated risk and needs assessment and a unified case planning system to assess individuals at intake into facilities or community corrections and reassess these individuals at various points during their sentence. Staff are in frequent contact with the individuals and regularly update case plans. All divisions and many agency partners share the same information system and are able to access assessments and information about program participation, which increases efficiency and ensures that interventions are appropriate for an individual’s most current needs.
■ Supporting employment readiness. WIDOC partners with the state’s 11 workforce development boards on the Windows to Work program, which offers comprehensive reentry services (3 to 9 months prior to release) and post-release
programming (for approximately 12 months after release) with a focus on skills training, financial literacy, and other assistance needed to help participants find and maintain employment.
■ Alternative sanctions to reduce revocations. Before reforms in 2009, low-level violations often resulted in revocations to prison. Community corrections agents are now able to use shorter jail stays as an alternative to revocation for individuals on extended supervision.
■ Investments in targeted services. In 2011, WIDOC expanded a variety of interventions designed to increase community-based alternatives to revocation, including cognitive behavioral programming, alcohol and drug treatment, education, vocational and employment opportunities, and treatment for individuals with serious mental disorders.

ReduCING ReCidivism I 19
i e. Ann Carson and daniela Golinelli, Prisoners in 2012 (Washington, dC: Bureau of Justice Statistics, u.S. department of Justice, 2013), www.bjs.gov/content/pub/pdf/p12tar9112.pdf. ii Little Hoover Commission, Back to the Community: Safe and Sound Parole Policies (Sacramento: Little Hoover Commission, 2003), www.lhc.ca.gov/studies/172/report172.pdf.iii Patrick A. Langan and david J. Levin, Recidivism of Prisoners Released in 1994 (Washington, dC: Bureau of Justice Statistics, u.S. department of Justice, 2002), www.bjs.gov/content/pub/pdf/rpr94.pdf.iv To be eligible, an individual must meet criteria as established under Penal Code section 3000.03. For these eligibility criteria, see www.cdcr.ca.gov/Parole/Non_Revocable_Parole/pdf/Non_Revocable_Parole_FAQs.pdf.v “CdCR implements public safety reforms to parole supervision, expanded incentive credit for inmates,” California department of Corrections and Rehabilitation, accessed July 26, 2011, www.insidecdcr.ca.gov/2010/01/cdcr-implements-public-safety-reforms-to-parole-supervision-expanded-incentive-credits-for-inmates/.vi California department of Corrections and Rehabilitation, Realignment Report: An Examination of Offenders Released from State Prison in the First Year of Public Safety Realignment (Sacramento: California department of Corrections and Rehabilitation, 2013), www.cdcr.ca.gov/Adult_Research_Branch/Research_documents/Realignment_1_Year_Report_12-23-13.pdf; California department of Corrections and Rehabilitation, 2013 Outcome Evaluation Report (Sacramento: California department of Corrections and Rehabilitation, 2013), www.cdcr.ca.gov/Adult_Research_Branch/Research_documents/Outcome_evaluation_Report_2013.pdf.
Prison Population 170,129 170,020 167,711 162,006 147,051 132,624 134,333 -21.0%
Parole Population 123,739 120,730 106,355 105,128 98,719 56,342 45,585 -63.2%
Correctional metrics 2007 2008 2009 2010 2011 2012 2013 Percent Change
Returns to Prison 2007 65.1% 2009 61.0% -6.3%
Reconvictions 2007 51.5% 2009 49.1% -4.7%
Three-Year Recidivism metrics
Release Cohort
Recidivism Rate
Release Cohort
Recidivism Rate
Percent Change
found that 70 percent of the state’s parole population returned to prison within 18 months of release, which was calculated to cost the state nearly $1 billion per year.ii The size of the state’s parole population and its high recidivism rates skewed national recidivism data; criminologists cited the Bureau of Justice Statistics’ 2002 report on prisoners released in 1994 that showed national recidivism data that incorporated California data (51.8 percent) and that did not incorporate California data (40.1 percent).iii
In the last three years, state leaders have fundamentally changed the policies of the California corrections system. Recognizing that parole revocations were a key driver of the prison population, lawmakers enacted Senate Bill (SB) 18 in 2009, which established a new type of “non-revocable” parole (NRP) for individuals, who, according to the validated risk assessment tool used by the California Department of Corrections and Rehabilitation (CDCR), did not pose a high risk to reoffend. Additional criteria were included in the statute that a person had to meet to be placed under NRP.iv Parole for people under NRP cannot be revoked for any reason; they can only be incarcerated again for a new crime.v Also enacted in 2009, SB 678 created the California Community Corrections Performance Incentive Program, which promoted the use of evidence-based strategies for reducing the rate of failure on probation. SB 678 also developed a mechanism for providing additional funding to probation departments via corrections expenditure savings realized through fewer revocations to prison.
Moving to comply with orders by federal court judges, the legislature enacted Assembly Bill (AB) 109 and AB 117. Known as the Public Safety Realignment Act of 2011, this law realigned custody responsibilities for a particular class of offenders—those identified as non-violent, non-serious, and non-sex offenders—from state to local jurisdictions and transferred post-release supervision responsibilities for this population from state parole officers to county probation officers.
Between 2010 and 2013, the state’s prison population declined by 17 percent, a decline unmatched by any other state. The number of adults on parole has dropped even more dramatically—from 105,128 in 2010 to 45,585 in 2013, a 57-percent decline.
What has happened to recidivism rates during this period? Preliminary data from the first year of Public Safety Realignment implementation reveal promising trends. The most recent data available, which are current through 2012, all show declines in recidivism from the previous year.vi This includes returns to prison, rearrests, and reconvictions at one year, two years, and three years post-release. Changes in three-year reincarceration and reconviction rates since 2007 (the main point of reference used in this report) show even greater declines over a longer period of time.
California’s recidivism rates are based on fiscal year cohorts; all correctional metrics presented here are based on calendar year data.

20 I ReduCING ReCidivism
APPeNdix: AddiTioNAL dATA oN ReCidivism, iNCARCeRATioN, ANd CRime
Colorado - 52.0% 52.0% 50.0% 49.0%
Connecticut - 43.9% 41.4% 40.3% 40.0%
Georgia - 28.9% 27.6% 26.6% 26.0%
North Carolina 35.8% - - - 28.9%
Pennsylvania - 43.9% 43.0% 38.9% 40.8%
Rhode Island 54.0% - - 47.8% 48.9%
South Carolina - 33.5% 30.6% 29.4% 27.5%
Wisconsin - 56.2% 53.4% 51.9% 51.1%
Prior to 2007
Three-Year Returns to Prison
2007 2008 2009 2010
Colorado - 33.0% 33.0% 34.0% 32.0% 29.0% 30.0%
Connecticut - 22.2% 19.5% 18.5% 18.4% 17.2% 18.3%
Georgia - 10.5% 8.8% 8.5% 7.9% 8.2% 8.8%
North Carolina 12.7% - - 12.0% - 11.1% 10.2%
Pennsylvania - 23.4% 22.0% 20.1% 22.5% 24.4% 24.7%
Rhode Island 31.8% - - 30.6% 31.2% - 33.2%
South Carolina - 13.1% 12.3% 11.9% 9.9% - 8.2%
Wisconsin - 32.4% 31.6% 31.9% 30.0% 28.6% 27.0%
Prior to 2007
one-Year Returns to Prison
2007 2008 2009 2010 2011 2012
Colorado 3,351 2,994 -10.7% 472 392 -17.0%
Connecticut 2,772 2,423 -12.6% 413 333 -19.4%
Georgia 4,381 3,790 -13.5% 569 542 -4.8%
North Carolina 4,548 3,723 -18.1% 364 357 -1.9%
Pennsylvania 2,780 2,515 -9.5% 363 398 9.6%
Rhode Island 2,826 2,825 -0.04% 235 190 -19.2%
South Carolina 5,081 4,381 -13.8% 527 458 -13.1%
Wisconsin 3,135 2,734 -12.8% 398 357 -10.3%
National Crime Figures, 2007 and 2012
index Crime Rate BJs incarceration Rate2007 20072012 2012Change Change

ReduCING ReCidivism I 21
Colorado 472 472 454 452 427 392
Connecticut 413 407 383 372 350 333
Georgia 569 543 565 563 547 542
North Carolina 364 370 372 371 362 357
Pennsylvania 363 390 407 402 403 398
Rhode Island 235 239 211 198 197 190
South Carolina 527 521 515 492 473 458
Wisconsin 398 399 395 386 385 357
incarceration Rates, by Year
2007 2008 2009 2010 2011 2012
Colorado 3,351 3,175 3,010 2,998 2,910 2,994
Connecticut 2,772 2,798 2,649 2,471 2,428 2,423
Georgia 4,381 4,494 4,101 4,042 4,015 3,790
North Carolina 4,548 4,510 4,068 3,806 3,847 3,723
Pennsylvania 2,780 2,822 2,581 2,540 2,587 2,515
Rhode Island 2,836 3,098 2,871 2,819 2,909 2,825
South Carolina 5,081 4,971 4,584 4,508 4,518 4,381
Wisconsin 3,135 3,038 2,871 2,758 2,700 2,734
index Crime Rates, by Year
2007 2008 2009 2010 2011 2012

22 I ReduCING ReCidivism
1 The most notable of these studies is Douglas Lipton, Robert Martinson, and Judith Wilks’ 1975 publication The Effectiveness of Correctional Treatment: A Survey of Treatment Evaluation Studies.2 California, Delaware, Georgia, Nebraska, New Jersey, New York, and West Virginia are examples of states where governors highlighted reentry and recidivism-reduction efforts in their 2014 state-of-the-state addresses.3 A requirement of the Second Chance Act Adult Reentry Demonstration program is that grantees form a reentry task force that includes state and local stakeholders. Since 2009, adult demonstration grants have been awarded to 67 counties, cities, and tribes and to state-level agencies in 30 states. In addition, in 2008, Public/Private Ventures highlighted a number of cities’ reentry task forces in the publication From Options to Action: A Roadmap for City Leaders to Connect Formerly Incarcerated Individuals to Work.4 Council of State Governments Justice Center, States Report Reductions in Recidivism (New York: Council of State Governments Justice Center, 2012), csgjusticecenter.org/documents/0000/1569/9.24.12_Recidivism_Reductions_9-24_lo_res.pdf.5 Matthew R. Durose, Alexia D. Cooper, and Howard N. Snyder, Recidivism of Prisoners Released in 30 States in 2005: Patterns from 2005 to 2010 (Washington, DC: Bureau of Justice Assistance, U.S. Department of Justice, 2014), www.bjs.gov/content/pub/pdf/rprts05p0510.pdf.6 The Association of State Correctional Administrators’ Performance Measures Committee defines recidivism as a return to prison and has developed a set of standards for measuring outcomes to promote more uniform definitions across states. For more information, visit the project’s website at www.asca.net/projects/1.7 Recidivism is defined as a return to prison or inmate status in Colorado within three years of release for either new criminal activity or a technical violation of parole, probation, or non-departmental community placement. Colorado’s recidivism rates are based on calendar year cohorts; criminal justice trends are based on fiscal year data.8 Colorado Commission on Criminal and Juvenile Justice, Colorado Commission on Criminal and Juvenile Justice 2008 Annual Report (Denver: Colorado Department of Public
Safety, 2008), www.ccjrc.org/pdf/CCCJJ_2008_Report.pdf. 9 Elizabeth Drake, Steve Aos, and Marna Miller, “Evidence-Based Public Policy Options to Reduce Crime and Criminal Justice Costs: Implications in Washington State,” Victims and Offenders 4 (2009): 170–96, www.wsipp.wa.gov/rptfiles/09-00-1201.pdf.10 For additional information, see the American Probation and Parole Association’s recent publication focusing on evidence-based practices in community supervision: American Probation and Parole Association, Effective Responses to Offender Behavior: Lessons Learned for Probation and Parole Supervision (Lexington: American Probation and Parole Association, 2013), www.appa-net.org/eWeb/docs/APPA/pubs/EROBLLPPS-Report.pdf. 11 Council of State Governments Justice Center, The National Summit on Justice Reinvestment and Public Safety (New York: Council of State Governments Justice Center, 2011), csgjusticecenter.org/wp-content/uploads/2012/08/JR_Summit_Report_Final.pdf.12 Available at csgjusticecenter.org/reentry/reentry-checklists.13 Recidivism is calculated for sentenced inmates released from CTDOC and subsequently returned to custody for new convictions or technical violations within the specified follow-up period (one, two, and three years). Connecticut’s recidivism rates are based on calendar year cohorts; criminal justice trends are based on calendar year data.14 Probation revocations dropped from 400 in July 2003 to 200 in September 2005.15 Recidivism is calculated as the conviction for a new felony within a specified tracking period for (1) Georgia inmates released from DOC custody, and (2) Georgia probationers either starting or successfully completing their probationary sentences. Follow-up periods range from 6 months to 180 months, but the most commonly reported rate is 36 months, or 3 years. Georgia also calculates return-to-prison rates for the same array of tracking periods. Georgia’s recidivism rates are based on fiscal year cohorts; criminal justice trends are based on fiscal year data.16 In general, North Carolina defines recidivism broadly to cover the offender’s possible span of re-involvement in the North Carolina criminal justice system, to include rearrests, reconvictions, and reincarcerations. For this
eNdNoTes

ReduCING ReCidivism I 23
report, reincarceration is defined as any return to a North Carolina prison for a new criminal offense or revocation of parole, post-release, or probation supervision. These figures represent rates of returns to North Carolina state prisons. Official recidivism rates are produced on schedules according to North Carolina statutes. These rates should not be confused with or compared to official re-incarceration rates because different methodologies may have been employed in providing data for this report. For more information on recidivism statistics for North Carolina, please link to www.nccourts.org/Courts/CRS/Councils/spac/Publication/Recidivism/AdultRec.asp. North Carolina’s recidivism rates are based on calendar year cohorts; criminal justice trends are based on fiscal year data.17 Recidivism is calculated as the return to state DOC custody (which may include prison, county jail, or a Parole Violator Center) for Pennsylvania state inmates released and subsequently re-incarcerated within the specified follow-up period (one or three years). Pennsylvania also calculates re-arrest rates; the first instance of a re-arrest or re-incarceration event is counted toward the state’s overall recidivism rate. Please note that the latest 1-year and 3-year recidivism rates are not yet published and should be considered preliminary at this time. Pennsylvania’s recidivism rates are based on calendar year cohorts; criminal justice trends are based on calendar year data.18 Rhode Island defines recidivism as sentenced releases who return to RIDOC as sentenced commitments. The release cohorts include all release events from incarceration including offenders released to probation and parole supervision, as only 8 percent of sentenced releases are released to parole supervision and upwards of 90 percent of inmates who expire a sentence have probation supervision upon release. Additionally, because Rhode Island operates a unified correctional system, both misdemeanor and felony level offenders are included in the release cohorts. As 60 to 65 percent of Rhode Island’s sentenced population are committed for less than 6 months, it is possible that individual offenders can be released from sentenced
incarceration more than one time in a calendar year and therefore be included as a sentenced release multiple times in a release cohort. Due to these short sentences, RIDOC’s definition of recidivism is based on release events and not individual people. Rhode Island’s recidivism rates are based on calendar year cohorts; criminal justice trends are based on calendar year data.19 James Bonta and Don A. Andrews, Risk-Need-Responsivity Model for Offender Assessment and Rehabilitation (Ottawa: Public Safety Canada, 2007).20 In South Carolina, recidivism is calculated for SCDC state inmates released from custody and subsequently returned to prison within the specified follow-up period (one, two, or three years). An SCDC state inmate is an individual who received a prison sentence of greater than 90 days. South Carolina’s recidivism rates are based on fiscal year cohorts; criminal justice trends are based on fiscal year data.21 Bureau of Justice Assistance, Fact Sheet on Second Chance Act Grant Program Accomplishments: October 2009 – September 2013 (Washington, DC: Bureau of Justice Assistance, U.S. Department of Justice, 2014), www.bja.gov/Publications/SCA-FS-Oct09-Sep13.pdf; Office of Juvenile Justice and Delinquency Prevention, Fact Sheet on OJJDP Second Chance Act Grant Program Accomplishments: July 2009 – June 2013 (Washington, DC: Bureau of Justice Assistance, U.S. Department of Justice, 2014), www.ojjdp-dctat.org/help/SCAFactSheetJan2009Jun2013.pdf.22 In Wisconsin, recidivism is defined as a criminal offense resulting in a new conviction and sentence to WI DOC (probation or prison) during the specified follow-up period (one or three years). The date of the offense is the date of the recidivism event. For this report, Wisconsin also calculated re-incarceration rates which can include short-term admissions for offenders who have violated the terms and conditions of supervision, but have not been revoked. Wisconsin’s recidivism rates are based on calendar year cohorts; criminal justice trends are based on calendar year data.

24 I ReduCING ReCidivism
Suggested citation: Council of State Governments Justice Center, Reducing Recidivism: States Deliver Results (New York: Council of State Governments Justice Center, 2014)
This project was supported by Grant No. 2012-CZ-BX-K071 awarded by the Bureau of Justice Assistance. The Bureau of Justice Assistance is a component of the Office of Justice Programs, which also includes the Bureau of Justice Statistics, the National Institute of Justice, the Office of Juvenile Justice and Delinquency Prevention, the Office for Victims of Crime, the Community Capacity Development Office, and the Office
of Sex Offender Sentencing, Monitoring, Apprehending, Registering, and Tracking. Points of view or opinions in this document are those of the author and do not necessarily represent the official position or
policies of the U.S. Department of Justice. To learn more about the Bureau of Justice Assistance, please visit ojp.usdoj.gov/BJA.
The Council of State Governments Justice Center is a national nonprofit organization that serves policymakers at the local, state, and federal levels from all branches of government. It provides practical, nonpartisan advice and evidence-based, consensus-driven strategies to increase public safety and strengthen communities. To learn more
about the Council of State Governments Justice Center, please visit csgjusticecenter.org.
Established by the Second Chance Act, the National Reentry Resource Center (NRRC) provides education, training, and technical assistance to states, tribes, territories, local governments, community-based service
providers, non-profit organizations, and corrections institutions involved with prisoner reentry. The NRRC’s mission is to advance the reentry field by disseminating information to and from policymakers, practitioners, and researchers and by promoting evidence-based principles and best practices. The NRRC is administered
by the U.S. Department of Justice’s Bureau of Justice Assistance and is a project of the Council of State Governments Justice Center, in cooperation with the Urban Institute, the National Association of Counties,
the Association of State Correctional Administrators, the American Probation and Parole Association, and other key partner organizations. To learn more about the National Reentry Resource Center,
please visit csgjusticecenter.org/nrrc.