Embed Size (px)
Citation preview
Whole hippocampushigh-resolution optical imaging
Ludovico SilvestriEuropean Laboratory for Non-linear Spectroscopy
Florence
Pavone’s Lab @ LENS
Advanced microscopy methods for neuroscience
Biomedical label-free imaging
Single-molecule biophysics
Pavone’s Lab @ LENS
Advanced microscopy methods for neuroscience
Biomedical label-free imaging
Single-molecule biophysics
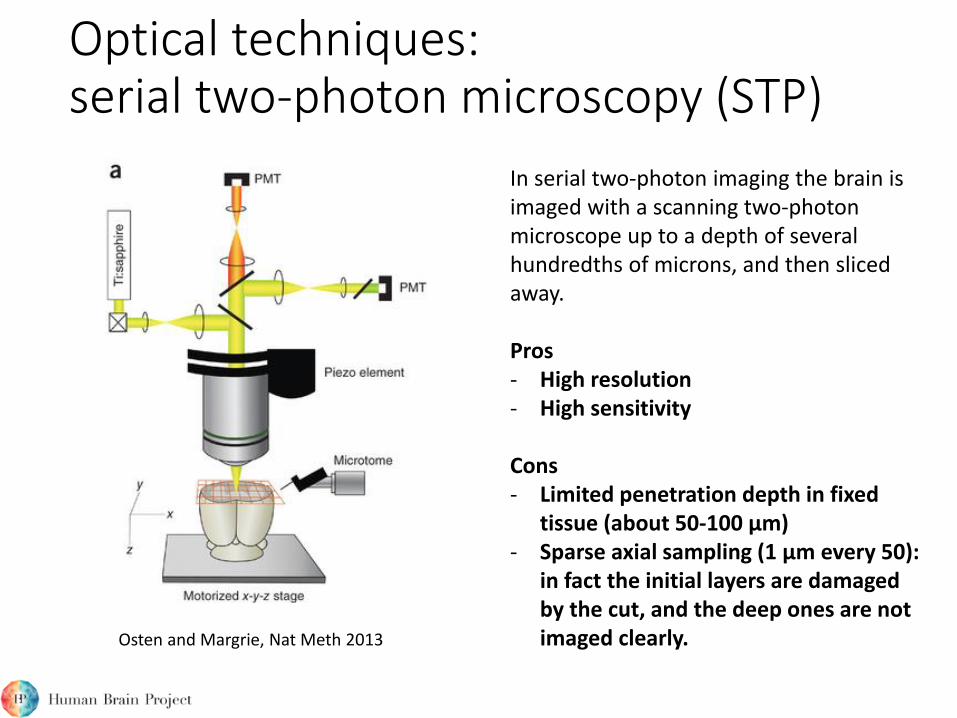
Optical techniques:serial two-photon microscopy (STP)
Osten and Margrie, Nat Meth 2013
In serial two-photon imaging the brain isimaged with a scanning two-photonmicroscope up to a depth of severalhundredths of microns, and then slicedaway.
Pros- High resolution- High sensitivity
Cons- Limited penetration depth in fixed
tissue (about 50-100 µm)- Sparse axial sampling (1 µm every 50):
in fact the initial layers are damagedby the cut, and the deep ones are notimaged clearly.
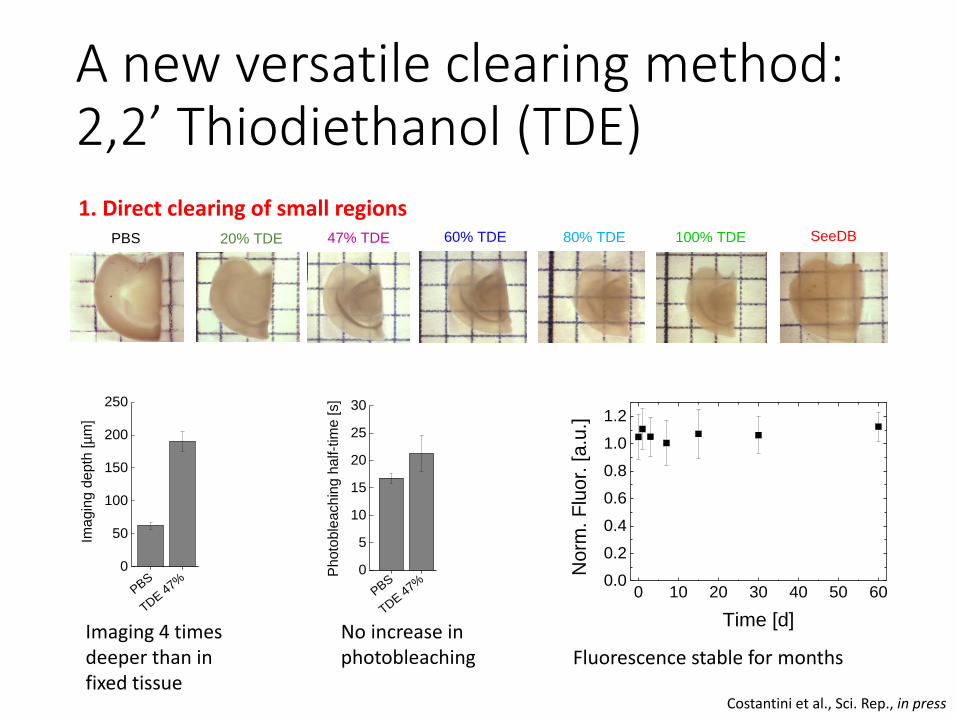
A new versatile clearing method: 2,2’ Thiodiethanol (TDE)1. Direct clearing of small regions
60% TDE 80% TDE 100% TDEPBS SeeDB20% TDE 47% TDE
Costantini et al., Sci. Rep., in press
PBS
TDE 47%
0
50
100
150
200
250
Imagin
g d
epth
[µ
m]
PBS
TDE 47%
0
5
10
15
20
25
30
Photo
ble
achin
g h
alf-t
ime [
s]
0 10 20 30 40 50 600.0
0.2
0.4
0.6
0.8
1.0
1.2
No
rm.
Flu
or.
[a
.u.]
Time [d]Imaging 4 timesdeeper than in fixed tissue
No increase in photobleaching Fluorescence stable for months
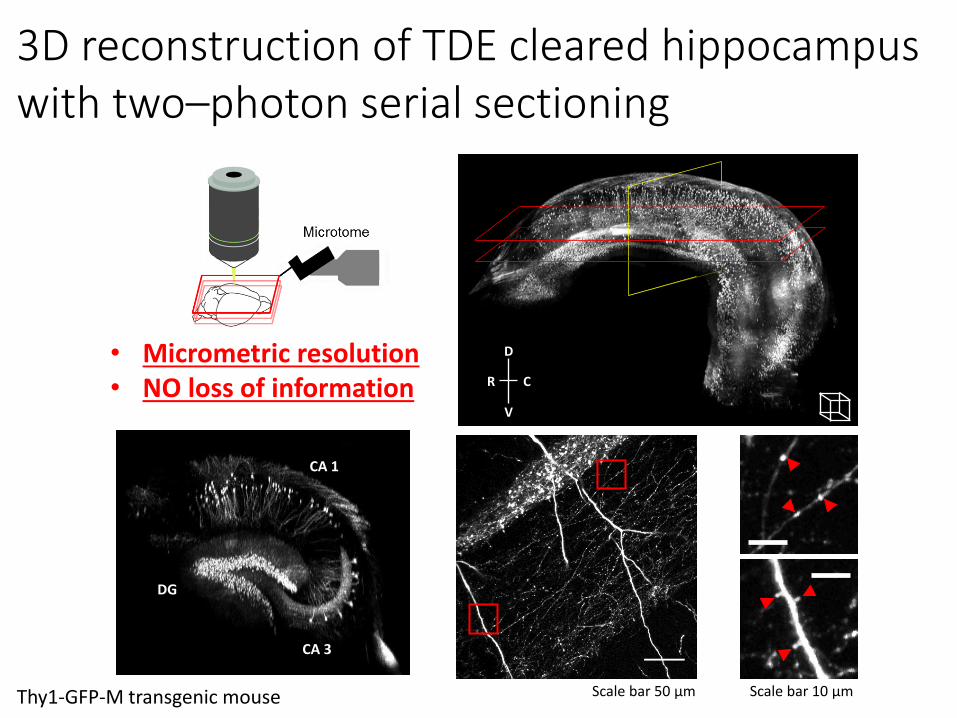
DG
CA 1
CA 3
D
V
CR
3D reconstruction of TDE cleared hippocampuswith two–photon serial sectioning
• Micrometric resolution• NO loss of information
Scale bar 10 µmScale bar 50 µmThy1-GFP-M transgenic mouse
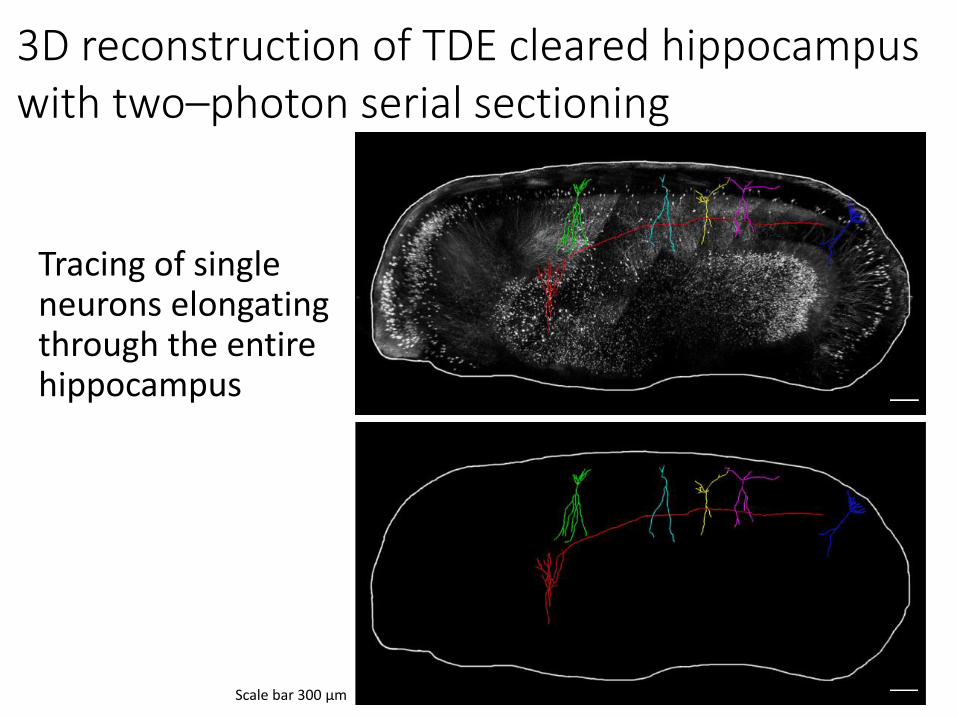
Tracing of single neurons elongating through the entire hippocampus
Scale bar 300 µm
3D reconstruction of TDE cleared hippocampuswith two–photon serial sectioning
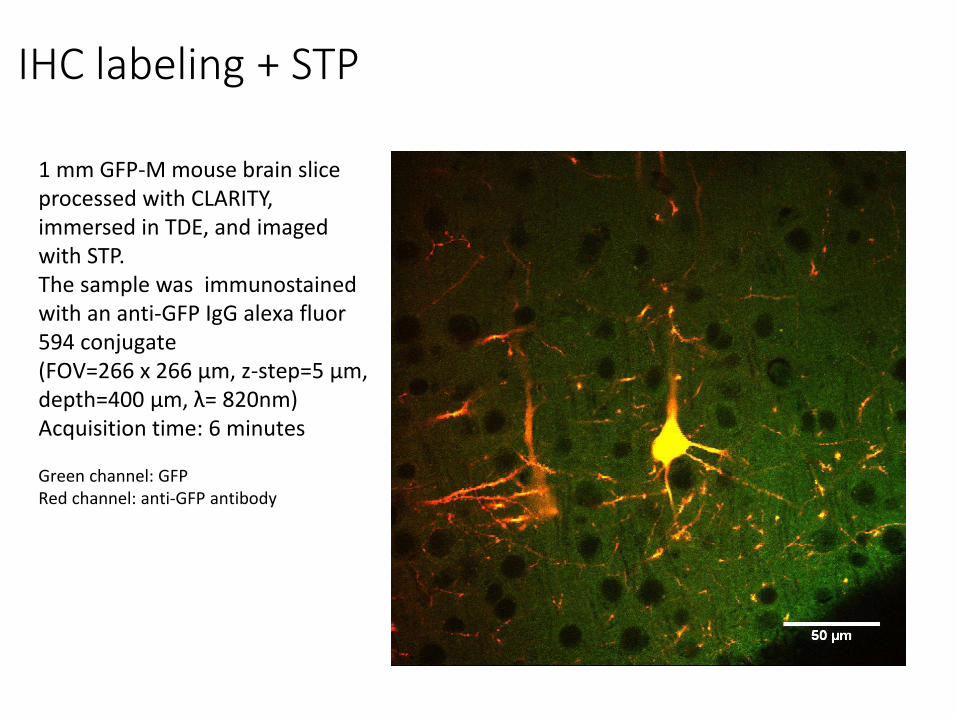
IHC labeling + STP
1 mm GFP-M mouse brain sliceprocessed with CLARITY, immersed in TDE, and imagedwith STP.The sample was immunostainedwith an anti-GFP IgG alexa fluor594 conjugate(FOV=266 x 266 µm, z-step=5 µm, depth=400 µm, λ= 820nm)Acquisition time: 6 minutes
Green channel: GFPRed channel: anti-GFP antibody
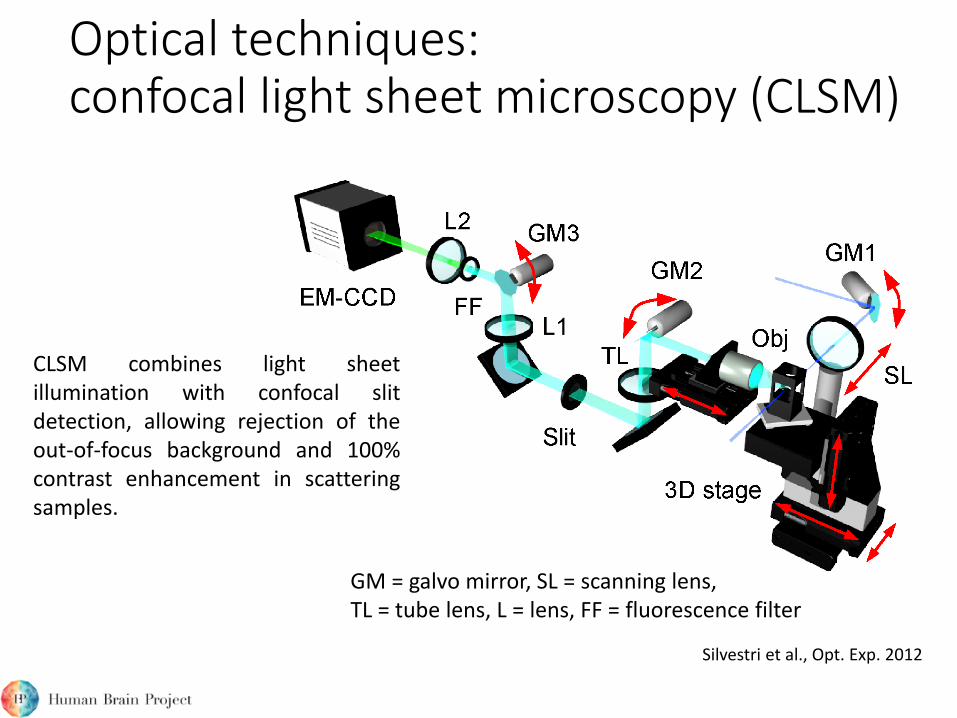
Optical techniques:confocal light sheet microscopy (CLSM)
GM = galvo mirror, SL = scanning lens,TL = tube lens, L = lens, FF = fluorescence filter
Silvestri et al., Opt. Exp. 2012
CLSM combines light sheetillumination with confocal slitdetection, allowing rejection of theout-of-focus background and 100%contrast enhancement in scatteringsamples.
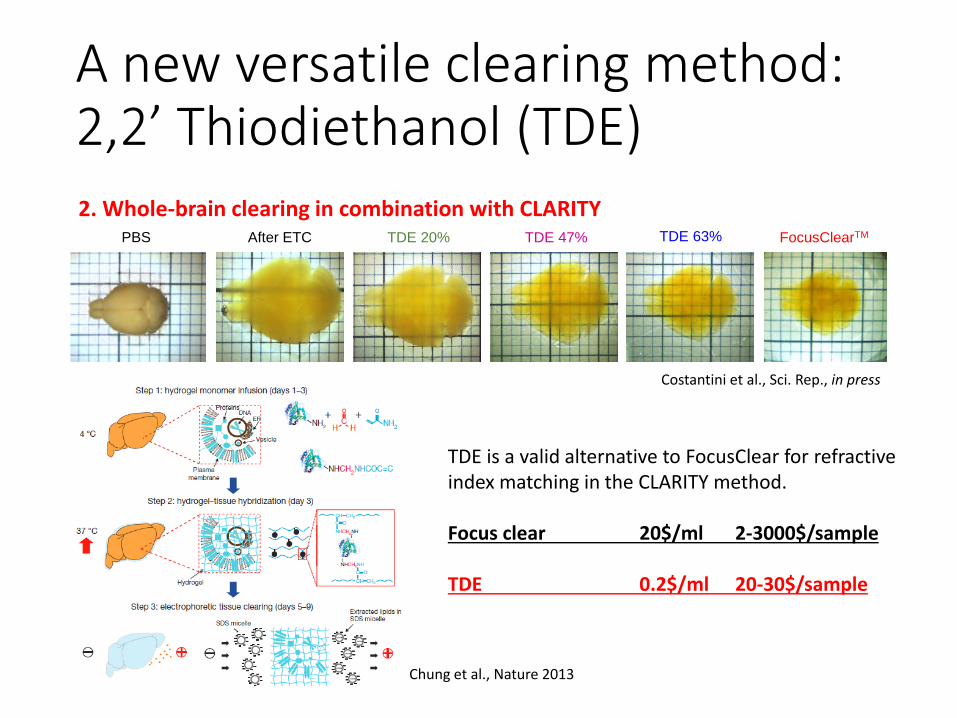
A new versatile clearing method: 2,2’ Thiodiethanol (TDE)
PBS After ETC TDE 20% TDE 47% TDE 63% FocusClearTM
2. Whole-brain clearing in combination with CLARITY
Chung et al., Nature 2013
TDE is a valid alternative to FocusClear for refractiveindex matching in the CLARITY method.
Focus clear 20$/ml 2-3000$/sample
TDE 0.2$/ml 20-30$/sample
Costantini et al., Sci. Rep., in press
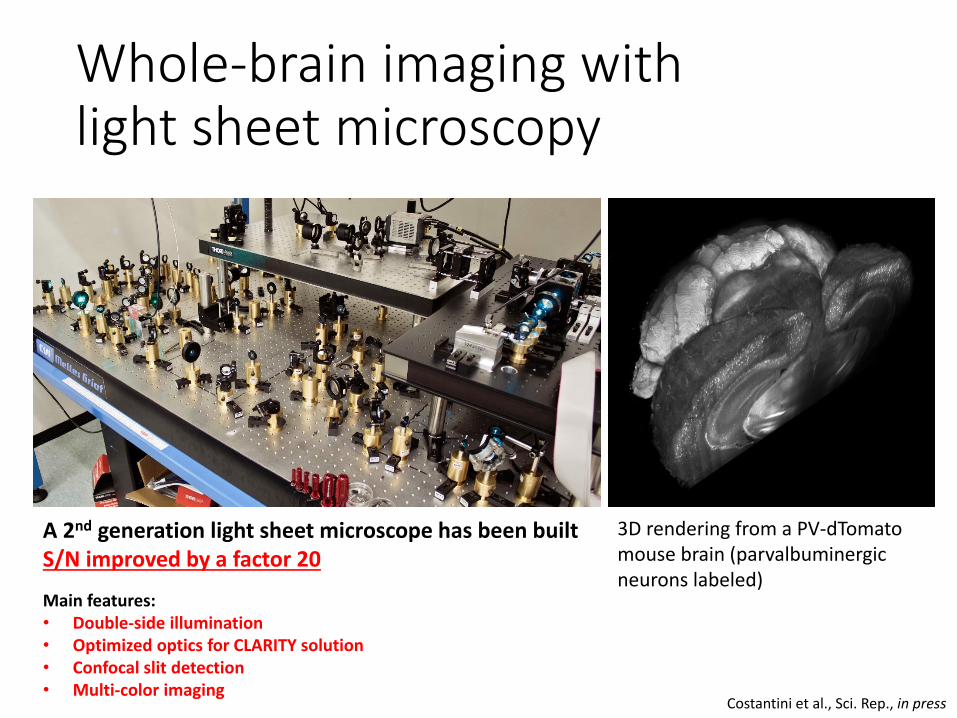
Whole-brain imaging with light sheet microscopy
a
3D rendering from a PV-dTomatomouse brain (parvalbuminergicneurons labeled)
A 2nd generation light sheet microscope has been builtS/N improved by a factor 20
Main features:• Double-side illumination• Optimized optics for CLARITY solution• Confocal slit detection• Multi-color imaging
Costantini et al., Sci. Rep., in press
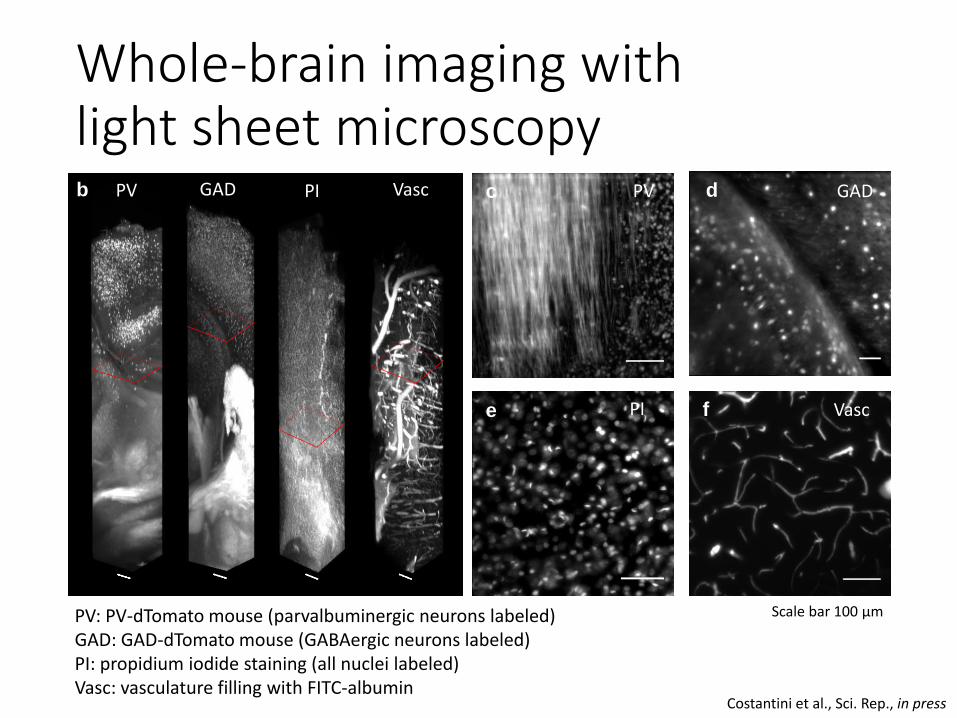
Whole-brain imaging with light sheet microscopy
PV GAD PI Vascb dc
e f
PV GAD
PI Vasc
PV: PV-dTomato mouse (parvalbuminergic neurons labeled)GAD: GAD-dTomato mouse (GABAergic neurons labeled)PI: propidium iodide staining (all nuclei labeled)Vasc: vasculature filling with FITC-albumin
Scale bar 100 µm
Costantini et al., Sci. Rep., in press
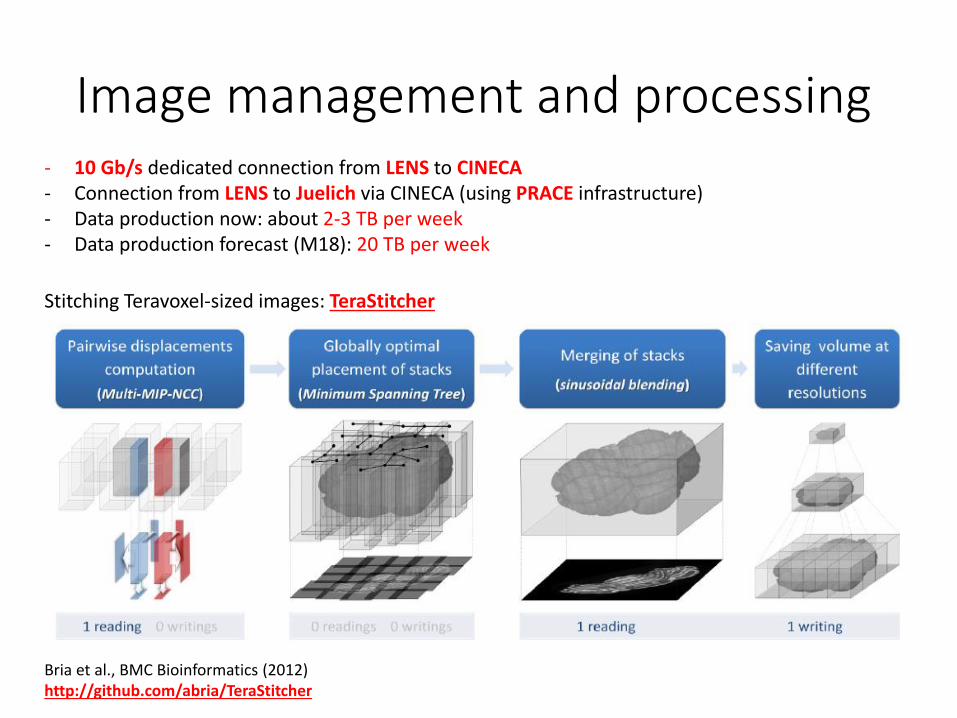
Image management and processing- 10 Gb/s dedicated connection from LENS to CINECA- Connection from LENS to Juelich via CINECA (using PRACE infrastructure)- Data production now: about 2-3 TB per week- Data production forecast (M18): 20 TB per week
Stitching Teravoxel-sized images: TeraStitcher
Bria et al., BMC Bioinformatics (2012)http://github.com/abria/TeraStitcher
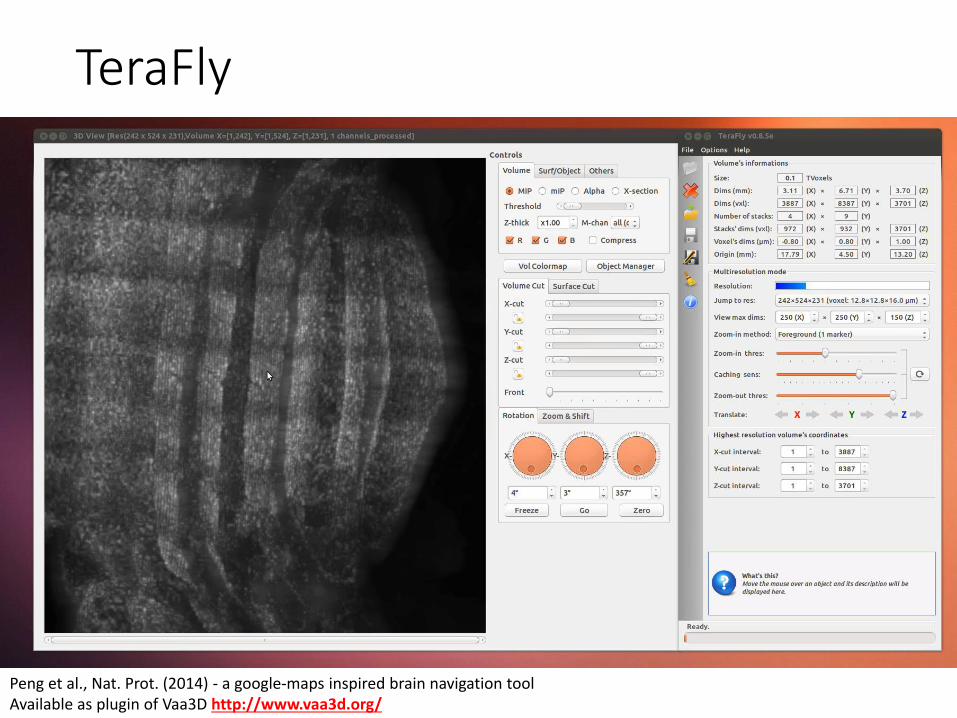
TeraFly
Peng et al., Nat. Prot. (2014) - a google-maps inspired brain navigation toolAvailable as plugin of Vaa3D http://www.vaa3d.org/
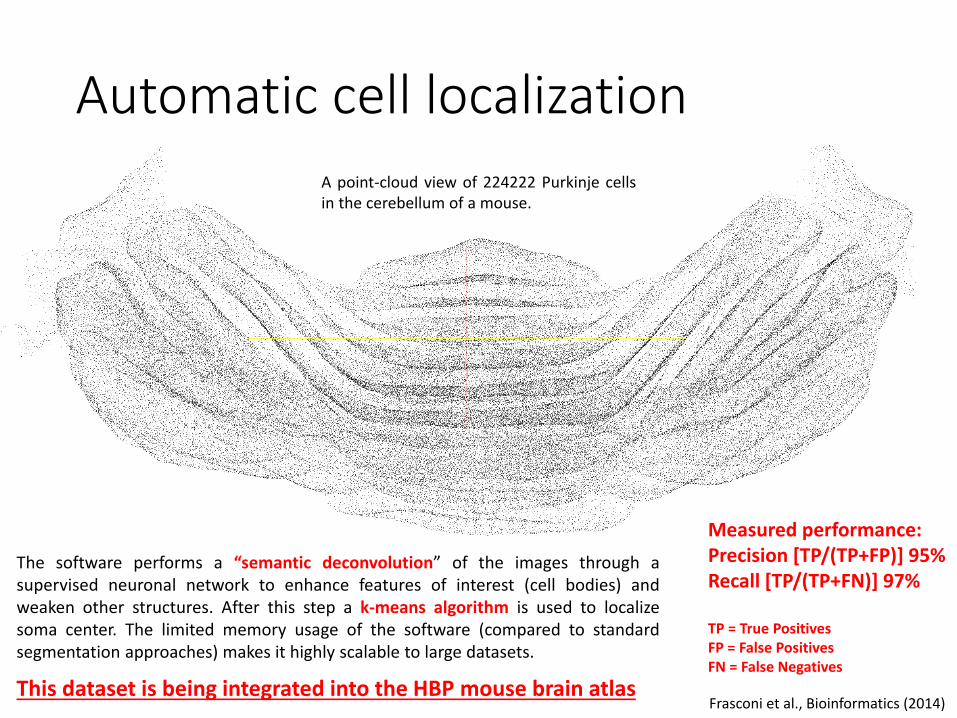
Automatic cell localization
The software performs a “semantic deconvolution” of the images through asupervised neuronal network to enhance features of interest (cell bodies) andweaken other structures. After this step a k-means algorithm is used to localizesoma center. The limited memory usage of the software (compared to standardsegmentation approaches) makes it highly scalable to large datasets.
Frasconi et al., Bioinformatics (2014)
Measured performance:Precision [TP/(TP+FP)] 95%Recall [TP/(TP+FN)] 97%
TP = True PositivesFP = False PositivesFN = False Negatives
A point-cloud view of 224222 Purkinje cellsin the cerebellum of a mouse.
This dataset is being integrated into the HBP mouse brain atlas
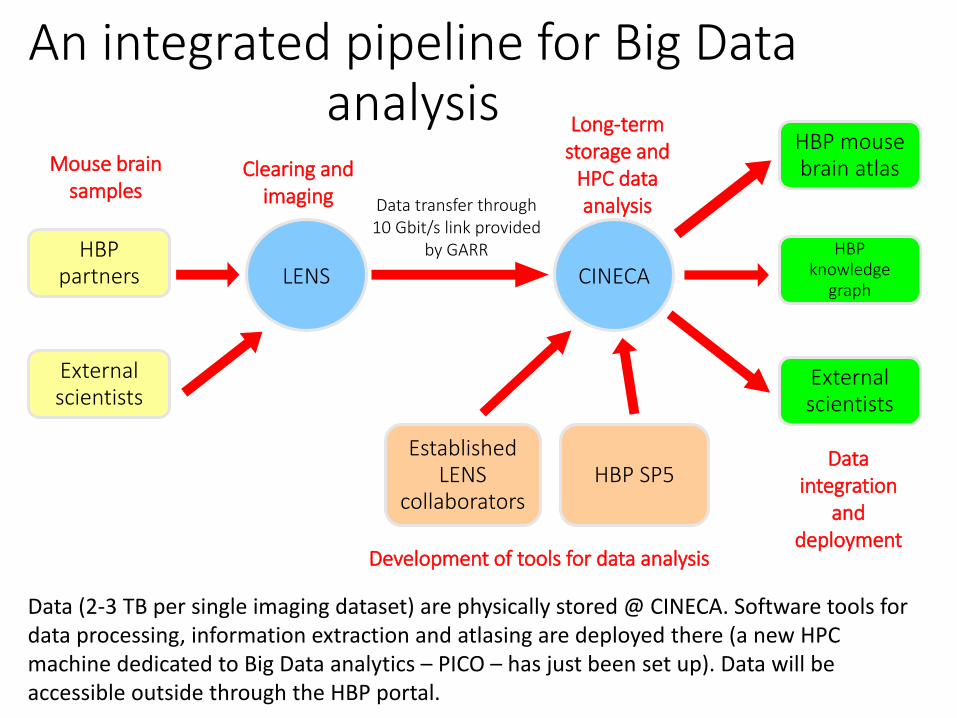
LENS CINECA
Data transfer through10 Gbit/s link provided
by GARR
Mouse brain samples
Clearing and imaging
Long-term storage and
HPC data analysis
Data integration
and deployment
Development of tools for data analysis
HBP partners
External scientists
HBP mouse brain atlas
Established LENS
collaborators
HBP knowledge
graph
External scientists
HBP SP5
Data (2-3 TB per single imaging dataset) are physically stored @ CINECA. Software tools for data processing, information extraction and atlasing are deployed there (a new HPC machine dedicated to Big Data analytics – PICO – has just been set up). Data will be accessible outside through the HBP portal.
An integrated pipeline for Big Data analysis
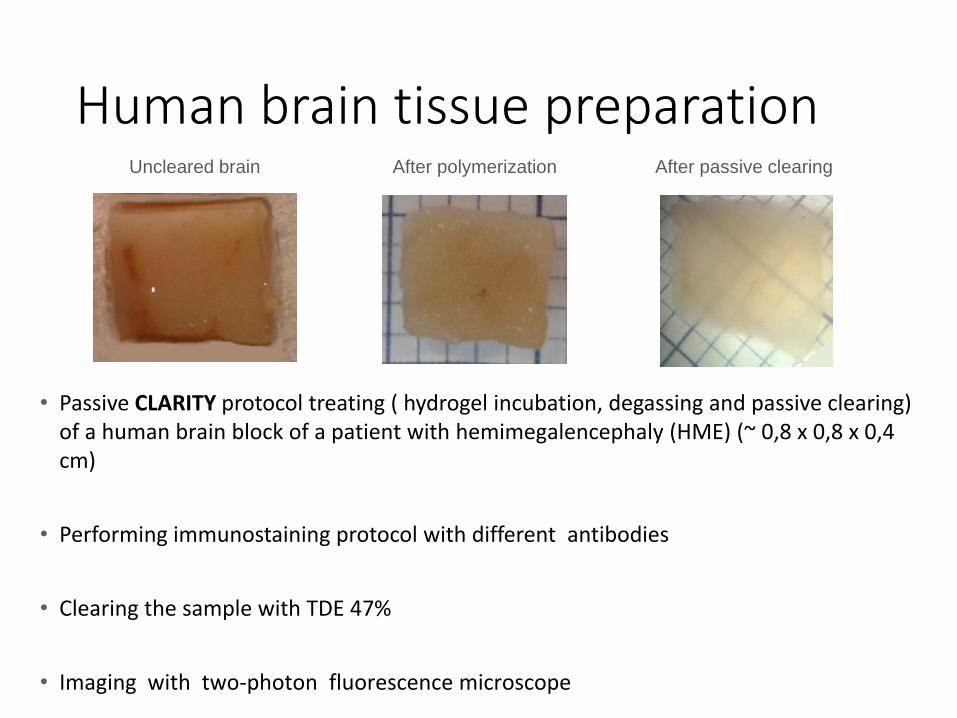
Human brain tissue preparationUncleared brain After polymerization After passive clearing
• Passive CLARITY protocol treating ( hydrogel incubation, degassing and passive clearing) of a human brain block of a patient with hemimegalencephaly (HME) (~ 0,8 x 0,8 x 0,4 cm)
• Performing immunostaining protocol with different antibodies
• Clearing the sample with TDE 47%
• Imaging with two-photon fluorescence microscope
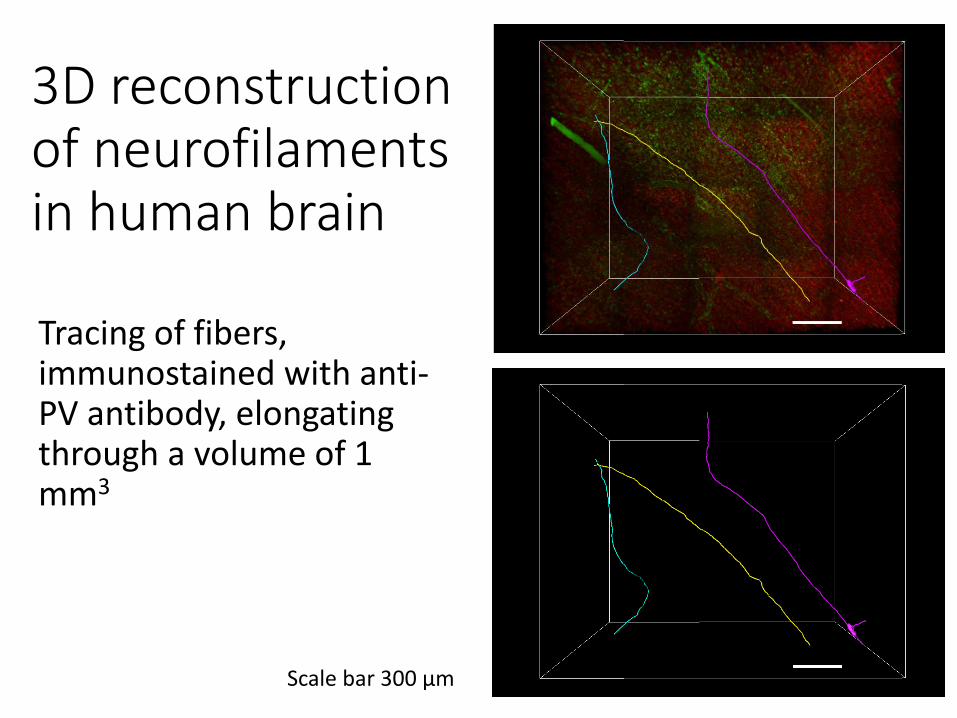
3D reconstructionof neurofilamentsin human brain
Tracing of fibers, immunostained with anti-PV antibody, elongating through a volume of 1 mm3
Scale bar 300 µm
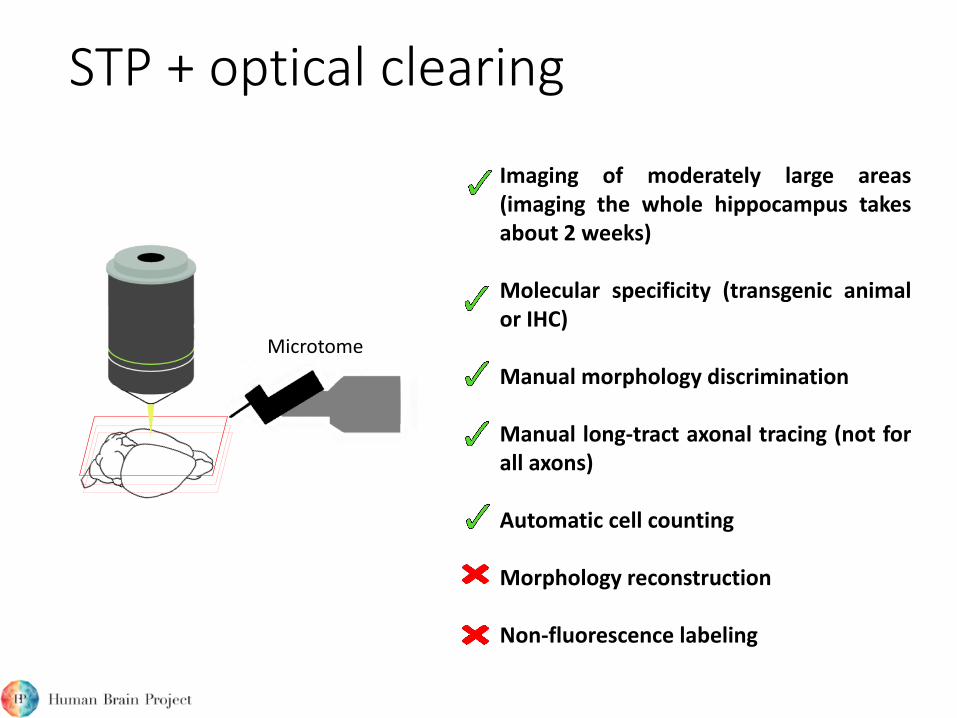
STP + optical clearing
Imaging of moderately large areas(imaging the whole hippocampus takesabout 2 weeks)
Molecular specificity (transgenic animalor IHC)
Manual morphology discrimination
Manual long-tract axonal tracing (not forall axons)
Automatic cell counting
Morphology reconstruction
Non-fluorescence labeling
Microtome
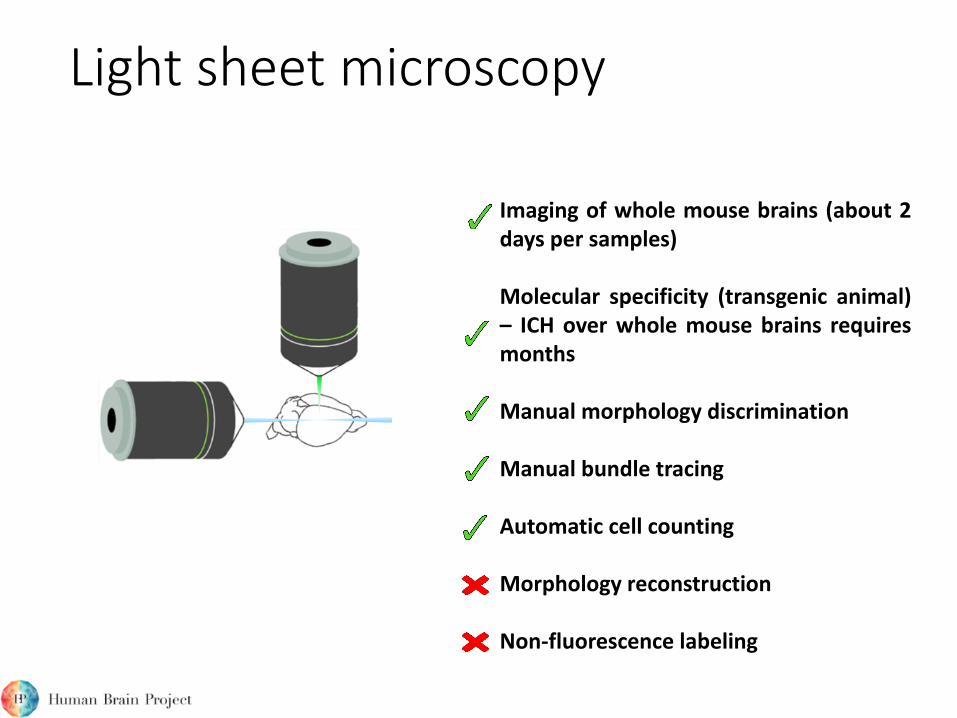
Light sheet microscopy
Imaging of whole mouse brains (about 2days per samples)
Molecular specificity (transgenic animal)– ICH over whole mouse brains requiresmonths
Manual morphology discrimination
Manual bundle tracing
Automatic cell counting
Morphology reconstruction
Non-fluorescence labeling
People involved and collaborationsFlorence: LENS and UniversityFrancesco Saverio Pavone (Principal Investigator)Leonardo Sacconi (light sheet microscopy and serial two-photon)Anna Letizia Allegra Mascaro (serial two-photon)Marie Caroline Muellenbroich (light sheet microscopy)Irene Costantini (clearing methods)Antonino Paolo di Giovanna (serial two-photon)Paolo Frasconi (automatic cell localization)
Rome: University Campus Bio-medicoGiulio Iannello (image stitching)Alessandro Bria (image visualization)
École Polytechnique Fédérale de LausanneJean-Pierre Ghobril (vasculature and brain mapping)Henry Markram (brain mapping)
University of ZurichBruno Weber (vasculature mapping)Matthias Schneider (vessel segmentation)
University of EdinburghFei Zhu (synaptic puncta mapping)Seth Grant (synaptyic puncta mapping)
Seattle: Allen Institute for Brain SciencesHanchuan Peng (image visualization)
Florence: Meyer Paediatric HospitalRenzo Guerrini (human brain samples)Valerio Conti (human brain samples)
Juelich: ForschungszentrumKatrin Amunts (human brain mapping)Karl Zilles (human brain mapping)
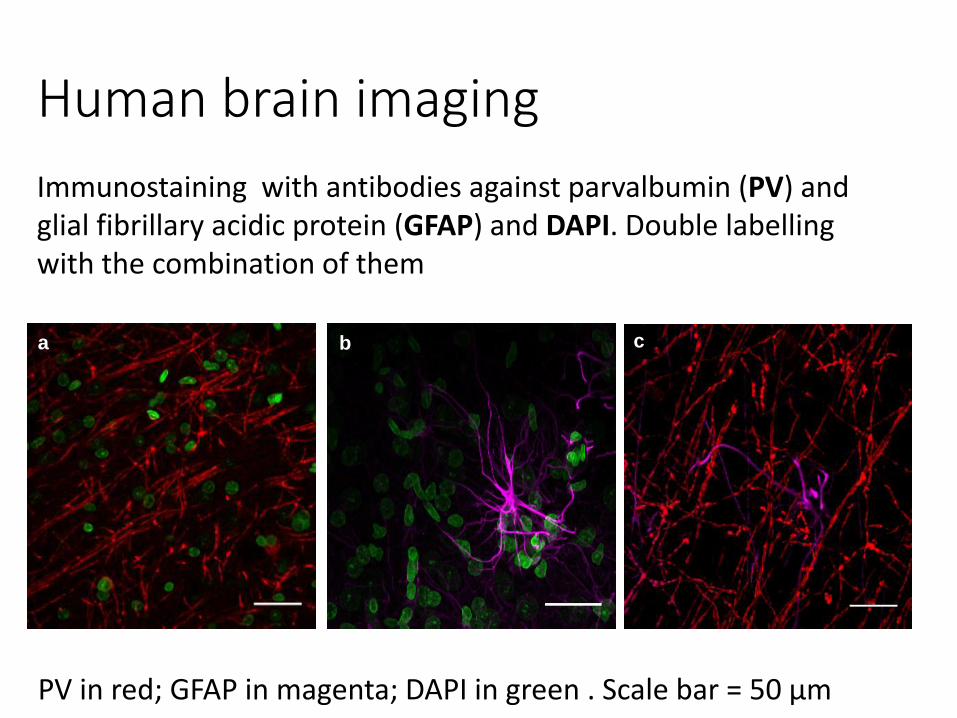
Human brain imaging
a cb
PV in red; GFAP in magenta; DAPI in green . Scale bar = 50 µm
Immunostaining with antibodies against parvalbumin (PV) and glial fibrillary acidic protein (GFAP) and DAPI. Double labelling with the combination of them
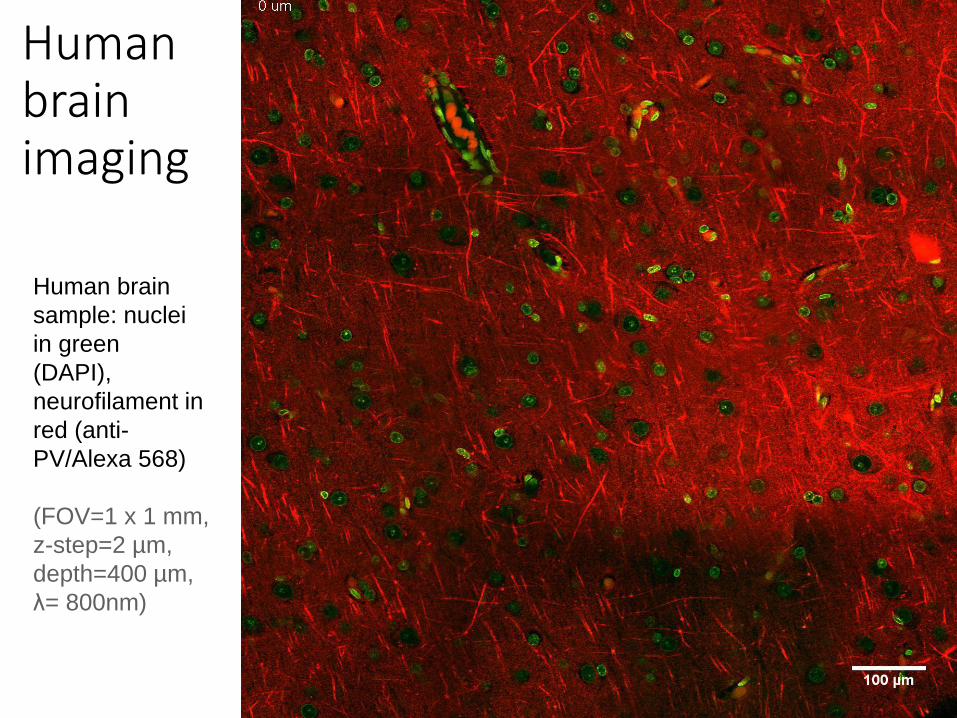
Human brainimaging
Human brain
sample: nuclei
in green
(DAPI),
neurofilament in
red (anti-
PV/Alexa 568)
(FOV=1 x 1 mm,
z-step=2 µm,
depth=400 µm,
λ= 800nm)
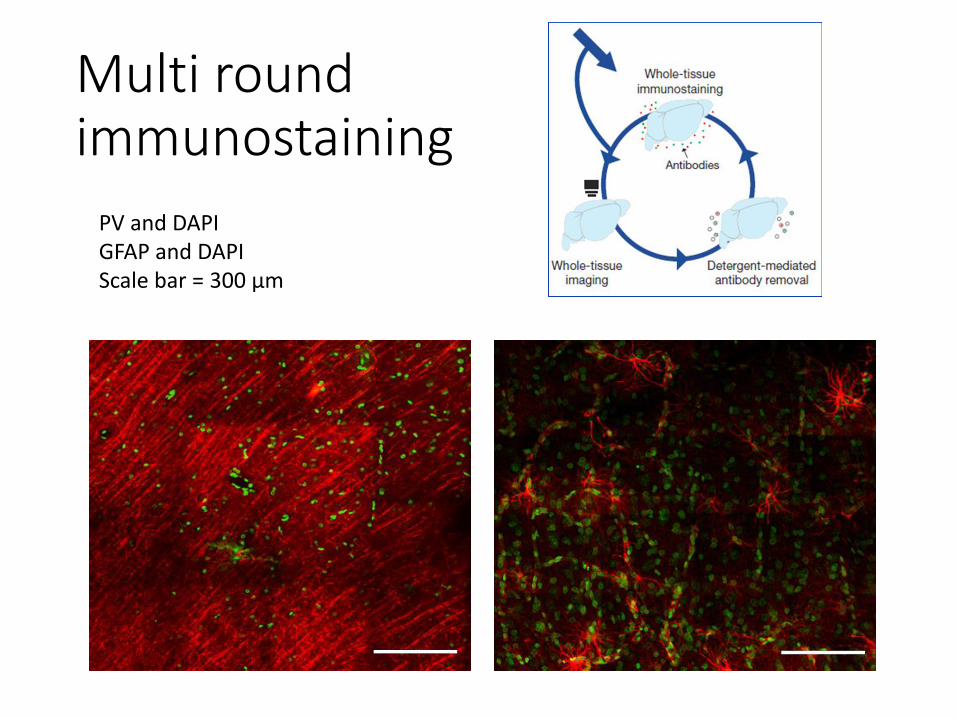
Multi round immunostaining
PV and DAPIGFAP and DAPI Scale bar = 300 µm
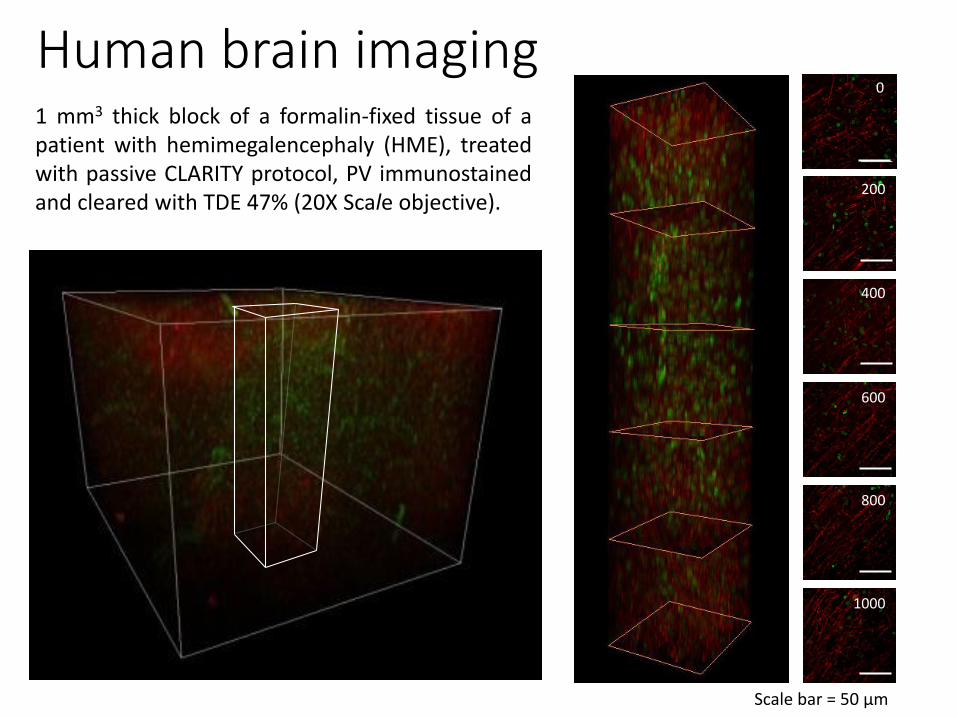
Human brain imaging0
200
400
600
800
1000
Scale bar = 50 µm
1 mm3 thick block of a formalin-fixed tissue of apatient with hemimegalencephaly (HME), treatedwith passive CLARITY protocol, PV immunostainedand cleared with TDE 47% (20X Scale objective).
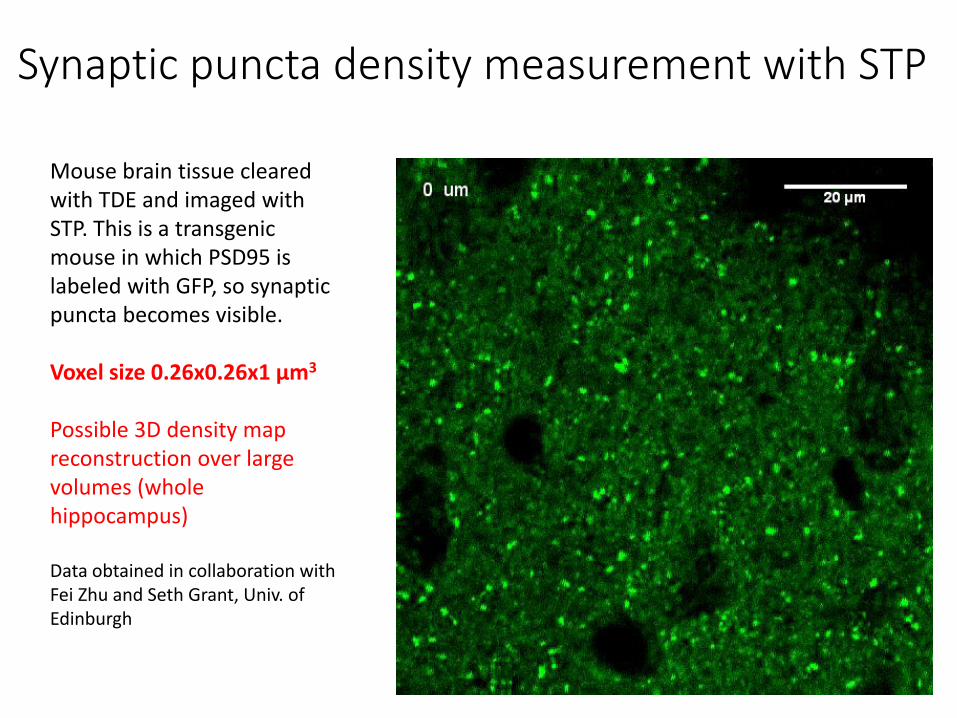
Synaptic puncta density measurement with STP
Mouse brain tissue clearedwith TDE and imaged with STP. This is a transgenicmouse in which PSD95 islabeled with GFP, so synapticpuncta becomes visible.
Voxel size 0.26x0.26x1 µm3
Possible 3D density mapreconstruction over large volumes (wholehippocampus)
Data obtained in collaboration with Fei Zhu and Seth Grant, Univ. of Edinburgh