Embed Size (px)
Citation preview
International Conference: September 15-17, 2008 Ragusa - Italy
“Innovation Technology to Empower Safety, Health and Welfare in Agriculture and Agro-food Systems”
Whole Body Vibration (WBV) transmitted to the operator by tractors
equipped with radial tires
Deboli R.1, Calvo A.
2, Preti C.
1, Paletto G.
1 IMAMOTER-CNR, Strada delle Cacce 73, 10135 Torino, Italy, Tel. 0039 0113977710, Fax
011 3489218, [email protected] 2 DEIAFA, Sez. Meccanica, Facoltà di Agraria, V. Leonardo da Vinci 44, 10095 Grugliasco
(TO), Italy, [email protected]
Abstract Other than the tractor components technological development, in the last decennia the interest
for the driver comfort increased. Noise and vibration control priority increased too. Especially
for vibration the tires quality plays a great role.
Modern tractors are often equipped without any type of suspension and the tires task is to
reduce vibration caused by the uneven ground where these machines travel.
When the tractor moves, it is solicited by a vibrational excitation that, through the vehicle,
reaches the driver causing to him a stressing and tiring situation.
To verify the vibrational comfort value given by these radial-ply tires, tests have been carried
out using a 93 kW tractor. The tests have been executed with two different tractor speeds (12
and 7 km/h) and using both an artificial test track (ISO 5008) and an asphalt road.
Four different types of tires have been used (from three different manufacturers): for each test
cycle the inflation pressure has been changed.
The acceleration values have always been revealed over the cabin platform to make irrelevant
the running in of the seat.
In this way it was possible to extract the tires parameters which most influence the dynamical
behaviour of the tractor and therefore the operator’s comfort.
192 test have been conducted, using four different tires at two different pressure, 3 different
track type, 2 different speed, and repeating each test three times.
Keywords: vibration, WBV, tractor tires.
Introduction Low-frequency vibrations, produced by the agricultural vehicles, can be extremely
severe, depending upon the terrain that the agricultural vehicle is crossing and the forward
speed of the vehicle (Lines et al., 1995, Scarlett et al., 2007). By comparison with the progress
achieved over the past decades in improving the performance of agricultural tractors (power,
transmission, electronics…), the protection of the driver from vibration remains very
inadequate. This is due to the fact that, in general, agricultural tractors do not have chassis
suspension and the tires, which are relatively flexible and weakly damped, are the only
suspension system (Cutini et al., 2007, Servadio et al., 2007). This explains why the tractor
driver is subjected to low frequency, high amplitude vibration that are an important risk factor
for low back pain disorder (Bovenzi et al., 1994).
In order to reduce the health risks and the discomfort to the driver and to enable the
driver to work at a faster pace, it is important to isolate the driver from the machine vibration
as much as possible.
Agricultural machinery construction companies play an important role in the production
and implementation of all features that can reduce the WBV driver level: for this reason tyres
producers are heavily involved (Stayner 2001, Sherwina et al., 2004) .

International Conference: September 15-17, 2008 Ragusa - Italy
“Innovation Technology to Empower Safety, Health and Welfare in Agriculture and Agro-food Systems”
Aim of this investigation is to indicate likely variations in WBV from four different
types of tires (from three different manufacturers). 192 test have been conducted, using four
different tires at two different pressure, 3 different track type, 2 different speed, and repeating
each test three times.
Materials and methods
To verify the vibrational comfort value given by the radial-ply tires, tests have been
carried out using a 4WD tractor (table 1) equipped with four different types of tires, from
three different manufacturers.
Table 1. Main features of tractors
Item Measure unit Value
Tractor power kW 93
Cylinders n 6
Displacement cm3 6720
Wheel base, mm 2661
Trackwith front mm 1407
Trackwith rear mm 1426
Mass front kg 2044
Mass rear kg 3066
Cab suspension silent-blocks
Axles suspension any
Ballast any
Tire characteristic
Four different types of tires have been tested (table 2). All tires were new. Tires A, C and D
were at low aspect ratio.
Table2. Tire characteristics
Tire A B C D
front rear front rear front rear front rear
Tire size 480/65
R28
600/65
R38
380/85
R28
460/85
R38
480/65
R28
600/65
R38
480/65
R28
600/65
R38
Number of
lugs
22 23 20 21 19 20 20 22
Lugs height,
mm
41 46 48 52 41 50 42 49
Average area
of a lug, cm2
108 175 77 112 130 213 114 171
Tests have been carried out on three different surfaces:
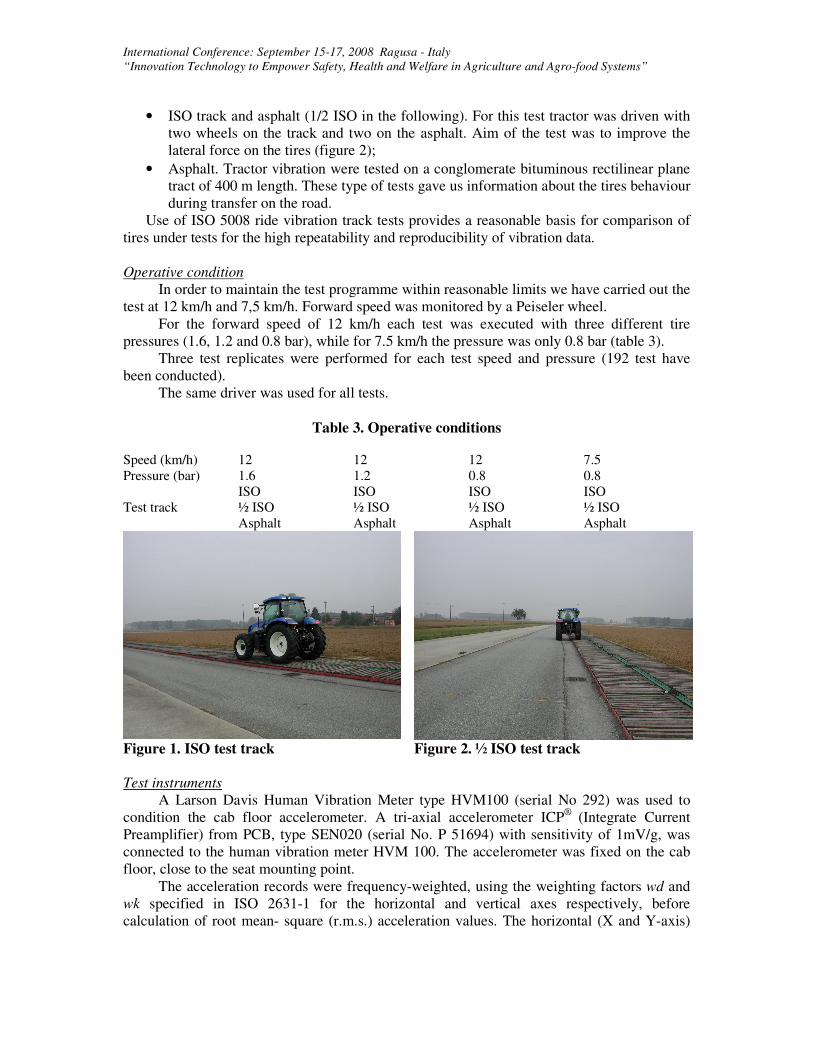
• The smoother ISO, 100 m track (from standard ISO 5008: 2001), which represents an
unmetalled farm roadway, designed to test the fitness for validity of tractor seats. This
track provides an acceleration input which, at the cab floor, is dominated by the
vertical component (figure 1);
International Conference: September 15-17, 2008 Ragusa - Italy
“Innovation Technology to Empower Safety, Health and Welfare in Agriculture and Agro-food Systems”
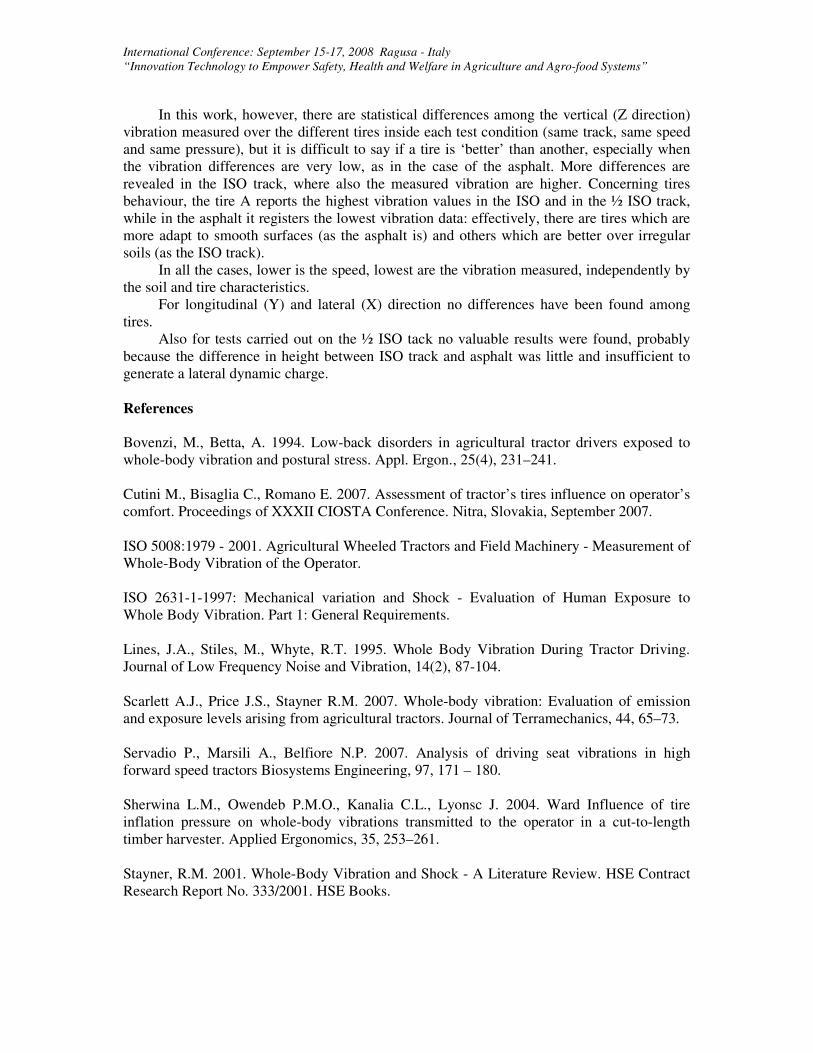
• ISO track and asphalt (1/2 ISO in the following). For this test tractor was driven with
two wheels on the track and two on the asphalt. Aim of the test was to improve the
lateral force on the tires (figure 2);
• Asphalt. Tractor vibration were tested on a conglomerate bituminous rectilinear plane
tract of 400 m length. These type of tests gave us information about the tires behaviour
during transfer on the road.
Use of ISO 5008 ride vibration track tests provides a reasonable basis for comparison of
tires under tests for the high repeatability and reproducibility of vibration data.
Operative condition
In order to maintain the test programme within reasonable limits we have carried out the
test at 12 km/h and 7,5 km/h. Forward speed was monitored by a Peiseler wheel.
For the forward speed of 12 km/h each test was executed with three different tire
pressures (1.6, 1.2 and 0.8 bar), while for 7.5 km/h the pressure was only 0.8 bar (table 3).
Three test replicates were performed for each test speed and pressure (192 test have
been conducted).
The same driver was used for all tests.
Table 3. Operative conditions
Speed (km/h) 12 12 12 7.5
Pressure (bar) 1.6 1.2 0.8 0.8
ISO ISO ISO ISO
½ ISO ½ ISO ½ ISO ½ ISO
Test track
Asphalt Asphalt Asphalt Asphalt
Figure 1. ISO test track Figure 2. ½ ISO test track
Test instruments
A Larson Davis Human Vibration Meter type HVM100 (serial No 292) was used to
condition the cab floor accelerometer. A tri-axial accelerometer ICP®
(Integrate Current
Preamplifier) from PCB, type SEN020 (serial No. P 51694) with sensitivity of 1mV/g, was
connected to the human vibration meter HVM 100. The accelerometer was fixed on the cab
floor, close to the seat mounting point.
The acceleration records were frequency-weighted, using the weighting factors wd and
wk specified in ISO 2631-1 for the horizontal and vertical axes respectively, before
calculation of root mean- square (r.m.s.) acceleration values. The horizontal (X and Y-axis)

International Conference: September 15-17, 2008 Ragusa - Italy
“Innovation Technology to Empower Safety, Health and Welfare in Agriculture and Agro-food Systems”
components were multiplied by a factor of 1.4, as also specified in ISO 2631-1. Combined
(vector-sum) three-axis acceleration values were obtained for the cab floor by calculating the
root-sum-of-squares (RSS) of the combined orthogonal axes components.
As the tractor seat was new of factory, in order to avoid any effect of the seat running
in, the measurements of vibration were executed only on cab floor.
Test type
Each test has been repeated three times for each configuration. In table 4 the RSS
measured and the averages for 7.5 km/h speed at the pressure of 0.8 bar are reported.
Table 4. RSS values (m/s2) obtained at the speed of 7.5 km/h, 0.8 bar pressure
A B C D
RSS RSS RSS RSS
ISO 1.16 ISO 1.07 ISO 1.03 ISO 1.16
ISO 1.15 ISO 1.09 ISO 1.03 ISO 1.14
ISO 1.21 ISO 1.09 ISO 1.03 ISO 1.15
average 1.17 average 1.08 average 1.03 average 1.15 1/2 ISO outward 1.03 1/2 ISO outward 0.95 1/2 ISO outward 0.87 1/2 ISO outward 0.88
1/2 ISO back 1.01 1/2 ISO back 1.02 1/2 ISO back 0.88 1/2 ISO back 0.96
1/2 ISO outward 1.00 1/2 ISO outward 0.93 1/2 ISO outward 0.85 1/2 ISO outward 0.91
1/2 ISO back 1.05 1/2 ISO back 1.01 1/2 ISO back 0.84 1/2 ISO back 0.98
1/2 ISO outward 1.02 1/2 ISO outward 0.96 1/2 ISO outward 0.84 1/2 ISO outward 0.92
1/2 ISO back 1.00 1/2 ISO back 1.00 1/2 ISO back 0.87 1/2 ISO back 0.98
average 1.02 average 0.98 average 0.86 average 0.94
asphalt 0.15 asphalt 0.16 asphalt 0.13 asphalt 0.21
asphalt 0.16 asphalt 0.15 asphalt 0.14 asphalt 0.19
asphalt 0.14 asphalt 0.16 asphalt 0.16 asphalt 0.21
average 0.15 average 0.15 average 0.14 average 0.20
To better understand the possible influence of track type, speed, tire pressure and tire
type over the measure vibration, data have been grouped in different ways (by tire type, by
speed, etc.). All data have been written in Excel and therefore elaborated using the SPSS
software to verify differences among speed, pressure and tire type, using the ANOVA
procedure, considering the normality of the data distribution. This has been possible because
an high repeatability has been revealed during each test phase: in fact, the obtained result in
each test are very homogeneous to demonstrate the high accuracy level used during the test.
Results
First of all, no statistical analysis has been carried out to verify if vibration differences
existed among the different test tracks because it was obvious looking at the collected data.
The asphalt registers the lowest values, while the highest accelerations are reported in
the ISO track.
Vibration in function of speed and pressure
Considering the speed and the pressure, the different test track have been evaluated. In
all the cases, the 0.8 bar pressure registered the lowest vibration values for all the tire type.

International Conference: September 15-17, 2008 Ragusa - Italy
“Innovation Technology to Empower Safety, Health and Welfare in Agriculture and Agro-food Systems”
12 km/h speed. ISO track
The 12 km/h speed has been initially considered. For the ISO track, the vibration
averages at different pressure level at the speed of 12 km/h are reported in figure 3. At the
pressure of 1.6 and 1.2 bar the vibrations are between 2 and 2.5 m/s2, while at 0.8 bar they
don’t exceed 1.84 m/s2.
Also if the differences are very low, the highest vibration values are always due to the A
and D tires. Because of the high repeatability, the two-way ANOVA (with a confidence level
of 95%) reports the main difference factor as the pressure, while a lower difference is for the
tire type. In all the cases the tires are different among them.
0,00
0,50
1,00
1,50
2,00
2,50
3,00
p_1,6 p_1,2 p_0,8
bar
m/s
2
A
B
C
D
Figure 3. Average vibration values on the ISO track, 12 km/h speed
With a one-way ANOVA analysis (p<0.05) it has been possible to better evaluate
possible tire statistical homogeneity at the different pressure levels. The results are in table 5.
Table 5. Statistical vibration analysis among tires on the ISO track, speed 12 km/h 1.6 bar 1.2 bar 0.8 bar
C and D have the same
vibration behaviour
B and C are statistically
equivalent for the WBV
WBV are statistically equal for
B and C tyre. The same is for A
and D
12 km/h speed. ½ ISO track
Analysing data for this track type (figure 4), we immediately notice that the accelerations are
lower than the ISO track (figure 3). Also in this case, the two-way ANOVA (p<0.05) reports
the highest differences for the pressure and it is not possible to group the tire vibration values.
Only the one-way ANOVA permits to couple the vibration obtained by the tires at the
different pressure level (table 6). In this case the differences are more underlined, at the point
that only at the 1.2 bar it is possible to consider statistically equivalent tires B and C.

International Conference: September 15-17, 2008 Ragusa - Italy
“Innovation Technology to Empower Safety, Health and Welfare in Agriculture and Agro-food Systems”
0,00
0,50
1,00
1,50
2,00
2,50
3,00
p_1,6 p_1,2 p_0,8
bar
m/s
2
A
B
C
D
Figure 4. Average vibration values measured on the ½ ISO track, 12 km/h speed
Table 6. Statistical analysis among vibration tires on the ½ ISO track, speed 12 km/h 1.6 bar 1.2 bar 0.8 bar
All tires are different among
them
B and C have the same
vibration behaviour
B and C are statistically
different for p<0.05, equal for
p<0.01
12 km/h speed. Asphalt track
Because the measured vibrations on this track are very low, here it is not possible to
represent the averages with the same scale of the other tracks (figure 5): in fact the highest
vibration value in this case is 0.42 m/s2 for the C tire. It is also curious that in the asphalt the
tire A registers the lowest vibration values, whereas in the ISO and in the ½ ISO it had the
highest values.
0,00
0,10
0,20
0,30
0,40
0,50
p_1,6 p_1,2 p_0,8
bar
m/s
2
A
B
C
D
Figure 5. Average vibration values measured on the asphalt track, 12 km/h speed
From a statistical point of view, because the values are smaller and are between 0.16
and 0.42 m/s2, it is not possible to group the tires among each pressure level: only the one-
way ANOVA (p<0.05) permits to group them inside each pressure level (table 7).

International Conference: September 15-17, 2008 Ragusa - Italy
“Innovation Technology to Empower Safety, Health and Welfare in Agriculture and Agro-food Systems”
Table 7. Statistical analysis among vibration tires on the asphalt track, speed 12 km/h
1.6 bar 1.2 bar 0.8 bar
B and D are statistically equal
from the vibration point of view
B and C transmit the same
WBV
B, C and D are statistically
equivalent
7.5 km/h speed. All the test tracks
At the 7,5 km/h speed, only the 0.8 bar pressure has been tested for all the tracks.
Because of the very high repeatability, none statistical equivalence has been detected: all the
tires are different for vibration emission, also if the averages are very close to each other
(figure 6). Only for the asphalt, the vibration equivalence among A, B and C tires has been
statistically obtained.
0,00
0,20
0,40
0,60
0,80
1,00
1,20
1,40
ISO 1/2 ISO Asphalt
m/s
2
A
B
C
D
Figure 6. Average vibration values measured over different tracks, 7.5 km/h speed, 0.8
bar tire pressure
0,00
0,20
0,40
0,60
0,80
1,00
1,20
1,40
1,60
1,80
2,00
A B C D
m/s
2
ISO_12km/h
ISO_7.5km/h
1/2 ISO_12km/h
1/2 ISO_7.5km/h
asphalt_12km/h
asphalt_7.5km/h
Figure 7. Average vibration values at the 0.8 bar pressure
The comparison of the average vibration values in the same conditions between the 7.5
km/h speed and the 12 km/h (figure 7) reveals that the acceleration is higher at the highest
speed: the difference is more evident for the ISO and the ½ ISO track, while it is softer over
the asphalt.
Conclusions Under the vibrational aspect the behavior of tire B (with different structural elements) is
similar to the other ones and there are not statistical differences.
International Conference: September 15-17, 2008 Ragusa - Italy
“Innovation Technology to Empower Safety, Health and Welfare in Agriculture and Agro-food Systems”
In this work, however, there are statistical differences among the vertical (Z direction)
vibration measured over the different tires inside each test condition (same track, same speed
and same pressure), but it is difficult to say if a tire is ‘better’ than another, especially when
the vibration differences are very low, as in the case of the asphalt. More differences are
revealed in the ISO track, where also the measured vibration are higher. Concerning tires
behaviour, the tire A reports the highest vibration values in the ISO and in the ½ ISO track,
while in the asphalt it registers the lowest vibration data: effectively, there are tires which are
more adapt to smooth surfaces (as the asphalt is) and others which are better over irregular
soils (as the ISO track).
In all the cases, lower is the speed, lowest are the vibration measured, independently by
the soil and tire characteristics.
For longitudinal (Y) and lateral (X) direction no differences have been found among
tires.
Also for tests carried out on the ½ ISO tack no valuable results were found, probably
because the difference in height between ISO track and asphalt was little and insufficient to
generate a lateral dynamic charge.
References
Bovenzi, M., Betta, A. 1994. Low-back disorders in agricultural tractor drivers exposed to
whole-body vibration and postural stress. Appl. Ergon., 25(4), 231–241.
Cutini M., Bisaglia C., Romano E. 2007. Assessment of tractor’s tires influence on operator’s
comfort. Proceedings of XXXII CIOSTA Conference. Nitra, Slovakia, September 2007.
ISO 5008:1979 - 2001. Agricultural Wheeled Tractors and Field Machinery - Measurement of
Whole-Body Vibration of the Operator.
ISO 2631-1-1997: Mechanical variation and Shock - Evaluation of Human Exposure to
Whole Body Vibration. Part 1: General Requirements.
Lines, J.A., Stiles, M., Whyte, R.T. 1995. Whole Body Vibration During Tractor Driving.
Journal of Low Frequency Noise and Vibration, 14(2), 87-104.
Scarlett A.J., Price J.S., Stayner R.M. 2007. Whole-body vibration: Evaluation of emission
and exposure levels arising from agricultural tractors. Journal of Terramechanics, 44, 65–73.
Servadio P., Marsili A., Belfiore N.P. 2007. Analysis of driving seat vibrations in high
forward speed tractors Biosystems Engineering, 97, 171 – 180.
Sherwina L.M., Owendeb P.M.O., Kanalia C.L., Lyonsc J. 2004. Ward Influence of tire
inflation pressure on whole-body vibrations transmitted to the operator in a cut-to-length
timber harvester. Applied Ergonomics, 35, 253–261.
Stayner, R.M. 2001. Whole-Body Vibration and Shock - A Literature Review. HSE Contract
Research Report No. 333/2001. HSE Books.


![Low Intensity Vibration as a Non-Drug ... - BTT Health · 1.0 1.2 1.4 BC AC WBV Cross section area [mm 2] a b 0 200 400 600 800 BC AC WBV Total fiber number (mean+SD, n=12) A. ATPase](https://img.pdfslide.us/doc/110x75/5fba2700fd167947dc23c0f2/low-intensity-vibration-as-a-non-drug-btt-health-10-12-14-bc-ac-wbv-cross.jpg)