Embed Size (px)
Citation preview
GLAST LAT Project Instrument Analysis Workshop September 27, 2004
Dario Gasparrini and Sara Cutini 1/21
Minimum Ionizing Particle (MIP) Minimum Ionizing Particle (MIP) StudiesStudies
Sara Cutini – Dario Gasparrini
Instrument Analysis Workshop II
SLAC
27 September 2004
Gamma-ray Large Gamma-ray Large Area Space Area Space TelescopeTelescope
GLAST LAT Project Instrument Analysis Workshop September 27, 2004
Dario Gasparrini and Sara Cutini 2/21
IntroductionIntroduction
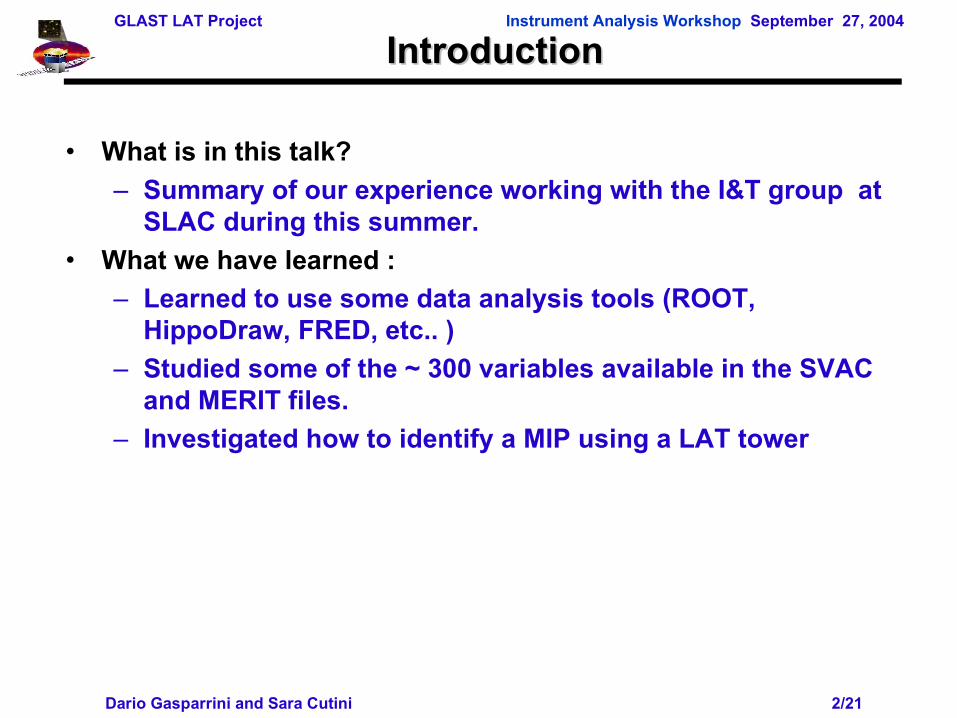
• What is in this talk?
– Summary of our experience working with the I&T group at SLAC during this summer.
• What we have learned :
– Learned to use some data analysis tools (ROOT, HippoDraw, FRED, etc.. )
– Studied some of the ~ 300 variables available in the SVAC and MERIT files.
– Investigated how to identify a MIP using a LAT tower
GLAST LAT Project Instrument Analysis Workshop September 27, 2004
Dario Gasparrini and Sara Cutini 3/21
MIP SearchMIP Search
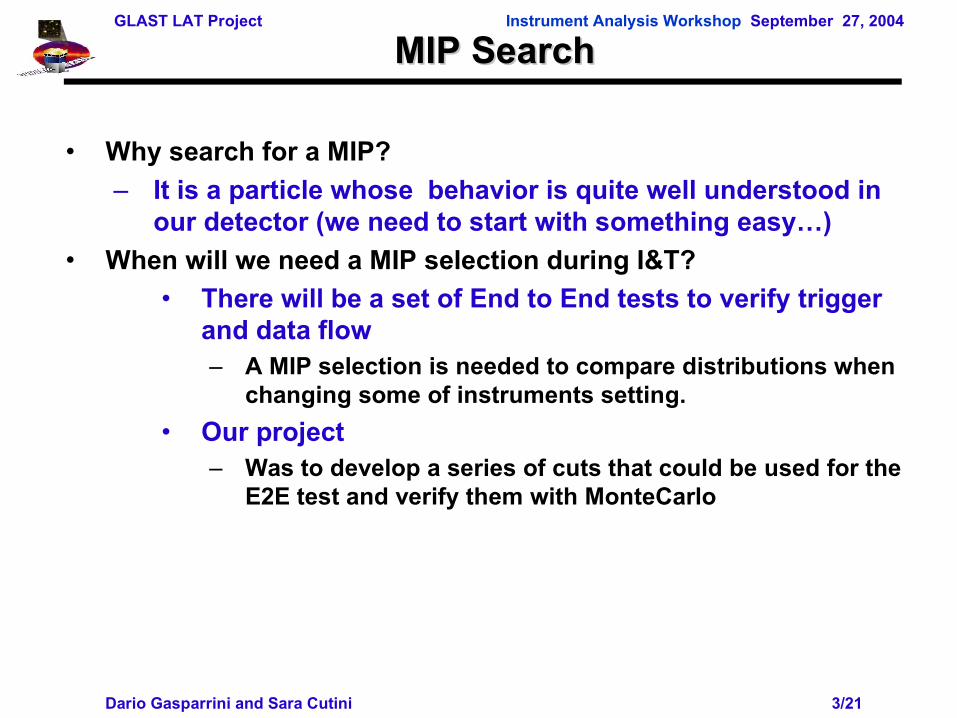
• Why search for a MIP?
– It is a particle whose behavior is quite well understood in our detector (we need to start with something easy…)
• When will we need a MIP selection during I&T?
• There will be a set of End to End tests to verify trigger and data flow– A MIP selection is needed to compare distributions when
changing some of instruments setting.
• Our project– Was to develop a series of cuts that could be used for the
E2E test and verify them with MonteCarlo
GLAST LAT Project Instrument Analysis Workshop September 27, 2004
Dario Gasparrini and Sara Cutini 4/21
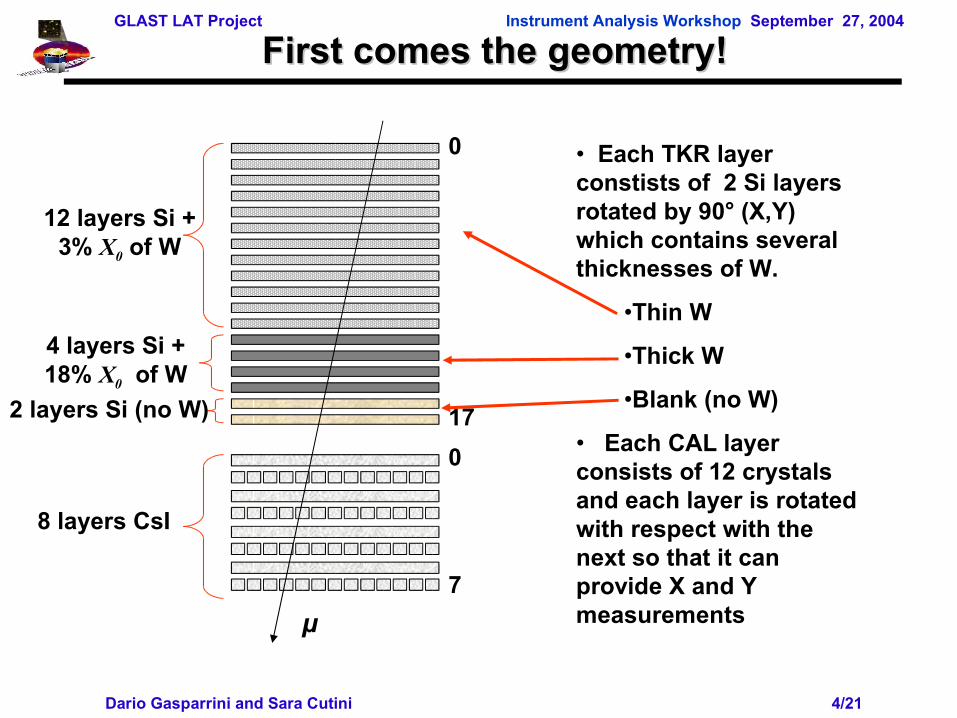
First comes the geometry!First comes the geometry!
12 layers Si + 3% X0 of W
4 layers Si + 18% X0 of W
2 layers Si (no W)
0
17
0
7
8 layers CsI
• Each TKR layer constists of 2 Si layers rotated by 90° (X,Y) which contains several thicknesses of W.
•Thin W
•Thick W
•Blank (no W)
• Each CAL layer consists of 12 crystals and each layer is rotated with respect with the next so that it can provide X and Y measurementsµ
GLAST LAT Project Instrument Analysis Workshop September 27, 2004
Dario Gasparrini and Sara Cutini 5/21
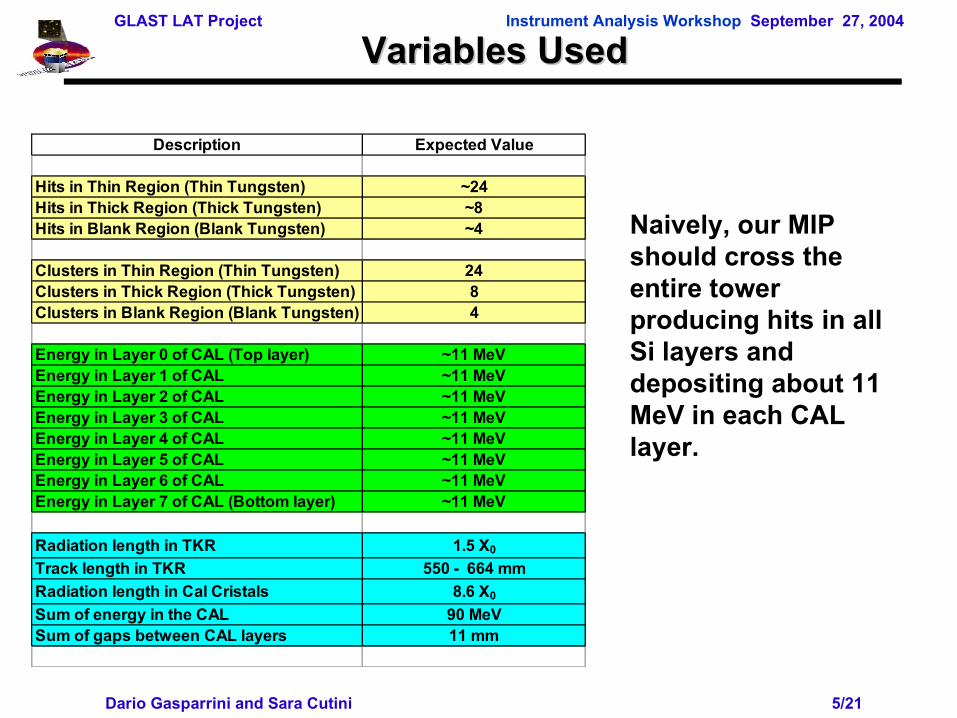
Variables UsedVariables Used
Description Expected Value
Hits in Thin Region (Thin Tungsten) ~24Hits in Thick Region (Thick Tungsten) ~8Hits in Blank Region (Blank Tungsten) ~4
Clusters in Thin Region (Thin Tungsten) 24Clusters in Thick Region (Thick Tungsten) 8Clusters in Blank Region (Blank Tungsten) 4
Energy in Layer 0 of CAL (Top layer) ~11 MeVEnergy in Layer 1 of CAL ~11 MeVEnergy in Layer 2 of CAL ~11 MeVEnergy in Layer 3 of CAL ~11 MeVEnergy in Layer 4 of CAL ~11 MeVEnergy in Layer 5 of CAL ~11 MeVEnergy in Layer 6 of CAL ~11 MeVEnergy in Layer 7 of CAL (Bottom layer) ~11 MeV
Radiation length in TKR 1.5 X0
Track length in TKR 550 - 664 mm
Radiation length in Cal Cristals 8.6 X0
Sum of energy in the CAL 90 MeVSum of gaps between CAL layers 11 mm
Naively, our MIP should cross the entire tower producing hits in all Si layers and depositing about 11 MeV in each CAL layer.
GLAST LAT Project Instrument Analysis Workshop September 27, 2004
Dario Gasparrini and Sara Cutini 6/21
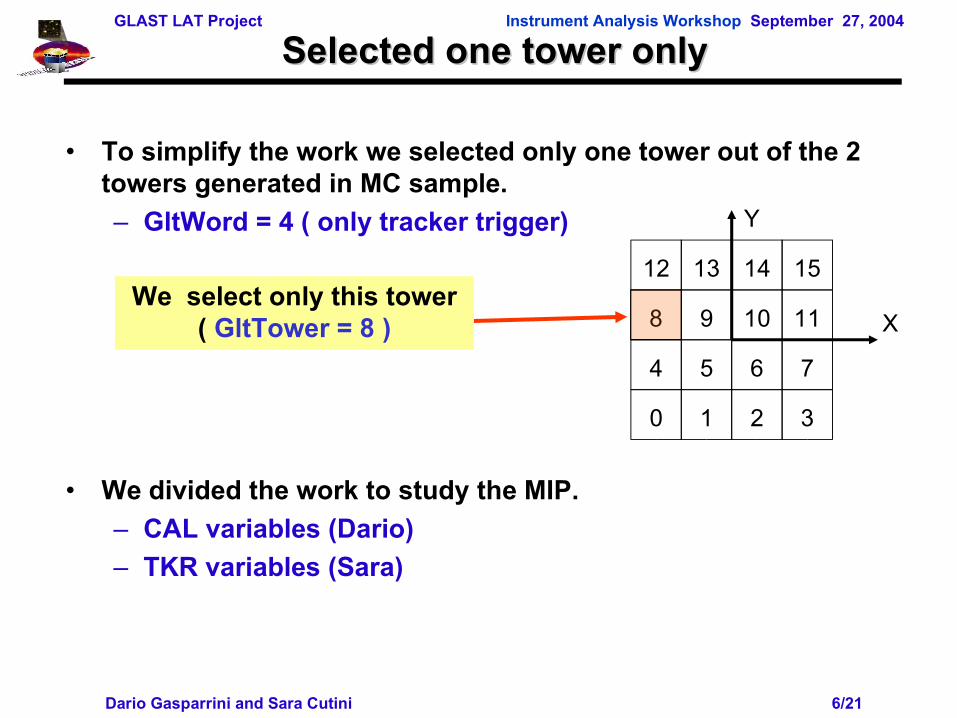
• To simplify the work we selected only one tower out of the 2 towers generated in MC sample.
– GltWord = 4 ( only tracker trigger)
• We divided the work to study the MIP.
– CAL variables (Dario)
– TKR variables (Sara)
Selected one tower onlySelected one tower only
12
111098
7654
3210
13 14 15
X
Y
We select only this tower ( GltTower = 8 )
GLAST LAT Project Instrument Analysis Workshop September 27, 2004
Dario Gasparrini and Sara Cutini 7/21
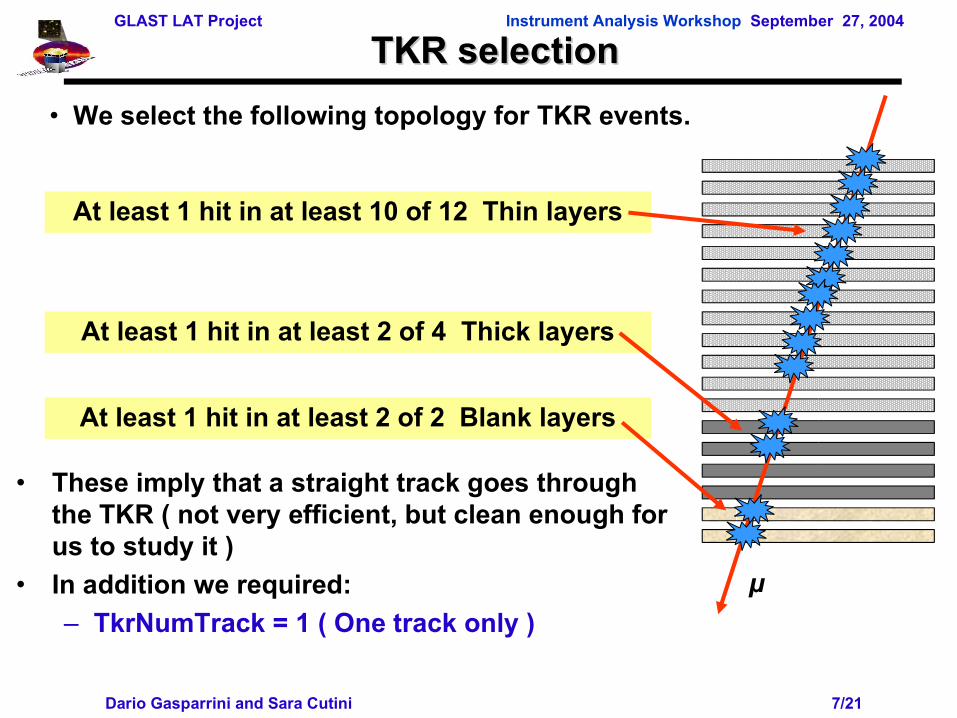
At least 1 hit in at least 2 of 2 Blank layers
At least 1 hit in at least 2 of 4 Thick layers
TKR selectionTKR selection
• These imply that a straight track goes through the TKR ( not very efficient, but clean enough for us to study it )
• In addition we required:
– TkrNumTrack = 1 ( One track only )
• We select the following topology for TKR events.
At least 1 hit in at least 10 of 12 Thin layers
µ
GLAST LAT Project Instrument Analysis Workshop September 27, 2004
Dario Gasparrini and Sara Cutini 8/21
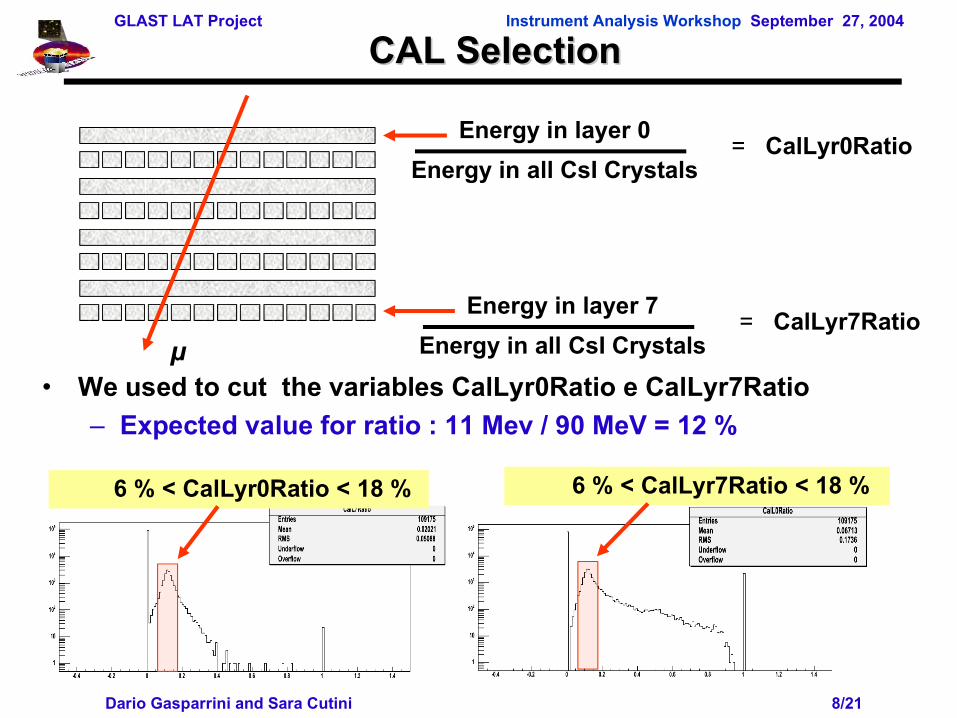
CAL SelectionCAL Selection
• We used to cut the variables CalLyr0Ratio e CalLyr7Ratio
– Expected value for ratio : 11 Mev / 90 MeV = 12 %
Energy in layer 0
Energy in all CsI Crystals= CalLyr0Ratio
Energy in layer 7
Energy in all CsI Crystals= CalLyr7Ratio
µ
6 % < CalLyr0Ratio < 18 % 6 % < CalLyr7Ratio < 18 %
GLAST LAT Project Instrument Analysis Workshop September 27, 2004
Dario Gasparrini and Sara Cutini 9/21
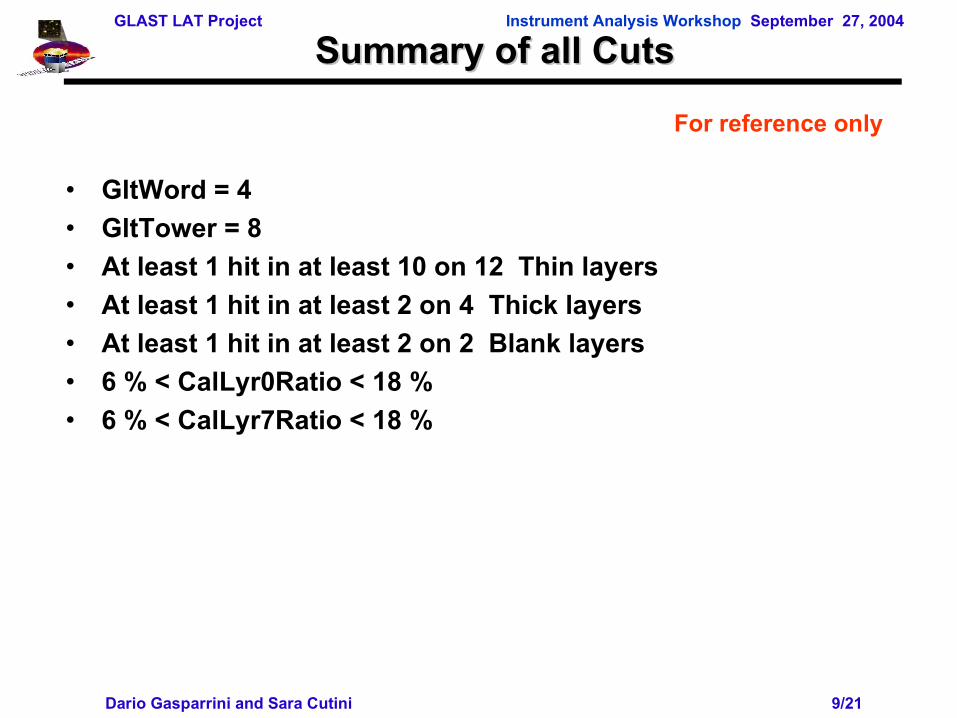
Summary of all CutsSummary of all Cuts
• GltWord = 4
• GltTower = 8
• At least 1 hit in at least 10 on 12 Thin layers
• At least 1 hit in at least 2 on 4 Thick layers
• At least 1 hit in at least 2 on 2 Blank layers
• 6 % < CalLyr0Ratio < 18 %
• 6 % < CalLyr7Ratio < 18 %
For reference only
GLAST LAT Project Instrument Analysis Workshop September 27, 2004
Dario Gasparrini and Sara Cutini 10/21
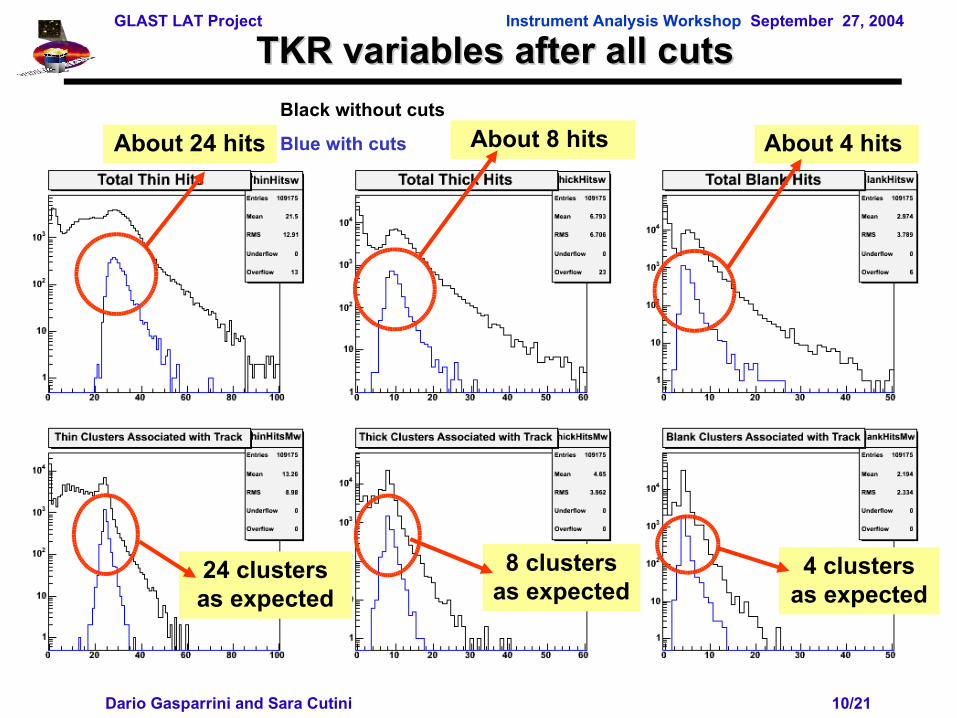
24 clusters as expected
TKR variables after all cutsTKR variables after all cuts
8 clusters as expected
4 clusters as expected
About 24 hits About 8 hits About 4 hits
Black without cuts
Blue with cuts
GLAST LAT Project Instrument Analysis Workshop September 27, 2004
Dario Gasparrini and Sara Cutini 11/21
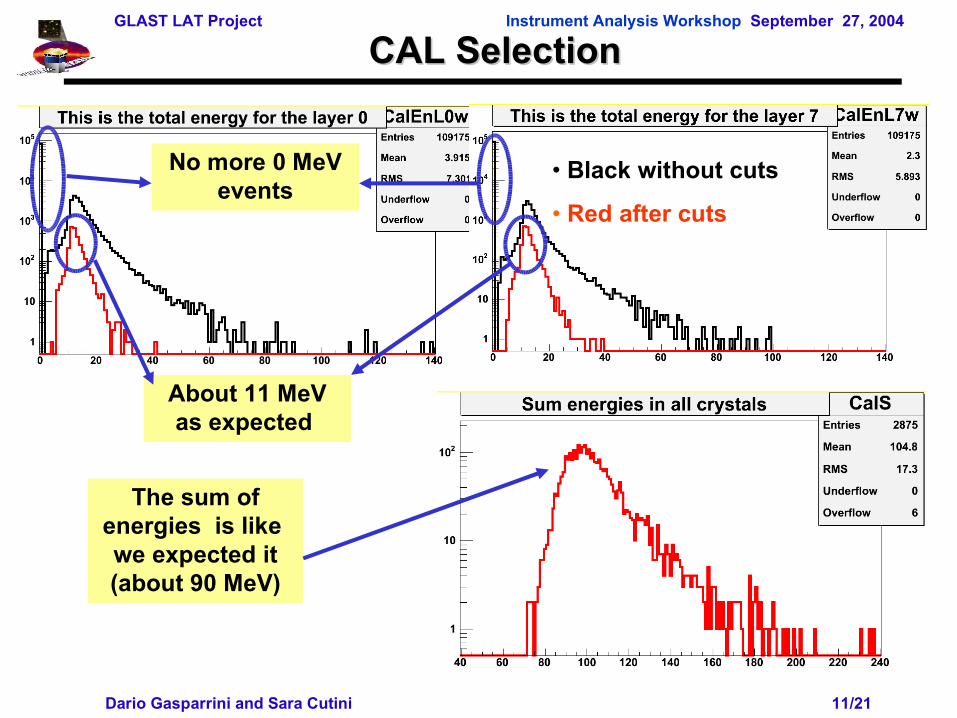
CAL SelectionCAL Selection
• Black without cuts
• Red after cuts
About 11 MeV as expected
No more 0 MeV events
The sum of energies is like we expected it (about 90 MeV)
GLAST LAT Project Instrument Analysis Workshop September 27, 2004
Dario Gasparrini and Sara Cutini 12/21
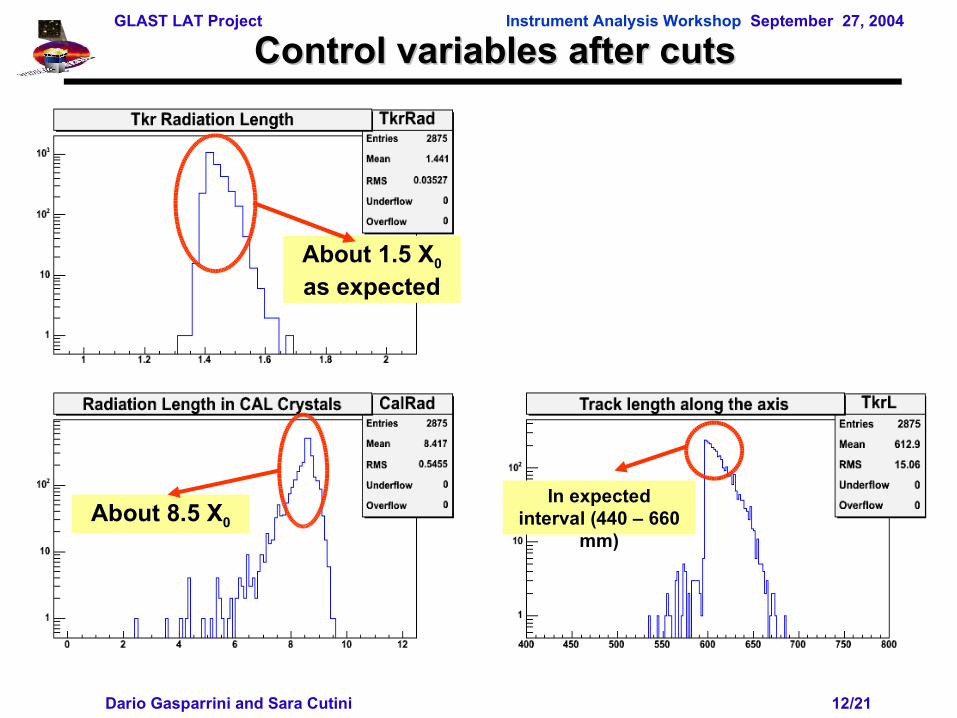
Control variables after cutsControl variables after cuts
About 1.5 X0
as expected
Peaked on 11 mm
About 8.5 X0
In expected interval (440 – 660
mm)
GLAST LAT Project Instrument Analysis Workshop September 27, 2004
Dario Gasparrini and Sara Cutini 13/21
Now we will study tails of distributions with Now we will study tails of distributions with Event Display (FRED)Event Display (FRED)
GLAST LAT Project Instrument Analysis Workshop September 27, 2004
Dario Gasparrini and Sara Cutini 14/21
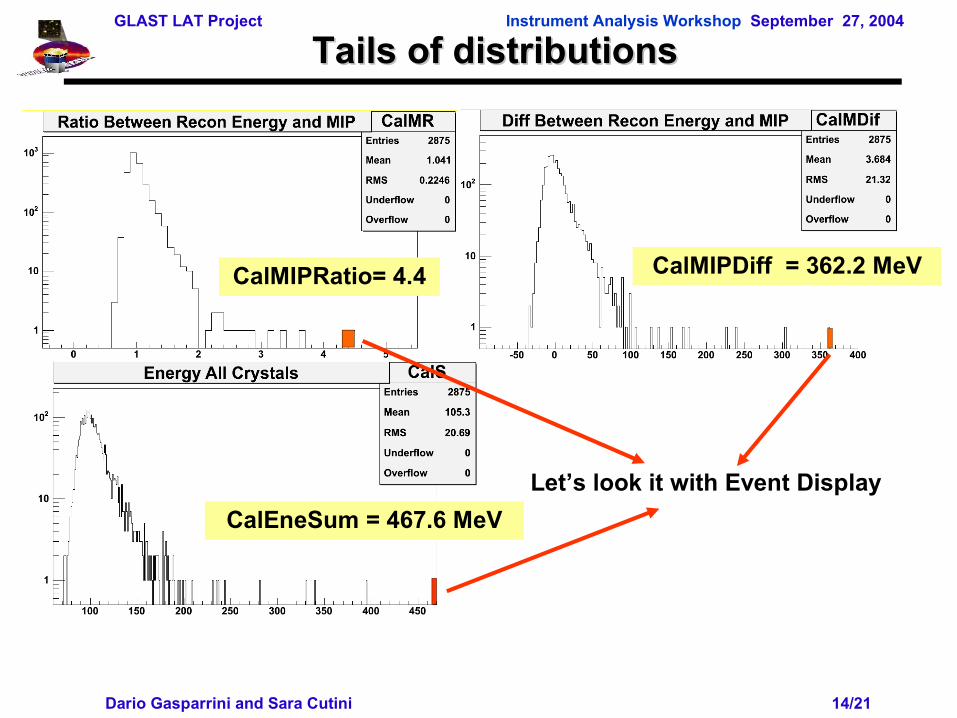
Tails of distributionsTails of distributions
CalMIPRatio= 4.4 CalMIPDiff = 362.2 MeV
CalEneSum = 467.6 MeV
Let’s look it with Event Display
GLAST LAT Project Instrument Analysis Workshop September 27, 2004
Dario Gasparrini and Sara Cutini 15/21
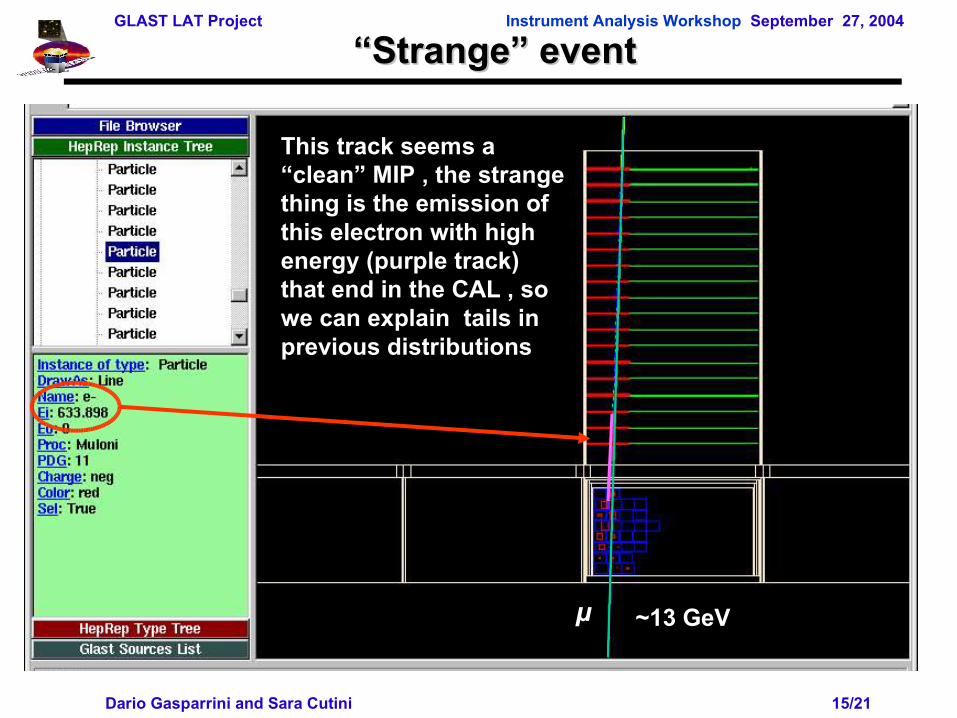
““Strange” eventStrange” event
This track seems a “clean” MIP , the strange thing is the emission of this electron with high energy (purple track) that end in the CAL , so we can explain tails in previous distributions
~13 GeVµ
GLAST LAT Project Instrument Analysis Workshop September 27, 2004
Dario Gasparrini and Sara Cutini 16/21
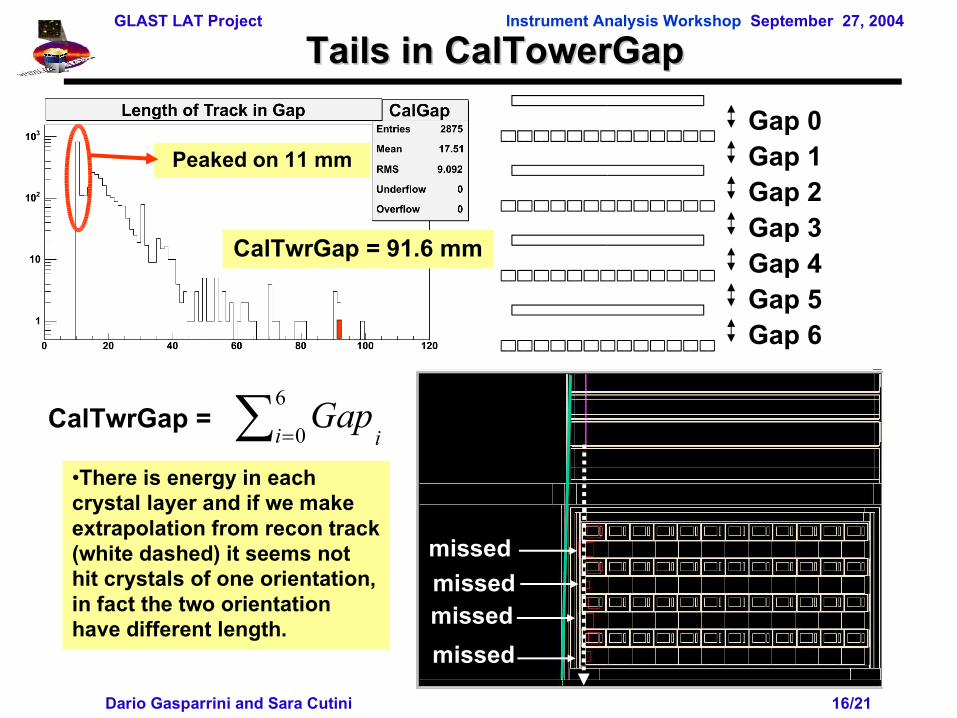
Tails in CalTowerGapTails in CalTowerGap
•There is energy in each crystal layer and if we make extrapolation from recon track (white dashed) it seems not hit crystals of one orientation, in fact the two orientation have different length.
Gap 0
Gap 4Gap 3
Gap 5
Gap 1Gap 2
Gap 6
CalTwrGap = ii
Gap
6
0
CalTwrGap = 91.6 mm
Peaked on 11 mm
missed
missed
missed
missed
GLAST LAT Project Instrument Analysis Workshop September 27, 2004
Dario Gasparrini and Sara Cutini 17/21
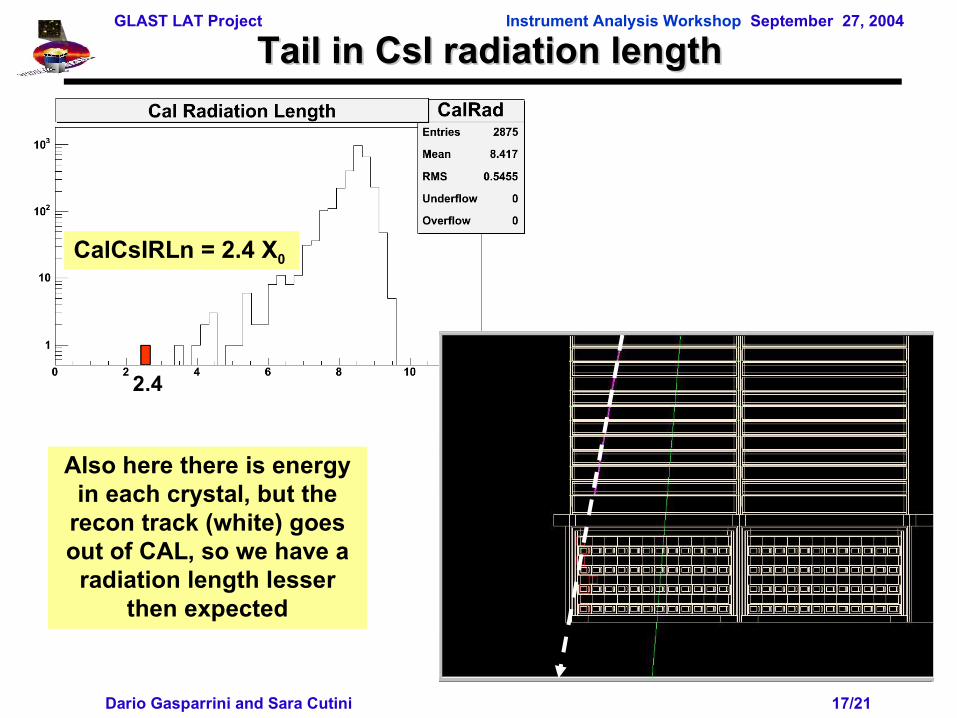
Tail in CsI radiation length Tail in CsI radiation length
Also here there is energy in each crystal, but the
recon track (white) goes out of CAL, so we have a
radiation length lesser then expected
2.4
CalCsIRLn = 2.4 X0
GLAST LAT Project Instrument Analysis Workshop September 27, 2004
Dario Gasparrini and Sara Cutini 18/21
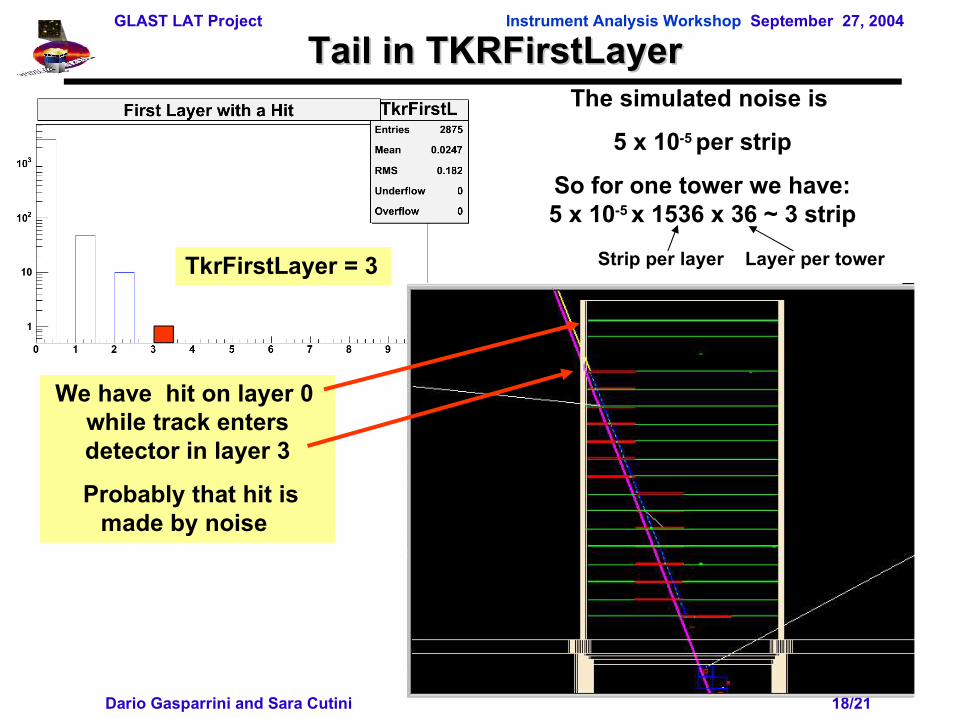
Tail in TKRFirstLayerTail in TKRFirstLayer
TkrFirstLayer = 3
We have hit on layer 0 while track enters detector in layer 3
Probably that hit is made by noise
The simulated noise is
5 x 10⁻⁵ per strip
So for one tower we have: 5 x 10-5 x 1536 x 36 ~ 3 strip
Strip per layer Layer per tower
GLAST LAT Project Instrument Analysis Workshop September 27, 2004
Dario Gasparrini and Sara Cutini 19/21
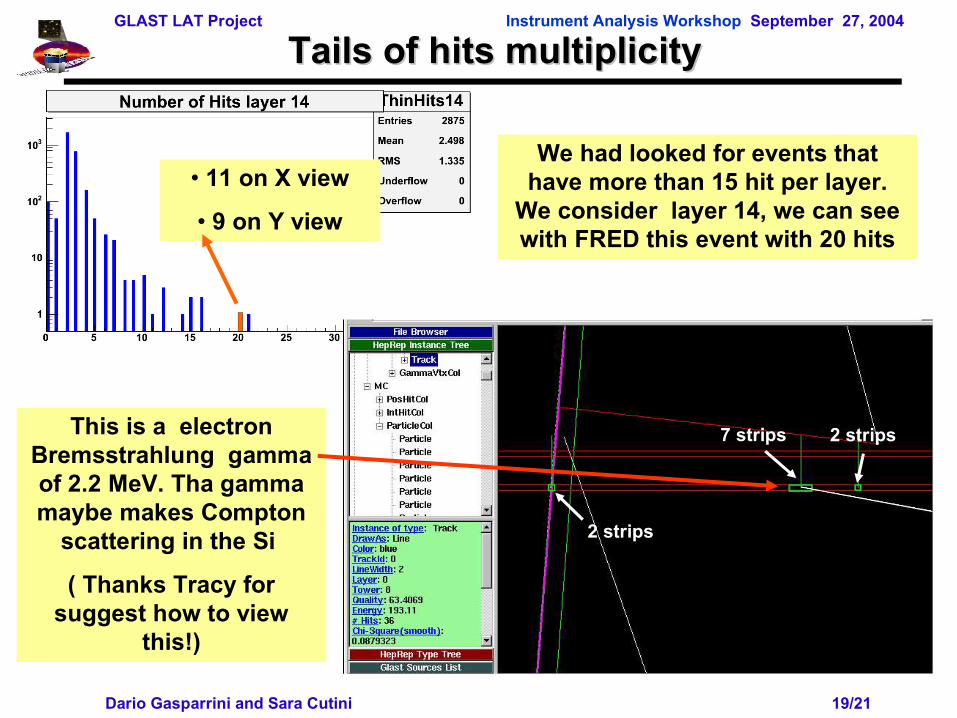
Tails of hits multiplicityTails of hits multiplicity
We had looked for events that have more than 15 hit per layer.
We consider layer 14, we can see with FRED this event with 20 hits
This is a electron Bremsstrahlung gamma of 2.2 MeV. Tha gamma maybe makes Compton
scattering in the Si
( Thanks Tracy for suggest how to view
this!)
• 11 on X view
• 9 on Y view
7 strips 2 strips
2 strips
GLAST LAT Project Instrument Analysis Workshop September 27, 2004
Dario Gasparrini and Sara Cutini 20/21
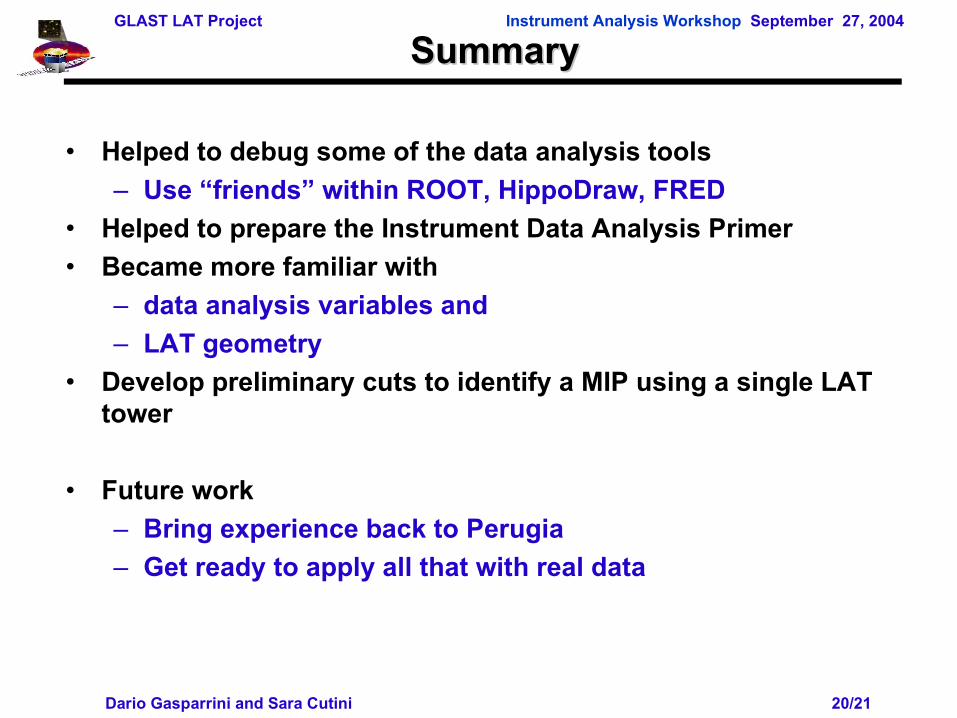
• Helped to debug some of the data analysis tools
– Use “friends” within ROOT, HippoDraw, FRED
• Helped to prepare the Instrument Data Analysis Primer
• Became more familiar with
– data analysis variables and
– LAT geometry
• Develop preliminary cuts to identify a MIP using a single LAT tower
• Future work
– Bring experience back to Perugia
– Get ready to apply all that with real data
SummarySummary
GLAST LAT Project Instrument Analysis Workshop September 27, 2004
Dario Gasparrini and Sara Cutini 21/21
AcknowledgementsAcknowledgements
• Eduardo (Thanks, Thanks, Thanks)
• Anders (Thanks, Thanks)
• Riccardo (Thanks) • Paul (Thanks)
and all I&T group
GLAST LAT Project Instrument Analysis Workshop September 27, 2004
Dario Gasparrini and Sara Cutini 22/21
Backup slidesBackup slides
GLAST LAT Project Instrument Analysis Workshop September 27, 2004
Dario Gasparrini and Sara Cutini 23/21
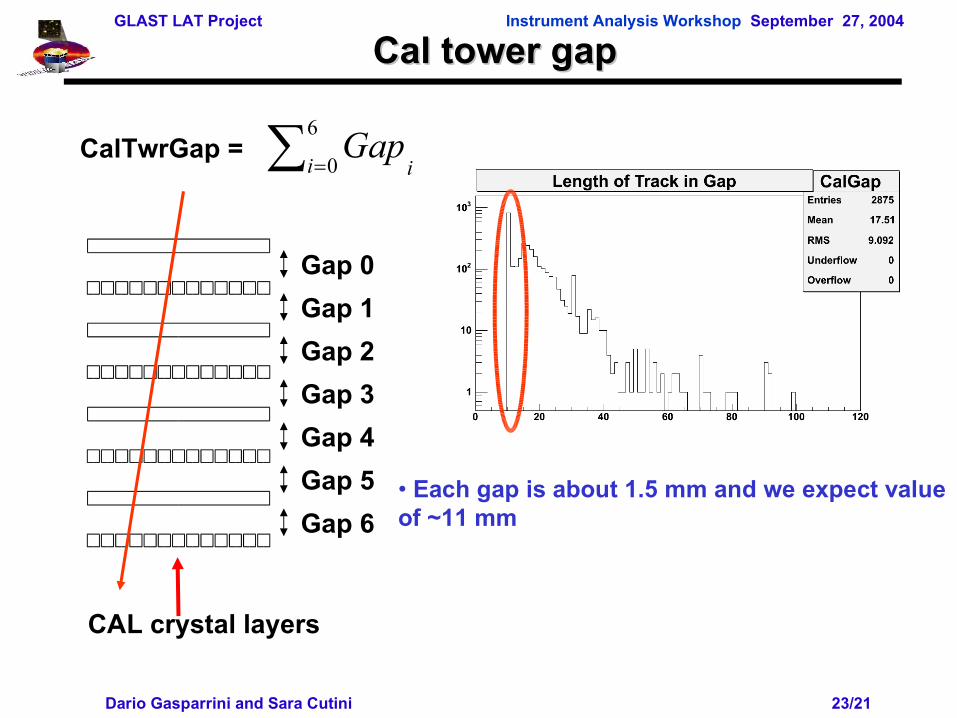
Cal tower gapCal tower gap
CalTwrGap = ii
Gap
6
0
Gap 0
Gap 4
Gap 3
Gap 5
Gap 1
Gap 2
Gap 6
CAL crystal layers
• Each gap is about 1.5 mm and we expect value of ~11 mm
GLAST LAT Project Instrument Analysis Workshop September 27, 2004
Dario Gasparrini and Sara Cutini 24/21
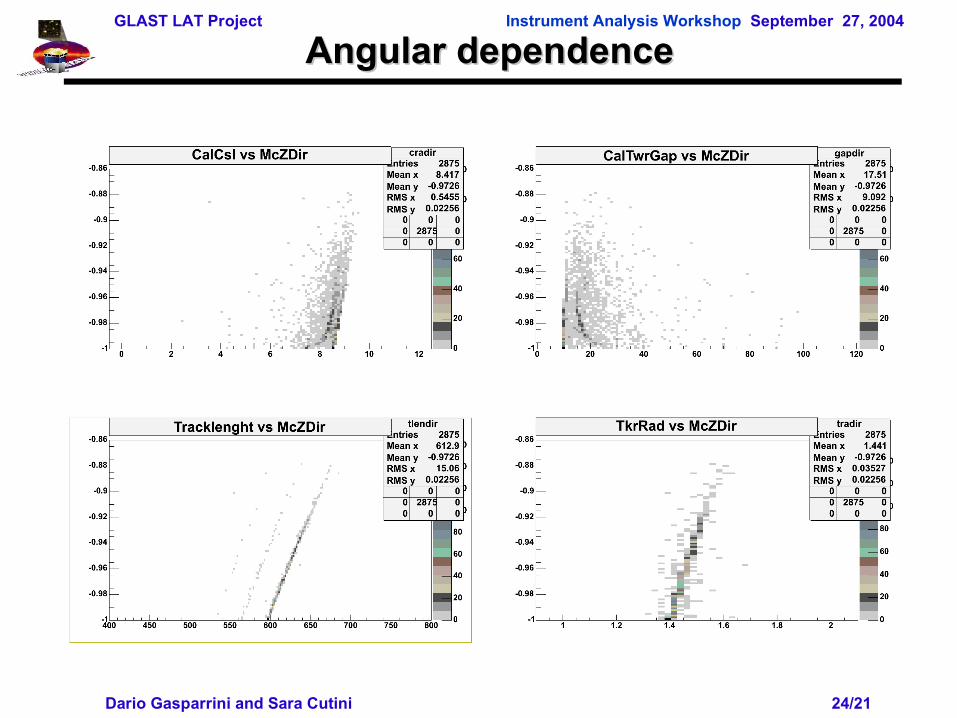
Angular dependence Angular dependence
GLAST LAT Project Instrument Analysis Workshop September 27, 2004
Dario Gasparrini and Sara Cutini 25/21
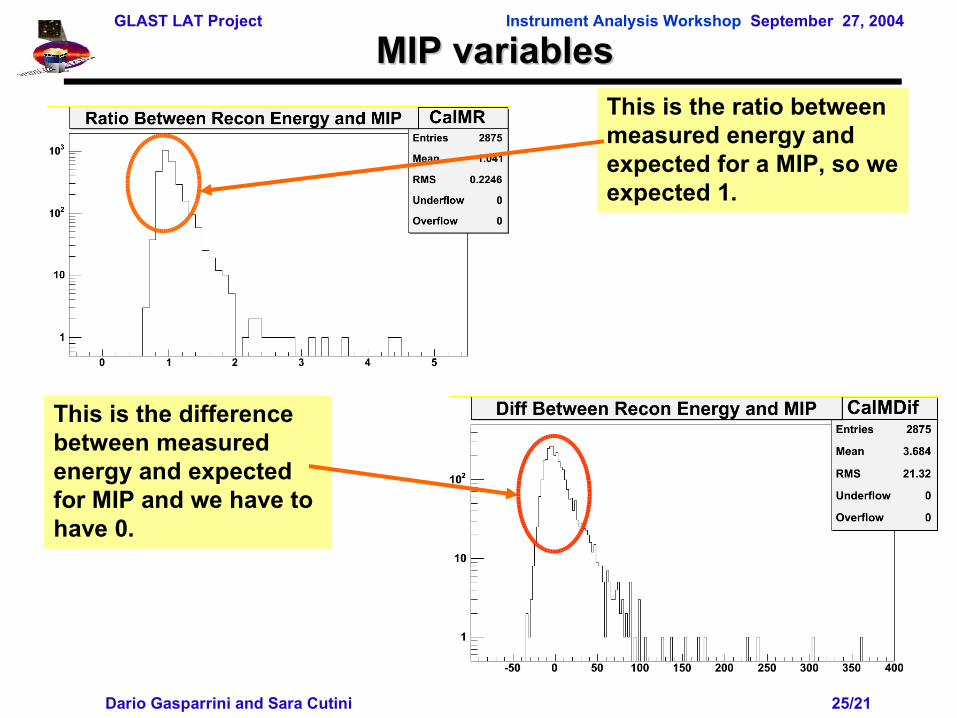
MIP variablesMIP variablesThis is the ratio between measured energy and expected for a MIP, so we expected 1.
This is the difference between measured energy and expected for MIP and we have to have 0.