Embed Size (px)
Citation preview

Who owns the legend?
Presentation by Giacomo RambaldiCTA, Wageningen NL
GISDECO 2004, Universiti Teknologi Malaysia,
Johor Malaysia, 10-12 May 2004

Flow of the presentation
Maps and mapmaking
Pros and Cons
Maps as media
Visual language: building blocks and ownership
Lessons learned
Food for thoughts …

Maps and mapmaking
Describe discoveries
Navigate space
Define boundaries
Locate resources
Register ownership
Plan and strategise

Maps and mapmaking
Educate
Inform and misinform
Raise awareness
Advertise
Re/deterritorialize
Nationalize
Make political propaganda
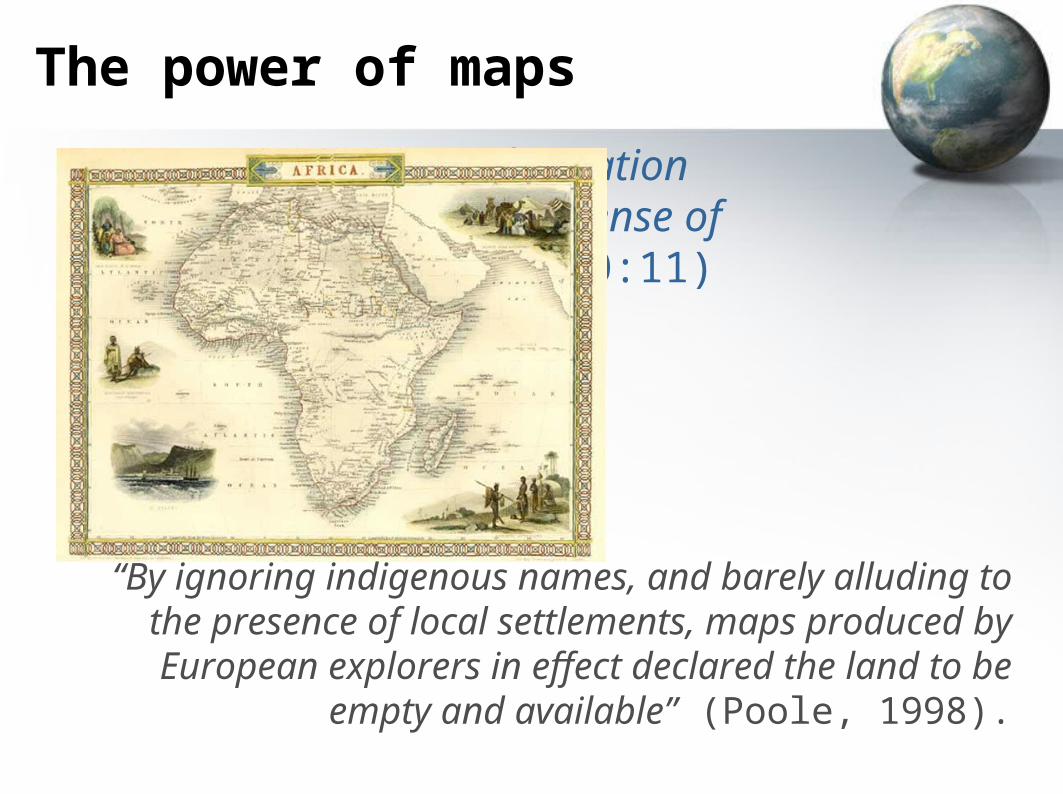
The power of maps
“Maps communicate information immediately and convey a sense of authority” (Alcorn, 2000:11)
“By ignoring indigenous names, and barely alluding to the presence of local settlements, maps produced by European explorers in effect declared the land to be
empty and available” (Poole, 1998).

Maps as media
Humans communicate via maps
For centuries and increasingly with the advent of new Spatial Information Technologies (SIT),
graphic representations of Earth in cartographic, electronic, two or three
dimensional formats have been playing significant roles as media

Towards 2-way communication
Spatial data, previously controlled by government institutions increasingly available to and mastered by civil society;
Increased availability and opportunities for integrating SIT in support to Information & Communication Management (ICM);
SIT integrated into community-centred initiatives through e.g. PGIS, P-GIS, PPGIS, CiGIS, MiGIS, counter mapping, etc.

From pebbles to keyboards …
Participatory approaches
• Solid terrain
models (P3DM)
• 2 D scale maps
• Sketch maps
• Ephemeral maps

From pebbles to keyboards …
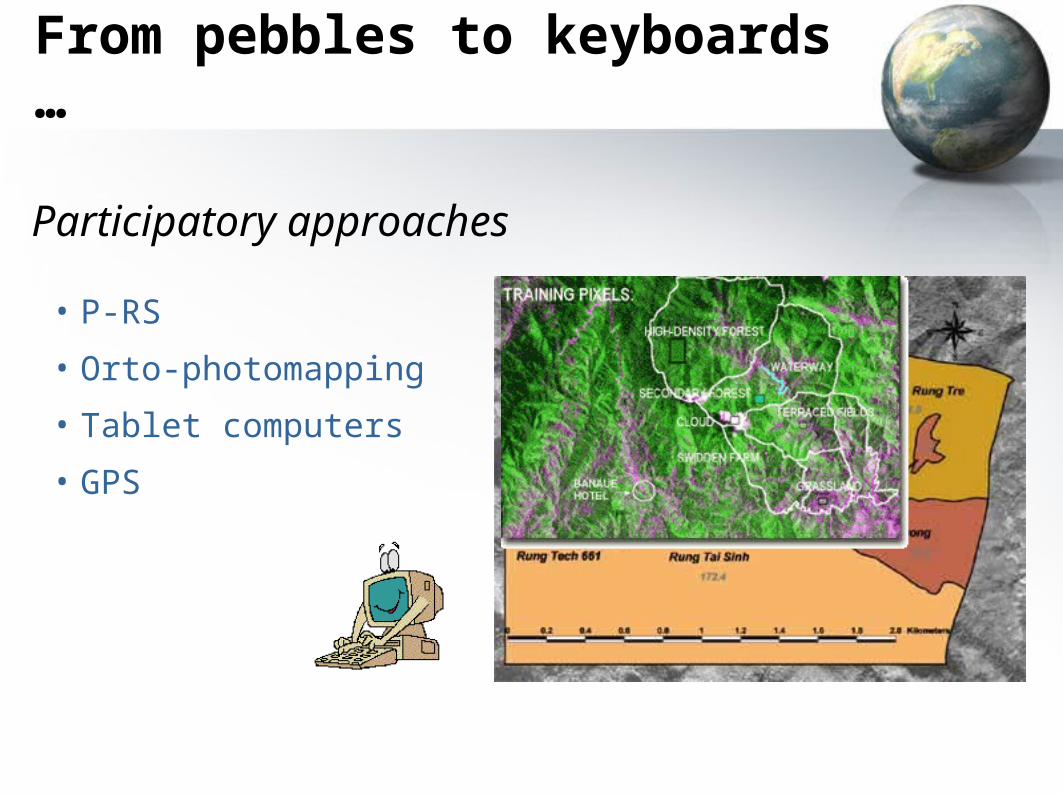
From pebbles to keyboards …
Participatory approaches
• P-RS
• Orto-photomapping
• Tablet computers
• GPS

What is what?
The symbols used to depict real world features reflect through their choice, variation and definition a selected interpretation of reality made by the mapmakers.
This combination produces the visual language through which mapmakers communicate.
The language has to be a “common property” in order for communication to take place.

Visual language
symbols (points, lines, polygons and volumes)
variables (colour, orientation, shading value, shape, size, and texture)
Scales (horizontal and vertical)
interpretation keys
Building blocks
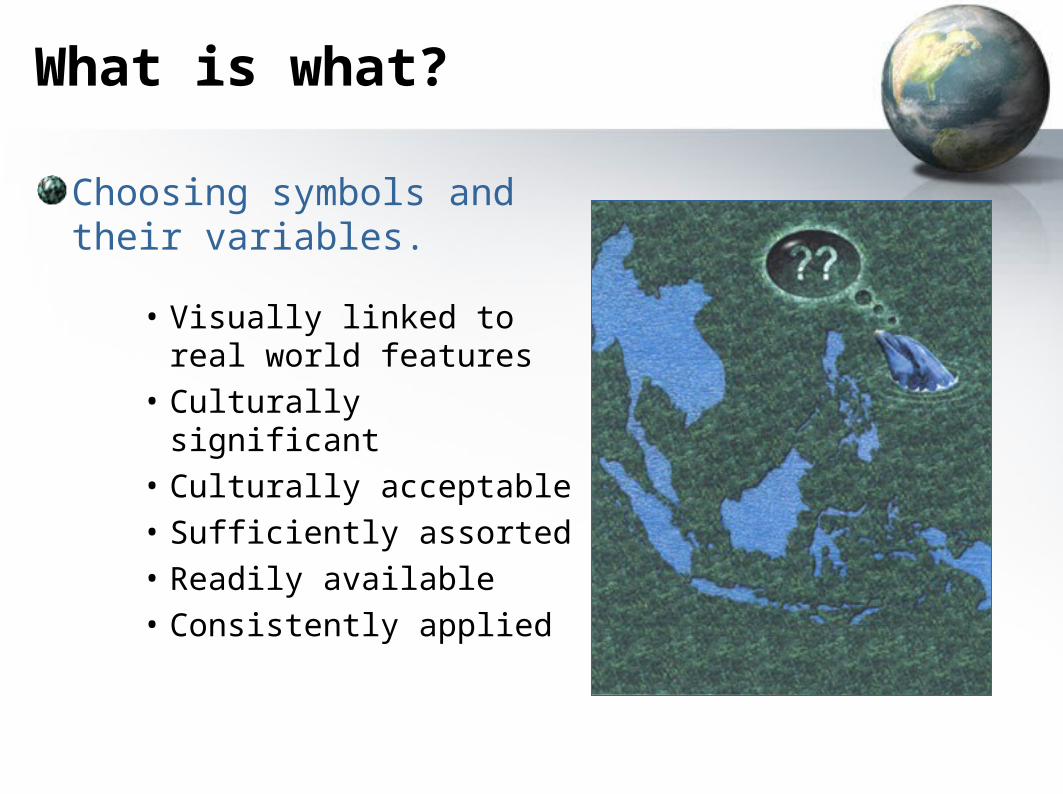
What is what?
Choosing symbols and their variables.
• Visually linked to real world features
• Culturally significant
• Culturally acceptable
• Sufficiently assorted
• Readily available
• Consistently applied
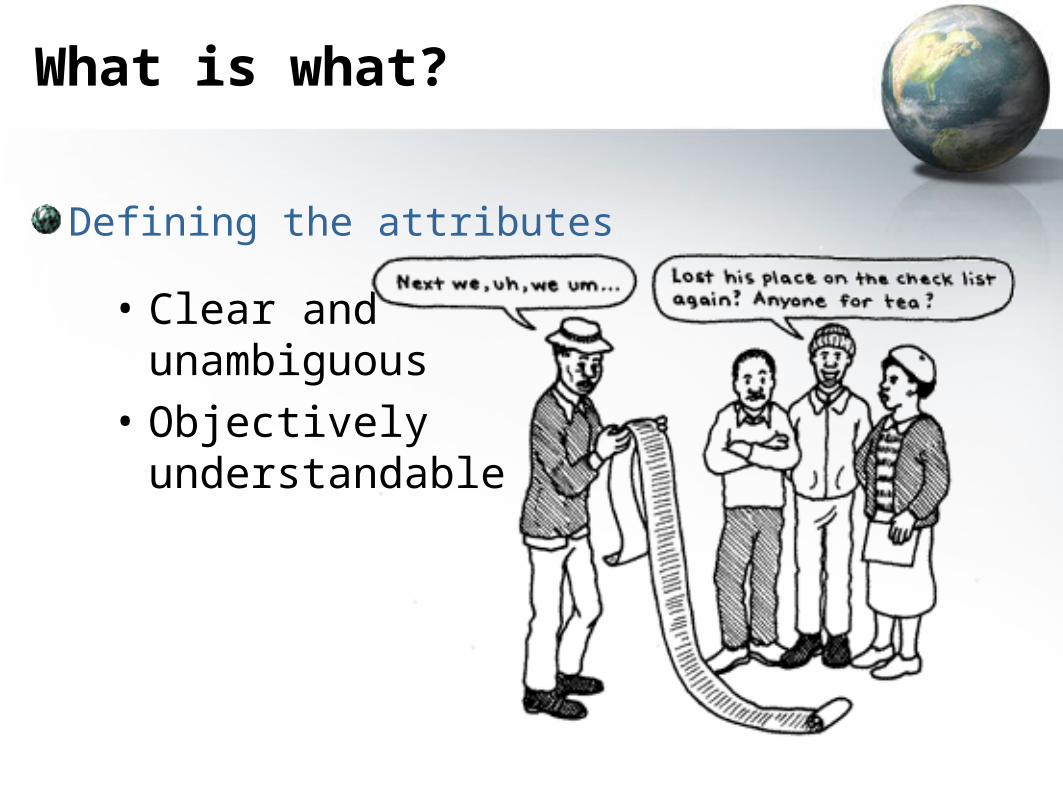
What is what?
Defining the attributes
• Clear and unambiguous
• Objectively understandable

Questions of ownership …
Who decides on what is “important”?
Who defines the attribute of single features in objectively understandable terms ?
Who selects symbol and variable to depict given feature ?
If made public, who decides on what to display on the map and its legend ?

… ultimately
Who owns
the pictorial language,
its graphic vocabulary and
the resulting message?
Who owns the Legend?

In the field In/off the fieldCommunity
consultation and/or raw data collection
Data collection & non-digital mapmaking
Data analysis, editing, manipulation, etc.
• Tentative list of features
• Textual description and definition
• customary associations b/w “features” and “their display”
• Draft legend
• Revise draft legend items;
• Include new items
• Redefine items and list
• Exclude
• Identify sensitive features
• Produce final makeshift legend
• Content matching
• Polishing
• Matching of symbols and variables with available software graphics
• Display of layers (public and restricted access)
• Legends (2)

Towards improved practice …
• Be aware of diversity • Your logic is not necessarily theirs• Be inclusive• Do not assume: ask or discretely verify• Be open to change• Listen and learn• Do nor preach or
teach • Reconcile rather
than correct

Thank you

Useful links
www.ppgis.net: electronic discussion forum (forthcoming)
www.iapad.org: reference site on P3DM, PGIS, PPGIS, P-GIS, GiGIS and more …
www.cta.int: support to ICT & ICM development in ACP member countries