Embed Size (px)
Citation preview

8/14/2019 Who. Methylmercury Information Full
http://slidepdf.com/reader/full/who-methylmercury-information-full 1/68
Environmental Burden of Disease Series, No. 16
Mercury
Assessing the environmental burden of disease at national
and local levels
Jessie Poulin
Herman Gibb
Editor
Annette Prüss-Üstün
A Microsoft Excel spreadsheet for calculating the estimates described in this document can beobtained from WHO/PHE. E-mail contact: [email protected]
Public Health and the EnvironmentGeneva 2008

8/14/2019 Who. Methylmercury Information Full
http://slidepdf.com/reader/full/who-methylmercury-information-full 2/68
WHO Library Cataloguing-in-Publication Data
Mercury : assessing the environmental burden of disease at national and local levels/ Jessie Poulin, Herman Gibb. Edited by Annette Prüss-Üstün.
1.Mercury - adverse effects. 2.Mercury - toxicity. 3.Mercury poisoning, Nervoussystem. 4.Methylmercury compounds - toxicity. 5.Cost of illness. I.World HealthOrganization. II.Poulin, Jessie. III.Gibb, Herman. III.Prüss-Üstün, Annette.
ISBN 978 92 4 159657 2 (NLM classification: QV 293)
Suggested Citation
Poulin J, Gibb H. Mercury: Assessing the environmental burden of disease at nationaland local levels. Editor, Prüss-Üstün A. World Health Organization, Geneva, 2008.
(WHO Environmental Burden of Disease Series No. 16)
© World Health Organization 2008
All rights reserved. Publications of the World Health Organization can be obtained from WHO Press,World Health Organization, 20 Avenue Appia, 1211 Geneva 27, Switzerland (tel.: +41 22 791 3264; fax:+41 22 791 4857; e-mail: [email protected]). Requests for permission to reproduce or translate WHOpublications – whether for sale or for noncommercial distribution – should be addressed to WHO Press,at the above address (fax: +41 22 791 4806; e-mail: [email protected]).
The designations employed and the presentation of the material in this publication do not imply theexpression of any opinion whatsoever on the part of the World Health Organization concerning the legalstatus of any country, territory, city or area or of its authorities, or concerning the delimitation of itsfrontiers or boundaries. Dotted lines on maps represent approximate border lines for which there may notyet be full agreement.
The mention of specific companies or of certain manufacturers’ products does not imply that they areendorsed or recommended by the World Health Organization in preference to others of a similar naturethat are not mentioned. Errors and omissions excepted, the names of proprietary products aredistinguished by initial capital letters.
All reasonable precautions have been taken by the World Health Organization to verify the information
contained in this publication. However, the published material is being distributed without warranty of anykind, either expressed or implied. The responsibility for the interpretation and use of the material lies withthe reader. In no event shall the World Health Organization be liable for damages arising from its use.
The named authors alone are responsible for the views expressed in this publication.
Printed by the WHO Document Production Services, Geneva, Switzerland.

8/14/2019 Who. Methylmercury Information Full
http://slidepdf.com/reader/full/who-methylmercury-information-full 3/68
iii
Table of Contents
Preface.........................................................................................................................................................................v
Affiliations and acknowledgements..............................................................................................................................v
Glossary and abbreviations ..................... ....................... ....................... ...................... ..................... ....................... ...vi
Summary....................................................................................................................................................................vii
1. Introduction................... ...................... ...................... ...................... ...................... ...................... ...................... 1
2. Sources of mercury and exposure pathways ...................... ........................ ....................... .................. ............ 2
2.1 Elemental and inorganic mercury......................................................................................................2 2.2 Organic mercury................................................................................................................................3 2.3 Mercury exposure framework............................................................................................................3
3. Mercury toxicity ....................... ...................... ....................... ....................... .................... ...................... ........... 5
3.1 Elemental and inorganic mercury......................................................................................................5 3.2 Methylmercury...................................................................................................................................6
4. Exposure-risk relationships ...................... ...................... ....................... ....................... ..................... ............... 8 4.1 Endpoints not included in the assessment .................... ....................... ...................... ...................... .8 4.2 Methylmercury-induced IQ deficits ...................... ....................... ....................... ...................... ........10 4.3 Summary ...................... ...................... ...................... ...................... ...................... .................... .......12
5. Exposure assessment ....................... ....................... ...................... ....................... .................... ..................... 13
5.1 Measuring methylmercury levels.....................................................................................................13 5.2 Determining population mercury levels ...................... ....................... ...................... ....................... .15 5.3 Summary ...................... ...................... ...................... ...................... ...................... .................... .......16
6. Disease burden methodology....................... ....................... ...................... ....................... .................... .......... 17
6.1 Incidence of methylmercury-induced MMR ...................... ........................ ....................... ................ 17 6.2
Disease burden in DALYs ....................... ....................... ...................... ....................... .................... 19
7. Example disease burden estimate ...................... ....................... ........................ ....................... .................... . 22
7.1 Biomarker conversions....................................................................................................................22 7.2 Calculating the population at risk.....................................................................................................22 7.3 Estimating MMR incidence..............................................................................................................24 7.4 Estimating DALYs............................................................................................................................24 7.5 Summary of steps for estimating disease burden ....................... ....................... ........................ .....24
8. Burden of disease estimates for selected populations..................... ........................ ....................... ............... 26
9. Uncertainties ................... ...................... ....................... ...................... ...................... ..................... ................. 28
9.1 Other outcomes...............................................................................................................................28 9.2 Model parameters............................................................................................................................28 9.3 Quantitative estimation of uncertainty .................... ...................... ....................... ....................... .....30 9.4 Beneficial nutrients in fish and seafood...........................................................................................31
10. Research needs and recommendations......................... ....................... ...................... ....................... ............ 32
11. Disease burden and policy ...................... ....................... ....................... ...................... ...................... ............. 33
References........................... ...................... ...................... ...................... ...................... ..................... ...................... .. 34
Annex 1 List of meeting participants........................... ........................ ....................... .................... ...........38 Annex 2 Measuring hair mercury concentrations ...................... ...................... ....................... .................. 39 Annex 3 Mercury and omega-3 fatty acid content of seafood ...................... ........................ .................... 41 Annex 4 Subpopulation mercury levels ....................... ....................... ....................... ........................ ....... 43 Annex 5 Calculation spreadsheet for mercury..........................................................................................60

8/14/2019 Who. Methylmercury Information Full
http://slidepdf.com/reader/full/who-methylmercury-information-full 4/68
Mercury burden of disease
iv
List of Tables
Table 1 Health effects of prenatal exposure to methylmercury.................. ........................ ....................... .....12
Table 2 Incremental IQ loss and percent of population shifted to MMR ........................ ....................... .........17 Table 3 Proportion above lower bound of each hair mercury interval................ ....................... ..................... 23
Table 4 Rate of IQ loss per 1000 infants in each exposure interval ....................... ....................... ................ 23
Table 5 Methylmercury exposure, MMR incidence, and DALYs for selected populations.............................26
Table 6 Values for uncertainty analyses........................................................................................................31
Table A3 –1 Mercury and omega-3 fatty acid (DHA + EPA) content of seafood...................................................41
Table A4–1 Review of mercury levels by region and country, represented as concentrations in hair (μg/g) ......44
Table A4–2 Countries in WHO regional groups ................... ...................... ...................... ...................... .............. 54
List of Figures
Figure 1 Framework for mercury exposure..........................................................................................................4
Figure 2 Shift to MMR as a result of methylmercury-induced IQ loss................................................................18
Figure 3 Flowchart for estimating the disease burden of methylmercury...........................................................25
Figure A3 –1 Mercury and omega-3 fatty acid (DHA + EPA) content of seafood......................................................42

8/14/2019 Who. Methylmercury Information Full
http://slidepdf.com/reader/full/who-methylmercury-information-full 5/68
v
Preface
The disease burden of a population and how that burden is distributed across differentsubpopulations (e.g. infants, women), are important pieces of information for definingstrategies to improve population health. For policy-makers, disease burden estimates
provide an indication of the health gains that could be achieved by targeted actionagainst specific risk factors. The measures also allow policy-makers to prioritizeactions and direct them to the population groups at highest risk. To help provide areliable source of information for policy-makers, WHO analysed 26 risk factorsworldwide in the World Health Report (WHO, 2002).
The Environmental Burden of Disease (EBD) series continues this effort to generatereliable information, by presenting methods for assessing the environmental burden ofmercury at national and local levels. The methods in the series use the generalframework for global assessments described in the World Health Report (WHO,2002). The introductory volume in the series outlines the general method (Prüss-Üstün
et al., 2003), while subsequent guides address specific environmental risk factors. Theguides on specific risk factors are organized similarly, first outlining the evidencelinking the risk factor to health, and then describing a method for estimating the healthimpact of that risk factor on the population. All the guides take a practical, step-by-stepapproach and use numerical examples. The methods described in the guides can beadapted both to local and national levels, and can be tailored to suit data availability.
This document was reviewed in Geneva at the Informal preparatory meeting for theChemical Task Force of the Foodborne Disease Epidemiology Reference Group(FERG), held by the World Health Organization Department of Food Safety,Zoonoses, and Foodborne Diseases on 29 June 2007. For a list of invited experts andother attendees, see Appendix 1.
Af fil iations and acknowledgements
Herman Gibb and Jessie Poulin are from Sciences International, Alexandria, USA, andAnnette Prüss-Üstün is from the World Health Organization.
We thank Lesley Onyon and Claudia Stein for their inputs and support, as well as thevaluable comments from the participants of the Informal preparatory meeting for the
Chemical Task Force of the Foodborne Disease Epidemiology Reference Group(FERG) held in Geneva on 29 June 2007. WHO acknowledges and appreciatesthe financial support for this project from the Government of Germany, Ministry forthe Environment, Nature Conservation & Nuclear Safety.

8/14/2019 Who. Methylmercury Information Full
http://slidepdf.com/reader/full/who-methylmercury-information-full 6/68
Mercury burden of disease
vi
Glossary and abbreviations
ATSDR Agency for Toxic Substances and Disease Registry
CI Confidence interval
DALYs Disability-Adjusted Life Years
DHA Docosahexaenoic acid
EPA Eicosapentaenoic acid
IPCS International Programme on Chemical Safety
IOM Institute of Medicine
IQ Intelligence Quotient
μg Micrograms
MMR Mild mental retardation
NRC National Research Council
OR Odds ratio
PTWI Provisional tolerable weekly intake
RfD Reference dose
RR Relative risk
US EPA Environmental Protection Agency of the USA
WHO World Health Organization
WISC Wechsler Intelligence Scales for Children

8/14/2019 Who. Methylmercury Information Full
http://slidepdf.com/reader/full/who-methylmercury-information-full 7/68
vii
Summary
This document provides a review of the health effects of elemental, inorganic, andmethylmercury and methods for estimating the burden of disease for methylmercury.Elemental mercury can cause a variety of health effects. Methylmercury has been
associated with adult neurological problems, and there is some evidence thatmethylmercury exposure affects the adult cardiovascular system. However, the data forthese effects are insufficient for a quantitative analysis. As a result, the quantitativeaspect of this report focuses on the neurodevelopmental toxicity of methylmercury.
Cognitive deficits in infants are represented as IQ point deficits caused by prenatalexposure to methylmercury. The disease burden is assessed using the distribution ofhair mercury concentrations among pregnant women or women of childbearing age asa measure of infant exposure. Although small IQ deficits may not be visible on anindividual basis, they can be significant in a population with high exposure or amongthose affected by endemic diseases that impair neurological function. IQ deficits have
the greatest population impact among children with IQ scores just above 69 points, forwhom lowered IQ score would result in mild mental retardation (defined as an IQ
between 50 and 69 points). The rate of mild mental retardation caused bymethylmercury-related IQ loss and the resulting number of disability-adjusted lifeyears (DALYs) lost are calculated from the exposure distribution. DALYs measure thehealth impact in a population as the number of healthy years of life lost based on theseverity and length of the illness.
This report estimates the disease burden for several populations, including subsistencefishers, sport fishers, and indigenous communities near industrial and miningactivities. The incidence rate for mild mental retardation is estimated to be as high as17.37 per 1000 infants born among a subsistence fishing population in the Amazon,resulting in a loss of 202.8 disability-adjusted life years per 1000 infants. Due to thelack of exposure data from representative populations in the various regionsthroughout the world, the global burden of disease could not be estimated.Quantification of the disease burden in subpopulations for which exposure is known,however, provides an important basis for targeting populations at risk for significanthealth deficits.
Because elemental mercury can be transported long distances in air, regions with littleor no mercury emissions may have high environmental mercury levels. Minimizing the
amount of mercury emitted into the environment to reduce methylmercuryconcentrations in fish and seafood requires global cooperation. Furthermore, someelemental mercury is emitted as a result of natural processes (e.g. volcanoes, forestfires). Thus, reducing the consumption of seafood with high methylmercuryconcentrations is the most direct way to reduce the risk of methylmercury-relatedcognitive deficits in a highly exposed population. However, consumptionrecommendations must also consider the nutritional value of fish and shellfish,
particularly in populations without access to alternative sources of protein.Additionally, there is evidence that omega-3 fatty acids in fish and shellfish have a
beneficial effect on neurodevelopment. The risks and benefits of fish consumptiondepend on the amount and species of fish consumed and must be weighed carefully for
each subgroup in the population.

8/14/2019 Who. Methylmercury Information Full
http://slidepdf.com/reader/full/who-methylmercury-information-full 8/68
Mercury burden of disease
viii

8/14/2019 Who. Methylmercury Information Full
http://slidepdf.com/reader/full/who-methylmercury-information-full 9/68
Introduction
1
1. Introduction
The toxic effects of mercury have been observed for centuries. The phrase “mad as ahatter” was coined due to neurological problems suffered by hat makers who inhaledmercuric nitrate vapour. Mercurous chloride in teething powders and ointments caused
cases of acrodynia (pink disease) among young children in the 1900s. In the 1950s,mercury was released from a chemical plant into the Minimata Bay of Japan,contaminating fish that were consumed by fishermen and their families. Another
poisoning episode occurred in the 1970s when seed grain coated with a methylmercuryfungicide was mistakenly used as flour in Iraq. These incidents dramaticallydemonstrated mercury’s neurotoxic effects, which were particularly severe amonginfants exposed during the prenatal period. In recent years, concern has centred onexposure to methylmercury in fish and elemental mercury from industrial and miningactivities.
This document estimates the burden of disease from prenatal methylmercury exposure
in several high-risk groups and provides methods for determining the burden of diseasein populations with elevated methylmercury exposure. Mercury exposure sources,health effects, and exposure-response relationships are described and used in aquantitative methodology for measuring the disease burden of methylmercury-inducedneurodevelopmental deficits. Although exposure to elemental mercury and inorganicmercury compounds is known to cause a variety of adverse health outcomes, the dataare insufficient to conduct a burden of disease estimate for these effects. This does notdiminish the significance of elemental mercury toxicity in highly-exposed populations(e.g. artisanal and small scale gold miners), and lack of this information is a criticalresearch need for estimating the disease burden from mercury.
The burden of disease in each population is determined by estimating the impact ofmethylmercury-induced IQ deficits in infants. The following are the basic steps of theassessment:
1. Determine the distribution of hair mercury concentrations in women ofchild-bearing age consuming methylmercury-contaminated fish.
2. Calculate IQ deficits in infants based on the distribution of hair mercuryconcentrations in women of child-bearing age.
3. Estimate the incidence rate of methylmercury-induced mild mental
retardation and the resulting disease burden in DALYs.

8/14/2019 Who. Methylmercury Information Full
http://slidepdf.com/reader/full/who-methylmercury-information-full 10/68
Mercury burden of disease
2
2. Sources of mercury and exposure pathways
Mercury is a metallic element that exists naturally in the earth’s crust and can betransported throughout the environment in air and water. Mercury is released into theair as vapour during natural processes such as volcanic activity, forest fires, water body
movement, weathering of rock, and biologic processes. Elemental mercury cancombine with other elements to form inorganic mercury compounds (e.g. mercuricacetate, mercuric chloride, mercurous chloride, mercuric nitrate, mercuric oxide,mercuric sulfide). As mercury cycles through the environment, it deposits in water
bodies where it undergoes biotransformation by aquatic microorganisms, formingmethylmercury. Other organic forms of mercury include ethyl mercury and phenylmercury.
Anthropogenic sources of mercury contribute significantly to levels in the environmentand include mining operations, industrial processes, combustion of fossil fuels, cement
production, and incineration of medical, chemical, and municipal wastes. Current
mercury levels in the atmosphere are between 3 and 6 times higher than levelsestimated to have existed before industrialization (WHO, 2003). Due to global mercurycycling through air and water, even regions without mercury emissions can havesubstantial environmental mercury levels.
2.1 Elemental and inorganic mercury
General population exposure to inorganic forms of mercury can occur from a widevariety of sources. While not an exhaustive list, some of the major sources include:
• contact with mercury-containing products (e.g. thermometers, barometers,thermostats, blood pressure monitors, electrical switches, batteries, paint, etc.);
• exposure from dental amalgams fillings:
• playing in contaminated soil or with mercury from thermometers (children);
• inhalation of ambient air near mercury refineries, mines, and industrial plants,or where mercury-containing fungicides have been applied (i.e. environmental“hotspots”);
• ingestion of mercury-contaminated food or drinking water;
• use of traditional, folk, or herbal medicines (e.g. antiseptics, diuretics,laxatives);
• application of mercury-containing skin lightening creams and soaps;
• exposure during religious and cultural practices.
Occupational exposure
Mercury vapour inhalation is the primary route of occupational exposure, but mercurycan also be absorbed through the skin. Mercury-related health effects have beenobserved in dental personnel, gold and silver miners, florescent light bulbmanufacturers, and workers in the chlor-alkali and thermometer industries, amongothers. In developing countries, mercury vapour exposure through artisanal and small-

8/14/2019 Who. Methylmercury Information Full
http://slidepdf.com/reader/full/who-methylmercury-information-full 11/68
Sources and exposure
3
scale gold mining can reach very high levels due to uncontrolled working conditions.As many as 10–15 million people in over 50 countries are engaged in these activities,which are estimated to release between 800 and 1000 tons of mercury into theenvironment each year (Veiga and Baker, 2004).
2.2 Organic mercury
The most common form of organic mercury is methylmercury, which is formed whenmercury in oceans, lakes, and rivers is biotransformed by aquatic microorganisms.Methylmercury is present in most aquatic species and bioaccumulates in the aquaticfood-chain, which may lead to high concentrations in fish, shellfish, and marinemammals. Mercury content is highest in large carnivorous species and older fish. Themajor source of human exposure to methylmercury is ingestion of contaminated fishand seafood (seafood includes shellfish and marine mammals, such as whales). Highexposures can occur among populations with high fish consumption (e.g. subsistence
fishers, sport fishers). Environmental hotspots can occur near industrial and miningactivities, where pollution of local water bodies may result in elevated levels ofmethylmercury in fish.
Other organic forms of mercury, such as ethyl mercury and phenyl mercury, have beenused in paints, fungicides, antiseptics, preservatives, and topical disinfectants.Although these uses have been largely discontinued, they may be a source of exposurein some parts of the world. Other forms of mercury (i.e. dialkyl mercurials) areextremely toxic and not commonly used outside of limited occupational applications.Thimerosal is a preservative in vaccines that contains ethyl mercury. While there has
been much debate over the possible toxicity of ethyl mercury in thimerosal (i.e.
autism), the WHO Global Advisory Committee on Vaccine Safety concluded that thereis “no evidence of toxicity in infants, children or adults exposed to thiomersal invaccines” (WHO, 2006). Data on health effects and exposure-response for organicforms other than methylmercury are not well characterized and are thus not evaluatedin this assessment.
2.3 Mercury exposure framework
It is important to identify all sources of mercury as they may be significant amongexposed individuals. Common routes of mercury exposure are summarized in Fig. 1.

8/14/2019 Who. Methylmercury Information Full
http://slidepdf.com/reader/full/who-methylmercury-information-full 12/68
Mercury burden of disease
4
Figure 1 Framework for mercury exposure
Dental amalgams
Mining
Folk medicines,
religious
practices, etc.
Fossil fuel
combustion
Waste
incineration
Mercury in food
Mercury in air
Mercury in water
Methylmercury
in food
- Blood
- Urine
- Hair
- Blood
- Cord-blood
Mercury health effects
Methylmercury health
effects, e.g.:
- IQ deficits
Thermometers,
barometers, etc.
Industrial
processes
Outcome
Biological
Measure of Exposure
Exposure
Pathway
Source of
Exposure
Transformation
by microorganisms
and bioaccumulation
in aquatic species

8/14/2019 Who. Methylmercury Information Full
http://slidepdf.com/reader/full/who-methylmercury-information-full 13/68
Mercury toxicity
5
3. Mercury toxici ty
This section outlines the main health effects resulting from exposure to elementalmercury, inorganic mercury compounds, and methylmercury. The data provided beloware based on reviews, which are available for additional information on mercury
toxicity (ATSDR, 1999; NRC, 2000; WHO/IPCS, 1990; WHO/IPCS, 1991; WHO,2003; WHO/IPCS, 2004). The weight of evidence for these endpoints and theirusefulness in the burden of disease evaluation are discussed in Section 4.
3.1 Elemental and inorganic mercury
Nervous system effects
The nervous system is the most sensitive target for mercury exposure. A variety ofneurological and behavioural disorders have been reported, including tremors, erethism(abnormal irritability or responsiveness to stimulation), emotional lability, insomnia,
memory loss, neuromuscular changes, headaches, polyneuropathy, and deficits incognitive and motor function tests. Effects are similar at varying durations but can
become more severe (sometimes irreversible) as duration and concentration increase.Studies of workers in florescent tube manufacturing, wood processing, chlor-alkali,and thermometer plants have demonstrated subtle central nervous system toxicity atmercury vapour concentrations in air as low as 20 µg/m3.
Renal effects
The kidneys are another major target of mercury vapour toxicity, though effects occur
at higher levels than neurological problems. Inhalation of high mercury vapourconcentrations can cause gross or mild transient proteinuria, changes in urinary acidexcretion, hematuria, oliguria, and acute renal failure. Chronic oral exposure toinorganic mercury compounds also results in renal damage, and renal failure has beenreported in several cases following mercuric chloride ingestion.
Cardiovascular effects
Increased blood pressure, palpitations, and increased heart rate have been observed incases of acute high level mercury exposure. Studies of chronic exposure in chlor-alkaliworkers and mercury miners have also been suggestive of cardiovascular toxicity
(Barregard et al., 1990; Boffetta et al., 2001; Kobal et al., 2004).
Skin effects
Rashes, hives, and dermatitis have been observed following occupational andaccidental contact with inorganic mercury compounds. Inhalation of mercury vapoursand contact with mercurous chloride in teething powders and ointments can causeacrodynia, a pink discolouration of the hands and feet usually accompanied byinsomnia, irritability, and light sensitivity.

8/14/2019 Who. Methylmercury Information Full
http://slidepdf.com/reader/full/who-methylmercury-information-full 14/68
Mercury burden of disease
6
Respiratory effects
Acute high-level exposure to mercury vapours causes respiratory effects such ascough, dyspnea, and chest tightness or burning. Effects of chronic occupationalexposure include similar symptoms and more severe effects such as pneumonitis,
reduced pulmonary function, airway obstruction, hyperinflation, decreased vitalcapacity, respiratory distress, pulmonary oedema, and lobar pneumonia fibrosis.
3.2 Methylmercury
Nervous system effects
Methylmercury poisoning can cause a variety of central nervous system effects inadults. Neurological effects in adults with Minimata disease include sensory and motorimpairment, such as paresthesia, peripheral neuropathy, tremor, dysarthria, cerebellar
ataxia, gait and equilibrium disturbance, opthalmological and audiological impairment,and subjective symptoms (e.g. headache, muscle and joint pain, forgetfulness, fatigue).Some of these effects may be reversible with removal from exposure. It is unclearwhether low dose methylmercury exposure from fish is toxic in adults; several cross-sectional studies have reported varying results (Auger et al., 2005; Johansson et al.,2002; Lebel et al., 1998; Yokoo et al., 2003; Weil et al., 2005).
Developmental neurotoxicity
Neurodevelopmental toxicity is the most sensitive endpoint for methylmercury(WHO/IPCS, 2004). Methylmercury can pass through the placental barrier and affect
the nervous system of developing foetuses. Prenatal exposure can result in irreversibledamage to the fetal central nervous system, which is more sensitive to methylmercurytoxicity than that of adults. Severe neurodevelopmental toxicity was demonstrated inchildren exposed to high methylmercury concentrations in utero during poisoningepisodes in Japan and Iraq. Effects included mental retardation, impaired mentaldevelopment, dysarthria, sensory impairment (blindness and deafness), paralysis,hyperactive or primitive reflexes, cerebellar ataxia, cerebral palsy, physical growthdisturbance, and limb deformities (NRC, 2000).
Developmental neurotoxicity has also been observed following prenatal exposure ofchildren to methylmercury from maternal fish consumption. Prenatal methylmercury
exposure from fish and seafood has been investigated in three prospective long-termcohort studies conducted in the Faroe Islands, New Zealand, and the Republic ofSeychelles. Maternal hair mercury concentrations in these three studies were 4.3 μg/g(geometric mean), 8.3 μg/g (mean), and 5.8 μg/g (median), respectively (Cohen et al.,2005a). The Faroe Islands study reported an inverse dose response relationship
between children’s performance on standardized neurobehavioural tests andconsumption of methylmercury-contaminated seafood (primarily pilot whale) by theirmothers during pregnancy. Deficits were observed in tests of attention, fine-motorfunction, visual-spatial abilities, and verbal memory (NRC, 2000). The New Zealandstudy found similar associations between fish consumption by pregnant women and
neurodevelopmental effects in their children, but the Seychelles Island study did not.

8/14/2019 Who. Methylmercury Information Full
http://slidepdf.com/reader/full/who-methylmercury-information-full 15/68
Mercury toxicity
7
Evaluations by WHO and NRC provide thorough descriptions and analyses of thesestudies (WHO/IPCS, 2004; NRC, 2000).
Cardiovascular effects
Several studies have found associations between low level methylmercury exposureand cardiac outcomes in adults. Prospective studies of a cohort of Finnish males haveshown that mercury exposure increases risk of acute myocardial infarction and deathfrom coronary heart disease and cardiovascular disease, as well as increased intima-media thickness (an indicator of atherosclerosis) (Salonen et al., 1995; Salonen et al.,2000; Rissanen et al., 2000; Virtanen et al., 2005). Rissanen et al. and Virtanen et al.also reported that the cardio-protective effect of fatty acids in fish was attenuated byelevated hair mercury levels. A case-control study found a dose-related association
between toenail mercury concentrations and myocardial infarction in European andIsraeli men, which increased when adjusted for the omega-3 fatty aciddocosahexaenoic acid (DHA) (Guallar et al., 2002). Yoshizawa et al. (2002) conducted
a nested case-control study of American male health professionals and did not find anassociation between toenail mercury levels and cardiovascular disease. However, thestudy included a large number of dentists, who are exposed to elemental mercuryvapour from dental amalgams rather than methylmercury from seafood. Since the twoforms of mercury may affect the cardiovascular system differently, a second analysiswas conducted that excluded dentists and controlled for the omega-3 fatty acidseicosapentaenoic acid (EPA) and DHA. The results showed an elevated risk ofcardiovascular disease (RR = 1.70) that was non-significant, likely due to a lack of
power from the reduced sample size (Yoshizawa et al., 2002). A study of non-indigenous fish consumers in the Brazilian Amazon reported that hair mercury levels
above 10 μg/g were associated with increased systolic blood pressure (OR: 2.91, 95%CI: 1.26–7.28) (Fillion et al., 2006).
Cardiovascular effects have also been observed in children. A study of Faroesechildren exposed to methylmercury in utero, as measured by cord-blood mercury,reported significantly increased systolic and diastolic blood pressure at age 7 (Sørensenet al., 1999). However, when this cohort was followed to age 14, increased blood
pressure was no longer associated with cord-blood mercury concentrations (Grandjeanet al. 2004). Heart rate variability was 47% lower in boys at age 7 and remaineddecreased at the 14 year follow-up, but the degree to which decreased childhood heartrate variability can be associated with risk of future disease is uncertain (Stern, 2005).

8/14/2019 Who. Methylmercury Information Full
http://slidepdf.com/reader/full/who-methylmercury-information-full 16/68
Mercury burden of disease
8
4. Exposure-risk relationships
Methods for quantifying disease burden are provided only for selected health effects.This determination is based on:
• the strength of the evidence demonstrating the health effect;
• whether the effects are well defined health outcomes or can be converted intosuch;
• the availability of quantitative information on the association between themercury biomarker and the health effect.
Only publicly available, peer-reviewed literature was used in the preparation of thisdocument. A systematic literature search was conducted to obtain quantitativeexposure-response data on mercury outcomes. A search of online databases includingPubMed, MEDLINE, and TOXLINE was conducted using mercury and
methylmercury as search terms and limiting the results to studies in humans. Allreferences were downloaded into a reference management database and abstracts werereviewed. All studies with exposure-response data were obtained. ATSDR, EPA, NAS,and WHO documents on mercury were also reviewed for relevant information andfurther studies were obtained for consideration.
4.1 Endpoints not included in the assessment
For most of the outcomes described in Section 3, no exposure-response data areavailable. Case reports indicate ranges of exposure for some endpoints but do not
provide sufficient quantitative information to estimate risk. In addition, many effectsare subtle and/or transient and can not be related to quantifiable health outcomes forwhich disability weights have been determined. Data on exposure-response forinorganic mercury compounds are particularly sparse. Specific data limitations arediscussed below.
Elemental Mercury
General assessments have attempted to determine exposure-response relationships between elemental mercury and health effects. Clarkson and Magos (2006)summarized data from twelve occupational studies where the mercury concentrations
were less than 50 µg/L in urine and reported that while there are effects on thenervous, immune, and renal systems, “One cannot see any consistent relation betweenurinary levels and effect findings.” WHO determined that there is a “high probability”of developing tremor, erethism, and proteinuria at levels of 100 µg/g creatinine inurine (80 µg/m3 in air), but a quantitative definition of “high probability” was not
provided (WHO/IPCS, 1991).
Neuropsycholog ical effects
Neuropsychological deficits in workers and other adults are difficult to quantify
because they are subtle and vary from study to study (e.g. tremor, irritability, negativeself-concept, anxiety, psychoticism, hysteria, schizoid and psycho-asthenia, decreased

8/14/2019 Who. Methylmercury Information Full
http://slidepdf.com/reader/full/who-methylmercury-information-full 17/68
Exposure-risk relationships
9
logical memory and total retention score). Two meta-analyses failed to identify a dose– response relationship. A study by Meyer-Baron et al. (2004) found general exposure-response associations between inorganic mercury exposure and neurobehavioural tests,
but was unable to estimate specific dose–response relationships. A meta-analysis byRohling and Demakis (2006) reported that “the prevalence of neuropsychological
deficits due to occupational exposure to mercury is small and difficult to detect on anindividual case-by-case basis.” Additionally, many neuropsychological effects recoverwith removal from exposure.
Renal effects
No exposure-response information was identified for renal outcomes. Effects such asrenal failure occur following high exposure such as in uncontrolled occupationalsettings.
Cardiovascular effects
Silberud (1990) found an association between blood pressure and mercury and Boffettaet al. (2001) reported “a possible association between employment in mercury miningand refining and risk in some groups of cardiovascular diseases.” However, bothstudies had methodological problems such as limited exposure data, confounding, anddisease misclassification. Although they are suggestive of a relationship betweeninorganic mercury exposure and cardiovascular risk, more studies are needed.
Skin effects
Children who inhale mercury vapour can develop a skin condition known as acrodynia.Although there may be a threshold for development of the disease, there is wideindividual variability. A dose–response relationship has not been determined and thereis no disability weight for this condition.
Methylmercury
Adul t nervous sys tem effects
As discussed in Section 3.2, several studies have noted effects of methylmercury onthe adult nervous system. However, the health significance of these outcomes are
difficult to quantify as they may be reversible. No quantitative estimates of exposure-response in the adult nervous system were identified in the literature.
Cardiovascular effects
The Institute of Medicine (IOM) reviewed the risks and benefits of fish consumptionand concluded that, “increased methylmercury exposure might be a risk factor for adultcardiovascular toxicity, although the data available are not extensive and uncertaintiesremain” (IOM, 2006). The IOM report also reported that “increased seafoodconsumption is associated with a decreased risk of cardiovascular deaths andcardiovascular events in the general population” (IOM, 2006). Similarly, a US EPA
review stated that “the science on the impact of methylmercury on the risk ofcardiovascular events remains uncertain, and the weight of the evidence, in fact,
8/14/2019 Who. Methylmercury Information Full
http://slidepdf.com/reader/full/who-methylmercury-information-full 18/68
Mercury burden of disease
10
supports a positive association between fish consumption and potential cardiovascular benefits” (US EPA, 2005). Therefore, the evidence for cardiovascular effects was notdeemed adequate for use in the burden of disease analysis.
4.2 Methylmercury-induced IQ defici ts
The neurodevelopmental deficits caused by prenatal methylmercury exposure are welldocumented and can be used to determine health impacts in a population. In a safetyevaluation of methylmercury in food, WHO stated that “neurodevelopment wasconsidered to be the most sensitive health outcome, and in utero the most sensitive
period of exposure” (WHO/IPCS, 2004).
Dose–response studies
Three studies were identified that calculated a dose–response relationship between
prenatal methylmercury exposure and IQ deficits in infants.
Budtz-Jorgensen et al. (2004a)Using data from the Faroe Islands 7-year follow-up study, Budtz-Jorgensen et al.estimated the association between maternal hair mercury concentration and observedtest performance deficits in infants expressed as IQ points. Since there is nostandardized Faroese IQ test, structural equation analyses were conducted using fourtests as indicators of motor function and seven tests as indicators for verbally mediatedfunction. Doubling of maternal hair mercury concentration was estimated to result in atest performance deficit of 9.74% of the test standard deviation for motor function and
10.45% of the standard deviation for verbally mediated function. Since a 10%reduction of the IQ scale standard deviation is 1.5 points, doubling of maternal hairmercury was estimated to be associated with a 1.5 point IQ deficit.
Cohen et al. (2005a)Cohen et al. modelled the relationship between IQ and methylmercury exposure usingdata from all three major cohort studies (Faroe Islands, the Republic of Seychelles, and
New Zealand). For each cohort, regression coefficients were calculated for each test inseven functional domains: motor, attention, visuospatial/visuomotor, language,memory, intelligence, and learning/achievement. Neurological tests were weighted
according to known or judged correlation with IQ scores, relevance to the US population, and study quality. The log regression coefficients reported in the FaroeIslands were linearized over the lowest quartile of exposure for comparison with thelinear coefficients of the other studies. This portion of the curve, which is supra-linear,was deemed most applicable to US exposures. The average cognitive performancedecrease was 0.043 SDs per μg/g increase in maternal hair methylmercuryconcentration. Based on the IQ test standard deviation of 15 points, the authorsconcluded that every 1 μg/g increase in maternal hair methylmercury concentration isassociated with an IQ decrease of 0.7 points. In a sensitivity analysis, the Faroe Islandsdata were linearized over the mid-range of exposure where the dose–response curve islinear. This analysis was conducted due to the NRC (2000) conclusion that a linear
relationship is more biologically plausible than a supra-linear one. This model resultedin a mean deficit of 0.2 IQ points per 1 μg/g increase in maternal hair mercury. An

8/14/2019 Who. Methylmercury Information Full
http://slidepdf.com/reader/full/who-methylmercury-information-full 19/68
Exposure-risk relationships
11
integrated sensitivity analysis determined that the plausible values for the associationranged from 0 to 1.5 IQ points lost per 1 μg/g increase in maternal hairmethylmercury.
Axelrad et al. (2007)This analysis incorporated dose–response coefficients for neurological outcomes fromthe three major cohort studies in a Bayesian hierarchical model assuming a linear non-threshold association. The relevance of each neurodevelopmental test to IQ scores wasevaluated and the following tests were included in the model: full-scale IQ (all threecohorts), performance IQ (New Zealand), California Verbal Learning Test (Faroes andSeychelles), Bender-Gestalt Test (Faroes), Boston Naming Test (Faroes andSeychelles), McCarthy Scales of Children’s Abilities (New Zealand), Test ofLanguage Development (New Zealand), Developmental Test of Visual-MotorIntegration (Seychelles), and Wide Rage Assessment of Memory and Learning(Seychelles). The Wechsler Intelligence Scales for Children (WISC) test of full-scale
IQ was administered to the Seychelles and New Zealand cohorts; the WISC dose– response coefficient for the Faroe Islands cohort was estimated in a structural equationmodel based on three subtests. Although the Seychelles study used WISC-R and the
New Zealand and Faroe Islands studies used WISC-III, the two versions correlate well(r = 0.89). A Bayesian hierarchical random effects approach was used to treat allmodel parameters as random variables and control for within and between studyvariability. The coefficient for each test was rescaled based on the standard deviationand expressed as IQ. The authors obtained a central estimate of −0.18 IQ points (95%CI −0.387, −0.012) per each 1 μg/g increase in maternal hair mercury. Estimates fromsensitivity analyses ranged from −0.125 to −0.25 IQ points per 1 μg/g increase in
maternal hair mercury.
Evaluation of the literature
The Axelrad et al. (2007) paper is the most recent meta-analysis describing therelationship between methylmercury and IQ. It incorporates data from all three of thelarge prospective cohort studies on prenatal methylmercury exposure and neurologicaloutcomes. It uses a sophisticated Bayesian hierarchical model approach and considersseveral measures of cognitive performance. As an update of a prior study by Ryan(2005), which was conducted for the US EPA’s Clean Air Mercury Rule, the methodsof Axelrad et al. have undergone extensive scientific peer-review and comment. In a
discussion of the Ryan study, the IOM stated, “although the findings of the Seychellesstudy appear discrepant from those of the Faroe Islands and New Zealand studies ifone focuses only on the p-values of the reported analyses, at a deeper, quantitativelevel that focuses on the rates of decline in scores as mercury burden increases, thefindings of the three studies are remarkably concordant” (IOM, 2006). The relationshipdescribed by Axelrad et al. is also similar to the results of the Cohen et al. (2005a)sensitivity analysis, and the studies share a primary author (David C. Bellinger). Forthese reasons the dose–response relationship described by Axelrad et al. is deemed themost reliable for use in burden of disease calculations. For a discussion of modeluncertainties, see Section 9.2.

8/14/2019 Who. Methylmercury Information Full
http://slidepdf.com/reader/full/who-methylmercury-information-full 20/68
Mercury burden of disease
12
4.3 Summary
Table 1 summarizes the quantitative relationship developed by Axelrad et al. (2007).
Table 1 Health effects of prenatal exposure to methylmercury
Outcome Group Biomarker Threshold Relationship
IQ reduction Infants Maternalhair
None Linear relationship between 1 μg/g increase inmaternal hair mercury concentration and 0.18 pointdecrease in IQ (Axelrad et al., 2007)

8/14/2019 Who. Methylmercury Information Full
http://slidepdf.com/reader/full/who-methylmercury-information-full 21/68
Exposure assessment
13
5. Exposure assessment
5.1 Measuring methylmercury levels
Many techniques are available to assess mercury exposure. While proximal estimatesof methylmercury intake from food can be useful, pathophysiological measurementsthat assess the body burden of mercury (e.g. hair, blood, cord-blood) are preferred.When conducting burden of disease calculations, it may be necessary to convert blood,cord-blood, or dietary levels into hair mercury concentrations. Although relationships
between biomarkers are described below, these correlations are subject to individualand population variability and using hair mercury concentrations is suggested.
Hair
Maternal hair concentrations correlate well with dietary methylmercury intake and hairsample collection is simple and non-invasive. Concentrations at increasing distances
from the root can also provide information on exposure over time, includingmagnitude and peak levels (NRC, 2000). Determining past exposure usingconcentrations in hair further from the root may be particularly beneficial for
populations with seasonal variability in fish consumption (NRC, 2000). For populations without significant elemental mercury exposure, total hair mercury can beused as a measure of methylmercury exposure: “the use of total hair Hg concentrationin fish-consuming populations as a surrogate for hair MeHg concentration in fish-consuming populations should not lead to significant exposure misclassification”(NRC, 2000). Information on assessing hair mercury concentrations is provided inAnnex 2.
Blood
Blood mercury levels indicate recent or current exposure and can reflect bothelemental and methylmercury exposure. In populations exposed to mercury mainlythrough fish consumption, a high fraction of total blood mercury is organic and cantherefore be used as a measure of methylmercury exposure. However, blood samplesfrom populations with concomitant elemental mercury exposure must be analysedspecifically for methylmercury. WHO determined that “the concentration of mercuryin hair is approximately 250 times the concentration in blood”; however, thisrelationship varies between populations and ratios from 140 to 370 have been reported(WHO/IPCS, 2004). If blood and hair mercury measurements are available for the
study population, a population-specific blood to hair ratio should be used to convertmercury levels. In the absence of these data, burden of disease calculations use theaverage ratio of 250 to estimate mercury levels in hair from blood values.
Cord-blood
Umbilical cord-blood mercury levels are representative of prenatal methylmercuryexposure during late pregnancy. Mercury concentrations in cord-blood correlate wellwith fetal-brain mercury concentrations during the third trimester, but not as well withmaternal dietary intake (NRC, 2000). Mercury concentrates in cord-blood; thusmercury levels cord-blood are higher than in maternal blood. A meta-analysis ofstudies that collected cord-blood and maternal blood mercury levels determined that

8/14/2019 Who. Methylmercury Information Full
http://slidepdf.com/reader/full/who-methylmercury-information-full 22/68
Mercury burden of disease
14
the central tendency for the ratio of total mercury in cord-blood (μg/L) to total mercuryin maternal blood (μg/L) is 1.7 (Stern and Smith, 2003). This ratio can be used in
burden of disease calculations to convert mercury cord-blood levels to blood levels andsubsequently to hair mercury concentrations. However, relationships between
biomarkers differ between populations and ratios computed from levels observed in the
study population are preferred. For example, Axelrad et al. (2007) converted FaroeIsland cord-blood levels to hair concentrations using a ratio of 200, which was thevalue observed in the Faroes' population.
Dietary records
Quantitative, prospectively collected data on dietary intake including the frequency,amount, and species of seafood consumed can provide valuable information onmethylmercury exposure (NRC, 2000). Supplementing direct measurements withdietary intake data can provide key information on the variability, magnitude, andtiming of exposure. Knowledge of the type and amount of fish consumed is
particularly valuable for developing policy recommendations and advisories (seeSection 11). WHO modelled the following relationship between dietary intake and
blood mercury levels (WHO/IPCS, 2004):
C · b · v d =
A · f · bw
where:d = dose (μg/kg bw/day)C = concentration in blood (μg/L)b = elimination rate constant (0.014 per day-1)v = blood volume (9% of bw - pregnant female)A = fraction of the dose absorbed (0.95)f = absorbed fraction distributed to blood (0.05)
bw = body weight (65 kg for pregnant female)
This relationship may not be an accurate indicator of population hair levels due toindividual variability in absorption and elimination rates (Canuel et al., 2006).However, if direct measurements are not available, the dietary intake model can beused to estimate blood mercury levels and then convert from blood to hairconcentrations.
Nails
Fingernail and toenail mercury levels have also been used to measure the body burdenof mercury. As with blood mercury measurements, using nail mercury levels may be problematic for populations with concomitant elemental mercury exposure. Inaddition, the extent to which finger and toenail levels correlate with methylmercuryexposure has not been established (NRC, 2000). For these reasons, this document doesnot include methods for estimating the disease burden using mercury concentrations innails.
Summary
The National Research Council states that “the most useful and powerful approach toexposure and dose assessment for methylmercury is the collection of comparabledietary, cord-blood and single-strand hair data” (NRC, 2000). However, the majority

8/14/2019 Who. Methylmercury Information Full
http://slidepdf.com/reader/full/who-methylmercury-information-full 23/68
Exposure assessment
15
of existing studies on mercury exposure report only hair mercury concentrations. Inaddition, the dose–response relationship between methylmercury exposure and IQdeficits in infants developed by Axelrad et al. (2007) is based on hair mercurymeasurements. Therefore, this guide uses maternal hair mercury concentrations (orhair mercury concentrations of women of childbearing age) as a surrogate measure for
prenatal exposure. If necessary, the blood, cord-blood, and dietary intake conversionsdescribed above can be used to estimate hair mercury concentrations. Theseconversions are based on the best available estimates; however, the use of these ratiosintroduces additional uncertainty. In addition, they are based on populations solelyexposed to methylmercury and may not be accurate for populations with appreciableelemental mercury exposure.
5.2 Determining population mercury levels
The mercury-related burden of disease in a population can be estimated using the
population mean and standard deviation mercury levels. Mercury exposure informationcan be obtained from many sources (described below). Population studies are alsoneeded to determine the number of infants born in the study year. Information on hairsampling and analysis techniques are provided in Annex 2.
Mercury surveys
Ideally, the burden of disease estimate would use hair mercury concentration data fromone or more population-based studies. Population-based studies of this sort have not
been conducted in many countries; often, only sparse data on mercury levels or fishconsumption are available for highly exposed subgroups.
Focused sampling of populations believed to have high methylmercury exposure can be useful for estimating the burden of disease among groups with the greatest risk.This requires careful consideration of sites to be studied and how the results can beapplied to non-sampled areas. There are many factors to account for since mercurysources and fish consumption behaviours vary among sections of the population.Subsistence fishing, location near environmental hotspots, and differences in otherrelevant behaviours and exposures throughout the region must be considered.
If a representative burden of disease estimate for a country or large region is desired,studies should be conducted using a probability sample from the entire population.
These studies are expensive to mount; however, hair sample collection is generally asmall fraction of the total cost since it does not require medical personnel or invasive
procedures. One way to minimize the expense of conducting a population-based studyis to add mercury testing to an established survey. In the United States for example,mercury sampling in hair and blood was added to the National Health and NutritionExamination Survey in 1999.
Although mercury concentration data in children and males may be useful for other public health purposes, they are not required to estimate the burden of disease usingthe methods provided in this guide. Therefore, if resources are limited, mercurysamples may be collected from women of childbearing age only.

8/14/2019 Who. Methylmercury Information Full
http://slidepdf.com/reader/full/who-methylmercury-information-full 24/68
Mercury burden of disease
16
Data from the literature
A literature search can provide data on mercury levels collected from existing studieswhen a new survey can not be conducted. Information may be available from nationalinstitutes, universities, administrations, government authorities, or other research
bodies. In addition, databases searches (e.g. MEDLINE, PubMed, TOXLINE) can
provide data from the peer-reviewed literature (use keywords such as methylmercury,women, pregnancy, blood, cord-blood, hair, diet, exposure, fish, seafood, neurologicaldeficit, cognitive function). Table A4–1 in Annex 4 of this document contains mercuryexposure data from many peer-reviewed studies conducted throughout the world.While this table can be helpful as a starting point for a literature review, additional datamay be available and should be sought.
Studies obtained from the literature search must be evaluated to determine whetherthey are of sufficient quality for use in the burden of disease study and to ensure thedata are representative of the target population. Factors to consider include thecharacteristics of the study population, the type of exposure (occupational, hotspot,general population); whether the study measured dietary intake or a biomarker; whattype of biomarker (i.e. blood, cord-blood, hair); if the biomarker measured totalmercury or methylmercury; the applicability of the study (e.g. is the population alsoexposed to elemental mercury?); and quality control. In addition, it is important to notewhether a fish advisory has been issued since the data were collected, as it might havehad a significant influence on current exposure levels.
5.3 Summary
Regardless of whether data are collected from the literature or surveys, the population
mean hair mercury concentration and its standard deviation are required to estimate the burden of disease.

8/14/2019 Who. Methylmercury Information Full
http://slidepdf.com/reader/full/who-methylmercury-information-full 25/68
Disease burden methodology
17
6. Disease burden methodology
6.1 Incidence of methylmercury-induced MMR
This guide uses the dose–response relationship described in Table 1 to quantitativelyestimate the burden of disease from methylmercury-induced IQ loss. Because IQ lossis not considered a disease, the adverse health outcome is defined as IQ loss thatresults in mild mental retardation. Intelligence in human populations approximates anormal distribution with a mean of 100 IQ points and a standard deviation of 15 IQ
points (NRC, 2000). Mild mental retardation (MMR) occurs when IQ is between 50and 70 points.
The number of infants that would be shifted into the MMR range with a givenmethylmercury exposure is estimated from the mean and standard deviation maternalhair mercury levels of the population. The loss of IQ points is quantified assuming alinear no threshold relationship between each μg/g increase in maternal hair mercury
concentration and a 0.18 point decrease in IQ (Axelrad et al., 2007).
The method implements an incremental approach for associating hair mercury levelswith IQ deficits. Maternal hair mercury concentrations are divided into 2 μg/g intervalsfrom 0 to 100 μg/g and an IQ point deficit is assigned to each interval based on themidpoint of the interval. For example, the IQ deficit for 2–4 μg/g is based on 3 μg/g,which is associated with a 0.54 point IQ deficit (3 × 0.18 = 0.54). An 18 point IQdeficit is assigned to exposures greater than 100 μg/g. IQ deficits were not calculatedabove this exposure because it is unknown if the relationship holds at such high levels,which are uncommon even in populations with substantial methylmercury exposure.Because this approach is based on a no threshold dose–response relationship, anyexposure above 0 μg/g results in at least a 0.18 IQ point loss, essentially shifting the
population IQ down by 0.18 points.
Table 2 illustrates how the IQ deficit associated with each hair mercury increment iscombined with the normal distribution of IQ to estimate the percent of the populationwithin each IQ range that would be shifted to MMR given mercury exposure in eachinterval.
Table 2 Incremental IQ loss and percent of population shifted to MMR
Hair mercuryinterval ( g/g)
IQ point
loss fromexposure
IQ range for which
exposure wouldresult in MMR
Percent of
population shifted toMMR
0–2 0.18 70.00 - 70.18 0.05 2–4 0.54 70.00 - 70.54 0.22 4–6 0.90 70.00 - 70.90 0.34 6–8 1.26 70.00 - 71.26 0.46 8–10 1.62 70.00 - 71.62 0.66
10–12 1.98 70.00 - 71.98 0.79 12–14 2.34 70.00 - 72.34 1.01 14–16 2.70 70.00 - 72.70 1.16 16–18 3.06 70.00 - 73.06 1.31 18–20 3.42 70.00 - 73.42 1.56
a
Based on a normal distribution

8/14/2019 Who. Methylmercury Information Full
http://slidepdf.com/reader/full/who-methylmercury-information-full 26/68
Mercury burden of disease
18
For example, prenatal exposure to 15 μg/g maternal hair mercury falls into the 14–16μg/g exposure interval, which results in a 2.7 point IQ loss (Table 2). A 2.7 point IQloss would shift 1.16% of the infants in the IQ range of 70 - 72.7 points into the MMRrange. This shift to MMR is illustrated in Fig. 2.
Figure 2 Shift to MMR as a result of methylmercury-induced IQ loss _____________________________________________________________________
100 IQ score
P
e r c e n t a g e o f
s u b j e c t s
908070
72.7
50
MMR
Shift to MMR due to
methylmercury-induced
loss of IQ points
Normal curve of
distribution of
intelligence
_____________________________________________________________________Adapted from: Fewtrell et al. 2003
To estimate the incidence of the MMR shift in a population, the proportion of the population with mercury exposure in each interval must be estimated from the
population mean and standard deviation. A brief discussion of these methods is provided below. The Mercury Spreadsheet (available by request, see Annex 5)includes a datasheet programmed to estimate the incidence rate of MMR with only the
population mean and standard deviation hair mercury concentrations as input.
In populations with high mercury exposure, hair mercury levels are assumed to benormally distributed. The Microsoft Excel function NORMDIST1 (MicrosoftCorporation, Redmond, Washington, U.S.A) is used to determine the proportion of the
population above a given hair mercury concentration. The syntax for this function isNORMDIST ( x, , , cumulative). The function returns the probability that theobserved value of a normal random variable with a mean of mu (μ) and a standard
deviation of sigma (σ) will be less than or equal to x. The last argument in the functionis set to true, or 1, to obtain the cumulative probability. Thus, 1 - NORMDIST ( x, μ, σ,1) calculates the cumulative proportion of a population above the lower bound ( x) of agiven mercury interval.
1 Additional information can be obtained from the “Help” function in Microsoft Excel.

8/14/2019 Who. Methylmercury Information Full
http://slidepdf.com/reader/full/who-methylmercury-information-full 27/68
Disease burden methodology
19
For example, in a population with a mean hair mercury concentration of 2.5 μg/g and astandard deviation of 3.5 μg/g, the proportion with hair mercury concentrations above6 μg/g can be calculated using the NORMDIST function:
n = 1 – NORMDIST(6, 2.5, 3.5, 1)
The output of this function is 0.1586, meaning that 15.86% of the population have hairmercury levels above 6 μg/g. (This method is also used to calculate the proportion ofthe population with mercury levels greater than 10 μg/g, at which there is a 1.98 pointIQ loss. This proportion is an output of the Mercury Spreadsheet.)
To determine the percentage of the population in the 6–8 μg/g mercury exposureinterval, the formula is repeated using the upper bound ( x = 8). The output of thiscalculation, 0.0580, reveals that 5.80% of the population has mercury levels greaterthan 8 μg/g. Subtracting the proportion of the population with mercury levels greater
than the upper bound from the proportion with mercury levels greater than the lower bound reveals that about 10% of the population is exposed to mercury levels between 6and 8 μg/g (0.1586 – 0.0580 = 0.1006).
The 6–8 μg/g mercury exposure interval is associated with an IQ deficit of 1.26 IQ points (Table 2). Thus, the rate of a 1.26 IQ point deficit per 1000 infants is calculated by multiplying the proportion of the population in the interval by 1000 (0.1006 ×1000 = 100.6). This rate is then multiplied by the proportion of the population thatwould be shifted to MMR given an IQ deficit of 1.26 points, which was determined to
be 0.46% (Table 2). This calculation, 0.1006 × 0.0046 = 0.4628, reveals that the
incidence rate for MMR among infants in the 6–8 μg/g exposure interval is 0.4628 per1000 infants. The total MMR incidence rate is estimated by summing the rates for eachinterval.
6.2 Disease burden in DALYs
The incidence rate can be used to estimate disability-adjusted life years (DALYs) lostdue to methylmercury-induced MMR. DALYs are defined as “a health gap measurethat combines both time lost due to premature mortality and non-fatal conditions”(WHO, 2001a). Because methylmercury-induced MMR is not associated with
premature mortality, DALYs for this outcome are based solely on healthy years lostdue to disability (YLDs). This section briefly describes the parameters required tocalculate DALYs; detailed information on DALY methodology is available elsewhere(WHO, 2001a).
The following parameters are used to calculate DALYs lost due to methylmercury-induced MMR (described in further detail below). Values used in this analysis are in
parentheses:
• age weight (full age weights);
• discount rate (3%);
• MMR incidence rate (calculated using the methods described above);
8/14/2019 Who. Methylmercury Information Full
http://slidepdf.com/reader/full/who-methylmercury-information-full 28/68
Mercury burden of disease
20
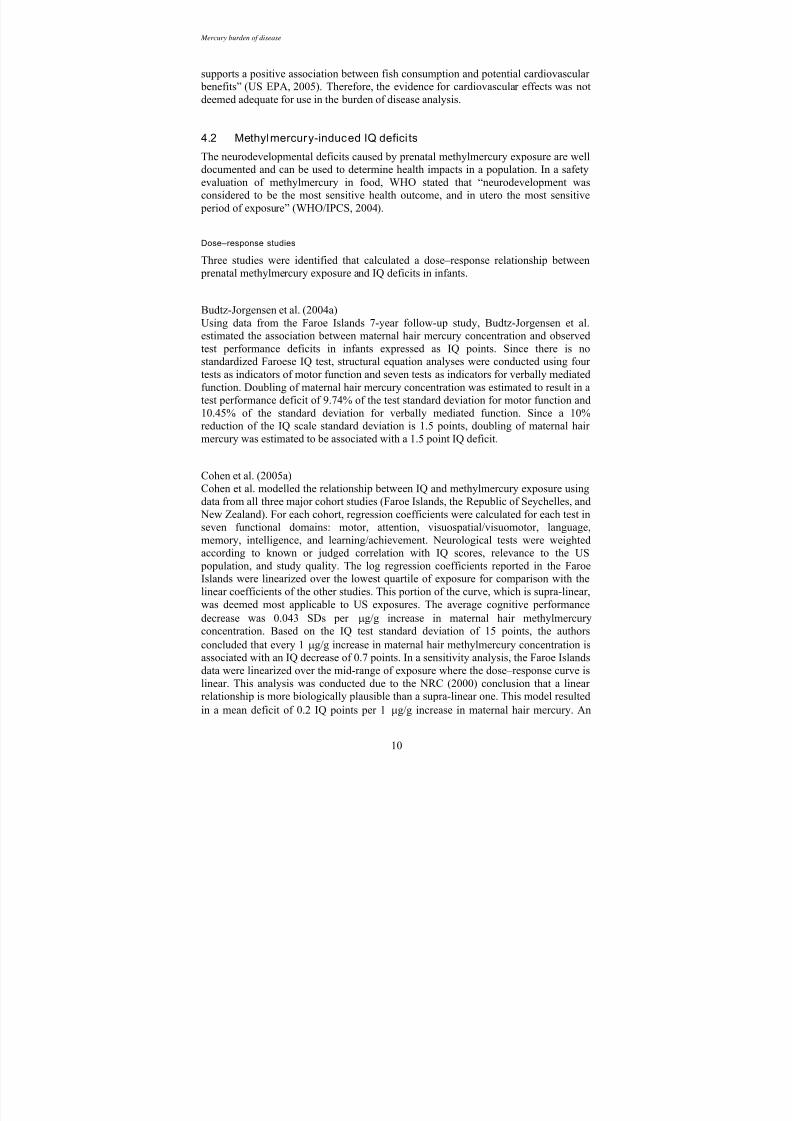
• disability weight (0.361):
• disease duration, equivalent to life expectancy (80 years for males, 82.5 yearsfor females);
• number of infants born in the year of interest.
Age weighting reflects societal preferences for years of healthy life lived at differentages and assigns less value to years lived at younger and older ages than to other ages.Age weights range from 0 (no age weights) to 1 (full age weights). This report usesfull age weights, but DALYs can be computed with other age weights or none at all.
The DALYs reported in this study are calculated using a 3% discount rate per year foryears of life lost in the future. Discounting, often used in economic analyses, assignsless value to future years lost than to years lost in the present. WHO is currently re-evaluating the standard discount rate of 3% and whether discount rating should beapplied at all. If preferred, other discount weights can be used or DALYs can be
calculated without age discounting.
Disability weights quantify societal preferences for different health states as comparedto optimal health. Because no disability weight has been developed formethylmercury-induced MMR, this document uses the disability weight for lead-induced MMR (0.361) (Mathers et al., 2003).
Since an infant born with an IQ below 70 will always be in the MMR range, thedisease duration for MMR is equal to average life expectancy. Persons with moderateor severe mental retardation are known to have decreased life expectancy (Bittles et al.,2002; Eyman et al., 1990; Patja et al., 2000; Whalley and Deary, 2001), but studies areconflicted on whether MMR is associated with shorter lifespan. A longitudinal cohortstudy reported that Scottish students with a 15 point lower IQ at age 11 had decreasedsurvival 65 years later (RR = 0.79, 95% CI: 0.75–0.84) (Whalley and Deary, 2001). A
prospective cohort study in Finland found that life expectancy for people with mildintellectual disabilities did not differ from the general population at the 35-year follow-up (Patja et al., 2000). Western Australians with mild intellectual disability had anaverage life expectancy of 74.0 years compared to 67.6 and 58.6 years for moderateand severe forms, but there was no comparison group without intellectual disability(Bittles et al., 2002). Even in studies for which MMR has been associated withdecreased life expectancy, it is unknown whether the reduction is due to MMR itself or
to a condition associated with MMR. Furthermore, the studies referenced above wereconducted in developed countries; less is known about the survival of persons withMMR in developing countries. Because the effect of methylmercury-induced MMR onlifespan is uncertain, this guide calculates DALYs with the standard expectancies of 80years for males and 82.5 years for females.
DALY calculations also require population size data to determine the number ofDALYs lost. For methylmercury-induced MMR, the population data required is thenumber of infants born in the year of interest. Caution should be taken in applying theincidence rate to years distant from the year that the exposure information wasdetermined, since many factors may lead to changes in mercury levels over time (e.g.
consumption advisories or recommendations, seafood availability, industrial activity,environmental contamination).

8/14/2019 Who. Methylmercury Information Full
http://slidepdf.com/reader/full/who-methylmercury-information-full 29/68
Disease burden methodology
21
The Mercury Spreadsheet is programmed with the functions needed to derive theincidence rate, the number of DALYs lost, and rate of DALYs per 1000 attributable tomethylmercury-induced MMR (see Annex 5).
8/14/2019 Who. Methylmercury Information Full
http://slidepdf.com/reader/full/who-methylmercury-information-full 30/68
Mercury burden of disease
22
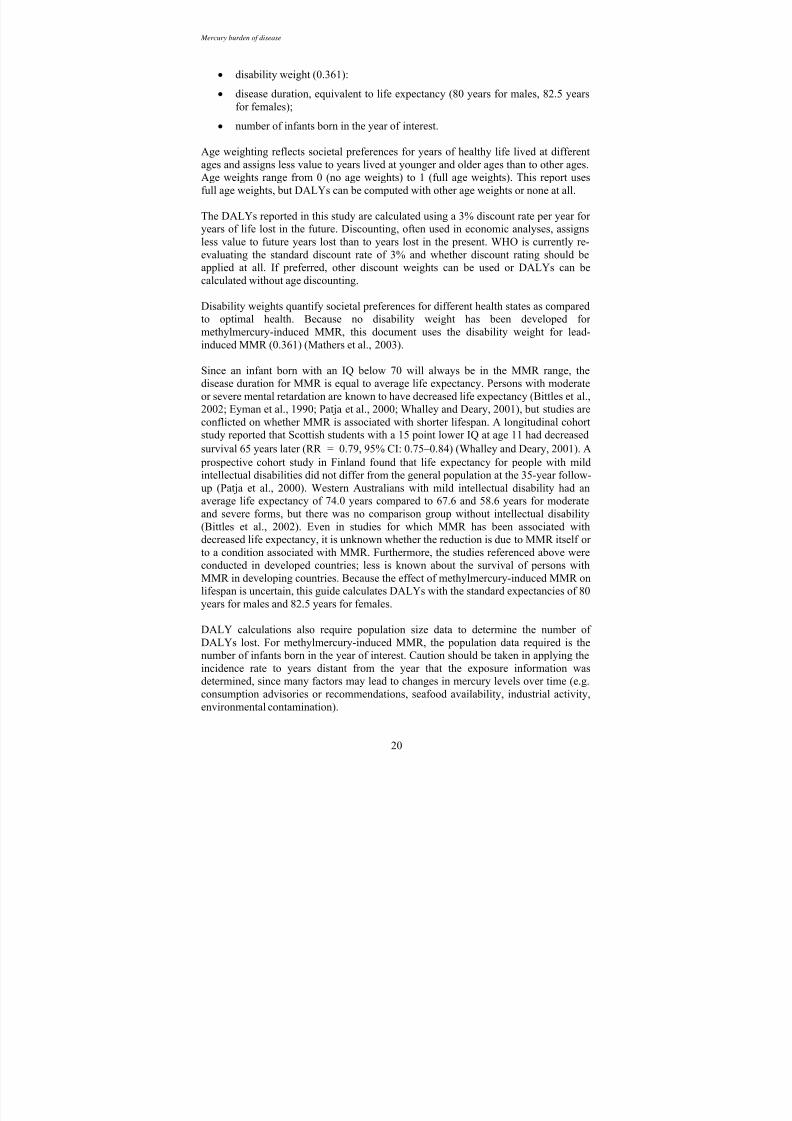
7. Example disease burden estimate
This section provides an example of how to combine exposure information with dataon methylmercury-related IQ deficits to obtain the population incidence rate for MMRand the disease burden in DALYs.
The steps to determine the MMR incidence rate are summarized as follows:
1. collect data (mean and standard deviation) on mercury concentrations in the population;
2. convert blood, cord-blood, and dietary measurements into hairconcentrations;
3. determine the proportion of the population within each mercury exposureinterval (from Table 2);
4. for each interval, multiply the rate of IQ loss per 1000 infants by the percent of a normal population that would be shifted to MMR (from Table2);
5. sum the results to obtain the incidence rate for MMR.
These steps are illustrated in the example below and the calculations are shown in theMercury Spreadsheet (see Annex 5).
7.1 Biomarker conversions
To estimate disease burden, it may be necessary to convert blood, cord-blood, ordietary mercury levels into hair mercury concentrations. Section 5.1 discusses therelationships between these biomarkers and provides a dietary intake model and ratiosfor converting blood and cord-blood levels into hair concentrations. Formulas for thesecalculations are provided in the Mercury Spreadsheet (see Annex 5).
7.2 Calculating the population at risk
The first step in estimating incidence of MMR is to use the mean and standarddeviation hair mercury concentrations to determine the proportion of the population at
risk. Consider a hypothetical population of subsistence fishers, population X, with amean hair mercury concentration of 4.6 μg/g and a standard deviation of 2.25 μg/g.
As mentioned earlier, hair mercury concentrations are normally distributed in a population. The mean mercury concentrations and standard deviation are entered in the1 – NORMDIST function described in Section 6.1, and the proportion of the
population with mercury levels greater than the lower bound of each given interval iscalculated (Table 3).

8/14/2019 Who. Methylmercury Information Full
http://slidepdf.com/reader/full/who-methylmercury-information-full 31/68
Example
23
Table 3 Proportion above lower bound of each hair mercury interval
Hair mercury
concentration ( g/g)Proportion
0 μg/g 1.0000a 2 μg/g 0.8761 4 μg/g 0.6051 6 μg/g 0.2669 8 μg/g 0.0654 10 μg/g 0.0082 12 μg/g 0.0005 14 μg/g 0.0000 16 μg/g 0.0000 18 μg/g 0.0000 20 μg/g 0.0000
a 100% of the population is assumed to have levels greater than 0
The table shows that 0.82% of the population has mercury levels greater than 10 μg/g,the level at which infants will sustain approximately a 2 point IQ deficit.
To determine the proportion of women within each mercury exposure interval (0–2μg/g, 2–4 μg/g, etc.), the proportion corresponding to the upper bound of each intervalis subtracted from the lower one. Since IQ deficits in infants are based on the hairmercury concentrations of their mothers, the proportions of women within each hairmercury interval represent the proportion of infants at risk. Thus, the proportions ineach interval are multiplied by 1000 to give the rate of IQ loss per 1000 infants.
For example, the proportion of women who have hair mercury concentrations in the 0– 2 μg/g exposure interval is 1.0000 – 0.8761 = 0.1239. Multiplying this proportion by1000 gives the rate of IQ loss, which is 123.93 per 1000 infants in the 0–2 μg/ginterval. The IQ loss associated with prenatal exposure to 0–2 μg/g is 0.18 IQ points(from Table 2). The number of IQ points lost and the rate of IQ loss per 1000 infantsare presented for each exposure interval in Table 4.
Table 4 Rate of IQ loss per 1000 infants in each exposure interval
Hair mercury
interval ( g/g)
IQ loss
(points)
Rate of IQ loss
per 1 000 infants0–2 0.18 123.93 2–4 0.54 270.93 4–6 0.90 338.24 6–8 1.26 201.52 8–10 1.62 57.18 10–12 1.98 7.69 12–14 2.34 0.49 14–16 2.70 0.01 16–18 3.06 0.00 18–20 3.42 0.00

8/14/2019 Who. Methylmercury Information Full
http://slidepdf.com/reader/full/who-methylmercury-information-full 32/68
Mercury burden of disease
24
7.3 Estimating MMR incidence
The final step in the MMR incidence calculation is converting IQ loss into a rate ofMMR per 1000 infants. The rate of IQ loss in each exposure interval is multiplied bythe percent of a normal population that would be shifted into the MMR range (fromTable 2). Summing the values for each exposure interval yields the total rate of MMR
per 1000 infants.
For example, the incidence rate of methylmercury-induced MMR in population X iscalculated as:
I(MMR) = (123.93 infants/1000 × 0.0005) + (270.93 infants/1000 × 0.0022) +
(338.24 infants/1000 × 0.0034) + (201.52 infants/1000 × 0.0046) + (57.18infants/1000 × 0.0066) + (7.69 infants/1000 × 0.0079) + (0.49 infants/1000 ×0.0101) + (0.1 infants/1000 × 0.0116)
= 3.18 infants per 1000 infants in population X
Exposure to methylmercury is therefore expected to result in 3.18 cases of MMR forevery 1000 infants born each year in population X. The MMR incidence rate can also
be calculated by entering the population mean and standard deviation into the MercurySpreadsheet (see Annex 5).
7.4 Estimating DALYs
The disease burden can also be quantified using disability-adjusted life years, whichtake into account the severity and length of the illness. The disease burden in DALYs
can be estimated by entering the MMR incidence rate and the number of infants bornin the year of interest into the ‘DALYs’ worksheet of the Mercury Spreadsheet (seeAnnex 5).
In population X, 100 000 infants were born in year Y. Inputting these data and theincidence rate from Section 7.4 into the Mercury Spreadsheet reveals that 3794DALYs were lost due to methylmercury-induced MMR in population X in year Y. Ifthe mercury exposure observed during year Y continues over a five-year period and thenumber of births per year remains stable, methylmercury exposure would result in aloss of 18 971 DALYs.
7.5 Summary of steps for estimating disease burden
The process for estimating disease burden is summarized as a flowchart in Fig. 3.

8/14/2019 Who. Methylmercury Information Full
http://slidepdf.com/reader/full/who-methylmercury-information-full 33/68
Example
25
Figure 3 Flowchart for estimating the disease burden of methylmercury
Review data sources to obtain hair, blood,
and cord-blood mercury concentration
data relevant to the study population.
Examine individual studies
for applicability to project.
Perform any necessary corrections to the data (e.g.,
derive hair levels from blood or cord-blood samples).
Consider a specially
designed program for
population-based hair
mercury sampling.
Calculate the average mean value and
standard deviation for each study population
(use sample weighting if possible).
● General population
● Subsistence fishers
● Sport fishers
● Environmental hotspots
Enter the population mean and standard
deviation in the ‘Mercury Spreadsheet’ to
calculate the incidence of MMR (see Annex 4).
Enter the MMR incidence rate into the ‘DALYs’
worksheet of the ‘Mercury Spreadsheet’ to derive an
estimate of the disease burden (see Annex 4).
Adequate
Inadequate
● How was the biomarker sampled/measured?
● How recent are the data?
● Have significant exposure changes occurred since the
data were collected?
● Are the data representative of the study population?
● Can populations with high exposures be studied?

8/14/2019 Who. Methylmercury Information Full
http://slidepdf.com/reader/full/who-methylmercury-information-full 34/68
Mercury burden of disease
26
8. Burden of disease estimates for selected populations
Methylmercury-induced IQ loss is greatest among populations with high fish orseafood consumption such as subsistence fishing populations. This is particularly truein areas with high environmental mercury exposure such as from industrial or mining
operations.
A literature review was conducted to identify studies which measured the distributionof mercury levels in blood, cord-blood, and hair (see Annex 4). For studies thatmeasured mercury in blood or cord-blood, the levels were converted to hair mercuryconcentrations using the conversion factors provided in Section 5.1. Table 5 providescompiled data on exposure, proportion of infants losing approximately 2 or more IQ
points, MMR incidence, and DALYs per 1000 infants for selected populations (i.e. populations with studies on mercury exposure levels in pregnant women or women ofchildbearing age). See Section 6 for assumptions used in the incidence rate and DALYcalculations. The total number of DALYs lost is not reported because the number of
infants born per year could not be determined for these population subgroups.
Table 5 Methylmercury exposure, MMR incidence, and DALYs for selected populations
Population (reference)
Mean (SD)hair mercury
levels ( g/g)
% of infants
losing ≥ 2 IQ
points
Incidence ofMMR per
1 000 infants
DALYs
per 1 000
infants
Brazilian subsistence fishingpopulation near the Tapajós River in agold mining region of the Amazon(Santos et al., 2002)
16.0 (18.92) 62.44 17.37 202.8
Chinese fish consumers in Wujiazhan,downstream of a methylmercury-polluted river (Zhang and Wang,2006)
2.92 (11.8) 27.43 5.16 60.6
Columbian fishing village in the SanJorge River basin near local goldmining activities (Olivero et al., 2002)
5.78 (1.21) 0.02 3.89 45.7
Canadian subsistence fishing NunavikInuits in the arctic (Muckle et al.,2001)
4.5 (1.9) 0.19 3.09 36.8
Greenland subsistence fishing Inuitsin the Disko Bay (Bjerregaard andHansen, 2000)
3.2 (3.4) 2.28 2.52 29.9
Canadian fish consumers of Asian-Canadian descent in the Great Lakes‘Area of Concern’ (Cole et al., 2004)
2.35 (0.55) 0.00 1.76 20.9
Japanese fish consumers in the Akitaprefecture (Iwasaki et al., 2003)
2.10 (0.98) 0.00 1.45 17.3
Canadian sport fishers in the Lake St.Pierre region of Quebec (Stamler etal., 2006)
0.68 (0.85) 0.00 0.60 7.2
SD = standard deviation
It is evident from Table 5 that subsistence fishing populations and seafood consuming populations near gold mining activities or industrial pollution sites may have a

8/14/2019 Who. Methylmercury Information Full
http://slidepdf.com/reader/full/who-methylmercury-information-full 35/68
Burden of selected population
27
significant disease burden due to methylmercury exposure. The estimated incidencerates for mild mental retardation were as high as 17.37 per 1000 infants born, resultingin a loss of 202.8 disability-adjusted life years per 1000 infants. When combined with
population data and summed over the years that mercury exposure has occurred, theneurodevelopmental effects of mercury exposure may have a considerable health
impact.

8/14/2019 Who. Methylmercury Information Full
http://slidepdf.com/reader/full/who-methylmercury-information-full 36/68
Mercury burden of disease
28
9. Uncertainties
Burden of disease estimates derived using the methods provided in this guide aresubject to several sources of uncertainty, which are discussed in the following sections.
9.1 Other outcomes
The burden of disease methods provide an estimate based solely onneurodevelopmental effects of methylmercury in prenatally-exposed infants. All healtheffects of elemental mercury were excluded from the analysis, as were thecardiovascular and neurological effects of methylmercury exposure in adults, forwhich data were insufficient to quantify relationships between exposure and effect.The combined total health impact of mercury and methylmercury exposure is likely to
be greater than that which would be estimated with the methods provided in thisdocument.
9.2 Model parameters
Health outcome
IQ is a useful measure for assessing the effects of methylmercury exposure becausemethods have been established to estimate the educational, occupational, economic,and societal impact of IQ deficits. While lowered IQ is not considered a disease in thetraditional sense, it has been associated with diminished academic performance andoccupational success. In the case of methylmercury, however, IQ may not reflect thefull range of cognitive effects. Axelrad et al. (2007) noted that IQ tests do not assessword retrieval, verbal learning ability, motor skills, and attention/behaviour effects thatare impacted by methylmercury exposure. Thus, using IQ as a measure of cognitivedeficits may underestimate the true neurodevelopmental impact of exposure.
Background rate of MMR
The susceptibility of individuals and populations to IQ loss is variable and individualsmay suffer effects at different levels of mercury exposure. One source of uncertainty inthe burden of disease methodology is that not all populations follow the standard IQdistribution. For example, regions differ in several risk factors and diseases that affect
the rate of MMR, such as anaemia, meningitis, pertussis, Japanese encephalitis,ascariasis, trichuriasis, hookworm infection, cretinoidism, and cretinism due to iodinedeficiencies (WHO, 2001b). In populations where the rate of MMR is already high dueto endemic diseases, the impact of methylmercury could be substantially greater thanestimated in this guide. If a population-specific distribution of IQ is available, this can
be applied instead of the standard curve to obtain a more accurate estimate.
Mercury measurements
Hair mercury collection is subject to a variety of procedural and analytical errors thatcan introduce substantial uncertainty. The techniques described in Annex 2 should be
followed to minimize imprecision when collecting new data. Measurements derivedfrom the literature should be reviewed for quality; when sampling and quality-control

8/14/2019 Who. Methylmercury Information Full
http://slidepdf.com/reader/full/who-methylmercury-information-full 37/68
Uncertainties
29
procedures are not described the associated uncertainty may be significant. Usingsound study design, sampling diverse populations, and implementing quality-control
procedures will help make the estimate more accurate and representative.
Conversion factors
Central estimates of the ratios between blood and hair and blood and cord-blood are provided to convert blood and cord-blood levels into hair mercury concentrations.However, relationships between these biomarkers have been shown to vary widely
between individuals and populations. The recommended conversion factor forconverting blood to hair is 250, but values ranging from 140 to 370 have beenobserved. Similarly, the cord-blood to blood mercury relationship is based on a meta-analysis that incorporated ratios ranging from 1.09 to 2.32. There is also considerableuncertainty in the relationship between dietary intake and blood mercury levels.Canuel et al. (2006) constructed a model using pharmacokinetic parameters from NRC(2000), which are similar to those in the WHO model, and found that actual hair
mercury concentrations were as much as 14 times less than predicted. Therefore, it isemphasized that the application of these conversion factors may not result in anaccurate representation of the hair concentrations in the sampled population and directsampling of hair levels is recommended.
Dose–response
The dose–response relationship between methylmercury and IQ is based on a meta-analysis of various cognitive test results from the three major prospectiveepidemiologic cohort studies on methylmercury and neurodevelopment (Axelrad et al.,
2007). While the Faroe Islands data suggest that the dose–response curve may besupra-linear at low exposure, the NRC concluded that “an additive (linear) or perhapssublinear model is the most justifiable from a biological perspective” (NRC, 2000). Inaddition, the New Zealand and Seychelles data have linear dose–response curves.Based on this information, Axelrad et al. chose a linear model. If in fact there is asupra-linear effect at low doses, the Axelrad et al. dose–response relationship wouldunderestimate the effect of methylmercury on IQ.
Threshold
The burden of disease estimate in this guide is based on the linear non-threshold
approach described by Axelrad et al. (2007). Axelrad et al. chose a no thresholdapproach based on the US EPA’s statement that “no evidence of a threshold arose formethylmercury-related neurotoxicity within the range of exposures in the Faroe Islandsstudy” (US EPA, 2002). However, the minimum maternal hair mercury concentrationin the Faroes study was 0.2 μg/g (Budtz-Jorgensen et al., 2004b) and it is unknown ifeffects occur below this level. In the methods used to estimate burden of disease, anyexposure above 0 μg/g results in at least a 0.18 IQ point loss, essentially shifting the
population IQ down by 0.18 points and resulting in a minimum incidence rate of 0.5cases of MMR per 1000 infants. The US EPA reference dose (RfD) of 0.1 μg/kg/dayand the WHO provisional tolerable weekly intake (PTWI) of 1.6 μg/kg bw indicatethat there is a level of exposure below which adverse effects are unlikely (US EPA,2002; WHO/IPCS, 2004). If indeed there is a threshold, the methods in this guide may

8/14/2019 Who. Methylmercury Information Full
http://slidepdf.com/reader/full/who-methylmercury-information-full 38/68
Mercury burden of disease
30
overestimate the burden of disease from methylmercury-induced MMR in populationswith low mercury exposure.
Incremental approach
Another source of uncertainty is the use of exposure intervals to estimate IQ deficits.The approach provided in this document assumes a uniform distribution of hairmercury concentrations across the exposure interval. If the hair mercury concentrationstend to be at the lower end of each exposure interval, the estimated disease burdenwould be an overestimate of the true burden. Conversely, the estimated disease burdenwould be an overestimate if the hair mercury concentrations tend to be at the upper endof each exposure interval.
DALYs
The strengths and limitations of using DALYs in burden of disease estimates have been discussed elsewhere (Cohen, 2000; Barker and Green, 1996; Murray and Lopez,1997; WHO, 2001a). While DALYs have been criticized for being based on social andeconomic value judgments (e.g. age-weighting, age discounting, disability weights),DALYs have also been recognized as a useful and effective decision-making tool,especially in the absence of other data. A benefit of using DALYs in burden of diseaseestimates is that, in contrast to mortality-based measures, DALYs incorporate theimpact of morbidity in the population. This is particularly relevant in the case ofmethylmercury-induced MMR, which is not associated with excess mortality.
Disability w eight
Because no disability weight has been developed for methylmercury-induced MMR,this guide calculates DALYs using the disability weight for lead-induced MMR. It isreasonable to expect that the social preference for methylmercury-induced MMR doesnot differ substantially from social preference for lead-induced MMR.
Life expectancy
Disease duration for MMR is defined as the average life expectancy since the effectsof MMR are life long. There is conflicting evidence on whether persons with MMRhave reduced life expectancy and it is unknown if methylmercury-induced MMR has
an effect on lifespan. Although this guide calculates DALYs with standard lifeexpectancies, it may be appropriate to use reduced life expectancies if data becomeavailable.
9.3 Quantitative estimation of uncertainty
The methods in this guide provide a best estimate of methylmercury-related burden ofdisease; however, there are uncertainties in the estimate as described above. MonteCarlo analysis is a systematic approach for addressing uncertainty and is defined as “arepeated random sampling from the distribution of values for each of the parameters in
a calculation (e.g., lifetime average daily exposure), to derive a distribution ofestimates (of exposures) in the population” (US EPA, 1992). If the available data do

8/14/2019 Who. Methylmercury Information Full
http://slidepdf.com/reader/full/who-methylmercury-information-full 39/68
Uncertainties
31
not contain the necessary input parameters for Monte-Carlo analysis, the alternativevalues in Table 6 can be used in the Mercury Spreadsheet to provide a less systematicindication of the uncertainty of disease burden estimate.
Table 6 Values for uncertainty analyses
Parameter Best estimate Al ternative values
Mean IQ 100 Population-specific mean IQ
Exposure Mean 95% confidence limits of the mean
Dose–responserelationship 0.18 0.012 IQ points per μg/g (lower 95% CI)
0.387 IQ points per μg/g (upper 95% CI)
Blood: hair ratio 250 140–370, or value indicated by population data
Cord-blood: blood ratio 1.7 1–2.3, or value indicated by population data
Relationship between dietaryintake and blood
Dietary intakemodel
Divide dietary intake model output by 14
Threshold None US EPA RfD (~0.94 μg/g in hair)WHO PTWI (~2.15 μg/g in hair)
* US EPA RfD and WHO PTWI were estimated as levels in hair using the dietary intake modeldescribed in WHO/IPCS, 2004 and assuming a hair to blood mercury ratio of 250
9.4 Beneficial nutrients in fish and seafood
Another source of uncertainty in the burden of disease estimate for methylmercury isconcomitant exposure to nutrients in fish and shellfish. Because uptake ofmethylmercury is almost exclusively through consumption of seafood, the health
benefits of protein, vitamin D, selenium, omega-3 polyunsaturated fatty acids, andother micronutrients should also be considered. Developmental exposure to the omega-3 fatty acids DHA and EPA have been associated with lengthened gestation time,improved visual function, and increased cognition in infants (IOM, 2006). A pooledanalysis that quantified the benefit of DHA in terms of IQ estimated that every 100mg/day increase in maternal DHA consumption increases child IQ by 0.13 points(Cohen et al., 2005b). Thus, the effects of fish consumption on IQ depend on the fatcontent of the fish consumed, with non-fatty, carnivorous fish posing a greater riskthan oily or fatty fish high in omega-3 fatty acids and low in mercury. The disease
burden methodology is based on dose–response data from studies of infants exposed tomethylmercury from seafood consumption. Although these studies may inherently
account for some beneficial effects of omega-3 fatty acids, effects on IQ may beinfluenced by species differences in omega-3 content. Furthermore, seafood speciesconsumed by the mothers in those studies, such as pilot whale, may differ from thoseconsumed by populations for which the disease burden is being estimated. Moreresearch is needed to characterize the relationship between the effects of omega-3 fattyacids and methylmercury on IQ before it can be incorporated into a burden of diseasestudy.

8/14/2019 Who. Methylmercury Information Full
http://slidepdf.com/reader/full/who-methylmercury-information-full 40/68
Mercury burden of disease
32
10. Research needs and recommendations
Elemental mercury exposure is known to be toxic at high doses, but more data areneeded to develop methods to quantify the disease burden. The probability ofdeveloping tremor, erethism, and proteinuria is “high” at urinary mercury levels of 100
µg/g creatinine, but exposure-response relationships and disability weights for theseoutcomes are not available (WHO/IPCS, 1991). Development of disability weights forsuch conditions and additional, high-quality studies are necessary to conduct aquantitative assessment of the health impact of elemental mercury in high risk
populations (e.g. small scale mining communities).
Although this assessment focused on methylmercury-induced IQ deficits in infants,methylmercury has also been associated with neurological and cardiovascular effectsin adults. More studies are needed to investigate these effects. If methylmercury isassociated with cardiac toxicity, the relationship between concomitant exposure tomethylmercury and omega-3 fatty acids must also be evaluated.
While the body of evidence is strongest for the neurodevelopmental toxicity ofmethylmercury, uncertainties regarding this association remain, particularly at lowdoses. Evidence that omega-3 fatty acids in fish promote cognitive development wasnot considered in this analysis. The relationship between the cognitive effects ofomega-3 fatty acids and methylmercury must be further characterized to create a
burden of disease estimate that considers the risks and benefits of fish consumptionrather than the risks of methylmercury exposure alone.
Large data gaps exist regarding the omega-3 fatty acid and methylmercury content offish and shellfish species throughout the world. Data on the frequency, amount, andspecies of seafood consumed in different regions is also needed. These data are criticalfor determining the specific risks and benefits of fish consumption in local
populations.
Global or national environmental burden of disease estimates may be difficult toconduct due to the lack of representative exposure data for countries and regions. Mostof the data on mercury levels pertain to populations with elevated exposure. Whilethese data are essential for estimating the disease burden for high risk groups,information on general population exposure is lacking and studies that measure general
population mercury levels, particularly among women of childbearing-age, are needed.
Finally, the use of DALYs to estimate the burden of disease of environmentalchemicals is limited by the lack of disability weights for relevant health outcomes.Disability weights must be determined for additional diseases and symptoms to fullycharacterize the disease burden from mercury.

8/14/2019 Who. Methylmercury Information Full
http://slidepdf.com/reader/full/who-methylmercury-information-full 41/68
Research needs
33
11. Disease burden and policy
Creating policy decisions based on burden of disease estimates requires carefulconsideration of the complex balance between the risks of mercury exposure and the
benefits of fish consumption within the target population.
Methylmercury exposure is almost exclusively from fish and seafood, which alsocontain protein, vitamin D, selenium, and other micronutrients. Fish and shellfish arealso major sources of omega-3 fatty acids such as DHA and EPA. Although the benefitof omega-3s in adults is as yet uncertain, they may decrease the risk of coronary heartdisease, and there is evidence that adults who eat fish have reduced risk of heartdisease (IOM, 2006). DHA and EPA are more strongly associated with health benefitsin developing infants, including lengthened gestation, improved visual acuity, andincreased cognitive development (IOM, 2006). It is therefore necessary to consider thealternative impacts of recommendations made based on the methylmercury burden ofdisease estimate. Reducing mercury levels in subsistence fishing populations is also
complicated by the reliance of such groups on fish as a primary source of protein.Therefore, recommendations should be tailored to the risk profile of the target
population to ensure the greatest health gain.
The risks and benefits of fish consumption depend greatly on the species and amountof fish consumed. Women of childbearing age and children should avoid large
predatory, non-fatty fish (e.g. shark, swordfish, tilefish, king mackerel) (IOM, 2006).On the other hand, it may be prudent to encourage consumption of fish high in omega-3 fatty acids and low in methylmercury (e.g. salmon, oysters). If available, country- orregion-specific data on the mercury and omega-3 fatty acid levels in fish should beused to develop recommendations. Mercury concentrations in some seafood speciesare available for several countries (UNEP, 2002). In the absence of national data,information compiled in the United States may be helpful to guide consumers in someregions (see Annex 3 for mercury and omega-3 fatty acid levels in US seafood).
Ideally, the burden of disease from mercury should be reduced by lowering the amountof mercury in the environment rather than by managing fish consumption. This wouldgenerate the greatest health benefit by eliminating contaminants in fish and increasingtheir overall benefit to human health. While global partnerships are working towardsthis goal, nations can minimize the impact of methylmercury toxicity by helping highrisk populations make informed choices on the type and amount of fish they eat.

8/14/2019 Who. Methylmercury Information Full
http://slidepdf.com/reader/full/who-methylmercury-information-full 42/68
Mercury burden of disease
34
References
ATSDR. 1999. Toxicological profile for mercury (update). Atlanta, GA: US Department ofHealth & Human Services, Agency for Toxic Substances and Disease Registry.
Auger N, Kofman O, Kosatsky T, Armstrong B. Low-level methylmercury exposure as a risk
factor for neurologic abnormalities in adults. Neurotoxicology 2005;26:149-57.doi:10.1016/j.neuro.2004.12.005
Axelrad DA, Bellinger DC, Ryan LM, Woodruff TJ. Dose–response Relationship of PrenatalMercury Exposure and IQ: An Integrative Analysis of Epidemiologic Data. Environ
Health Perspect 2007. In press 10.1289/ehp.9303 Available athttp://ehp.niehs.nih.gov/docs/2007/9303/abstract.html.
Barker C, Green A. Opening the debate on DALYs (disability-adjusted life years). Health
Policy Plan 1996;11:179-83. doi:10.1093/heapol/11.2.179
Barregard L, Sallsten G, Jarvholm B. Mortality and cancer incidence in chloralkali workersexposed to inorganic mercury. Br J Ind Med 1990;47:99-104.
Bittles AH, Petterson BA, Sullivan SG, Hussain R, Glasson EJ, Montgomery PD. Theinfluence of intellectual disability on life expectancy. J Gerontol A Biol Sci Med Sci 2002;57:M470-2.
Bjerregaard P, Hansen JC. Organochlorines and heavy metals in pregnant women from theDisko Bay area in Greenland. Sci Total Environ 2000;245:195-202.doi:10.1016/S0048-9697(99)00444-1
Boffetta P, Sallsten G, Garcia-Gomez M, Pompe-Kirn V, Zaridze D, Bulbulyan M, et al.Mortality from cardiovascular diseases and exposure to inorganic mercury. Occup
Environ Med 2001;58:461-6. doi:10.1136/oem.58.7.461
Budtz-Jorgensen E, Debes F, Weihe P, Grandjean P. 2004a. Adverse mercury effects in 7 year-
old children as expressed as loss in “IQ.” Odense: University of Southern Denmark.Budtz-Jorgensen E, Grandjean P, Jorgensen PJ, Weihe P, Keiding N. Association between
mercury concentrations in blood and hair in methylmercury-exposed subjects atdifferent ages. Environ Res 2004b;95:385-93. doi:10.1016/j.envres.2003.11.001
Canuel R, de Grosbois SB, Atikesse L, Lucotte M, Arp P, Ritchie C, et al. New evidence onvariations of human body burden of methylmercury from fish consumption. Environ
Health Perspect 2006;114:302-6.
Clarkson TW, Magos L. The toxicology of mercury and its chemical compounds. Crit Rev
Toxicol 2006;36:609-62. doi:10.1080/10408440600845619
Cohen JT, Bellinger DC, Shaywitz BA. A quantitative analysis of prenatal methylmercury
exposure and cognitive development. Am J Prev Med 2005a;29:353-65.doi:10.1016/j.amepre.2005.06.007
Cohen JT, Bellinger DC, Connor WE, Shaywitz BA. A quantitative analysis of prenatal intakeof n-3 polyunsaturated fatty acids and cognitive development. Am J Prev Med 2005b;29:366-74. doi:10.1016/j.amepre.2005.06.008
Cohen J. The Global Burden of Disease Study: a useful projection of future global health? J
Public Health Med 2000;22:518-24. doi:10.1093/pubmed/22.4.518
Cole DC, Kearney J, Sanin LH, Leblanc A, Weber JP. Blood mercury levels among Ontarioanglers and sport-fish eaters. Environ Res 2004;95:305-14.doi:10.1016/j.envres.2003.08.012
Eyman RK, Grossman HJ, Chaney RH, Call TL. The life expectancy of profoundlyhandicapped people with mental retardation. N Engl J Med 1990;323:584-9.

8/14/2019 Who. Methylmercury Information Full
http://slidepdf.com/reader/full/who-methylmercury-information-full 43/68
References
35
Fewtrell L, Kaufmann R, Prüss-Üstün A. 2003. Lead: Assessing the environmental burden ofdisease at national and local levels. Environmental Burden of Disease Series, No. 2Geneva: World Health Organization.
Fillion M, Mergler D, Sousa Passos CJ, Larribe F, Lemire M, Davee Guimaraes JR. A preliminary study of mercury exposure and blood pressure in the Brazilian Amazon.
Environ Health 2006;5:29. doi:10.1186/1476-069X-5-29 Grandjean P, Murata K, Budtz-Jorgensen E, Weihe P. Cardiac autonomic activity in
methylmercury neurotoxicity: 14-year follow-up of a Faroese birth cohort. J Pediatr 2004;144:169-76. doi:10.1016/j.jpeds.2003.10.058
Guallar E, Sanz-Gallardo MI, van't Veer P, Bode P, Aro A, Gomez-Aracena J, et al. Mercury,fish oils, and the risk of myocardial infarction. N Engl J Med 2002;347:1747-54.doi:10.1056/NEJMoa020157
IOM. 2006. Seafood Choices: Balancing Benefits and Risks. Prepublication copy: uncorrected proofs. Washington, DC: National Academies Press.
Iwasaki Y, Sakamoto M, Nakai K, Oka T, Dakeishi M, Iwata T, et al. Estimation of daily
mercury intake from seafood in Japanese women: Akita cross-sectional study. Tohoku J Exp Med 2003;200:67-73. doi:10.1620/tjem.200.67
Johansson N, Basun H, Winblad B, Nordberg M. Relationship between mercury concentrationin blood, cognitive performance, and blood pressure, in an elderly urban population. Biometals 2002;15:189-95. doi:10.1023/A:1015202301127
Kobal AB, Horvat M, Prezelj M, Briski AS, Krsnik M, Dizdarevic T, et al. The impact oflong-term past exposure to elemental mercury on antioxidative capacity and lipid
peroxidation in mercury miners. J Trace Elem Med Biol 2004;17:261-74.doi:10.1016/S0946-672X(04)80028-2
Lebel J, Mergler D, Branches F, Lucotte M, Amorim M, Larribe F, et al. Neurotoxic effects of
low-level methylmercury contamination in the Amazonian Basin. Environ Res 1998;79:20-32. doi:10.1006/enrs.1998.3846
Mathers C, Bernard C, Iburg K, Inoue M, Ma Fat D, Shibuya K, et al. 2003. Global Burden ofDisease in 2002: data sources, methods and results. Global Programme on Evidencefor Health Policy Discussion Paper No. 54 Geneva: World Health Organization.
Meyer-Baron M, Schaeper M, van Thriel C, Seeber A. Neurobehavioural test results andexposure to inorganic mercury: in search of dose–response relations. Arch Toxicol 2004;78:207-11. doi:10.1007/s00204-003-0531-2
Muckle G, Ayotte P, Dewailly EE, Jacobson SW, Jacobson JL. Prenatal exposure of thenorthern Quebec Inuit infants to environmental contaminants. Environ Health
Perspect 2001;109:1291-9. doi:10.2307/3454753
Murray CJ, Lopez AD. The utility of DALYs for public health policy and research: a reply. Bull World Health Organ 1997;75:377-81.
NRC. 2000. Toxicolocal effects of methylmercury. Washington, DC: National ResearchCouncil.
Olivero J, Johnson B, Arguello E. Human exposure to mercury in San Jorge river basin,Colombia (South America). Sci Total Environ 2002;289:41-7.
Patja K, Iivanainen M, Vesala H, Oksanen H, Ruoppila I. Life expectancy of people withintellectual disability: a 35-year follow-up study. J Intellect Disabil Res 2000;44:591-9. doi:10.1046/j.1365-2788.2000.00280.x

8/14/2019 Who. Methylmercury Information Full
http://slidepdf.com/reader/full/who-methylmercury-information-full 44/68
Mercury burden of disease
36
Prüss-Üstün A, Mathers C, Corvalán C, Woodward A. 2003. Introduction and methods:Assessing the environment burden of disease at national and local levels. Geneva:World Health Organization.
Rissanen T, Voutilainen S, Nyyssonen K, Lakka TA, Salonen JT. Fish oil-derived fatty acids,docosahexaenoic acid and docosapentaenoic acid, and the risk of acute coronary
events: the Kuopio ischaemic heart disease risk factor study. Circulation 2000;102:2677-9.
Rohling ML, Demakis GJ. A meta-analysis of the neuropsychological effects of occupationalexposure to mercury. Clin Neuropsychol 2006;20:108-32.doi:10.1080/13854040500203324
Ryan LM. 2005. Effects of Prenatal Methylmercury on Childhood IQ: A Synthesis of ThreeStudies. Report to the US Environmental Protection Agency. Document ID EPA-HQ-OAR-2002–0056–6048 and EPA-HQ-OAR-2002–0056–6049. Available:http://www.regulations.gov.
Salonen JT, Seppanen K, Lakka TA, Salonen R, Kaplan GA. Mercury accumulation and
accelerated progression of carotid atherosclerosis: a population-based prospective 4-year follow-up study in men in eastern Finland. Atherosclerosis 2000;148:265-73.doi:10.1016/S0021-9150(99)00272-5
Salonen JT, Seppanen K, Nyyssonen K, Korpela H, Kauhanen J, Kantola M, et al. Intake ofmercury from fish, lipid peroxidation, and the risk of myocardial infarction andcoronary, cardiovascular, and any death in eastern Finnish men. Circulation 1995;91:645-55.
Santos EC, de Jesus IM, Camara Vde M, Brabo E, Loureiro EC, Mascarenhas A, et al.Mercury exposure in Munduruku Indians from the community of Sai Cinza, State ofPara, Brazil. Environ Res 2002;90:98-103. doi:10.1006/enrs.2002.4366
Siblerud RL. 1990. The relationship between mercury from dental amalgam and the
cardiovascular system. Sci Total Environ 99(1-2):23-35.
Sørensen N, Murata K, Budtz-Jorgensen E, Weihe P, Grandjean P. Prenatal methylmercuryexposure as a cardiovascular risk factor at seven years of age. Epidemiology 1999;10:370-5. doi:10.1097/00001648-199909000-00016
Stamler CJ, Abdelouahab N, Vanier C, Mergler D, Chan HM. Relationship between plateletmonoamine oxidase-B (MAO-B) activity and mercury exposure in fish consumersfrom the Lake St. Pierre region of Que., Canada. Neurotoxicology 2006;27:429-36.doi:10.1016/j.neuro.2005.12.005
Stern AH. A review of the studies of the cardiovascular health effects of methylmercury withconsideration of their suitability for risk assessment. Environ Res 2005;98:133-42.
doi:10.1016/j.envres.2004.07.016 Stern AH, Smith AE. An assessment of the cord-blood: maternal blood methylmercury ratio:
implications for risk assessment. Environ Health Perspect 2003;111:1465-70.
UNEP. 2002. Global Mercury Assessment. Geneva: UNEP Chemicals and the Inter-Organization Programme for the Sound Management of Chemicals (IOMC).
US EPA. 2005. Regulatory Impact Analysis of the Final Clean Air Mercury Rule. Office ofAir Quality Planning and Standards, Air Quality Strategies and Standards Division,Innovative Strategies and Economics Group (MD 339–01). Research Triangle Park,
NC.
US EPA. 2002. Methylmercury (MeHg) (CASRN 22967–92–6). National Center for
Environmental Assessment, Integrated Risk Information System. Washington, DC.

8/14/2019 Who. Methylmercury Information Full
http://slidepdf.com/reader/full/who-methylmercury-information-full 45/68
References
37
US EPA. 1992. Guidelines for Exposure Assessment. Risk Assessment Forum. Washington,DC. EPA/600/Z-92/001.
Veiga MM, Baker RF. 2004. Global Mercury Project: Protocols for environmental and healthassessment of mercury released by artisanal and small-scale gold miners. Vienna,Austria: GEF/UNDP/UNIDO. p 294.
Virtanen JK, Voutilainen S, Rissanen TH, Mursu J, Tuomainen TP, Korhonen MJ, et al.Mercury, fish oils, and risk of acute coronary events and cardiovascular disease,coronary heart disease, and all-cause mortality in men in eastern Finland. Arterioscler
Thromb Vasc Biol 2005;25:228-33.
Weil M, Bressler J, Parsons P, Bolla K, Glass T, Schwartz B. Blood mercury levels andneurobehavioural function. JAMA 2005;293:1875-82. doi:10.1001/jama.293.15.1875
Whalley LJ, Deary IJ. Longitudinal cohort study of childhood IQ and survival up to age 76. BMJ 2001;322:819. doi:10.1136/bmj.322.7290.819
WHO. 2001a. National Burden of Disease Studies: A Practical Guide. Edition 2.0. Geneva:World Health Organization.
WHO. 2001b. World Health Report 2001. Geneva: World Health Organization.
WHO. 2002. World Health Report 2002 - Reducing risks, promoting healthy life. Geneva:World Health Organization.
WHO. 2003. Concise International Chemical Assessment Document (CICAD) 50. Elementalmercury and inorganic mercury compounds: human health aspects. Geneva: WorldHealth Organization.
WHO. 2006. Statement on thiomersal. Geneva: WHO Global Advisory Committee on VaccineSafety.
WHO/IPCS. 1990. Environmental Health Criteria (EHC) 101: Methylmercury. Geneva: World
Health Organization, International Programme on Chemical Safety.WHO/IPCS. 1991. Environmental Health Criteria (EHC) 118: Inorganic mercury. Geneva:
World Health Organization, International Programme on Chemical Safety.
WHO/IPCS. 2004. Safety Evaluation of Certain Food Additives and Contaminants, Sixty-firstmeeting of the Joint FAO/WHO Expert Committee on Food Additives, WHO FoodAdditives Series, No. 52. Geneva: World Health Organization, InternationalProgramme on Chemical Safety.
Yokoo EM, Valente JG, Grattan L, Schmidt SL, Platt I, Silbergeld EK. Low levelmethylmercury exposure affects neuropsychological function in adults. Environ
Health 2003;2:8. doi:10.1186/1476-069X-2-8
Yoshizawa K, Rimm EB, Morris JS, Spate VL, Hsieh CC, Spiegelman D, et al. Mercury andthe risk of coronary heart disease in men. N Engl J Med 2002;347:1755-60.doi:10.1056/NEJMoa021437
Zhang L, Wang Q. Preliminary study on health risk from mercury exposure to residents ofWujiazhan town on the Di'er Songhua river, North-east China. Environ Geochem
Health 2006;28:67-71. doi:10.1007/s10653-005-9013-1

8/14/2019 Who. Methylmercury Information Full
http://slidepdf.com/reader/full/who-methylmercury-information-full 46/68
Mercury burden of disease
38
Annex 1 List of meeting part ic ipants
The following is a list of participants in the Informal preparatory meeting for theChemical Task Force of the Foodborne Disease Epidemiology Reference Group(FERG), held in Geneva on 29 June 2007.
• Dr Janis BAINES, Food Standards Australia and New Zealand.
• Dr David BELLINGER, Neuroepidemiology Unit, Children's Hospital, FarleyBasement, USA.
• Dr Diane BENFORD, Food Standards Agency, London, UK.
• Dr Mike BOLGER, Division of Risk Assessment, Food and DrugAdministration (FDA), USA.
• Dr Herman GIBB, Sciences International Inc., Alexandria, USA.
• Dr John LARSEN, National Food Institute, Technical University of Denmark.• Professor Rolaf van LEEUWEN, Centre for Substances and Integrated Risk
Assessment, National Institute for Public Health and the Environment (RIVM),Bilthoven, Netherlands.
• Dr Andrew RENWICK, Clinical Pharmacology Group, University ofSouthampton, UK.
• Dr Josef SCHLATTER, Food Toxicology Section, Swiss Federal Office ofPublic Health, Zürich, Switzerland.
Observers
• Dr Robert BLACK, John Hopkins University, Baltimore, USA.
• Ms Jessie POULIN, Sciences International Inc., Alexandria, USA.
WHO Secretariat
• Dr James BARTRAM, Water, Sanitation and Health.
• Dr Cynthia BOSCHI PINTO, Newborn and Child Health and Development.
• Dr Tanya KUCHENMÜLLER, Food Safety, Zoonoses and Foodborne
Diseases.
• Dr Gerry MOY, Food Safety, Zoonoses and Foodborne Diseases.
• Dr Claudia STEIN, Food Safety, Zoonoses and Foodborne Diseases.
• Dr Kurt STRAIF, International Agency for Cancer Research (IARC), Lyon.
• Dr Angelika TRITSCHER, International Programme on Chemical Safety.

8/14/2019 Who. Methylmercury Information Full
http://slidepdf.com/reader/full/who-methylmercury-information-full 47/68
Annex
39
Annex 2 Measuring hair mercury concentrations
Hair sampling is the preferred method for measuring methylmercury concentrations, asobtaining hair samples is minimally invasive, reduces the risk of disease transmission,and does not require medical supervision (NRC, 2000). There are also fewer culturalissues in obtaining hair samples, although in some regions of Africa and Latin Americahair may be of superstitious or magical significance (Veiga and Baker, 2004). Otherfactors to consider include sampling of persons who are bald or have short hair, andthe use of certain hair treatments (artificial waving may reduce mercury content whilemercury-containing soaps may increase it).
Before conducting hair sampling, describe the goal of the research to each donor andobtain informed consent. Stress that the samples will only be used for this purpose andthat there is no consequence for choosing not to participate. Be sure to follow anyother local guidelines on research ethics. Administer a questionnaire to gatherdemographic and exposure information (e.g. age; sex; species, amount, and frequency
of fish consumption; possible sources of elemental mercury exposure).
Samples should be collected from the occipital region of the head and hair should becut with scissors as close to the hair root as possible. The National Institute forMinamata Disease of Japan recommends cutting at least twenty 10 cm long strands; ifhair is longer than 10 cm, the portion of the hair furthest from the root can be discarded(Nakamura, 2003). If hair is shorter than 10 cm, more strands are required forlaboratory analysis. One end of the hair sample should be tied, stapled, or knotted todifferentiate the proximal and distal ends, especially if time sequencing is to beconducted (Veiga and Baker, 2004). The sample should then be placed in a sealedenvelope or plastic bag until laboratory analysis.
If the population is primarily exposed to mercury through fish consumption, laboratoryanalyses for total mercury are acceptable. Samples from populations exposed tomercury vapour should be analysed specifically for methylmercury content due toexternal contamination. A variety of techniques have been used to analyse mercury inhair and there is no international standard. Common methods include gas-liquidchromatography (Veiga and Baker, 2004), flameless atomic absorption spectrometry(Nakamura, 2003), cold vapour atomic absorption spectroscopy (NRC, 2000), and coldvapour atomic fluorescence spectrometry (CDC, 2006). If one of the precedingtechniques is chosen, segmental analysis can be conducted to obtain exposure levelsover time. This is done by cutting the hair samples into 1.1 cm segments, which
correspond to about a month of hair growth (NRC, 2000). A non-segmental method oftime sequencing analysis is X-ray fluorescence (XRF), which continuously measuresmercury levels along a single strand of hair. The NRC suggests using XRF analysis
because it provides the most detailed information on magnitude and timing of exposure(NRC, 2000).
References to Annex 2
CDC. 2006. Laboratory Procedure Manual: Hair Mercury, NHANES 1999–2000 ResearchTriangle Park, NC: Centers for Disease Control and Prevention.
Nakamura K. 2003. Instructions for hair sampling: Department of International Affairs andEnvironmental Sciences, National Institute for Minamata Disease of Japan.

8/14/2019 Who. Methylmercury Information Full
http://slidepdf.com/reader/full/who-methylmercury-information-full 48/68
Mercury burden of disease
40
NRC. 2000. Toxicolocal effects of methylmercury Washington, DC: National ResearchCouncil.
Veiga MM, Baker RF. 2004. Global Mercury Project: Protocols for environmental and healthassessment of mercury released by artisanal and small-scale gold miners Vienna,Austria: GEF/UNDP/UNIDO.
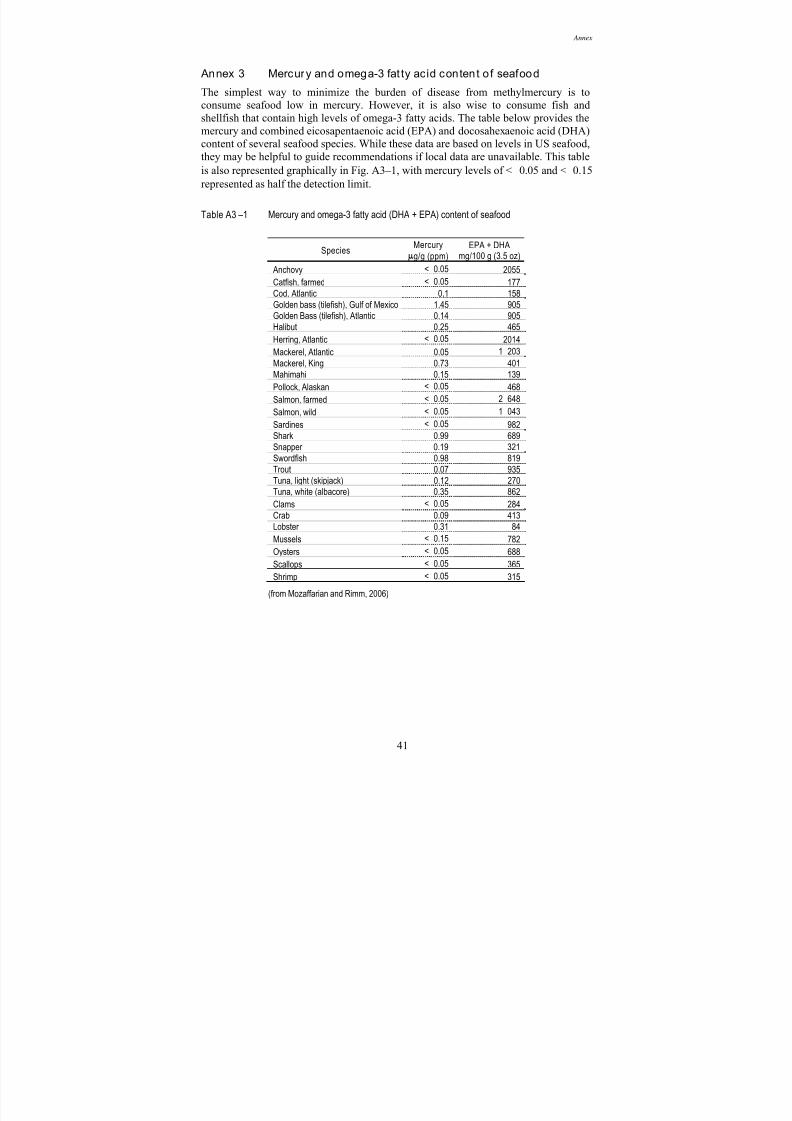
8/14/2019 Who. Methylmercury Information Full
http://slidepdf.com/reader/full/who-methylmercury-information-full 49/68
Annex
41
Annex 3 Mercury and omega-3 fat ty acid content o f seafood
The simplest way to minimize the burden of disease from methylmercury is toconsume seafood low in mercury. However, it is also wise to consume fish andshellfish that contain high levels of omega-3 fatty acids. The table below provides themercury and combined eicosapentaenoic acid (EPA) and docosahexaenoic acid (DHA)content of several seafood species. While these data are based on levels in US seafood,they may be helpful to guide recommendations if local data are unavailable. This tableis also represented graphically in Fig. A3–1, with mercury levels of < 0.05 and < 0.15represented as half the detection limit.
Table A3 –1 Mercury and omega-3 fatty acid (DHA + EPA) content of seafood
SpeciesMercury
g/g (ppm)EPA + DHA
mg/100 g (3.5 oz)
Anchovy < 0.05 2055Catfish, farmed < 0.05 177Cod, Atlantic 0.1 158Golden bass (tilefish), Gulf of Mexico 1.45 905Golden Bass (tilefish), Atlantic 0.14 905Halibut 0.25 465Herring, Atlantic < 0.05 2014Mackerel, Atlantic 0.05 1 203Mackerel, King 0.73 401Mahimahi 0.15 139Pollock, Alaskan < 0.05 468Salmon, farmed < 0.05 2 648
Salmon, wild <
0.05 1
043Sardines < 0.05 982Shark 0.99 689Snapper 0.19 321Swordfish 0.98 819Trout 0.07 935Tuna, light (skipjack) 0.12 270Tuna, white (albacore) 0.35 862Clams < 0.05 284Crab 0.09 413Lobster 0.31 84Mussels < 0.15 782
Oysters <
0.05 688Scallops < 0.05 365Shrimp < 0.05 315
(from Mozaffarian and Rimm, 2006)
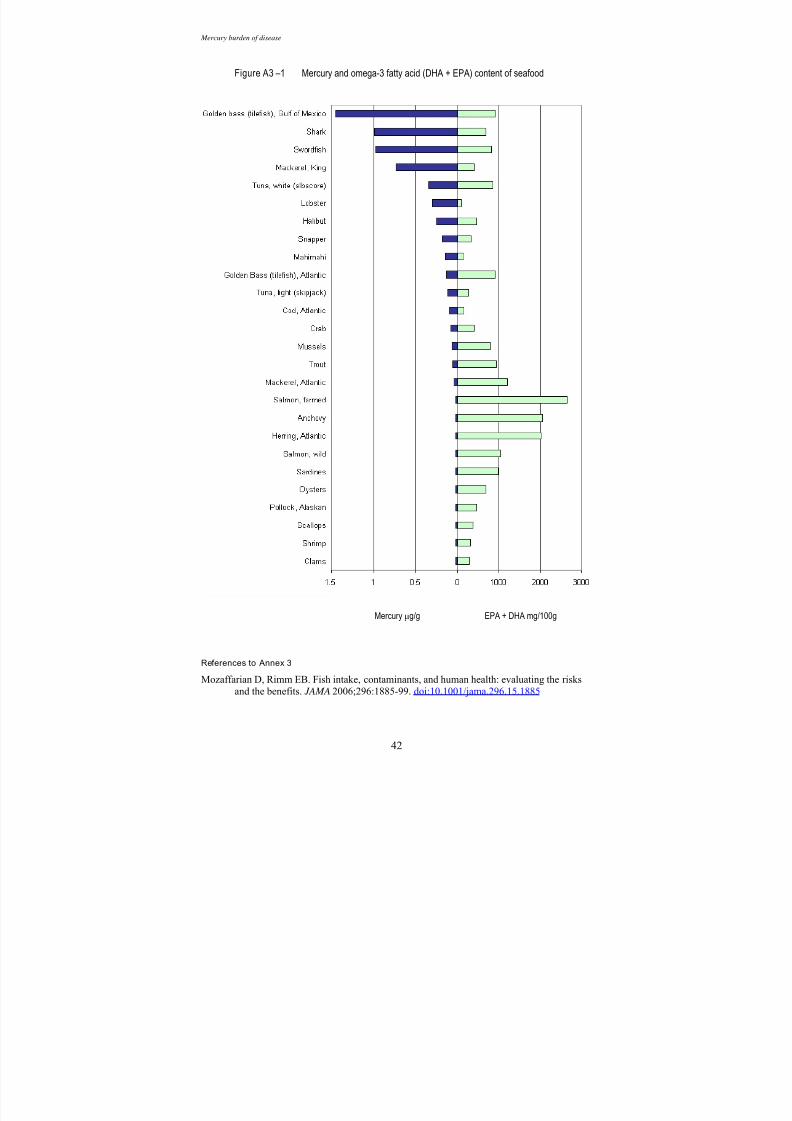
8/14/2019 Who. Methylmercury Information Full
http://slidepdf.com/reader/full/who-methylmercury-information-full 50/68
Mercury burden of disease
42
Figure A3 –1 Mercury and omega-3 fatty acid (DHA + EPA) content of seafood
Mercury μg/g EPA + DHA mg/100g
References to Annex 3
Mozaffarian D, Rimm EB. Fish intake, contaminants, and human health: evaluating the risks
and the benefits. JAMA 2006;296:1885-99. doi:10.1001/jama.296.15.1885

8/14/2019 Who. Methylmercury Information Full
http://slidepdf.com/reader/full/who-methylmercury-information-full 51/68
Annex
43
Annex 4 Subpopulation mercury levels
Table A4–1 summarizes available methylmercury exposure data from peer-reviewedstudies. The table includes surveys of high exposure subpopulations as well asinformation on general population exposure in countries where data were identified.For areas where mercury data are lacking, the table may be useful to indicate exposurelevels in nearby regions or in populations with similar characteristics.
The table is divided by WHO global region (see Table A4–2) and by country. Studies published in English from 1990 forward are included if they contained mean hair, blood, or cord-blood mercury levels. Populations exposed primarily to elementalmercury (i.e. dental amalgam, occupational) are not included. Studies that did notinclude women are excluded except for countries where only male exposure data wereavailable. All data are represented as hair mercury concentrations using theconversions provided in Section 5.1 [blood mercury levels given in nmol/L weredivided by 5 to convert to μg/L, as described in Grandjean et al. (1997)]. Blood
mercury levels are reported in addition to hair concentrations when elemental mercurymay have contributed significantly to exposure. Because total hair mercury correlateswell with methylmercury exposure, all reported levels are total mercury unlessotherwise noted (i.e. methylmercury concentrations are used when there is substantialelemental exposure).
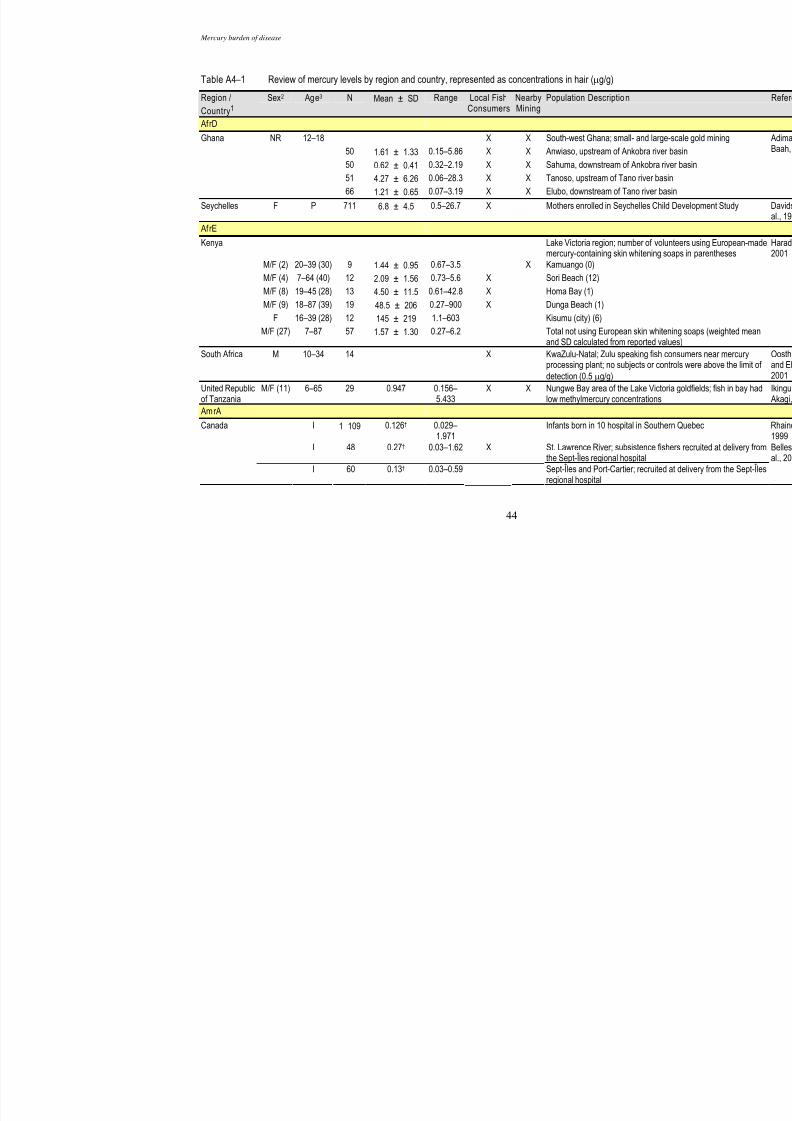
8/14/2019 Who. Methylmercury Information Full
http://slidepdf.com/reader/full/who-methylmercury-information-full 52/68
Mercury burden of disease
44
Table A4 –1 Review of mercury levels by region and country, represented as concentrations in hair (μg/g)
Region /
Country1
Sex2 Age3 N Mean ± SD Range Local FishConsumers
NearbyMining
Population Description
AfrD
NR 12–18 X X South-west Ghana; small- and large-s50 1.61 ± 1.33 0.15–5.86 X X Anwiaso, upstream of Ankobra river ba
50 0.62 ± 0.41 0.32–2.19 X X Sahuma, downstream of Ankobra rive
51 4.27 ± 6.26 0.06–28.3 X X Tanoso, upstream of Tano river basin
Ghana
66 1.21 ± 0.65 0.07–3.19 X X Elubo, downstream of Tano river basin
Seychelles F P 711 6.8 ± 4.5 0.5–26.7 X Mothers enrolled in Seychelles Child D
AfrE
Lake Victoria region; number of voluntmercury-containing skin whitening soa
M/F (2) 20–39 (30) 9 1.44 ± 0.95 0.67–3.5 X Kamuango (0)
M/F (4) 7–64 (40) 12 2.09 ± 1.56 0.73–5.6 X Sori Beach (12)M/F (8) 19–45 (28) 13 4.50 ± 11.5 0.61–42.8 X Homa Bay (1)
M/F (9) 18–87 (39) 19 48.5 ± 206 0.27–900 X Dunga Beach (1)
F 16–39 (28) 12 145 ± 219 1.1–603 Kisumu (city) (6)
Kenya
M/F (27) 7–87 57 1.57 ± 1.30 0.27–6.2 Total not using European skin whiteninand SD calculated from reported value
South Africa M 10–34 14 X KwaZulu-Natal; Zulu speaking fish conprocessing plant; no subjects or controdetection (0.5 μg/g)
United Republicof Tanzania
M/F (11) 6–65 29 0.947 0.156–5.433
X X Nungwe Bay area of the Lake Victorialow methylmercury concentrations
AmrA I 1 109 0.126† 0.029–
1.971Infants born in 10 hospital in Southern
I 48 0.27† 0.03–1.62 X St. Lawrence River; subsistence fishethe Sept-Îles regional hospital
Canada
I 60 0.13† 0.03–0.59 Sept-Îles and Port-Cartier; recruited atregional hospital

8/14/2019 Who. Methylmercury Information Full
http://slidepdf.com/reader/full/who-methylmercury-information-full 53/68
45
Region /
Country1
Sex2 Age3 N Mean ± SD Range Local FishConsumers
NearbyMining
Population Description
F P (26.7) 101 0.15 X South-west Quebec near the St. Françwomen recruited from prenatal clinics Health System, some local fish consum
M/F NR 130 0.83 ± 0.97 X Quebec near Lake St. Pierre; sport an
M/F NR 146 1.20 ± 1.40 X Quebec; Abitibi, sport and subsistence
M/F NR 118 0.40 ± 0.36 X Labrador; First Nations people of the Itaken during “camp” season when they
M/F (23) > 17 52 0.42 ± 0.15 Bay of Fundy; St. Andrews/St. Stephe
M/F (54) > 17 91 0.70 ± 0.55 X Bay of Fundy; Grand Manan, fishing a
F P (24.6) 123 4.5 ± 1.9 0.3–14.0 X Nunavik; Inuit subsistence fishers
Human tissue monitoring program in th
F P (31.5) 134 0.22 ± 0.49 ND-1.05 Caucasian
F P (26.9) 92 0.34 ± 0.40 ND-1.51 X Dene/Métis
F P (23.6) 31 1.68 ± 4.42 ND-8.48 X Baffin (Inuit)F P (23.0) 31 0.53 ± 1.26 0.60–6.07 X Inuvik (Inuit)
F P (24.9) 17 0.92 ± 1.44 0.60–2.88 X Kivalliq (Inuit)
F P (26.4) 63 0.86 ± 1.47 ND-3.19 X Kitikmeot (Inuit)
F 18–24 67 2.70 0.50–16.80
X
F 25–44 131 3.89 0.65–19.85
X
F 45–75 85 6.76 2.25–28.00
X
Arctic Quebec; Randomly selected Inu
M/F(12%)
(45) 60 0.82 ± 2.54 X Montreal area; eat sport caught fish fro≥ once per week
M/F(11%)
(48) 72 0.38 ± 2.28 X Montreal area; eat sport caught fish fro< once per week
F 17–64 26 0.33 ± 0.53 Ontario; licensed anglers, non-fish eat
F 17–64 60 0.48 ± 0.45 X Ontario; licensed anglers in Ontario, fi
F 17–64 27 2.35 ± 0.55 X Ontario; fish consumers in the Great LAsian-Canadian decent

8/14/2019 Who. Methylmercury Information Full
http://slidepdf.com/reader/full/who-methylmercury-information-full 54/68
Mercury burden of disease
46
Region /
Country1
Sex2 Age3 N Mean ± SD Range Local FishConsumers
NearbyMining
Population Description
F 17–64 15 0.55 ± 0.48 X Ontario; fish consumers in the Great LEuro-Canadian decent
F 20–49 97 0.07 ± 0.01 X Quebec; consumers of fish from Uppelakes
F > 18 52 0.68 ± 0.85 X Quebec; sport fishers who consume fi
F C, 16–49 1 726 0.20† ± 0.02se National Health and Nutrition Examina1999–2000
F C (29.9) 45 0.40 Puerto Rico, north-east
F C (31.8) 41 4.40 X Puerto Rico, island of Vieques where f
F P 135 0.55 0.02–2.38 Eastern Massachusetts; women recruprospective pregnancy and child coho
F 18–92 1 050 0.525 0.012–15.2
Wisconsin; volunteers (ate more fish ageneral Wisconsin pop)
F P, > 14 1 024 0.29 0.01–2.50 Michigan; women recruited for the Pre
Community Health studyM/F > 5 63 0.64 ± 0.43 X X California; Native Americans near an isome participants consume fish from l
F P (25.7) 189 0.53 ± 0.07se < 0.2–9.1 New Jersey; women recruited from hophysicians offices state-wide
M/F(65%)
(41) 311 0.4 NR-2.95 X Wisconsin, Michigan, and Minnesota; Lakes region
M/F(68.57%)
50–70(59.32)
474 0.69 ± 0.59 0.0–4.0 Maryland; recruited for the Baltimore M
United States ofAmerica
I 188 0.71± 0.50
0.0–2.94 Hawaii; recruited deliveries at KapiolaWomen and Children in Honolulu
AmrB
F P, 14–45 75 1.12 ± 1.17 0.05–8.2 X X Alta Floresta; near the Teles Pires Rivthe Amazon BasinM/F (192) 324 16.0 ± 18.92 4.50–
90.40X X Para; Munduruku Indians near the Tap
14–44 had a mean concentration of 15
Brazil4
F C (26.6) 21 9.39† 5.25–21.00
X X Tapajós River; riverside communities

8/14/2019 Who. Methylmercury Information Full
http://slidepdf.com/reader/full/who-methylmercury-information-full 55/68
47
Region /
Country1
Sex2 Age3 N Mean ± SD Range Local FishConsumers
NearbyMining
Population Description
F P (23.8) 19 8.25† 1.51–19.43
X X Tapajós River; riverside communities
F 15–40 100 7.4 0.16–62.4 X X Porto Velho; urban mothers
Colombia F 15–69 38 5.78 ± 1.21 NR X X San Jorge River basin; fishing village o
M (26) 16 6.70 ± 3.65 NR X X Djumu; non-mining control group near(study measured blood THg)
Suriname
M (27) 25 4.53 ± 2.75 NR X X Sillakreek mining area; small scale miblood THg)
AmrD
Peru F P 131 7.1† ± 2.1 0.9–28.5 X Máncora; prospective study of Peruvia
EmrB
F P (26.9) 348 0.34 ± 0.30 0.0–3.3 Tehran; controls from case-control stupreeclampsiaIslamicRepublic of Iran(IslamicRepublic of)
NR NR 23 0.99 ± 0.89 0.196–4.27
Postmortem samples collected at randsex, or location
M 25–60(34.9)
100 4.18 ± 3.22 0.025–17.79
X Fishermen of Egyptian origin in the Do
M 26–35(30.4)
35 2.62 ± 1.40 0.75–5.21 Controls of Egyptian nationality workincompany
Kuwait
M/F 2–57 106 4.6 ± 4.8 0.80–25.0 Kuwait residents
EmrD Egypt M/F (25) 28–40
(34.4)68 0.23 ± 0.06 0.11–0.41 Mansoura; randomly selected hospital
Morocco M/F (80) > 18(38.8)
377 2.4 ± 3.5 Rabat; randomly selected from Rabat statistically significant difference betwewomen)

8/14/2019 Who. Methylmercury Information Full
http://slidepdf.com/reader/full/who-methylmercury-information-full 56/68
Mercury burden of disease
48
Region /
Country1
Sex2 Age3 N Mean ± SD Range Local FishConsumers
NearbyMining
Population Description
EurA
Austria F 18–65(42.9)
78 0.63 ± 0.42 0.09–9.97 Vienna; blood donors recruited at the and females combined
M/F (45) 2–83 Vis; over-sampled the island fishing po51 4.91 ± 3.15 0.33–
16.30X Fish consumption < 1 000 g / wk
23 6.56 ± 4.67 0.84–19.30
X Fish consumption 1 000–1500 g / wk
Croatia
17 6.39 ± 3.51 1.30–12.10
X Fish consumption > 1 500 g / wk
M/F (21) 20–60 (43) 41 0.6‡ Denmark; Danes consuming Europea
M/F (32) 20–60 (43) 53 1.2‡ Denmark; Greenlanders consuming E
M/F (30) 20–60 (39) 45 2.7‡ Greenland; Greenlanders consuming
M/F (23) 20–60 (42) 47 6.2‡ X Greenland; Greenlanders consuming t
F P 180 3.2 ± 3.4 0.5–18.9 X Greenland; Inuits of five municipalities
Denmark
F P 914 4.27 X Faroe Islands
M/F (9%) (48) 11 0.98‡ 0.29–1.55 Riihimäki; Workers at hazardous wastof 0.35 μg/g since treatment plant ope
Finland
M/F(64%)
(51) 55 0.40‡ 0.09–5.11 Hämeenlinna; controls living 30km fro
France F > 18 62 0.85 ± 0.50 NR-1.9 Angers; randomly selected from the UAngers
Germany M/F 18–69 4 645 0.22 German Environmental Survey 1998 (sample of 120 locations throughout Ea
Iceland NR NR 62 6.38 ± 8.69 0.88–51.1 Postmortem samples collected at randsex, or location
Portugal F P 181 10.39 NR-42.61 X Medeira; coastal village of Camara dehair Hg concentrations > 10 μg/g)
Sweden F P (27‡) 127 0.35‡ 0.07–1.5 Uppsala County; recruited at antenata

8/14/2019 Who. Methylmercury Information Full
http://slidepdf.com/reader/full/who-methylmercury-information-full 57/68
49
Region /
Country1
Sex2 Age3 N Mean ± SD Range Local FishConsumers
NearbyMining
Population Description
F 43 .327‡ 0.086–0.960
Southern Sweden; alkaline region
F 47 .376‡ 0.012–3.503
Southern Sweden; acid region
F P (31‡) 112 0.18‡ 0.0–0.7 Solna; recruited at first antenatal visit of MeHg in blood)
F 19–97 51 1.1 X Hagfors; angling households near lake(only 12 women were aged < 50)
F P (30) 30 0.28 ± 0.16 0.07–0.71 Västerbotten county
M/F(53%)
21–63(32.1)
161 0.57 ± 0.48 0.04–3.86 Scotland; staff and postgraduate studeGlasgow (controls for dentist study)
70 5.52 ± 5.21 Scotland; postmortem samples collectinformation on age, sex, or location
United Kingdom
F P (22.6) 14 0.05 ± 0.03 Mothers delivering at North of England
did not have dental amalgamsEurB
Albania M/F 20–56 25 0.405 ± 0.3 0.195–1.698
Durres and Tirana; controls from study
Poland M/F (8) 17–90 46 0.379 ± 0.315 Gdańsk region; postmortem samples fsuddenly
EurC
SearB
M/F(61.8%)
1–65(14.7)
68 5.59 0.78–60.86
X Two islands off Batam; randomly selecpredominantly fishermen
Indonesia
M 40–49 55 3.133 ± 4.697 0.203–
19.888
Medan; industrial centre ~30 km from
concentrations were lower: 0.779 ± 0

8/14/2019 Who. Methylmercury Information Full
http://slidepdf.com/reader/full/who-methylmercury-information-full 58/68
Mercury burden of disease
50
Region /
Country1
Sex2 Age3 N Mean ± SD Range Local FishConsumers
NearbyMining
Population Description
SearD
Bangladesh M 16–69 (34) 219 0.44 ± 0.19 0.02–0.95 X Cox’s Bazar, Chittagon, Dhaka, Mymemeans for all regions and occupationa
μg/g; fishermen (n = 26) had the highF 20–25 5 0.08 ± 0.03
F 25–30 6 BDL
F 30–35 10 BDL
F 35–40 9 0.20 ± 0.05
India
F 40–45 5 0.23 ± 0.03
Central India; controls living > 100 kmsteel plant in Bhilai who had given birtcollection. Inorganic mercury contributmercury levels in women who had recein Bhilai (highest mean was 6.3 ± 5.3or worked in the steel plant (highest mμg/L for 40–45 year olds)
WprA
F P (30.0) 115 1.624† All participants
30 1.453† Tsushima Islands in Nagasaki Prefect
68 1.954† Fukuoka City in Fukuoka Prefecture18 2.120† Katsushika ward of metropolitan Tokyo
F 19–20(19.9)
59 1.51 ± 0.91 Akita; women born in the Akita Prefectdietician’s license
F 0–95 1 666 1.43† 0.00–25.75
Total of 5 districts; samples collected abarbershops, and primary schools; 58between the ages of 16 and 49
594 1.23† 0.09–7.33 Minimata
327 1.33† 0.14–6.20 Kumamoto
209 1.40† 0.26–12.52
Tottori
303 1.46† 0.00–8.09 Wakayama
233 2.30† 0.14–25.75
Chiba
F 32–82 108 2.1 ± 1.1 X Shiranui Sea, near Minimata Bay; fish[men had significantly higher levels (5
M/F (73) 32–82 (59) 138 3.7 ± 3.0 0.5–22.5 X Goshonoura
Japan
M/F (10) 43–75 (59) 19 3.3 ± 2.3 0.9–11.0 X Ashikita

8/14/2019 Who. Methylmercury Information Full
http://slidepdf.com/reader/full/who-methylmercury-information-full 59/68
51
Region /
Country1
Sex2 Age3 N Mean ± SD Range Local FishConsumers
NearbyMining
Population Description
M/F (4) 54–70 (62) 6 3.0 ± 1.1 2.2–5.1 X Tanoura
M/F (9) 36–78 (62) 11 2.0 ± 1.3 0.7–5.6 X Tsunagi
M/F (12) 33–77 (61) 17 1.9 ± 0.8 0.9–3.8 X Minimata
M 40–49 243 4.624 ± 2.753 0.626–24.644
Tokushima prefecture; methylmercurymercury
39 2.758 ± 1.0 1.309–5.642
Mountainous
126 4.069 ± 1.533 0.626–9.994
Middle
78 6.245 ± 3.717 1.742–24.644
X Coastal
F 25–48(35.7)
107 2.1 ± 0.98 0.49–5.82 X Akita Prefecture; women recruited for study on the effects of prenatal methydevelopment (results are presented fohair waving)
F 12–82(26.5)
284 2.02 Tokyo and surrounding area (Ibaragi, and Saitama); volunteer university stu
M/F (14) 0–82 35 5.6 ± 3.8 Tokyo; autopsy samples
Singapore M/F(76.6)
2–77(20.9)
85 5.92 1.14–35.52
Singaporean Chinese randomly selecthousing estate
WprB
M/F (50) 1–76 94 7.3 ± 22 0.54–190 Phnom Penh, Kien Svay, Tomnup Rolinformation on donor selection
M/F (24) 10–49(25.1)
40 11 ± 31 0.69–190 Phnom Penh
M/F (12) 1–76(25.4)
20 8.2 ± 16 0.54–70 Kien Svay, only region where sex wasfemales was 5.1 μg/g
M/F (8) 6–14(11.3)
12 2.4 ± 0.73 1.5–3.8 Tomnup Rolork
Cambodia
M/F (6) 8–62(24.3)
22 3.2 ± 1.7 1.1–7.5 Batrong; near Sihanoukville industrial
China F P (29‡) 96 1.7‡ 1.4–2.4 IQR Hong Kong Special Administrative Reg
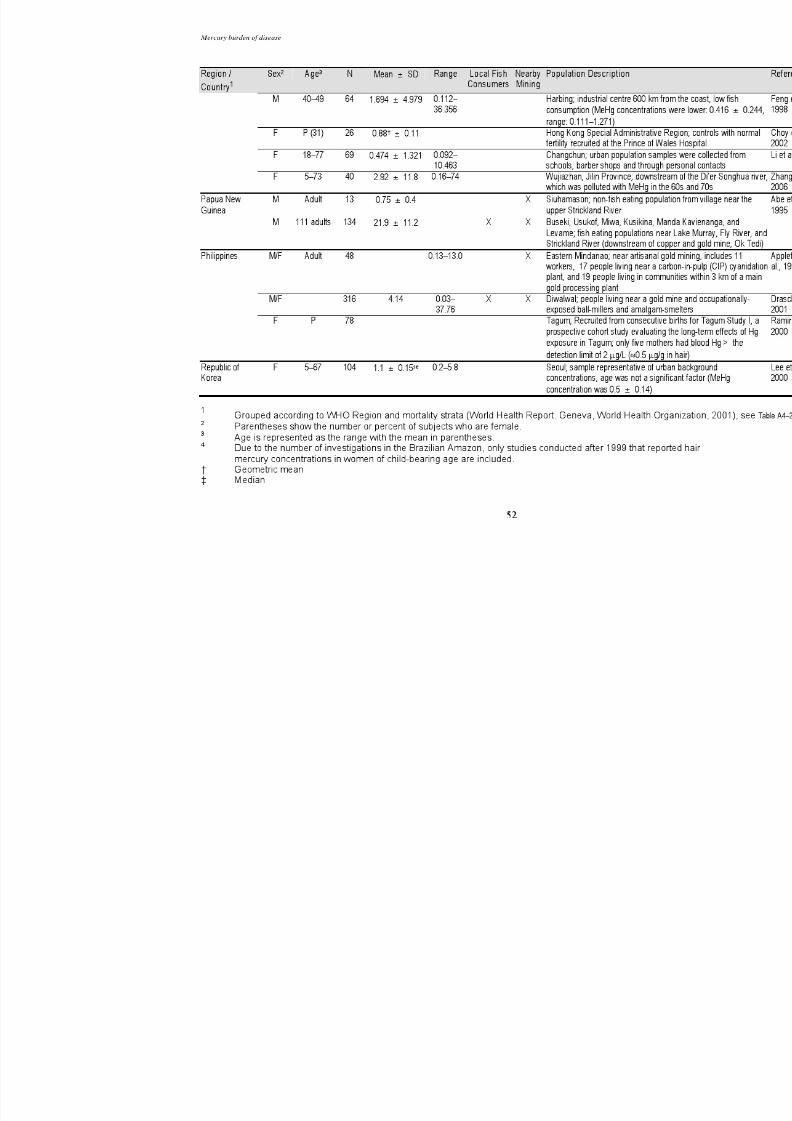
8/14/2019 Who. Methylmercury Information Full
http://slidepdf.com/reader/full/who-methylmercury-information-full 60/68

8/14/2019 Who. Methylmercury Information Full
http://slidepdf.com/reader/full/who-methylmercury-information-full 61/68
53
N Study population sizeSD Standard deviationNR Not reportedF FemaleM MaleP Pregnant
C Child-bearing ageI Infants (data from cord-blood)SE Standard errorIQR Inter quartile rangeMeHg MethylmercuryTHg Total mercury
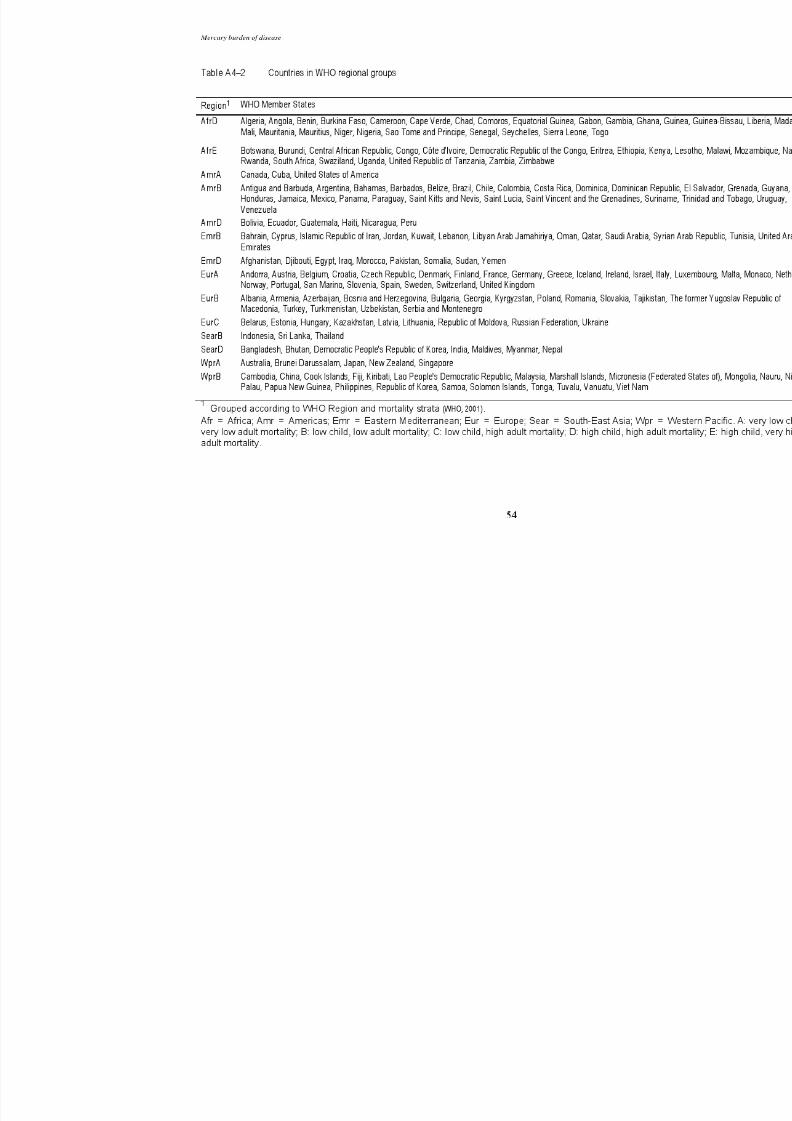
8/14/2019 Who. Methylmercury Information Full
http://slidepdf.com/reader/full/who-methylmercury-information-full 62/68

8/14/2019 Who. Methylmercury Information Full
http://slidepdf.com/reader/full/who-methylmercury-information-full 63/68
Annex
55
References to Annex 4
Abe T, Ohtsuka R, Hongo T, Suzuki T, Tohyama C, Nakano A, et al. High hair and urinarymercury levels of fish eaters in the nonpolluted environment of Papua New Guinea. Arch Environ Health 1995;50:367-73.
Adimado AA, Baah DA. Mercury in human blood, urine, hair, nail, and fish from the Ankobraand Tano River Basins in south-western Ghana. Bull Environ Contam Toxicol 2002;68:339-46. doi:10.1007/s001280259
Agusa T, Kunito T, Iwata H, Monirith I, Tana TS, Subramanian A, et al. Mercurycontamination in human hair and fish from Cambodia: levels, specific accumulationand risk assessment. Environ Pollut 2005;134:79-86.doi:10.1016/j.envpol.2004.07.015
Al-Majed NB, Preston MR. Factors influencing the total mercury and methylmercury in thehair of the fishermen of Kuwait. Environ Pollut 2000;109:239-50. doi:10.1016/S0269-7491(99)00261-4
Al-Yakoob SN, Bou-Olayan A-H. Mercury in human hair: a study of residents in Kuwait. J Environ Sci Health, Part A: Environ Sci Eng 1994;A29:1541.
Appleton JD, Williams TM, Breward N, Apostol A, Miguel J, Miranda C. Mercurycontamination associated with artisanal gold mining on the island of Mindanao, thePhilippines. Sci Total Environ 1999;228:95-109. doi:10.1016/S0048-9697(99)00016-9
Babi D, Vasjari M, Celo V, Koroveshi M. Some results on Hg content in hair in different populations in Albania. Sci Total Environ 2000;259:55-60. doi:10.1016/S0048-9697(00)00549-0
Becker K, Kaus S, Krause C, Lepom P, Schulz C, Seiwert M, et al. German EnvironmentalSurvey 1998 (GerES III): environmental pollutants in blood of the German population.
Int J Hyg Environ Health 2002;205:297-308. doi:10.1078/1438-4639-00155 Belles-Isles M, Ayotte P, Dewailly E, Weber JP, Roy R. Cord-blood lymphocyte functions in
newborns from a remote maritime population exposed to organochlorines andmethylmercury. J Toxicol Environ Health A 2002;65:165-82.doi:10.1080/152873902753396794
Bjerregaard P, Hansen JC. Organochlorines and heavy metals in pregnant women from theDisko Bay area in Greenland. Sci Total Environ 2000;245:195-202.doi:10.1016/S0048-9697(99)00444-1
Bjornberg KA, Vahter M, Petersson-Grawe K, Glynn A, Cnattingius S, Darnerud PO, et al.Methylmercury and inorganic mercury in Swedish pregnant women and in cord-blood:influence of fish consumption. Environ Health Perspect 2003;111:637-41.
Butler Walker J, Houseman J, Seddon L, McMullen E, Tofflemire K, Mills C, et al. Maternaland umbilical cord-blood levels of mercury, lead, cadmium, and essential traceelements in Arctic Canada. Environ Res 2006;100:295-318.doi:10.1016/j.envres.2005.05.006
Buzina R, Stegnar P, Buzina-Suboticanec K, Horvat M, Petric I, Farley TM. Dietary mercuryintake and human exposure in an Adriatic population. Sci Total Environ 1995;170:199-208. doi:10.1016/0048-9697(95)04708-5
Canuel R, de Grosbois SB, Atikesse L, Lucotte M, Arp P, Ritchie C, et al. New evidence onvariations of human body burden of methylmercury from fish consumption. Environ
Health Perspect 2006;114:302-6.

8/14/2019 Who. Methylmercury Information Full
http://slidepdf.com/reader/full/who-methylmercury-information-full 64/68
Mercury burden of disease
56
Choy CM, Lam CW, Cheung LT, Briton-Jones CM, Cheung LP, Haines CJ. Infertility, bloodmercury concentrations and dietary seafood consumption: a case-control study. BJOG 2002;109:1121-5.
Cole DC, Kearney J, Sanin LH, Leblanc A, Weber JP. Blood mercury levels among Ontarioanglers and sport-fish eaters. Environ Res 2004;95:305-14.
doi:10.1016/j.envres.2003.08.012 Davidson PW, Myers GJ, Cox C, Axtell C, Shamlaye C, Sloane-Reeves J, et al. Effects of
prenatal and postnatal methylmercury exposure from fish consumption onneurodevelopment: outcomes at 66 months of age in the Seychelles ChildDevelopment Study. JAMA 1998;280:701-7. doi:10.1001/jama.280.8.701
de Kom JF, van der Voet GB, de Wolff FA. Mercury exposure of maroon workers in the smallscale gold mining in Suriname. Environ Res 1998;77:91-7.doi:10.1006/enrs.1998.3835
Dellinger JA. Exposure assessment and initial intervention regarding fish consumption oftribal members of the Upper Great Lakes Region in the United States. Environ Res
2004;95:325-40. doi:10.1016/j.envres.2003.07.012 Dewailly E, Ayotte P, Bruneau S, Lebel G, Levallois P, Weber JP. Exposure of the Inuit
population of Nunavik (Arctic Quebec) to lead and mercury. Arch Environ Health 2001;56:350-7.
Drasch G, Bose-O'Reilly S, Beinhoff C, Roider G, Maydl S. The Mt. Diwata study on thePhilippines 1999 — assessing mercury intoxication of the population by small scalegold mining. Sci Total Environ 2001;267:151-68. doi:10.1016/S0048-9697(00)00806-8
Feng Q, Suzuki Y, Hisashige A. Hair mercury levels of residents in China, Indonesia, andJapan. Arch Environ Health 1998;53:36-43.
Fok TF, Lam HS, Ng PC, Yip AS, Sin NC, Chan IH, et al. 2006. Fetal methylmercuryexposure as measured by cord-blood mercury concentrations in a mother-infant cohortin Hong Kong Special Administrative Region. Environ Int.
Foo SC, Tan TC. Elements in the hair of South-east Asian islanders. Sci Total Environ 1998;209:185-92. doi:10.1016/S0048-9697(97)00309-4
Grandjean P, Weihe P, White RF, Debes F, Araki S, Yokoyama K, et al. Cognitive deficit in 7-year-old children with prenatal exposure to methylmercury. Neurotoxicol Teratol 1997;19:417-28. doi:10.1016/S0892-0362(97)00097-4
Gundacker C, Komarnicki G, Zodl B, Forster C, Schuster E, Wittmann K. 2006. Whole bloodmercury and selenium concentrations in a selected Austrian population: Does gendermatter? Sci Total Environ.
Hac E, Krzyzanowski M, Krechniak J. Total mercury in human renal cortex, liver, cerebellumand hair. Sci Total Environ 2000;248:37-43. doi:10.1016/S0048-9697(99)00474-X
Hacon S, Yokoo E, Valente J, Campos RC, da Silva VA, de Menezes AC, et al. Exposure tomercury in pregnant women from Alta Floresta-Amazon basin, Brazil. Environ Res 2000;84:204-10. doi:10.1006/enrs.2000.4115
Harada M, Nakachi S, Tasaka K, Sakashita S, Muta K, Yanagida K, et al. Wide use of skin-lightening soap may cause mercury poisoning in Kenya. Sci Total Environ 2001;269:183-7. doi:10.1016/S0048-9697(00)00812-3
Harada M, Nakanishi J, Konuma S, Ohno K, Kimura T, Yamaguchi H, et al. The present
mercury contents of scalp hair and clinical symptoms in inhabitants of the Minamataarea. Environ Res 1998;77:160-4. doi:10.1006/enrs.1998.3837

8/14/2019 Who. Methylmercury Information Full
http://slidepdf.com/reader/full/who-methylmercury-information-full 65/68
Annex
57
Harnly M, Seidel S, Rojas P, Fornes R, Flessel P, Smith D, et al. Biological monitoring formercury within a community with soil and fish contamination. Environ Health
Perspect 1997;105:424-9. doi:10.2307/3433340
Holsbeek L, Das HK, Joiris CR. Mercury in human hair and relation to fish consumption inBangladesh. Sci Total Environ 1996;186:181-8. doi:10.1016/0048-9697(96)05110-8
Ikingura JR, Akagi H. Monitoring of fish and human exposure to mercury due to gold miningin the Lake Victoria goldfields, United Republic of Tanzania. Sci Total Environ 1996;191:59-68. doi:10.1016/0048-9697(96)05178-9
Iwasaki Y, Sakamoto M, Nakai K, Oka T, Dakeishi M, Iwata T, et al. Estimation of dailymercury intake from seafood in Japanese women: Akita cross-sectional study. Tohoku
J Exp Med 2003;200:67-73. doi:10.1620/tjem.200.67
Johnsson C, Sallsten G, Schutz A, Sjors A, Barregard L. Hair mercury levels versus freshwaterfish consumption in household members of Swedish angling societies. Environ Res 2004;96:257-63. doi:10.1016/j.envres.2004.01.005
Khassouani CD, Soulaymani R, Jana M, Mauras Y, Allain P. Blood mercury concentrations in
the population of Rabat area, Morocco. Bull Environ Contam Toxicol 2001;66:439-42.doi:10.1007/s00128-001-0025-y
Knobeloch L, Gliori G, Anderson H. 2006. Assessment of methylmercury exposure inWisconsin. Environ Res.
Kosatsky T, Przybysz R, Armstrong B. Mercury exposure in Montrealers who eat St.Lawrence River sportfish. Environ Res 2000;84:36-43. doi:10.1006/enrs.2000.4073
Kurttio P, Pekkanen J, Alfthan G, Paunio M, Jaakkola JJ, Heinonen OP. Increased mercuryexposure in inhabitants living in the vicinity of a hazardous waste incinerator: a 10-year follow-up. Arch Environ Health 1998;53:129-37.
Lee W, Myeong J, Lee, Lee S, Kim J, Bae C, Park T. An observation on the mercury contents
of scalp hair in the urban residents of Republic of Korea. Environ Toxicol Pharmacol 2000;8:275-8. doi:10.1016/S1382-6689(00)00044-2
Legrand M, Arp P, Ritchie C, Chan HM. Mercury exposure in two coastal communities of theBay of Fundy, Canada. Environ Res 2005;98:14-21. doi:10.1016/j.envres.2004.07.006
Li Z, Wang Q, Luo Y. Exposure of the urban population to mercury in Changchun city, North-east China. Environ Geochem Health 2006;28:61-6. doi:10.1007/s10653-005-9012-2
Lindow SW, Knight R, Batty J, Haswell SJ. Maternal and neonatal hair mercuryconcentrations: the effect of dental amalgam. BJOG 2003;110:287-91.doi:10.1046/j.1471-0528.2003.02257.x
Mahaffey KR, Mergler D. Blood levels of total and organic mercury in residents of the upperSt. Lawrence River basin, Quebec: association with age, gender, and fishconsumption. Environ Res 1998;77:104-14. doi:10.1006/enrs.1998.3834
Marques RC, Garrofe Dorea J, Rodrigues Bastos W, de Freitas Rebelo M, de Freitas FonsecaM, Malm O. 2006. Maternal mercury exposure and neuro-motor development in
breastfed infants from Porto Velho (Amazon), Brazil. Int J Hyg Environ Health.
Marsh DO, Turner MD, Smith JC, Allen P, Richdale N. Fetal methylmercury study in aPeruvian fish-eating population. Neurotoxicology 1995;16:717-26.
McDowell MA, Dillon CF, Osterloh J, Bolger PM, Pellizzari E, Fernando R, et al. Hairmercury levels in US children and women of childbearing age: reference range datafrom NHANES 1999–2000. Environ Health Perspect 2004;112:1165-71.
Morrissette J, Takser L, St-Amour G, Smargiassi A, Lafond J, Mergler D. Temporal variationof blood and hair mercury levels in pregnancy in relation to fish consumption history

8/14/2019 Who. Methylmercury Information Full
http://slidepdf.com/reader/full/who-methylmercury-information-full 66/68
Mercury burden of disease
58
in a population living along the St. Lawrence River. Environ Res 2004;95:363-74.doi:10.1016/j.envres.2003.12.007
Mortada WI, Sobh MA, el-Defrawy MM, Farahat SE. Reference intervals of cadmium, lead,and mercury in blood, urine, hair, and nails among residents in Mansoura city, Niledelta, Egypt. Environ Res 2002;90:104-10. doi:10.1006/enrs.2002.4396
Muckle G, Ayotte P, Dewailly EE, Jacobson SW, Jacobson JL. Prenatal exposure of thenorthern Quebec Inuit infants to environmental contaminants. Environ Health
Perspect 2001;109:1291-9. doi:10.2307/3454753
Nakagawa R. Concentration of mercury in hair of Japanese people. Chemosphere 1995;30:127-33. doi:10.1016/0045-6535(94)00382-5
NRC. 2000. Toxicolocal effects of methylmercury Washington, DC: National ResearchCouncil.
Ohno T, Sakamoto M, Kurosawa T, Dakeishi M, Iwata T, Murata K. 2006. Total mercurylevels in hair, toenail, and urine among women free from occupational exposure andtheir relations to renal tubular function. Environ Res.
Oken E, Wright RO, Kleinman KP, Bellinger D, Amarasiriwardena CJ, Hu H, et al. Maternalfish consumption, hair mercury, and infant cognition in a US Cohort. Environ Health
Perspect 2005;113:1376-80.
Olivero J, Johnson B, Arguello E. Human exposure to mercury in San Jorge river basin,Colombia (South America). Sci Total Environ 2002;289:41-7.
Oosthuizen J, Ehrlich R. The impact of pollution from a mercury processing plant inKwaZulu-Natal, South Africa, on the health of fish-eating communities in the area: anenvironmental health risk assessment. Int J Environ Health Res 2001;11:41-50.doi:10.1080/09603120020019638
Ortiz-Roque C, Lopez-Rivera Y. Mercury contamination in reproductive age women in a
Caribbean island: Vieques. J Epidemiol Community Health 2004;58:756-7.doi:10.1136/jech.2003.019224
Oskarsson A, Schultz A, Skerfving S, Hallen IP, Ohlin B, Lagerkvist BJ. Total and inorganicmercury in breast milk in relation to fish consumption and amalgam in lactatingwomen. Arch Environ Health 1996;51:234-41.
Pedersen EB, Jorgensen ME, Pedersen MB, Siggaard C, Sorensen TB, Mulvad G, et al.Relationship between mercury in blood and 24-hour ambulatory blood pressure inGreenlanders and Danes. Am J Hypertens 2005;18:612-8.doi:10.1016/j.amjhyper.2004.11.022
Pinheiro MC, Muller RC, Sarkis JE, Vieira JL, Oikawa T, Gomes MS, et al. Mercury and
selenium concentrations in hair samples of women in fertile age from Amazonriverside communities. Sci Total Environ 2005;349:284-8.doi:10.1016/j.scitotenv.2005.06.026
Raie RM. Regional variation in As, Cu, Hg, and Se and interaction between them. Ecotoxicol
Environ Saf 1996;35:248-52. doi:10.1006/eesa.1996.0107
Ramirez GB, Cruz MC, Pagulayan O, Ostrea E, Dalisay C. The Tagum study I: analysis andclinical correlates of mercury in maternal and cord-blood, breast milk, meconium, andinfants' hair. Paediatrics 2000;106:774-81. doi:10.1542/peds.106.4.774
Renzoni A, Zino F, Franchi E. Mercury levels along the food-chain and risk for exposed populations. Environ Res 1998;77:68-72. doi:10.1006/enrs.1998.3832
Rhainds M, Levallois P, Dewailly E, Ayotte P. Lead, mercury, and organochlorine compoundlevels in cord-blood in Quebec, Canada. Arch Environ Health 1999;54:40-7.

8/14/2019 Who. Methylmercury Information Full
http://slidepdf.com/reader/full/who-methylmercury-information-full 67/68
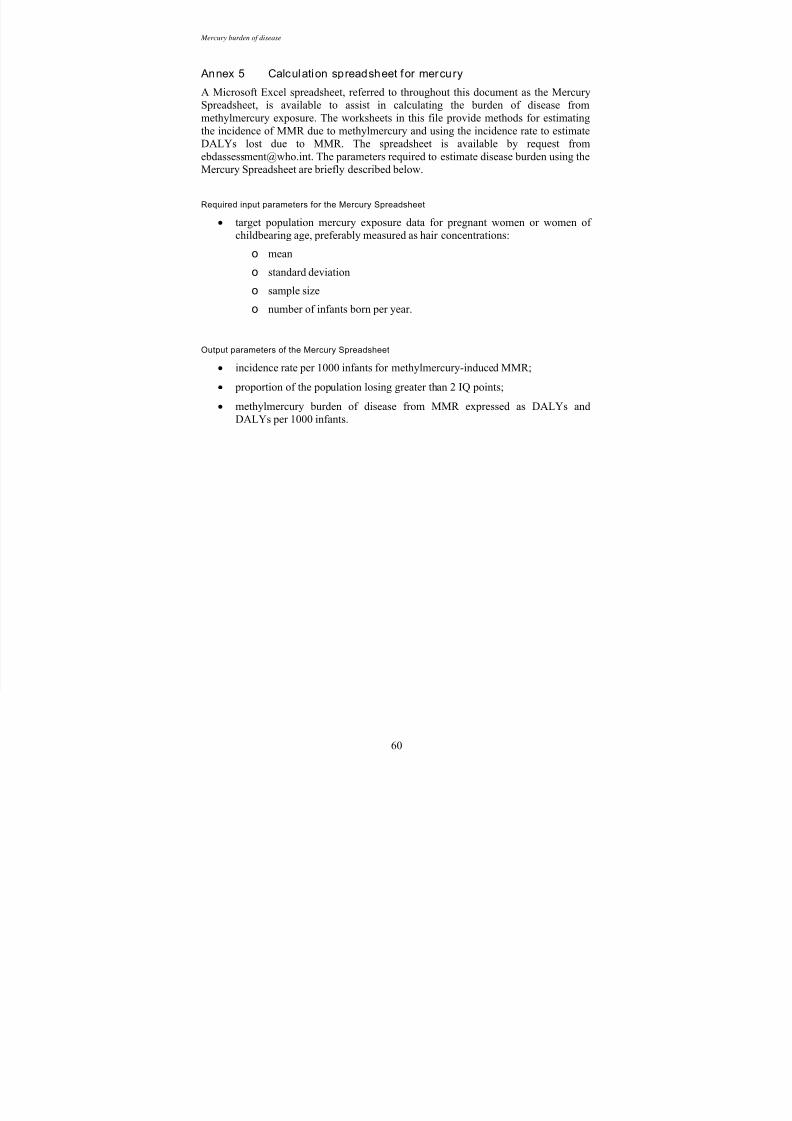
8/14/2019 Who. Methylmercury Information Full
http://slidepdf.com/reader/full/who-methylmercury-information-full 68/68
Mercury burden of disease
Annex 5 Calculation spreadsheet for mercury
A Microsoft Excel spreadsheet, referred to throughout this document as the MercurySpreadsheet, is available to assist in calculating the burden of disease frommethylmercury exposure. The worksheets in this file provide methods for estimatingthe incidence of MMR due to methylmercury and using the incidence rate to estimateDALYs lost due to MMR. The spreadsheet is available by request [email protected]. The parameters required to estimate disease burden using theMercury Spreadsheet are briefly described below.
Required input parameters for the Mercury Spreadsheet
• target population mercury exposure data for pregnant women or women ofchildbearing age, preferably measured as hair concentrations:
o mean
o
standard deviationo sample size
o number of infants born per year.
Output parameters of the Mercury Spreadsheet
• incidence rate per 1000 infants for methylmercury-induced MMR;
• proportion of the population losing greater than 2 IQ points;
• methylmercury burden of disease from MMR expressed as DALYs and
DALYs per 1000 infants.