Embed Size (px)
Citation preview
1
Methylmercury concentrations in shark
fins from the Hong Kong and Chinese
shark fin market and related health risks
for human consumption
by
NADJA SOEST
August 2016
Submitted as part assessment for the degree of Master of Science
(M.Sc.)
in
Marine Resource Development & Protection
Supervisor: Dr. Mark Hartl, Dr. Silvia Frey (Oceancare)
School of Life Sciences
Heriot-Watt University, Edinburgh
2
Abstract
More than half of sharks species traded in the shark fin market are threatened with
extinction due to overexploitation, while the high demand for shark fin is the main
driver for shark mortality. The major shark fin consumer countries are Hong Kong and
China, where shark fin soup has a long tradition and is considered as health promoting
food.
Methylmercury (MeHg) is a very potent toxin that can damage among others the
central nervous system, and fertility. The major MeHg source to humans is via seafood
consumption while highest concentrations are found in top predators like sharks, tuna
and swordfish. The aim of this study was to examine whether health risks of shark fin
consumption are severe enough to constitute another argument for consumers to
cease or limit shark fin consumption.
The mean value of MeHg concentrations in shark fins of 9 different studies has been
calculated and used to estimate MeHg exposure for different consumption patterns.
26% of the samples exceeded MeHg safety limits for fish set by the Japanese Health
Authority (0.3 mg/kg wet weight). For frequent shark fin soup consumption between
once per month and 3 times per week, the US EPA safety limit of 0.1 µg/kg body
weight per day were reached by 22-329% (men), 26-988% (women) and 83-3234%
(young children).
Frequent consumption of shark fins can pose serious health risk, while also less
frequent consumption should be seen in the context of additional daily MeHg intake
for the populations of Hong Kong and China were average seafood intake is 196g/day
and 91g/day respectively. The consumption of shark fins is in particular not
recommended for children or breast-feeding women because of the severe
neurodevelopmental damages that MeHg can cause in early-life stages. Conservative
consumption of sharks and their fins would not only make a significant difference for
consumer health, but also for the status of decreasing and endangered shark
populations and the marine ecosystem.
3
Acknowledgements
I would like to thank Thomas, Luca and Katrin for all their patience, support and helpful
inputs, and for always making sure that I, totally absorbed from my work, do not forget
one of the most important things in life: to live it.
Special thanks also to Eric, who dedicated his limited time to proofread my work, to
my supervisor Dr. Mark Hartl for his feedback and to my external supervisor Dr. Silvia
Frey (Oceancare), who gave me very helpful tips and feedback, and - most importantly
- saved my motivation in the last phase of my work.
I would also like to thank Stanley Shea (Bloom Asscociation, Hong Kong) for sharing
very detailed information about shark fin soup consumption in Hong Kong and for his
helpfulness and friendly way of communication.
Many thanks also Ran Elfassy (Shark Rescue) and to Yandy (Shark Foundation Hong
Kong) for providing helpful tips for my research on shark fin consumption in Hong Kong
and China, and to Yann Gilbert who shared the raw data of her study with me.

4
I certify that this dissertation is my own work based on my personal investigation and
that I have cited all material and sources used in its elaboration.
5
Contents
1 Introduction .......................................................................................................................... 6
2 Global conservation status of shark species ......................................................................... 9
3 Characteristics of shark fin soup, cultural background, market dimensions and trends.... 18
4 Global distribution of mercury and bioaccumulation of methylmercury in marine
organisms and in the human body ...................................................................................... 23
5 Biological and ecological factors that influence MeHg concentration in shark tissue ....... 30
6 Effects of mercury on human health .................................................................................. 38
7 Methods .............................................................................................................................. 47
8 Results ................................................................................................................................. 53
9 Discussion ............................................................................................................................ 56
References................................................................................................................................... 66
Appendix - List of shark species discussed .................................................................................. 83
6
1 Introduction
Shark populations have dramatically declined over recent decades and many shark
species are categorized as nearly threatened, vulnerable or endangered on the IUCN
Red List (IUCN, 2016). The main driver of declining shark populations is the high demand
for shark fins that leads to overexploitation of shark populations. Shark fins are
consumed in many Asian countries in the form of shark fin soup, especially in Hong
Kong and China where shark fin soup has been a traditional meal since the Song
dynasty (960-1279) and where it is still associated with traditional values, health,
strength and social status today. A fast growing Chinese economy since the mid 90’s
led to an increasing demand for shark fins and other luxury seafood products with the
consequence of overfishing of shark populations. In addition, official numbers of the
global shark capture production do not include unreported and illegal catches and
recent studies estimated that the latter ones make up at least 78% of the global
capture production (Clarke et al., 2006b).
Apart from the ecological impact, shark fin consumption also has severe impacts on
human health, as sharks are top predators and many contaminants, such as heavy
metals and organochlorines, biomagnify along the food chain and lead to high
concentrations of contaminants in predators on top of the food pyramid.
Methylmercury (MeHg) is an organic form of mercury and is of special importance (in
general but also in comparison to other forms of mercury) when looking at mercury
exposure from seafood consumption. It is very potent neurotoxin, primarily occurs in
aquatic systems, and is, due to its lipophilic nature, very easily absorbed in animal and
humans bodies. MeHg accumulates in different parts of the body, easily passes the
blood-brain barrier and causes severe damages principally in the nervous system, but
it also causes impairments of other body functions, for example in the reproductive
and cardiovascular system. The main source of MeHg to humans is via seafood
consumption. The most famous example of effects of MeHg exposure to humans was
the Minamata incident in Japan in 1956, where large volumes of mercury were
discharged from a chemical plant into nearby waterways. Consumption of mercury
contaminated fish and shellfish led to mercury poisoning of large parts of the

7
population in the area. The poisoning caused different neurological disorders, for
example disturbed coordination, impairment of vision speech and motor functions and
neurodevelopmental damage in neonatal and children including limb deformations.
While there are several studies available that analyse total mercury (THg) and MeHg
levels in muscle tissue of different shark species, only a few studies are available that
analyse mercury levels in shark fins. In this study, mercury levels in shark fins from 9
different studies have been evaluated, and MeHg levels have been calculated where
only THg levels were given. The mean MeHg concentration of all studies was calculated
and compared to international safety limits of maximum allowable MeHg levels in
shark tissue. The same mean MeHg concentration was used to estimate exposure for
different scenarios of consumption frequency and dish sizes and compared to
international safety limits for daily intake for men, women and children, based on body
weight.
Even though mercury levels in shark fins are much lower than in shark meat, 26% of all
shark fin samples of these 9 studies exceeded MeHg limits for fish by the Japanese
Health Authority (0.3 mg/kg wet weight) and 22% of the samples exceeded the safety
limits for THg in shark products of 1 mg/kg wet weight, adopted by the European
Union, Australia, New Zealand and Canada. 24% of the samples exceeded the Japanese
safety limits for THg in fish (0.4 mg/g) and 26% exceeded the US safety limit of 0.3
mg/g for fish and shellfish.
Mean MeHg concentrations of all studies were 0.83 mg/kg dry weight and 0.37 mg/kg
wet weight. Exposure estimates based on this mean concentration were below the
recommended safety limit by US EPA of 0.1 µg/kg body weight per day, if shark fin
soup is eaten 3 times per year or less. Young children may already reach more than
60% of the safety limit if they consume large 150g shark fin portions 3 times a year, not
including mercury intake by additional seafood. If consumed once per month, MeHg
intake exceeds the safety limits for young children by far, while adult men and women
might reach 67-77% of their safety limits, just by shark fin consumption. If shark fin
soup is consumed once per week or more often, all three groups reach or exceed
safety limits by several factors, even for dishes with small (50g) portions of shark fin.
8
In conclusion, the consumption of large portions of shark fins or the frequent
consumption of small portions can have severe health risks. In addition, for the
consumption of small portions at a lower frequency it should be kept in mind that
small dosages also add to the daily mercury intake, which is already high in populations
with high seafood consumption, as is the case for Hong Kong and China. In particular,
children, pregnant and breast-feeding women should avoid the consumption of shark
fins and other products of high predator fish because of the particular sensitivity of the
nervous system in early life stages to mercury exposure.
While many studies have examined MeHg levels in shark muscle tissue and a few
examined MeHg levels in shark fins, no metastudy was found that combined the
results of MeHg in shark fins of different studies to estimate exposure based on
different consumption scenarios. The aim of this study therefore was to fill this gap
and to examine whether, apart from the ecological aspects, there are also health
concerns that would influence consumer behaviour to limit or cease shark fin
consumption.
2 Global conservation status of shark species
All shark species which were found to occur in the global fin trade by
(Vannuccini, 1999; Clarke et al.
threatened with higher risk of extinction (IUCN
‘near threatened, vulnerable or
exploitation and bad fisheries management in combination with a typically low
productivity of most shark species (Clarke et al., 2013; Dulvy et al., 2008; Davidson et
al., 2015). The high value of fins is considered to be the main driver of shark mortality
(Clarke et al., 2006b; Clarke et al., 2007).
between 1950 and 2003, and then declined by 15% between 2003 and 2011. Also
catch sizes decreased significantly (Clarke et al., 2013) which underlines the finding
that decreasing populations are not the result o
average 81% to 89% decline from the baseline of global elasmobranch populations has
been estimated for 2009 (Costello et al., 2012; Dulvy et al., 2008).
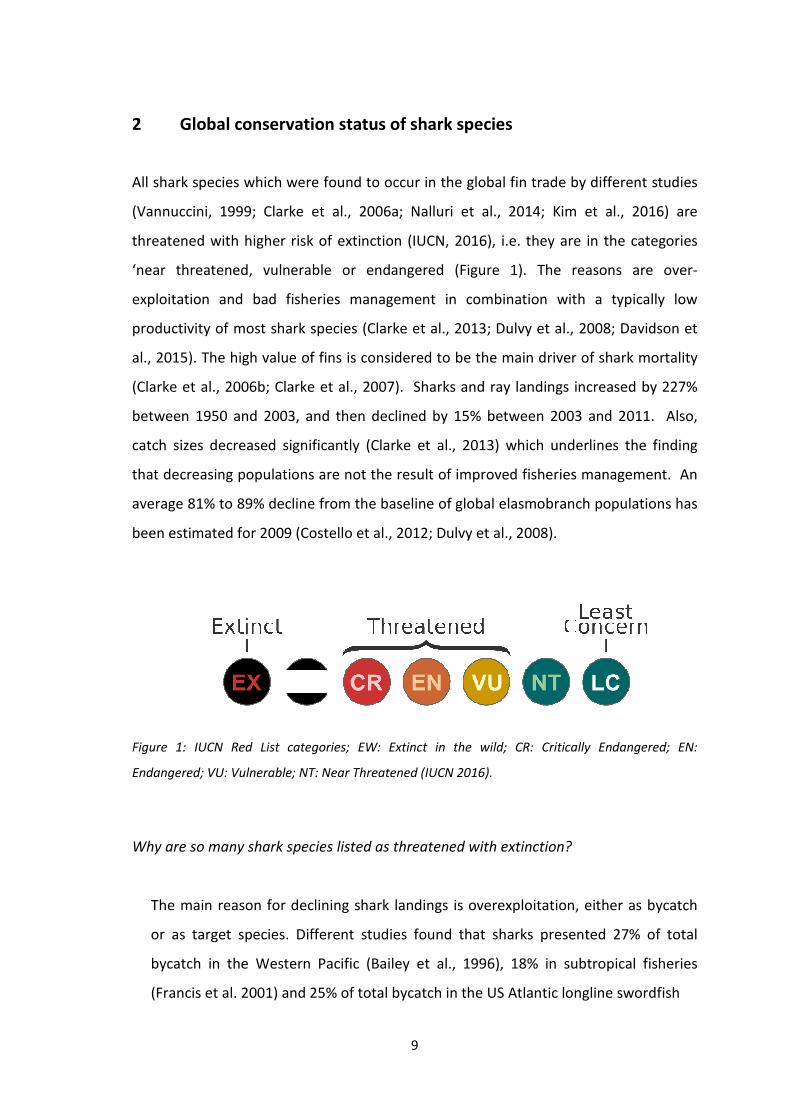
Figure 1: IUCN Red List categories; EW: Extinct in the wild; CR: Critically Endangered; EN:
Endangered; VU: Vulnerable; NT: Near Threatened (IUCN 2016)
Why are so many shark species listed as threatened with extinction?
The main reason for declining shark
or as target species. Different studies found that sharks presented 27% of total
bycatch in the Western Pacific (Bailey et al., 1996), 18% in subtropical fisheries
(Francis et al. 2001) and 25% of total bycat
9
Global conservation status of shark species
which were found to occur in the global fin trade by
Clarke et al., 2006a; Nalluri et al., 2014; Kim et
threatened with higher risk of extinction (IUCN, 2016), i.e. they are in the categories
‘near threatened, vulnerable or endangered (Figure 1). The reasons
n and bad fisheries management in combination with a typically low
productivity of most shark species (Clarke et al., 2013; Dulvy et al., 2008; Davidson et
al., 2015). The high value of fins is considered to be the main driver of shark mortality
; Clarke et al., 2007). Sharks and ray landings
between 1950 and 2003, and then declined by 15% between 2003 and 2011. Also
catch sizes decreased significantly (Clarke et al., 2013) which underlines the finding
ng populations are not the result of improved fisheries management.
average 81% to 89% decline from the baseline of global elasmobranch populations has
been estimated for 2009 (Costello et al., 2012; Dulvy et al., 2008).
: IUCN Red List categories; EW: Extinct in the wild; CR: Critically Endangered; EN:
Endangered; VU: Vulnerable; NT: Near Threatened (IUCN 2016).
Why are so many shark species listed as threatened with extinction?
The main reason for declining shark landings is overexploitation, either as bycatch
or as target species. Different studies found that sharks presented 27% of total
bycatch in the Western Pacific (Bailey et al., 1996), 18% in subtropical fisheries
(Francis et al. 2001) and 25% of total bycatch in the US Atlantic longline swordfish
which were found to occur in the global fin trade by different studies
Kim et al., 2016) are
2016), i.e. they are in the categories
The reasons are over-
n and bad fisheries management in combination with a typically low
productivity of most shark species (Clarke et al., 2013; Dulvy et al., 2008; Davidson et
al., 2015). The high value of fins is considered to be the main driver of shark mortality
increased by 227%
between 1950 and 2003, and then declined by 15% between 2003 and 2011. Also,
catch sizes decreased significantly (Clarke et al., 2013) which underlines the finding
f improved fisheries management. An
average 81% to 89% decline from the baseline of global elasmobranch populations has
: IUCN Red List categories; EW: Extinct in the wild; CR: Critically Endangered; EN:
landings is overexploitation, either as bycatch
or as target species. Different studies found that sharks presented 27% of total
bycatch in the Western Pacific (Bailey et al., 1996), 18% in subtropical fisheries
ch in the US Atlantic longline swordfish
10
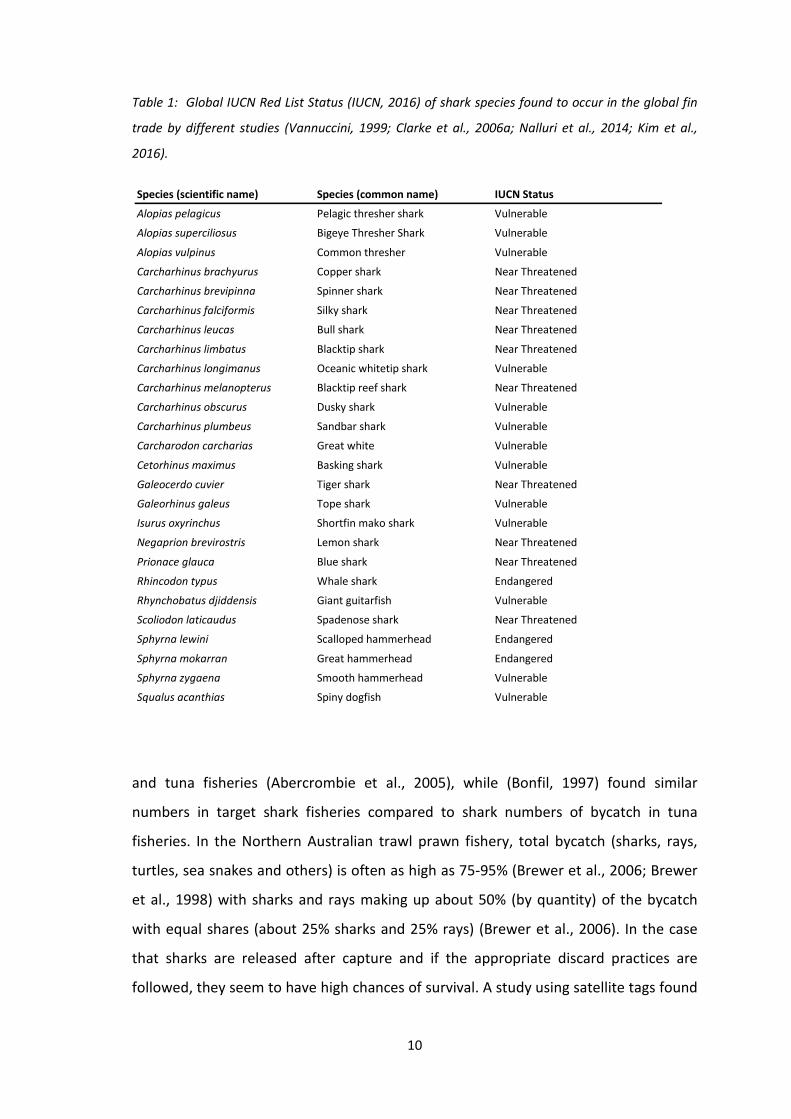
Table 1: Global IUCN Red List Status (IUCN, 2016) of shark species found to occur in the global fin
trade by different studies (Vannuccini, 1999; Clarke et al., 2006a; Nalluri et al., 2014; Kim et al.,
2016).
and tuna fisheries (Abercrombie et al., 2005), while (Bonfil, 1997) found similar
numbers in target shark fisheries compared to shark numbers of bycatch in tuna
fisheries. In the Northern Australian trawl prawn fishery, total bycatch (sharks, rays,
turtles, sea snakes and others) is often as high as 75-95% (Brewer et al., 2006; Brewer
et al., 1998) with sharks and rays making up about 50% (by quantity) of the bycatch
with equal shares (about 25% sharks and 25% rays) (Brewer et al., 2006). In the case
that sharks are released after capture and if the appropriate discard practices are
followed, they seem to have high chances of survival. A study using satellite tags found
Species (scientific name) Species (common name) IUCN Status
Alopias pelagicus Pelagic thresher shark Vulnerable
Alopias superciliosus Bigeye Thresher Shark Vulnerable
Alopias vulpinus Common thresher Vulnerable
Carcharhinus brachyurus Copper shark Near Threatened
Carcharhinus brevipinna Spinner shark Near Threatened
Carcharhinus falciformis Silky shark Near Threatened
Carcharhinus leucas Bull shark Near Threatened
Carcharhinus limbatus Blacktip shark Near Threatened
Carcharhinus longimanus Oceanic whitetip shark Vulnerable
Carcharhinus melanopterus Blacktip reef shark Near Threatened
Carcharhinus obscurus Dusky shark Vulnerable
Carcharhinus plumbeus Sandbar shark Vulnerable
Carcharodon carcharias Great white Vulnerable
Cetorhinus maximus Basking shark Vulnerable
Galeocerdo cuvier Tiger shark Near Threatened
Galeorhinus galeus Tope shark Vulnerable
Isurus oxyrinchus Shortfin mako shark Vulnerable
Negaprion brevirostris Lemon shark Near Threatened
Prionace glauca Blue shark Near Threatened
Rhincodon typus Whale shark Endangered
Rhynchobatus djiddensis Giant guitarfish Vulnerable
Scoliodon laticaudus Spadenose shark Near Threatened
Sphyrna lewini Scalloped hammerhead Endangered
Sphyrna mokarran Great hammerhead Endangered
Sphyrna zygaena Smooth hammerhead Vulnerable
Squalus acanthias Spiny dogfish Vulnerable

11
that 97.5% of pelagic sharks survived capture in longline gear after release (Gilman et
al., 2008) and 94% of shortfin mako sharks (Isurus oxyrinchus) were found to survive
beyond two months after capture in longline gear after release (NMFS, 2005).
Shark mortality can be reduced by turtle excluder devices and bycatch reduction
devices (Brewer et al., 2006) in the trawl net fishery or by chemical, electrical,
magnetic or electropositive rare earth metal repellents in longline fisheries (Gilman et
al., 2008). However, the present use of these devices is limited, and with an increasing
value of shark fins and shark meat, shark bycatch is more often retained (Dulvy et al.,
2008). In recent years, many shark species have become target species, due to the
increasing demand for their fins and meat, and other products like liver oil, cartilage
and skin (Dulvy et al., 2008). Shark meat has become more popular as other target fish
landings are declining while demand for fish is increasing. For example, Spain, Hong
Kong’s most important import partner in recent years, has started to target blue sharks
(prionace glauca) for their meat and fins. The meat is sold on the domestic or
European market - Spain and Italy are the top shark meat consumer countries in
Europe - or it is sold in other international landing ports around the world. The more
valuable fins are frozen and shipped mainly to Hong Kong. The bulk of the fin trade is
represented by fins of blue shark, oceanic whitetip shark (Carcharhinus longimanus),
silky shark (Carcharhinus falciformis), thresher sharks (Alopias spp.) and hammerhead
sharks (Sphyrna spp.) (Clarke et al., 2004).
Global shark populations would be in a better condition if shark fisheries were well-
managed, however, despite their high value fins, most fisheries continue to regard
sharks as bycatch and not as target species (Clarke et al., 2013). Another reason, why
shark fisheries are poorly managed or not managed at all is the lack of data. Catches
remain often unreported or underreported, and species are misidentified or
unidentified (Clarke et al. 2013). For example only 15% of FAO recorded shark are
reported by species (Lack et al. 2006). The near extinction of the angel shark (Squatina
squatina) in Europe went almost undiscovered, as they were reported under the same
product name as anglerfish (Lophius spp.) and the declining catches of the angel shark
were masked by increasing catches of anglerfish (Dulvy and Forrest, 2010). Estimates
of real catches, including unreported catches, exceed reported catches by far. Exports
12
of Atlantic blue shark fins are much higher than reported landings (ICCAT, 2005;
Campana et al., 2006; Pilling et al., 2008). Furthermore, a study comparing shark fins
auctioned on the Hong Kong fin market to trade statistics found that shark biomass
represented in the global fin trade is more than 4 times higher than FAO estimates
(Clarke et al. 2006b). This lack of data also makes it difficult to assess the impact of
overexploitation and to define each species’ conservation status. As a consequence
their conservation status might be upgraded to higher categories as soon as more data
are available (Dulvy et al. 2008).
Why do different shark species have different conservation statuses?
Sharks are especially vulnerable to over-exploitation as they are so-called K-selected
species. This means that their biology and their role in the ecosystem makes them
long-lived, slow-growing and late-maturing, with low reproduction rates and - in an
environment with limited human impact - with naturally low mortality rates (Field et
al. 2009). These characteristics make them highly vulnerable to over-exploitation
(Cortés 2002; Fowler & Cavanagh 2005). Different shark species have different
conservation statuses because of their different demographic resilience and because
of different intensities of exploitation for each species (Dulvy et al., 2008). For
example, the blue shark and the shortfin mako shark are both heavily exploited for
their fins and meat, however the blue shark has a higher productivity, while the
shortfin mako shark is less productive, which is one of the reasons why the short fin
mako is classified as vulnerable and the blue shark as near threatened. Apart from
their global status shark species might have different regional conservation statuses.
For example, the shortfin mako is globally classified as vulnerable but classified as
critically endangered in the Mediterranean Sea and as near-threatened in the North-
east Pacific, where they are not targeted and where the US swordfish fishery is
comparatively well-managed (Taylor and Bedford, 2001).
Declining shark populations also have consequences for marine ecosystems, especially
if they are a keystone species. Species have a “keystone role” if their abundance
13
strongly influences the abundance and diversity of other species in the same
ecosystem.
For example, sea otter populations in British Columbia and Alaska have a keystone role
and influence sea urchin and kelp forest populations. (Watson and Estes, 2011; Estes
et al., 1998). Sea otters were extinct in British Columbia waters by about 1850 (Watson
and Estes, 2011) as they had been previously overexploited for their fur (Kenyon,
1969). In 1969, 89 sea otters were reintroduced to Checleset Bay, British Columbia
and sea otter population of British Columbia increased to 3180 animals in 2001
(Watson and Estes, 2011). Sea otters feed on sea urchins which graze on kelp forest,
and the reintroduction of sea otters led to a recovery of the kelp forest in most areas
of British Columbian waters. The opposite effect has been reported for declining sea
otter populations in Alaskan regions due to increased predation by killer whales,
resulting in high sea urchin abundances and a declining kelp forest, (Estes et al., 1998).
These effects, when removal of top predators leads to a chain reaction in the food
web, strongly influencing abundance of other species, and in this way also ecosystem
structure, primary production and nutrient cycling are called “trophic cascades” (Paine,
1980; Terborgh and Estes, 2013).
Many other studies have shown that the removal of predators can reduce species
richness which can lead to reduced productivity, stability and nutrient cycling (Duffy,
2006; Schmitz et al., 2000; Stachowicz et al., 2007; Worm et al., 2006) and that
depleting shark populations can lead to trophic cascades (Stevens et al., 2000; Kitchell
et al., 2002; Myers et al., 2007). Simulations of the French Frigate shoals in Hawaii, the
Venezuelan shelf and the Alaska Gyre predicted changes in prey species abundances
after the removal of sharks (Stevens et al., 2000), while over-fishing of top predator
sharks might have led to increasing abundance of cownose rays (Rhinoptera bonasus)
in the North Atlantic (Myers et al., 2007). Other studies state that the influence of
sharks on diversity and ecosystem structure is still unexplored (Camhi et al., 1998) and
that the effects of removing large marine predators from marine ecosystems are not
clearly understood for most ecosystems (Bruno and O’Connor, 2005).
A number of different international treaties and initiatives aim to protect threatened
sharks species and to prevent further over-exploitation. Annex II ‘List of endangered or
14
threatened species’ of the Barcelona Convention for the Protection of the
Mediterranean Sea Against Pollution lists the basking shark (Cetorhinus maximus) and
the great white shark (Carcharodon carcharias). Appendix II ‘List of species whose
exploitation is regulated’ lists shortfin mako, porbeagle (Lamna nasus), blue shark and
angel shark (Squatina squatina). Parties of the Barcelona convention are obliged to
provide maximum protection and to support the recovery of listed species in Appendix
II and are required ‘to adopt measures to ensure the protection and conservation’ of
species listed in Annex II and III (Barcelona, 1995). The relevant protocol (Protocol
Concerning Specially Protected Areas and Biological Diversity in the Mediterranean)
was signed by 18 Mediterranean member states and entered into force in 2015
(Barcelona, 2013; Barcelona, 2016).
The same shark species as in the Barcelona convention are listed in Appendix I and II of
the Bern Convention on the Conservation of European Wildlife and Natural Habitats
(CETS, 2002a; CETS 2002b), however, the regulations only concern the Mediterranean
populations of shortfin mako, porbeagle, blue and angel shark. Appendix I ensures
maximum protection and prohibits any taking or killing of the listed species while
Appendix II limits the exploitation of listed species.
Whale shark (Rhincodon typus), basking shark, great white shark, hammerhead sharks,
oceanic white tip shark and manta rays (Manta spp.) are listed in Appendix II of CITES
(Convention on International Trade in Endangered Species of Wild Fauna and Flora),
that lists species for which trade is only permitted with an export permit and a
certificate of origin from the state of the member country who has listed the species
(CITES, 2016). Great white shark and basking shark are listed under CMS Appendix I
(Convention on the Conservation of Migratory Species of Wild Animals), which requires
member states to prohibit any taking of these species with very few exceptions. CMS
Appendix II lists species with an ‘unfavourable conservation status’ and encourages
member states to take actions that benefit the species listed. These include whale,
great white and basking shark, shortfin mako, longfin mako, thresher sharks (Alopias
spp.), silky shark, scalloped hammerhead (Sphyrna lewini), great hammerhead
(Sphyrna mokarran), porbeagle shark and Northern hemisphere populations of the
spiny dogfish (CMS, 2014). The convention has 123 parties including the majority of
15
European, South American, African and Middle East countries, Australia and New
Zealand. The United States and Canada are not members. The last amendments of the
convention (CMS, 2014) entered into force in February 2015. Apart from these
international conventions, there are also different regional initiatives and action plans
with the aim to improve protection of threatened, vulnerable or endangered shark
species.
The provisions of these conventions are however not legally binding nor highly
enforced (Oceana, 2009). The EU has adopted the prohibition of catches of some shark
species into EU law, including basking shark, great white shark, porbeagle and angel
shark in EU waters, and of spiny dogfish, tope shark (Galeorhinus galeus), smooth
lantern shark (Etmopterus pusillus), great lanternshark (Etmopterus princeps), kitefin
shark (Dalatias licha), birdbeak dogfish (Deania calcea), leafscale gulper shark
(Centrophorus squamosus), Portuguese dogfish (Centroscymnus coelolepis) and
guitarfishes (Rhinobatidae) in specific areas of EU waters (EC, 2015b, Article 44).
No such prohibitions or catch limits in form of quotas or total allowable catch (TAC)
have been adopted by the European Commission for the other shark species listed in
Appendix II of the Barcelona and Bern Convention (shortfin mako and blue shark), and
for the shark species listed in Appendix II of the CMS (shortfin mako, longfin mako,
thresher sharks, silky shark, scalloped hammerhead, great hammerhead shark).
Moreover, even for species where prohibitions of catches or TACs have been adapted
into European law, enforcement is absent or inefficient due to very limited monitoring,
control and surveillance for chondrichthyans captures and landings (Fowler et al.,
2004).
Different NGOs claim a lack of enforcement and abundance of loopholes in the legal
provisions that aim to protect sharks (Oceana, 2009; Oceana, 2009b; Seashepherd,
2016). The size of seas and oceans makes it difficult to control fishery activities, many
governments cannot afford controls and often there is a lack of political will and
corruption. For example, the government of Costa Rica received several million dollars
for infrastructure investments from Taiwan, ignoring in return the large-scale illegal
shark fin trade run by a number of private docks in Costa Rica (Seashepherd, 2016).
16
The EU profits by the lacking policies of other countries as well. The EU has the second
largest chondrichthyan capture production in the world (FAO, 2014). EU vessels can
fish under bilateral agreements in the waters of developing countries where species
are unprotected or less protected and where they can report shark catches as bycatch
even if they make up to 80% of their total catch (Oceana, 2009).
It has to be kept in mind as well, that policies can only work if enforcement and
controls are in place. For example the great white shark, which is the most protected
shark species in the world, is still illegally caught, despite its protection status (Shivji et
al., 2005; Gilbert et al., 2015). Apart from that, the regulations of conventions are only
valid for the parties that signed the convention and are not relevant for non-members.
This means that any capture of protected species on the High Seas, where no state has
any sovereignty rights and where no state has the right to create any regulations for
another state, unless it is in a form of a convention, and in that case it only has to be
respected by the parties who signed the convention.
However, despite these difficulties, a number of species recovered with the help of
strict management regulations. For example, white shark populations in California
recovered after their taking was prohibited in 1994 (Burgess et al. 2014) and spiny
dogfish populations increased after catch quotas had been introduced in the United
States (COSEWIC, 2011). Seven West African countries (Dulvy et al., 2014) and four
South American countries (Gomez, 2008) implemented regional action plans for shark
and ray fisheries management, which did not introduce any catch quotas or legal
bindings, but improved landing records, public awareness and improved cooperation
with international conservation efforts.
Finning bans have been recently introduced by several countries. Their aim is to
prevent the cruel and wasteful finning of sharks and the disposal of the live shark
carcass at sea. The enforcement works by defining a maximum fin to carcass (i.e.
normally the gutted body of the shark excluding fins and head) ratio that is permitted
to be landed. This measure aims to reduce the cruel act of finning of live sharks,
however it does not reduce shark mortality (Clarke et al., 2013).
17
The International Commission for the Conservation of Atlantic Tunas and tuna-like
Species (ICCAT) introduced a prohibition to retain bycatch of oceanic whitetip and silky
sharks. This measure has bigger potential to reduce shark mortality compared to
finning bans, however, in a study about the Atlantic long-line fishery, 69% of silky
sharks did not survive despite release. Clarke et al. (2013) criticizes such prohibitions as
they take away the focus from on-board-handling practices, that would improve post-
release survival rates, and from the fact that sharks are an economically valuable
target species that should be sustainably managed. In addition, sharks are less likely to
be recorded if their catch is prohibited. Future recommendations of different studies
are therefore an improved management of shark fisheries with introduction of catch
quotas and improvement of bycatch handling techniques.
18
3 Characteristics of shark fin soup, cultural background, market
dimensions and trends
Shark fin soup has a long tradition in China and is a symbol for health and good
fortune. Different media and an the San-Francisco-based NGO WildAid have reported
strong declines of about 70% in the demand for shark fin in the last years, claiming
public awareness campaigns to be the main reason (Tsui, 2013; Duggan, 2014; Wild
Aid, 2014). However there is scientific evidence that these numbers are overestimated
and market declines are much smaller. The high demand for shark fin is still the main
driver of the global shark capture production.
Shark fin consumption has a long history dating back to the Song dynasty (960-1279)
where it became popular as a delicacy (Freeman, 1977). During the Ming Dynasty
(1368-1644), it became part of imperial banquets (Rose, 1996). Until the 1990s, shark
fin was mainly consumed in the southern Chinese provinces of Hong Kong, Beijing and
Shanghai (Clarke, 2007; Li, 2007). Shark fin soup is a luxury food product and the rapid
growth of the Chinese economy since the 1990s led to an increasing number of
seafood and luxury seafood consumers (Fabinyi, 2012).
Shark fins have kept their popularity in China and other Asian countries until today,
where they mainly stand for tradition, health and status. In a survey undertaken in
Hong Kong, people indicated the main reasons for eating shark fin soup to be tradition
(52%), taste (51%), texture (40%), health (27%) and status (19%) (Bloom, 2015).
In terms of their health symbolism, it is important to understand the origins of their
health aspects in Traditional Chinese Medicine (TCM). They form part of the bu foods
which are considered as ‘strengthening or tonic-like’ (Anderson 1988; Simoons 1991;
Newman 2004). Apart from that, there is a connection between bu foods and wild
foods as these are considered ‘unpolluted’, ‘precious’ and ‘special’ (TRAFFIC, 2010) and
therefore ‘more bu’ compared to non-wild foods. Bu foods are also considered to
promote sexual potency and virility (Anderson 1988) and are for this reason more
popular among men than women (Zhang et al. 2008; TRAFFIC, 2010). For the same
19
reason wild caught reef fish sells in China for much higher prices than cultured fish
(Vincent 2002).
Apart from their health symbolism, consumption of shark fins reflects social status.
Shark fin soup is an expensive dish, often found in Chinese upper-class restaurants. It is
mainly consumed on special occasions like wedding and birthday banquets, family
reunions, New Year, corporate events, festivals and friend gatherings (Bloom/SSRC,
2015). In some social circles, not serving shark fin is considered as equal to admitting
to be poor (Watts, 2001). According to an internet blog by Wild Aid conservation
photojournalist Alex Hofford, shark fin soup has become much more affordable in
recent years and is also available in buffets and all-you-can-eat menus of simpler
restaurants, with prices in the range of 10 to 40 USD instead of the usual prices of 100
US$ or more (Hofford, 2009). Regarding shark fin soup some information sources have
to be carefully re-evaluated, as it seems to be a sensitive and emotional topic for the
main consumer countries, who want to defend their tradition, believes and their global
image as well as for environmentalists who fear the cruel treatment of sharks and a
near extinction of a number of species. However, this blog seems reliable as it
provided photographs of the restaurant menus that were discussed.
The price range can be explained by the amount and quality of fins added to the soup.
(Hausfather, 2004). For most traders, the size of the fin is more important than the
species in terms of pricing (Eilperrin, 2011). Other sources list some shark species with
large fins, for example thresher sharks (Alopias spp.), whale shark and basking shark
only in the ‘third choice’ category (Vannuccini, 1999). The reason might however be a
lesser suitability of the fin texture, as this is another important criterion. The selection
of species that occur in the fin market is rather small, with only 14 species representing
40% of the Hong Kong fin market, of which blue shark alone makes up 17% (Clarke et
al., 2004).
According to records from the Hong Kong fin market, the most important fin market in
the world with a global share of about 52% (1996-2000), preferred fin types are the
first dorsal (Figure 2), pectoral and lower caudal lope fins (Clarke et al., 2006b) due to
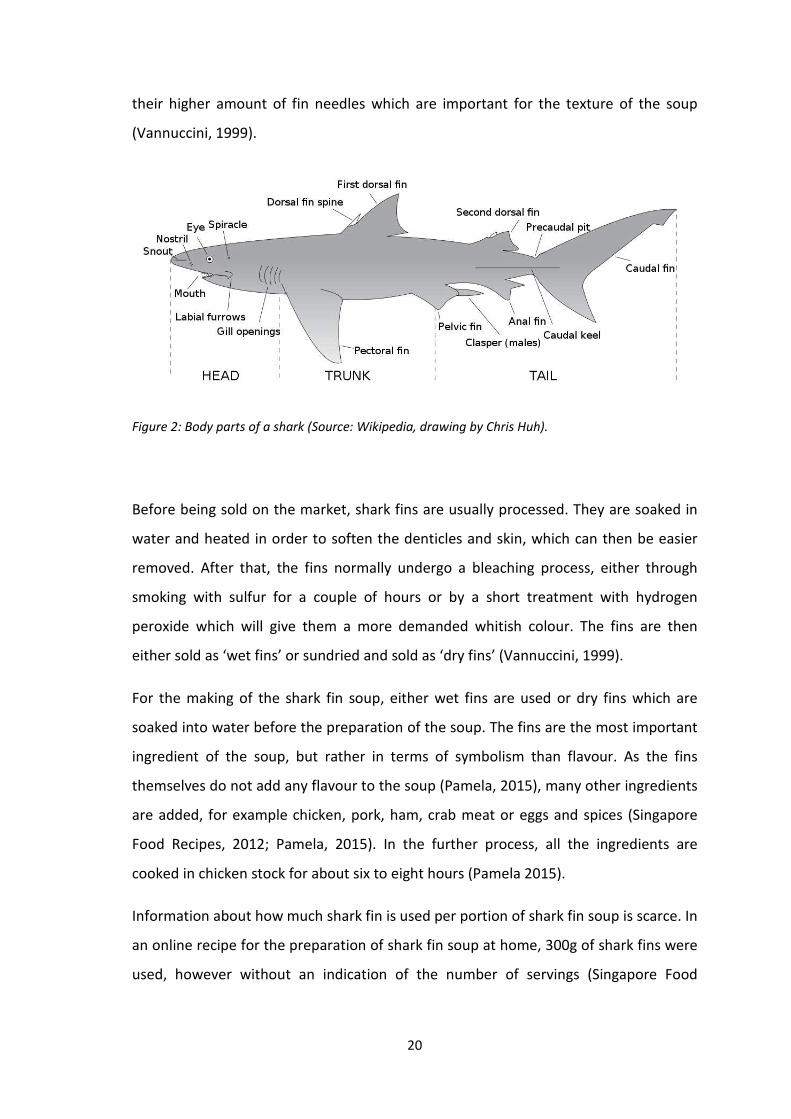
their higher amount of fin needles which are important fo
(Vannuccini, 1999).
Figure 2: Body parts of a shark (Source: Wikipedia, drawing by Chris Huh)
Before being sold on the market, shark fins are usually processed. They are soaked in
water and heated in order to soften the denticles and skin, which can then be easier
removed. After that, the fins
smoking with sulfur for a couple of hours or by a short treatment with hydrogen
peroxide which will give them
either sold as ‘wet fins’ or sundried and sold as ‘dry fins’ (Vannuccini, 1999).
For the making of the shark fin soup, either wet fins are used or dry fins which are
soaked into water before the preparatio
ingredient of the soup, but rather in terms of symbolism
themselves do not add any flavour to the soup (Pamela, 2015), many other ingredients
are added, for example chicken, pork, ham
Food Recipes, 2012; Pamela, 2015). In the further process, all
cooked in chicken stock for about six to eight hours (Pamela 2015).
Information about how much shark fin is used per portion of sha
an online recipe for the preparation of shark fin soup at home, 300g of shark fins were
used, however without an indication of the number of servings (Singapore Food
20
their higher amount of fin needles which are important for the texture of the soup
: Body parts of a shark (Source: Wikipedia, drawing by Chris Huh).
Before being sold on the market, shark fins are usually processed. They are soaked in
rder to soften the denticles and skin, which can then be easier
moved. After that, the fins normally undergo a bleaching process, either through
smoking with sulfur for a couple of hours or by a short treatment with hydrogen
peroxide which will give them a more demanded whitish colour. The fins are then
either sold as ‘wet fins’ or sundried and sold as ‘dry fins’ (Vannuccini, 1999).
For the making of the shark fin soup, either wet fins are used or dry fins which are
soaked into water before the preparation of the soup. The fins are the most important
ingredient of the soup, but rather in terms of symbolism than flavour. As the fins
themselves do not add any flavour to the soup (Pamela, 2015), many other ingredients
are added, for example chicken, pork, ham, crab meat or eggs and spices (Singapore
es, 2012; Pamela, 2015). In the further process, all the ingredients
in chicken stock for about six to eight hours (Pamela 2015).
Information about how much shark fin is used per portion of shark fin soup is scarce. In
an online recipe for the preparation of shark fin soup at home, 300g of shark fins were
used, however without an indication of the number of servings (Singapore Food
r the texture of the soup
Before being sold on the market, shark fins are usually processed. They are soaked in
rder to soften the denticles and skin, which can then be easier
normally undergo a bleaching process, either through
smoking with sulfur for a couple of hours or by a short treatment with hydrogen
a more demanded whitish colour. The fins are then
either sold as ‘wet fins’ or sundried and sold as ‘dry fins’ (Vannuccini, 1999).
For the making of the shark fin soup, either wet fins are used or dry fins which are
n of the soup. The fins are the most important
flavour. As the fins
themselves do not add any flavour to the soup (Pamela, 2015), many other ingredients
, crab meat or eggs and spices (Singapore
the ingredients are
rk fin soup is scarce. In
an online recipe for the preparation of shark fin soup at home, 300g of shark fins were
used, however without an indication of the number of servings (Singapore Food
21
Recipes, 2012). Much larger portions of 150g of shark fin per serving can be found in
restaurants as well (Man et al., 2015).
Shark fins are consumed in several Asian countries, with China being the world’s
leading consumer market, followed by Hong Kong, Japan, Malaysia, Singapore, Taiwan
(FAO 2015) and South Korea (Kim et al., 2016). Reliable numbers of sharks globally
traded in the fin trade are difficult to find, as large numbers of catches are illegal or
remain unreported. The use of customs data has also become more difficult. First of
all, information from Chinese customs records is unreliable (FAO, 2015), and second, a
worldwide change in custom commodity codes in 2012 resulted in shark fins being
recorded as shark meat in the trade statistics (Erikson and Clarke, 2015). As a result,
even the reported and legal part of shark fin capture production does not appear
anymore as a separate unit in import and export statistics, not only for China, but also
for Hong Kong. One study has estimated the real dimension of the fin market by
genetic identification of shark fins found on the Hong Kong market. Recordings of
species and numbers of different fin positions, information from local traders, Hong
Kong trade statistics and FAO records of shark capture production data were combined
and statistically evaluated. The annual number of sharks caught for the global fin trade
was estimated to be 26-73 million, with a median of 38 million, corresponding to 1.7
million tons of shark biomass. These numbers were more than four times higher than
the FAO estimate of 0.39 million tons (Clarke et al., 2006b).
WildAid had launched a campaign for public awareness on shark finning, and claimed
that shark fin consumption had fallen by 70% in 2012 (Wild Aid, 2014) supported by
media reports (e.g. Tsui, 2013; Duggan, 2014). A study from 2015 discussed that
demand of shark fins did decrease but not to such a large extent and mainly because
of other reasons than conservation concerns (Eriksson and Clarke, 2015). A decline of
50% can be seen in the official trade statistics, however, this was mainly influenced by
the aforementioned change in customs commodity codes in 2012. Recalculation of
trade volumes using this information resulted in a decline of imports by 22% in 2012
from the 2008-2010 average.
22
Actual declines in fin trade volumes were also influenced by a campaign of the Chinese
government that banned certain luxury seafood products including shark fin soup at
official government banquets as part of an anti-corruption campaign. Shark fin
demand was also negatively influenced by increasing media reports about incidents
where artificial shark fin has been sold as real shark fin. Import numbers of shark fins
along with chondrichthyan capture production (sharks, skates, rays and chimaeras)
(FAO, 2014b) are also believed to be decreasing due to overfishing (Dulvy et al. 2008;
Field et al. 2009; Clarke et al. 2013; Davidson et al., 2015).
A media report about a survey by the Hong Kong Shark Foundation confirmed the
assumptions that the decrease of shark fin consumption might not be as significant as
reported, by stating that shark fin soup is still served in 98% of Hong Kong restaurants,
and that the foundation had expected the number to be much lower due to several
conservation campaigns and decreasing consumption trends reported in recent years
(Karacs 2016).

23
4 Global distribution of mercury and bioaccumulation of
methylmercury in marine organisms and in the human body
Mercury is emitted from natural as well as from anthropogenic sources, such as fossil
fuel consumption and gold mining. Mercury concentrations in the atmosphere and in
the environment increased dramatically with industrialization. Mercury exists in
different forms and the most toxic form, also the most relevant form in seafood
consumption, is MeHg as it is a severe neurotoxin, lipophilic and therefore highly
absorbable by animals and humans. It tends to accumulate and biomagnify along the
food chain and makes up 72-100% of total mercury in fish (Storelli et al., 2001).
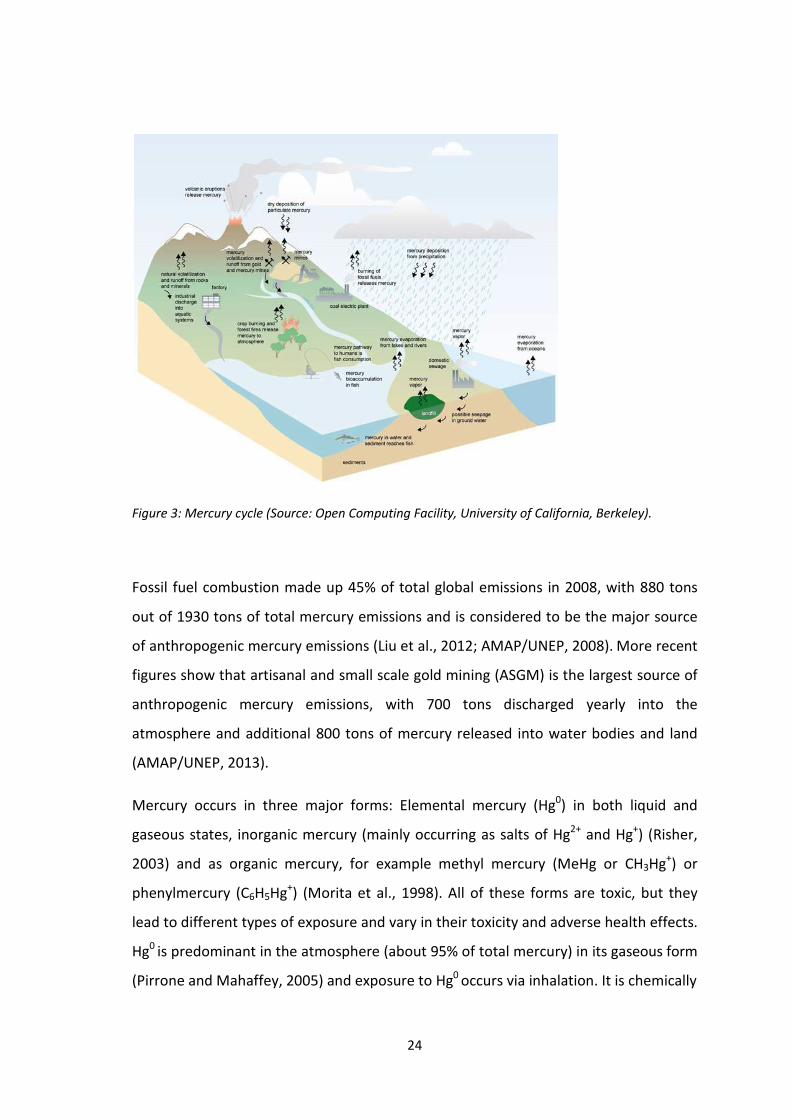
Mercury naturally occurs in geologic deposits and in the atmosphere. In geologic
formations, it occurs in particularly high concentrations in the areas of mercuriferous
belts, which are associated with tectonic plates. Mercury stored in geologic formations
can be released into the atmosphere by volcanoes, geothermal vents, erosion,
volatilization or by forest fires (Jitaru and Adams, 2004) (Figure 3). Apart from natural
processes, mercury is released by a number of anthropogenic processes, mainly fossil
fuel combustion (for power generation), mining of mercury and other elements,
especially gold mining, waste incineration and by industrial processes, for example
fertilizer production (Stein et al., 1996). Combustion processes release mercury into
the atmosphere, and its high volatility results in long residence times in the
atmosphere and transport over long distances (Jitaru and Adams, 2004).
Mercury is used for electrical products (e.g. batteries and lamps), thermometers, in the
chlor-alkali-production, and for the production of fungicides, herbicides and fertilizers.
In industrial processes it is most often released into the environment by leakages,
waste-water discharges or improper disposal of products. Anthropogenic release of
mercury into the atmosphere has been happening for centuries, but only the industrial
revolution led to serious increases of mercury in the atmosphere. Anthropogenic
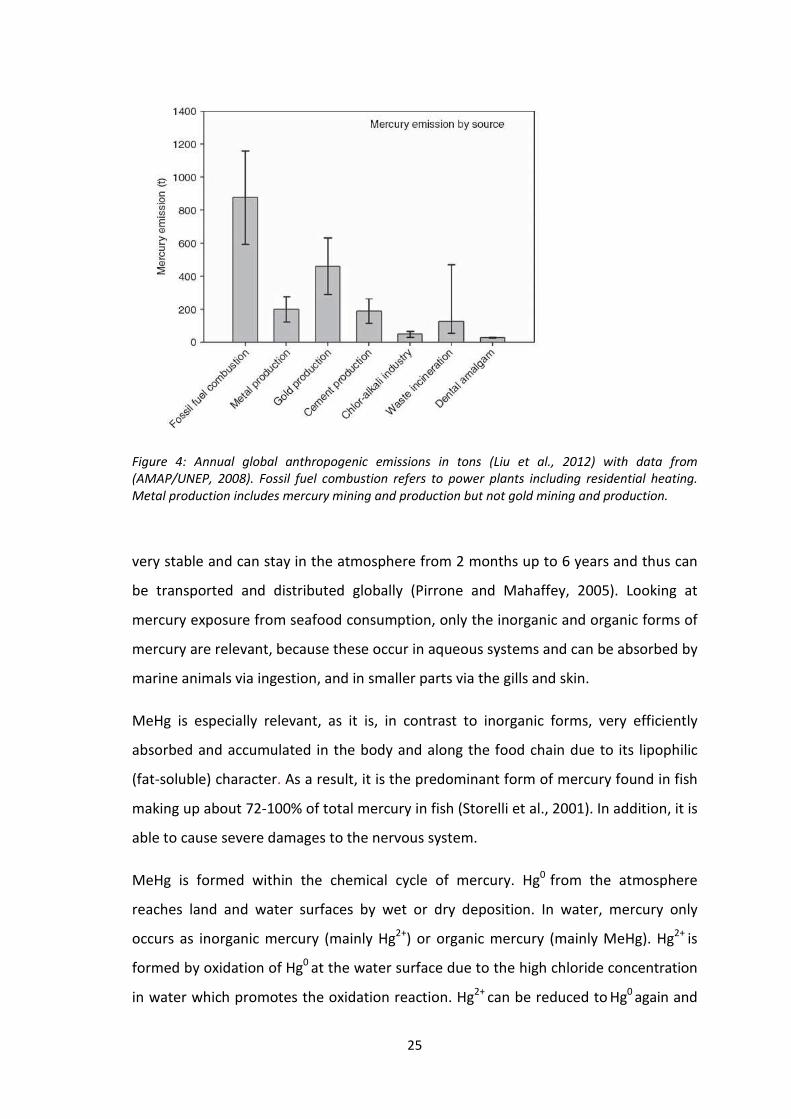
mercury emissions are estimated to make up 75% (Barkay et al., 2003) of the total
mercury emissions. The largest sources are fossil fuel plants for power generation and
gold production (Figure 4).
24
Figure 3: Mercury cycle (Source: Open Computing Facility, University of California, Berkeley).
Fossil fuel combustion made up 45% of total global emissions in 2008, with 880 tons
out of 1930 tons of total mercury emissions and is considered to be the major source
of anthropogenic mercury emissions (Liu et al., 2012; AMAP/UNEP, 2008). More recent
figures show that artisanal and small scale gold mining (ASGM) is the largest source of
anthropogenic mercury emissions, with 700 tons discharged yearly into the
atmosphere and additional 800 tons of mercury released into water bodies and land
(AMAP/UNEP, 2013).
Mercury occurs in three major forms: Elemental mercury (Hg0) in both liquid and
gaseous states, inorganic mercury (mainly occurring as salts of Hg2+ and Hg+) (Risher,
2003) and as organic mercury, for example methyl mercury (MeHg or CH3Hg+) or
phenylmercury (C6H5Hg+) (Morita et al., 1998). All of these forms are toxic, but they
lead to different types of exposure and vary in their toxicity and adverse health effects.
Hg0 is predominant in the atmosphere (about 95% of total mercury) in its gaseous form
(Pirrone and Mahaffey, 2005) and exposure to Hg0 occurs via inhalation. It is chemically
25
Figure 4: Annual global anthropogenic emissions in tons (Liu et al., 2012) with data from
(AMAP/UNEP, 2008). Fossil fuel combustion refers to power plants including residential heating.
Metal production includes mercury mining and production but not gold mining and production.
very stable and can stay in the atmosphere from 2 months up to 6 years and thus can
be transported and distributed globally (Pirrone and Mahaffey, 2005). Looking at
mercury exposure from seafood consumption, only the inorganic and organic forms of
mercury are relevant, because these occur in aqueous systems and can be absorbed by
marine animals via ingestion, and in smaller parts via the gills and skin.
MeHg is especially relevant, as it is, in contrast to inorganic forms, very efficiently
absorbed and accumulated in the body and along the food chain due to its lipophilic
(fat-soluble) character. As a result, it is the predominant form of mercury found in fish
making up about 72-100% of total mercury in fish (Storelli et al., 2001). In addition, it is
able to cause severe damages to the nervous system.
MeHg is formed within the chemical cycle of mercury. Hg0 from the atmosphere
reaches land and water surfaces by wet or dry deposition. In water, mercury only
occurs as inorganic mercury (mainly Hg2+) or organic mercury (mainly MeHg). Hg2+ is
formed by oxidation of Hg0 at the water surface due to the high chloride concentration
in water which promotes the oxidation reaction. Hg2+ can be reduced to Hg0 again and
26
released back into the atmosphere or it may be absorbed by organic particles or
organic matter (Ullrich et al., 2001) and precipitate with the particles to the seabed.
Once in the sediments, it may bind to sulfide groups to form mercury sulfide (HgS) and
be stored in the sediments in this non-bioavailable form. Alternatively Hg2+ can bind to
organic alkyl groups and in this way form organic mercury, with MeHg being the most
common form. This process is called mercury methylation (Stein et al., 1996). MeHg
can be formed by abiotic and biotic processes, but it is primarily produced by
anaerobic sulfate-reducing bacteria in the sediments (Mason and Benoit, 2003). The
resulting organic mercury compound is highly lipophilic, which facilitates its transport
into the cells of organisms, and is one of the reasons why MeHg is so toxic. Without
methylation, mercury would be stored in the sediments, not being bioavailable to any
marine organism. The sulfate reducing bacteria however turn it into a highly
bioavailable form and in this way turn the sediments from a mercury sink into a
mercury source (Gochfeld, 2003).
MeHg is taken up from the water column by marine organisms at lower trophic levels
and bioaccumulates in their tissues, and as it is difficult to eliminate by the body, the
uptake rate is usually higher than the excretion. When these organisms are eaten by
marine organisms of higher trophic levels, mercury is transferred from the prey to the
predator. As organisms of higher trophic levels need to consume more biomass in
order to survive, their intake of mercury is higher. In this way, the concentration of
mercury in the body tissue increases along the food chain, a process called
biomagnification. Francesconi and Lenanton (1992) found mean MeHg levels of 0.002
µg/g in macroalgae, 0.01 µg/g in seagrass, 0.05 µg/g in echinoderms, 0.09 µg/g in
polychaetes, 0.14 µg/g in molluscs, 0.25 µg/g in crustaceans, 0.46 µg/g in smaller fish
species and 2.3 µg/g in large predatory fish. These findings confirm that organisms of
higher trophic levels usually have higher mercury concentrations in their tissue. Apart
from the trophic position of an animal, also its ages plays an important role, as
exposure time and accumulated MeHg increase with age. MeHg uptake by marine
organisms of higher trophic levels does not only work via ingestion but also via the skin
and gills (Olson et al., 1973; Phillips and Buhler, 1978; Kudo and Mortimer, 1979; Klinck
et al., 2005). However the water column only contains small amounts of MeHg, and
27
the uptake via ingestion is about a seven fold higher compared to direct uptake from
the water column (Monteiro et al., 1996).
Of ingested mercury 95% is absorbed (Clarkson, 2002) by the digestive system and
distributed to other parts of the body through the circulatory system. Its lipophilic
character facilitates its transport through cell membranes and the blood brain barrier.
For Hg2+ it is more difficult to cross the blood brain barrier and it mainly accumulates in
the liver and kidney, where it is broken down and excreted from the body. Possible
health implications of Hg2+ exposure are damage to the gastrointestinal tract or to the
kidneys including kidney failure (Hać et al., 2000).
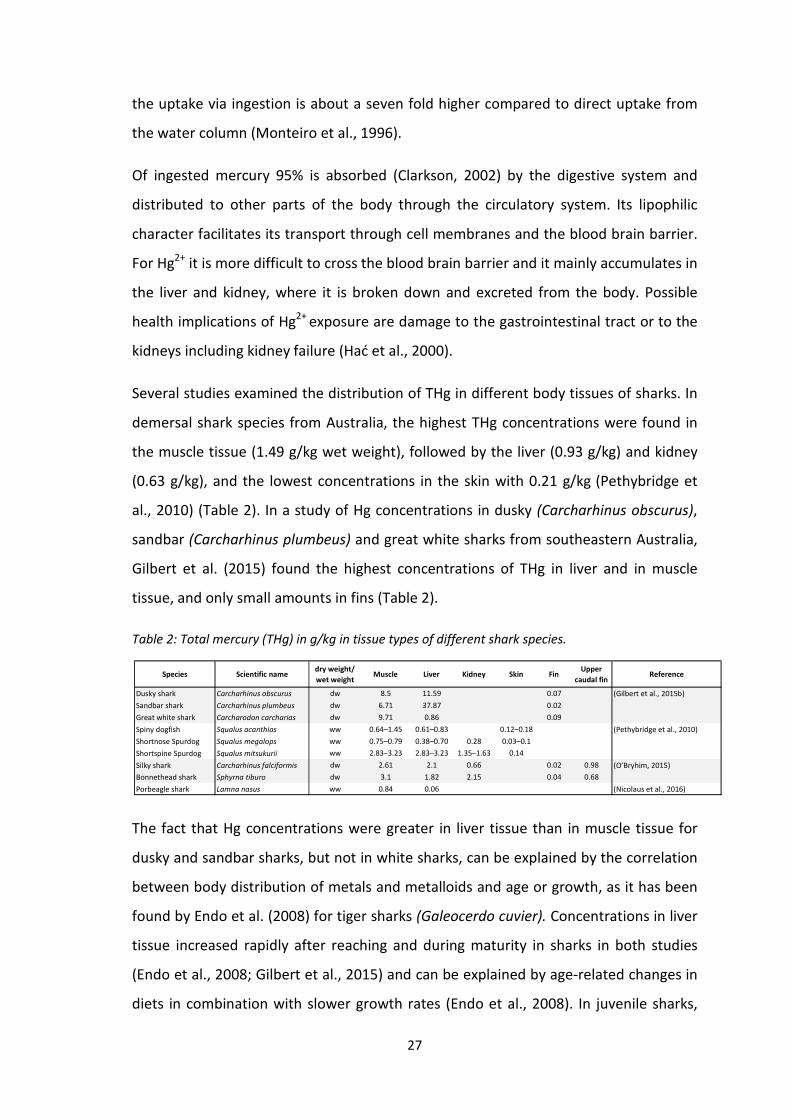
Several studies examined the distribution of THg in different body tissues of sharks. In
demersal shark species from Australia, the highest THg concentrations were found in
the muscle tissue (1.49 g/kg wet weight), followed by the liver (0.93 g/kg) and kidney
(0.63 g/kg), and the lowest concentrations in the skin with 0.21 g/kg (Pethybridge et
al., 2010) (Table 2). In a study of Hg concentrations in dusky (Carcharhinus obscurus),
sandbar (Carcharhinus plumbeus) and great white sharks from southeastern Australia,
Gilbert et al. (2015) found the highest concentrations of THg in liver and in muscle
tissue, and only small amounts in fins (Table 2).
Table 2: Total mercury (THg) in g/kg in tissue types of different shark species.
The fact that Hg concentrations were greater in liver tissue than in muscle tissue for
dusky and sandbar sharks, but not in white sharks, can be explained by the correlation
between body distribution of metals and metalloids and age or growth, as it has been
found by Endo et al. (2008) for tiger sharks (Galeocerdo cuvier). Concentrations in liver
tissue increased rapidly after reaching and during maturity in sharks in both studies
(Endo et al., 2008; Gilbert et al., 2015) and can be explained by age-related changes in
diets in combination with slower growth rates (Endo et al., 2008). In juvenile sharks,
Species Scientific namedry weight/
wet weightMuscle Liver Kidney Skin Fin
Upper
caudal finReference
Dusky shark Carcharhinus obscurus dw 8.5 11.59 0.07 (Gilbert et al., 2015b)
Sandbar shark Carcharhinus plumbeus dw 6.71 37.87 0.02
Great white shark Carcharodon carcharias dw 9.71 0.86 0.09
Spiny dogfish Squalus acanthias ww 0.64–1.45 0.61–0.83 0.12–0.18 (Pethybridge et al., 2010)
Shortnose Spurdog Squalus megalops ww 0.75–0.79 0.38–0.70 0.28 0.03–0.1
Shortspine Spurdog Squalus mitsukurii ww 2.83–3.23 2.83–3.23 1.35–1.63 0.14
Silky shark Carcharhinus falciformis dw 2.61 2.1 0.66 0.02 0.98 (O’Bryhim, 2015)
Bonnethead shark Sphyrna tiburo dw 3.1 1.82 2.15 0.04 0.68
Porbeagle shark Lamna nasus ww 0.84 0.06 (Nicolaus et al., 2016)

28
faster growth rates caused dilution effects in the ratio of body weight to mercury
concentration. Liver concentrations in great white sharks were lower in relation to
muscle tissue concentrations because all of the white sharks in the study were
juveniles (Gilbert et al., 2015). O’Bryhim (2015) found highest THg concentrations in
the muscle tissue of bonnethead sharks (Sphyrna tiburo) and silky sharks from the
Atlantic Coast of Florida, followed by the kidney and liver, with lowest concentrations
in the fins. The highest THg levels among the different fin types were found in the
upper caudal fins (Figure 2) which the authors explained by a higher concentration of
muscle tissue in this type of fin.
While muscle tissue contains mainly MeHg (Storelli et al., 2001), shark liver has been
found to contain primarily inorganic mercury (Branco et al., 2007; Nam et al., 2011).
This is because MeHg is believed to be demethylated by binding to selenium and to be
converted into inorganic mercury, which facilitates the excretion of MeHg (Nam et al.,
2011). However, for this detoxification process, a selenium-mercury molar ratio of at
least 1:1 is necessary. Below this ratio, MeHg continues to accumulate in the liver and
in other organs (Das et al., 2000; Storelli and Marcotrigiano, 2002; Endo et al., 2002;
Endo et al., 2006) and because of this high THg levels in liver tissue might indicate that
the organism did not have high enough selenium levels in order to break-down and
excrete mercury.
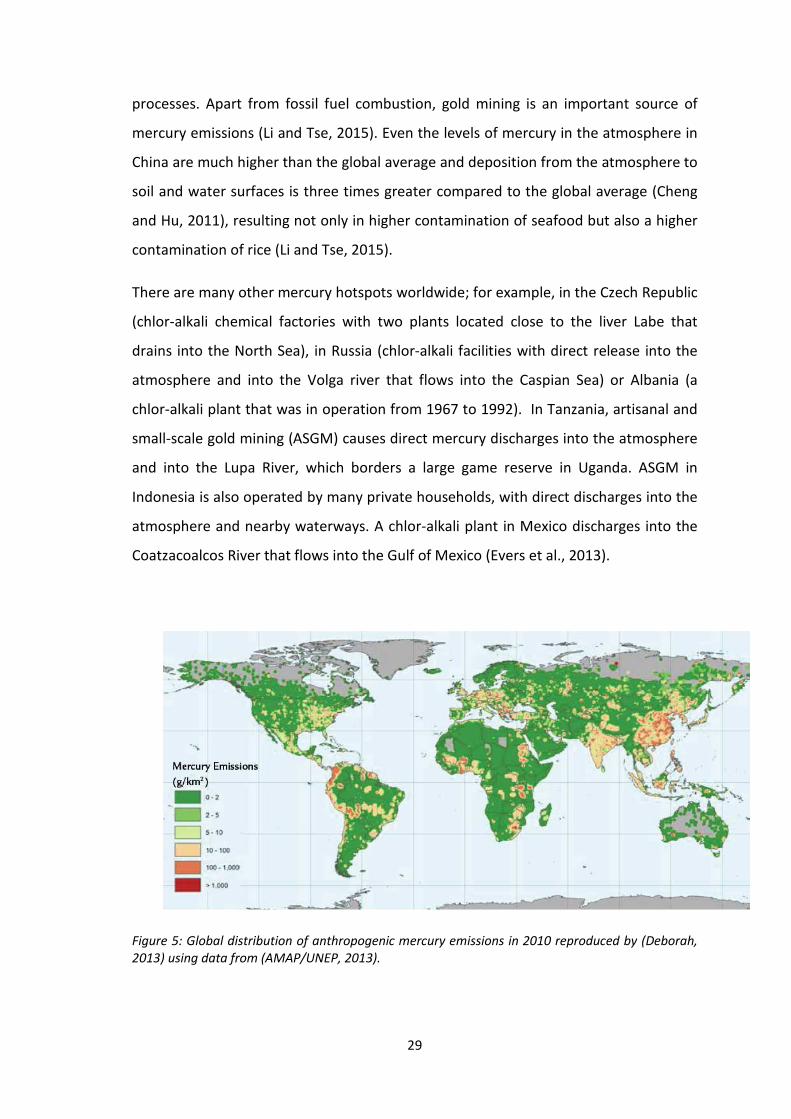
The global distribution of anthropogenic mercury emissions (Figure 5) shows areas
which are expected to have higher mercury concentrations in the environment and in
food sources. Asia causes more than half of the global mercury emissions and China’s
rapid economic growth made it the leader in mercury emissions (Jiang et al., 2006;
Zhang and Wong, 2007) with one third of global mercury emissions in 1999 (Streets et
al., 2005).
Many developing countries have such a large share in mercury emissions because they
lack control measures and mitigation technologies, e.g. flue gas cleaning and emission
controls (Cheng and Hu, 2011). Another reason is that the manufacture of many
consumer products for the rest of the world, especially Western countries, has been
outsourced to China, which has to supply the energy (mainly fossil fuels) for these
29
processes. Apart from fossil fuel combustion, gold mining is an important source of
mercury emissions (Li and Tse, 2015). Even the levels of mercury in the atmosphere in
China are much higher than the global average and deposition from the atmosphere to
soil and water surfaces is three times greater compared to the global average (Cheng
and Hu, 2011), resulting not only in higher contamination of seafood but also a higher
contamination of rice (Li and Tse, 2015).
There are many other mercury hotspots worldwide; for example, in the Czech Republic
(chlor-alkali chemical factories with two plants located close to the liver Labe that
drains into the North Sea), in Russia (chlor-alkali facilities with direct release into the
atmosphere and into the Volga river that flows into the Caspian Sea) or Albania (a
chlor-alkali plant that was in operation from 1967 to 1992). In Tanzania, artisanal and
small-scale gold mining (ASGM) causes direct mercury discharges into the atmosphere
and into the Lupa River, which borders a large game reserve in Uganda. ASGM in
Indonesia is also operated by many private households, with direct discharges into the
atmosphere and nearby waterways. A chlor-alkali plant in Mexico discharges into the
Coatzacoalcos River that flows into the Gulf of Mexico (Evers et al., 2013).
Figure 5: Global distribution of anthropogenic mercury emissions in 2010 reproduced by (Deborah,
2013) using data from (AMAP/UNEP, 2013).
30
5 Biological and ecological factors that influence MeHg
concentration in shark tissue
Mercury levels vary a lot, even between species in the same studies. There are
multiple factors that influence accumulation of mercury in sharks, such as body length,
age, feeding habits, trophic position, reproduction mode and geographical factors.
There are currently no available studies in the available literature which examined
correlations between MeHg levels in shark fins and these factors. Therefore,
correlations are discussed based on the findings of studies examining MeHg in muscle
tissue.
Body Length
Most studies that examined the correlation between mercury levels in shark tissue and
body length found a positive correlation. For blacknose, blacktip, and sharpnose sharks
from Southwest Florida, intraspecific variation in Hg concentrations could be related to
total length (Rumbold et al., 2014). In a study with 17 shark species from the South
African East Coast, total intraspecific length was found to be the dominant factor for
THg levels in muscle tissue (McKinney et al., 2015).
Maz-Courrau et al. (2011) examined 68 samples of blue, short fin mako, silky and
smooth hammerhead (Sphyrna zygaena) shark at the Pacific and Gulf Coast of Baja
California, Mexico and found a positive relationship between size and mercury
concentrations for all species except blue shark. This exception can be explained by
other factors like feeding habits, metabolism (Maz-Courrau et al., 2011), and is
explained later in this chapter.
In 16 demersal shark species from Southeast Australia Pethybridge et al. (2010) found
higher mercury concentrations in the muscle tissue of larger and supposedly older
individuals. Several other studies found similar patterns (Walker, 1976, 1988; Taguchi
et al., 1979; Hueter et al.,1995).
31
Body length, however cannot be regarded as an independent, isolated factor. Body
length, age, trophic level and also feeding habits that vary with age are dependent
factors, i.e. they influence each other. The typical correlation between mercury
concentrations and size (body length or weight) in fish, is caused by the fact that
mercury bioaccumulates with age (Boudou and Ribeyre, 1997; Driscoll et al. 2013).
Therefore it is difficult to define which of these factors has the most influence on
mercury accumulation for a specific species.
McKinney et al. (2015) found that the correlation between mercury levels and body
length was significant for most of the sharks in the study. Missing correlations for the
smooth hammerhead sharks could be explained by the fact that all smooth
hammerhead sharks in the study were juveniles. In most available studies, influences
of different factors were found. For example, McKinney et al. (2015) could relate
interspecific and intraspecific variations of mercury levels to body length, as the
dominant factor (age was not assessed) and to tropic position and feeding habits.
Age and growth rate
The correlation between age and mercury levels is not only influenced by a longer
exposure time and the fact that mercury accumulates with time, but also by the fact
that sharks have different diets in different life phases. For example neonate and
juvenile sharks were found to have a higher percentage of crustaceans in their diet
compared to adult sharks (Medved et al., 1985; Bornatowski et al., 2014). Older
(larger) sharks usually prefer prey of a higher trophic level, or their habitats are
different than those of younger (smaller) sharks (Cortés, 1999). This also means that
where increasing mercury levels are found to correlate with body length or age, the
underlying reasons for higher mercury levels could also be changes in foraging habitats
or trophic position (Rumbold et al., 2014).
Some studies also connected mercury levels to age-related growth rates. In a study of
five demersal sharks from Brazil, young sharks had lower mercury levels compared to
adult sharks and the authors speculated that, apart from shorter exposure times, the
32
greater growth rates of juvenile sharks might be an additional factor for the low
mercury levels (de Pinho et al., 2002).
In life stages with faster growth rate, mercury might be rather diluted than
accumulated. A study from Mexico about mercury in top predator fish did not find any
mercury-length correlation in some species and attributed this to their moderate to
rapid growth rates compared to the slower growth rates of other species in the same
study (García-Hernández et al., 2007). In tiger sharks in a study from Japan, an
exponential increase of mercury levels was observed at about 270 cm body length. The
authors concluded that this phenomenon was the result of continuous mercury intake
at a slowing growth rate at the start of maturity (Endo et al., 2008).
Trophic position
Trophic level and related diet and ecology, are some one of the most important factors
for different interspecific metal concentrations (Vas & Gordon, 1993; Turoczy et al.,
2000; Pethybridge et al., 2010). For 17 shark species of South Africa, trophic position
and body length explained most of the interspecific variations in Hg levels (McKinney
et al., 2015). Pethybridge et al. (2010) found low mercury levels in species from lower
trophic levels. However, as with all factors that influence mercury levels in shark body
tissue, other factors can still have a stronger influence. For example, Pethybridge et al.
(2010) also found low Hg levels in the sevengill shark (Notorynchus cepedianus) which
had low Hg levels despite its high trophic position.
Feeding habits
Feeding habits were found to be a significant factor apart from body length for 17
South African shark species (McKinney et al., 2015). High THg levels were found in
ragged-tooth, Java, and white sharks which preferentially feed on teleost fish and
other chondrichthyans. The lowest THg levels were found in smooth hammerhead,
spinner (Carcharhinus brevipinna) and tiger sharks which preferably feed on
cephalopods or teleosts and/or reptiles (Cortés, 1999). Species which feed on
33
cephalopods and crustaceans mainly accumulate cadmium (cephalopods) and arsenic
(crustaceans) instead of mercury compared to piscivorous species (Bustamante et al.,
1998; Storelli and Marcotrigiano, 1999; Storelli and Marcotrigiano, 2000). For
especially high THg levels found in scalloped hammerhead shark, the authors explained
that apart from other factors like body length and trophic position and prey items,
their habit of foraging at greater depth would be an additional important factor.
Pethybridge et al. (2010) found higher mercury concentrations in deep-demersal
species of 16 demersal sharks from Australia and attributed this finding to the fact that
they forage in deep-sea environments which are a sink for contaminants (Tatsukawa
and Tanabe, 1984). Moreover, deepsea sharks are longer-lived, and have higher
trophic positions than shark species living in shallower waters. Maz-Courrau et al.
(2011) found highest THg levels in silky shark, an epipelagic predator that is typically
found in coastal areas, compared to lower levels in blue shark, which has pelagic
feeding habits. Mercury contamination tends to be higher in coastal areas with a
higher abundance of anthropogenic mercury sources, which causes coastal prey
species to be particularly exposed.
Geographic Location
Despite sharks being highly migratory species, several studies found correlations
between the areas where sharks were caught and their mercury levels. Maz-Courrau
et al. (2011) found average mercury concentrations in samples of smooth
hammerhead sharks of the Pacific coast of Mexico to be about ten times higher than
those from a Mediterranean study (Storelli et al., 2003). THg concentrations in South
African sharks were higher than in their conspecifics from the North-east Atlantic coast
(US), North Pacific (US, Japan, Mexico) and South Pacific (Australia, Chile, Papua New
Guinea) (McKinney et al., 2015). However, THg levels were lower compared to the
same species from the Mediterranean Sea. Mediterranean fish of higher trophic levels
have particularly high Hg body burdens, which are believed to be the result of lower
growth rates and greater Hg bioavailability due to higher mercury emissions in the
area (Cossa et al., 2012). However, the same authors found similar levels of MeHg
34
when comparing the Mediterranean Sea, with the Tasmanian margin and the Celtic
Sea (Cossa et al., 2008), two regions where lower mercury levels in sharks have been
reported compared to the Mediterranean Sea (Pethybridge et al., 2010). It has to be
considered that, apart from local mercury emissions, other factors, such as a different
food web structure, growth rates could be the reason for high Hg levels in shark tissue
(Gilbert et al., 2015).
García-Hernández et al. (2007) found similar levels in smooth hammerhead sharks of
the Gulf of California (Mexico) compared to smooth hammerheads of the
Mediterranean Sea. The peninsula of Baja California Sur, to the west side of the Gulf, is
considered to be an unpolluted pristine region with little mercury emissions by several
authors that undertook studies of mercury levels in sharks in this area (Maz-Courrau et
al., 2011; Escobar-Sánchez et al., 2011; Barrera-García et al., 2012). One of these
authors underlines that higher mercury concentrations in this region could be caused
by natural Hg sources including hydrothermal vents associated with the presence of
the San Andres Fault (Barrera-García et al., 2012).
High mercury levels in South African sharks, compared to conspecifics from other
regions can be explained by the proximity of their feeding habitats to South African
regions with high mercury emissions or discharges (McKinney et al., 2015). For
example, a mercury processing plant in the region of KwaZulu-Natal has been reported
to discharge mercury into adjacent waters in 1990 (Papu-Zamxaka et al., 2010).
Moreover, South Africa’s energy supply is exclusively covered by coal power plants.
Sex and maternal transfer
Shark species have different ways of reproduction. Some are viviparous, i.e. they give
live birth. Viviparous placental species, for example mothers of hammerhead sharks
(Sphyrna spp.) or blue sharks have a placental connection to their embryos for the
entire gestation period (Balon, 1975; Dulvy and Reynolds, 1997). In Blacktip sharks
(Carcharhinus limbatus) (viviparous), the placental connection to their embryos is only
established after the first 8 weeks of gestation. In the first weeks of gestation, embryos

35
are nourished by a yolk sac (Castro 1996). Oviparous shark species lay fertilized eggs
while in the case of ovoviviparous sharks, embryos stay inside the mother’s body
without a placental connection, being nourished by a yolk sac for the entire gestation
period. Members of the family of requiem sharks (Carcharhinidae), such as silky shark,
oceanic whitetip, blacktip reef shark (Carcharhinus melanopterus), copper shark
(Carcharhinus brachyurus), dusky and sandbar shark belong to the viviparous sharks.
Shortfin mako sharks and great white sharks (both belonging to the family of mackerel
sharks (Lamnidae)), and thresher sharks (Alopiidae) are ovoviviparous, with embryos
feeding on other ova produced by the mother after the yolk sac is absorbed (Dulvy and
Reynolds, 1997).
Lower mercury levels observed in female sharks can be the result of maternal transfer
of mercury from the mother to the embryos or developing ova (Walker, 1976). In a
study of five shark species from the Florida east coast, THg levels in embryos of
blacktip sharks, bonnethead sharks (Sphyrna tiburo) and Atlantic sharpnose sharks
(Rhizoprionodon terraenovae), were between 20 and 53% of the THg levels of adults
sharks of the same species (Adams and McMichael 1999). For juvenile sharks, high
mercury levels can also be the result of higher tendency to forage in coastal areas
compared to adults sharks (Rumbold et al., 2014).
Pethybridge et al. (2010) found different mercury levels between male and female
sharks, which were partly related to the fact that females of most species were larger
than the males. However, a normalisation of THg levels with size showed that males
had higher mercury levels than females, which could be the result of maternal
transfer. The phenomenon of maternal transfer could also be observed for other
Carcharhinus species (Lyle, 1984; de Pinho et al., 2002) and for white sharks (Lowe et
al., 2012; Mull et al., 2012).
Some studies did not find any significant correlation between THg levels in sharks and
maternal transfer for tiger sharks (Endo et al. 2008), common thresher (Alopias
vulpinus) and shortfin mako sharks (Suk et al. 2009), blue sharks (Escobar-Sánchez et
al, 2011), and 17 different shark species of the South African coast (McKinney et al
36
2015, ). An explanation could be that the majority of sharks in these studies were
juveniles.
There are other factors, apart from body length, that can influence correlations
between mercury levels and sex, for example different growth rates in males and
females (Walker, 1976; Marcovecchio et al., 1991; de Pinho et al., 2002; Geraghty et
al., 2013). Male sandbar and dusky sharks from Australia had higher growth rates
compared to juvenile females and slower growth rates after reaching maturity.
Metabolism
Different mercury levels in different shark species might also be the caused by their
metabolism. Suk et al. (2009) studied mercury levels in five shark specie of the Florida
east coast and found particularly high levels in shortfin mako shark, with an average
THg concentration of 2.90 μg/g in the muscle tissue of the largest individuals (nearly 3
times the EU safety limit of 1 μg/g). The shortfin mako is one of the few pelagic fish
species with an excess of mercury relative to selenium in its muscle tissue (Kaneko and
Ralston 2007). Selenium binds to MeHg and in this way weakens its toxicity of MeHg
(Raymond and Ralston 2004).
Maz-Courrau et al. (2011) did not find a significant THg-body length correlation for
blue sharks and explained this by more efficient mercury elimination mechanisms of
this species, because of a higher synthesis of metallothioneine (Núñez Nogeira et al.,
1998). Increasing Hg concentrations in sharks with decreasing Se:Hg molar ratios were
also found by a number of other authors (Burger et al., 2012; Bergés-Tiznado et al.,
2015).
Temporal trends
Because mercury is persistent in the environment and the positive trends in the use of
fossil fuels and gold-mining, mercury levels in the environment and organisms can be
expected to rise as well. McKinney et al. (2015) found 50% higher mercury levels in
37
shortfin mako sharks sampled between 2005 and 2010 (161-220cm body length)
compared to the shortfin mako sharks of similar sizes (110-260 cm) from the same
geographical area in 1980 (Watling et al. 1981).
38
6 Effects of mercury on human health
Fish consumption is the main source of mercury exposure to humans (Mergler et al.
2007; Escobar-Sánchez et al., 2014; McKinney et al., 2015). Consumption of top
predators such as whale, shark, swordfish and tuna bear the highest exposure risks for
humans, as mercury levels in seafood biomagnify along the food chain. About 70 to
100% of mercury in fish (more than 90% in muscle tissue) is MeHg, its most toxic form
(Storelli et al., 2002a; Storelli et al., 2002b; Burger and Gochfeld, 2004).
Mercury is ranked as the third most toxic substance after lead and arsenic in the list of
most toxic elements by the US Agency for Toxic Substances and Disease Registry (US
ATSDR, 1999). Exposure to MeHg can have various negative effects on the human
body, including the nervous system as the most sensitive target (Aschner, 2002),
endocrine system and reproductive system, among others. Exposure of embryos and
children during development are of special concern due to the damages that MeHg
can cause to the developing brain and the nervous system. The populations of China
and Hong Kong are particularly affected as seafood represents the main protein source
in their diet.
Neuro- and neurodevelopmental toxicity of mercury
The presence of mercury in the nervous system leads to various effects, including
abnormal tissue formation and cell damage in the brain, causing impairments of motor
function, visual function, memory function, attention and speech processing (Tsubaki,
1975; Takeuchi, 1977; Chang et al., 1977; Reuhl et al., 1981), neurocognitive deficits
and neuromotor disabilities (Bose-O’Reilly et al., 2010). MeHg blocks Ca2+ ion channels
in the axon membranes of neurons, which are essential for the interneuronal
information transfer (Shafer and Atchison, 1989; Rossi et al., 1993). It also damages
the sheaths of myelinated axons and in this way impairs impulse conduction of signals
in the nervous system. Mercury has also been found to damage the blood brain barrier
and facilitate access of other toxic metals to the brain and to impair the synthesis of
39
actin and tubulin, important components of the neuronal cell structure and essential
for a number of detoxification processes (Kazantzis, 2002). Mercury targets granule
cells in the cerebellum of both, adults and neonates. The fact, that damages in
neonates and children lead to much more severe symptoms can be explained by the
role of mercury in the phase of neurological development. The structure of the mitotic
spindle, which eukaryotic cells use to separate their chromosomes during cell division,
is formed by microtubules. The assembly of such microtubules requires free sulfhydryl
groups on monomeric tubulin. Mercury binds those sulfhydryl groups and in this way
inhibits the assembly of immature microtubules, which results in destabilized
microtubules causing impaired mitoses (cell division process) and perturbation of
other critical processes in the development of the brain (Graff et al., 1997). More
mature microtubules are in contrary to immature microtubules resistant to
destabilization through MeHg (Philbert et al., 2000).
Neurological biomarkers of elevated mercury exposure are well documented in major
historic incidents of mercury poisoning. Excessive releases of MeHg via the wastewater
of the Chisso Cooperation’s chemical factory in the Minamata Bay, Japan, between
1932 and 1968, led to elevated bioaccumulation in fish and shell fish and finally to
mercury poisoning of the local population in the Kumamoto prefecture (Harada, 1995).
Several hundred people died and about 9000 people showed severe neurological
symptoms (Tsubaki and Takahashi, 1986). The factory primarily produced
acetaldehyde, using mercury sulfate as a catalyst. The first human victims were
discovered in 1956 and 2273 official patients of the so-called Minamata-disease were
registered by 2011 (Harada, 1995). Both adults and children showed symptoms of
mercury poisoning, but most severely affected were children who had been indirectly
exposed to mercury as foetuses via the placental connection to their mother and/or as
babies via mercury transferred over their mother’s milk. The mothers developed
weaker symptoms of mercury poisoning as most of the mercury in their body
transferred to their foetuses. Symptoms are characterized by different
neurodevelopmental and neurocognitive impairments, such as cerebral palsy (a
neurological disorder appearing in early childhood with permanent impairment of
muscle coordination and balance), deformation of limbs, impairment of growth,

40
disturbed coordination, hyperactivity, squints, muscular spasms and uncontrollable
writhing, vision and speech impairment, paresthesias (sensation of tingling, tickling,
pricking, or burning on the skin), neuralgias (pain in the nerves), dermographism (red
weals appearing on the skin), malfunctions of smell, taste and hearing, seizures and in
some cases coma and death (Harada, 1978).
The fact that mercury from the incident was transferred from mothers to their
embryos was discovered by Masazumi Harada in 1968, when he had the idea to
measure mercury concentrations in umbilical cords, which in the Japanese tradition
are preserved, enabling him to collect them from residents in the area. In this way, he
was able to find a correlation between the mercury concentrations in umbilical cords
and the Minamata incident (Nishigaki and Harada, 1975). In 1965 a similar outbreak
was detected in the Niigata Prefecture, caused by the excessive release of MeHg into
the Agano river basin by the Showa Electrical chemical factory (Takizawa et al., 1970).
In Iraq, a mercury poising occurred throughout the country between 1971 and 1972
due to consumption of flour, wheat and barley that had been treated with MeHg
containing fungicides (Bakir et al., 1973). 6530 people showed symptoms of mercury
poisoning and 459 deaths were reported. Reported symptoms were loss of sensation
in hands, feet and around the mouth, loss of coordination, impairment of vision,
speech and hearing, and blindness. Fatalities were caused by failure of the central
nervous system and in rare cases of the cardiovascular system (Bakir et al., 1973).
Similar incidents occurred in Pakistan and Guatemala (Bakir et al., 1973).
Cohort studies conducted in the Seychelles, Faroe Islands and New Zealand have
examined the effects of MeHg exposure of children whose mothers ate fish and whale
meat during pregnancy. The ‘high exposure group’ of mothers in the New Zealand
study consumed fish, including shark, 3 times a week and had mercury hair levels
above 6 µg/g. The children of this group showed lower scores in their mental and
motoric development at the age of four, compared to less exposed groups (Kjellström
et al., 1986; Kjellström et al., 1989).
Meat and intestines of pilot whales are traditionally consumed by the population of
the Faroe Islands. Mothers of the test group ate episodically pilot whale meat, which

41
usually has high mercury levels, and frequently ate fish. Their children underwent
different tests at the age of 7 and 14, where deficits in attention, memory and
language faculty were observed, and under-developed motoric and visuospatial
abilities. These symptoms were correlated to prenatal MeHg exposure (Debes et al.,
2006; Grandjean et al., 1997).
The study from the Seychelles did not find any evident correlation between prenatal
MeHg exposure and mercury related health effects. Mothers in the test group
frequently consumed fish, however not including shark or whale meat contrary to the
other two studies. Cernichiari et al. (1994) found higher mean mercury levels in
maternal hair of test groups in the Seychelles (5.8 µg/g) compared to test groups from
the Faroer Islands (4.5 µg/g) (Grandjean et al., 1992). However, Hg concentration in
hair is also influenced by hair colour, hair type and permanent hair treatment
(Grandjean et al., 1992). In comparison, populations with minimum fish consumption
have average mercury hair levels between 0.1 and 1.0 µg/g (Stern et al., 2001 (US);
Pesch and Wilhelm, 2002 (Germany); Björnberg et al., 2003 (Sweden)).
Exposure to mercury from seafood consumption is not the only way to cause
symptoms of mercury poisoning. There are many reported cases of children who were
exposed to mercury by interior latex paint (Agocs et al., 1990) and of children exposed
to phenylmercury, another organic form of mercury, used as a fungicide in nappy rinse
(Langford and Ferner, 1999). Symptoms observed in these cases were rashes, limb
pain, swollen nodes, peripheral neuropathy (damage to or disease affecting nerves,
which may impair sensation, movement, gland or organ function), hypertension, and
kidney dysfunction (Agocs et al., 1990; Langford and Ferner, 1999).
Immunotoxicity of mercury
Mercury exposure leads to impairment of the immune system most likely by
preventing the production and function of polymorphonuclear leucocytes (PMNs), a
type of white blood cells (leucocytes). Leucocytes are an essential part of the immune
system, destroying bacteria, viruses, toxic substances and other exogenous threats to
the body (Wada et al., 2009). Mercury exposure by ingestion often causes increased
42
levels of bacteria, yeasts and molds, which protect the body by absorbing excess
mercury. Fungi, such as Candida Albicans, which occurs naturally in the human gut
flora, can be destroyed by antibiotics, and this may lead to an enormous release of
heavy metals in adults with a high body burden (Rice et al., 2014).
A high mercury body burden has been correlated to a number of different immune or
autoimmune diseases, for example allergies, psoriasis, asthma, arthritis, autism,
attention deficit hyperactivity disorder, epilepsy, multiple sclerosis, thyroiditis,
schizophrenia and scleroderma (Warren, 1989; Schofield, 2005; Johnson and Atchison,
2009; Singh, 2009; Gardner et al., 2010; Hybenova et al., 2010; Landrigan, 2010). In a
study from the Amazonas region, increased Malaria infections were correlated to
elevated occupational mercury exposure of gold miners (Silbergeld et al., 2005).
Cardiovascular toxicity of mercury
In the 14-year follow-up of the already mentioned cohort study from the Faroe Islands,
an alteration of heart function was observed in the test group of 14 year-old children
whose mothers consumed pilot whale meat and fish during pregnancy (Grandjean et
al., 2004). The children showed a decreased heart rate variability, which might be
caused by MeHg damage to brainstem nuclei. The brainstem is the posterior part of
the brain, which provides important nerve connections for the motor and sensory
functions. Among others, it is essential for control of cardiac and respiratory functions.
Sørensen et al. (1999) reported similar observations, with a 47% decrease in heart rate
variability in a study of 7-year old Faroese children with prenatal mercury exposure.
In a study from Korea, an increase in children’s cholesterol levels, which is a risk factor
for coronary or cardiovascular diseases, has been associated to MeHg exposure (Kim et
al., 2005), and in a study from the Seychelles, elevated blood pressure levels in
teenage boys were correlated with prenatal mercury exposure (Thurston et al., 2007).
MeHg exposure from latex paint evoked hypertension in children (Agocs et al., 1990)
and in a study from the Brazilian Amazon hypertension in adults has been associated
43
with mercury exposure (Fillion et al., 2006). In a study from Finland, men with high fish
consumption were found to have exceptionally high mortality associated with
coronary heart disease (Salonen et al., 1995).
Effects on the endocrine system
The endocrine system consists of glands that produce hormones that regulate almost
every biological process, for example metabolism, growth, development, sexual
maturation reproduction, sleep, mood, immune functions and memory. The glands
producing these hormones include the pituitary gland, thyroid gland, parathyroid
glands, adrenal glands, pancreas, ovaries, and testicles. Endocrine disruption can be
caused by natural or man-made chemicals, which either target the hormone itself, the
glands where the hormones are produced or the hormone receptors, with dramatic
effects on the regulation of body functions. Insulin, estrogen, testosterone and
adrenaline belong to the hormones most affected by mercury exposure (Rice et al.,
2014).
Autopsy studies have found that the thyroid and the pituitary have an affinity to
accumulate mercury, even more than the kidneys (Tan et al., 2009). Mercury occupies
iodine-binding receptors, which leads to the inhibition or alteration of hormone
production in the thyroid (McGregor and Mason, 1991; Wada et al., 2009). A
decreased activity of the thyroid (hypothyreosis) or an increased activity of the thyroid
(hyperthyreosis) can lead to disruptions of the cardiovascular system, the nervous
system, the psyche, the gastro-intestinal system, metabolism, skin, muscle and
skeleton system and sexual functions. A hyperthyreosis can for example lead to
acceleration of heartbeat (tachycardia), nervousness and weight loss. A hypothyreosis
can lead to a deceleration of the heartbeat (bradycardia), increase in weight,
depression or loss of libido.
Mercury has also been found to accumulate in the pituitary glands of humans
(Kanabrocki et al., 1976; Nylander, 1986; Erfurth et al., 1990) and animals. While in
tested animals, mercury had adverse effects on the pituary (Thorlacius-Ussing et al.,
1985; Danscher et al., 1990) and other glands (thyroid, adrenal, gonads) (Ghosh and
44
Bhattacharya, 1992; Thaxton et al., 1975; Vachhrajani and Chowdhury, 1990), no such
effects could be found for the human pituary. In mercury exposed workers (McGregor
and Mason, 1991; Erfurth et al., 1990), dentists (Erfurth et al., 1990) and chlor-alkali
workers (Barregard et al., 1994), no changes were found in the levels of different
pituitary-related hormones, even though tested individuals had elevated mercury
levels in their blood and urine and in the pituitary glands (Nylander, 1986; Erfurth et
al., 1990).
Effects on the reproductive system
Several studies could correlate MeHg exposures to impairments of the reproductive
system. After the outbreak of the Minamata disease, an increasing number of male
stillborns was observed and concluded that male embryos might be more sensitive to
mercury exposure (Sakamoto et al., 2001). The mercury mass poising in Iraq led to a
strong decline in pregnancies (Bakir et al., 1973).
Two studies from Hong Kong with couples who underwent in-vitro fertilization,
seafood consumption could be correlated to blood mercury concentration and
infertility (Leung et al., 2001; Choy et al., 2002). In 35% of infertile men and 23% of
infertile women had abnormally high blood mercury concentrations (Choy et al., 2002).
Mercury can bind to membranes of the acrosome, the anterior part of a
spermatozoon, and impair its function (Ernst et al., 1991). The acrosome contains
enzymes which break down the outer membrane of the ovum, allowing the sperm cell
to join with the ovum. Other possible toxic effects of mercury on sperm are disruptions
of sperm membrane permeability and DNA synthesis (Vogel et al., 1985; Ernst et al.,
1991; Liu et al., 1995). Apart from sperm, mercury can target cells in the testis (Ernst et
al., 1991), and in the seminal vesicles (Li et al., 1995), which are essential for the
energy supply of the spermatozoa, and in the epididymis (Working et al., 1985), which
is essential for the maturation process and storage of the spermatozoa. Observed
infertility in women with mercury exposure might be explained by similar disruptions
in the female gametes. For example, it has been reported that mercury damages ova
chromosomes of rodents (Jagiello and Lin, 1973).
45
In another study from Hong Kong, infertility of males could be linked to mercury levels
in their hair and to the intensity of fish consumption. High hair mercury levels could
also be correlated to age, explained by the fact that the intake rate of mercury was
higher than the rate of degradation and excretion, leading to an accumulation of
mercury over time. The study also discussed that organochlorine contaminants in
seafood (e.g. PCBs, PAHs and DDT) add to the effects of mercury on the reproductive
system (Dickman et al., 1998). Organochlorines have been correlated to impairments
in the endocrine system and to reduced sperm counts in humans (Richardson, 1993).
Owing to the problem of mercury accumulation with age and high seafood
consumption in Hong Kong, Dickman et al., (1998) claimed that the MeHg safety limit
of 0.5 g/kg fish established by the WHO (WHO, 1990) should be reduced for regions
like Hong Kong where seafood is the major protein source, to the safety limit used in
Japan (0.3 g/kg) (MOE, 2002), in order to match annual intake rates to annual
excretion rates.
Even for lower mercury dosages, a correlation was observed between mercury
exposure and effects on the reproductive system. Dental assistants who were exposed
to mercury vapour when assisting with amalgam fillings, were found to have abnormal
numbers of miscarriages and stillbirths (Sikorski et al., 1987).
Carcinogenicity
MeHg compounds were classified as possible carcinogens to humans by the
International Agency for Research on Cancer (IARC, 1993). In a study from Slovenia,
different types of cancer (oral, pharyngeal and lung cancers) among mercury miners
have been associated to occupational mercury exposure (Zadnik and Pompe-Kirn,
2007). In mercury miners from Spain, increased cancer mortality was observed,
including liver, colon, bladder, kidney, lung and central nervous system cancers, and a
trend in cancer mortality was positively correlated to duration of exposure (García
Gómez et al., 2007). For mercury miners and mercury millers from Italy, Ukraine, Spain
and Slovenia, correlations were found between mercury exposure and liver and lung
46
cancer, however not for kidney cancer. A correlation between the occurrence of
cancer and duration of exposure could not be found. The authors also mentioned that
increased cases of lung cancer could be explained by co-exposure to radon and
crystalline silica (Boffetta et al., 1998). In victims of the Minamata outbreak increased
cases of leukemia were observed and correlated to mercury exposure (Yorifuji et al.,
2007).
47
7 Methods
MeHg levels in shark fins of 9 different studies were collected and results were used to
estimate exposure of the Hong Kong and Chinese population, depending on their
consumption patterns and compared to the recommended safety limits.
Methylmercury concentrations in fins
Of the shark species represented in the different studies, the only ones considered
were those that typically occur in the shark fin trade (Table 3). The authors of these
studies presented their results either as MeHg concentrations or as total mercury
(THg) concentrations, and either based on dry-weight or based on wet weight.
Therefore, mercury concentrations were converted into values based on dry weight
and wet weight, where necessary, as international mercury limit values per kg fish are
represented on a wet weight basis, while dry weight values are more convenient to
compare daily exposure related to consumption of shark fins which are normally
bought from the market in dried or processed form. A ratio of 1:2.27 for wet weight to
dry weight of fin tissue of was used for the conversion (Gilbert et al., 2015).
Where only total mercury (THg) information was available, data have been normalised
to MeHg values, in order to make values comparable. Different studies report quite
wide ranges of MeHg to THg ratios. (Kim et al., 2016) found average MeHg to THg
ratios of 77% for all species in the study and of about 80% for larger shark species of
higher trophic levels. Nalluri et al. (2014) found ratios in the range of 55-89%,
however, not specifying the respective shark species for each percentage. The wide
range of MeHg to THg ratios may be explained by differences in age, size, origin, diet
and trophic level which influence bioaccumulation of MeHg (de Pinho et al., 2002) and
different studies confirmed a positive correlation between MeHg to THg ratio and
trophic level (Holsbeek et al., 1997; Watras et al., 1998; Francesconi and Lenanton,
1992). As all the shark species considered in this study belong to sharks of high trophic
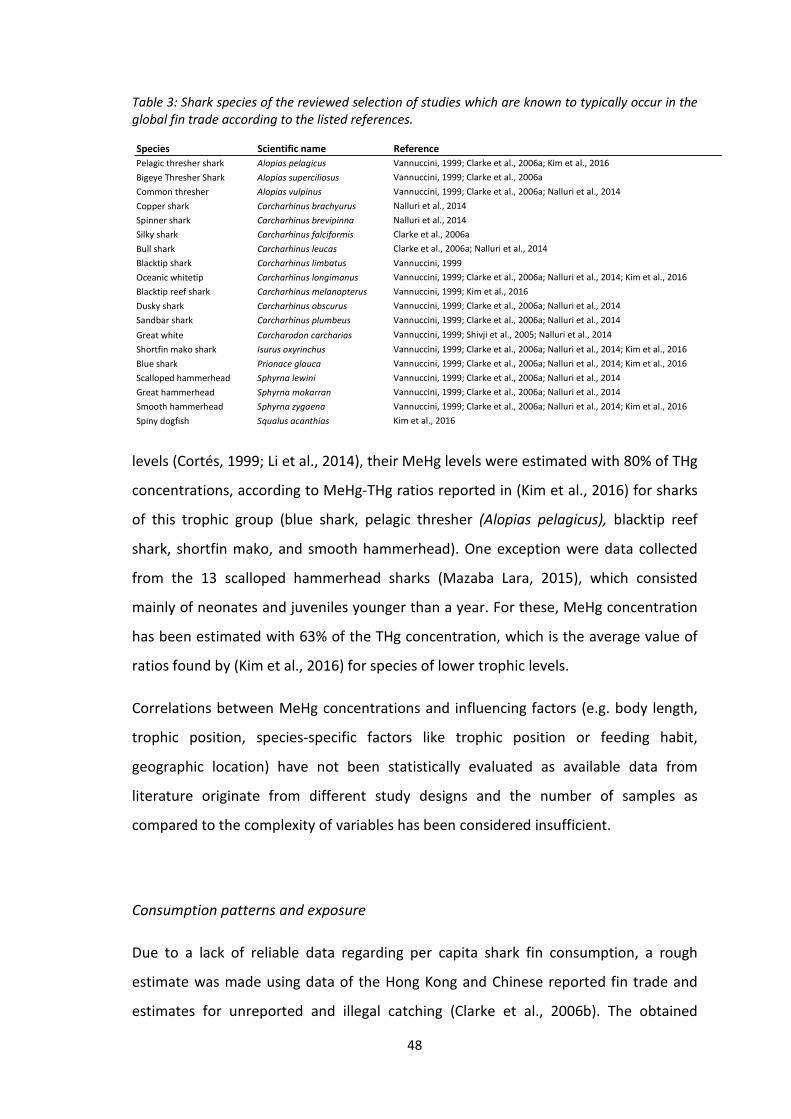
48
Table 3: Shark species of the reviewed selection of studies which are known to typically occur in the
global fin trade according to the listed references.
levels (Cortés, 1999; Li et al., 2014), their MeHg levels were estimated with 80% of THg
concentrations, according to MeHg-THg ratios reported in (Kim et al., 2016) for sharks
of this trophic group (blue shark, pelagic thresher (Alopias pelagicus), blacktip reef
shark, shortfin mako, and smooth hammerhead). One exception were data collected
from the 13 scalloped hammerhead sharks (Mazaba Lara, 2015), which consisted
mainly of neonates and juveniles younger than a year. For these, MeHg concentration
has been estimated with 63% of the THg concentration, which is the average value of
ratios found by (Kim et al., 2016) for species of lower trophic levels.
Correlations between MeHg concentrations and influencing factors (e.g. body length,
trophic position, species-specific factors like trophic position or feeding habit,
geographic location) have not been statistically evaluated as available data from
literature originate from different study designs and the number of samples as
compared to the complexity of variables has been considered insufficient.
Consumption patterns and exposure
Due to a lack of reliable data regarding per capita shark fin consumption, a rough
estimate was made using data of the Hong Kong and Chinese reported fin trade and
estimates for unreported and illegal catching (Clarke et al., 2006b). The obtained
Species Scientific name Reference
Pelagic thresher shark Alopias pelagicus Vannuccini, 1999; Clarke et al., 2006a; Kim et al., 2016
Bigeye Thresher Shark Alopias superciliosus Vannuccini, 1999; Clarke et al., 2006a
Common thresher Alopias vulpinus Vannuccini, 1999; Clarke et al., 2006a; Nalluri et al., 2014
Copper shark Carcharhinus brachyurus Nalluri et al., 2014
Spinner shark Carcharhinus brevipinna Nalluri et al., 2014
Silky shark Carcharhinus falciformis Clarke et al., 2006a
Bull shark Carcharhinus leucas Clarke et al., 2006a; Nalluri et al., 2014
Blacktip shark Carcharhinus limbatus Vannuccini, 1999
Oceanic whitetip Carcharhinus longimanus Vannuccini, 1999; Clarke et al., 2006a; Nalluri et al., 2014; Kim et al., 2016
Blacktip reef shark Carcharhinus melanopterus Vannuccini, 1999; Kim et al., 2016
Dusky shark Carcharhinus obscurus Vannuccini, 1999; Clarke et al., 2006a; Nalluri et al., 2014
Sandbar shark Carcharhinus plumbeus Vannuccini, 1999; Clarke et al., 2006a; Nalluri et al., 2014
Great white Carcharodon carcharias Vannuccini, 1999; Shivji et al., 2005; Nalluri et al., 2014
Shortfin mako shark Isurus oxyrinchus Vannuccini, 1999; Clarke et al., 2006a; Nalluri et al., 2014; Kim et al., 2016
Blue shark Prionace glauca Vannuccini, 1999; Clarke et al., 2006a; Nalluri et al., 2014; Kim et al., 2016
Scalloped hammerhead Sphyrna lewini Vannuccini, 1999; Clarke et al., 2006a; Nalluri et al., 2014
Great hammerhead Sphyrna mokarran Vannuccini, 1999; Clarke et al., 2006a; Nalluri et al., 2014
Smooth hammerhead Sphyrna zygaena Vannuccini, 1999; Clarke et al., 2006a; Nalluri et al., 2014; Kim et al., 2016
Spiny dogfish Squalus acanthias Kim et al., 2016
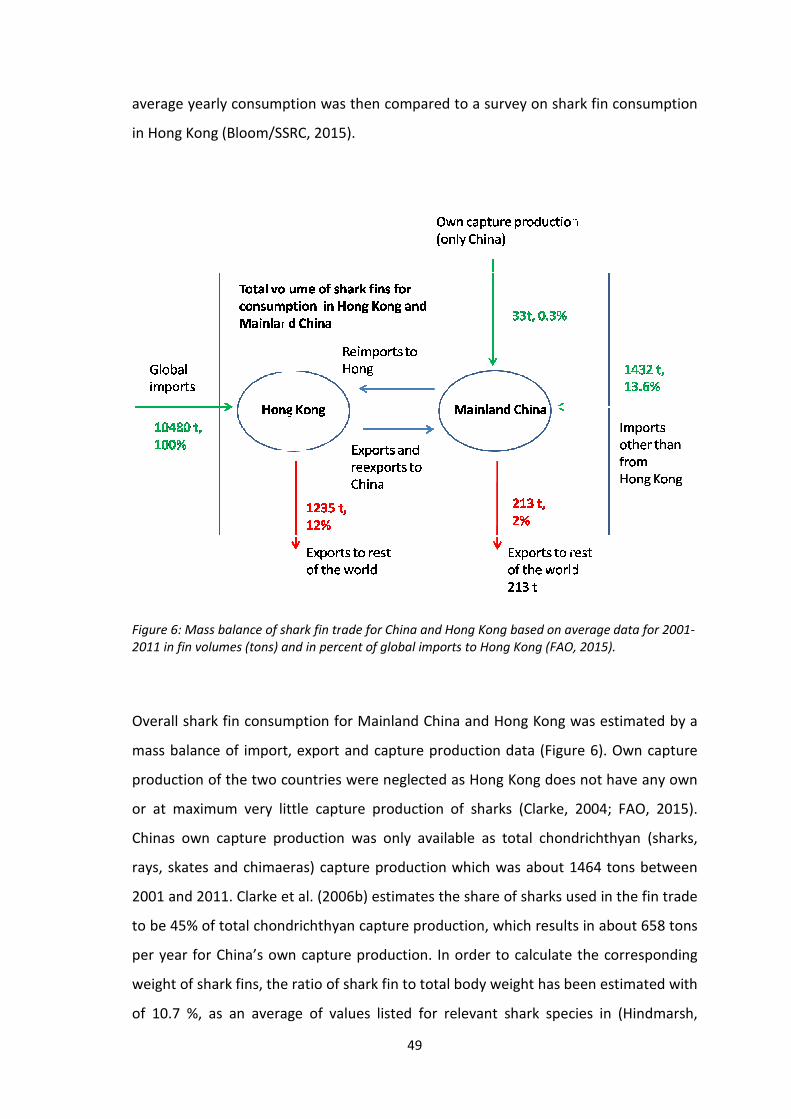
average yearly consumption was
in Hong Kong (Bloom/SSRC
Figure 6: Mass balance of shark fin tr
2011 in fin volumes (tons) and in percent of global imports
Overall shark fin consumption for Mainland China and Hong Kong was estimated by a
mass balance of import, export and capture production data (
production of the two co
or at maximum very little capture production of sharks (Clarke
Chinas own capture production was only available as total
rays, skates and chimaeras
2001 and 2011. Clarke et al.
to be 45% of total chondrichthyan
per year for China’s own
weight of shark fins, the ratio of shark fin to total body weight has been estimated with
of 10.7 %, as an average of values listed for relevant shark species in (Hindmarsh,
49
ge yearly consumption was then compared to a survey on shark fin consumption
Bloom/SSRC, 2015).
: Mass balance of shark fin trade for China and Hong Kong based on average data for 2001
tons) and in percent of global imports to Hong Kong (FAO
Overall shark fin consumption for Mainland China and Hong Kong was estimated by a
mass balance of import, export and capture production data (Figure 6
production of the two countries were neglected as Hong Kong does
very little capture production of sharks (Clarke, 2004;
own capture production was only available as total chondrichthyan
himaeras) capture production which was about 1464 tons between
Clarke et al. (2006b) estimates the share of sharks used in the fin trade
45% of total chondrichthyan capture production, which results
per year for China’s own capture production. In order to calculate the corresponding
weight of shark fins, the ratio of shark fin to total body weight has been estimated with
of 10.7 %, as an average of values listed for relevant shark species in (Hindmarsh,
pared to a survey on shark fin consumption
for China and Hong Kong based on average data for 2001-
(FAO, 2015).
Overall shark fin consumption for Mainland China and Hong Kong was estimated by a
Figure 6). Own capture
untries were neglected as Hong Kong does not have any own
, 2004; FAO, 2015).
chondrichthyan (sharks,
was about 1464 tons between
the share of sharks used in the fin trade
, which results in about 658 tons
In order to calculate the corresponding
weight of shark fins, the ratio of shark fin to total body weight has been estimated with
of 10.7 %, as an average of values listed for relevant shark species in (Hindmarsh,
50
2007). Using this ratio, 658 tons of sharks correspond to 33 tons of shark fins that are
yearly produced in China’s own capture production. This small volume of shark fins
corresponded to 0.3 % of global import to Hong Kong and was therefore neglected.
Consumption in tons of shark fins for Hong Kong and China was calculated by taking
average global shark fin imports to Hong Kong and China, subtracting Chinese exports
to other countries than Hong Kong and Hong Kong exports to other countries than
China. The sum of Hong Kong exports to other countries than China, non-Hong-Kong
imports to China and non-Hong-Kong exports from China were about 6% of the global
imports to Hong Kong and for this reason these three addends have been neglected as
well. As a result, shark fin consumption in Hong Kong and mainland China was
considered to more or less equal to the volume of global shark fin imports to Hong
Kong.
In order to correct the reported trade values in terms of more realistic values which
include the dimensions of unreported and illegal catches, a correction factor of 4.4
(Clarke et al., 2006b), was applied to the import (=consumption) volume. This
correction factor has been statistically estimated using genetic identification of shark
fins of the Hong Kong fin market combined with Hong Kong trade statistics and FAO
records.
In the next step, the present import data for 2015 were estimated. Latest import
trends for shark fins are not available as China stopped registering shark fins as a
separate custom code in 2005 and Hong Kong followed suit in 2012 (FAO, 2015; Clarke
et al., 2006b). According to different media reports, shark fin consumption in Hong
Kong and China decreased due to various reasons in the last years and in some media
reports decreases of 70% have been mentioned (Tsui, 2013; Duggan, 2014; Wild Aid,
2014). However Eriksson & Clarke (2015) explained why this value is far too optimistic.
2012 imports were 22% lower than the 2008-2011 average (Eriksson & Clarke, 2015).
Due to a lack of reliable information on recent import numbers, a further decline of
imports between 2012 and 2015 has been estimated with 25% to 2012 imports. This
estimate was made under the assumption, that imports kept decreasing, but not with
a continuing linear trend (which would have been a steep linear decrease of 22% per
51
year) but a rather asymptotic trend, as there have not been any events in the last years
that would justify drastic yearly import declines.
Applying a correction factor of 4.4 (Clarke et al., 2006b) and assumed consumption
declines (22% between 2011 and 2012; 25% between 2012 and 2015) to the mass
balance of average import and export data of 2001-2011 (i.e. imports to Hong Kong
≙ consumption in Kong Kong and China), 55334 tons of shark fins were estimated to
have been imported to Hong Kong, which correspond to the volume of shark fins
consumed in Hong Kong and China for 2015. Divided by the 2015 population of Hong
Kong (7,287,983) and the Chinese urban population (56.6% of 1,376,048,943) (United
Nations Population Division, 2016), the per capita consumption would be 70 g per
person per year, which would correspond to approximately 1-2 shark fin soups of 50g
fins each on average per person per year. As large parts of the population, especially of
the rural population and people with lower income, do not consume shark fins at all,
the Chinese share has been estimated using only the urban population.
This estimate roughly agrees with data of a telephone interview survey conducted in
Hong Kong where 1030 people between 18 and 75 years where asked how often they
consumed shark fin soup per year in 2009. 44.1 % of people had consumed shark fin
soup one or more times a year, while 43.6 % had consumed shark fin soup less than
once a year and 12.3% indicated that they never had eaten shark fin soup (unpublished
data of Bloom/SSRC, 2015). It is uncertain in how far the Hong Kong consumption
patterns can be applied to consumption patterns in China. However estimates for
consumption in Hong Kong and China using trade statistics with correction factors
from Clarke et al. (2006b) do not differ significantly from the Hong Kong interview
data, and these were the only two available reference points. In order to account for
these uncertainties, consumption MeHg exposure has been calculated for different
possible consumption scenarios.
Possible MeHg exposures were calculated for five different shark fin soup consumption
frequencies between once per year and three times a week, in order to calculate
possible MeHg exposures for adult men (62kg), adult women (54kg) and children
between one and six years (16.5kg). Average body weights were obtained from Lee et
al. (1994) and Yang et al. (2005). Two indicators of typical amounts of shark fin used in

52
the fin soups were found. Man et al. (2015) reported a restaurant in Hong Kong that
serves dishes with large amounts of shark fin (150g). An internet recipe indicated 300g
of shark fin to be used, however no number of servings was given (Singapore Food
Recipes, 2012). Assuming 6 servings, the amount per person would result in 50g. These
two different amounts of fins were used to calculate daily MeHg exposure, using the
mean MeHg concentration in mg/kg dry weight calculated from the selection of
studies.
53
8 Results
Mean values of MeHg and THg concentrations were calculated based on dry weight
and wet weight. Results were compared with international safety limits for THg
concentrations in fish as well as safety limits for daily MeHg exposure. Mean MeHg
concentration in dry weight was used to estimate exposure for different consumption
frequencies for adults and children.
Comparison of MeHg and THg concentrations with international safety limits for
concentrations in fish
Of the 9 studies on mercury levels in shark fins, 26% of the samples exceeded the
safety limits of MeHg concentration in fish set by the Japanese Health Authority (0.3
mg/kg wet weight). 22% of the samples exceeded the safety limits for THg
concentration in shark products of 1 mg/kg wet weight, adopted by the European
Union (EC, 2002), Australia and New Zealand (FSANZ, 2004) and Canada (Health
Canada, 2008), 24% exceeded the Japanese safety limits for THg concentration in fish
(0.4 mg/g) (MOE, 2002; UNEP, 2008) and 26% exceeded the US safety limits for THg
concentration in fish and shellfish (0.3mg/g) (US EPA, 2001b).
MeHg concentrations varied between 0.006 mg/kg wet weight (0.01 mg/kg dry weight)
for juvenile scalloped hammerhead sharks (103±35cm) of the Pacific Ocean (Mexico)
and 5.96 mg/kg wet weight (13.53 mg/kg dry weight) for a larger sample of the same
species (183 cm, 7cm below first maturity body length) of the Gulf of Mexico (Table 4).
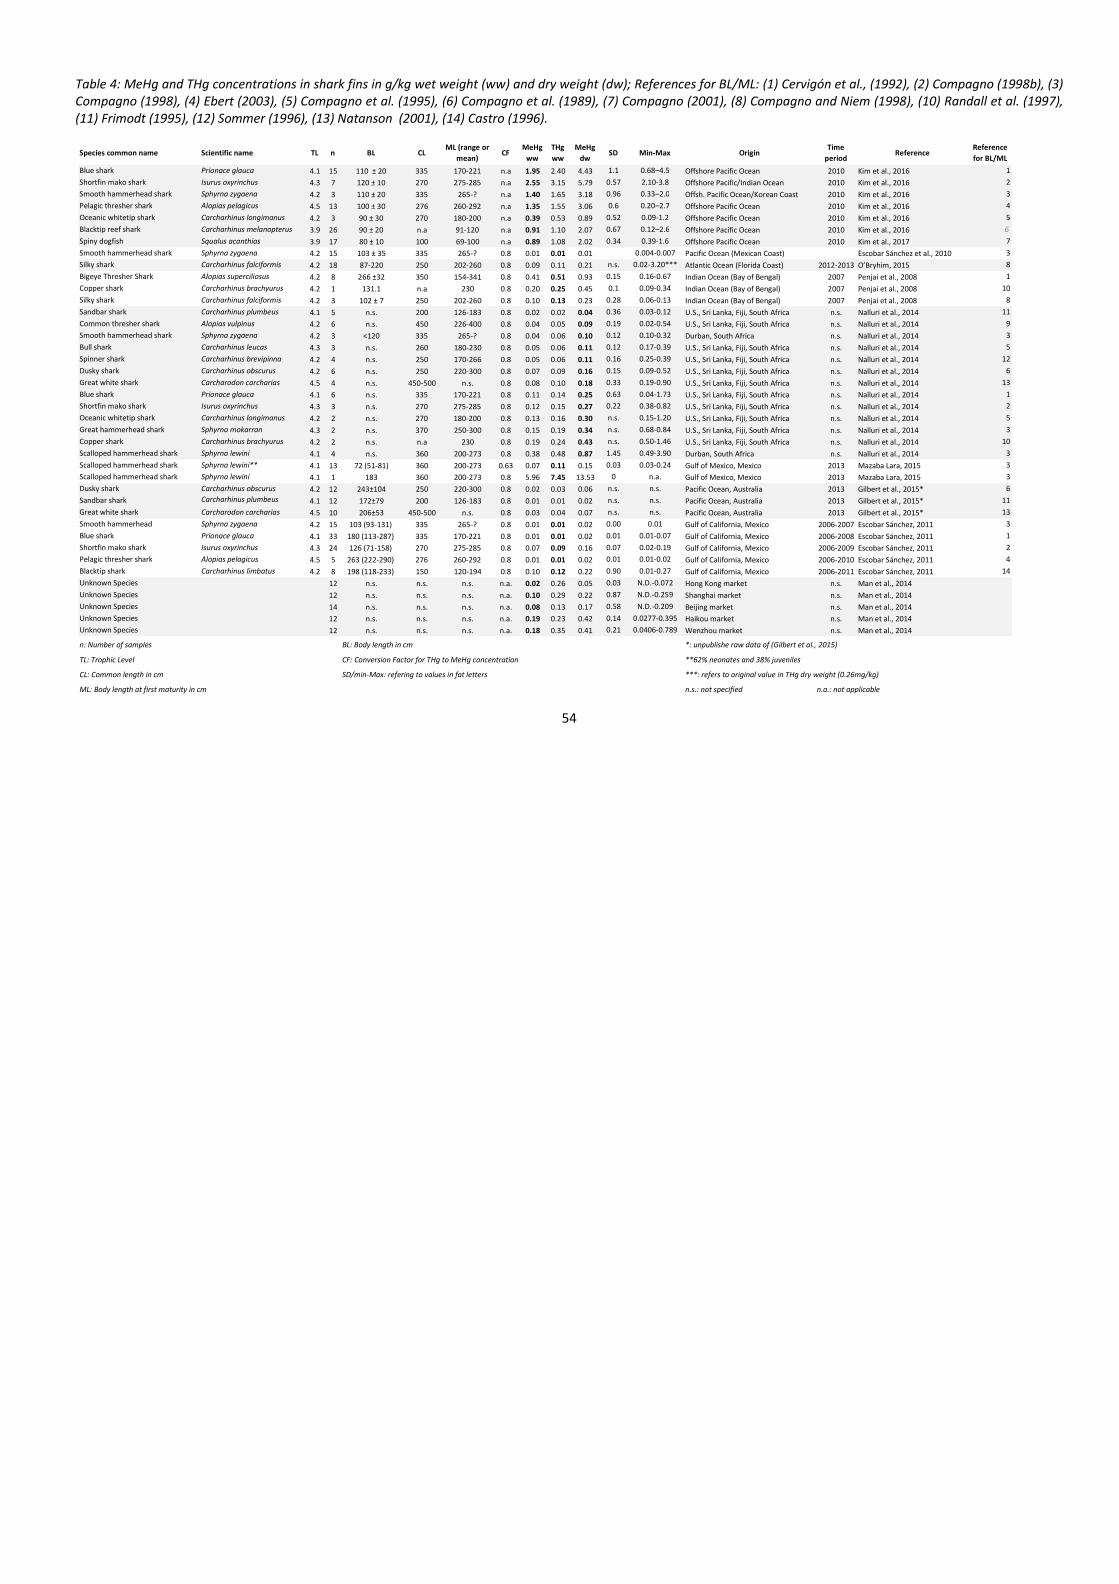
54
Table 4: MeHg and THg concentrations in shark fins in g/kg wet weight (ww) and dry weight (dw); References for BL/ML: (1) Cervigón et al., (1992), (2) Compagno (1998b), (3)
Compagno (1998), (4) Ebert (2003), (5) Compagno et al. (1995), (6) Compagno et al. (1989), (7) Compagno (2001), (8) Compagno and Niem (1998), (10) Randall et al. (1997),
(11) Frimodt (1995), (12) Sommer (1996), (13) Natanson (2001), (14) Castro (1996).
Species common name Scientific name TL n BL CLML (range or
mean)CF
MeHg
ww
THg
ww
MeHg
dwSD Min-Max Origin
Time
periodReference
Reference
for BL/ML
Blue shark Prionace glauca 4.1 15 110 ± 20 335 170-221 n.a 1.95 2.40 4.43 1.1 0.68–4.5 Offshore Pacific Ocean 2010 Kim et al., 2016 1
Shortfin mako shark Isurus oxyrinchus 4.3 7 120 ± 10 270 275-285 n.a 2.55 3.15 5.79 0.57 2.10-3.8 Offshore Pacific/Indian Ocean 2010 Kim et al., 2016 2
Smooth hammerhead shark Sphyrna zygaena 4.2 3 110 ± 20 335 265-? n.a 1.40 1.65 3.18 0.96 0.33–2.0 Offsh. Pacific Ocean/Korean Coast 2010 Kim et al., 2016 3
Pelagic thresher shark Alopias pelagicus 4.5 13 100 ± 30 276 260-292 n.a 1.35 1.55 3.06 0.6 0.20–2.7 Offshore Pacific Ocean 2010 Kim et al., 2016 4
Oceanic whitetip shark Carcharhinus longimanus 4.2 3 90 ± 30 270 180-200 n.a 0.39 0.53 0.89 0.52 0.09-1.2 Offshore Pacific Ocean 2010 Kim et al., 2016 5
Blacktip reef shark Carcharhinus melanopterus 3.9 26 90 ± 20 n.a 91-120 n.a 0.91 1.10 2.07 0.67 0.12–2.6 Offshore Pacific Ocean 2010 Kim et al., 2016 6
Spiny dogfish Squalus acanthias 3.9 17 80 ± 10 100 69-100 n.a 0.89 1.08 2.02 0.34 0.39-1.6 Offshore Pacific Ocean 2010 Kim et al., 2017 7
Smooth hammerhead shark Sphyrna zygaena 4.2 15 103 ± 35 335 265-? 0.8 0.01 0.01 0.01 0.004-0.007 Pacific Ocean (Mexican Coast) Escobar Sánchez et al., 2010 3
Silky shark Carcharhinus falciformis 4.2 18 87-220 250 202-260 0.8 0.09 0.11 0.21 n.s. 0.02-3.20*** Atlantic Ocean (Florida Coast) 2012-2013 O’Bryhim, 2015 8
Bigeye Thresher Shark Alopias superciliosus 4.2 8 266 ±32 350 154-341 0.8 0.41 0.51 0.93 0.15 0.16-0.67 Indian Ocean (Bay of Bengal) 2007 Penjai et al., 2008 1
Copper shark Carcharhinus brachyurus 4.2 1 131.1 n.a 230 0.8 0.20 0.25 0.45 0.1 0.09-0.34 Indian Ocean (Bay of Bengal) 2007 Penjai et al., 2008 10
Silky shark Carcharhinus falciformis 4.2 3 102 ± 7 250 202-260 0.8 0.10 0.13 0.23 0.28 0.06-0.13 Indian Ocean (Bay of Bengal) 2007 Penjai et al., 2008 8
Sandbar shark Carcharhinus plumbeus 4.1 5 n.s. 200 126-183 0.8 0.02 0.02 0.04 0.36 0.03-0.12 U.S., Sri Lanka, Fiji, South Africa n.s. Nalluri et al., 2014 11
Common thresher shark Alopias vulpinus 4.2 6 n.s. 450 226-400 0.8 0.04 0.05 0.09 0.19 0.02-0.54 U.S., Sri Lanka, Fiji, South Africa n.s. Nalluri et al., 2014 9
Smooth hammerhead shark Sphyrna zygaena 4.2 3 <120 335 265-? 0.8 0.04 0.06 0.10 0.12 0.10-0.32 Durban, South Africa n.s. Nalluri et al., 2014 3
Bull shark Carcharhinus leucas 4.3 3 n.s. 260 180-230 0.8 0.05 0.06 0.11 0.12 0.17-0.39 U.S., Sri Lanka, Fiji, South Africa n.s. Nalluri et al., 2014 5
Spinner shark Carcharhinus brevipinna 4.2 4 n.s. 250 170-266 0.8 0.05 0.06 0.11 0.16 0.25-0.39 U.S., Sri Lanka, Fiji, South Africa n.s. Nalluri et al., 2014 12
Dusky shark Carcharhinus obscurus 4.2 6 n.s. 250 220-300 0.8 0.07 0.09 0.16 0.15 0.09-0.52 U.S., Sri Lanka, Fiji, South Africa n.s. Nalluri et al., 2014 6
Great white shark Carcharodon carcharias 4.5 4 n.s. 450-500 n.s. 0.8 0.08 0.10 0.18 0.33 0.19-0.90 U.S., Sri Lanka, Fiji, South Africa n.s. Nalluri et al., 2014 13
Blue shark Prionace glauca 4.1 6 n.s. 335 170-221 0.8 0.11 0.14 0.25 0.63 0.04-1.73 U.S., Sri Lanka, Fiji, South Africa n.s. Nalluri et al., 2014 1
Shortfin mako shark Isurus oxyrinchus 4.3 3 n.s. 270 275-285 0.8 0.12 0.15 0.27 0.22 0.38-0.82 U.S., Sri Lanka, Fiji, South Africa n.s. Nalluri et al., 2014 2
Oceanic whitetip shark Carcharhinus longimanus 4.2 2 n.s. 270 180-200 0.8 0.13 0.16 0.30 n.s. 0.15-1.20 U.S., Sri Lanka, Fiji, South Africa n.s. Nalluri et al., 2014 5
Great hammerhead shark Sphyrna mokarran 4.3 2 n.s. 370 250-300 0.8 0.15 0.19 0.34 n.s. 0.68-0.84 U.S., Sri Lanka, Fiji, South Africa n.s. Nalluri et al., 2014 3
Copper shark Carcharhinus brachyurus 4.2 2 n.s. n.a 230 0.8 0.19 0.24 0.43 n.s. 0.50-1.46 U.S., Sri Lanka, Fiji, South Africa n.s. Nalluri et al., 2014 10
Scalloped hammerhead shark Sphyrna lewini 4.1 4 n.s. 360 200-273 0.8 0.38 0.48 0.87 1.45 0.49-3.90 Durban, South Africa n.s. Nalluri et al., 2014 3
Scalloped hammerhead shark Sphyrna lewini** 4.1 13 72 (51-81) 360 200-273 0.63 0.07 0.11 0.15 0.03 0.03-0.24 Gulf of Mexico, Mexico 2013 Mazaba Lara, 2015 3
Scalloped hammerhead shark Sphyrna lewini 4.1 1 183 360 200-273 0.8 5.96 7.45 13.53 0 n.a. Gulf of Mexico, Mexico 2013 Mazaba Lara, 2015 3
Dusky shark Carcharhinus obscurus 4.2 12 243±104 250 220-300 0.8 0.02 0.03 0.06 n.s. n.s. Pacific Ocean, Australia 2013 Gilbert et al., 2015* 6
Sandbar shark Carcharhinus plumbeus 4.1 12 172±79 200 126-183 0.8 0.01 0.01 0.02 n.s. n.s. Pacific Ocean, Australia 2013 Gilbert et al., 2015* 11
Great white shark Carcharodon carcharias 4.5 10 206±53 450-500 n.s. 0.8 0.03 0.04 0.07 n.s. n.s. Pacific Ocean, Australia 2013 Gilbert et al., 2015* 13
Smooth hammerhead Sphyrna zygaena 4.2 15 103 (93-131) 335 265-? 0.8 0.01 0.01 0.02 0.00 0.01 Gulf of California, Mexico 2006-2007 Escobar Sánchez, 2011 3
Blue shark Prionace glauca 4.1 33 180 (113-287) 335 170-221 0.8 0.01 0.01 0.02 0.01 0.01-0.07 Gulf of California, Mexico 2006-2008 Escobar Sánchez, 2011 1
Shortfin mako shark Isurus oxyrinchus 4.3 24 126 (71-158) 270 275-285 0.8 0.07 0.09 0.16 0.07 0.02-0.19 Gulf of California, Mexico 2006-2009 Escobar Sánchez, 2011 2
Pelagic thresher shark Alopias pelagicus 4.5 5 263 (222-290) 276 260-292 0.8 0.01 0.01 0.02 0.01 0.01-0.02 Gulf of California, Mexico 2006-2010 Escobar Sánchez, 2011 4
Blacktip shark Carcharhinus limbatus 4.2 8 198 (118-233) 150 120-194 0.8 0.10 0.12 0.22 0.90 0.01-0.27 Gulf of California, Mexico 2006-2011 Escobar Sánchez, 2011 14
Unknown Species 12 n.s. n.s. n.s. n.a. 0.02 0.26 0.05 0.03 N.D.-0.072 Hong Kong market n.s. Man et al., 2014
Unknown Species 12 n.s. n.s. n.s. n.a. 0.10 0.29 0.22 0.87 N.D.-0.259 Shanghai market n.s. Man et al., 2014
Unknown Species 14 n.s. n.s. n.s. n.a. 0.08 0.13 0.17 0.58 N.D.-0.209 Beijing market n.s. Man et al., 2014
Unknown Species 12 n.s. n.s. n.s. n.a. 0.19 0.23 0.42 0.14 0.0277-0.395 Haikou market n.s. Man et al., 2014
Unknown Species 12 n.s. n.s. n.s. n.a. 0.18 0.35 0.41 0.21 0.0406-0.789 Wenzhou market n.s. Man et al., 2014
n: Number of samples BL: Body length in cm *: unpublishe raw data of (Gilbert et al., 2015)
TL: Trophic Level CF: Conversion Factor for THg to MeHg concentration **62% neonates and 38% juveniles
CL: Common length in cm SD/min-Max: refering to values in fat letters ***: refers to original value in THg dry weight (0.26mg/kg)
ML: Body length at first maturity in cm n.s.: not specified n.a.: not applicable
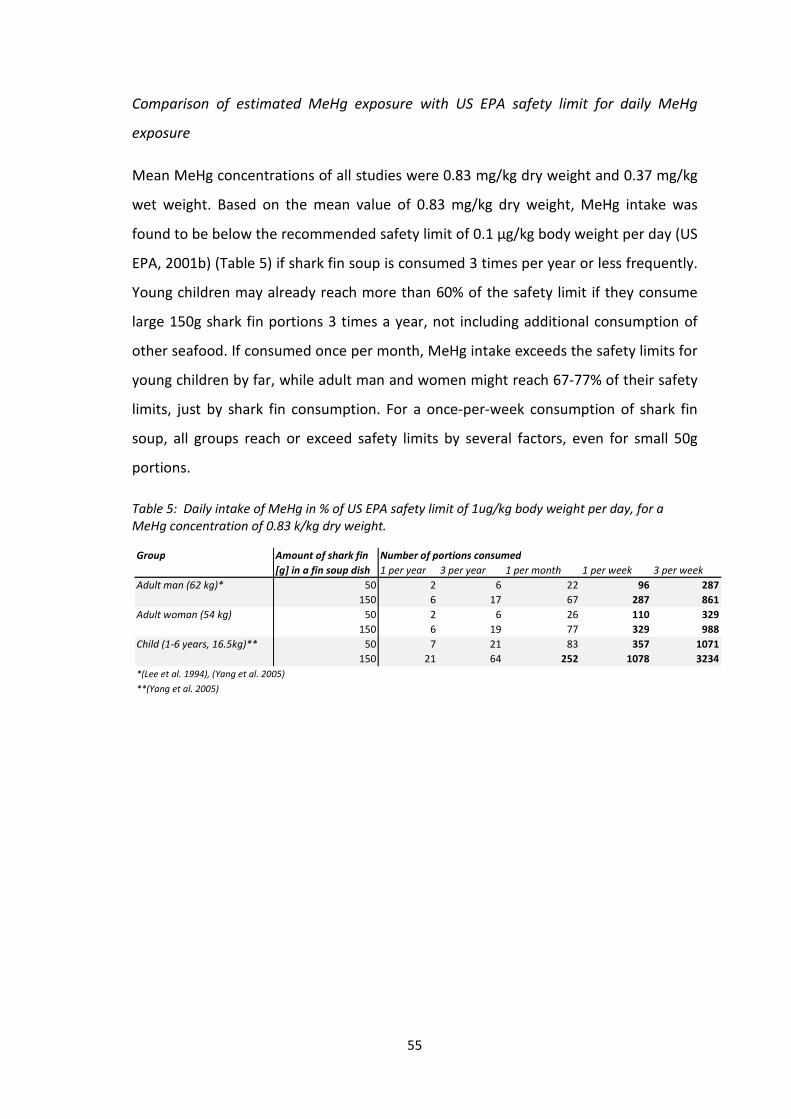
55
Comparison of estimated MeHg exposure with US EPA safety limit for daily MeHg
exposure
Mean MeHg concentrations of all studies were 0.83 mg/kg dry weight and 0.37 mg/kg
wet weight. Based on the mean value of 0.83 mg/kg dry weight, MeHg intake was
found to be below the recommended safety limit of 0.1 µg/kg body weight per day (US
EPA, 2001b) (Table 5) if shark fin soup is consumed 3 times per year or less frequently.
Young children may already reach more than 60% of the safety limit if they consume
large 150g shark fin portions 3 times a year, not including additional consumption of
other seafood. If consumed once per month, MeHg intake exceeds the safety limits for
young children by far, while adult man and women might reach 67-77% of their safety
limits, just by shark fin consumption. For a once-per-week consumption of shark fin
soup, all groups reach or exceed safety limits by several factors, even for small 50g
portions.
Table 5: Daily intake of MeHg in % of US EPA safety limit of 1ug/kg body weight per day, for a
MeHg concentration of 0.83 k/kg dry weight.
Group Number of portions consumed
1 per year 3 per year 1 per month 1 per week 3 per week
Adult man (62 kg)* 50 2 6 22 96 287
150 6 17 67 287 861
Adult woman (54 kg) 50 2 6 26 110 329
150 6 19 77 329 988
Child (1-6 years, 16.5kg)** 50 7 21 83 357 1071
150 21 64 252 1078 3234
*(Lee et al. 1994), (Yang et al. 2005)
**(Yang et al. 2005)
Amount of shark fin
[g] in a fin soup dish

56
9 Discussion
MeHg concentrations
Average MeHg concentrations found in shark fins were in general about an order of
magnitude lower compared to shark muscle tissue (Storelli et al., 2002a; Storelli et al.,
2003; Pethybridge et al., 2010; Maz-Courrau et al., 2011; Rumbold et al., 2014;
McKinney et al., 2015). One important factor might be that the majority of samples
were of sharks below maturity lengths (at least 52% juveniles, at least 19% adults and
29% undefined). Despite the young age of sharks and comparatively low
concentrations in shark fins in general, still about a quarter of the fins had MeHg
concentrations above international safety limits.
Kim et al. (2016) found the highest mean concentrations of all studies, even if all
recorded species except the blacktip reef shark had juvenile body lengths (Castro,
1996) (Table 4).
The reason might be higher mercury contaminations in the geographic area where the
sharks were caught or their feeding habits. Smooth hammerhead sharks of a similar
size from the Gulf of California (Escobar Sánchez, 2011) had nearly 200 times lower
MeHg concentrations and similar differences can be found between the two studies
for blue shark, pelagic thresher and shortfin mako that had higher average body
lengths (Escobar Sánchez, 2011). In conclusion, trophic level, size and species specific
feeding habits cannot be significant factors in this case, unless their feeding habits are
different in different geographic locations, as it has been reported for dusky sharks in
Australia and South Africa (Gilbert, 2015; Cortés, 1999; Dudley et al., 2005). The
concentration of mercury in the water column could be an important factor, as the
region around Korea has higher mercury emissions compared to the Mexican west
coast (Figure 5), however smooth hammerhead sharks (Kim et al., 2016) came from
different locations (offshore Pacific Ocean and Korean coast).
Also compared to the other studies, trophic levels of sharks in Kim’s study were similar
or even lower and body lengths were comparatively small, which indicates a an
influence of local factors in the geographic area, where the sharks were caught, These
57
factors can be high mercury levels in the local marine environment or special feeding
habits and food web structure related to this area.
MeHg concentrations for smooth hammerhead, blue shark, shortfin mako shark
(Nalluri et al., 2014) were much lower than Kim’s results however but higher than
MeHg levels of the same species by (Escobar Sánchez, 2011). Yet, factors like body
length, age and geographic source, could be the reason. Furthermore, smooth
hammerheads (Nalluri et al., 2014) from Durban, South Africa, a region in which
different studies found elevated MeHg levels in shark muscle tissue (Watling et al.,
1981; McKinney et al., 2015; Bosch et al., 2016). High mercury levels in this region
might be correlated to an extensive usage of coal power plants in South Africa and a
mercury processing plant which discharged mercury into nearby waterways in 1990
(Papu-Zamxaka et al., 2010). Regarding body size of the smooth hammerheads, it is
only known that they were smaller than 120cm, i.e. about the same size or even
smaller than those sampled by (Escobar Sánchez, 2011). For the other species studied,
Nalluri et al. (2014) did not specify body length or geographic location.
Three studies (Escobar Sánchez et. al, 2011, Escobar Sánchez, 2011, Gilbert et al.,
2015) found comparatively low mean MeHg levels in shark fins in general and also
compared to the same species in other studies (Nalluri et al., 2014, Kim et al., 2016).
Age could be one reason, as many of the sharks in these studies were smaller than the
typical body length at first maturity. However, average body length of samples in most
of the other studies was below maturity length as well. Geographic location could be
an important factor, as already mentioned for the comparison between MeHg levels of
smooth hammerhead sharks from South Africa (Nalluri et al., 2014) and the Mexican
Pacific Ocean (Escobar Sánchez, 2011). However, (Gilbert et al., 2015) found that
mercury levels in muscle tissue of white shark (9.71 mg/kg dry weight; 206 mean body
length) and dusky shark (8.5mg/kg dry weight; 243 cm mean body length) were
comparable with a study from South Africa (great white shark: 10.26 mg/kg dry weight,
217 cm mean body length; dusky shark: 5.82 mg/kg dry weight, 164 mean body length)
(McKinney et al., 2015). This would mean that mercury contamination in Australian
waters is similar to the South African region, which has comparatively high mercury
emissions. It has to be kept in mind though, that feeding habits are also an important
factor. Dusky sharks from Australia (Cortés, 1999) have been reported to have a higher

58
percentage of cephalopods in their diet than conspecifics from South African waters
(Dudley et al., 2005). Species which feed preferentially on cephalopods and
crustaceans mainly accumulate cadmium (cephalopods) and arsenic (crustaceans)
instead of mercury compared to piscivorous species (Bustamante et al., 1998; Storelli
and Marcotrigiano, 1999; Storelli and Marcotrigiano, 2000).
A finding that stands out in Gilbert’s study are the comparatively high mercury levels in
the muscle tissue of the dusky shark and great white shark in combination with
comparatively low mercury levels in their fins. All white sharks in the study were
juveniles, judging from their body length (Natanson, 2001). However it is not evident
why they would have low mercury levels in their fins but still high mercury levels in
their muscle tissue compared to conspecifics of other studies (McKinney et al., 2015).
Reasons for comparatively low MeHg levels reported by Man et al. (2014) could be
that this is the only study in which dried fins from Chinese markets were analysed. Fins
found on the market have often been de-skinned and have usually been bleached
(Vannuccini, 1999). These processes might have had an influence on their mercury
concentration. Apart from that, MeHg concentrations might have incorrect values, as a
majority of MeHg concentrations were 9% and 59% of the THg concentrations which is
much lower than MeHg-THg ratios found by Nalluri et al. (2014), 67 ± 22%, and Kim et
al. (2016), who reported an average of 77%. Other reasons might be species, origin,
trophic level and body length of the sampled sharks, which have not been presented in
the study.
Comparing MeHg levels of different species, the highest concentration was found in
one scalloped hammerhead from the Mexican Gulf (Mazaba Lara, 2015), exceeding the
safety limit of 1 mg/kg wet weight (EC, 2002, FSANZ, 2004, Health Canada, 2008) by
nearly 14 times. These might have been caused by a combination of body length,
trophic level, feeding habits and geographic location, also keeping in mind that this is
only one sample. This shark was 183 cm long, still below the typical size of first
maturity (200cm) (Compagno, 1998), but was nevertheless more than twice as large as
its conspecifics from the same study (72 cm mean body length) (Table 4). As the other
individuals in this study had comparatively low MeHg concentrations (Table 4), the
exceptionally high MeHg concentrations in this one individual of 183 cm size are
unlikely to be a result of the analytical methods used in this study. The Mexican Gulf is
59
close to areas with medium to high mercury emissions (Figure 5) which might result in
higher concentrations of mercury in the marine environment. In addition, scalloped
hammerhead sharks usually feed at greater depths (McKinney et al., 2015), i.e. their
diet contains prey items with higher exposure to mercury stored in the sediments.
Scalloped hammerhead sharks (Nalluri et al., 2014) also had comparatively high MeHg
levels, and except for the geographic location and body length, which have already
been discussed, feeding habits might be an additional factor. Other species with
comparatively high MeHg levels are blacktip reef shark and spiny dogfish (Squalus
acanthias) (Kim et al., 2016) considering their lower trophic level compared to other
species in the same study. In addition to the reasons for high average mercury
concentrations in the study itself that have already been discussed, samples of these
two species were mainly adults in terms of the blacktip shark and all adults in terms of
the spiny dogfish. Also for other studies where only adults were sampled,
comparatively high mercury levels were present, 0.41 mg/kg wet weight for the bigeye
thresher shark (Alopias superciliosus) (Penjai et al., 2008) and 0.1 mg/kg wet weight for
the blacktip shark (Escobar Sánchez, 2011) which was a high value compared to other
shark species in this study.
High MeHg levels in blacktip sharks compared to other shark species (Escobar Sánchez,
2011) might be, apart from age, related to feeding habits and reproduction mode.
Blacktip sharks are known to inhabit shallow near shore waters (McKinnney et al.,
2015), while juvenile blacktip sharks are able to enter estuaries (Rumbold et al., 2014).
Blacktip sharks, being viviparous, placental sharks, also receive larger loads of mercury
through maternal transfer. Their embryos are nourished by yolk for the first eight
weeks of the gestation, however they have a placental connection with their
mother for the remaining 9 months of gestation (Castro, 1996). In a study of mercury
levels in shark embryos, four embryos in a blacktip female had the highest mercury
levels in their tissue (0.69 ± 0.08 mg/kg) while the mother had mercury levels of 2.3
mg/kg (Adams and McMichael, 1999).
Comparatively low mercury concentrations were found in the fins of sandbar sharks
(Nalluri et al., 2014, Gilbert et al., 2015). In the latter study, 11 of 12 sampled sandbar
sharks were adults and in combination with the high trophic level, it might be
60
surprising that lower mercury levels were found (in fin tissue and in muscle tissue)
compared to dusky shark and great white shark. This might be explained by the fact
that sandbar sharks have a larger percentage of crustaceans (Cortés, 1999) and
cephalopods (Cortés, 1999; McAuley et al., 2006) in their diet, compared to dusky and
great white sharks, which have a larger percentage of large carnivorous teleost fish,
marine mammals and other elasmobranches in their diet (Walker, 1976; Cortés, 1999;
de Pinho et al., 2002). As already mentioned, cephalopods mainly accumulate
cadmium and crustaceans mainly accumulate arsenic. The hypothesis of lower mercury
levels as a result of feeding habits was also confirmed by highest levels of arsenic and
cadmium found in sandbar sharks in this study (Gilbert et al., 2015).
As an overall conclusion, mean MeHg concentrations found in the reviewed studies fit
into the common opinion that different MeHg levels result in a combination of
different factors, like tropic level, body length or age, reproduction mode, feeding
habits and Hg levels in the environment of different geographic regions.
Different MeHg levels for the same shark species of different studies might be
explained by body length or age where these were different, by geographic factors like
mercury levels in the water column, distinct feeding habits of a species in a certain
geographic region or different food web structures in different regions. However, as
interactions between the different factors that influence MeHg levels are very
complex, differences and similarities can easily misinterpreted, especially as the
number of studies and samples were rather small compared to the number of factors.
The studies reviewed here only cover a part of the species found in the shark fin trade.
Other species caught for their fins are, for example, great hammerhead, common
thresher shark, bull shark (Carcharhinus leucas), tiger shark, giant guitarfish, basking
shark, whale shark, lemon shark and tope shark (Vannuccini, 1999; Clarke et al., 2006a;
Nalluri et al., 2014).
Sharks sampled came from a number of different regions, however no studies of MeHg
in shark fins have been found for most of the geographic regions with high mercury
emissions, e.g. China, the South American West Coast, West Africa, India, Indonesia
(Figure 5) or for regions where noticeably high mercury levels in shark muscle tissue
have been reported, for example the Mediterranean (Storelli et al., 2001; Storelli et al.,
61
2003) and South Africa (McKinney et al., 2015). Apparently shark fins are used in sun-
dried form, in dried and bleached form with skin removed (Pamela, 2015) and also as
wet fins (Shea, 2016). One of the studies examined dried and processed fins from
Chinese markets (Man et al., 2014), and one study analysed sun-dried fins (Nalluri et
al., 2014), all other studies analysed unprocessed wet fins. It is uncertain, in how far
drying and bleaching processes might have an impact on the mercury concentration in
the fins.
Health risks of shark fin consumption
Even if shark fins contain lower MeHg concentrations compared to shark muscle tissue,
and other high-predator fish species like tuna and swordfish, frequent consumption of
shark fin soup can pose serious health risks, especially for children and if the soup
contains larger portions of fin tissue. MeHg levels found in the presented studies are
relevant for Chinese and Hong Kong consumers, as all shark species evaluated in this
study are present in the Hong Kong and Chinese fin markets (Vannuccini, 1999; Clarke
et al., 2006a; Nalluri et al., 2014). It is also very likely that sharks found on the Hong
Kong and Chinese fin markets originate from locations discussed in this study, due to
the global character of the fin trade. Sharks are caught all over the world and then
shipped to Hong Kong, the world’s biggest fin market, and further exported to China
(81% of Hong Kong exports in 2001-2011 (FAO, 2015)). As an example, Spain has the
third largest shark capture production in the world, is the most important shark fin
importer to Hong Kong (27% of Hong Kong imports in 2001-2011) and exported 80% of
its shark fin exports to Hong Kong in 2001-2011 (FAO, 2015). The Spanish fleet works
mainly in the Atlantic Ocean, but also in the Pacific and Indian Ocean with its main
landing ports distributed all over the world: Spain, Portugal, Cap Verde, Brazil,
Namibia, South Africa, Mauritius, Seychelles, Indonesia, French Polynesia and Peru
(Chabrol, 2015). Other crucial importers for Hong Kong were, in order of importance,
Taiwan, Indonesia, Singapore, United Arab Emirates, Mexico, Japan, Brazil, Australia,
United States, Yemen, Costa Rica and India.
62
It is uncertain, if size and age of sharks examined in this study are representative for
the global fin trade. Most of the sharks were juveniles. It is unknown whether the
actual average age of sharks caught is higher or even lower compared to the
individuals of the studies reviewed here, which means that average MeHg levels found
here could be under- or overestimated. However it is evident that most of the shark
species discussed here and most of the shark species used in the fin trade (Vannuccini,
1999; Clarke et al., 2006a; Nalluri et al., 2014) belong to the group of sharks with top
trophic levels above 4.1 (in a range between 3.1 (zebra shark (Stegostoma fasciatum))
and 4.5 (great white shark) (Cortés, 1999), which results in generally higher MeHg
levels compared to shark species of lower trophic levels.
Estimates of consumption patterns for different groups showed that frequent
consumption of shark fin can pose serious health risks. For children, even a
consumption of three times a year can be critical, if additional seafood or other
mercury sources are consumed. Consumption of shark fin soup once per month can
become critical also for adult men and women if they consume larger portions (150g)
of shark fin. Consuming shark fin soup once per week and more exceeds the US EPA
safety limit of 1 µg/kg body weight per day for all groups (except adult men eating 50g
portions: 96% of the US EPA safety limit).
Early life exposure to MeHg is of particular concern, because of its potential neuro-
developmental effects. Even the exposure of a single-meal can be critical during
pregnancy (Ginsberg and Toal, 2000), especially in the phase where the embryo is
developing (Burger et al., 2001). As MeHg has a half-life of 70 to 80 days in the human
body, fish consumption can already be critical before or at the beginning of pregnancy
(Björnberg et al., 2005). For this reason, the US Food and Drug Administration
(FDA) and the Environmental Protection Agency (EPA) recommend to sensitive
populations like pregnant women, young children and women of childbearing age to
avoid the consumption of shark, swordfish and king mackerel and to keep the
consumption of tuna and other species within limits (US EPA, 2001a; FDA, 2004).
The only available study in the literature which tested MeHg concentrations in shark
fin soup, examined 50 shark fin soup samples from restaurants all over the United
63
States (Nalluri et al., 2014). The authors found a mean MeHg concentration of 4.6
ng/ml, resulting in a dose of 1.1 μg for a 250ml bowl, which is 15% of the US EPA safety
limit (0.1 µg/kg body weight per day) for a US American with an average weight of 74
kg. It is unclear, which shark species were used for the soup and whether the soups
were freshly made or canned. The amount of shark fin used per soup was not given
either. If the average MeHg concentration of 0.23 µg/g found in dried shark fins from a
separate survey of the same study is used to calculate the necessary amount of shark
fin that would be needed for a soup which contains 1.1 µg of MeHg, the resulting
amount would be 5 g of fins. This value differs significantly from amounts reported for
a restaurant by a study from Hong Kong (150g) (Man et al., 2014) and amounts used in
home recipes (50g) (Singapore Food Recipes, 2012).
In order to evaluate health risks of shark fin consumption based on findings and
estimations of this study, additional aspects should be considered. First of all, the limit
value of 0.1 µg/kg body weight per day established by US EPA is a reference value that
has been calculated for the average US American seafood consumption patterns.
Seafood consumption in the United States is with 17.5 g fish/day (US EPA, 2001b) and
not comparable to seafood consumption of 196 g/day in Hong Kong (WWF, 2011) or
with 91 g/day in China (FAO, 2014).
Regarding EU total mercury (THg) safety limits of 1mg/kg for shark, swordfish, tuna
and other species (EC, 2002), it should be mentioned that limits for fish species with
usually lower mercury concentrations are stricter, with a limit of 0.5 mg/kg. From the
consumer health perspective this does not make any sense. Apart from that, these
limits are based on seafood consumption of European member states (60g/day for 28
EU member states in 2010 (FAO, 2007).
Evaluating the risks of shark fin consumption for the population in Hong Kong and
China, it has also be taken into account that China has by far the highest mercury
emissions in the world (McKinney, 2015) and besides seafood, other food sources,
such as rice, might have higher mercury concentrations compared to other regions.
Shark fin soup is most often served as a starter, usually consumed at wedding and
birthday banquets, family reunions, New Year and corporate events as a component of
64
an extensive menu, where other seafood dishes follow (Bloom/SSRC, 2015; Shea,
2016). This means that the exposure values shown in this study have to be seen as a
small piece of the entire mercury exposure picture. For example, consumption of a 200
g of albacore tuna, containing 1.06 µg MeHg per gram wet weight (Storelli et al., 2001)
would result in an additional dose of 212 μg of MeHg, compared to a shark fin soup
with 50g fins (42 μg). According to an internet blog, shark fin soup might have become
much more affordable in recent years, being sold in all you-can-eat shark fin buffets for
30-42 USD in restaurants of medium to high budget hotels and promotion menus
including shark fin soup for 8 USD in a cheaper restaurant (Hofford, 2009). It is not
clear whether the shark fins used are real or artificial and how much shark fin hotels
can afford to add to the dishes for such low prices. However it might mean that shark
fin consumption has become much better accessible to the population, which would
result in a more frequent and more widespread consumption over the whole
population.
It might easily be forgotten that MeHg does not only accumulate in seafood but also in
humans. With a consumption of only 10 g of fish per day humans can
accumulate significant mercury levels over a lifetime (WHO, 1991). Dickman and Leung
(1998) stated that even with a small mean mercury level of 0.12 mg/kg in fish, a Hong
Kong male adult would have accumulated 4mg/kg mercury in his hair by the age of 30,
and 7.5 mg/kg by the age of 60, which is more than the hair mercury levels of
fishermen from Minamata Bay, Japan in 1982 (Fjuiki, 1985). This study is from 1998
where mercury levels in fish and per capita seafood consumption in Hong Kong (164
g/day) were lower than today (196 g/day) (Dickman and Leung, 1998; WWF, 2011).
Adult males of this study from Hong Kong with only 5 mg/kg hair mercury levels
showed signs of subfertility. Studies from Iraq and Japan over a period of 1 - 10 years
found adults with hair mercury levels of 50 m/kg body weight that showed symptoms
of mercury poisoning (Bakir et al., 1973; Fjuiki, 1985).
Due to very unreliable records of Chinese shark fin consumption data, production data
and customs data (FAO, 2015) and a lack of respective information in the literature,
the real dimension of the shark fin trade and shark fin consumption remains unknown
and can only be estimated. Additionally individual fin consumption might vary a lot, for
65
example with more frequent consumption in the urban and high income population
and less frequent consumption in the rural or low income population.
Conclusions
Estimations of the actual dimensions of shark fin trade result in the assumption that
large quantities are still consumed despite signs of decreasing demand. MeHg
exposure by shark fin consumption is small compared to consumption meat of shark
and of other top marine predators, however frequent consumption of shark fin can still
pose serious health risks and is in particular not recommended for children and
pregnant and breast-feeding women because of the severe neurodevelopmental
damages that MeHg can cause in early-life stages. Also less frequent consumption
should be seen in the context of additional daily MeHg intake for the populations of
Hong Kong and China were average seafood intake is 196g/day and 91g/day
respectively.
Conservative consumption of sharks and their fins would not only make a significant
difference for the health of their consumers, but also for the status of decreasing and
endangered shark populations and the marine ecosystem.
66
References
Abercrombie DL, Balchowsky HA and Paine AL (2005) 2002 and 2003 Annual Summary: Large Pelagic
Species. U.S. Department of Commerce, National Oceanic and Atmospheric Administration
(NOAA), National Marine Fisheries Service.
Adams DH and McMichael RH (1999) Mercury levels in four species of sharks from the Atlantic coast of
Florida. Fishery Bulletin 97(2): 372–379.
Agocs MM, Etzel RA, Parrish RG, et al. (1990) Mercury exposure from interior latex paint. New England
journal of medicine 323(16): 1096–1101.
AMAP/UNEP (2008) Technical Background Report for the Global Mercury Assessment 2008. Arctic
Monitoring and Assessment Programme, United Nations Environmental Programme.
AMAP/UNEP (2013) Technical Background Report for the Global Mercury Assessment 2013. Arctic
Monitoring and Assessment Programme, United Nations Environmental Programme.
Anderson EN (1988) The Food of China. London, UK and New Haven, CT, USA: Yale University Press.
Aschner M (2002) Neurotoxic mechanisms of fish-borne methylmercury. Environmental Toxicology and
Pharmacology 12(2): 101–104.
ATSDR (1999) Toxicological profile for mercury. Atlanta: US Department of Health and Human Services -
Agency for Toxic Substances and Disease Registry.
Bailey K, Williams PG, Itano D, et al. (1996) By-catch and discards in western Pacific tuna fisheries: a
review of SPC data holdings and literature. Food and Agriculture Organization of the United
Nations.
Bakir F, Damluji SF, Amin-Zaki L, et al. (1973) Methylmercury poisoning in Iraq. Science 181(4096): 230–
241.
Balon EK (1975) Reproductive guilds of fishes: a proposal and definition. Journal of the Fisheries Board of
Canada 32(6): 821–864.
Barcelona (1995) Protocol Concerning Specially Protected Areas and Biological Diversity in the
Mediterranean Sea. Barcelona Convention for the Protection of the Mediterranean Sea Against
Pollution.
Barcelona (2013) Annexes to the Protocol concerning specially protected areas and biological diversity in
the Mediterranean. Barcelona Convention for the Protection of the Mediterranean Sea Against
Pollution.
Barcelona (2016) Signatures and Ratifications of the Barcelona Convention for the Protection of the
Marine Environment and the Coastal Region of the Mediterranean and its Protocols as at 30
July 2016.
Barkay T, Miller SM and Summers AO (2003) Bacterial mercury resistance from atoms to ecosystems.
FEMS microbiology reviews 27(2–3): 355–384.
Barregard L, Lindstedt G, Schütz A, et al. (1994) Endocrine function in mercury exposed chloralkali
workers. Occupational and environmental medicine 51(8): 536–540.

67
Barrera-García A, O’Hara T, Galván-Magaña F, et al. (2012) Oxidative stress indicators and trace
elements in the blue shark (Prionace glauca) off the east coast of the Mexican Pacific Ocean.
Comparative Biochemistry and Physiology Part C: Toxicology & Pharmacology 156(2): 59–66.
Bergés-Tiznado ME, Márquez-Farías F, Lara-Mendoza RE, et al. (2015) Mercury and selenium in muscle
and target organs of Scalloped Hammerhead Sharks Sphyrna lewini of the SE Gulf of California:
dietary intake, molar ratios, loads, and human health risks. Archives of Environmental
Contamination and Toxicology 69(4): 440–452.
Björnberg KA, Vahter M, Petersson-Grawe K, et al. (2003) Methyl mercury and inorganic mercury in
Swedish pregnant women and in cord blood: influence of fish consumption. Environmental
Health Perspectives 111(4): 637.
Björnberg KA, Vahter M, Grawé KP, et al. (2005) Methyl mercury exposure in Swedish women with high
fish consumption. Science of the total environment 341(1): 45–52.
Bloom (2015) Summary Report- Survey on Shark Consumption Habits and Attitudes in Hong Kong
2009/2010. Bloom Association Hong Kong.
Bloom/SSRC (2015) Survey on Shark Consumption Habits and Attitudes in Hong Kong. Bloom Association
Hong Kong and Social Sciences Research Centre of the University of Hong Kong.
Boffetta P, Garcia-Gómez M, Pompe-Kirn V, et al. (1998) Cancer occurrence among European mercury
miners. Cancer Causes & Control 9(6): 591–599.
Bonfil R (1997) Trends and patterns in world and Asian elasmobranch fisheries. Elasmobranch
biodiversity, conservation and management: Proceedings of the International Seminar and
Workshop, Sabah, Malaysia.
Bornatowski H, Braga RR, Abilhoa V, et al. (2014) Feeding ecology and trophic comparisons of six shark
species in a coastal ecosystem off southern Brazil. Journal of fish biology 85(2): 246–263.
Bosch AC, O’Neill B, Sigge GO, et al. (2016) Heavy metal accumulation and toxicity in smoothhound
(Mustelus mustelus) shark from Langebaan Lagoon, South Africa. Food chemistry 190: 871–878.
Bose-O’Reilly S, McCarty KM, Steckling N, et al. (2010) Mercury exposure and children’s health. Current
problems in pediatric and adolescent health care 40(8): 186–215.
Boudou A and Ribeyre F (1997) Mercury in the food web: accumulation and transfer mechanisms. Food
and Agriculture Organization of the United Nations.
Branco V, Vale C, Canário J, et al. (2007) Mercury and selenium in blue shark (Prionace glauca, L. 1758)
and swordfish (Xiphias gladius, L. 1758) from two areas of the Atlantic Ocean. Environmental
Pollution 150(3): 373–380.
Brewer D, Rawlinson N, Eayrs S, et al. (1998) An assessment of bycatch reduction devices in a tropical
Australian prawn trawl fishery. Fisheries Research 36(2): 195–215.
Brewer D, Heales D, Milton D, et al. (2006) The impact of turtle excluder devices and bycatch reduction
devices on diverse tropical marine communities in Australia’s northern prawn trawl fishery.
Fisheries Research 81(2): 176–188.
Bruno JF and O’Connor MI (2005) Cascading effects of predator diversity and omnivory in a marine food
web. Ecology Letters 8(10): 1048–1056.
Burger J and Gochfeld M (2004) Mercury in canned tuna: white versus light and temporal variation.
Environmental research 96(3): 239–249.
68
Burger J, Gaines KF, Boring CS, et al. (2001) Mercury and selenium in fish from the Savannah River:
species, trophic level, and locational differences. Environmental Research 87(2): 108–118.
Burger J, Gochfeld M, Jeitner C, et al. (2012) Interspecific and intraspecific variation in selenium:
mercury molar ratios in saltwater fish from the Aleutians: potential protection on mercury
toxicity by selenium. Science of the total environment 431: 46–56.
Burgess GH, Bruce BD, Cailliet GM, et al. (2014) A re-evaluation of the size of the white shark
(Carcharodon carcharias) population off California, USA. PloS one 9(6): 98.
Bustamante P, Caurant F, Fowler SW, et al. (1998) Cephalopods as a vector for the transfer of cadmium
to top marine pre<dators in the north-east Atlantic Ocean. Science of the Total Environment
220(1): 71–80.
Camhi M, Fowler SL, Musick JA, et al. (1998) Sharks and their relatives: ecology and conservation.
International Union for Conservation of Nature and Natural Resources (IUCN).
Campana SE, Marks L, Joyce W, et al. (2006) Effects of recreational and commercial fishing on blue
sharks (Prionace glauca) in Atlantic Canada, with inferences on the North Atlantic population.
Canadian Journal of Fisheries and Aquatic Sciences 63(3): 670–682.
Castro JI (1996) Biology of the blacktip shark, Carcharhinus limbatus, off the southeastern United States.
Bulletin of marine science 59(3): 508–522.
Cavanagh JB (1988) Long term persistence of mercury in the brain. British journal of industrial medicine
45(10): 649.
Cernichiari E, Brewer R, Myers GJ, et al. (1994) Monitoring methylmercury during pregnancy: maternal
hair predicts fetal brain exposure. Neurotoxicology 16(4): 705–710.
Cervigón F, Cipriani R, Fischer W, et al. (1992) Fichas FAO de identificación de especies para los fines de
la pesca; guía de campo de las especies comerciales marinas y de aguas salobres de la costa
septentrional de Sur América. Rome: Food and Agriculture Organization of the United Nations.
CETS (2002a) CETS 104 - Appendix I - Convention on the Conservation of European Wildlife and Natural
Habitats. Convention on the Conservation of European Wildlife and Natural Habitats.
CETS (2002b) CETS 104 - Appendix II - Convention on the Conservation of European Wildlife and Natural
Habitats. Convention on the Conservation of European Wildlife and Natural Habitats.
Chabrol R (2015) Pelagic shark meat in Europe. Main markets and links within the iberic longline sector.
Preliminary research for Sharkproject International.
Chang LW, Reuhl KR and Lee GW (1977) Degenerative changes in the developing nervous system as a
result of in utero exposure to methylmercury. Environmental research 14(3): 414–423.
Cheng H and Hu Y (2011) Mercury in municipal solid waste in China and its control: a review.
Environmental science & technology 46(2): 593–605.
Choy CM, Lam CW, Cheung LT, et al. (2002) Infertility, blood mercury concentrations and dietary
seafood consumption: a case–control study. BJOG: An International Journal of Obstetrics &
Gynaecology 109(10): 1121–1125.
CITES (2016) CITES Appendices I, II and III valid from 10 March 2016. Convention on International Trade
in Endangered Species of Wild Fauna and Flora).
Clarke SC (2004) Shark product trade in Hong Kong and mainland China and implementation of the CITES
69
shark listings. TRAFFIC East Asia, Hong Kong, China.
Clarke SC, McAllister MK and Michielsens CG (2004) Estimates of Shark Species Composition and
Numbers Associated with the Shark Fin Trade Based on Hong - Google Scholar. Journal of the
Northwest Atlantic Fishery Science 35: 453–465.
Clarke SC, McAllister MK, Milner-Gulland EJ, et al. (2006b) Global estimates of shark catches using trade
records from commercial markets. Ecology letters 9(10): 1115–1126.
Clarke SC, Magnussen JE, Abercrombie DL, et al. (2006a) Identification of shark species composition and
proportion in the Hong Kong shark fin market based on molecular genetics and trade records.
Conservation Biology 20(1): 201–211.
Clarke SC, Milner-Gulland EJ and Bjorndal T (2007) Social, Economic and Regulatory Drivers of the Shark
Fin Trade. Marine Resource Economics 22(3): 305–327.
Clarke SC, Harley SJ, Hoyle SD, et al. (2013) Population trends in Pacific Oceanic sharks and the utility of
regulations on shark finning. Conservation Biology 27(1): 197–209.
Clarkson TW (2002) The three modern faces of mercury. Environmental Health Perspectives 110(1): 11.
CMS (2014) Appendices I and II of the Convention on the Conservation of Migratory Species of Wild
Animals (CMS). Convention on the Conservation of Migratory Species of Wild Animals.
Compagno LJ. (1998) Sphyrnidae. Hammerhead and bonnethead sharks. In: FAO identification guide for
fishery purposes. The Living Marine Resources of the Western Central Pacific, Food and
Agriculture Organization of the United Nations, pp. 1361–1366.
Compagno LJ (2001) Sharks of the world: an annotated and illustrated catalogue of shark species known
to date. Food and Agriculture Organization of the United Nations.
Compagno LJ, Ebert DA and Smale MJ (1989) Guide to the sharks and rays of southern Africa. Food and
Agriculture Organization of the United Nations.
Compagno LJ., Krupp F and Schneider W (1995) Sphyrnidae. Hammerhead and bonnethead sharks. In:
Guia FAO para Identification de Especies para los Fines de la Pesca. Pacifico Centro-Oriental,
Food and Agriculture Organization of the United Nations, pp. 1361–1366.
Compagno LJV (1998b) Lamnidae. Mackerel sharks, makos, white sharks, porbeagles. In: FAO
Identification Guide for Fishery Purposes. The Living Marine Resources of the Western Central
Pacific, pp. 1274–1278.
Compagno LJV and Niem VH (1998) Carcharhinidae. Requiem sharks. In: FAO Identification Guide for
Fishery Purposes. The Living Marine Resources of the Western Central Pacific. FAO, Rome, Food
and Agriculture Organization of the United Nations, pp. 1312–1360.
Cortés E (1999) Standardized diet compositions and trophic levels of sharks. ICES Journal of Marine
Science 56(5): 707–717.
Cortés E (2002) Incorporating uncertainty into demographic modeling: application to shark populations
and their conservation. Conservation biology 16(4): 1048–1062.
COSEWIC (2011) COSEWIC Assessment and Status Report on the North Pacific Spiny Dogfish (Squalus
suckleyi) in Canada. Ottawa, Canada: Committee on the Status of Endangered Wildlife in
Canada.
Cossa D, Harmelin-Vivien M, Mellon-Duval C, et al. (2012) Influences of bioavailability, trophic position,
70
and growth on methylmercury in hakes (Merluccius merluccius) from northwestern
Mediterranean and northeastern Atlantic. Environmental science & technology 46(9): 4885–
4893.
Costello C, Ovando D, Hilborn R, et al. (2012) Status and solutions for the world’s unassessed fisheries.
Science 338(6106): 517–520.
Craig PJ (1986) Organometallic compounds in the environment; principles and reactions. Available from:
http://www.osti.gov/scitech/biblio/6136446 (accessed 19 August 2016).
Danscher G, Hørsted-Bindslev P and Rungby J (1990) Traces of mercury in organs from primates with
amalgam fillings. Experimental and molecular pathology 52(3): 291–299.
Das K, Debacker V and Bouquegneau J-M (2000) Metallothioneins in marine mammals. Cellular and
Molecular Biology 46(2).
Davidson LN, Krawchuk MA and Dulvy NK (2015) Why have global shark and ray landings declined:
improved management or overfishing? Fish and Fisheries.
de Pinho AP, Guimarães JRD, Martins AS, et al. (2002) Total mercury in muscle tissue of five shark
species from Brazilian offshore waters: effects of feeding habit, sex, and length. Environmental
Research 89(3): 250–258.
Debes F, Budtz-Jørgensen E, Weihe P, et al. (2006) Impact of prenatal methylmercury exposure on
neurobehavioral function at age 14 years. Neurotoxicology and teratology 28(5): 536–547.
Deborah M (2013) Global mercury hotspots: New evidence reveals mercury contamination regularly
exceeds health advisory levels in humans and fish worldwide. Biodiversity Research Institute
and IPEN: 1–20.
Dickman MD and Leung KMC (1998) Mercury and organochlorine exposure from fish consumption in
Hong Kong. Chemosphere 37(5): 991–1015.
Dickman MD, Leung CK and Leong MK (1998) Hong Kong male subfertility links to mercury in human hair
and fish. Science of the Total Environment 214(1): 165–174.
Driscoll CT, Mason RP, Chan HM, et al. (2013) Mercury as a global pollutant: sources, pathways, and
effects. Environmental science & technology 47(10): 4967–4983.
Dudley SFJ, Cliff G, Zungu MP, et al. (2005) Sharks caught in the protective gill nets off KwaZulu-Natal,
South Africa. The dusky shark Carcharhinus obscurus. African Journal of Marine Science 27(1):
107–127.
Duffy JE (2006) Biodiversity and the functioning of seagrass ecosystems. Marine Ecology Progress Series
311: 233–250.
Duggan J (2014) Sales of shark fin in China drop by up to 70%. The Guardian. Available from:
https://www.theguardian.com/environment/chinas-choice/2014/aug/08/sales-of-shark-fin-
china-drop-70 (accessed 28 July 2016).
Dulvy JD NK Reynold (1997) Evolutionary transitions among egg-laying, live-bearing and maternal inputs
in sharks and rays. Proceedings of the Royal Society B: Biological Sciences 264(1386): 1309–
1315.
Dulvy NK and Forrest RE (2010) Life histories, population dynamics, and extinction risks in
chondrichthyans. Sharks and Their Relatives 2: 639–679.

71
Dulvy NK, Baum JK, Clarke S, et al. (2008) You can swim but you can’t hide: the global status and
conservation of oceanic pelagic sharks and rays. Aquatic Conservation: Marine and Freshwater
Ecosystems 18(5): 459–482.
Dulvy NK, Fowler SL, Musick JA, et al. (2014) Extinction risk and conservation of the world’s sharks and
rays. Elife 3: 51–59.
Ebert DA (2003) Sharks, rays, and chimaeras of California. University of California Press.
EC (2015b) COUNCIL REGULATION (EU) 2015/104 - 2015 fixing for fishing opportunities for certain fish
stocks and groups of fish stocks. European Commission.
EC (2002) Setting maximum levels for certain contaminants in foodstuffs. European Commission).
EC (2015) TACs and quotas - Fisheries - European Commission. Available from:
http://ec.europa.eu/fisheries/cfp/fishing_rules/tacs/index_en.htm (accessed 24 August 2016).
Eilperrin J (2011) Demon Fish: Travels Through the Hidden World of Sharks. New York: Knopf Doubleday
Publishing Group.
Endo T, Haraguchi K and Sakata M (2002) Mercury and selenium concentrations in the internal organs of
toothed whales and dolphins marketed for human consumption in Japan. Science of the Total
Environment 300(1): 15–22.
Endo T, Kimura O, Hisamichi Y, et al. (2006) Distribution of total mercury, methyl mercury and selenium
in pod of killer whales (Orcinus Orca) stranded in the northern area of Japan: comparison of
mature females with calves. Environmental Pollution 144(1): 145–150.
Endo T, Hisamichi Y, Haraguchi K, et al. (2008) Hg, Zn and Cu levels in the muscle and liver of tiger sharks
(Galeocerdo cuvier) from the coast of Ishigaki Island, Japan: relationship between metal
concentrations and body length. Marine Pollution Bulletin 56(10): 1774–1780.
Erfurth EM, Schütz A, Nilsson A, et al. (1990) Normal pituitary hormone response to thyrotrophin and
gonadotrophin releasing hormones in subjects exposed to elemental mercury vapour. British
journal of industrial medicine 47(9): 639–644.
Eriksson H and Clarke S (2015) Chinese market responses to overexploitation of sharks and sea
cucumbers. Biological Conservation 184: 163–173.
Ernst E., Christensen M and Lauritsen JG (1991) In vitro exposure of human spermatozoa to mercuric
chloride - a histochemical study. Progress in histochemistry and cytochemistry 23(1): 263–268.
Escobar-Sánchez O, Galvan-Magaña F and Rosíles-Martínez R (2010) Mercury and selenium
bioaccumulation in the smooth hammerhead shark, Sphyrna zygaena Linnaeus, from the
Mexican Pacific Ocean. Bulletin of Environmental Contamination and Toxicology 84(4): 488–
491.
Escobar Sánchez O (2011) Bioacumulación y Biomagnificación de mercurio y selenio en peces pelágicos
mayores de la Costa Occidental de Baja California Sur, México. Instituto Politécnico Nacional.
Centro Interdisciplinario de Ciencias Marinas.
Escobar-Sánchez O, Galván-Magaña F and Rosíles-Martínez R (2011) Biomagnification of Mercury and
Selenium in Blue Shark Prionace glauca from the Pacific Ocean off Mexico. Biological Trace
Element Research 144(1–3): 550–559.
Escobar-Sánchez O, Ruelas-Inzunza J, Patrón-Gómez JC, et al. (2014) Mercury levels in myliobatid
stingrays (Batoidea) from the Gulf of California: tissue distribution and health risk assessment.
72
Environmental monitoring and assessment 186(3): 1931–1937.
Estes JA, Tinker MT, Williams TM, et al. (1998) Killer whale predation on sea otters linking oceanic and
nearshore ecosystems. Science 282(5388): 473–476.
Evers DC, DiGangi J and Petrlík J (2013) Global Mercury Hotspots New Evidence Reveals Mercury
Contamination Regularly Exceeds Health Advisory Levels in Humans and Fish Worldwide.
Biodiversity Research Institute. Gorham, Maine. IPEN. Göteborg, Sweden.
Fabinyi M (2012) Historical, cultural and social perspectives on luxury seafood consumption in China.
Environmental Conservation 39(1): 83–92.
FAO (2007) Future prospects for fish and fishery products. 4. Fish consumption in the European Union in
2015 and 2030. Part 1. European Overview. Food and Agriculture Organization of the United
Nations.
FAO (2014) The State of World Fisheries and Aquaculture Opportunities and Challenges 2014. Food and
Agriculture Organization of the United Nations.
FAO (2014b) FAO Fisheries & Aquaculture - FishStatJ - software for fishery statistical time series. Food
and Agriculture Organization of the United Nations.
FAO (2015) State of the global market for shark products. FAO Fisheries and Aquaculture Technical
Paper, Food and Agriculture Organization of the United Nations.
FAO/WHO (2016) Discussion Paper on Maximum Levels for Mercury in Fish. Food and Agriculture
Organization of the United Nations, World Health Organization.
FDA (2004) What you need to know about mercury in fish and shellfish: 2004 EPA and FDA advice for
women who might become pregnant, women who are pregnant, nursing mothers, young
children. US Food and Drug Administration.
Field IC, Meekan MG, Buckworth RC, et al. (2009) Susceptibility of sharks, rays and chimaeras to global
extinction. Advances in marine biology 56: 275–363.
Fillion M, Mergler D, Passos CJS, et al. (2006) A preliminary study of mercury exposure and blood
pressure in the Brazilian Amazon. Environmental Health 5(1): 1–12.
Fjuiki M (1985) Hair mercury for residents of Minimata Bay. Water Science and Technology 25: 133–141.
Fowler S, Mogensen CB and Blasdale T (2004) Plan of action for the conservation and management of
sharks in UK waters. Joint Nature Conservation Commitee.
Fowler SL and Cavanagh RD (2005) International conservation and management initiatives for
chondrichthyan fish. In: Sharks, Rays and Chimaeras: The Status of Chondrichthyan Fishes,
International Union for Conservation of Nature (IUCN), pp. 58–69.
Francesconi KA and Lenanton RC (1992) Mercury contamination in a semi-enclosed marine embayment:
organic and inorganic mercury content of biota, and factors influencing mercury levels in fish.
Marine Environmental Research 33(3): 189–212.
Francis MP, Griggs LH and Baird SJ (2001) Pelagic shark bycatch in the New Zealand tuna longline fishery.
Marine and Freshwater Research 52(2): 165–178.
Freeman M (1977) Sung. In: Food in Chinese Culture, K.C. Chang, New Haven, CT, USA: Yale University
Press, pp. 141–192.
73
Frimodt C (1995) Multilingual illustrated guide to the world’s commercial warmwater fish. Fishing News
Books Ltd.,.
FSANZ (2004) Mercury in fish. Food Standards Australia New Zealand.
García Gómez M, Boffetta P, Caballero Klink JD, et al. (2007) Cancer mortality in mercury miners. Gaceta
Sanitaria 21(3): 210–217.
García-Hernández J, Cadena-Cárdenas L, Betancourt-Lozano M, et al. (2007) Total mercury content
found in edible tissues of top predator fish from the Gulf of California, Mexico. Toxicological &
Environmental Chemistry 89(3): 507–522.
Gardner RM, Nyland JF and Silbergeld EK (2010) Differential immunotoxic effects of inorganic and
organic mercury species in vitro. Toxicology letters 198(2): 182–190.
Geraghty PT, Macbeth WG, Harry AV, et al. (2013) Age and growth parameters for three heavily
exploited shark species off temperate eastern Australia. ICES Journal of Marine Science: Journal
du Conseil: 158–164.
Ghosh N and Bhattacharya S (1992) Thyrotoxicity of the chlorides of cadmium and mercury in rabbit.
Biomedical and Environmental Sciences 5: 236–236.
Gilbert JM, Reichelt-Brushett AJ, Butcher PA, et al. (2015b) Metal and metalloid concentrations in the
tissues of dusky Carcharhinus obscurus, sandbar C. plumbeus and white Carcharodon
carcharias sharks from south-eastern Australian waters, and the implications for human
consumption - supplementary data.
Gilbert JM, Reichelt-Brushett AJ, Butcher PA, et al. (2015) Metal and metalloid concentrations in the
tissues of dusky Carcharhinus obscurus, sandbar C. plumbeus and white Carcharodon
carcharias sharks from south-eastern Australian waters, and the implications for human
consumption. Marine pollution bulletin 92(1): 186–194.
Gilman E, Clarke S, Brothers N, et al. (2008) Shark interactions in pelagic longline fisheries. Marine Policy
32(1): 1–18.
Ginsberg GL and Toal BF (2000) Development of a Single-Meal Fish Consumption Advisory for Methyl
Mercury. Risk Analysis 20(1): 41–48.
Gochfeld M (2003) Cases of mercury exposure, bioavailability, and absorption. Ecotoxicology and
environmental safety 56(1): 174–179.
Gomez DJL (2008) Plan de Accion Regional para la Conservación de tiburones, rayas y quimeras en el
Pacífico Sudeste (PAR-CPPS). Comision Permanente del Pacifico Sur - CPPS, Universidad Austral
de Chile.
Graff RD, Falconer MM, Brown DL, et al. (1997) Altered sensitivity of posttranslationally modified
microtubules to methylmercury in differentiating embryonal carcinoma-derived neurons.
Toxicology and applied pharmacology 144(2): 215–224.
Grandjean P, Weihe P, Jørgensen PJ, et al. (1992) Impact of maternal seafood diet on fetal exposure to
mercury, selenium, and lead. Archives of Environmental Health: An International Journal 47(3):
185–195.
Grandjean P, Weihe P, White RF, et al. (1997) Cognitive deficit in 7-year-old children with prenatal
exposure to methylmercury. Neurotoxicology and teratology 19(6): 417–428.
Grandjean P, Murata K, Budtz-Jørgensen E, et al. (2004) Cardiac autonomic activity in methylmercury
74
neurotoxicity: 14-year follow-up of a Faroese birth cohort. The Journal of pediatrics 144(2):
169–176.
Hać E, Krzyżanowski M and Krechniak J (2000) Total mercury in human renal cortex, liver, cerebellum
and hair. Science of the total environment 248(1): 37–43.
Harada M (1978) Congenital Minamata disease: intrauterine methylmercury poisoning. Teratology
18(2): 285–288.
Harada M (1995) Minamata disease: methylmercury poisoning in Japan caused by environmental
pollution. Critical reviews in toxicology 25(1): 1–24.
Hausfather Z (2004) India’s Shark Trade: An Analysis of Indian Shark Landings Based on Shark Fin
Exports.
Health Canada (2008) Updating the existing risk management strategy for mercury in retail fish. Health
Canada.
Hindmarsh S (2007) A review of fin-weight ratios for sharks. IOTC. Available from:
http://www.ico.iotc.org/sites/default/files/documents/proceedings/2007/wpby/IOTC-2007-
WPEB-14.pdf (accessed 19 July 2016).
Hofford A (2009) A Price Myth Debunked: Why Shark Fin Soup In Hong Kong Is Not Expensive Anymore.
Available from: http://www.alexhoffordphotography.com/node/2222 (accessed 27 July 2016).
Holsbeek L, Das HK and Joiris CR (1997) Mercury speciation and accumulation in Bangladesh freshwater
and anadromous fish. Science of the total environment 198(3): 201–210.
Hueter RE, Fong WG, Henderson G, et al. (1995) Methylmercury concentration in shark muscle by
species, size and distribution of sharks in Florida coastal waters. In: Mercury as a Global
Pollutant, Springer, pp. 893–899.
Hybenova M, Hrda P, Prochazkova J, et al. (2010) The role of environmental factors in autoimmune
thyroiditis. Neuroendocrinol. Lett 31: 283–289.
IARC (1993) Mercury and mercury compounds. International Agency for Research on Cancer.
ICCAT (2005) Report of the 2004 inter-sessional meeting of the ICCAT subcommittee on by-catches: shark
stock assessment. International Commission for the Conservation of Atlantic Tunas and tuna-
like Species (ICCAT).
IUCN (2016) The IUCN Red List of Threatened Species. International Union for Conservation of Nature
and Natural Resources. Available from: http://www.iucnredlist.org/ (accessed 3 August 2016).
Jagiello G and Lin JS (1973) An assessment of the effects of mercury on the meiosis of mouse ova.
Mutation Research/Fundamental and Molecular Mechanisms of Mutagenesis 17(1): 93–99.
Jiang G-B, Shi J-B and Feng X-B (2006) Mercury pollution in China. Environmental Science & Technology
40(12): 3672–3678.
Jitaru P and Adams F (2004) Toxicity, sources and biogeochemical cycle of mercury. In: Journal de
Physique IV, pp. 185–193.
Johnson FO and Atchison WD (2009) The role of environmental mercury, lead and pesticide exposure in
development of amyotrophic lateral sclerosis. Neurotoxicology 30(5): 761–765.
Kanabrocki EL, Greco J, Graham LA, et al. (1976) Trace elements in human pituitary. International journal

75
of nuclear medicine and biology 3(2): 73–76.
Kaneko JJ and Ralston NV (2007) Selenium and mercury in pelagic fish in the central north Pacific near
Hawaii. Biological Trace Element Research 119(3): 242–254.
Karacs S (2016) Shark fin soup still served at 98 per cent of Hong Kong restaurants as restaurants choose
money over environmentally friendly practices. South China Morning Post. Available from:
http://www.scmp.com/news/hong-kong/health-environment/article/1905257/shark-fin-soup-
still-served-98-cent-hong-kong (accessed 31 July 2016).
Kazantzis G (2002) Mercury exposure and early effects: an overview. Medicina del Lavoro 93(3): 139–
147.
Kenyon KW (1969) The sea otter in the eastern Pacific Ocean. US Fish and Wildlife Service.
KFDA (Korean Food and Drug Administration) (2010) Risk profile of methylmercury. Korean Food and
Drug Administration.
Kim DS, Lee EH, Yu SD, et al. (2005) Heavy metal as risk factor of cardiovascular disease - an analysis of
blood lead and urinary mercury. Journal of preventive medicine and public health 38(4): 401–
407.
Kim SJ, Lee HK, Badejo AC, et al. (2016) Species-specific accumulation of methyl and total mercury in
sharks from offshore and coastal waters of Korea. Marine pollution bulletin 102(1): 210–215.
Kitchell JF, Essington TE, Boggs CH, et al. (2002) The role of sharks and longline fisheries in a pelagic
ecosystem of the central Pacific. Ecosystems 5(2): 202–216.
Kjellström T, Kennedy P, Wallis S, et al. (1986) Physical and mental development of children with
prenatal exposure to mercury from fish. Stage 1. Interviews and psychological tests at age 4.
Food and Agriculture Organization of the United Nations.
Kjellström T, Kennedy P, Wallis S, et al. (1989) Physical and mental development of children with
prenatal exposure to mercury from fish. Stage 2. Interviews and psychological tests at age 6.
Food and Agriculture Organization of the United Nations, World Health Organization.
Klinck J, Dunbar M, Brown S, et al. (2005) Influence of water chemistry and natural organic matter on
active and passive uptake of inorganic mercury by gills of rainbow trout (Oncorhynchus mykiss).
Aquatic Toxicology 72(1–2): 161–175.
Kudo A and Mortimer DC (1979) Pathways for mercury uptake by fish from bed sediments.
Environmental Pollution (1970) 19(3): 239–245.
Lack M, Sant G and others (2006) Confronting shark conservation head on! Food and Agriculture
Organization of the United Nations, World Health Organization.
Landrigan PJ (2010) What causes autism? Exploring the environmental contribution. Current opinion in
pediatrics 22(2): 219–225.
Langford NJ and Ferner RE (1999) Toxicity of mercury. Journal of human hypertension 13(10): 651–656.
Lee MM, Wu-Williams A, Whittemore AS, et al. (1994) Comparison of dietary habits, physical activity
and body size among Chinese in North America and China. International Journal of
Epidemiology 23(5): 984–990.
Leung TY, Choy CMY, Yim S-F, et al. (2001) Whole blood mercury concentrations in sub-fertile men in
Hong Kong. Australian and New Zealand Journal of Obstetrics and Gynaecology 41(1): 75–77.

76
Li H, Yao W and Yang J (1995) [Analysis of biochemical components of seminal plasma in male workers
exposed to mercury vapor]. Zhonghua yu fang yi xue za zhi [Chinese journal of preventive
medicine] 29(6): 351–353.
Li PJ (2007) Enforcing wildlife protection in China the legislative and political solutions. China
Information 21(1): 71–107.
Li WC and Tse HF (2015) Health risk and significance of mercury in the environment. Environmental
Science and Pollution Research 22(1): 192–201.
Li Y, Gong Y, Chen X, et al. (2014) Trophic ecology of sharks in the mid-east Pacific ocean inferred from
stable isotopes. Journal of Ocean University of China 13(2): 278–282.
Liu C, Gao D, Preston GM, et al. (1995) High water permeability of human spermatozoa is mercury-
resistant and not mediated by CHIP28. Biology of reproduction 52(4): 913–919.
Liu G, Cai Y and O’Driscoll NJ (2012) Environmental chemistry and toxicology of mercury. Wiley.
Man YB, Wu SC and Wong MH (2014) Shark fin, a symbol of wealth and good fortune may pose health
risks: the case of mercury. Environmental geochemistry and health 36(6): 1015–1027.
Marcovecchio JE, Moreno VJ and Pérez A (1991) Metal accumulation in tissues of sharks from the Bahia
Blanca Estuary, Argentina. Marine Environmental Research 31(4): 263–274.
Mason RP and Benoit JM (2003) Organomercury compounds in the environment. In: Organometallic
compounds in the environment, Wiley, pp. 57–99.
Mazaba Lara JJ (2015) Determinación de plomo (Pb) y mercurio (Hg) en aletas e hígados de tiburón
martillo (Sphyrna lewini), provenientes de Chachalacas, Veracruz, México.
Maz-Courrau A, López-Vera C, Galván-Magaña F, et al. (2011) Bioaccumulation and Biomagnification of
Total Mercury in Four Exploited Shark Species in the Baja California Peninsula, Mexico. Bulletin
of Environmental Contamination and Toxicology 88(2): 129–134.
McAuley RB, Simpfendorfer CA, Hyndes GA, et al. (2006) Validated age and growth of the sandbar shark,
Carcharhinus plumbeus (Nardo 1827) in the waters off Western Australia. Environmental
Biology of Fishes 77(3–4): 385–400.
McGregor AJ and Mason HJ (1991) Occupational mercury vapour exposure and testicular, pituitary and
thyroid endocrine function. Human & experimental toxicology 10(3): 199–203.
McKinney MA, Dean K, Hussey NE, et al. (2015) Global versus local causes and health implications of
high mercury concentrations in sharks from the east coast of South Africa. Science of The Total
Environment 541: 176–183.
Medved RJ, Stillwell CE and Casey JJ (1985) Stomach contents of young sandbar sharks, Carcharhinus
plumbeus, in Chincoteague Bay, Virginia. Fishery Bulletin 83(3): 395–402.
MOE (2002) Minamata disease the history and measures. Environmental health department, Ministry of
the Environment Government of Japan.
Monteiro LR, Costa V, Furness RW, et al. (1996) Mercury concentrations in prey fish indicate enhanced
bioaccumulation in mesopelagic environments. Marine Ecology Progress Series 141: 21–25.
Morita M, Yoshinaga J and Edmonds JS (1998) The determination of mercury species in environmental
and biological samples (technical report). Pure and Applied chemistry 70(8): 1585–1615.
77
Myers RA, Baum JK, Shepherd TD, et al. (2007) Cascading effects of the loss of apex predatory sharks
from a coastal ocean. Science 315(5820): 1846–1850.
Nalluri D, Baumann Z, Abercrombie DL, et al. (2014) Methylmercury in dried shark fins and shark fin
soup from American restaurants. Science of the Total Environment 496: 644–648.
Nam D-H, Adams DH, Reyier EA, et al. (2011) Mercury and selenium levels in lemon sharks (Negaprion
brevirostris) in relation to a harmful red tide event. Environmental monitoring and assessment
176(1–4): 549–559.
Natanson LJ (2001) Preliminary investigations into the age and growth of the shortfin mako, Isurus
oxyrinchus, white shark, Carcharodon carcharias, and thresher shark, Alopias vulpinus, in the
Western North Atlantic Ocean. International Commission for the Conservation of Atlantic Tunas
- Standing Committee on Research and Statistics.
Nicolaus EM, Bendall VA, Bolam TP, et al. (2016) Concentrations of mercury and other trace elements in
porbeagle shark Lamna nasus. Marine Pollution Bulletin.
Nishigaki S and Harada M (1975) Methylmercury and selenium in umbilical cords of inhabitants of the
Minamata area.
NMFS (2005) US National Marine Fisheries Service. 2005 Report to Congress Pursuant to the Shark
Finning Prohibition Act of 2000.
Núñez Nogeira G, Bautista Ordoñez J and Rosiles Martínez R (1998) Concentración y distribución de
mercurio en tejidos del cazón (Rhizoprionodon terraenovae) del Golfo de México. Vet. Mex
29(1): 15–21.
Nylander M (1986) Mercury in pituitary glands of dentists. The Lancet 327(8478): 442.
O’Bryhim JR (2015) The Shark Trade in Costa Rica: Genetics, Mercury Contamination and Human
Dimensions and the Implications for Conservation. George Mason University.
Oceana (2009) Keeping the balance - How environmental conventions can be used to protect sharks and
their habitats.
Oceana (2009b) The race for threatened sharks - the tragedy for non-managed species.
Olson KR, Bergman HL and Fromm PO (1973) Uptake of methyl mercuric chloride and mercuric chloride
by trout: a study of uptake pathways into the whole animal and uptake by erythrocytes in vitro.
Journal of the Fisheries Board of Canada 30(9): 1293–1299.
Paine RT (1980) Food webs: linkage, interaction strength and community infrastructure. Journal of
Animal Ecology 49(3): 667–685.
Pamela TLG (2015) Man Eating Shark: Unravelling the Debate on the (un)ethical Consumption of Shark’s
Fin in Singapore.
Papu-Zamxaka V, Mathee A, Harpham T, et al. (2010) Elevated mercury exposure in communities living
alongside the Inanda Dam, South Africa. Journal of Environmental Monitoring 12(2): 472–477.
Penjai S, Jinnathum H, Somjet S, et al. (2008) An assessment of mercury concentration in fish tissues
caught from three compartments of Bay of Bengal.
Pesch A and Wilhelm M (2002) Mercury concentrations in urine, scalp hair, and saliva in children from
Germany. Journal of Exposure Analysis & Environmental Epidemiology 12(4).
78
Pethybridge H, Cossa D and Butler EC (2010) Mercury in 16 demersal sharks from southeast Australia:
biotic and abiotic sources of variation and consumer health implications. Marine Environmental
Research 69(1): 18–26.
Philbert MA, Billingsley ML and Reuhl KR (2000) Mechanisms of injury in the central nervous system.
Toxicologic pathology 28(1): 43–53.
Phillips GR and Buhler DR (1978) The relative contributions of methylmercury from food or water to
rainbow trout (Salmo gairdneri) in a controlled laboratory environment. Transactions of the
American Fisheries Society 107(6): 853–861.
Pilling GM, Apostolaki P, Failler P, et al. (2009) Assessment and management of data-poor fisheries.
Advances in fisheries science 50: 280–305.
Pirrone N and Mahaffey KR (2005) Dynamics of mercury pollution on regional and global scales:
atmospheric processes and human exposures around the world. Springer Science & Business
Media.
Randall JE, Allen GR and Steene RC (1997) Fishes of the great barrier reef and coral sea. University of
Hawaii Press.
Raymond LJ and Ralston NV (2004) Mercury: selenium interactions and health implications. Seychelles
Medical and Dental Journal 7(1): 72–77.
Reuhl KR, Chang LW and Townsend JW (1981) Pathological effects of in utero methylmercury exposure
on the cerebellum of the golden hamster: I. Early effects upon the neonatal cerebellar cortex.
Environmental research 26(2): 281–306.
Rice KM, Walker EM, Wu M, et al. (2014) Environmental mercury and its toxic effects. Journal of
preventive medicine and public health 47(2): 74–83.
Richardson M (1993) Reproductive toxicology. Vch Pub.
Richardson M (1993) Reproductive toxicology. VCH Verlagsgesellschaft, Weinheim, New York, Basel,
Cambridge, Tokyo.
Risher JF (2003) Elemental mercury and inorganic mercury compounds: human health aspects. Concise
International Chemical Assessment Document.
Rose DA (1996) An overview of world trade in sharks and other cartilaginous fishes. Traffic International.
Available from: http://afrilib.odinafrica.org/handle/0/16415 (accessed 10 August 2016).
Rossi AD, Larsson O, Manzo L, et al. (1993) Modifications of Ca2+ signaling by inorganic mercury in PC12
cells. The FASEB journal 7(15): 1507–1514.
Rumbold D, Wasno R, Hammerschlag N, et al. (2014) Mercury Accumulation in Sharks From the Coastal
Waters of Southwest Florida. Arch Environ Contam Toxicol 67(3): 402–412.
Sakamoto M, Nakano A and Akagi H (2001) Declining Minamata male birth ratio associated with
increased male fetal death due to heavy methylmercury pollution. Environmental Research
87(2): 92–98.
Salonen JT, Seppänen K, Nyyssönen K, et al. (1995) Intake of mercury from fish, lipid peroxidation, and
the risk of myocardial infarction and coronary, cardiovascular, and any death in eastern Finnish
men. Circulation 91(3): 645–655.
Schmitz OJ, Hambäck PA and Beckerman AP (2000) Trophic cascades in terrestrial systems: a review of
79
the effects of carnivore removals on plants. The American Naturalist 155(2): 141–153.
Schofield P (2005) Dementia associated with toxic causes and autoimmune disease. International
Psychogeriatrics 17(s1): S129–S147.
Seashepherd (2016) Is it Legal? Available from: http://www.seashepherd.org/requiem/is-it-legal.html.
Shafer TJ and Atchison WD (1989) Block of 45Ca uptake into synaptosomes by methylmercury: Ca2+
- and
Na+-dependence. Journal of Pharmacology and Experimental Therapeutics 248(2): 696–702.
Shea S (2016) Personal Notes. Bloom Association Hong Kong.
Shivji MS, Chapman DD, Pikitch EK, et al. (2005) Genetic profiling reveals illegal international trade in fins
of the great white shark, Carcharodon carcharias. Conservation Genetics 6(6): 1035–1039.
Sikorski R, Juszkiewicz T, Paszkowski T, et al. (1987) Women in dental surgeries: reproductive hazards in
occupational exposure to metallic mercury. International archives of occupational and
environmental health 59(6): 551–557.
Silbergeld EK, Silva IA and Nyland JF (2005) Mercury and autoimmunity: implications for occupational
and environmental health. Toxicology and applied pharmacology 207(2): 282–292.
Singapore Food Recipes (2012) How to make Shark’s Fin Soup. Available from:
http://www.singaporelocalfavourites.com/2012/02/how-to-make-sharks-fin-soup.html
(accessed 18 July 2016).
Singh VK (2009) Phenotypic expression of autoimmune autistic disorder (AAD): a major subset of autism.
Ann Clin Psychiatry 21(3): 148–161.
Sommer C (1996) The living marine resources of Somalia. Food and Agriculture Organization of the
United Nations.
Sørensen N, Murata K, Budtz-Jørgensen E, et al. (1999) Prenatal methylmercury exposure as a
cardiovascular risk factor at seven years of age. Epidemiology: 370–375.
Stachowicz JJ, Bruno JF and Duffy JE (2007) Understanding the effects of marine biodiversity on
communities and ecosystems. Annual Review of Ecology, Evolution and Systematics: 739–766.
Stein ED, Cohen Y and Winer AM (1996) Environmental distribution and transformation of mercury
compounds. Critical reviews in Environmental Science and technology 26(1): 1–43.
Stern AH, Gochfeld M, Weisel C, et al. (2001) Mercury and methylmercury exposure in the New Jersey
pregnant population. Archives of Environmental Health: An International Journal 56(1): 4–10.
Stevens JD, Bonfil R, Dulvy NK, et al. (2000) The effects of fishing on sharks, rays, and chimaeras
(chondrichthyans), and the implications for marine ecosystems. ICES Journal of Marine Science:
Journal du Conseil 57(3): 476–494.
Storelli MM and Marcotrigiano GO (1999) Cadmium and total mercury in some cephalopods from the
South Adriatic Sea (Italy). Food Additives & Contaminants 16(6): 261–265.
Storelli MM and Marcotrigiano GO (2000) Total, organic and inorganic arsenic and mercury in
crustaceans (Squilla mantis). Italian journal of food science 12(3): 365–370.
Storelli MM and Marcotrigiano GO (2002) Mercury speciation and relationship between mercury and
selenium in liver of Galeus melastomus from the Mediterranean Sea. Bulletin of environmental
contamination and toxicology 69(4): 516–522.
80
Storelli MM, Giacominelli Stuffler R and Marcotrigiano GO (2001) Total mercury and methylmercury in
tuna fish and sharks from the south Adriatic Sea. Italian Journal of Food Science 13(1): 101–106.
Storelli MM, Giacominelli-Stuffler R and Marcotrigiano G (2002a) Mercury Accumulation and Speciation
in Muscle Tissue of Different Species of Sharks from Mediterranean Sea, Italy. Bulletin of
Environmental Contamination and Toxicology 68(2): 201–210.
Storelli MM, Stuffler RG and Marcotrigiano GO (2002b) Total and methylmercury residues in tuna-fish
from the Mediterranean Sea. Food Additives & Contaminants 19(8): 715–720.
Storelli MM, Ceci E, Storelli A, et al. (2003) Polychlorinated biphenyl, heavy metal and methylmercury
residues in hammerhead sharks: contaminant status and assessment. Marine Pollution Bulletin
46(8): 1035–1039.
Streets DG, Hao J, Wu Y, et al. (2005) Anthropogenic mercury emissions in China. Atmospheric
environment 39(40): 7789–7806.
Suk SH, Smith SE and Ramon DA (2009) Bioaccumulation of mercury in pelagic sharks from the northeast
Pacific Ocean. CalCOFI Rep 50: 172–177.
Taguchi M, Yasuda K, Toda S, et al. (1979) Study of metal contents of elasmobranch fishes: part 1—
metal concentration in the muscle tissues of a dogfish, squalus mitsukurii. Marine
Environmental Research 2(3): 239–249.
Takeuchi T (1977) Neuropathology of Minamata disease in Kumamoto: especially at the chronic stage.
Neurotoxicology 1: 235–246.
Takizawa Y and others (1970) Studies on the Niigata episode of Minamata disease outbreak.
Investigation of causative agents of organic mercury poisoning in the district along the river
Agano. Acta medica biologica 17: 293–297.
Tan SW, Meiller JC and Mahaffey KR (2009) The endocrine effects of mercury in humans and wildlife.
Critical reviews in toxicology 39(3): 228–269.
Tatsukawa R and Tanabe S (1984) Environmental monitoring: geochemical and biochemical behavior of
PCBs in the open ocean environment. Proceedings of PCB Seminar. Ministry of Housing, Physical
Planning and Environment, The Netherlands.
Taylor VB and Bedford DW (2001) Shortfin mako shark. California’s Living Marine Resources: A Status
Report: 336–337.
Terborgh J and Estes JA (2013) Trophic cascades: predators, prey, and the changing dynamics of nature.
Island Press.
Thaxton P, Parkhurst CR, Cogburn LA, et al. (1975) Adrenal function in chickens experiencing mercury
toxicity. Poultry science 54(2): 578–584.
Thorlacius-Ussing O, Møller-Madsen B and Danscher G (1985) Intracellular accumulation of mercury in
the anterior pituitary of rats exposed to mercuric chloride. Experimental and molecular
pathology 42(2): 278–286.
Thurston SW, Bovet P, Myers GJ, et al. (2007) Does prenatal methylmercury exposure from fish
consumption affect blood pressure in childhood? Neurotoxicology 28(5): 924–930.
TRAFFIC (2010) Understanding the motivations: the first step toward influencing China’s unsustainable
wildlife consumption. TRAFFIC East Asia, Hong Kong.
81
Tsubaki T (1975) Studies on the Health Effects of Alkylmercury in Japan. Environmental Agency, Japan.
Tsubaki T and Takahashi H (1986) Recent advances in Minamata disease studies: methylmercury
poisoning in Minamata and Niigata, Japan. Kodansha.
Tsui B (2013) Souring on Shark Fin Soup. The New York Times. Available from:
http://www.nytimes.com/2013/06/30/opinion/sunday/souring-on-shark-fin-soup.html
(accessed 28 July 2016).
Turoczy NJ, Laurenson LJB, Allinson G, et al. (2000) Observations on metal concentrations in three
species of shark (Deania calcea, Centroscymnus crepidater, and Centroscymnus owstoni) from
southeastern Australian waters. Journal of agricultural and food chemistry 48(9): 4357–4364.
Ullrich SM, Tanton TW and Abdrashitova SA (2001) Mercury in the aquatic environment: a review of
factors affecting methylation. Critical reviews in environmental science and technology 31(3):
241–293.
UNEP (2008) Guidance for Identifying Populations at Risk from Mercury Exposure. Geneva, Switzerland:
UNEP (United Nations Environmental Programme) DTIE Chemical Branch and WHO Department
of Food Safety, Zoonoses and Foodborne Diseases.
United Nations Population Division (2016) World Population Prospects - Population Division - United
Nations. Available from: https://esa.un.org/unpd/wpp/ (accessed 18 July 2016).
US EPA (2001a) Mercury Update: Impact on Fish Advisories. Washington, DC, USA: US Environmental
Protection Agency.
US EPA (2001b) Water quality criterion for the protection of human health: Methylmercury. Washington,
DC, USA: Office of Science and Technology, Office of Water, United States Environmental
Protection Agency.
Vachhrajani KD and Chowdhury AR (1990) Distribution of mercury and evaluation of testicular
steroidogenesis in mercuric chloride and methylmercury administered rats. Indian journal of
experimental biology 28(8): 746–751.
Vannuccini S (1999) Shark utilization, marketing, and trade. FAO Fisheries Technical Paper, Rome: Food
and Agriculture Organization of the United Nations, World Health Organization.
Vas P and Gordon JD (1993) Trace metals in deep-sea sharks from the Rockall Trough. Marine Pollution
Bulletin 26(7): 400–402.
Vincent AC (2002) Ecological issues and the trades in live reef fishes. Coral reef fishes: Dynamics and
diversity in a complex ecosystem: 391.
Vogel DG, Margolis RL and Mottet NK (1985) The effects of methyl mercury binding to microtubules.
Toxicology and applied pharmacology 80(3): 473–486.
Wada H, Cristol DA, McNabb FA, et al. (2009) Suppressed adrenocortical responses and thyroid
hormone levels in birds near a mercury-contaminated river. Environmental science &
technology 43(15): 6031–6038.
Walker TI (1976) Effects of species, sex, length and locality on the mercury content of school shark
Galeorhinus australis (Macleay) and gummy shark Mustelus antarcticus Guenther from south-
eastern Australian waters. Marine and Freshwater Research 27(4): 603–616.
Warren HV (1989) Geology, trace elements and health. Social Science & Medicine 29(8): 923–926.
82
Watling RJ, McClurg TP and Stanton RC (1981) Relation between mercury concentration and size in the
mako shark. Bulletin of Environmental Contamination and Toxicology 26(1): 352–358.
Watras CJ, Back RC, Halvorsen S, et al. (1998) Bioaccumulation of mercury in pelagic freshwater food
webs. Science of the Total Environment 219(2): 183–208.
Watson J and Estes JA (2011) Stability, resilience, and phase shifts in rocky subtidal communities along
the west coast of Vancouver Island, Canada. Ecological Monographs 81(2): 215–239.
Watts S (2001) The End of the Line? Global Threats to Sharks. Wild Aid.
WHO (1990) Environmental health criteria 110: Methylmercury. Geneva, Switzerland: World Health
Organisation.
WHO (1991) Environmental health criteria 118: Inorganic mercury. Geneva, Switzerland: World Health
Organisation.
WildAid (2014) Evidence of Declines in Shark Fin Demand China. Wild Aid.
Working PK, Bus JS and Hamm TE (1985) Reproductive effects of inhaled methyl chloride in the male
Fischer 344 rat: II. Spermatogonial toxicity and sperm quality. Toxicology and applied
pharmacology 77(1): 144–157.
Worm B, Barbier EB, Beaumont N, et al. (2006) Impacts of biodiversity loss on ocean ecosystem services.
science 314(5800): 787–790.
WWF (2011) WWF Hong Kong - Seafood Choice Initiative. Available from: http://www.wwf.org.hk/en/
whatwedo/footprint/seafood/sci/ (accessed 27 July 2016).
Yang XG, Li YP, Ma GS, et al. (2005) Study on weight and height of the Chinese people and the
differences between 1992 and 2002. Zhonghua liu xing bing xue za zhi - Zhonghua
liuxingbingxue zazhi 26(7): 489–493.
Yorifuji T, Tsuda T and Kawakami N (2007) Age standardized cancer mortality ratios in areas heavily
exposed to methyl mercury. International archives of occupational and environmental health
80(8): 679–688.
Zadnik V and Pompe-Kirn V (2007) Effects of 500-year mercury mining and milling on cancer incidence in
the region of Idrija, Slovenia. Collegium antropologicum 31(3): 897–903.
Zhang L and Wong MH (2007) Environmental mercury contamination in China: sources and impacts.
Environment international 33(1): 108–121.
Zhang L, Hua N and Sun S (2008) Wildlife trade, consumption and conservation awareness in southwest
China. Biodiversity and Conservation 17(6): 1493–1516.
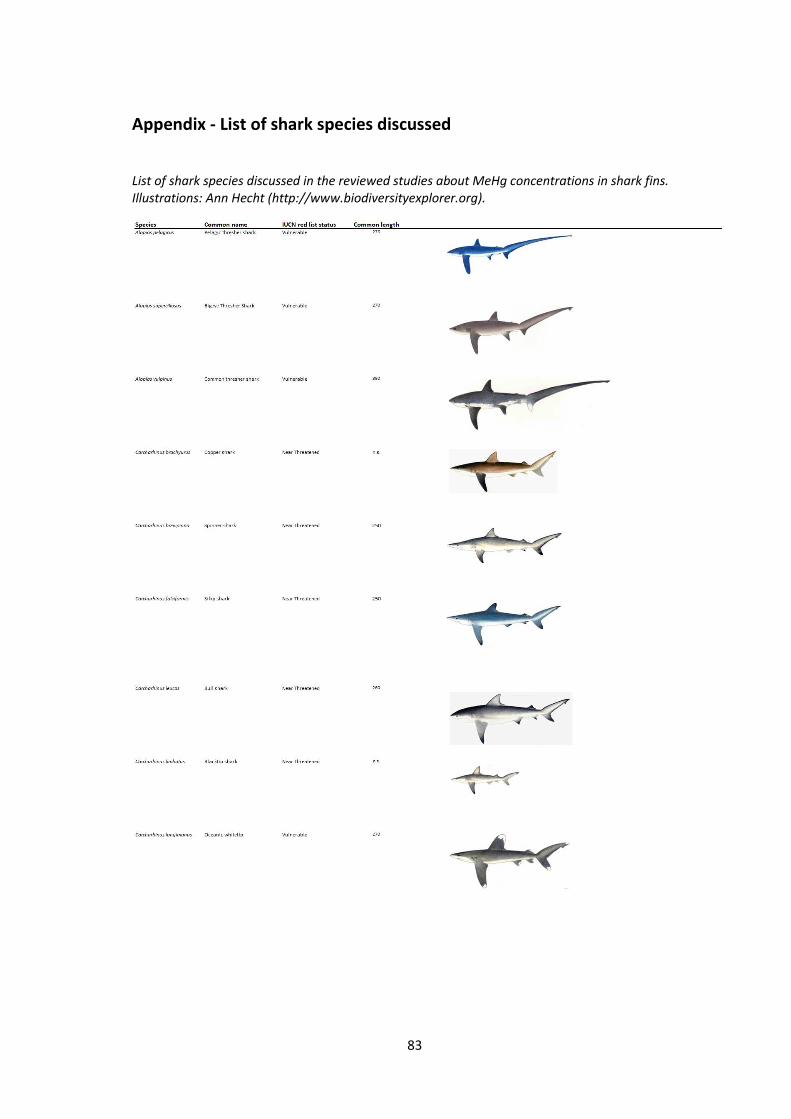
83
Appendix - List of shark species discussed
List of shark species discussed in the reviewed studies about MeHg concentrations in shark fins.
Illustrations: Ann Hecht (http://www.biodiversityexplorer.org).

84