Embed Size (px)
Citation preview

Who Lives in the C-Suite?
Organizational Structure and the
Division of Labor in Top Management
_______________
Maria GUADALUPE
Hongyi LI
Julie WULF
2012/118/EPS

Who Lives in the C-Suite?
Organizational Structure and the Division of Labor in Top Management
Maria Guadalupe*
Hongyi Li**
Julie Wulf***
June 14th, 2012
We would like to thank Erik Brynjolfsson, David Collis, Wouter Dessein, Bob Gibbons, Shane Greenstein, Don
Hambrick, Connie Helfat, Bruce Harreld, Anne Marie Knott, Kristina McElheran, Gabriel Natividad, Paul Oyer,
Heikki Rantakari, Jim Rebitzer, Julio Rotemberg, Raffaella Sadun, Tano Santos, John Van Reenen, David
Yoffie, Tim Van Zandt, and especially Jim Dana for very helpful discussions. Thanks also to seminar
participants at IESE, LBS, the NBER Organizational Economics meeting, UCLA, Washington University, HBS
strategy conference, HBS brown bag and to Erik Brynjolfsson and Lorin Hitt, for the Harte Hanks data.
* Associate Professor of Economics and Political Sciences at INSEAD, Boulevard de Constance
77305 Fontainebleau Cedex. Email: [email protected]
** Postdoctoral Associate, Applied Economics Group at MIT Sloan School of Management, 100
Main Street, E62-513, Cambridge MA 02142, USA. Email: [email protected]
*** Associate Professor of Business Administration at Harvard Business School, Soldiers Field
Road, Boston, MA 02163
A Working Paper is the author’s intellectual property. It is intended as a means to promote research to
interested readers. Its content should not be copied or hosted on any server without written permission
from [email protected]
Find more INSEAD papers at http://www.insead.edu/facultyresearch/research/search_papers.cfm

Abstract
This paper shows that top management structures in large US firms have changed
significantly since the mid-1980s. While the size of the executive team – the group of
managers reporting directly to the CEO – doubled during this period, this growth was driven
primarily by an increase in functional managers rather than general managers. Using panel
data on senior management positions, we explore the relationship between changes in the
structure of the executive team, firm diversification, and IT investments—which arguably
alter returns to exploiting synergies through corporate-wide coordination by functional
managers in headquarters. We find that the number of functional managers closer to the
product (―product‖ functions i.e., marketing, R&D) increases as firms become less
diversified, while the number of functional managers farther from the product
(―administrative‖ functions i.e., finance, law, HR) increases with IT investments. Finally, we
show that general manager pay decreases as functional managers join the executive team
suggesting a shift in activities from general to functional managers— a phenomenon we term
―functional centralization.‖
Key words: communication, organizational design, functions, centralization, M-form,
hierarchy, top management team, information technology, activities, diversification.
2""
I. Introduction
“We learned from experience that work of higher quality could be obtained by utilizing,
corporation-wide, the highly developed talents of the [functional] specialists.”
Alfred P. Sloan, Jr. “My Years with General Motors” (1963)
Modern corporations are typically run by a group of executives that go beyond the Chief
Executive Officer (CEO). Although the executive team, commonly known as the C-Suite, is the focus of
extensive research on top management teams by management scholars (e.g., Hambrick and Mason, 1984),
we know less about the structure and the allocation of roles among the positions reporting directly to the
CEO, and how these have changed over time.1 This is important because the executive team is a reflection
of the firm’s organizational structure, as well as the governing body that sets firm strategy, coordinates
activities and allocates resources across business units. Using a unique panel dataset rich in details of
managerial job descriptions, reporting relationships and compensation structures for senior management
positions in large US firms over two decades (1986-2006), this paper documents the relationship between
the executive team structure -- a key organizational design choice -- and strategy variables such as
diversification and IT investments. In doing so, we offer some insights into the determinants of firm
organizational structure – issues that have long been central to the strategy literature (e.g., Chandler 1962;
Lawrence and Lorsch, 1967).
Our analysis is motivated by the following novel observation, which we document in Section II:
from the mid-1980s to the mid-2000s, the size of the executive team (defined as the number of positions
reporting directly to the CEO) doubled from 5 to 10 positions, with approximately three-fourths of the
increase attributable to functional managers rather than general managers. 2 To understand this trend and
what it implies about firm organizational structure, we appeal to existing ideas in management theory.
Start with the observation that firms perform activities associated with various functions (marketing,
sales, finance, etc.) (e.g., Porter, 1985). For each function, synergies can be realized from coordinating
activities across multiple business units (e.g., Galbraith, 1971; Rivkin and Siggelkow, 2003), and such
"""""""""""""""""""""""""""""""""""""""""""""""""""""""""""""1While much of the empirical research in management on top management teams (TMT) focuses on the characteristics of the individual manager (e.g., tenure, education, experience and functional skills), we focus instead on the structure of the executive team and on the distribution of roles within the team. More recent research in management has analyzed individual TMT positions (e.g., COO, CMO, CIO), yet there is limited evidence on the structure of the functional TMT members as a group, their reporting relationship to the CEO, and what this implies about the underlying organizational structure of the firm (see Collis, Young and Goold, 2007; and surveys by Carpenter, Geletkanycz, and Sanders, 2004; Finkelstein, Hambrick, and Cannella, 2009; Menz, 2011; Beckman and Burton, 2011). "2 In this paper, we define the executive team or members of the C-Suite (e.g., Groysberg, Kelly, and MacDonald, 2011) as the positions that report directly to the CEO in the organizational hierarchy; i.e. the CEO’s span of control.

3""
coordination is often achieved with activities being centralized at corporate headquarters (under
corporate-level functional managers) instead of being left in the hands of business units (e.g., Hill and
Hoskinsson, 1987; Argyres, 1995). This leads naturally to the view of the organization as an information
processor, with managers in charge of “gathering, interpreting and synthesizing information” (e.g.
Galbraith, 1974; Tushman and Nadler, 1978). Therefore, to explain this shift in the structure of the C-
Suite, we consider two major trends in the environment in which firms operate that have altered the
ability to exploit synergies, and to communicate and process information inside the firm. First, large US
firms have become less diversified in response to increased global competition and demanding capital
markets, which clearly alters the potential for synergies. Second, firms have dramatically increased
investments in information technology (IT) as costs have declined, which changes the costs of
communicating and processing information inside the firm.
Our main findings document how firm diversification and IT investments affect the presence of
functional managers in the executive team. First," firms that became less diversified also increased the
number of functional managers in front-end / “product” functions (e.g., sales, marketing), but not in back-
end / “administrative” functions (e.g. finance, HR). Second, when firms invest in information technology,
they increase the number of functional managers in “administrative” functions; in contrast, the number of
functional managers in “product” functions increases with IT investment only in less diversified firms.
Third, we find that changes in the structure at the top affect pay at various levels of the organization: for
example, in position-level regressions, division manager (general manager) pay declined by 5.4 percent as
an additional front-end or “product” functional manager joined the executive team.
The idea that firms increasing their business relatedness also increase the number of corporate-
level functional managers is familiar to the management and strategy literatures. One well-known
example is Lou Gerstner’s turnaround of IBM in the mid-1990s. Before Gerstner was hired as CEO, IBM
operated in related information technology businesses, but with poor coordination across businesses. The
executive team was comprised primarily of general managers of business units (e.g., mainframes) and
very few functional managers. Gerstner joined IBM in 1993 and deliberately “centralized” select
functional activities to move away from the “balkanized IBM of the early 1990’s”,3 which resulted
partially from the inordinate power of the mainframes division (Argyres, 1995). Not long into his tenure,
Gerstner changed the firm’s strategy to one based on an integrated product and service offering to
customers (“One IBM”). Since the new strategy required extensive coordination across business units,
Gerstner reorganized the top team and added functional managers to facilitate corporate-wide
coordination (see Exhibit 1). For example, he created a Chief Marketing Officer position (CMO) and
filled the position with an external hire. Historically, all marketing activities were performed within the """""""""""""""""""""""""""""""""""""""""""""""""""""""""""""3"Gerstner, Louis, Jr., “Who Says Elephants Can’t Dance,” Harper Collins, New York, p. 77, 2002.

4""
individual business units, which led to 100 marketing campaigns, overseen by various advertising
agencies.4 To better coordinate marketing activities across all businesses and unify IBM’s global brand,
the new CMO consolidated all of IBM’s buying, planning and direct marketing in the hands of one
advertising agency. Another illustration of how corporate-level functional managers are used to capture
synergies is Procter & Gamble’s shift in 1989 toward a matrix organization which included functional
senior vice presidents to manage functions across business units in order to promote “the pooling of
knowledge, transfer of best practices, elimination of intraregional redundancies, and standardization of
activities.”5 Both examples illustrate the idea, confirmed by our empirical analysis, that corporate-level
functional managers may be used to exploit potential synergies, particularly in less diversified firms. In
what follows, we will loosely refer to the presence of a functional manager reporting to the CEO as
“functional centralization,” acknowledging that some functional activities may still be performed within
the business unit. 6
Existing theories can provide insight into why changes in firm diversification and IT investments
may have an effect on the structure of the top team (in this case, the extent of functional centralization).
As firms narrow their business portfolios, they increase opportunities for synergies (e.g., Rumelt, 1974;
Hill and Hoskisson, 1987; Hill, 1988); also, as they increase IT investments, they reduce communication
and information processing costs (e.g., Malone, Benjamin and Yates 1987; Gurbaxani and Whang 1991)
and hence the costs of exploiting synergies (e.g., Dessein and Santos, 2006; Cremer, Garicano and Prat,
2007). Both trends could lead to additional corporate-level functional managers as the gains from
coordinating activities across business units increase and the costs of coordination decline.
However, beyond explaining the broad trends and correlations, existing models do not adequately
explain the nuances in our results: specifically, how firm diversification, IT investments and functional
type interact in determining firms’ choices over functional centralization. To explain these heterogeneous
effects, we advance the perspective that it is important to take into account the nature of the information
required by the different functions. We suggest that front-end or “product” functions (e.g., marketing) use
information that is product-specific and harder to aggregate across businesses. In contrast, back-end or
“administrative” functions (e.g., finance) use information that is easier to aggregate because it is less
product-specific.7 As we discuss in Section V, this distinction between types of functions allows us to
interpret all our results. We hope that this distinction will guide scholars in developing further theories of
organizational change that incorporate this feature, which seems to be very relevant in the data. """""""""""""""""""""""""""""""""""""""""""""""""""""""""""""4 International Business Machine (IBM), 1994 Annual Report, p.6. 5 Procter & Gamble: Organization 2005 (A), (9-707-519, Piskorski, 2007, pg. 6-7).""6Argyres and Silverman (2004), in a large sample of research-intensive firms, document different types of organizational structures where activities can be performed at the corporate level, divisional level, or both. 7"Chandler’s (1991) description of the finance function is consistent with this view: “Its functions were somewhat less product-specific…” (pg. 33) "

5""
It is important to highlight that the nature of our dataset allows for a very tight empirical
identification over a long time span, which is unusual in this kind of study. We have detailed information
on firm hierarchies and compensation in 300 Fortune 500 companies over 14 years. Having this
longitudinal dimension in the data means that we can identify all our effects by exploiting not only
differences within firms and positions over time, but also differences between types of positions within
firms, such that our results are not confounded by permanent unobserved heterogeneity across firms. The
dataset is also unique since it captures the reporting relationships of executive positions (i.e., CEO’s span
of control) thereby allowing a precise definition of the top team that does not rely on titles and other
measures that can vary significantly across firms and over time. While we cannot argue causality in the
absence of sources of exogenous variation, we can present a set of robust within-firm correlations, which
is rare in this kind of analysis due to data limitations.
Taken as a whole, our results provide a new perspective on Chandler’s insight that “structure
follows strategy.” In particular, we show how the structure of the top management team and the presence
of different types of functional managers at the corporate level are related to key strategic choices such as
firm diversification and IT investment. In doing so, we link the existing top management team (TMT)
literature -- which has generally focused on the demographics of senior managers or individual positions
rather than the structure of the team -- to the strategy literature about organizational structure. Further, our
results have broader implications for organizational form beyond the C-Suite. Our findings, based on a
large sample of US firms over two decades, suggest a movement away from the pure multidivisional M-
form, comprised of largely autonomous general managers (Chandler, 1962; Williamson, 1975, 1985),
towards other forms of organization such as matrix forms (Galbraith, 1972) or the centralized M-form
(Hill, 1988) where functional and general managers coexist in an attempt to capture synergies across
functions and business units. In this sense, our results suggest that key strategy choices such as firm
diversification and IT investments have important and nuanced effects on organizational form, that have
not been uncovered to date.
II: Defining Positions and Identifying Changes in Executive Teams
We define the executive team of an organization as the CEO and the managers that report directly
to him. To make concepts concrete, let us refer to the top team structure for IBM in 1994 (Figure 1). At
the time, Lou Gerstner, the CEO, had fourteen direct reports that can be classified into two broad types of
positions: functional managers and general managers. Functional managers -- or corporate staff -- are
responsible for corporate-wide activities of their specialized function (e.g., finance, legal, marketing,
R&D). In contrast, general managers -- or line managers -- are concerned with a broad range of functional
activities within their business units and typically have profit and loss responsibility. Gerstner’s executive
6""
team included nine functional managers and five general managers including the general managers of the
personal computer business (General Manager -- Personal Systems ) and the mainframe business (General
Manager -- Systems), among others.
Not surprisingly, corporate-level functional managers perform different activities that vary by
function. For example, in the marketing function as illustrated in IBM, CMO responsibilities include “leading the company’s marketing organization; uniting and strengthening various departments’ own marketing plans; directing global marketing efforts, including branding, product marketing, and customer
relationship marketing.” (Nath and Mahajan, 2008, pg. 67). As another example, the corporate R&D
function of Du Pont involved “coordination of research, avoidance of duplication of effort, promulgation
of results which are of interest to more than one department.” (Hounshell and Smith, 1988, pg 108).
Finally, for the finance function, Chandler’s (1991) description states that: “tasks were to coordinate the
flow of funds through the enterprise’s many units and to provide a steady flow of information to enable
top management to monitor performance and allocate resources” (Pg. 33).8
A number of scholars have proposed classifications of functions into categories. Chandler (1991)
talks about entrepreneurial (value-creation) and administrative (loss prevention) functions; Porter (1985)
distinguishes between support activities (finance, HR, systems) and primary activities (manufacturing,
inbound and outbound logistics, sales, after-sales support); Hambrick and Mason (1984) differentiate
between throughput, output, and peripheral functions. These classifications can be seen, at a broader
level, as distinguishing between front-end functions (entrepreneurial, primary, output) and back-end
functions (administrative, support, peripheral). In what follows we will retain this broad distinction and
emphasize one dimension of these classifications that will be relevant in interpreting our results: the
proximity of the function to the final product. Specifically, we categorize functions that are close to the
product as product functions, and functions that are far from the product as administrative functions. We
classify the following functions as front-end or “product” functions: Marketing (Chief Marketing Officer,
CMO), Research & Development (Chief R&D Officer), Sales and Manufacturing. We classify the
following functions as back-end or “administrative” functions: Finance (Chief Financial Officer, CFO),
Law (General Counsel), Human Resources (Chief Human Resources Officer, CHRO), Information
Technology (Chief Information Officer, CIO), Strategy (Long-Range Planning & Business Development)
and Public Relations (PR or Communications Officer). IBM’s Gerstner had three product functional
managers and six administrative functional managers reporting directly to the CEO.
"""""""""""""""""""""""""""""""""""""""""""""""""""""""""""""8"In addition, it is well-known that managers at the top of the hierarchy have extensive visibility (both internal and external) and have direct access and interaction with the CEO, arguably the scarcest and most valuable human capital resource (Bandiera, Prat, Sadun and Wulf, 2011). Managers reporting directly to the CEO often comprise the Executive Committee which is the most influential decision-making body in large organizations. According to CEOs, managers that report directly to the CEO tend to “have a seat at the table” which means that they are important and influential members of the senior management team (Wulf, 2012; Neilson and Wulf, 2012). "
7""
As mentioned earlier, while the span of control of the CEO has increased substantially since mid-
1980 (Rajan and Wulf, 2006), less is known about the changes in the structure of the top executive team.
Figure 2 shows the evolution of the executive team in our sample of large US firms (see data description
in Section III). We plot the average size of the executive team (CEO span of control) in our data (1986-
1999) and for a more recent time period using data collected from the Conference Board for 43 firms (we
obtained the organizational chart for these firms for one year between 2004 and 2008). To minimize bias
from using an unbalanced panel, the figures documenting trends are based on the sample of firms that
appear for at least 10 years over the sample period (if we limit the sample to only the 43 firms for which
we have data in the later period, the pattern over the time period is qualitatively similar). The average
CEO span of control doubled from approximately 5 to 10 positions. But, the novel trend documented in
this paper is a shift in the structure of the executive team towards more functional managers. The average
number of functional managers reporting directly to the CEO increased from 3.1 in the late 1980s to 6.7
in the mid 2000s—an increase of 3.6 positions. This is significantly larger than the 1.3 position increase in
general manager positions (from 1.6 to 2.9). This means that, on average, approximately three quarters of
the five position increase is attributed to functional managers. 9
To give a better sense of the details behind these averages, in Table 1 we report data on select
individual positions that comprise the executive team. Column 1 reports the fraction of firms in the
sample where the position reports directly to the CEO and shows that CEOs in our sample had a higher
number of administrative functions (especially finance, legal, HR) reporting directly in comparison to
product functions. Columns 2 onwards report the (unconditional) correlation coefficients between
positions reporting to the CEO. We find that functional positions that we classify as administrative appear
together in the executive team (i.e., have large positive correlation coefficients), while the positions that
we classify as product functions also appear together. For example, CFO and General Counsel tend to
appear together in the executive team (0.29 correlation), and so do Sales/Marketing and Manufacturing
(0.21 correlation). These correlations provide some support for our ex-ante classification of positions into
the two types. Notice also that there is a positive correlation between the number of general managers and
all functional manager positions, except for sales and marketing and manufacturing, suggesting that
functional managers are not necessarily replacing general managers. In section IV, we will analyze how
the structure of the executive team changed over time within firms in response to changes in firm
diversification and IT investments. """""""""""""""""""""""""""""""""""""""""""""""""""""""""""""9"There are various idiosyncratic reasons why functional manager positions have become more important over time. For example, the rise of the CFO position is related to the increasing complexity of financial markets and changes in accounting rules (Zorn, 2004). Or, as companies become more customer-focused and marketing techniques grow in sophistication, Chief Marketing Officers (CMOs) play a more important role in senior management. CEOs may also signal greater strategic importance of certain functions both inside the organization and to key external constituents through their choice of direct reports."

8""
III. Data Sources and Description
In order to analyze the drivers of the observed increased presence of functional managers in the
executive team described in Section II, we draw on a number of different datasets. First, our main dataset
is based on a confidential compensation survey conducted by Hewitt Associates, a leading human
resources consulting firm specializing in executive compensation and benefits. This dataset allows us to
identify how the number and type of positions that report directly to the CEO change over time. The
dataset records information on managerial positions at the top of the organization, their compensation,
their title/job description and who the individual reports to. Notice that the title/job description is
categorized by Hewitt in order to make positions comparable across firms. That is, even if the same
position has different titles in different firms, Hewitt will group them into positions that share job
descriptions and responsibilities. This is essential for our study, since it implies that we can easily
compare positions and their evolution across firms over time. In addition to the positions defined earlier,
the dataset also records information on the Chief Executive Officer (CEO), the Chief Operating Officer
(COO) and the Chief Administrative Officer (CAO). With this dataset we are able to define how many
positions report directly to the CEO (span of control or the members of the executive team) and observe
what positions those are.
The sample spans the 1986-1999 period and includes around 300 firms, of which 69% are in
manufacturing and 31% are in services. The firms are typically leaders in their sector and representative
of the Fortune 500 firms (see Rajan and Wulf, 2006 for a detailed sample description). 10 Hewitt also
records detailed compensation information for all positions, but we were only able to obtain the detailed
data for a subset of positions. These include the CEO, Division Managers, the CFO, General Counsel and
the Chief Human Resources Officer. For these positions, we have information on the level of salary,
bonus and long-term compensation (this includes the Black-Scholes value of stock options grants,
restricted stock and other long-term incentives).
This unique dataset allows us to characterize the structure of the executive team, as defined by the
positions that report directly to the CEO, and analyze how this structure changes over 14 years. So, our
definition and measure of the executive team is not dependent on titles, but instead is based on reporting
relationships. This is not possible in any of the existing datasets we are aware of. However, in spite of its
richness, our dataset has some limitations. First, functional positions may exist in other places of the
organization, and not report directly to the CEO (in that case, because we focus on top executive team
"""""""""""""""""""""""""""""""""""""""""""""""""""""""""""""10 Rajan and Wulf (2006) describes the sample representativeness relative to Compustat firms, discusses concerns about selection, and potential misreporting in the survey. It concludes that the sample is representative of large, Fortune 500 firms that are leaders in their sectors.

9""
positions, we would under-estimate the extent of centralization of functions). Second, we cannot
definitively answer the question of whether the increase in functional positions at the top comes from
newly-created or existing positions. For some functions (finance, law and HR), we know whether the
position exists and the reporting level of the position; however, we don’t have this information for all
functional positions. Finally, while the number of functional managers that report directly to the CEO is
arguably related to the need to realize synergies within the firm, we do not observe how these synergies
are realized, and in particular if the changes in functional managers are associated with changes in the
allocation of activities, decision making, monitoring or aggregation of information towards the functional
manager (and away from general or division managers).
We constructed a set of variables that measure the degree of diversification within firms (note
that, throughout the paper, we do not distinguish between the concepts of diversification and business
relatedness: a lower degree of diversification corresponds to a higher degree of business relatedness). The
first variable uses Compustat Segment data to measure firm entropy as defined in Palepu (1985) and
conceptualized by Rumelt (1974). Intuitively, firm entropy measures the extent of diversification as
captured by the different 2-digit SIC segments the firm operates in. We compute Palepu’s measure for
unrelated diversification; it is a transformation of a Herfindahl index (sum of squared shares of segment
sales to firm sales) across different two-digit SIC segments reported by the firm that captures the extent of
relatedness of the businesses the firm operates in.11 The higher the entropy/unrelated diversification
measure, the more diversified the firm is. The second set of diversification variables, measure the degree
of diversification/relatedness not just by whether two firm segments are close as defined by the SIC code,
but by whether they use products that are related in Input-Output tables. Fan & Lang (2000) calculate
inter-industry relatedness coefficients using input-output commodity flow tables and construct two basic
measures of relatedness: vertical relatedness and complementarity. The vertical relatedness measure
captures the extent to which the segments the firm operates in are inputs to one another, as defined in the
Input-Output tables.12 The higher the vertical relatedness value, the more related the firm’s businesses
along the production chain. For example, since semiconductors are an important input into personal
computers, firms that operate in both sectors would score high on the vertical relatedness measure. The
complementarity measure, in turn, captures whether the businesses the firm operates in are all inputs into
"""""""""""""""""""""""""""""""""""""""""""""""""""""""""""""11"Unrelated diversification is the weighted average of all 2-digit SIC group share in sales, i.e. the summation of the share multiplied by the log of the inverse of the share. This measure is widely used (e.g., Hill, Hitt, and Hoskisson, 1992 for an early example)."12"Vertical relatedness is the dollar value of industry i’s output required to produce 1 dollars’ worth of industry j’s output, as stated in input-output tables (we use coefficients based on 1992 US input-output tables). Forward vertical relatedness is when i is the secondary segment and j is the primary segment. Backward vertical relatedness is the reverse. We denote the primary segment as the segment with the most sales. Our vertical relatedness measure is the simple average of the two."

10""
the same, common industry, or alternatively whether they source their products from the same common
industry.13 For example, a firm that operates in both semiconductors and plasma screens would score high
on the complementarity measure since these are both inputs into personal computers. The higher the
complementarity value, the more related the firm’s businesses.
We also obtain information on IT investment at the firm-year level from the Harte-Hanks
database (see details in Bresnahan, Brynjolfsson and Hitt, 2002). The database reports the number of
personal computers in use in each firm in a given year, so that we can define IT-intensity of the firm as
the number of PCs per employee. Since our sample covers the 1986-1999 period, this variable is
particularly meaningful, given that this is the period where PC prices were falling and firms started
adopting the new technology (Dunne et al, 2004). We exploit the panel nature of our dataset and the
differential rate of adoption by different firms. In our use of this variable, we expect to capture the overall
IT-intensity within the firm, including not just PCs themselves, but also other aspects of IT that are
correlated with hardware, such as software, Enterprise Resource Planning (ERP) or different types of
technologies that improve communication. While we are not able to distinguish between investments in
hardware, software or communication technology, from 1993 onwards, the dataset also records the
number of Local Area Network nodes. A Local Area Network (LAN) is a communication network that
connects several devices and provides a means for information exchange among those devices. The
“nodes” are the devices connected to the network that can directly exchange information and
communicate. Therefore the number of LAN nodes is a better measure of IT as a communication-
improving investment.14
Finally, using accounting information from Compustat data, we construct a number of control
variables such as firm size (ln sales and ln employment), firm internationalization (defined as the ratio of
sales by foreign segments to total sales, from Compustat Segment data), the average industry price cost
margin at 3 digit SIC as an inverse measure of product market competition and R&D intensity (R&D over
firm sales, where missing R&D is considered as zero). We include these as controls, because as product
markets globalize and become more competitive, and US firms increasingly differentiate products, we
might expect firms to change the structure of the top team for other reasons.
"""""""""""""""""""""""""""""""""""""""""""""""""""""""""""""13"Following Fan & Lang (2000), we compute the percentage of an industry’s output supplied to each intermediate industry, denoted bik. For each pair of industries i and j, compute the simple correlation between bik and bjk across all k except i and j. Forward complementarity measures the overlap in markets to which a firm’s various segments sells its products. Backward complementarity measures the overlap in markets for the input industries of the firm’s segments. Out complementarity measure is the simple average of both measures. "14 Bloom, et al, (2011) also uses Harte-Hanks data for a cross-section of firms in 2006. In that period Harte-Hanks collected information on the types of software adopted such that the authors are able to distinguish between information technology and communications technology. Unfortunately such information is not available in our time period (a 14 year panel).

11""
IV. Results: Determinants of Executive Team Structure
The empirical analysis in what follows relies on the panel nature of our dataset for identification
to identify simultaneous changes in diversification, IT investments and organizational decisions. 15 We
observe firms for up to 14 years, and we have information on changes in the structure of the executive
team (defined by who reports directly to the CEO) along with measures for firm diversification and IT-
intensity. We also have detailed pay information for a subset of positions within firms over time.
Therefore, we are able to control for unobserved firm heterogeneity and do not have to rely on cross-
sectional relationships to identify our results, thus improving on the literature that relies on cross-sectional
evidence. 16
IV.A. Firm Diversification, IT, and Executive Team Structure
To study the correlates of executive team structure, we exploit the panel nature of our dataset and
estimate fixed effects regressions. The basic structure of our empirical specification will be as follows:
!!" = α + !!"#$%&"'!" + !!"!" + !!" ′! + !! + !! + ɛ!" where the dependent variable !!" will be the number of managers reporting to the CEO (in total, and by
type --general or functional) in firm i, and year t. !"#$%&"'!" and!!"!"!are the diversification and IT-
intensity measures respectively, !!" are a large set of control variables: firm size (ln firm sales), the
number of segments the firm operates in, the fraction of sales by foreign subsidiaries, the average price-
cost margin in the industry as an (inverse) measure of product market competition, R&D intensity
measured by total R&D expenses over sales, and controls for whether the firm has a CAO or a COO. !! are year dummies and !! are firm fixed effects.
Table 3 explores the relationship between the size and structure of the executive team on the one
hand and diversification choices and IT investments on the other. The dependent variable in Column 1 is
the total number of managers that report directly to the CEO (CEO span of control). Columns 2 to 5 split
the total number of managers into different types. First, we consider general managers (Column 2), i.e.
managers responsible for a broad set of functional activities within their business unit; Second, functional
"""""""""""""""""""""""""""""""""""""""""""""""""""""""""""""15"Relatedly, a number of papers have documented that the complementarity between IT and various organizational choices (e.g. Brynolfsson et al, 1994; Bresnahan, Brynjolfsson and Hitt, 2002; Bartel, Ichiowski and Shaw, 2007; McElheran, 2010). The organizational choice we focus on here is the structure of the executive team. 16"While we cannot argue that the relevant independent variables of interest (degree of firm diversification or IT investments) are purely exogenous, there are some clear exogenous forces (falling price of IT; globalization of trade and production and increasing competition) driving changes in these variables. However, it is difficult to find instruments that vary over time and by firms/industries. And even if we had such instruments, it would be hard to argue that they satisfy the exclusion restriction (that they only affect organizational choices through the instrumented variable). This is a common problem in this kind of work, so we rely on within firm and across position correlations to identify our results in this paper. For a reduced form analysis, with exogenous variation and arguably causal effects of competition on organizational structure, see Guadalupe and Wulf (2010). "

12""
managers (Column 3), i.e. managers responsible for corporate-wide activities for a specific function. We
further distinguish between types of functional managers, i.e., product (front-end) functional managers
(Column 4) vs. administrative (back-end) functional managers (Column 5).
Column 1 shows that unrelated diversification is positively related to the size of the top team:
diversifying firms increase the number of positions reporting to the CEO. In contrast, IT investments (as
measured by the number of PCs per employee) are not significantly related to team size. However, as we
shall see, the relationships between the executive team structure and diversification, and between
executive team structure and IT investments, systematically vary by type of position. Column 2 shows
that the number of general managers reporting directly to the CEO is positively related to firm
diversification, but unrelated to IT investments. In fact, the estimate for IT is negative, suggesting that if
anything, there are fewer general managers in the top team as the firm invests more in IT. In contrast,
Column 3 shows the opposite relationship for functional managers: the number of functional managers is
positively related to IT investments, but unrelated to firm diversification. Even further, when we
distinguish between types of functional managers, the number of product functional managers is
negatively related to diversification (the relationship is positive for general managers), but unrelated to IT
investments (column 4). A one standard deviation increase in diversification is associated with a decrease
of 0.11 product functional managers, which is 18 percent of the standard deviation in the number of
product functional managers. In contrast, the number of administrative functional managers is strongly
positively related to IT investments, but unrelated to diversification (column 5). A one standard deviation
increase in IT is associated with a decrease of 0.12 administrative functional managers, or 8 percent of the
standard deviation in the number of administrative functional managers.17
The fact that these relationships vary by type of position allows us to rule out that we are just
capturing a spurious correlation driven by the fact that the CEO span of control, diversification and
investments in IT are all trending up over time. If the correlation was simply spurious, we shouldn’t see
these differences given that all types of positions increasingly report directly to the CEO over time.18
To further evaluate the relationship between diversification, IT and types of functional managers
reporting to the top, we turn to Table 4 where we use additional measures of firm diversification and IT
"""""""""""""""""""""""""""""""""""""""""""""""""""""""""""""17 We also tested and rejected the notion that the relationship between the number of functional managers and IT is just driven by the increasing importance of the Chief Information Officer (CIO) position. 18"We also performed a number of additional robustness tests/additional specifications (unreported): The results are similar when using CEO rather than firm fixed effects, when controlling for firm employment, when introducing industry specific time trends, and when using a Poisson count model rather than OLS. We also explored the time dimension of the changes and found that the effects are mainly contemporaneous (although some (smaller) effect also appears with a one year lag) . Given that the relationship is mainly contemporaneous and that we lose 20% of the observations when including lags, we report the regressions using the contemporaneous variables. Results are available upon request."

13""
investments and we add throughout as a further control the number of general managers to account for the
possible overall increase in span. Note that the number of general managers is positively correlated with
the number of both types of functional managers in each of our specifications. First, we evaluate the
relationship between different measures of firm relatedness and the number of product functional
managers reporting directly to the CEO. In Column 1 we replace the entropy measure of unrelated
diversification by the number of related and unrelated segments the firm operates in. We find that the
higher the number of related segments (i.e. in the same SIC 2 digit category as the primary segment), the
more product functional managers that report to the CEO, confirming that it is business relatedness that
matters for functional centralization of product functions. Second, in Columns 2 and 3, we reproduce
these results with two alternative measures of firm diversification. Using both measures of vertical
relatedness (Column 2) and of complementarity (Column 3), we find that firms with more related
businesses (less diversified) increase the number of product functional managers reporting directly to the
CEO. The result is stronger for complementarity than vertical relatedness, suggesting that it is the overlap
of businesses supplying to the same industries (or procuring inputs from similar industries) rather than
their relationship in the vertical chain that matters for coordination and the realization of synergies. Yet,
for administrative functional managers (columns 6 and 7), we find again the opposite sign on the
coefficients of all diversification measures, although they are never statistically significant.
Regarding IT, all columns control for PCs per employee and confirm that IT adoption is
positively correlated with the number of administrative functional managers (Columns 6 to 8), but not
with the number of product functional managers (Columns 1 to 5). However, we recognize that PCs per
employee is a crude measure of IT as a facilitator of communication. A better measure is available, but
only from 1993: This is the number of Local Area Network nodes. In Columns 4 and 8 we add the
logarithm of LAN nodes as an independent variable to our main specification (for the year prior to 1993
we impute a value of zero and dummy out the imputed observations in order to keep the number of
observations constant between columns 1 and 4, and 6 and 8). We find that using the number of LAN
nodes gives similar results as PCs per employee: it increases the number of functional managers reporting
to the CEO, but has no effect on product functional managers. The magnitude of the effect is also quite
large: a one standard deviation increase in ln nodes leads to 0.41 more administrative functional managers
(30 percent of the standard deviation). This suggests that the communication component of IT matters
most for the functional centralization of administrative positions.
Finally, we explored the interaction between diversification and IT. Column 5 shows that
investments in IT are related to product functional managers reporting directly to the CEO in less
diversified firms (i.e., with more related businesses). We found similar significant effects for product

14""
managers when using the other measures of diversification (vertical relatedness and complementarity),
and found no significant interaction effects for administrative functional managers (unreported).
All these results are identified from within-firm variation in the relevant variables (hence we are
controlling for permanent unobserved differences between firms). We also hold a large number of firm
characteristics constant, through the regression controls. Some interesting relationships emerge between
the controls and the dependent variable. In particular, in Table 3, our control for the degree of competition
(the price-cost margin), is related to the presence of general managers at the top: more competitive
industries have more general managers reporting to the CEO, but there is no relationship with functional
managers. This is consistent with the reduction in the number of management layers following a trade
liberalization found in Guadalupe and Wulf (2010) which we interpret as increased involvement in
decision making by division managers when competition, and hence the importance of fast, adapted
responses to local information, increases. We also find that the larger the share of sales by foreign
affiliates (a measure of the degree of internationalization of the firm), the larger the span of control which
is driven by a greater number of administrative functional managers."One interpretation is that as US
firms increase operations in international product and labor markets, the importance of monitoring and
compliance by administrative functional managers increases. Finally, over our sample period, firms have
been eliminating both COO and CAO positions – which are typically intermediary positions between
general managers and functional managers, respectively, and the CEO -- and our results could just be
reflecting the presence or absence of these positions. Our results are not dependent on introducing these
controls, but we decided to include them in all regressions to ensure that the findings are not driven by
these changes.
IV. B. Understanding Changes to the Executive Team through Changes in Pay
After showing how the executive team structure has changed over time with diversification and
IT investments, next we explore what adding a functional manager to the executive team means. To do so,
we analyze how pay for our different types of managers (general managers, functional managers and the
CEO) changes as their position in the hierarchy (i.e., their reporting level), as well as executive team
structure, changes. This will allow us to interpret how the allocation of activities within the firm is
changing with changes in top team structure.
One advantage of our dataset is that, for some positions (Division Managers, CFO, General
Counsel, and Chief HR Officer and CEO), we have information on pay and reporting levels, even if the

15""
position is not directly reporting to the CEO.19 So, all regressions in Table 5 have a position-year as the
basic unit of observation, and have the following structure:
ln!(!!"#) = α + !!"#′! + !!" ′! + !!" ′! + !! + !!" + !
The dependent variable !ln!(!!"#), is either the logarithm of base compensation (salary) or total
compensation (salary, bonus and long-term incentives) of position p in firm i, in year t. We analyze
separately the correlates of pay for three types of positions: general managers (division managers),
functional managers, and the CEO. The independent variables include a vector of variables that
characterize the position itself (!!"#) such as whether the position reports to the CEO, and a vector of
firm characteristics (!!") such as how many functional and general managers report to the CEO, and the
types of functional managers (i.e., product or administrative). All regressions include the same set of
controls !!" as earlier tables in addition to firm-specific position fixed effects and time dummies such that
all the effects are identified within a firm and position as they change over time.
We start describing pay for functional managers, in Columns 1 and 2. As mentioned, the only
functional managers we have pay information for are the CFO, the General Counsel and the Chief Human
Resources Officer (administrative functional managers in our terminology). The variable “Reports to the
CEO” is a dummy variable that equals one if the position reports directly to the CEO. Note that when this
variable equals zero, it means that the position exists elsewhere in the firm, not in the top team. We find
that there is an 11 percent increase in base compensation and a 15 percent increase in total compensation
when the position joins the executive team by reporting directly to the CEO. One might argue that
reporting to the CEO does not mean much, that it is simply a box on a chart with no real consequences. At
the very least, our evidence indicates that reporting to the CEO has practical consequences in terms of pay
and hence some economic meaning. We interpret this pay increase to suggest that the level of
responsibility and authority of the manager is greater when the position becomes part of the executive
team. We also find the base salary is 1.5 percent lower for functional managers with each extra functional
position that reports to the CEO.
Columns 3 to 6, report pay changes for division (general) managers. Here again, we find that
reporting directly to the CEO increases base pay (7 percent) and total compensation (13 percent) for these
managers. But even more interestingly, and a central finding in our paper, we find strong evidence that
division manager pay decreases as more functional managers report directly to the CEO (Columns 3 and
"""""""""""""""""""""""""""""""""""""""""""""""""""""""""""""19 In our firm-level data, for each firm-year, we know which positions report directly to the CEO. For a select group of positions, we know, conditional on the existence of the position, whether it reports directly to the CEO or not. In 72% of the cases, for this subset of positions, functional managers report directly to the CEO."

16""
4). In Columns 5 and 6 we distinguish between the effect of two types of functional managers --
administrative and product managers – on division manager pay. We find that the increase in the number
of product functional managers is strongly associated with a decrease in division manager’s pay: one
more product functional manager reporting to the CEO is associated with a 2.4 percent lower salary and
5.4 percent lower total compensation for division managers. In contrast, we find no correlation between
administrative functional managers and division manager pay.
While we do not observe the tasks/activities/decisions performed by each of our managers
directly, one interpretation of these results is that when more activities/decisions are “centralized”
(allocated to the functional manager), division manager pay declines. This effect is particularly strong for
product-related activities like R&D or marketing (relative to administrative activities) that typically are a
more substantial component of the division manager’s job. To sum up: First, the role of the functional
manager changes as the functional position joins the executive team since their pay increases. Second,
since division manager pay declines as more product functional managers join the executive team,
functional managers serve as substitutes for division managers in product functions, but not in
administrative functions.
Using pay and reporting relationships, we have documented two relevant facts that illustrate what
occurs inside the firm as the structure of the executive team changes: (i) functional manager and general
manager (division manager) pay increases when the position moves closer to the CEO and (ii) division
manager pay decreases when more product functional managers report directly to the CEO. These
findings are consistent with the interpretation that functional managers centralize functions that
previously resided with the business unit or division managers. This is particularly true for product
functions, and less so for administrative functions.
V. Discussion
In this section, we discuss the broader implications of our results and organize our discussion
around what we judge to be our more interesting findings. We show how our results complement existing
theory and empirical work on organizational structure, but we also point out where our facts cannot easily
be explained with existing theory. We then advance potential explanations for our data, and suggest
avenues for future work in this area. In particular, we focus on the implications of this work for our
understanding of organizational form.
V. A. Relationship between Executive Team and Diversification
We find that greater diversification is associated with more general managers and fewer
functional managers on the executive team. This is true for various measures of diversification/business
relatedness. A number of strategy papers (e.g., Rumelt 1974, 1982) argue that as a firm’s businesses

17""
become more diverse, opportunities for synergies between business units diminish. One important insight
of this strand of research is that coordination to exploit synergies is most effective when activities are
centralized under a single manager instead of being left in the hands of business units; for example, Hill
and Hoskisson (1987) and Argyres (1995) argue that divisional managers do not have the appropriate
incentives to undertake synergistic activities. 20,21 Within the executive team, diversification should thus
result in more general managers as the firm operates in more businesses, and fewer functional managers
who are in charge of exploiting synergies across business units (see Hill, Hitt and Hoskisson 1992 and
Dessein, Garicano and Gertner 2010 for similar arguments).
While this logic, drawn from existing theory, is largely consistent with our results, it does not
provide a complete explanation. In particular, in our data, the number of corporate-level functional
managers decreases with firm diversification only for product / front-end functions; and there is no
significant change in the number of administrative / back-end functional managers. This finding suggests
that even as diversification increases, potential synergies (and thus the role of functional managers) are
present for administrative functions. While the finding is consistent with some existing work (Chandler
1991, for example, points out that highly diversified firms tend to centralize only a limited set of
administrative functions such as finance), the point that synergies in product versus administrative
functions respond differently to firm diversification has not been highlighted in existing theories.
V.B. Relationship between Executive Team and IT Investments
Next, we turn to our finding that firms increase the number of functional managers in the
executive team as they increase IT investments. There is an extensive theoretical literature on the
information-processing view of the firm, and the role of organizational structure in managing
communication within the firm (e.g., Galbraith, 1974, Tushman and Nadler, 1978). A related literature
makes the point that IT improves communication and information processing (e.g. Malone, Benjamin and
Yates, 1987; Gurbaxani and Whang, 1991).22 Such an information-processing view of organizations, with
"""""""""""""""""""""""""""""""""""""""""""""""""""""""""""""20"More generally, the view that capturing synergies (broadly construed) involves centralizing/integrating activities is quite common in both the management literature (e.g. Lawrence and Lorsch, 1967; Bartlett and Goshal, 1993) and the organizational economics literature (e.g. Rotemberg, 1999; Hart and Moore, 2005; Qian, Roland and Xu, 2006; and Dessein, Garicano and Gertner, 2010). There is an alternative viewpoint, explored theoretically by Alonso, Dessein and Matouschek (2008) and Rantakari (2008), that synergies can also be captured under decentralization; we view our empirical results as reflecting the former rather than the latter view."21"Hill (1988), Hill and Hoskisson (1987) and Hill, Hitt and Hoskisson (1992) focus on the distinction between financial synergies and other synergies, and argue that centralization of activities is necessary to exploit non-financial synergies but stymies the exploitation of financial synergies (in the form of an internal capital market). We view their argument as consistent with ours: to us, exploitation of financial synergies involves the centralization of capital allocation decisions at corporate headquarters, often in the hands of a CFO. 22 Relatedly, some recent work (Garicano 2000, Bloom et al 2011) studies the impact of information technology on hierarchical design. These papers predict and find that IT has an ambiguous impact on span of control, but in a somewhat different setting; in particular, they do not focus on the executive team and have no functional differentiation between positions.

18""
managers in charge of “gathering, interpreting and synthesizing information” (Tushman and Nadler,
1978) can provide some insight into our findings.
To exploit synergies between business units, functional managers have to synthesize and process
information from the business units involved. IT makes functional managers more productive by (i)
improving the communication of information from the business unit to the functional manager, and (ii)
easing the processing of information from various business units when performing synergistic activities;
this implies that the number of functional managers should increase with IT investment.23
Again, such a framework built from existing theory does not provide a complete explanation for
our detailed results, where we find that the degree of correlation with IT differs by the type of function
and by the degree of firm diversification. More specifically, existing theory does not explain why product
functional managers increase with IT investment in firms with high business relatedness, but not in firms
with low business relatedness; whereas administrative functional managers increase with IT investment
regardless of firm diversification. These nuanced empirical findings provide a set of facts that we hope
may guide future theorists (both in organizational theory and in the top management team literature) to
develop work that takes our findings into account.
In the remainder of this section, we will take a first step towards building new theory by briefly
describing a model, building on the information-processing framework that we described above, that is
consistent with our nuanced findings. Next, we suggest some implications of our results for overall
organizational form, drawing on our results on executive pay. This then allows us to interpret the trends
we observe in terms of organizational form.
V.C. Enriching the Information-Processing View of the Firm
In this section, we build on the information-processing framework we described earlier in the
section to model the assignment of functional managers in the executive suite. The optimal organizational
choice depends on the costs and benefits of using a functional manager to process information.24 The goal
is to furnish an explanation for our more detailed results showing that the functional manager choice is
related to IT investments, firm diversification, and the type of function involved.
Relative to the existing literature, the key innovation of this framework is to relate a function’s
type to its information-processing requirements. Specifically, we propose the following distinction
"""""""""""""""""""""""""""""""""""""""""""""""""""""""""""""23 Here, we are implicitly arguing that improvements in IT, by themselves, do not allow business units to fully coordinate amongst themselves to exploit synergies in the absence of functional managers. As discussed previously, a key rationale for using functional centralization to exploit synergies is to overcome conflicts of interest between business units; improvements in IT alone are insufficient to solve such conflicts of interest. For this reason, we think of IT investments and functional managers as complements rather than substitutes. 24 Note that this choice is nontrivial: although synergies can be realized more effectively if activities are centralized in the hands of a functional manager who coordinates across all business units, it is costlier to communicate local information from the business unit (where the information resides) to the functional manager."

19""
between product functions and administrative functions: product functions (such as marketing or R&D)
use information that is very close to the product, and administrative functions (such as finance or human
resources) use information that is less related to the product. This implies that information relevant to
each administrative function is relatively commensurate (e.g. easier to aggregate and process) across
business units. In contrast, for product functions, relevant information is relatively incommensurate across
business units, and consequently difficult to synthesize for the purpose of exploiting synergies; this
incommensurability is intensified for firms with low business relatedness, and attenuated for firms with
high business relatedness. So, when relating the potential for synergies to the function’s information
requirements, we would expect that there are more potential synergies across businesses if (i) business
relatedness is high, or if (ii) relevant information is not product-specific.
With this perspective in mind, consider the relationship between functional manager choice and
the degree of business relatedness. For product functions (where relevant information is product-specific),
there are more potential synergies as the degree of business-relatedness increases. Thus, functions are
more likely to be centralized under a product functional manager in firms with higher business
relatedness. In contrast, for administrative functions (where relevant information is not product-specific),
changes in the degree of business-relatedness do not affect the extent of potential synergies, so business-
relatedness does not affect the functional manager choice. Therefore, the relationship between firm
relatedness and functional managers depends on the type of function; increases in business relatedness
increase the use of functional managers for product functions, but not for administrative functions. This is
exactly what we find.
Now, consider IT. As argued in Section V.B, IT increases the effectiveness of functional
managers by improving their ability to communicate and process information. However, and crucially, the
magnitude of improvement depends on the type of information involved: IT investments generate less
improvement for functions that use highly product-specific information and involve highly diversified
business units, for two reasons. First, if information is product-specific and activities are dissimilar across
business units, then there are less potential synergies for the functional manager to exploit and fewer
benefits from IT investment. Second, coordinating activities across business units requires integrating and
synthesizing information from multiple business units; when relevant information is product-specific and
products are dissimilar, this entails a great deal of subjective interpretation of incommensurate data. IT is
useful for communication and for data-processing, but plays little role in interpreting subjective
information; consequently, IT investments do little to help functional managers process information when
the relevant information is product-specific and the firm is highly diversified. 25
"""""""""""""""""""""""""""""""""""""""""""""""""""""""""""""25"The concept of subjective versus objective information is related to the ideas of tacit versus explicit knowledge (e.g. Kogut and Zander, 1992) and of hard versus soft information (e.g. Stein, 2002), but there are key distinctions

20""
This logic implies that as firms increase IT investments, they increase the number of
administrative functional managers since administrative functions use less product-specific information;
in particular, the relationship between IT and the number of administrative functional managers does not
depend on the degree of firm diversification. Continuing this line of reasoning, the reason that IT has no
effect on product functional managers in diversified firms is that the information across business units is
difficult to aggregate and hence IT does not help realize synergies. But this is true only in a highly
diversified multi-business firm: in firms where businesses are highly related, information is relatively
common across businesses even for product functions. In those firms, product functions behave like
administrative functions and increasing IT also leads to the centralization of product functions; as is
confirmed by our results, IT has a positive effect on the presence of product functional managers in the C-
Suite only in firms with related businesses.
V.D. Implications for Organizational Form
The findings discussed so far have documented relationships between the executive team and
strategy variables such as diversification and IT investments and how these change over time. Next, we
use changes in executive team structure to gain insight about organizational form and decision-making; as
Beckman and Burton (2011) point out, “The structure of the TMT can be a stand-in for the structure of
the organization.” To do so, we combine our findings on (i) pay within the executive team and (ii)
executive team structure. Note, however, that our analysis is limited by the absence of some reporting
relationships and other proxies for decision-making in our dataset.
Start with our findings on pay. Not particularly surprisingly, we find that functional managers
who join the executive team are paid more, suggesting a broader job scope for managers who report
directly to the CEO. This finding confirms that changes in hierarchical position have economic
significance and are not simply a meaningless movement of boxes on an organizational chart. More
notably, and crucial to interpreting our results as an increase in functional centralization, general manager
(division manager) pay declines as the number of product or front-end functional managers join the
executive team, but it is not affected by administrative or back-end functional managers. This suggests
that functional managers serve as partial substitutes for general managers (resulting in lower pay for the
latter), especially in activities that are close to the product, such as marketing or R&D. This evidence is
""""""""""""""""""""""""""""""""""""""""""""""""""""""""""""""""""""""""""""""""""""""""""""""""""""""""""""""""""""""""""""""""""""""""""""""""""""""""""""""""""""""""""""""""""""""""""""""""""""between each concept. In particular, if product functions are characterized by tacit knowledge or soft information (so that IT is ineffective at processing and communicating information in product functions), then we should expect IT to be uncorrelated with product functional managers regardless of the degree of diversification; instead, we find in our data that IT is correlated with functional managers when firms are undiversified. This suggests that the appropriate characterization of product functions is in terms of subjective information rather than tacit knowledge / soft information.

21""
consistent with the interpretation that functional managers centralize some activities that previously
resided with the business unit or division manager; this is particularly true for product functions.
Having argued that corporate-level functional managers partially substitute for general managers,
we ask the follow-up question: when functional managers join the executive team, do they replace general
managers, or coexist with them? To elaborate: the presence of a corporate-level functional manager may
achieve coordination across business units in two broad ways. First, by heading a centralized functional
unit that performs most functional activities, with little being performed in the business units. Second, by
coordinating functional activities, which continue to be performed within business units, to minimize
redundancies and realize synergies. We should expect the number of general managers to decrease as
functional managers join the executive suite in the first case, but not in the second. Our finding that the
number of general managers is positively correlated with the number of (product and administrative)
functional managers indicates that functional managers are coexisting with, rather than replacing, general
managers. This suggests that our evidence is consistent with a move towards matrix organizational forms
(Galbraith 1971) or centralized M-form organizations (Hill and Hoskisson, 1987), as illustrated by the
earlier example of Procter and Gamble.
Taken together, our findings on the relationships between the structure of the executive team and
strategy variables and how these changed over time suggest an organizational form distinct from the
traditional multidivisional firm. The M-form of Chandler (1962) and Williamson (1975, 1985), which
emphasized the delegation of authority to operating divisions, became pervasive among large US
companies throughout the 1950s and 1960s and persisted through the late 1970s (Fligstein, 1985). In
contrast, we document an increase, since the mid-1980s, in organizational forms that are based on greater
functional centralization within the executive team, consistent with a move towards the matrix or the
centralized M-form. Our results suggest that the increase in matrix-like organizational forms has been
triggered by a trend toward more business relatedness and IT investments in the face of increased
globalization, developing capital markets, and falling costs of information technology.
VI. Conclusion
We have studied changes in the structure of executive teams – a key organizational design
variable – and their relationship to firms’ strategy choices. In doing so, the paper makes a number of
novel contributions.
First, we document significant changes in executive team structure over approximately two
decades in Fortune 500 firms, with three-fourths of the doubling in the number of positions reporting
directly to the CEO being driven by the increased presence of corporate-level functional managers. The
richness of our dataset allows us to systematically document trends and relationships in a way that was

22""
previously impossible. Our results are particularly important because, as we argue, the structure of the
executive team reflects the firm’s underlying organizational structure. Notably, our findings suggest that,
as large US firms centralized corporate-level functions over the past couple of decades, they moved away
from the pure M-form (Chandler, 1962) towards other forms of organization such as matrix (Galbraith,
1972) or the centralized M-form (Hill, 1988). While this may be consistent with small sample studies, to
our knowledge, this has not been systematically documented in a large sample of firms over the period of
our study (mid-1980s to mid- 2000s).
Second, we show how changes in the executive team are related to changes in strategy choices; in
particular, firms’ diversification decisions and IT investments. Our empirical results are in the spirit of
existing theoretical work in strategy and management on how changes in both strategy and structure are
driven by shifts in the environment in which firms operate (e.g., Lawrence and Lorsch, 1967). Therefore,
our results systematically illustrate Chandler’s (1962) dictum that “structure follows strategy” for a large
sample of firms; and we do so for a period characterized by dramatic environmental changes which
include globalization, developing capital markets, and falling costs of information technology.
Third, we introduce some new theoretical ideas to the study of organizational structure. We do so
because we find robust differences in the response of “product” and “administrative” functional managers
to changes in diversification and IT investments that existing management theory does not adequately
explain. To explain our results, we identify a previously ignored aspect of what distinguishes different
functions: the nature of information relevant to functional decision-making. We argue that the closeness
of the function to the product – its reliance on product-specific information-- has important implications
for how to aggregate and process information across business units. Importantly, earlier classifications of
information types (e.g. tacit vs. explicit or hard vs. soft) cannot explain our full set of results. We hope
that scholars thinking about the information-processing view of the firm will find these ideas about the
product-specificity of information useful in developing future theoretical work on organizations.
Taken as a whole, we think our paper contributes to three related but often isolated fields of research.
First, our results should be of interest to strategy scholars interested in understanding the anatomy of
changes in organizational structure in Fortune 500 firms over the last two decades and how they relate to
changes in strategy choices. Second, we also contribute to the literature on top management teams (TMT)
by focusing on the structure of the roles in the executive team and how this has changed over time. This
perspective is important in understanding the secular changes in TMTs and ultimately the effects on firm
performance.26 Finally, we contribute to the literature in organizational economics by providing a new set
"""""""""""""""""""""""""""""""""""""""""""""""""""""""""""""26"As Hambrick (2007) argues: “I have long thought that there needs to be much more attention paid to the ‘structure’ of TMTs, to complement –and improve—our understanding of TMT composition and processes.” Similarly, Beckman and Burton (2011) point out: “More attention to structure and time will allow us to better

23""
of facts about issues that theoretical models have analyzed, such as the complementarities between
organizational choices, organizational form, and the optimal degree of decentralization (e.g., Milgrom and
Roberts, 1995; Bresnahan, Brynjolfsson and Hitt, 2002; Roberts, 2004).
Given the multifaceted nature of our findings, we think our paper contributes to the research in these
three fields individually, but also collectively. As such, our paper bridges the research of often
disconnected fields since they all “meet” in the intersection of this new set of facts.
References
Alonso, Ricardo, Wouter Dessein, & Niko Matouschek (2008). “When Does Coordination Require
Centralization?” The American Economic Review, 98(1): 145–179.
Argyres, Nicholas S. (1995). “Technology strategy, governance structure and interdivisional
coordination,” Journal of Economic Behavior & Organization, 28(3), 337–358.
Argyres, Nicholas S. and Brian S. Silverman (2004). “R&D, Organization Structure, and the
Development of Corporate Technological Knowledge,” Strategic Management Journal, 25 (8/9):
929-958.
Bandiera, Oriana, Andrea Prat, Raffaella Sadun and Julie Wulf (2011). “Span of Control or Span of
Activity?” working paper.
Bartlett, Christopher, and Sumantra Ghosal (1993). “Beyond the M-Form - Toward a Managerial Theory
of the Firm,” Strategic Management Journal, 14: 23–46.
Bartel, Ann, Casey Ichniowski, and Kathryn Shaw (2007). “How Does Information Technology Affect
Productivity? Plant Level Comparisons of Product Innovation, Process Improvement and Worker
Skills,” Quarterly Journal of Economics, 122 (4): 1721-1758.
Beckman, Christine M. and M. Diane Burton (2011). “Bringing organizational demography back in:
Time, change and structure in top management team research.” In M. Carpenter (ed.), Handbook of
Top Management Team Research. Edward Elgar, pp. 49-70.
Bloom, Nicholas, Luis Garicano, Raffaella Sadun, John Van Reenen (2011. “The Distinct Effects of
Information Technology and Communication Technology on Firm Organization.” HBS Working
Paper.
Bresnahan, Timothy F., Erik Brynjolfsson and Lorin M. Hitt (2002). “Information Technology,
Workplace Organization and the Demand for Skilled Labor: Firm-Level Evidence,” Quarterly
Journal of Economics, 117 (1): 339-376.
""""""""""""""""""""""""""""""""""""""""""""""""""""""""""""""""""""""""""""""""""""""""""""""""""""""""""""""""""""""""""""""""""""""""""""""""""""""""""""""""""""""""""""""""""""""""""""""""""""specify the causal mechanisms by which TMTs influence firms and to unpack the mixed findings that currently confound structure and experience.”

24""
Brynjolfsson, Erik, Thomas Malone, Vijay Gurbaxani, and Ajit Kambil (1994). “Does Information
Technology Lead to Smaller Firms?” Management Science, Vol. 40, No. 12 pp. 1645-1662.
Carpenter, Mason A., Marta A. Geletkanycz and Wm. Gerard Sanders (2004). “Upper echelons research
revisited: Antecedents, elements, and consequences of top management team composition,” Journal
of Management, 30 (6): 749–778.
Chandler, Alfred D. (1962). Strategy and Structure: Chapters in the History of the Industrial Enterprise,
Cambridge: MIT Press.
_____ (1991). “The Function of the HQ Unit in the Multibusiness Firm,” Strategic Management Journal,
12: 31-50.
Collis, David J., David Young, and Michael Goold (2007). “The Structure, Size, and Performance of
Corporate Headquarters,” Strategic Management Journal, 28 (4): 383-405.
Cremer, Jacques, Luis Garicano and Andrea Prat (2007). “Language and the Theory of the Firm,”
Quarterly Journal of Economics, 112 (1): 373-407.
Dessein, Wouter, Luis Garicano and Robert Gertner (2010). “Organizing for Synergies,” American
Economic Journal: Microeconomics. 2: 77-114.
Dessein, Wouter and Tano Santos (2006). “Adaptive Organizations,” Journal of Political Economy, 114
(5): 956-995.
Dunne, Timothy and et al (2004). “Wage and Productivity Dispersion in United States Manufacturing:
The Role of Computer Investment”, Journal of Labor Economics, 22 (2): 397-430.
Fan, J. P. H. and L. H. P. Lang (2000). “The Measurement of Relatedness: An Application to Corporate
Diversification.” Journal of Business, 73 (4): 629-660.
Finkelstein, Sydney, Donald C. Hambrick and Albert A. Cannella Jr. (2009). “Top Management Teams,”
In Strategic Leadership: Theory and Research on Executives, Top Management Teams, and Boards,
New York: Oxford University Press, p. 121-63.
Fligstein, Neil (1985). “The Spread of the Multidivisional Form Among Large Firms, 1919-1979,”
American Sociological Review, 50(3), 377–391.
Galbraith, Jay R. (1971). “Matrix Organization Designs - How to Combine Functional and Project
Forms,” Business Horizons, 14(1), 29–40.
_____ (1974). “Organization Design - Information Processing View,” Interfaces, 4(3): 28–36.
Garicano, Luis (2000). “Hierarchies and the Organization of Knowledge in Production,” Journal of
Political Economy, 108 (5): 874-904.
Gerstner, Louis, Jr. (2002). Who Says Elephants Can’t Dance, New York: Harper Collins, p. 77.
Groysberg, Boris, L. Kevin Kelly and Bryan MacDonald (2011). “The New Path to the C-Suite,”
Harvard Business Review, 89 (3): 60-68.
25""
Guadalupe, Maria and Julie Wulf (2010). “The Flattening Firm and Product Market Competition: The
Effect of Trade Liberalization on Corporate Hierarchies,” American Economic Journal: Applied
Economics, 2 (4): 105-127.
Gurbaxani, Vijay, & Seungjin Whang (1991). “The Impact of Information-Systems on Organizations and
Markets,” Communications of the Acm, 34(1), 59–73.
Hambrick, Donald C. and Phyllis A. Mason (1984). “Upper Echelons: The Organization as a Reflection
of Its Top Managers,” Academy of Management Review, 9 (2): 193-206.
Hart, Oliver and John Moore (2005). “On the Design of Hierarchies: Coordination versus Specialization,”
Journal of Political Economy, 113 (4): 675-702.
Hill, Charles W.L. (1988). “Internal Capital-Market Controls and Financial Performance in
Multidivisional Firms,” Journal of Industrial Economics, 37(1), 67–83.
Hill, Charles W. L.; Michael A. Hitt and Robert E. Hoskisson (1992). “Cooperative Versus Competitive
Structures in Related and Unrelated Diversified Firms.” Organization Science, 3(4): 501-21.
Hill, Charles W.L., and Robert E. Hoskisson (1987). “Strategy and Structure in the Multiproduct Firm,”
Academy of Management Review, 12(2), 331–341.
Hounshell, David and John Kenly Smith, Jr. (1988). Science and Corporate Strategy: Du Pont R&D,
1902-1980. New York, NY: Cambridge University Press.
Kogut, Bruce, & Udo Zander (1992). Knowledge of the Firm, Combinative Capabilities, and the
Replication of Technology. Organization Science, 3(3), 383–397.
Lawrence, Paul R. and Jay W. Lorsch (1967). Organization and Environment. Boston, Mass.: HBS
Division of Research,
Malone, Thomas W., Joanne Yates, & Robert I. Benjamin (1987). “Electronic Markets and Electronic
Hierarchies,” Communications of the Acm, 30(6), 484–497.
Menz, Markus (2011). “Functional Top Management Team Members: A Review, Synthesis, and
Research Agenda,” Journal of Management, (forthcoming).
McElheran, Kristina (2010). “Delegation in Multi-Establishment Firms: Evidence from I.T. Purchasing,”
Working Paper.
Milgrom, Paul and John Roberts (1995). “Complementarities and Fit: Strategy, Structure, and
Organizational Change in Manufacturing.” Journal of Accounting & Economics, 19 (2/3): 179-208.
Nath, Pravin and Vijay Mahajan (2008). “Chief Marketing Officers: A Study of Their Presence in Firms’
Top Management Teams,” Journal of Marketing, 72 (1): 65-81.
Neilson, Gary L. and Julie Wulf (2012). “How Many Direct Reports?” Harvard Business Review. 90 (4):
112-119.

26""
Palepu, Krishna (1985). “Diversification Strategy, Profit Performance and the Entropy Measure,”
Strategic Management Journal, 6 (3): 239-255.
Porter, Michael E. (1985). The Competitive Advantage: Creating and Sustaining Superior Performance,
New York: Free Press.
Qian, Yingyi, Gerard Roland and Chenggang Xu (2006). “Coordination and Experimentation in M-Form
and U-Form Organizations,” Journal of Political Economy, 114 (2): 366-402.
Rajan, Raghuram G. and Julie M. Wulf (2006). “The Flattening Firm: Evidence From Panel Data On The
Changing Nature Of Corporate Hierarchies,” Review of Economics & Statistics, 88 (4): 769-773.
Rivkin, Jan W. and Nicolaj Siggelkow (2003). “Balancing Search and Stability: Interdependencies among
Elements of Organizational Design.” Management Science, 49 (3): 290-311.
Roberts, John (2004). “The Modern Firm.” Oxford University Press.
Rotemberg, Julio J. (1999). “Process-versus Function-Based Hierarchies,” Journal of Economics &
Management Strategy, 8 (4): 453-487.
Rumelt, Richard (1974). Strategy, Structure, and Economic Performance, Cambridge: Harvard University
Press.
_____ (1982). “Diversification Strategy and Profitability,” Strategic Management Journal, 3(4), 359–369.
Sloan, Alfred P. (1963). My Years with General Motors, New York: Doubleday.
Stein, Jeremy (2002). “Information Production and Capital Allocation: Decentralized versus Hierarchical
Firms,” Journal of Finance, 57 (5): 1891-1921.
Tushman, Michael L. and David A. Nadler (1978). “Information processing as an integration concept in
organization design,” Academy of Management Review, 3: 613–624.
Williamson, Oliver (1975). Markets and Hierarchies, New York: Free Press.
_____ (1985). The Economic Institutions of Capitalism, New York: Free Press.
Wulf, Julie (2012). “The Flattened Firm - Not as Advertised,” forthcoming, California Management
Review.
Zorn, Dirk M. (2004). “Here a Chief, There a Chief: The Rise of the CFO in the American Firm.”
American Sociological Review, 69 (3): 345-364.

27"
Figure 1: IBM Senior Executive Team, 1994
Source: IBM Notes: Of the 14 managers that reported directly to the CEO, 5 were general managers and 9 were functional managers. The administrative functional managers are CFO, General Counsel, Human Resources, Strategy, Public Relations, and Gov’t Programs. The product functional managers are Research & Development, Marketing, and Sales. Figure 2: Span, Functional Managers and General Managers over Time (1986-2006) (sample averages)
Notes: (i) The span [of control] is the size of the executive team. (ii) To minimize bias from using an unbalanced panel, the figure above is based on the sample of firms that appear for at least 10 years over the sample period. The first three time periods use data from the larger sample of firms (290), while the last time period (2006) is based on smaller sample (43 firms). If we limit the sample to only the 43 firms for which we have data in the later period, the pattern over the 20 years is qualitatively similar. Where we could not find 2006 data, we took the nearest year to 2006 between 2004 and 2008.
0"
2"
4"
6"
8"
10"
12"
1986,1990" 1991,1995" 1996,1999" 2004,2008"
Average'Num
ber'
Years'
Span" Func4onal"Managers" General"Managers"
CEO
Finance General"Counsel
Human"Resources Strategy Public"
Relations Gov’t.
Programs R"&"D Marketing Sales
" "
Technology Personal"Systems Software Systems
(Mainframes) Services
Administrative"Functions Product"Functions
Legend Functional"Managers
General"Managers
"""2006"

28#
Table 1: Mean and Correlations between Executive Team Positions
Mean Gen. Mgrs. CFO General Counsel CHRO Strat.
Planning Sales &
Marketing R&D Manufacturing
(1) (2) (3) (4) (5) (6) (7) (8) (9) General Mgrs. 1.790 1 Admin. Functions: CFO 0.728 0.12*** 1 General Counsel 0.672 0.11*** 0.29*** 1 CHRO 0.522 0.13*** 0.19*** 0.29*** 1 CIO 0.063 0.08*** 0.074*** 0.04 0.14*** Strat. Planning 0.237 0.14*** 0.07** 0.03 0.08*** 1 Product Functions: Sales & Marketing 0.113 -0.02 -0.013 -0.03 0.02 -0.01 1 R&D 0.150 0.10*** 0.09*** 0.04 0.06** 0.08*** 0.08*** 1 Manufacturing 0.053 0.01 -0.04* -0.06** -0.01 0.03 0.21*** 0.14*** 1
Notes: ***, **, and * represent statistical significance at 1%, 5%, and 10% levels respectively. The following variables are included in this table: General managers is the number of general managers (includes COO, group managers and division managers) reporting directly to the CEO; All other variables are dummy variables for whether a given functional position reports directly to the CEO. CFO stands for Chief Financial Officer, CHRO stands for Chief Human Resource Officer, and CIO stands for Chief Information Officer. For each of these functions (Administrative and Product), the mean (Column 1) represents the fraction of the sample that has the position reporting directly to the CEO. Columns 2 through 10 show the correlation between pairs of positions. These correlations are calculated on our full sample (2321 firm-year observations).

29#
Table 2: Descriptive Statistics
Mean S.D. Observations
Firm variables: Sales (000s) 9267.44 16106.13 2321 Assets (000s) 10826.57 21852.34 2321 Number of Employees (000s) 48.28 81.36 2321 Number of Segments 2.76 1.66 2321 Functional Managers 3.19 1.53 2321 Administrative Functional Managers 2.55 1.41 2321 Product Functional Managers 0.32 0.60 2321 General Managers 1.79 1.52 2321 Span (Size of Executive team) 4.98 2.34 2321 CAO 0.33 0.47 2321 COO 0.48 0.50 2321 PCs per Employee 0.22 0.21 2321 Industry Avg. Price-Cost Margin 0.18 0.10 2321 Foreign Affiliates Sales (%) 0.23 0.21 2321 ln Number of LAN nodes 4.25 4.03 2321
Firm scope variables: Unrelated Diversif. (Entropy) 0.37 0.41 2321 Vertical Relatedness 0.02 0.04 1502 Complementarity 0.40 0.31 1502
Compensation variables: ln Func. Mgrs. Base Compensation 12.43 0.38 5317 ln Func. Mgrs. Total Compensation 13.28 0.70 5317 ln General Mgrs. Base Compensation 12.05 0.41 8866 ln General Mgrs. Total Compensation 12.75 0.65 8866 ln CEO Base Compensation 13.49 0.35 2340 ln CEO Total Compensation 14.65 0.75 2340
Notes: Number of segments is the number of business segments (COMPUSTAT segment data). Functional managers is the number of functional manager positions reporting directly to the CEO. Administrative functional managers include CFO, General Counsel, Human Resources, Public Relations, Planning, and Chief Information Officer. Product functional managers include heads of R&D, marketing, sales, sales & marketing, and manufacturing. General managers is the number of general managers reporting directly to the CEO (COO, group managers and division managers). Span is the total number of positions reporting directly to the CEO. PCs per employee is PCs per 1000 employees. The Industry average price-cost margin is computed at 3-digit SIC (COMPUSTAT). Foreign Affiliate Sales (%) is the fraction of sales reported by foreign affiliates as a share of total firm sales (COMPUSTAT Geographic Segment data). ln Number of LAN nodes is the log of the number of Local Area Network nodes. Unrelated diversification is the entropy measure used in Palepu (1985). Vertical Relatedness and Complementarity are based on Fan and Lang (2000) definitions, using 1992 US Input-Output tables and COMPUSTAT segment data. See footnotes 13, 14 and 15 for exact definitions. Base Compensation is an employee's base salary, while Total Compensation includes base salary along with bonuses and long-term incentives.

30#
Table 3: Changes in Executive Team Structure
(1) (2) (3) (4) (5) VARIABLES
Span
Gen. Mgr.
Func. Mgrs.
Product Func. Mgrs.
Admin. Func. Mgrs.
Unrelated Diversif. (Entropy) 0.741* 0.625** 0.116 -0.262** 0.378 (0.411) (0.270) (0.297) (0.133) (0.245) PCs per Employee 0.268 -0.370 0.638** 0.0902 0.548** (0.440) (0.245) (0.301) (0.134) (0.236) # of Segments -0.0551 -0.0571 0.00205 0.0423** -0.0402 (0.0810) (0.0534) (0.0549) (0.0194) (0.0480) CAO 0.464** 0.106 0.358*** 0.0602 -0.702*** (0.183) (0.117) (0.121) (0.0532) (0.0978) COO -0.870*** -0.412*** -0.459*** -0.190*** -0.269*** (0.168) (0.111) (0.106) (0.0403) (0.0860) Foreign Affiliates Sales (%) 1.595** 0.758 0.837** 0.103 0.734** (0.672) (0.487) (0.407) (0.167) (0.345) Ln(Sales) -0.381 -0.0186 -0.363 -0.122 -0.241 (0.349) (0.217) (0.234) (0.0809) (0.205) R & D / Sales -5.389 -7.024 1.635 2.759 -1.124 (7.430) (5.077) (4.458) (1.755) (3.990) Industry Avg. Price-Cost Margin -1.794 -1.784* -0.0102 -0.386 0.376 (1.616) (1.062) (1.019) (0.439) (0.847) Observations 2,321 2,321 2,321 2,321 2,321 R-squared 0.156 0.084 0.128 0.059 0.168 Number of firms 290 290 290 290 290 Year Dummies Yes Yes Yes Yes Yes Firm FE Yes Yes Yes Yes Yes
Notes: ***, **, and * represent statistical significance at 1%, 5%, and 10% levels respectively. Standard errors are clustered by firm. Span is the total number of positions reporting directly to the CEO (i.e., the sum of functional managers and general managers). General managers is defined the number of general managers reporting directly to the CEO. General managers include COO, group managers and division managers. Functional manager is defined as the number of functional manager positions reporting directly to the CEO. Product functional managers include heads of R&D, marketing, sales, sales & marketing, and manufacturing. Administrative functional managers include CFO, General Counsel, Human Resources, Public Relations, Planning, and Chief Information Officer.

31##
Table 4: Types of Functional Managers, Diversification and IT (1) (2) (3) (4) (5) (6) (7) (8)
Product Product Product Product Product Admin. Admin. Admin.
VARIABLES Func. Mgrs. Func. Mgrs. Func. Mgrs. Func. Mgrs. Func. Mgrs. Func. Mgrs. Func. Mgrs. Func. Mgrs. # Related Segments 0.0291**
(0.0117) # Unrelated Segments -0.0201
(0.0159)
Vertical Relatedness
0.829
-0.648
(0.634)
(2.082)
Complementarity
0.247**
-0.0410
(0.112)
(0.264)
PCs per employees*Unrelated Diversif
-0.477**
(0.227) Unrelated Diversif. (Entropy)
-0.281** -0.163
0.294
(0.132) (0.137)
(0.243)
Ln (# of LAN nodes)
-0.00634
0.104**
(0.0203)
(0.0422)
PCs per Employee 0.105 -0.0138 -0.0188 0.111 0.212 0.927* 0.927* 0.430*
(0.138) (0.200) (0.202) (0.137) (0.153) (0.550) (0.549) (0.228)
Gen. Mgrs. 0.0293** 0.0255 0.0238 0.0323** 0.0323** 0.0951*** 0.0957*** 0.0850***
(0.0140) (0.0166) (0.0165) (0.0143) (0.0140) (0.0347) (0.0347) (0.0271)
# of Segments
0.0319 0.0297 0.0445** 0.0401** -0.0246 -0.0239 -0.0419
(0.0231) (0.0229) (0.0196) (0.0192) (0.0486) (0.0485) (0.0476)
Observations 2,321 1,494 1,494 2,321 2,321 1,494 1,494 2,321 R-squared 0.063 0.084 0.091 0.066 0.070 0.165 0.165 0.184 Number of firms 290 213 213 290 290 213 213 290 Year Dummies Yes Yes Yes Yes Yes Yes Yes Yes Firm FE Yes Yes Yes Yes Yes Yes Yes Yes
Notes: ***, **, and * represent statistical significance at 1%, 5%, and 10% levels respectively. Standard errors are clustered by firm. Since the LAN nodes variable is only available after 1993, we impute a value of zero for the year prior to 1993 and include a dummy variable for the imputed observations in columns 4 and 8 (unreported) All columns include controls for the number of segments, CAO, COO, Industry Avg. Price-Cost Margin, Foreign Affiliates Sales (%), ln(Sales) and R&D / Sales, as in Table 3. See Table 3 for more definitions.
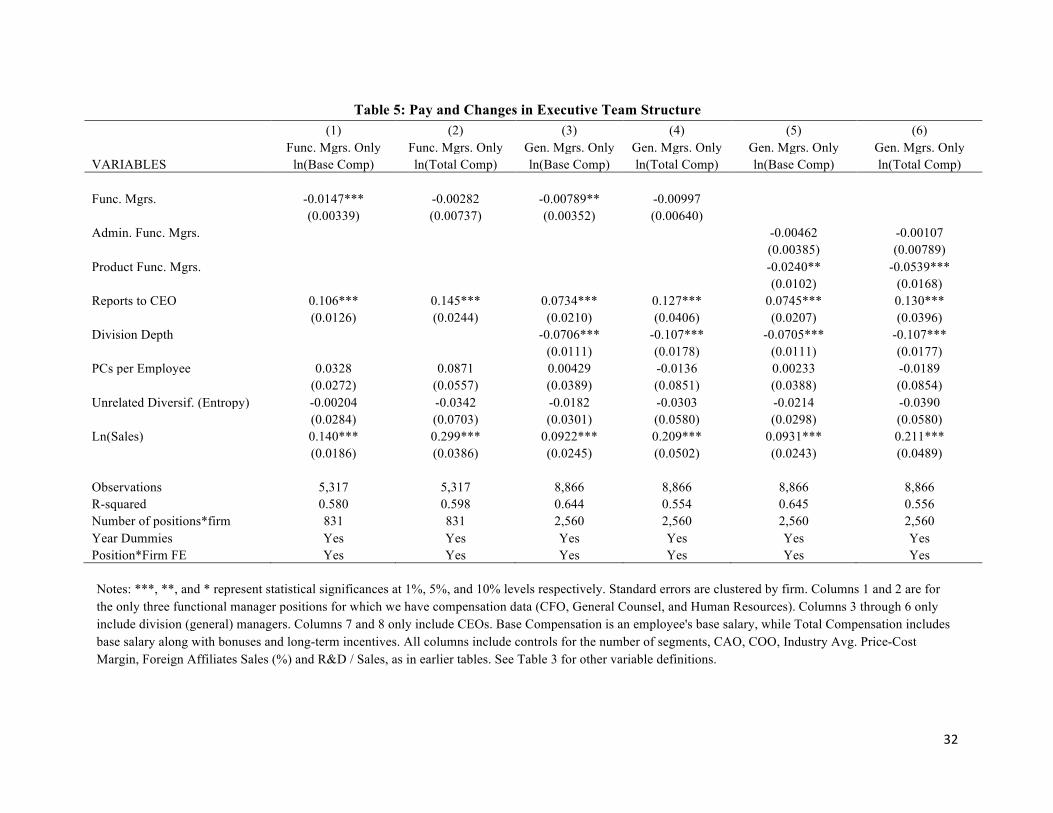
32##
Table 5: Pay and Changes in Executive Team Structure (1) (2) (3) (4) (5) (6)
Func. Mgrs. Only Func. Mgrs. Only Gen. Mgrs. Only Gen. Mgrs. Only Gen. Mgrs. Only Gen. Mgrs. Only
VARIABLES ln(Base Comp) ln(Total Comp) ln(Base Comp) ln(Total Comp) ln(Base Comp) ln(Total Comp) Func. Mgrs. -0.0147*** -0.00282 -0.00789** -0.00997
(0.00339) (0.00737) (0.00352) (0.00640) Admin. Func. Mgrs.
-0.00462 -0.00107
(0.00385) (0.00789)
Product Func. Mgrs.
-0.0240** -0.0539***
(0.0102) (0.0168)
Reports to CEO 0.106*** 0.145*** 0.0734*** 0.127*** 0.0745*** 0.130***
(0.0126) (0.0244) (0.0210) (0.0406) (0.0207) (0.0396)
Division Depth
-0.0706*** -0.107*** -0.0705*** -0.107***
(0.0111) (0.0178) (0.0111) (0.0177)
PCs per Employee 0.0328 0.0871 0.00429 -0.0136 0.00233 -0.0189
(0.0272) (0.0557) (0.0389) (0.0851) (0.0388) (0.0854)
Unrelated Diversif. (Entropy) -0.00204 -0.0342 -0.0182 -0.0303 -0.0214 -0.0390
(0.0284) (0.0703) (0.0301) (0.0580) (0.0298) (0.0580)
Ln(Sales) 0.140*** 0.299*** 0.0922*** 0.209*** 0.0931*** 0.211***
(0.0186) (0.0386) (0.0245) (0.0502) (0.0243) (0.0489)
Observations 5,317 5,317 8,866 8,866 8,866 8,866 R-squared 0.580 0.598 0.644 0.554 0.645 0.556 Number of positions*firm 831 831 2,560 2,560 2,560 2,560 Year Dummies Yes Yes Yes Yes Yes Yes Position*Firm FE Yes Yes Yes Yes Yes Yes Notes: ***, **, and * represent statistical significances at 1%, 5%, and 10% levels respectively. Standard errors are clustered by firm. Columns 1 and 2 are for the only three functional manager positions for which we have compensation data (CFO, General Counsel, and Human Resources). Columns 3 through 6 only include division (general) managers. Columns 7 and 8 only include CEOs. Base Compensation is an employee's base salary, while Total Compensation includes base salary along with bonuses and long-term incentives. All columns include controls for the number of segments, CAO, COO, Industry Avg. Price-Cost Margin, Foreign Affiliates Sales (%) and R&D / Sales, as in earlier tables. See Table 3 for other variable definitions.