Embed Size (px)
Citation preview

Who Gained Health Insurance Coverage Under the ACA, and Where Do They Live?
ACA Implementation—Monitoring and Tracking
Bowen Garrett and Anuj Gangopadhyaya
December 2016
ACA Implementation—Monitoring and Tracking 2
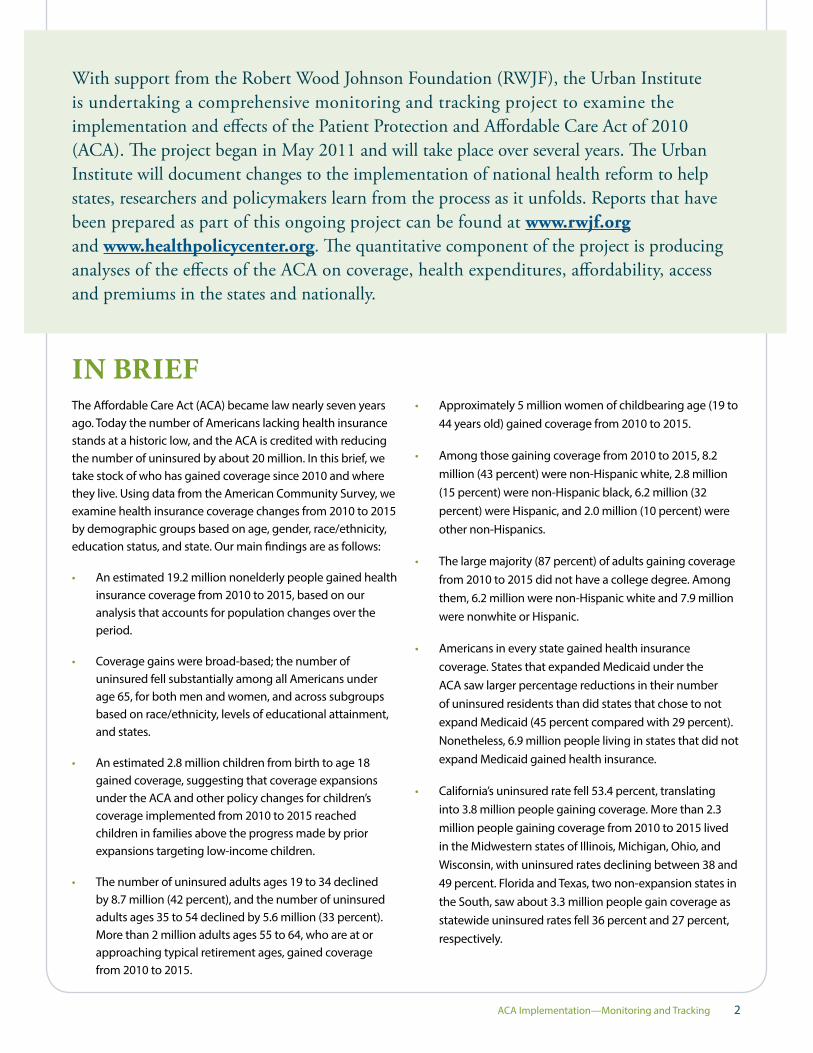
IN BRIEFThe Affordable Care Act (ACA) became law nearly seven years ago. Today the number of Americans lacking health insurance stands at a historic low, and the ACA is credited with reducing the number of uninsured by about 20 million. In this brief, we take stock of who has gained coverage since 2010 and where they live. Using data from the American Community Survey, we examine health insurance coverage changes from 2010 to 2015 by demographic groups based on age, gender, race/ethnicity, education status, and state. Our main findings are as follows:
• An estimated 19.2 million nonelderly people gained health insurance coverage from 2010 to 2015, based on our analysis that accounts for population changes over the period.
• Coverage gains were broad-based; the number of uninsured fell substantially among all Americans under age 65, for both men and women, and across subgroups based on race/ethnicity, levels of educational attainment, and states.
• An estimated 2.8 million children from birth to age 18 gained coverage, suggesting that coverage expansions under the ACA and other policy changes for children’s coverage implemented from 2010 to 2015 reached children in families above the progress made by prior expansions targeting low-income children.
• The number of uninsured adults ages 19 to 34 declined by 8.7 million (42 percent), and the number of uninsured adults ages 35 to 54 declined by 5.6 million (33 percent). More than 2 million adults ages 55 to 64, who are at or approaching typical retirement ages, gained coverage from 2010 to 2015.
• Approximately 5 million women of childbearing age (19 to 44 years old) gained coverage from 2010 to 2015.
• Among those gaining coverage from 2010 to 2015, 8.2 million (43 percent) were non-Hispanic white, 2.8 million (15 percent) were non-Hispanic black, 6.2 million (32 percent) were Hispanic, and 2.0 million (10 percent) were other non-Hispanics.
• The large majority (87 percent) of adults gaining coverage from 2010 to 2015 did not have a college degree. Among them, 6.2 million were non-Hispanic white and 7.9 million were nonwhite or Hispanic.
• Americans in every state gained health insurance coverage. States that expanded Medicaid under the ACA saw larger percentage reductions in their number of uninsured residents than did states that chose to not expand Medicaid (45 percent compared with 29 percent). Nonetheless, 6.9 million people living in states that did not expand Medicaid gained health insurance.
• California’s uninsured rate fell 53.4 percent, translating into 3.8 million people gaining coverage. More than 2.3 million people gaining coverage from 2010 to 2015 lived in the Midwestern states of Illinois, Michigan, Ohio, and Wisconsin, with uninsured rates declining between 38 and 49 percent. Florida and Texas, two non-expansion states in the South, saw about 3.3 million people gain coverage as statewide uninsured rates fell 36 percent and 27 percent, respectively.
With support from the Robert Wood Johnson Foundation (RWJF), the Urban Institute is undertaking a comprehensive monitoring and tracking project to examine the implementation and effects of the Patient Protection and Affordable Care Act of 2010 (ACA). The project began in May 2011 and will take place over several years. The Urban Institute will document changes to the implementation of national health reform to help states, researchers and policymakers learn from the process as it unfolds. Reports that have been prepared as part of this ongoing project can be found at www.rwjf.org and www.healthpolicycenter.org. The quantitative component of the project is producing analyses of the effects of the ACA on coverage, health expenditures, affordability, access and premiums in the states and nationally.

ACA Implementation—Monitoring and Tracking 3
Congress is now considering options to repeal and replace the ACA. Repeal of the ACA without new policies capable of maintaining the coverage gains achieved since 2010 would
result in millions of Americans, of all ages and backgrounds and in all states, losing health insurance along with the access to health care and financial protections it affords.
INTRODUCTION
FINDINGS
The Affordable Care Act (ACA) was enacted in March 2010. A primary goal of the ACA was expanding health insurance, and the law is credited with increasing the number of Americans with health insurance by around 20 million and bringing uninsured rates to a historic low (Uberoi, Finegold, and Gee 2016; Avery, Finegold, and Whitman 2016). Recent studies show that coverage expansions under the ACA led to increased access to health care (Wherry and Miller 2016; Kirby and Vistnes 2016; Furman and Fielder 2016), reduced financial risk for families (Hu et al. 2016), and lower uncompensated care costs for hospitals (Blavin 2016; Furman and Fielder 2016).
The following are key components of the ACA designed to expand coverage: establishment of health insurance marketplaces along with premium and cost-sharing subsidies; elimination of restrictions on coverage due to pre-existing health conditions; extension of dependent coverage for adult children up to age 26 under a parent’s plans; expansion of Medicaid; and initiation of the individual mandate and the employer mandate. At least the latter five of these provisions face proposals for repeal through budget reconciliation given the outcome of the November elections. It is thus worthwhile
to take stock of how many Americans gained health insurance coverage since the ACA was passed and to describe the geographic and demographic characteristics of those who gained coverage under the law, and whose coverage may be affected by ACA repeal.
Additional policy changes related to health insurance also occurred during this period. For instance, the Children’s Health Insurance Program Reauthorization Act of 2009 (CHIPRA) built upon earlier expansions of eligibility for children in Medicaid and the Children’s Health Insurance Program (CHIP) by providing states with additional resources to increase children’s take-up and retention.
In this brief, we take a detailed look at changes in health insurance coverage among the nonelderly population from 2010 to 2015. We find that gains in coverage were large and widespread. Nationally, uninsured rates fell substantially for all of the groups we examine based on age, gender, race/ethnicity, and education status. Uninsured rates fell for all states, but coverage gains were larger for states that chose to participate in the ACA’s Medicaid expansions.
We use data from the American Community Survey (ACS) to compute uninsured rates for the nation, individual states and demographic subgroups. We calculate uninsured rates for 2010 and 2015 as well as a 2010 uninsured rate adjusted for demographic changes in the population between these periods (see more details in the data and methods box on page 17). In all tables, we calculate the change in the number of people gaining coverage using the difference between the 2015 actual uninsured rate and the 2010 adjusted uninsured rate multiplied by the estimated 2015 population. Our survey-based estimates of changes in coverage from 2010 to 2015 differ from model-based estimates of the coverage impacts of ACA repeal such as those recently reported by Blumberg, Buettgens, and Holahan (2016). The analysis of the impacts of repeal forecasts
changes in coverage for 2019 and includes expected reductions in coverage due to market disruption in the entire individual market (including coverage purchased off-Marketplace).
Of the nearly 274 million Americans in 2015 who were under the age of 65, an estimated 11.2 percent were uninsured (Table 1). The uninsured rate in 2015 is substantially lower than the 18.0 percent uninsured rate in 2010. The adjusted uninsured rate for 2010, which accounts for shifts in the composition of the population from 2010 to 2015, is 18.2 percent. The adjusted uninsured rate represents what the uninsured rate would be in 2015 holding uninsured rates, by demographic group, as they were in 2010. Comparing the actual 2015 uninsured rate to the adjusted 2010 uninsured rate, we find that the uninsured rate in 2015 is 7 percentage points (18.2–11.2) lower than it would

ACA Implementation—Monitoring and Tracking 4
be if the coverage patterns that existed in 2010 applied in 2015. Accordingly, nearly 19.2 million Americans gained insurance coverage from 2010 to 2015, representing a -38.4 percent change in the number of uninsured.
Our national estimate of 19.2 million Americans gaining coverage from 2010 to 2015, accounting for the changes in the size and composition of the population over the period, is very similar to estimates of the effect of the ACA on insurance coverage using other methods and data sources (Uberoi, Finegold, and Gee 2016). But because our analysis extends only to the end of 2015, it does not include further coverage gains that occurred in 2016. Also, our analysis does not account for improved economic conditions over this period that could have helped reduce the number of uninsured.
Americans across every age group, gender, and race/ethnicity group we examined experienced gains in health insurance coverage from 2010 to 2015 (Table 1). Although children were not a specific target of coverage expansions under the ACA and already had relatively low uninsured rates in 2010, 2.8 million children gained health insurance from 2010 to 2015—a 41.4 percent reduction in the number of uninsured. Many children in 2010 were already eligible for coverage under pre-ACA Medicaid and CHIP expansions, but the coverage increase for children is consistent with prior research suggesting that children are more likely to gain coverage when their parents gain coverage (Dubay and Kenney 2003; Kenney 2015) and that participation in Medicaid/CHIP was increasing both under the ACA and before ACA implementation under CHIPRA’s enrollment and retention improvements and other policy changes (Kenney et al. 2016b; Kenney et al. 2012).
2015 population
2015 uninsured rate
2010 uninsured rate
2010 adjusted uninsured rate
Adjusted gain in coverage
Percentage change in uninsured
Total nonelderly 273,704,000 11.2% 18.0% 18.2% 19,150,000 -38.4%
Age (years)
0–18 78,073,000 5.1% 8.5% 8.7% 2,819,000 -41.4%
19–34 70,640,000 17.3% 29.9% 29.6% 8,672,000 -41.5%
35–54 84,143,000 13.3% 19.6% 20.0% 5,592,000 -33.3%
55–64 40,848,000 8.1% 12.7% 13.2% 2,067,000 -38.3%
Gender
Male 137,101,000 12.7% 19.9% 20.2% 10,284,000 -37.1%
Female 136,603,000 9.8% 16.1% 16.3% 8,866,000 -39.9%
Race/ethnicity
Non-Hispanic white 160,453,000 7.9% 13.2% 13.0% 8,177,000 -39.2%
Non-Hispanic black 35,459,000 13.2% 20.9% 21.2% 2,806,000 -37.4%
Hispanic 52,732,000 20.8% 32.7% 32.6% 6,213,000 -36.2%
Non-Hispanic other 25,060,000 9.7% 17.6% 17.4% 1,953,000 -44.7%
Table 1. National Estimates of Coverage Gains among Nonelderly Adults and Children, by Demographic Characteristics, 2010–15
Sources: Urban Institute analysis of American Community Survey data (IPUMS-USA, University of Minnesota, www.ipums.org) for 2010 and 2015.Notes: The adjusted uninsured rate adjusts the 2010 uninsured rate to reflect the demographic and geographic composition of the 2015 population. The adjusted gain in coverage is calculated as the 2015 population multiplied by the difference between the 2015 uninsured rate and the 2010 adjusted uninsured rate; it measures the difference between the number of uninsured in 2015 and the estimated number who would have been uninsured in 2015 if coverage rates for each demographic group had remained at their 2010 levels.

ACA Implementation—Monitoring and Tracking 5
Figure 1 shows that among adults ages 19 to 34, who had relatively a high uninsured rate of 30 percent in 2010, nearly 8.7 million people gained coverage from 2010 to 2015 (a 41.5 percent reduction in the uninsured). Among adults ages 35 to 54, nearly 5.6 million gained coverage (a 33.3 percent reduction in uninsured). Close to 2.1 million people ages 55 to 64 gained coverage from 2010 to 2015. In 2010, this group of adults at or nearing usual retirement age had a relatively low uninsured rate of 12.7 percent, yet the ACA appears to have contributed to further reducing their uninsured rate by 38.3 percent.
People gaining coverage from 2010 to 2015 were more likely to be male (10.3 million or 54 percent) than female (8.9 million or 46 percent), but both sexes experienced similar percentage reductions in the number uninsured (37.1 percent and 39.9
percent, respectively). Nearly 8.2 million (43 percent) of the 19.2 million people gaining health coverage from 2010 to 2015 were non-Hispanic white, 2.8 million (15 percent) were non-Hispanic black, 6.2 million (32 percent) were Hispanic, and 2.0 million (10 percent) were other non-Hispanic people. Hispanics had the highest uninsured rates in 2010 (33 percent) and experienced the largest reduction in uninsured rates (12 percentage points), but they still had the highest uninsured rate of the four groups in 2015 (20 percent). Consistent with these patterns, prior research has shown that the ACA reduced racial and ethnic disparities in health insurance coverage (McMorrow et al. 2015). In percentage terms, the four groups experienced similar reductions in their numbers of uninsured ranging from 36.2 percent (Hispanics) to 44.7 percent (other non-Hispanics).
Gender
Age Group
Race/Ethnicity
Non-Hispanic white Non-Hispanic black
Non-Hispanicother
Hispanic
0-18 19-34 55-6435-54
FemaleMale
8,866(46.3%)
10,284(53.7%)
2,819(14.7%)
8,672(45.3%)
2,067(10.8%)
5,592(29.2%)
8,177(42.7%)
2,806(14.7%)
1,953(10.2%)
6,213(32.4%)
Figure 1. Number and Share of Nonelderly People Who Gained Coverage from 2010 to 2015, by Demographic Characteristics (number in 1,000s)
Sources: Urban Institute analysis of American Community Survey data (IPUMS-USA, University of Minnesota, www.ipums.org) for 2010 and 2015.
We present similar findings for nonelderly adults in Table 2. Limiting to adults focuses on this target population of the ACA and enables us to examine changes by educational attainment. Nationally, 16.3 million adults ages 19 to 64 gained coverage from 2010 to 2015. Nearly 11.5 million were between the ages of 19 and 44, and nearly 4.9 million were between the ages of 45 and 64. A little more than half were men (8.9 million or 54 percent); 7.5 million women (46 percent) also gained coverage. Nearly 7.4 million (45 percent) were non-Hispanic whites, and 9.0 million (55 percent) were nonwhites or Hispanics.
Differences in coverage gains by educational attainment are large. Most of the 16.3 million nonelderly adults gaining coverage from 2010 to 2015 (14.1 million or 87 percent) did not have college degrees, while 2.2 million (13 percent) had college degrees. The coverage gains were therefore concentrated among adults with less than college degrees. This group experienced substantially higher rates of unemployment than those with college degrees in 2010 in the aftermath of the Great Recession (Snyder and Dillow 2015).

ACA Implementation—Monitoring and Tracking 6
2015 population
2015 uninsured rate
2010 uninsured rate
2010 adjusted uninsured rate
Adjusted gain in coverage
Percentage change in uninsured
All nonelderly adults (ages 19–64)
195,631,000 13.7% 21.9% 22.0% 16,331,000 -37.9%
Age (years)
19–44 111,639,000 16.6% 26.8% 26.8% 11,465,000 -38.3%
45–64 83,992,000 9.9% 15.4% 15.7% 4,866,000 -36.9%
Gender
Men 97,184,000 15.8% 24.8% 24.9% 8,860,000 -36.6%
Women 98,447,000 11.6% 19.1% 19.2% 7,471,000 -39.5%
Race/ethnicity
Non-Hispanic white 120,240,000 9.2% 15.7% 15.4% 7,379,000 -39.9%
Nonwhite or Hispanic 75,391,000 20.8% 33.2% 32.7% 8,952,000 -36.4%
Education
Less than a college degree
138,330,000 17.4% 27.1% 27.6% 14,135,000 -37.0%
College degree or more
57,301,000 4.8% 8.3% 8.6% 2,196,000 -44.4%
Gender and age
Men, ages 19–44 56,225,000 19.4% 30.9% 30.9% 6,487,000 -37.3%
Men, ages 45–64 40,958,000 10.8% 16.3% 16.6% 2,373,000 -34.8%
Women, ages 19–44 55,414,000 13.7% 22.7% 22.6% 4,978,000 -39.7%
Women ages 45–64 43,033,000 9.0% 14.6% 14.8% 2,493,000 -39.2%
Race/ethnicity and education
Non-Hispanic white, less than a college degree
79,627,000 12.2% 20.0% 20.0% 6,226,000 -39.1%
Non-Hispanic white, college degree or more
40,614,000 3.5% 6.3% 6.4% 1,153,000 -44.6%
Nonwhite or Hispanic, less than a college degree
58,703,000 24.4% 37.9% 37.9% 7,910,000 -35.5%
Nonwhite or Hispanic, college degree or more
16,687,000 7.9% 14.0% 14.1% 1,043,000 -44.2%
Table 2. National Estimates of Coverage Gains among Nonelderly Adults, 2010–15
Sources: Urban Institute analysis of American Community Survey data (IPUMS-USA, University of Minnesota, www.ipums.org) for 2010 and 2015.Notes: The adjusted uninsured rate adjusts the 2010 uninsured rate to reflect the demographic and geographic composition of the 2015 population. The adjusted gain in coverage is calculated as the 2015 population multiplied by the difference between the 2015 uninsured rate and the 2010 adjusted uninsured rate; it measures the difference between the number of uninsured in 2015 and the estimated number who would have been uninsured in 2015 if coverage rates for each demographic group had remained at their 2010 levels.
ACA Implementation—Monitoring and Tracking 7
Source: Urban Institute analysis of American Community Survey data (IPUMS-USA, University of Minnesota, www.ipums.org) for 2010 and 2015.
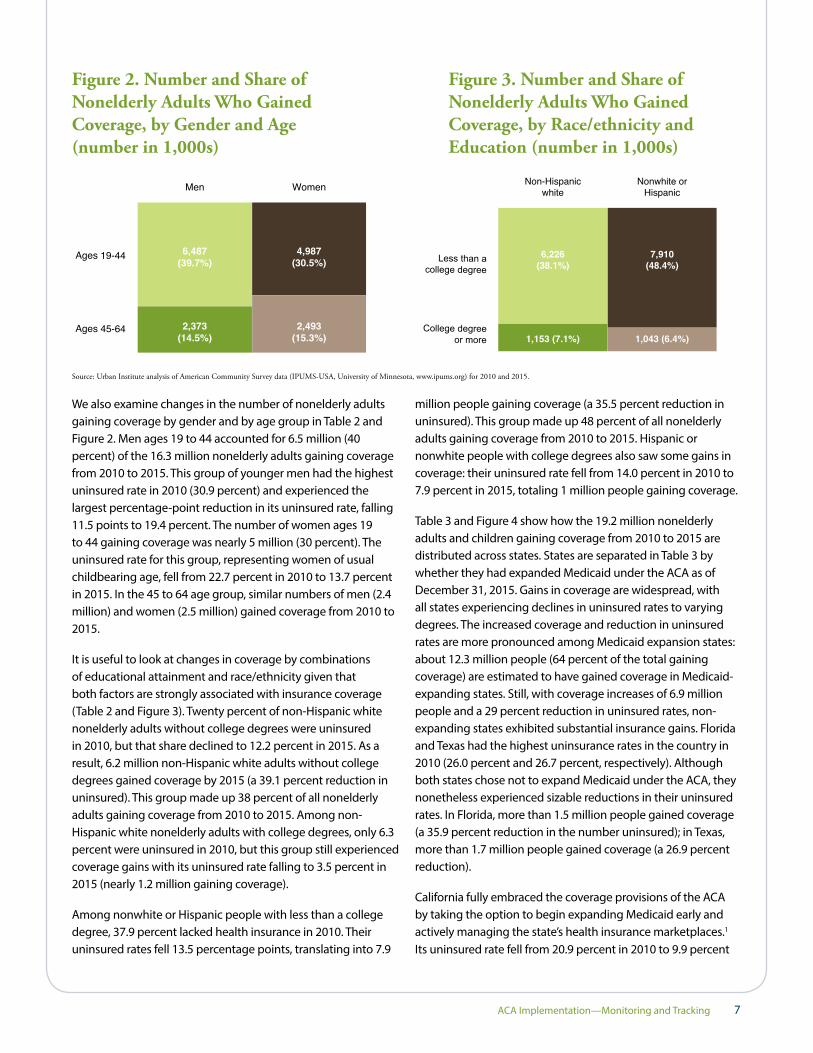
Figure 2. Number and Share of Nonelderly Adults Who Gained Coverage, by Gender and Age (number in 1,000s)
Figure 3. Number and Share of Nonelderly Adults Who Gained Coverage, by Race/ethnicity and Education (number in 1,000s)
We also examine changes in the number of nonelderly adults gaining coverage by gender and by age group in Table 2 and Figure 2. Men ages 19 to 44 accounted for 6.5 million (40 percent) of the 16.3 million nonelderly adults gaining coverage from 2010 to 2015. This group of younger men had the highest uninsured rate in 2010 (30.9 percent) and experienced the largest percentage-point reduction in its uninsured rate, falling 11.5 points to 19.4 percent. The number of women ages 19 to 44 gaining coverage was nearly 5 million (30 percent). The uninsured rate for this group, representing women of usual childbearing age, fell from 22.7 percent in 2010 to 13.7 percent in 2015. In the 45 to 64 age group, similar numbers of men (2.4 million) and women (2.5 million) gained coverage from 2010 to 2015.
It is useful to look at changes in coverage by combinations of educational attainment and race/ethnicity given that both factors are strongly associated with insurance coverage (Table 2 and Figure 3). Twenty percent of non-Hispanic white nonelderly adults without college degrees were uninsured in 2010, but that share declined to 12.2 percent in 2015. As a result, 6.2 million non-Hispanic white adults without college degrees gained coverage by 2015 (a 39.1 percent reduction in uninsured). This group made up 38 percent of all nonelderly adults gaining coverage from 2010 to 2015. Among non-Hispanic white nonelderly adults with college degrees, only 6.3 percent were uninsured in 2010, but this group still experienced coverage gains with its uninsured rate falling to 3.5 percent in 2015 (nearly 1.2 million gaining coverage).
Among nonwhite or Hispanic people with less than a college degree, 37.9 percent lacked health insurance in 2010. Their uninsured rates fell 13.5 percentage points, translating into 7.9
million people gaining coverage (a 35.5 percent reduction in uninsured). This group made up 48 percent of all nonelderly adults gaining coverage from 2010 to 2015. Hispanic or nonwhite people with college degrees also saw some gains in coverage: their uninsured rate fell from 14.0 percent in 2010 to 7.9 percent in 2015, totaling 1 million people gaining coverage.
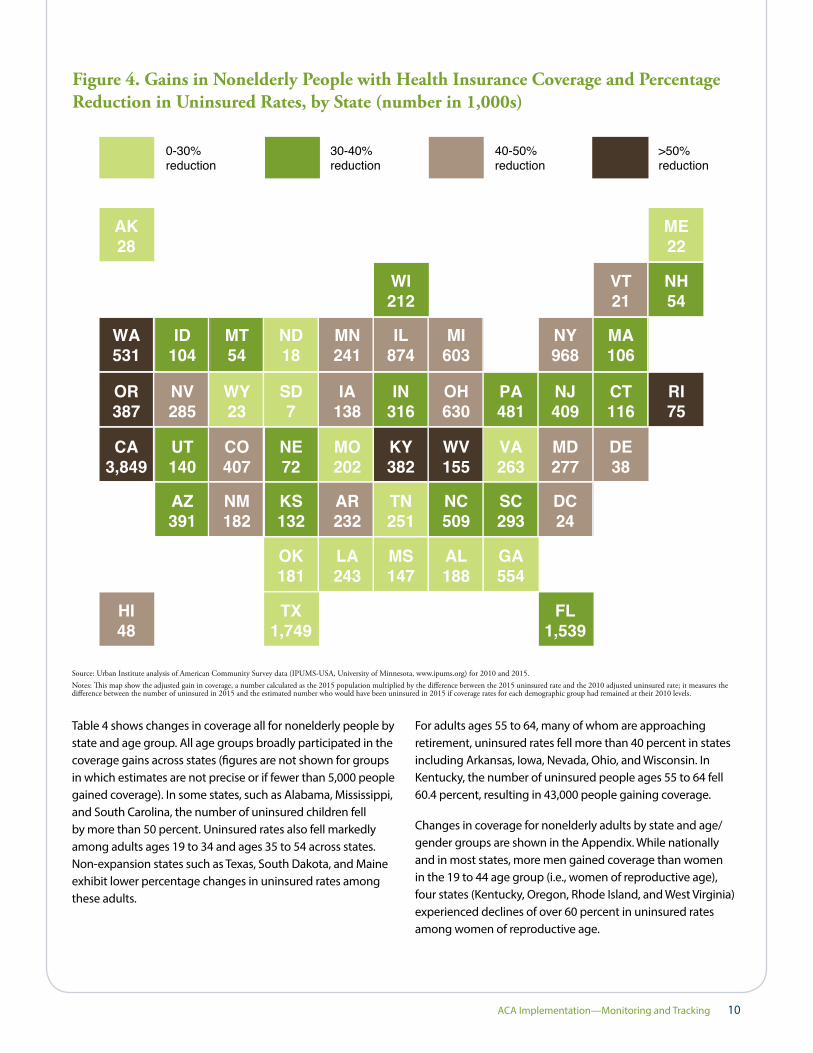
Table 3 and Figure 4 show how the 19.2 million nonelderly adults and children gaining coverage from 2010 to 2015 are distributed across states. States are separated in Table 3 by whether they had expanded Medicaid under the ACA as of December 31, 2015. Gains in coverage are widespread, with all states experiencing declines in uninsured rates to varying degrees. The increased coverage and reduction in uninsured rates are more pronounced among Medicaid expansion states: about 12.3 million people (64 percent of the total gaining coverage) are estimated to have gained coverage in Medicaid-expanding states. Still, with coverage increases of 6.9 million people and a 29 percent reduction in uninsured rates, non-expanding states exhibited substantial insurance gains. Florida and Texas had the highest uninsurance rates in the country in 2010 (26.0 percent and 26.7 percent, respectively). Although both states chose not to expand Medicaid under the ACA, they nonetheless experienced sizable reductions in their uninsured rates. In Florida, more than 1.5 million people gained coverage (a 35.9 percent reduction in the number uninsured); in Texas, more than 1.7 million people gained coverage (a 26.9 percent reduction).
California fully embraced the coverage provisions of the ACA by taking the option to begin expanding Medicaid early and actively managing the state’s health insurance marketplaces.1 Its uninsured rate fell from 20.9 percent in 2010 to 9.9 percent
Ages 19-44
Ages 45-64
Men Women
6,487(39.7%)
4,987(30.5%)
2,373(14.5%)
2,493(15.3%)
Less than acollege degree
College degreeor more
Non-Hispanicwhite
Nonwhite orHispanic
6,226(38.1%)
7,910(48.4%)
1,153 (7.1%) 1,043 (6.4%)

ACA Implementation—Monitoring and Tracking 8
Table 3. State-Level Estimates of Coverage Gains among Nonelderly People, 2010–15
in 2015, resulting in more than 3.8 million people gaining coverage (53.4 percent reduction in uninsured). Kentucky is also notable for its careful implementation of the ACA’s provisions; the state reduced its uninsured rate by 57.1 percent (382,000 people gaining coverage). Oregon, Washington, and West Virginia, all of which expanded Medicaid under the ACA, cut their uninsured numbers by more than half. A number of states that did not expand Medicaid under the ACA—such as Alabama, Georgia, Mississippi, Missouri, Oklahoma, Tennessee,
and Wyoming—still experienced reductions in the number of uninsured residents ranging from 24.2 to 27.4 percent. South Dakota also did not expand Medicaid under the ACA, and its number of uninsured residents declined by only around 7 percent. Because the District of Columbia, Hawaii, and Vermont already had relatively low uninsured rates in 2010, their lower-than-average percentage-point reductions in uninsured rates from 2010 to 2015 resulted in higher-than-average percentage reductions in uninsured rates.
State 2015 population
2015 uninsured rate
2010 uninsured rate
2010 adjusted uninsured rate
Adjusted gain in coverage
Percentage change in uninsured
National total 273,704,000 11.2% 18.0% 18.2% 19,150,000 -38.4%
Expansion states
Alaska 667,000 16.0% 19.2% 20.1% 28,000 -20.5%
Arizona 5,711,000 13.6% 20.2% 20.5% 391,000 -33.4%
Arkansas 2,503,000 11.6% 20.8% 20.9% 232,000 -44.4%
California 33,952,000 9.9% 20.9% 21.2% 3,849,000 -53.4%
Colorado 4,746,000 9.3% 17.7% 17.9% 407,000 -48.0%
Connecticut 3,025,000 7.0% 10.4% 10.9% 116,000 -35.3%
Delaware 786,000 7.2% 12.1% 12.0% 38,000 -40.1%
District of Columbia 598,000 4.2% 8.4% 8.1% 24,000 -48.5%
Hawaii 1,195,000 4.5% 8.6% 8.6% 48,000 -47.1%
Illinois 11,030,000 8.3% 16.0% 16.2% 874,000 -48.8%
Indiana 5,654,000 11.9% 17.5% 17.5% 316,000 -32.0%
Iowa 2,622,000 6.0% 11.1% 11.2% 138,000 -47.0%
Kentucky 3,751,000 7.6% 18.1% 17.8% 382,000 -57.1%
Maryland 5,162,000 7.9% 13.0% 13.2% 277,000 -40.6%
Massachusetts 5,752,000 3.4% 5.1% 5.2% 106,000 -35.6%
Michigan 8,348,000 7.4% 14.6% 14.6% 603,000 -49.3%
Minnesota 4,687,000 5.3% 10.3% 10.5% 241,000 -49.1%
Nevada 2,467,000 14.3% 25.5% 25.8% 285,000 -44.7%
New Hampshire 1,112,000 8.2% 12.9% 13.0% 54,000 -37.2%
New Jersey 7,616,000 10.3% 15.2% 15.7% 409,000 -34.2%
New Mexico 1,754,000 13.1% 23.1% 23.4% 182,000 -44.2%
New York 16,830,000 8.3% 13.8% 14.0% 968,000 -41.0%
North Dakota 649,000 9.5% 11.8% 12.2% 18,000 -22.5%
Ohio 9,773,000 8.0% 14.4% 14.4% 630,000 -44.7%

ACA Implementation—Monitoring and Tracking 9
Source: Urban Institute analysis of American Community Survey data (IPUMS-USA, University of Minnesota, www.ipums.org) for 2010 and 2015.Notes: The adjusted uninsured rate adjusts the 2010 uninsured rate to reflect the demographic and geographic composition of the 2015 population. The adjusted gain in coverage is calculated as the 2015 population multiplied by the difference between the 2015 uninsured rate and the 2010 adjusted uninsured rate; it measures the difference between the number of uninsured in 2015 and the estimated number who would have been uninsured in 2015 if coverage rates for each demographic group had remained at their 2010 levels. States classified as expansion states are those that had expanded Medicaid by December 31, 2015, including Alaska. Louisiana and Montana did not expand Medicaid until 2016.
State 2015 population
2015 uninsured rate
2010 uninsured rate
2010 adjusted uninsured rate
Adjusted gain in coverage
Percentage change in uninsured
National total 273,704,000 11.2% 18.0% 18.2% 19,150,000 -38.4%
Expansion states
Oregon 3,368,000 8.5% 20.0% 19.9% 387,000 -57.6%
Pennsylvania 10,619,000 8.0% 12.4% 12.5% 481,000 -36.2%
Rhode Island 887,000 6.1% 14.0% 14.6% 75,000 -58.2%
Vermont 517,000 5.0% 9.2% 9.1% 21,000 -44.6%
Washington 6,137,000 7.6% 16.1% 16.3% 531,000 -53.2%
West Virginia 1,508,000 7.3% 17.7% 17.6% 155,000 -58.6%
Expansion total 163,426,000 8.7% 16.1% 16.3% 12,266,000 -45.2%
Non-expansion states
Alabama 4,094,000 12.7% 17.4% 17.3% 188,000 -26.5%
Florida 16,329,000 16.8% 26.0% 26.3% 1,539,000 -35.9%
Georgia 8,920,000 16.4% 22.6% 22.7% 554,000 -27.4%
Idaho 1,414,000 13.6% 20.7% 21.0% 104,000 -35.1%
Kansas 2,486,000 11.1% 16.0% 16.4% 132,000 -32.4%
Louisiana 4,017,000 14.9% 21.0% 20.9% 243,000 -28.9%
Maine 1,077,000 10.6% 12.6% 12.6% 22,000 -15.9%
Mississippi 2,551,000 15.6% 21.4% 21.4% 147,000 -27.0%
Missouri 5,132,000 11.7% 15.7% 15.7% 202,000 -25.2%
Montana 854,000 14.2% 19.8% 20.4% 54,000 -30.7%
Nebraska 1,616,000 9.2% 13.5% 13.6% 72,000 -32.4%
North Carolina 8,528,000 13.3% 19.3% 19.2% 509,000 -31.0%
Oklahoma 3,336,000 17.0% 22.4% 22.5% 181,000 -24.2%
South Carolina 4,102,000 13.2% 20.4% 20.4% 293,000 -35.1%
South Dakota 724,000 13.7% 14.0% 14.7% 7,000 -6.8%
Tennessee 5,587,000 12.4% 16.9% 16.9% 251,000 -26.7%
Texas 24,249,000 19.6% 26.7% 26.8% 1,749,000 -26.9%
Utah 2,688,000 12.0% 17.1% 17.2% 140,000 -30.2%
Virginia 7,198,000 10.9% 14.4% 14.5% 263,000 -25.1%
Wisconsin 4,871,000 7.1% 11.4% 11.4% 212,000 -38.2%
Wyoming 503,000 12.2% 16.5% 16.8% 23,000 -27.4%
Non-expansion states total
110,276,000 14.9% 21.1% 21.2% 6,885,000 -29.3%
ACA Implementation—Monitoring and Tracking 10
Table 4 shows changes in coverage all for nonelderly people by state and age group. All age groups broadly participated in the coverage gains across states (figures are not shown for groups in which estimates are not precise or if fewer than 5,000 people gained coverage). In some states, such as Alabama, Mississippi, and South Carolina, the number of uninsured children fell by more than 50 percent. Uninsured rates also fell markedly among adults ages 19 to 34 and ages 35 to 54 across states. Non-expansion states such as Texas, South Dakota, and Maine exhibit lower percentage changes in uninsured rates among these adults.
For adults ages 55 to 64, many of whom are approaching retirement, uninsured rates fell more than 40 percent in states including Arkansas, Iowa, Nevada, Ohio, and Wisconsin. In Kentucky, the number of uninsured people ages 55 to 64 fell 60.4 percent, resulting in 43,000 people gaining coverage.
Changes in coverage for nonelderly adults by state and age/gender groups are shown in the Appendix. While nationally and in most states, more men gained coverage than women in the 19 to 44 age group (i.e., women of reproductive age), four states (Kentucky, Oregon, Rhode Island, and West Virginia) experienced declines of over 60 percent in uninsured rates among women of reproductive age.
Figure 4. Gains in Nonelderly People with Health Insurance Coverage and Percentage Reduction in Uninsured Rates, by State (number in 1,000s)
AK28
0-30%reduction
30-40%reduction
40-50%reduction
>50%reduction
ND18
WA531
OR387
CA3,849
ID104
NV285
UT140
AZ391
MT54
MI603
MN241
IL874
WI212
WY23
SD7
NE72
KS132
OK181
MO202
AR232
LA243
KY382
TN251
MS147
WV155
NC509
AL188
VA263
OH630
PA481
SC293
GA554
FL1,539
NJ409
NY968
MD277
CT116
RI75
MA106
VT21
NH54
ME22
DE38
DC24
TX1,749
IA138
IN316
CO407
NM182
HI48
Source: Urban Institute analysis of American Community Survey data (IPUMS-USA, University of Minnesota, www.ipums.org) for 2010 and 2015.Notes: This map show the adjusted gain in coverage, a number calculated as the 2015 population multiplied by the difference between the 2015 uninsured rate and the 2010 adjusted uninsured rate; it measures the difference between the number of uninsured in 2015 and the estimated number who would have been uninsured in 2015 if coverage rates for each demographic group had remained at their 2010 levels.

ACA Implementation—Monitoring and Tracking 11
Table 4. State-Level Estimates of Coverage Gains among Nonelderly People, by Age Group, 2010–15
Ages 0–18 Ages 19–34 Ages 35–54 Ages 55–64
StateAdjusted gain in
coverage
Percentage change in uninsured
Adjusted gain in
coverage
Percentage change in uninsured
Adjusted gain in
coverage
Percentage change in uninsured
Adjusted gain in
coverage
Percentage change in uninsured
Total nonelderly 2,819,000 -41.4% 8,672,000 -41.5% 5,592,000 -33.3% 2,067,000 -38.3%
Alabama 44,000 -55.8% 88,000 -28.3% 47,000 -19.0% 9,000 -12.7%
Alaska < 5,000 — 15,000 -26.1% 7,000 -19.0% < 5,000 —
Arizona 75,000 -32.0% 161,000 -36.0% 115,000 -30.8% 39,000 -34.1%
Arkansas 17,000 -30.6% 98,000 -44.2% 87,000 -47.3% 29,000 -48.8%
California 593,000 -63.1% 1,594,000 -53.7% 1,179,000 -47.9% 483,000 -58.3%
Colorado 79,000 -57.3% 195,000 -52.6% 91,000 -35.6% 43,000 -50.1%
Connecticut < 5,000 — 68,000 -45.6% 39,000 -33.5% 12,000 -32.7%
Delaware N.P. — 17,000 -41.5% 10,000 -31.9% N.P. —
Florida 287,000 -47.5% 594,000 -36.6% 483,000 -31.3% 176,000 -33.8%
Georgia 87,000 -30.2% 252,000 -29.8% 169,000 -24.5% 47,000 -23.4%
Hawaii N.P. — 17,000 -41.3% 18,000 -53.7% N.P. —
Idaho 23,000 -45.5% 43,000 -36.5% 24,000 -26.4% 13,000 -38.0%
Illinois 77,000 -47.3% 411,000 -52.4% 272,000 -43.3% 114,000 -53.0%
Indiana 31,000 -20.3% 173,000 -41.2% 82,000 -26.4% 28,000 -28.8%
Iowa 9,000 -24.1% 75,000 -54.6% 41,000 -45.9% 13,000 -42.9%
Kansas 19,000 -31.8% 67,000 -37.4% 34,000 -26.3% 12,000 -30.6%
Kentucky 23,000 -32.7% 177,000 -60.7% 139,000 -59.1% 43,000 -60.4%
Louisiana 36,000 -44.3% 111,000 -30.3% 74,000 -24.7% 23,000 -23.8%
Maine N.P. — 16,000 -28.2% 5,000 -11.2% 6,000 -30.8%
Maryland 19,000 -23.7% 140,000 -46.1% 94,000 -40.6% 24,000 -35.6%
Massachusetts 5,000 -22.8% 54,000 -38.0% 37,000 -35.7% 10,000 -33.4%
Michigan 29,000 -26.1% 304,000 -54.0% 209,000 -50.2% 61,000 -45.7%
Minnesota 47,000 -51.3% 113,000 -53.2% 62,000 -43.1% 19,000 -44.3%
Mississippi 36,000 -50.7% 70,000 -30.0% 30,000 -16.3% 10,000 -18.8%
Missouri 7,000 -7.3% 106,000 -30.5% 64,000 -24.8% 24,000 -24.9%
Montana 13,000 -40.7% 17,000 -27.5% 21,000 -36.4% < 5,000 —
Nebraska < 5,000 — 41,000 -40.4% 20,000 -28.9% 7,000 -31.6%
Nevada 74,000 -57.0% 114,000 -46.0% 69,000 -34.6% 27,000 -46.9%
New Hampshire N.P. — 26,000 -44.3% 15,000 -29.8% 8,000 -37.2%

ACA Implementation—Monitoring and Tracking 12
Source: Urban Institute analysis of American Community Survey data (IPUMS-USA, University of Minnesota, www.ipums.org) for 2010 and 2015.Notes: The adjusted gain in coverage measures the difference between the number of uninsured in 2015 and the estimated number who would have been uninsured in 2015 if coverage rates for each demographic group had remained at their 2010 levels. The District of Columbia and Vermont are omitted because of imprecise estimates across all categories. N.P. = estimate not precisely estimated (see Data and Methods); < 5,000 = fewer than 5,000 people gaining coverage.
Table 5 presents state-level estimates of changes in health insurance coverage from 2010 to 2015 by race/ethnicity and education categories. Nationally, as shown previously, 6.2 million of the 16.3 million gaining coverage were non-Hispanic white nonelderly adults who did not have college degrees. In Illinois, for example, 296,000 of such adults gained health insurance coverage from 2010 to 2015 (a 55.9 percent reduction in the uninsured rate). In Michigan, 355,000 people in this group gained coverage, along with 376,000 people in Ohio and 107,000 people in Wisconsin. Significant coverage gains among non-Hispanic white nonelderly adults with college degrees were also widespread across other states.
Among the 7.9 million Hispanic or nonwhite people with less than a college degree, coverage gains were widespread and generally comparable in terms of percentage reductions in the number of uninsured to the gains of non-Hispanic white people with less than a college degree. Minority populations in states like California, Florida, Illinois, New York, and Texas experienced particularly large reductions in the number of uninsured people, reflecting the states’ overall size and the geographic distribution of Hispanic and nonwhite populations. Although sample sizes were not large enough for reliable estimates in several states, nonwhite and Hispanic people with college degrees saw substantial changes in their uninsured rates, including 280,000 people in California, 129,000 in Florida, 97,000 in New York, and 97,000 in Texas.
Ages 0–18 Ages 19–34 Ages 35–54 Ages 55–64
StateAdjusted gain in
coverage
Percentage change in uninsured
Adjusted gain in
coverage
Percentage change in uninsured
Adjusted gain in
coverage
Percentage change in uninsured
Adjusted gain in
coverage
Percentage change in uninsured
New Jersey 53,000 -38.4% 188,000 -38.3% 104,000 -25.1% 64,000 -42.3%
New Mexico 33,000 -57.1% 78,000 -45.7% 53,000 -38.2% 18,000 -40.9%
New York 113,000 -49.2% 513,000 -46.7% 248,000 -31.1% 94,000 -40.0%
North Carolina 96,000 -44.7% 205,000 -30.9% 161,000 -27.3% 46,000 -26.9%
North Dakota N.P. — 15,000 -45.0% < 5,000 — N.P. —
Ohio 51,000 -29.1% 291,000 -49.5% 211,000 -44.6% 77,000 -44.6%
Oklahoma 30,000 -25.8% 92,000 -28.9% 46,000 -19.0% 14,000 -18.4%
Oregon 51,000 -60.7% 165,000 -58.5% 123,000 -54.7% 47,000 -59.1%
Pennsylvania 39,000 -24.6% 266,000 -44.7% 123,000 -28.5% 53,000 -36.4%
Rhode Island N.P. — 39,000 -62.8% 23,000 -57.1% N.P. —
South Carolina 68,000 -57.3% 115,000 -34.7% 82,000 -28.7% 27,000 -28.1%
South Dakota N.P. — 5,000 -11.6% < 5,000 — N.P. —
Tennessee 22,000 -24.1% 124,000 -31.3% 74,000 -21.5% 31,000 -28.3%
Texas 432,000 -36.5% 732,000 -28.0% 425,000 -20.1% 160,000 -27.0%
Utah 35,000 -31.9% 68,000 -36.5% 30,000 -22.5% 7,000 -20.6%
Virginia 38,000 -27.2% 143,000 -32.3% 59,000 -16.9% 23,000 -19.8%
Washington 66,000 -56.1% 265,000 -57.3% 153,000 -48.2% 48,000 -46.6%
West Virginia N.P. — 74,000 -64.2% 52,000 -54.1% 17,000 -55.8%
Wisconsin 28,000 -35.5% 99,000 -42.1% 59,000 -33.1% 27,000 -41.3%
Wyoming N.P. — 15,000 -39.2% 7,000 -27.1% N.P. —

ACA Implementation—Monitoring and Tracking 13
Table 5. State-Level Estimates of Coverage Gains among Nonelderly Adults, by Race/Ethnicity and Education, 2010–15
Non-Hispanic White, with Less Than a College
Degree
Non-Hispanic White, with a College Degree
or More
Nonwhite or Hispanic, with Less Than a College
Degree
Nonwhite or Hispanic, with a College Degree
or More
Adjusted gain in
coverage
Percentage change in uninsured
Adjusted gain in
coverage
Percentage change in uninsured
Adjusted gain in
coverage
Percentage change in uninsured
Adjusted gain in
coverage
Percentage change in uninsured
Total nonelderly 6,226,000 -39.1% 1,153,000 -44.6% 7,910,000 -35.5% 1,043,000 -44.2%
Alabama 56,000 -18.3% 9,000 -33.2% 73,000 -25.9% N.P. —
Alaska 9,000 -20.5% N.P. — 11,000 -20.3% N.P. —
Arizona 111,000 -37.7% 18,000 -37.1% 172,000 -30.8% 15,000 -42.0%
Arkansas 128,000 -47.2% N.P. — 74,000 -44.8% N.P. —
California 558,000 -52.8% 159,000 -54.2% 2,260,000 -51.0% 280,000 -57.8%
Colorado 154,000 -53.8% 34,000 -42.6% 131,000 -41.1% N.P. —
Connecticut 50,000 -50.2% 10,000 -39.7% 51,000 -32.6% N.P. —
Delaware 13,000 -37.0% N.P. — 13,000 -35.9% N.P. —
District of Columbia N.P. — N.P. — 11,000 -40.1% N.P. —
Florida 353,000 -29.6% 65,000 -32.6% 706,000 -35.1% 129,000 -45.1%
Georgia 143,000 -23.9% 24,000 -32.3% 258,000 -27.0% 44,000 -39.3%
Hawaii N.P. — N.P. — 26,000 -45.3% N.P. —
Idaho 56,000 -35.5% N.P. — 15,000 -22.5% N.P. —
Illinois 296,000 -55.9% 57,000 -51.3% 385,000 -43.6% 59,000 -56.2%
Indiana 195,000 -37.0% 20,000 -36.4% 63,000 -27.3% N.P. —
Iowa 85,000 -51.2% N.P. — 33,000 -47.7% N.P. —
Kansas 71,000 -39.1% 12,000 -45.2% 26,000 -20.5% N.P. —
Kentucky 279,000 -63.6% 17,000 -52.2% 57,000 -49.5% N.P. —
Louisiana 78,000 -25.4% 17,000 -48.3% 103,000 -26.2% 9,000 -35.4%
Maine 19,000 -20.0% N.P. — N.P. — N.P. —
Maryland 78,000 -50.2% 15,000 -52.0% 141,000 -38.7% 25,000 -43.7%
Massachusetts 40,000 -35.3% 11,000 -34.0% 47,000 -40.4% N.P. —
Michigan 355,000 -53.9% 48,000 -55.7% 154,000 -46.1% N.P. —
Minnesota 108,000 -51.7% 32,000 -70.1% 49,000 -36.6% N.P. —
Mississippi 38,000 -19.4% N.P. — 63,000 -25.6% N.P. —
Missouri 95,000 -21.8% 19,000 -40.5% 77,000 -37.2% N.P. —
Montana 28,000 -28.7% N.P. — 8,000 -25.8% N.P. —
Nebraska 38,000 -35.5% N.P. — 21,000 -31.7% N.P. —
Nevada 87,000 -52.6% 12,000 -43.3% 98,000 -34.2% N.P. —

ACA Implementation—Monitoring and Tracking 14
Non-Hispanic White, with Less Than a College
Degree
Non-Hispanic White, with a College Degree
or More
Nonwhite or Hispanic, with Less Than a College
Degree
Nonwhite or Hispanic, with a College Degree
or More
Adjusted gain in
coverage
Percentage change in uninsured
Adjusted gain in
coverage
Percentage change in uninsured
Adjusted gain in
coverage
Percentage change in uninsured
Adjusted gain in
coverage
Percentage change in uninsured
New Hampshire 33,000 -35.3% N.P. — N.P. — N.P. —
New Jersey 103,000 -40.2% 27,000 -38.7% 179,000 -29.0% 46,000 -41.8%
New Mexico 26,000 -38.7% N.P. — 113,000 -43.4% N.P. —
New York 234,000 -42.9% 78,000 -42.5% 447,000 -37.7% 97,000 -44.5%
North Carolina 160,000 -27.4% 33,000 -41.6% 202,000 -28.7% 18,000 -31.2%
North Dakota 15,000 -39.1% N.P. — N.P. — N.P. —
Ohio 376,000 -48.0% 52,000 -54.9% 137,000 -42.2% 14,000 -45.6%
Oklahoma 91,000 -29.6% 10,000 -31.8% 46,000 -16.6% N.P. —
Oregon 205,000 -62.8% 34,000 -58.1% 88,000 -48.1% N.P. —
Pennsylvania 242,000 -38.6% 50,000 -50.2% 132,000 -33.3% 17,000 -37.2%
Rhode Island 32,000 -63.3% N.P. — 29,000 -57.9% N.P. —
South Carolina 90,000 -29.1% 13,000 -31.9% 111,000 -32.7% N.P. —
South Dakota 8,000 -16.3% N.P. — < 5,000 — N.P. —
Tennessee 136,000 -28.5% 18,000 -37.4% 71,000 -23.7% N.P. —
Texas 307,000 -26.2% 67,000 -36.8% 846,000 -23.0% 97,000 -33.8%
Utah 63,000 -34.1% 10,000 -34.8% 30,000 -22.9% N.P. —
Vermont 16,000 -47.5% N.P. — N.P. — N.P. —
Virginia 76,000 -22.1% 8,000 -15.1% 117,000 -26.2% 23,000 -37.7%
Washington 244,000 -59.0% 43,000 -58.9% 161,000 -44.9% 17,000 -46.9%
West Virginia 119,000 -59.9% N.P. — 11,000 -46.8% N.P. —
Wisconsin 107,000 -40.5% 21,000 -53.6% 51,000 -31.7% N.P. —
Wyoming 15,000 -31.4% N.P. — N.P. — N.P. —
Source: Urban Institute analysis of American Community Survey data (IPUMS-USA, University of Minnesota, www.ipums.org) for 2010 and 2015.Notes: Adjusted gain in coverage measures the difference between the number of uninsured in 2015 and the estimated number who would have been uninsured in 2015 if coverage rates for each demographic group had remained at their 2010 levels. N.P. = estimate not precisely estimated (see Data and Methods); < 5,000 = fewer than 5,000 people gained coverage.
DISCUSSIONAnalyses comparing 2010 and 2015 data from the large nationally and state-representative American Community Survey show widespread gains in the number of people with health insurance coverage since the ACA was enacted in 2010. Men and women of all ages and across race, ethnicity, and education levels benefited from gains in coverage. States that expanded Medicaid coverage under the ACA, as the law had originally intended, generally experienced larger gains in coverage. But coverage also increased substantially in states that opted out of the Medicaid expansion. Nearly 12.3 million
people gained coverage in expansion states (45 percent fewer uninsured) compared with 6.9 million people in non-expansion states (29 percent fewer uninsured).
Our estimate of 19.2 million people gaining coverage from 2010 to 2015 accounts for changes in the size and demographic composition of the population over the period. This analysis does not adjust for improved economic and labor market conditions since 2010 that likely contributed somewhat to the coverage gains. Prior analyses using data through early 2015

ACA Implementation—Monitoring and Tracking 15
that did account for improved economic conditions concluded that 18.1 million people had gained coverage as a result of the ACA (Blumberg, Garrett, and Holahan 2016). More recent estimates that include 2016 data and account for the economic recovery indicate that 20 million Americans gained coverage because of the ACA (Avery, Finegold, and Whitman 2016).
Although policy analysts have identified various next steps that policymakers could take to build on the ACA, improve the law, and address some concerns of its critics (e.g., Blumberg and Holahan 2015; Jost and Pollack 2015), Congress is now considering options for repealing the ACA.2 Partial repeal of
the ACA under reconciliation, without new ACA replacement legislation, would increase the number of uninsured Americans by an estimated 29.8 million people (Blumberg, Buettgens, and Holahan 2016). Partial repeal would leave more Americans uninsured than before the ACA by majorly disrupting the individual (nongroup) health insurance market. The likely result of such a scenario, and other scenarios that do not maintain the coverage gains since 2010, would be reduced access to health care, increased exposure of families to financial risks associated with injury and illness, and increased uncompensated care for hospitals and other health care providers.
DATA AND METHODSThe American Community Survey (ACS), a data source on more than 2 million Americans each year since 2005, allows estimation of population sizes and insurance coverage rates by an array of demographic characteristics that are representative at the national and state levels. Using ACS data for the nonelderly (under age 65) population for years 2010 and 2015 from the Integrated Public Use Microdata Series (IPUMS) (Ruggles et al. 2015), we compute uninsured rates for the nation, individual states, and demographic subgroups. The 2015 ACS data, released in September of 2016, are the most recent ACS data available. Although other survey data can be used to assess coverage estimates through 2016 (Uberoi, Finegold, and Gee 2016), the ACS is best suited for this analysis among publicly available data sets in having adequate sample sizes to support detailed cuts of uninsured rates by state and demographic characteristics.
Insurance status is measured on the ACS as an individual’s point-in-time coverage at the time of the survey using a single question asking about multiple coverage types. Estimates represent an annual average over the 12 months of the year in which the data were collected. In order to assess changes under the ACA using the most recently available ACS data, these analyses rely upon the IPUMS health insurance status indicator and do not incorporate coverage edits developed by the Urban Institute’s Health Policy Center to target likely misclassified reported Medicaid and nongroup coverage for either the 2010 or 2015 data (see Kenney et al. 2016a for more details on the coverage edits). As a result, estimates presented here may differ from those in previously published analyses or forthcoming analyses that will incorporate coverage edits and other data adjustments.
In national-level tables, we report estimates of population sizes for 2015 and uninsured rates of 2015 and 2010 by demographic group and state. We define demographic groups based on age (0–18, 19–34, 35–54, and 55–64), sex, race/ethnicity (non-Hispanic white, non-Hispanic black, Hispanic, and non-Hispanic
other), and education level (less than college degree, college degree or more).
We also report estimates of how the number of people with insurance coverage changed from 2010 to 2015 population size and composition in 2015. To compute these estimates, we compare the number of uninsured in 2015 to an estimate of how many uninsured people there would have been in 2015 if uninsured rates had remained at their 2010 level for each demographic group and state. This requires that, for each demographic group, we estimate a “counterfactual” 2010 uninsured rate that is adjusted to reflect the demographic composition of 2015.
Using population weights provided in the ACS data, we compute the weighted average 2010 uninsured rate for each demographic cell defined by crossing all combinations of age group, gender, race/ethnicity category, education group, and state. We match the 2010 uninsured rate, by cell, to the corresponding cell in 2015 for which we have computed the 2015 weighted population and totals and 2015 uninsured rates.3 With the population-weighted cell-level data for 2015 and 2010, we are able to produce national-level and state-level tabulations for demographic subgroups of interest.
The ACS is sufficiently large to allow statistically reliable estimates of changes in uninsured rates from 2010 to 2015 at the state level and estimates that are further divided by subgroup in most cases. But state-level estimates for some subgroups are measured imprecisely. For this reason, we do not report estimates in state-level tables by subgroup when the margin of error (two times the standard error) for the change in uninsured rates from 2010 to 2015 is more than 30 percent of the average uninsured rate over the two periods.4 For subgroups within states in which fewer than 5,000 people were estimated to have gained coverage from 2010 to 2015, we simply report “< 5,000” as a further measure to avoid reporting imprecise estimates.

ACA Implementation—Monitoring and Tracking 16
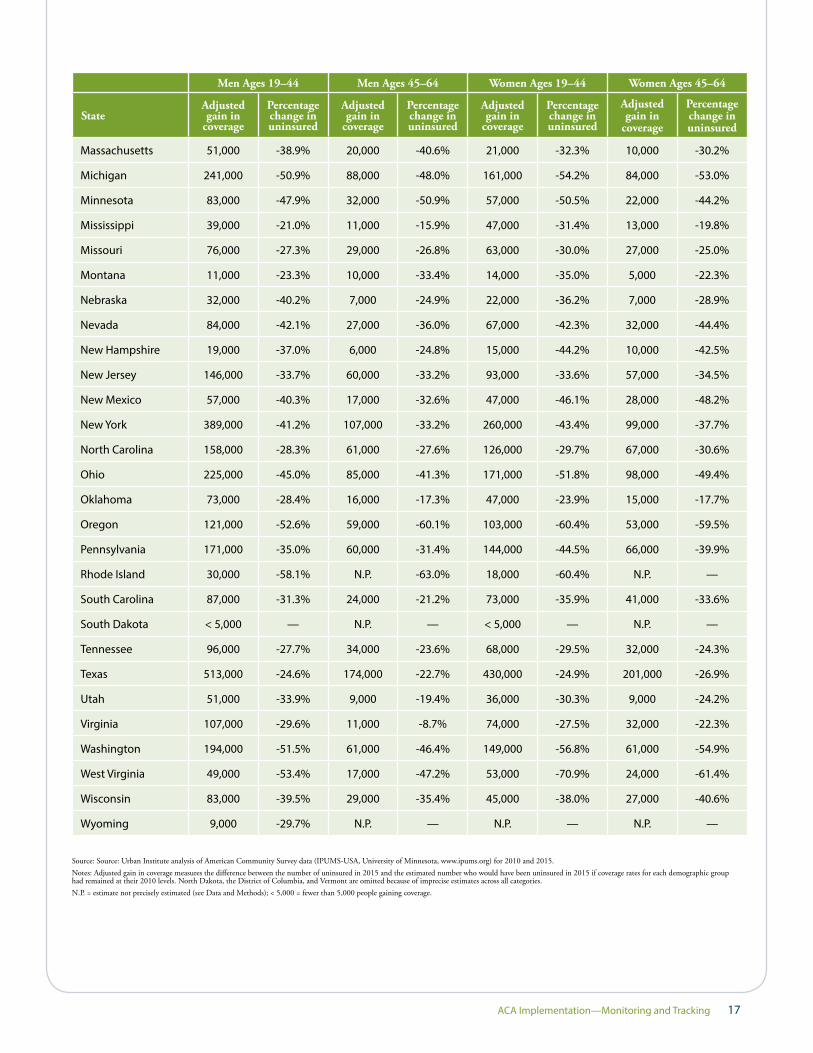
Appendix Table 1 shows state-level gains in coverage for nonelderly adults by gender and age group. Nationally, and in most states, more men gained coverage than women in the 19-to-44 age group. A likely reason for this is that prior Medicaid expansions covered some low-income families with children that may have disproportionately covered women in this age group. The ACA contributed to large reductions in the number of uninsured women and men ages 19 to 44. Two Southern states that expanded Medicaid under the ACA, Kentucky and
West Virginia, experienced the largest percentage declines in the number of women ages 19 to 34 who are uninsured. In Kentucky, 116,000 women of childbearing age gained coverage (a 66.3 percent decline in the number uninsured); in West Virginia, 53,000 women gained coverage (a 70.9 percent decline in the number uninsured). Both men and women ages 45 to 64 age group experienced reductions in uninsured rates that were widespread across states.
APPENDIX
Appendix Table 1: State-Level Estimates of Coverage Gains among Nonelderly Adults, by Gender and Age Group, 2010–15
Men Ages 19–44 Men Ages 45–64 Women Ages 19–44 Women Ages 45–64
StateAdjusted gain in
coverage
Percentage change in uninsured
Adjusted gain in
coverage
Percentage change in uninsured
Adjusted gain in
coverage
Percentage change in uninsured
Adjusted gain in
coverage
Percentage change in uninsured
Total nonelderly 6,487,000 -37.3% 2,373,000 -34.8% 4,978,000 -39.7% 2,493,000 -39.2%
Alabama 53,000 -21.4% 14,000 -15.3% 54,000 -27.8% 23,000 -24.4%
Alaska 13,000 -26.6% < 5,000 — < 5,000 — 6,000 -28.6%
Arizona 122,000 -31.7% 42,000 -28.5% 104,000 -38.4% 48,000 -35.6%
Arkansas 74,000 -41.9% 34,000 -45.0% 71,000 -48.3% 35,000 -53.3%
California 1,233,000 -49.4% 519,000 -50.7% 966,000 -54.1% 538,000 -56.4%
Colorado 137,000 -45.2% 45,000 -42.3% 100,000 -48.9% 47,000 -47.8%
Connecticut 61,000 -46.8% 15,000 -29.6% 25,000 -33.4% 17,000 -39.0%
Delaware 14,000 -37.0% N.P. — N.P. — N.P. —
Florida 454,000 -32.8% 211,000 -32.1% 376,000 -36.6% 212,000 -34.5%
Georgia 180,000 -26.3% 74,000 -28.0% 150,000 -28.0% 64,000 -25.4%
Hawaii 17,000 -45.6% N.P. — N.P. — N.P. —
Idaho 29,000 -30.6% 14,000 -36.7% 26,000 -34.5% 12,000 -31.6%
Illinois 315,000 -47.0% 125,000 -48.6% 220,000 -49.7% 136,000 -52.9%
Indiana 121,000 -35.7% 36,000 -28.9% 92,000 -36.1% 35,000 -31.1%
Iowa 56,000 -50.7% 19,000 -47.2% 35,000 -48.4% 21,000 -55.1%
Kansas 55,000 -37.5% 9,000 -18.6% 36,000 -33.2% 13,000 -29.2%
Kentucky 138,000 -55.9% 46,000 -53.2% 116,000 -66.3% 59,000 -65.9%
Louisiana 69,000 -23.7% 29,000 -24.5% 71,000 -30.6% 38,000 -32.3%
Maine 14,000 -28.7% 5,000 -20.1% < 5,000 — < 5,000 —
Maryland 107,000 -41.7% 41,000 -42.8% 76,000 -44.5% 35,000 -42.6%
ACA Implementation—Monitoring and Tracking 17
Men Ages 19–44 Men Ages 45–64 Women Ages 19–44 Women Ages 45–64
StateAdjusted gain in
coverage
Percentage change in uninsured
Adjusted gain in
coverage
Percentage change in uninsured
Adjusted gain in
coverage
Percentage change in uninsured
Adjusted gain in
coverage
Percentage change in uninsured
Massachusetts 51,000 -38.9% 20,000 -40.6% 21,000 -32.3% 10,000 -30.2%
Michigan 241,000 -50.9% 88,000 -48.0% 161,000 -54.2% 84,000 -53.0%
Minnesota 83,000 -47.9% 32,000 -50.9% 57,000 -50.5% 22,000 -44.2%
Mississippi 39,000 -21.0% 11,000 -15.9% 47,000 -31.4% 13,000 -19.8%
Missouri 76,000 -27.3% 29,000 -26.8% 63,000 -30.0% 27,000 -25.0%
Montana 11,000 -23.3% 10,000 -33.4% 14,000 -35.0% 5,000 -22.3%
Nebraska 32,000 -40.2% 7,000 -24.9% 22,000 -36.2% 7,000 -28.9%
Nevada 84,000 -42.1% 27,000 -36.0% 67,000 -42.3% 32,000 -44.4%
New Hampshire 19,000 -37.0% 6,000 -24.8% 15,000 -44.2% 10,000 -42.5%
New Jersey 146,000 -33.7% 60,000 -33.2% 93,000 -33.6% 57,000 -34.5%
New Mexico 57,000 -40.3% 17,000 -32.6% 47,000 -46.1% 28,000 -48.2%
New York 389,000 -41.2% 107,000 -33.2% 260,000 -43.4% 99,000 -37.7%
North Carolina 158,000 -28.3% 61,000 -27.6% 126,000 -29.7% 67,000 -30.6%
Ohio 225,000 -45.0% 85,000 -41.3% 171,000 -51.8% 98,000 -49.4%
Oklahoma 73,000 -28.4% 16,000 -17.3% 47,000 -23.9% 15,000 -17.7%
Oregon 121,000 -52.6% 59,000 -60.1% 103,000 -60.4% 53,000 -59.5%
Pennsylvania 171,000 -35.0% 60,000 -31.4% 144,000 -44.5% 66,000 -39.9%
Rhode Island 30,000 -58.1% N.P. -63.0% 18,000 -60.4% N.P. —
South Carolina 87,000 -31.3% 24,000 -21.2% 73,000 -35.9% 41,000 -33.6%
South Dakota < 5,000 — N.P. — < 5,000 — N.P. —
Tennessee 96,000 -27.7% 34,000 -23.6% 68,000 -29.5% 32,000 -24.3%
Texas 513,000 -24.6% 174,000 -22.7% 430,000 -24.9% 201,000 -26.9%
Utah 51,000 -33.9% 9,000 -19.4% 36,000 -30.3% 9,000 -24.2%
Virginia 107,000 -29.6% 11,000 -8.7% 74,000 -27.5% 32,000 -22.3%
Washington 194,000 -51.5% 61,000 -46.4% 149,000 -56.8% 61,000 -54.9%
West Virginia 49,000 -53.4% 17,000 -47.2% 53,000 -70.9% 24,000 -61.4%
Wisconsin 83,000 -39.5% 29,000 -35.4% 45,000 -38.0% 27,000 -40.6%
Wyoming 9,000 -29.7% N.P. — N.P. — N.P. —
Source: Source: Urban Institute analysis of American Community Survey data (IPUMS-USA, University of Minnesota, www.ipums.org) for 2010 and 2015.Notes: Adjusted gain in coverage measures the difference between the number of uninsured in 2015 and the estimated number who would have been uninsured in 2015 if coverage rates for each demographic group had remained at their 2010 levels. North Dakota, the District of Columbia, and Vermont are omitted because of imprecise estimates across all categories. N.P. = estimate not precisely estimated (see Data and Methods); < 5,000 = fewer than 5,000 people gaining coverage.

ACA Implementation—Monitoring and Tracking 18
Avery, Kelsey, Kenneth Finegold, and Amelia Whitman. Affordable Care Act has led to Historic, Widespread Increase in Health Insurance Coverage. Department of Health and Human Services: Offices of the Assistant Secretary for Planning and Evaluation, 2016.
Blavin, Fred. “Association Between the 2014 Medicaid Expansions and US Hospital Finances.” JAMA 316, no. 14 (2016): 1475-1483.
Blumberg, Linda J., and John Holahan. After King v. Burwell: Next Steps for the Affordable Care Act. The Urban Institute, 2015.
Blumberg, Linda J., Bowen Garrett, and John Holahan. “Estimating the Counterfactual: How Many Adults Would there be Today Without the ACA.” Inquiry 53 (2016): 1-13.
Blumberg, Linda J., Matthew Buettgens, and John Holahan. Implications of Partial Repeal of the ACA through Reconciliation. The Urban Institute, 2016.
Dubay, Lisa and Genevieve M. Kenney. “Expanding Public Health Insurance to Parents: Effects on Children’s Coverage under Medicaid.” Health Services Research 38, no. 5 (2003): 1283-1302.
Furman, Jason, and Fiedler Matt. The Economic Record of the Obama Administration: Reforming the Health Care System. Council of Economic Advisors, 2016.
Hu, Luojia, Robert Kaestner, Bhashkar Mazumder, Sarah Miller, and Ashley Wong. “The Effect of the Patient Protection and Affordable Care Act Medicaid Expansions on Financial Well-Being.” NBER Working Paper No. 22170, 2016.
Jost, Timothy, Stoltzfus, and Harold Pollack. Key Proposals to Strengthen the Affordable Care Act. The Century Foundation, 2015.
Kenney, Genevieve, Jennifer Haley, Nathaniel Anderson, and Victoria Lynch. 2015. “Children Eligible for Medicaid and CHIP: Who Remains Uninsured, and Why?” Academic Pediatrics 15(3): S36-S43.
Kenney, Genevieve, Jennifer Haley, Clare Pan, Victoria Lynch, and Matthew Buettgens. 2016a. “A Look at Early ACA Implementation: State and National Medicaid Patterns for Adults in 2014.” Princeton, NJ: Robert Wood Johnson Foundation. http://www.urban.org/research/publication/look-early-aca-implementation-state-and-national-medicaid-patterns-adults-2014.
Kenney, Genevieve, Jennifer Haley, Clare Pan, Victoria Lynch, and Matthew Buettgens. 2016b. “Children’s Coverage Climb Continues: Uninsurance and Medicaid/CHIP Eligibility and Participation Under the ACA.” Princeton, NJ: Robert Wood Johnson Foundation. http://www.urban.org/research/publication/childrens-coverage-climb-continues-uninsurance-and-medicaid-chip-eligibility-and-participation-under-aca.
Kenney, Genevieve, Victoria Lynch, Michael Huntress, Jennifer Haley, and Nathaniel Anderson. 2012. “Medicaid/CHIP Participation Among Children and Parents.” Princeton, NJ: Robert Wood Johnson Foundation. http://www.rwjf.org/en/research-publications/find-rwjf-research/2012/12/medicaid-chip-participation-among-children-and-parents.html.
Kirby, James B., and Jessica P. Vistnes. “Access to Care Improved for People who Gained Medicaid or Marketplace Coverage in 2014.” Health Affairs, 2016.
McMorrow, Stacey, Sharon K. Long, Genevieve M. Kenney, and Nathaniel Anderson. “Uninsurance Disparities Have Narrowed for Black and Hispanic Adults under the Affordable Care ACt.” Health Affairs 34, no. 10 (2015): 1774-1778.
Ruggles, Steven, Katie Genadek, Ronald Goeken, Josiah Grover, and Matthew Sobek. Integrated Public Use Microdata Series: Version 6.0 [Machine-readable database]. Minneapolis: University of Minnesota, 2015.
Snyder, Thomas D., and Sally A. Dillow. Digest of Education Statistics 2013. National Center for Education Statistics, 2015.
Uberoi, Namrata, Kenneth Finegold, and Emily Gee. Health Insurance Coverage and the Affordable Care Act, 2010-2016. Department of Health and Human Services: Office of the Assistant Secretary for Planning and Evaluation, 2016.
Wherry, Laura R., and Sarah Miller. “Early coverage, Access, Utilization, and Health Effects Associated with the Affordable Care Act Medicaid Expansions: A Quasi-experimental Study.” Annals of Internal Medicine 164, no. 12 (June 2016): 795-803.
REFERENCES

ACA Implementation—Monitoring and Tracking 19
ENDNOTES1. See, for example, http://www.chcf.org/~/media/MEDIA%20LIBRARY%20Files/PDF/
PDF%20T/PDF%20TrackingACAImplementationCAv5Final.pdf.
2. See, for example, http://www.politico.com/tipsheets/politico-pulse/2016/11/how-to-end-obamacare-health-care-may-be-weak-in-the-lame-duck-session-how-the-industry-sees-the-election-217392. Potential replacement options to date would likely increase the number of uninsured relative to the ACA. See, for example, http://www.vox.com/2016/11/17/13626438/obamacare-replacement-plans-comparison.
3. Of 3,264 possible cells, 33 cells in the 2015 data did not exist in the 2010 data with a combined total weight of 0.003% of the 2010 US population. We imputed 2010 uninsured rates for these cells using a regression-based prediction including all demographic factors and state as predictors.
4. We estimate standard errors for the change in coverage for each subgroup by inflating the standard error computed using the usual formula for a change in proportion by an overall factor of 1.5 to account for the complex survey design of the ACS. Using the replicate weights provided by the ACS, we found the survey-design-corrected standard error for a change in uninsured rates was approximately 1.5 times a standard error estimate that ignored the survey design.
Copyright© December 2016. The Urban Institute. Permission is granted for reproduction of this file, with attribution to the Urban Institute.
About the Authors and AcknowledgementsBowen Garrett is an economist and senior fellow in the Health Policy Center at the Urban Institute; Anuj Gangopadhyaya is an economist and research associate in the Health Policy Center at the Urban Institute. The authors are grateful for research assistance from Marni Epstein and for comments and suggestions from Linda Blumberg, Stan Dorn, Jennifer Haley, John Holahan, Genevieve Kenney, Laura Skopec, and Stephen Zuckerman. The authors are particularly grateful to the Robert Wood Johnson Foundation for its generous support of this project.
About the Robert Wood Johnson FoundationFor more than 40 years the Robert Wood Johnson Foundation has worked to improve health and health care. We are working with others to build a national Culture of Health enabling everyone in America to live longer, healthier lives. For more information, visit www.rwjf.org. Follow the Foundation on Twitter at www.rwjf.org/twitter or on Facebook at www.rwjf.org/facebook.
About the Urban InstituteThe nonprofit Urban Institute is dedicated to elevating the debate on social and economic policy. For nearly five decades, Urban scholars have conducted research and offered evidence-based solutions that improve lives and strengthen communities across a rapidly urbanizing world. Their objective research helps expand opportunities for all, reduce hardship among the most vulnerable, and strengthen the effectiveness of the public sector. For more information, visit www.urban.org. Follow the Urban Institute on Twitter or Facebook. More information specific to the Urban Institute’s Health Policy Center, its staff, and its recent research can be found at www.healthpolicycenter.org.