Embed Size (px)
Citation preview
Whitney Museum of American Art Financial Statements June 30, 2018 and 2017
Whitney Museum of American Art Index June 30, 2018 and 2017
Page(s)
Report of Independent Auditors .......................................................................................................... 1–2
Financial Statements
Statements of Financial Position .................................................................................................................. 3
Statements of Activities ............................................................................................................................ 4–5
Statements of Cash Flows ........................................................................................................................... 6
Notes to Financial Statements ............................................................................................................... 7–27
Report of Independent Auditors
To the Board of Trustees of the
Whitney Museum of American Art
We have audited the accompanying financial statements of Whitney Museum of American Art
(the “Company”), which comprise the statements of financial position as of June 30, 2018 and 2017, and
the related statements of activities and of cash flows for the years then ended.
Management’s Responsibility for the Financial Statements
Management is responsible for the preparation and fair presentation of the financial statements in
accordance with accounting principles generally accepted in the United States of America; this includes
the design, implementation, and maintenance of internal control relevant to the preparation and fair
presentation of financial statements that are free from material misstatement, whether due to fraud or
error.
Auditors’ Responsibility
Our responsibility is to express an opinion on the financial statements based on our audits. We conducted
our audits in accordance with auditing standards generally accepted in the United States of America.
Those standards require that we plan and perform the audit to obtain reasonable assurance about
whether the financial statements are free from material misstatement.
An audit involves performing procedures to obtain audit evidence about the amounts and disclosures in
the financial statements. The procedures selected depend on our judgment, including the assessment of
the risks of the material misstatement of the financial statements, whether due to fraud or error. In making
those risk assessments, we consider internal control relevant to the Company’s preparation and fair
presentation of the financial statements in order to design audit procedures that are appropriate in the
circumstances, but not for the purpose of expressing an opinion on the effectiveness of the Company’s
internal control. Accordingly, we express no such opinion. An audit also includes evaluating the
appropriateness of accounting policies used and the reasonableness of significant accounting estimates
made by management, as well as evaluating the overall presentation of the financial statements. We
believe that the audit evidence we have obtained is sufficient and appropriate to provide a basis for our
audit opinion.
PricewaterhouseCoopers LLP, PricewaterhouseCoopers Center, 300 Madison Avenue, New York, New York 10017 T: (646) 471 3000, F: (813) 286 6000, www.pwc.com/us
2
Opinion
In our opinion, the financial statements referred to above present fairly, in all material respects, the
financial position of Whitney Museum of American Art as of June 30, 2018 and 2017, and the results of its
statements of activities and its cash flows for the years then ended in accordance with accounting
principles generally accepted in the United States of America.
New York, New York
October 23, 2018
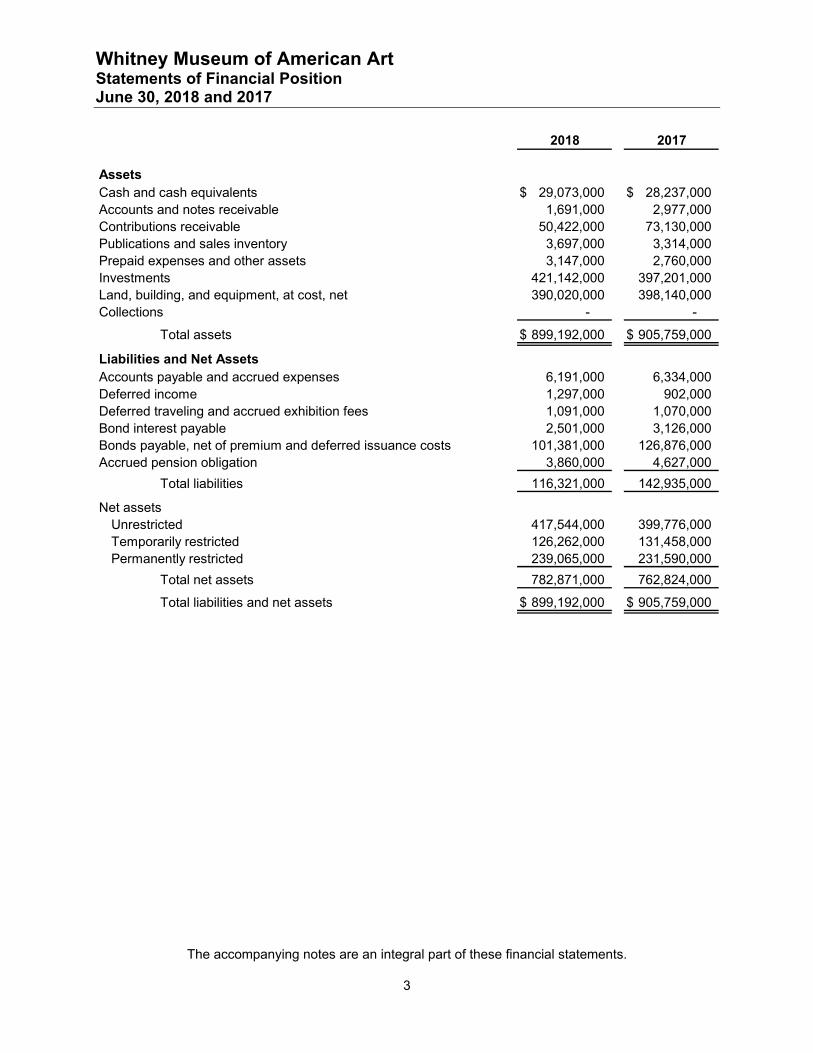
Whitney Museum of American Art Statements of Financial Position June 30, 2018 and 2017
The accompanying notes are an integral part of these financial statements.
3
2018 2017
AssetsCash and cash equivalents 29,073,000$ 28,237,000$ Accounts and notes receivable 1,691,000 2,977,000 Contributions receivable 50,422,000 73,130,000 Publications and sales inventory 3,697,000 3,314,000 Prepaid expenses and other assets 3,147,000 2,760,000 Investments 421,142,000 397,201,000 Land, building, and equipment, at cost, net 390,020,000 398,140,000 Collections - -
Total assets 899,192,000$ 905,759,000$
Liabilities and Net AssetsAccounts payable and accrued expenses 6,191,000 6,334,000 Deferred income 1,297,000 902,000 Deferred traveling and accrued exhibition fees 1,091,000 1,070,000 Bond interest payable 2,501,000 3,126,000 Bonds payable, net of premium and deferred issuance costs 101,381,000 126,876,000 Accrued pension obligation 3,860,000 4,627,000
Total liabilities 116,321,000 142,935,000
Net assetsUnrestricted 417,544,000 399,776,000 Temporarily restricted 126,262,000 131,458,000 Permanently restricted 239,065,000 231,590,000
Total net assets 782,871,000 762,824,000
Total liabilities and net assets 899,192,000$ 905,759,000$
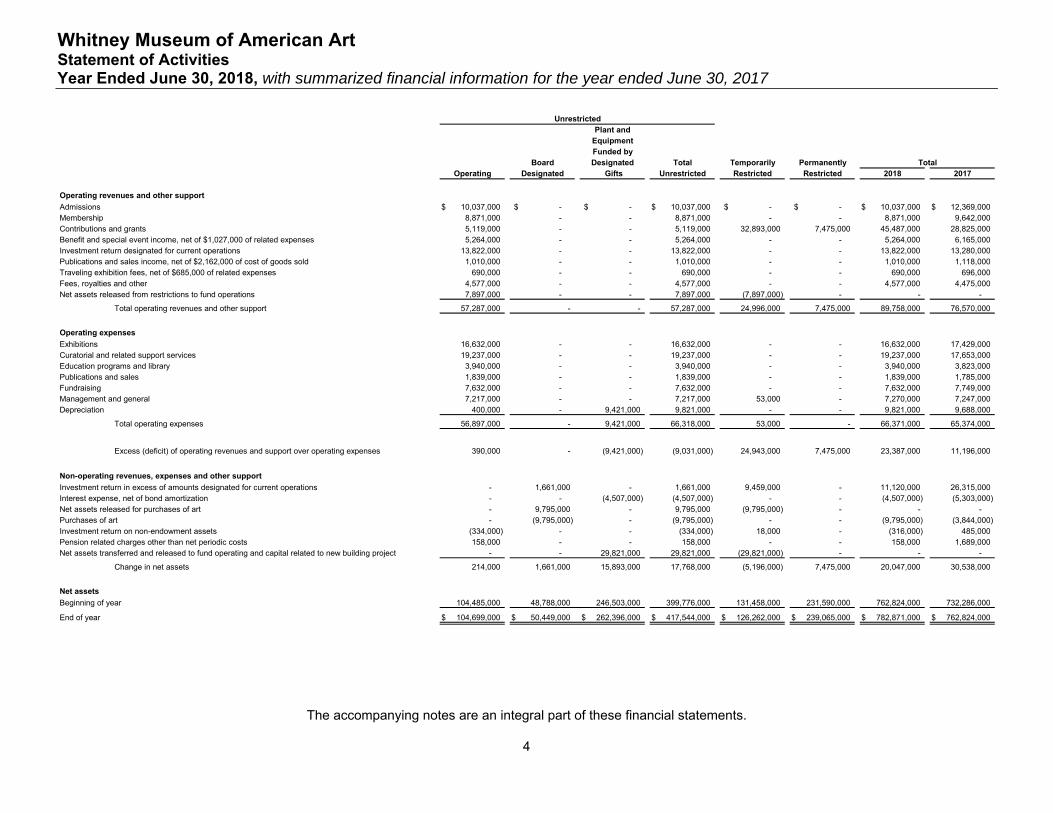
Whitney Museum of American Art Statement of Activities Year Ended June 30, 2018, with summarized financial information for the year ended June 30, 2017
The accompanying notes are an integral part of these financial statements.
4
Plant andEquipmentFunded by
Board Designated Total Temporarily PermanentlyOperating Designated Gifts Unrestricted Restricted Restricted 2018 2017
Operating revenues and other support
Admissions 10,037,000$ -$ -$ 10,037,000$ -$ -$ 10,037,000$ 12,369,000$ Membership 8,871,000 - - 8,871,000 - - 8,871,000 9,642,000 Contributions and grants 5,119,000 - - 5,119,000 32,893,000 7,475,000 45,487,000 28,825,000 Benefit and special event income, net of $1,027,000 of related expenses 5,264,000 - - 5,264,000 - - 5,264,000 6,165,000 Investment return designated for current operations 13,822,000 - - 13,822,000 - - 13,822,000 13,280,000 Publications and sales income, net of $2,162,000 of cost of goods sold 1,010,000 - - 1,010,000 - - 1,010,000 1,118,000 Traveling exhibition fees, net of $685,000 of related expenses 690,000 - - 690,000 - - 690,000 696,000 Fees, royalties and other 4,577,000 - - 4,577,000 - - 4,577,000 4,475,000 Net assets released from restrictions to fund operations 7,897,000 - - 7,897,000 (7,897,000) - - -
Total operating revenues and other support 57,287,000 - - 57,287,000 24,996,000 7,475,000 89,758,000 76,570,000
Operating expenses
Exhibitions 16,632,000 - - 16,632,000 - - 16,632,000 17,429,000 Curatorial and related support services 19,237,000 - - 19,237,000 - - 19,237,000 17,653,000 Education programs and library 3,940,000 - - 3,940,000 - - 3,940,000 3,823,000 Publications and sales 1,839,000 - - 1,839,000 - - 1,839,000 1,785,000 Fundraising 7,632,000 - - 7,632,000 - - 7,632,000 7,749,000 Management and general 7,217,000 - - 7,217,000 53,000 - 7,270,000 7,247,000 Depreciation 400,000 - 9,421,000 9,821,000 - - 9,821,000 9,688,000
Total operating expenses 56,897,000 - 9,421,000 66,318,000 53,000 - 66,371,000 65,374,000
Excess (deficit) of operating revenues and support over operating expenses 390,000 - (9,421,000) (9,031,000) 24,943,000 7,475,000 23,387,000 11,196,000
Non-operating revenues, expenses and other support
Investment return in excess of amounts designated for current operations - 1,661,000 - 1,661,000 9,459,000 - 11,120,000 26,315,000 Interest expense, net of bond amortization - - (4,507,000) (4,507,000) - - (4,507,000) (5,303,000) Net assets released for purchases of art - 9,795,000 - 9,795,000 (9,795,000) - - - Purchases of art - (9,795,000) - (9,795,000) - - (9,795,000) (3,844,000) Investment return on non-endowment assets (334,000) - - (334,000) 18,000 - (316,000) 485,000 Pension related charges other than net periodic costs 158,000 - - 158,000 - - 158,000 1,689,000 Net assets transferred and released to fund operating and capital related to new building project - - 29,821,000 29,821,000 (29,821,000) - - -
Change in net assets 214,000 1,661,000 15,893,000 17,768,000 (5,196,000) 7,475,000 20,047,000 30,538,000
Net assets
Beginning of year 104,485,000 48,788,000 246,503,000 399,776,000 131,458,000 231,590,000 762,824,000 732,286,000
End of year 104,699,000$ 50,449,000$ 262,396,000$ 417,544,000$ 126,262,000$ 239,065,000$ 782,871,000$ 762,824,000$
Unrestricted
Total
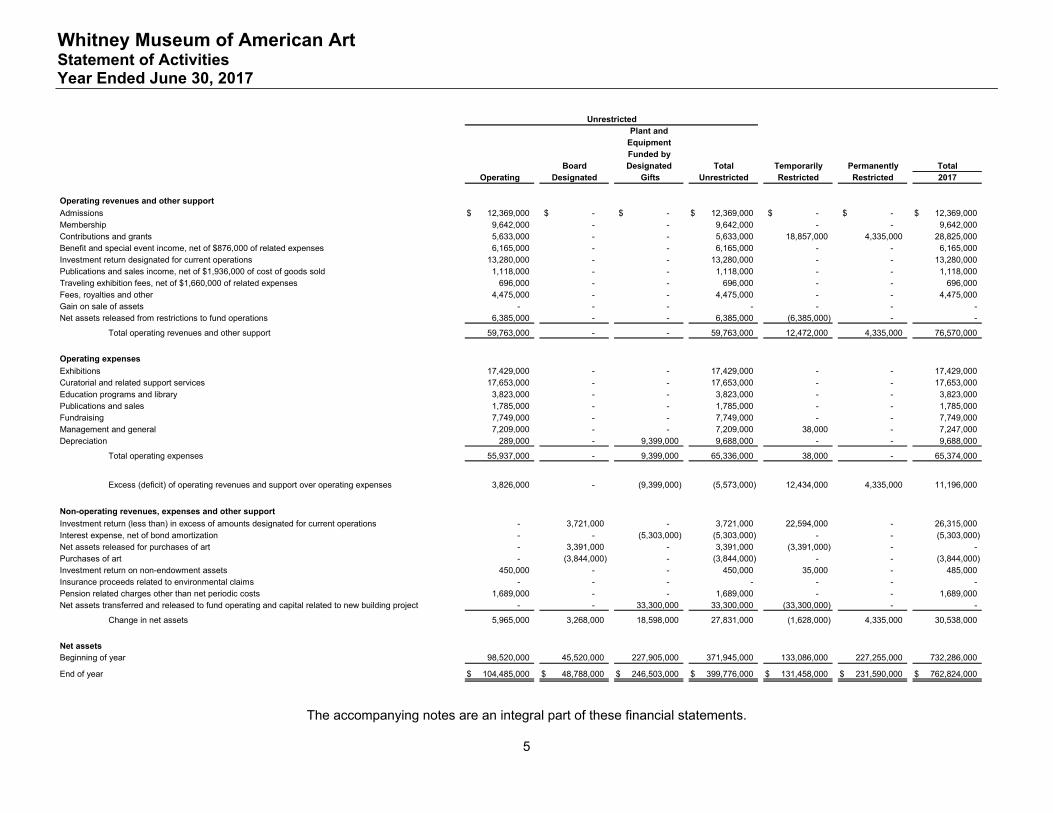
Whitney Museum of American Art Statement of Activities Year Ended June 30, 2017
The accompanying notes are an integral part of these financial statements.
5
Plant andEquipmentFunded by
Board Designated Total Temporarily Permanently TotalOperating Designated Gifts Unrestricted Restricted Restricted 2017
Operating revenues and other support
Admissions 12,369,000$ -$ -$ 12,369,000$ -$ -$ 12,369,000$ Membership 9,642,000 - - 9,642,000 - - 9,642,000Contributions and grants 5,633,000 - - 5,633,000 18,857,000 4,335,000 28,825,000Benefit and special event income, net of $876,000 of related expenses 6,165,000 - - 6,165,000 - - 6,165,000Investment return designated for current operations 13,280,000 - - 13,280,000 - - 13,280,000Publications and sales income, net of $1,936,000 of cost of goods sold 1,118,000 - - 1,118,000 - - 1,118,000Traveling exhibition fees, net of $1,660,000 of related expenses 696,000 - - 696,000 - - 696,000Fees, royalties and other 4,475,000 - - 4,475,000 - - 4,475,000Gain on sale of assets - - - - - - -Net assets released from restrictions to fund operations 6,385,000 - - 6,385,000 (6,385,000) - -
Total operating revenues and other support 59,763,000 - - 59,763,000 12,472,000 4,335,000 76,570,000
Operating expenses
Exhibitions 17,429,000 - - 17,429,000 - - 17,429,000Curatorial and related support services 17,653,000 - - 17,653,000 - - 17,653,000Education programs and library 3,823,000 - - 3,823,000 - - 3,823,000Publications and sales 1,785,000 - - 1,785,000 - - 1,785,000Fundraising 7,749,000 - - 7,749,000 - - 7,749,000Management and general 7,209,000 - - 7,209,000 38,000 - 7,247,000Depreciation 289,000 - 9,399,000 9,688,000 - - 9,688,000
Total operating expenses 55,937,000 - 9,399,000 65,336,000 38,000 - 65,374,000
Excess (deficit) of operating revenues and support over operating expenses 3,826,000 - (9,399,000) (5,573,000) 12,434,000 4,335,000 11,196,000
Non-operating revenues, expenses and other support
Investment return (less than) in excess of amounts designated for current operations - 3,721,000 - 3,721,000 22,594,000 - 26,315,000Interest expense, net of bond amortization - - (5,303,000) (5,303,000) - - (5,303,000)Net assets released for purchases of art - 3,391,000 - 3,391,000 (3,391,000) - -Purchases of art - (3,844,000) - (3,844,000) - - (3,844,000)Investment return on non-endowment assets 450,000 - - 450,000 35,000 - 485,000Insurance proceeds related to environmental claims - - - - - - -Pension related charges other than net periodic costs 1,689,000 - - 1,689,000 - - 1,689,000Net assets transferred and released to fund operating and capital related to new building project - - 33,300,000 33,300,000 (33,300,000) - -
Change in net assets 5,965,000 3,268,000 18,598,000 27,831,000 (1,628,000) 4,335,000 30,538,000
Net assetsBeginning of year 98,520,000 45,520,000 227,905,000 371,945,000 133,086,000 227,255,000 732,286,000
End of year 104,485,000$ 48,788,000$ 246,503,000$ 399,776,000$ 131,458,000$ 231,590,000$ 762,824,000$
Unrestricted
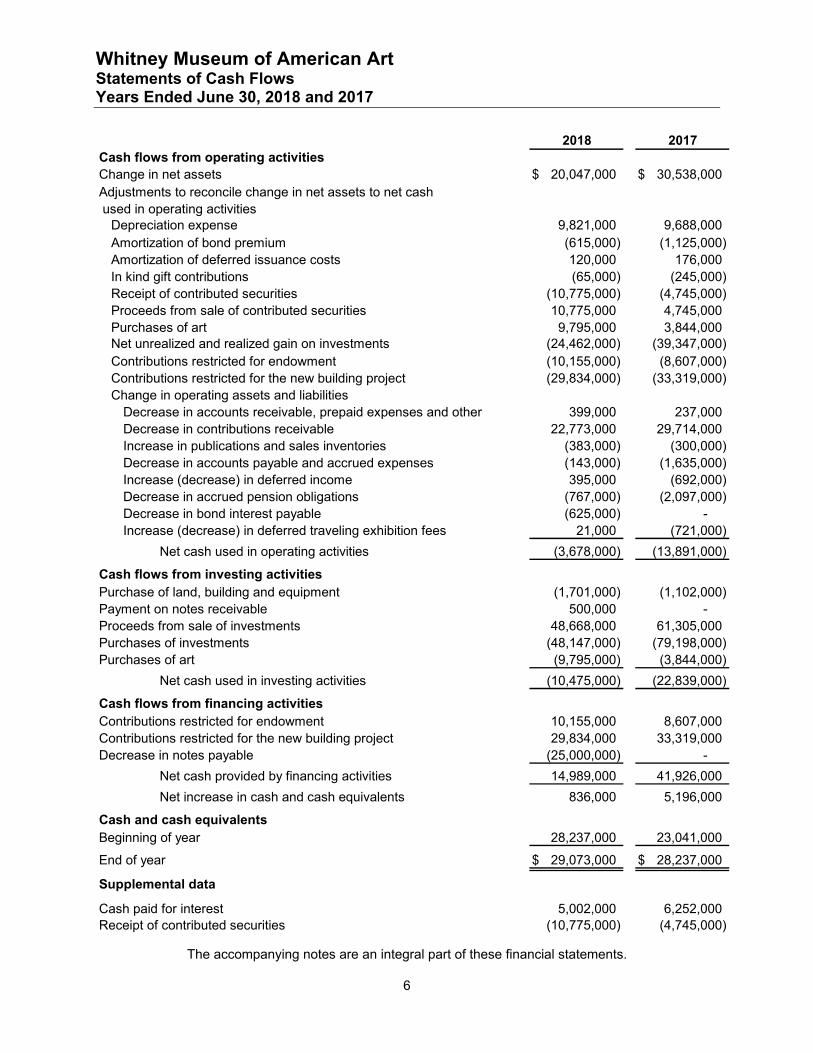
Whitney Museum of American Art Statements of Cash Flows Years Ended June 30, 2018 and 2017
The accompanying notes are an integral part of these financial statements.
6
2018 2017Cash flows from operating activitiesChange in net assets 20,047,000$ 30,538,000$ Adjustments to reconcile change in net assets to net cash used in operating activities
Depreciation expense 9,821,000 9,688,000 Amortization of bond premium (615,000) (1,125,000) Amortization of deferred issuance costs 120,000 176,000 In kind gift contributions (65,000) (245,000) Receipt of contributed securities (10,775,000) (4,745,000) Proceeds from sale of contributed securities 10,775,000 4,745,000 Purchases of art 9,795,000 3,844,000 Net unrealized and realized gain on investments (24,462,000) (39,347,000) Contributions restricted for endowment (10,155,000) (8,607,000) Contributions restricted for the new building project (29,834,000) (33,319,000) Change in operating assets and liabilities
Decrease in accounts receivable, prepaid expenses and other 399,000 237,000 Decrease in contributions receivable 22,773,000 29,714,000 Increase in publications and sales inventories (383,000) (300,000) Decrease in accounts payable and accrued expenses (143,000) (1,635,000) Increase (decrease) in deferred income 395,000 (692,000) Decrease in accrued pension obligations (767,000) (2,097,000) Decrease in bond interest payable (625,000) - Increase (decrease) in deferred traveling exhibition fees 21,000 (721,000)
Net cash used in operating activities (3,678,000) (13,891,000)
Cash flows from investing activitiesPurchase of land, building and equipment (1,701,000) (1,102,000) Payment on notes receivable 500,000 - Proceeds from sale of investments 48,668,000 61,305,000 Purchases of investments (48,147,000) (79,198,000) Purchases of art (9,795,000) (3,844,000)
Net cash used in investing activities (10,475,000) (22,839,000)
Cash flows from financing activitiesContributions restricted for endowment 10,155,000 8,607,000 Contributions restricted for the new building project 29,834,000 33,319,000 Decrease in notes payable (25,000,000) -
Net cash provided by financing activities 14,989,000 41,926,000
Net increase in cash and cash equivalents 836,000 5,196,000
Cash and cash equivalentsBeginning of year 28,237,000 23,041,000
End of year 29,073,000$ 28,237,000$
Supplemental data
Cash paid for interest 5,002,000 6,252,000Receipt of contributed securities (10,775,000) (4,745,000)
Whitney Museum of American Art Notes to Financial Statements June 30, 2018 and 2017
7
1. Summary of Significant Accounting Policies
Whitney Museum of American Art (the “Museum”) was founded in 1930 by Gertrude Vanderbilt Whitney and is dedicated to collecting, preserving, interpreting, and exhibiting American art. The Museum serves a wide variety of audiences from its New York City location.
The financial statements of the Museum have been prepared on the accrual basis of accounting in accordance with accounting principles generally accepted in the United States of America.
Net Asset Classifications The Museum reports information regarding its financial position and activities according to three classes of net assets: unrestricted, temporarily restricted and permanently restricted.
Unrestricted net assets are not restricted by donors, or the donor-imposed restrictions have expired. The Museum’s Board of Trustees has designated a portion of the unrestricted net assets for investment in land, building and equipment and long-term investment.
Temporarily restricted net assets contain donor-imposed restrictions that require the Museum to use or expend the assets as specified. The restrictions are satisfied either by the passage of time or by actions of the Museum.
Permanently restricted net assets contain donor-imposed restrictions that stipulate the resources be maintained permanently, but permit the Museum to use, or expend, part or all of the income derived from the donated assets for either specified or unspecified purposes.
Cash and Cash Equivalents Cash equivalents are short-term highly liquid investments with original maturities of three months or less when purchased. The Museum includes money market funds as cash equivalents, with the exception of those money market funds which are included as investments (Note 2).
Inventory Inventory consists of books, exhibition catalogues, posters, note cards and other merchandise valued at the lower of average cost or market. Inventory consisted of $2,896,000 and $2,606,000 of finished goods and $801,000 and $708,000 of work in process at June 30, 2018 and 2017, respectively.
Investments Equity securities are carried at market value based on the last reported sales price at the end of the fiscal year. Fixed income securities are valued by the external investment managers using quoted market prices.
Whitney Museum of American Art Notes to Financial Statements June 30, 2018 and 2017
8
Alternative investments include investments in limited partnerships, private equity and hedge funds. The Museum values these investments using the net asset value (“NAV”) provided by the investment managers of the underlying funds. As a general rule, investment managers of funds value investments based upon the best information available for given circumstances and may incorporate assumptions that are the investment manager’s best estimate after consideration of a variety of internal and external factors. The funds may make investments in securities that are publicly traded, which are generally valued based on observable market prices, unless a restriction exists. Investments for which observable market prices do not exist are reported at fair value as determined by the fund’s investment manager. The Museum’s management may consider other factors in assessing the fair value of these investments. Some of these funds may not have readily ascertainable market values and may be subject to withdrawal restrictions. The fair value of the funds represents the amount the Museum expects to receive at June 30, 2018 and 2017, if it had liquidated its investments in the funds on these dates. Because alternative investments may not be readily marketable, the estimated value is subject to uncertainty and, therefore, may differ from the value that would have been used had a ready market for the investment existed. Such differences could be material. Certain of the partnerships enter into contractual commitments including futures and option contracts and other derivative financial instruments. These contracts are valued by the partnerships at the last reported sales price and involve elements of market risk in excess of the amounts recognized on the partnership statement of financial condition. Risks arise from the potential changes in securities values and interest rates. The Museum records its share of the net income or loss for the accounting period in proportion to its participating percentage in each partnership.
Purchases and sales of securities are reflected on a trade-date basis. Realized gains and losses on sales of securities are determined on an average-cost basis. Dividend income is recorded on the ex-dividend date and interest income is recorded as earned on an accrual basis.
Unrealized gains and losses are determined by comparison of specific costs of acquisition to market values at the last day of the fiscal year.
A portion of the Museum’s investments are pooled to facilitate their management. Investment income is allocated among the individual components of unrestricted, temporarily restricted and permanently restricted net assets based on donor restrictions or the absence thereof, using percentage of participation based on their carrying value or market value.
The Museum manages its investment portfolio on a total return basis. To preserve the investments’ long-term value, the Museum makes available to be spent each year 5% of the investment portfolio’s average market value for the preceding three years ending December 31, excluding investment and custodial fees (the “spending rate”).
Art Collection The Museum has an extensive collection of art, including paintings, sculpture, photographs, drawings, prints, and films and videos. The collection is maintained under the care of the Registration Department staff and is held for research, education and public exhibition in furtherance of public service, rather than for financial gain. As a matter of policy, proceeds from the sale of collection items are used to acquire other items for the collection. The Museum does not include either the cost or the value of its collection in the statement of financial position, nor does it recognize gifts of collection items as revenues in the statement of activities. Since items acquired for the collection by purchase are not capitalized, the cost of those acquisitions is reported as decreases in net assets in the statement of activities.
Whitney Museum of American Art Notes to Financial Statements June 30, 2018 and 2017
9
Measure of Operations The Museum includes in its measure of operations all revenues and expenses that are an integral part of its programs and supporting activities. The measure of operations includes investment income equal to a defined spending rate, and interest earned from short-term investments on cash held for working capital. It excludes net assets released for the building project, purchases and sales of collection items, investment return in excess of the spending rate, investment return on non-endowment assets, pension related charges other than net periodic benefit cost, and board designated contributions and activities.
Contributions The Museum records cash and unconditional promises to give as revenue in the period received. Unconditional contributions are recorded at the net present value of the amounts expected to be collected. Conditional contributions are recognized as revenue when the conditions on which they depend have been substantially met. The Museum records unconditional contributions as temporarily restricted revenue if they are received with donor stipulations that limit their use either through purpose or time restrictions. When donor restrictions expire, that is, when a purpose restriction is fulfilled or a time restriction ends, temporarily restricted net assets are reclassified to unrestricted net assets and reported in the statement of activities as net assets released from restrictions.
The Museum has volunteers who provide administrative support to various Museum programs. Such contributed services do not meet the criteria for recognition of contributed services contained in accounting principles generally accepted in the United States of America and, accordingly, are not reflected in the accompanying financial statements.
Membership Dues Membership dues for individual and corporate membership categories are recognized in the applicable year that the subscription commences. Multi-year memberships are recognized over the term of the subscription.
Benefits and Special Events Benefits and special events revenue results from the Museum’s efforts to produce a wide variety of events around large annual fundraisers and rentals of the Museum’s facilities. The revenue is recognized in the period that the benefits and events are held.
Admission Fees Admission fees are from daily attendance and group visits to the Museum.
Fees, Royalties and Other Fees, royalties and other primarily relate to revenue sharing contracts associated with the Museum’s 945 Madison Ave. building and its restaurants.
Functional Allocation of Expenses The costs of providing Museum programs and other activities have been presented in the accompanying statement of activities. Management and general expenses include executive and financial administration, human resources and information services. Fundraising expenses of the Museum include salaries and employee benefits of program staff that develop proposals for fundraising; solicit contributions for those needs and for endowment purposes from individuals, corporations, government agencies and foundations; and conduct special fundraising events. Utilities, building maintenance and other operating costs are allocated to program areas and supporting services based on head count.
Whitney Museum of American Art Notes to Financial Statements June 30, 2018 and 2017
10
Advertising and public relations costs are generally expensed when incurred, except when related to the Museum’s exhibition program, for which the costs are recognized on a pro-rated basis over the scheduled exhibition period. In fiscal 2018 and 2017, the Museum incurred advertising and public relations expenses of $1,230,000 and $1,575,000, respectively, excluding Museum labor and overhead Land, Building and Equipment Land, building and equipment are stated at cost and expenditures in excess of $2,500 are capitalized. The Museum’s building and capital improvements, office furniture and equipment are depreciated on a straight-line basis over their estimated useful lives (building–fifty years; capital improvements, office furniture and equipment - three to fifteen years or the remaining useful life of the building). Leasehold improvements are amortized on a straight-line basis over the shorter of the lives of the assets or the terms of the leases.
Deferred Traveling and Accrued Exhibition Fees Deferred Traveling and Accrued Exhibition Fees of $1,091,000 and $1,070,000 at June 30, 2018 and 2017, respectively, relate to in-house and traveling exhibitions for which the cash is received but the exhibition has not yet begun.
Bond Premiums and Deferred Financing Costs Included in Bonds Payable at June 30, 2018 and 2017, is $2,060,000 and $2,675,000, respectively of bond premiums related to the 2011 Revenue Bonds issuance. These premiums are amortized over a straight line basis over the life of the bonds. Amortization was $615,000 and $1,125,000 for the years ended June 30, 2018 and 2017. Also included in Bonds Payable are deferred financing costs related to the 2011 Revenue Bonds issuance of $679,000 and $799,000 at June 30, 2018 and 2017, respectively. These costs are amortized over a straight line basis over the life of the bonds. Amortization expense in 2018 and 2017 was $120,000 and $176,000.
Estimates The preparation of financial statements in conformity with accounting principles generally accepted in the United States of America requires management to make estimates and assumptions that affect the reported amounts of assets and liabilities and disclosure of contingent assets and liabilities at the date of the financial statements, and the reported amounts of revenues and expenses during the reporting period. The more significant estimates made relate to the valuation of contributions receivable, valuation of alternative investments, and actuarial assumptions used in the calculation of accrued pension obligation. Actual results could differ from those estimates.
Concentrations of Credit Risk Financial instruments which potentially subject the Museum to concentrations of credit risk consist principally of cash and cash equivalents and investments in fixed income funds, equity funds and limited partnerships. The Museum maintains its cash and cash equivalents in various bank deposit accounts which, at times, may exceed federally insured limits. The Museum’s cash investments are placed with high credit quality financial institutions. The Museum has not experienced any losses in such accounts.
Three donors represented 26% and 27% of Contributions Receivable at June 30, 2018 and 2017, respectively. Three other donors represented approximately 29% of Contributions and Grants for the years ended June 30, 2018 and 2017.
Tax Status The Museum is exempt from federal income taxes under Section 501(c)(3) of the U.S. Internal Revenue Code and has been classified as an organization which is not a private foundation under Section 509(a).
Whitney Museum of American Art Notes to Financial Statements June 30, 2018 and 2017
11
Reclassification Certain amounts in the 2017 statements have been reclassified to conform to the current year presentation. New Accounting Pronouncements In May 2014, the Financial Accounting Standards Board (“FASB”) issued a standard on Revenue from Contracts with Customers. This standard implements a single framework for recognition of all revenue earned from customers. This framework ensures that entities appropriately reflect the consideration to which they expect to be entitled in exchange for goods and services by allocating transaction price to identified performance obligations and recognizing revenue as performance obligations are satisfied. Qualitative and quantitative disclosures are required to enable users of financial statements to understand the nature, amount, timing, and uncertainty of revenue and cash flows arising from contracts with customers. The standard is effective for fiscal years beginning after December 15, 2017 (will be implemented for fiscal year 2019 for the Museum). The Museum is evaluating the impact this will have on the financial statements. In January 2016, the FASB issued Accounting Standard Update ASU No. 2016-02, Leases, which will require lessees to reflect virtually all leases on their balance sheet. Under the FASB’s dual approach, determining whether a lease is finance or operating lease will be based on guidance similar to the classification model under current US GAAP, but without the bright lines. The FASB’s standard is effective for public companies, certain not-for-profits, and benefit plans for interim and annual reporting periods beginning after December 15, 2018 (private companies have an additional year) (will be implemented for fiscal year 2020 for the Museum). Entities are required to adopt the standard using a modified retrospective transition approach, which requires application of the new guidance at the beginning of the earliest comparative period presented in the year of adoption. Early adoption is permitted. The Museum is evaluating the impact this will have on the financial statements. In August 2016, the FASB issued ASU 2016-14, Presentation of Financial Statements for Not for Profit Entities (“ASU 2016-14”). The new standard looks to improve the current net asset classification requirements and the information presented in financial statements and notes about a not-for-profit entity’s liquidity, financial performance, and cash flows. The main provisions of this update, which amend the requirements for financial statements and notes, require not-for-profit entities to present on the face of the statement of financial position amounts for two classes of net assets at the end of the period, rather than for the currently required three classes. Other amendments include improved quantitative and qualitative disclosures in the footnotes. The amendments in this Update are effective for annual financial statements issued for fiscal years beginning after December 15, 2017, and for interim periods within fiscal years beginning after December 15, 2018 (will be implemented for fiscal year 2019 for the Museum). The Museum is evaluating the impact this will have on the financial statements. In June 2018, the FASB issued ASU 2018-08, Clarifying the Scope and the Accounting Guidance for Contributions Received and Contributions Made. The amendments in this update prove a framework for evaluating whether grants should be accounted for as exchange transactions or as nonexchange transactions. This ASU is effective for fiscal years beginning after December 15, 2017 (will be implemented for fiscal year 2019 for the Museum). This ASU should be applied on a modified prospective basis, however, retrospective application is permitted. The Museum is evaluating the impact of this standard on the financial statements.
Whitney Museum of American Art Notes to Financial Statements June 30, 2018 and 2017
12
2. Investments
The Museum follows guidance with respect to accounting and reporting for the fair value of their financial assets and liabilities. This guidance establishes a fair value hierarchy that prioritizes the inputs to valuation techniques used to measure fair value. Fair value is defined as the exchange price that would be received for an asset or paid to transfer a liability (an exit price) in the principal or most advantageous market for the asset or liability in an orderly transaction between participants on the measurement date. Fair value requires an organization to determine the unit of account, the mechanism of hypothetical transfer, and the appropriate markets for the asset or liability being measured.
The guidance establishes a hierarchy of valuation inputs based on the extent to which the inputs are observable in the marketplace. Observable inputs reflect market data obtained from sources independent of the reporting entity and unobservable inputs reflect the entities own assumptions about how market participants would value an asset or liability based on the best information available. Valuation techniques used to measure fair value must maximize the use of observable inputs and minimize the use of unobservable inputs. The standard describes a fair value hierarchy based on three levels of inputs, of which the first two are considered observable and the last unobservable, that may be used to measure fair value.
The following describes the hierarchy of inputs used to measure fair value and the primary valuation methodologies used by the Museum for financial instruments measured at fair value on a recurring basis. The three levels of inputs are as follows:
Level 1 Quoted prices in active markets that the Museum has the ability to access for identical assets and liabilities for which significant observable inputs exist. Market price data is generally obtained from exchange or dealer markets. The Museum does not adjust the quoted price for such assets and liabilities. Investments included in Level 1 may include certain equity and fixed income securities, registered mutual funds and exchange traded funds.
Level 2 Inputs other than Level 1 that are observable, either directly or indirectly, such as quoted prices for similar assets or liabilities; quoted prices in markets that are not active; or other inputs that are observable or can be corroborated by observable market data for substantially the same term of assets or liabilities. This includes use of model based valuations techniques for which all significant assumptions are observable in the market or can be corroborated by observable market data for substantially the full term of the assets. Inputs are obtained from various sources including market participants, dealers and brokers.
Level 3 Unobservable inputs, as they trade infrequently or not at all, that are supported by little or no market activity and that are significant to the fair value of the assets or liabilities.
The methods described above may produce a fair value calculation that may not be indicative of net realizable value or reflective of future fair values. Furthermore, while the Museum believes its valuation methods are appropriate and consistent with other market participants, the use of different methodologies or assumptions to determine the fair value of certain financial instruments could result in a different estimate of fair value at the reporting date.
Whitney Museum of American Art Notes to Financial Statements June 30, 2018 and 2017
13
A financial instrument’s categorization within the valuation hierarchy is based upon the lowest level of input that is significant to the fair value measurement. Inputs are used in applying the various valuation techniques and broadly refer to the assumptions that market participants use to make valuation decisions. Inputs may include price information, credit data, liquidity statistics and other factors. The Museum considers observable data to be that market data which is readily available and reliable and provided by independent sources. The categorization of a financial instrument within the hierarchy is therefore based upon the pricing transparency of the instrument and does not necessarily correspond to the Museum’s perceived risk of that investment.
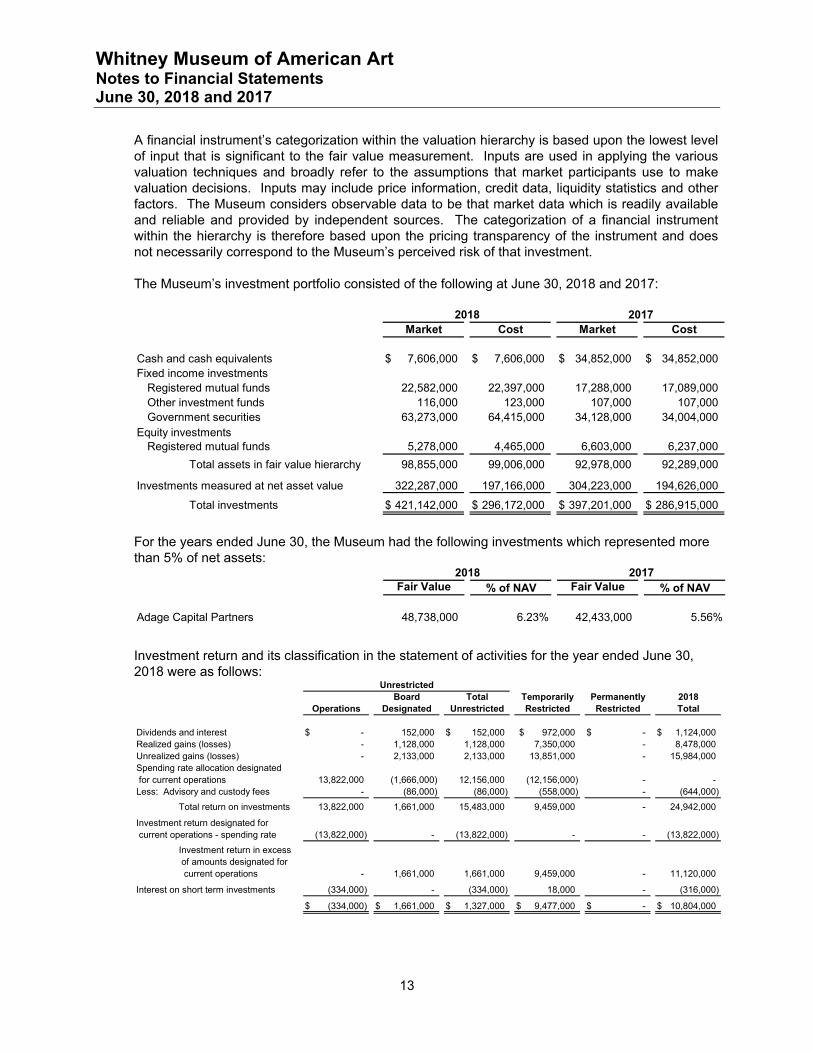
The Museum’s investment portfolio consisted of the following at June 30, 2018 and 2017:
Market Cost Market Cost
Cash and cash equivalents 7,606,000$ 7,606,000$ 34,852,000$ 34,852,000$ Fixed income investments
Registered mutual funds 22,582,000 22,397,000 17,288,000 17,089,000 Other investment funds 116,000 123,000 107,000 107,000Government securities 63,273,000 64,415,000 34,128,000 34,004,000
Equity investmentsRegistered mutual funds 5,278,000 4,465,000 6,603,000 6,237,000
Total assets in fair value hierarchy 98,855,000 99,006,000 92,978,000 92,289,000
Investments measured at net asset value 322,287,000 197,166,000 304,223,000 194,626,000
Total investments 421,142,000$ 296,172,000$ 397,201,000$ 286,915,000$
2018 2017
For the years ended June 30, the Museum had the following investments which represented more than 5% of net assets:
Fair Value % of NAV Fair Value % of NAV
Adage Capital Partners 48,738,000 6.23% 42,433,000 5.56%
2018 2017
Investment return and its classification in the statement of activities for the year ended June 30, 2018 were as follows:
Board Total Temporarily Permanently 2018Operations Designated Unrestricted Restricted Restricted Total
Dividends and interest -$ 152,000 152,000$ 972,000$ -$ 1,124,000$ Realized gains (losses) - 1,128,000 1,128,000 7,350,000 - 8,478,000Unrealized gains (losses) - 2,133,000 2,133,000 13,851,000 - 15,984,000Spending rate allocation designated for current operations 13,822,000 (1,666,000) 12,156,000 (12,156,000) - -Less: Advisory and custody fees - (86,000) (86,000) (558,000) - (644,000)
Total return on investments 13,822,000 1,661,000 15,483,000 9,459,000 - 24,942,000
Investment return designated for current operations - spending rate (13,822,000) - (13,822,000) - - (13,822,000)
Investment return in excess of amounts designated for current operations - 1,661,000 1,661,000 9,459,000 - 11,120,000
Interest on short term investments (334,000) - (334,000) 18,000 - (316,000)
(334,000)$ 1,661,000$ 1,327,000$ 9,477,000$ -$ 10,804,000$
Unrestricted
Whitney Museum of American Art Notes to Financial Statements June 30, 2018 and 2017
14
Investment return designated for current operations of $13,822,000 represents funds which have been made available for spending pursuant to the authorized spending rate. The $1,661,000 increase in board designated net assets represents unrestricted gains in excess of dividends and interest, realized gains, and amounts made available for spending. The $9,459,000 increase in the temporarily restricted investment category represents investment gains on temporarily restricted net assets.
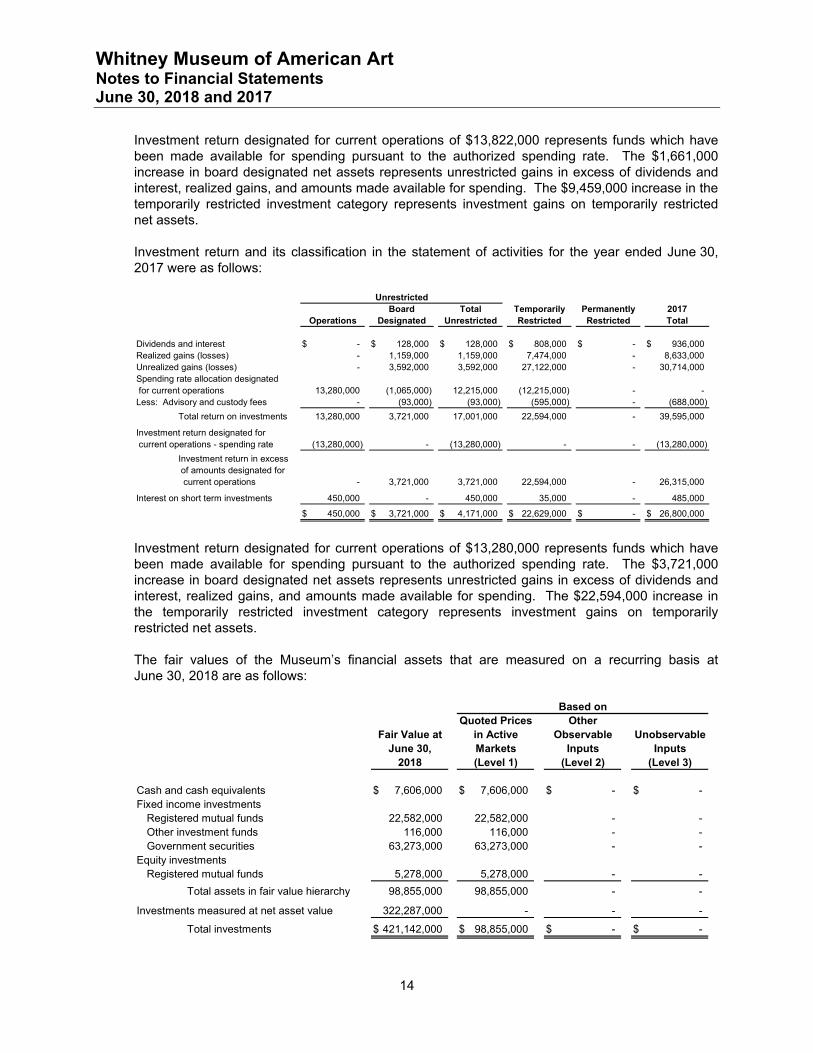
Investment return and its classification in the statement of activities for the year ended June 30, 2017 were as follows:
Board Total Temporarily Permanently 2017Operations Designated Unrestricted Restricted Restricted Total
Dividends and interest -$ 128,000$ 128,000$ 808,000$ -$ 936,000$ Realized gains (losses) - 1,159,000 1,159,000 7,474,000 - 8,633,000Unrealized gains (losses) - 3,592,000 3,592,000 27,122,000 - 30,714,000Spending rate allocation designated for current operations 13,280,000 (1,065,000) 12,215,000 (12,215,000) - -Less: Advisory and custody fees - (93,000) (93,000) (595,000) - (688,000)
Total return on investments 13,280,000 3,721,000 17,001,000 22,594,000 - 39,595,000
Investment return designated for current operations - spending rate (13,280,000) - (13,280,000) - - (13,280,000)
Investment return in excess of amounts designated for current operations - 3,721,000 3,721,000 22,594,000 - 26,315,000
Interest on short term investments 450,000 - 450,000 35,000 - 485,000
450,000$ 3,721,000$ 4,171,000$ 22,629,000$ -$ 26,800,000$
Unrestricted
Investment return designated for current operations of $13,280,000 represents funds which have been made available for spending pursuant to the authorized spending rate. The $3,721,000 increase in board designated net assets represents unrestricted gains in excess of dividends and interest, realized gains, and amounts made available for spending. The $22,594,000 increase in the temporarily restricted investment category represents investment gains on temporarily restricted net assets.
The fair values of the Museum’s financial assets that are measured on a recurring basis at June 30, 2018 are as follows:
Quoted Prices OtherFair Value at in Active Observable Unobservable
June 30, Markets Inputs Inputs2018 (Level 1) (Level 2) (Level 3)
Cash and cash equivalents 7,606,000$ 7,606,000$ -$ -$ Fixed income investments
Registered mutual funds 22,582,000 22,582,000 - -Other investment funds 116,000 116,000 - -Government securities 63,273,000 63,273,000 - -
Equity investmentsRegistered mutual funds 5,278,000 5,278,000 - -
Total assets in fair value hierarchy 98,855,000 98,855,000 - -
Investments measured at net asset value 322,287,000 - - -
Total investments 421,142,000$ 98,855,000$ -$ -$
Based on
Whitney Museum of American Art Notes to Financial Statements June 30, 2018 and 2017
15
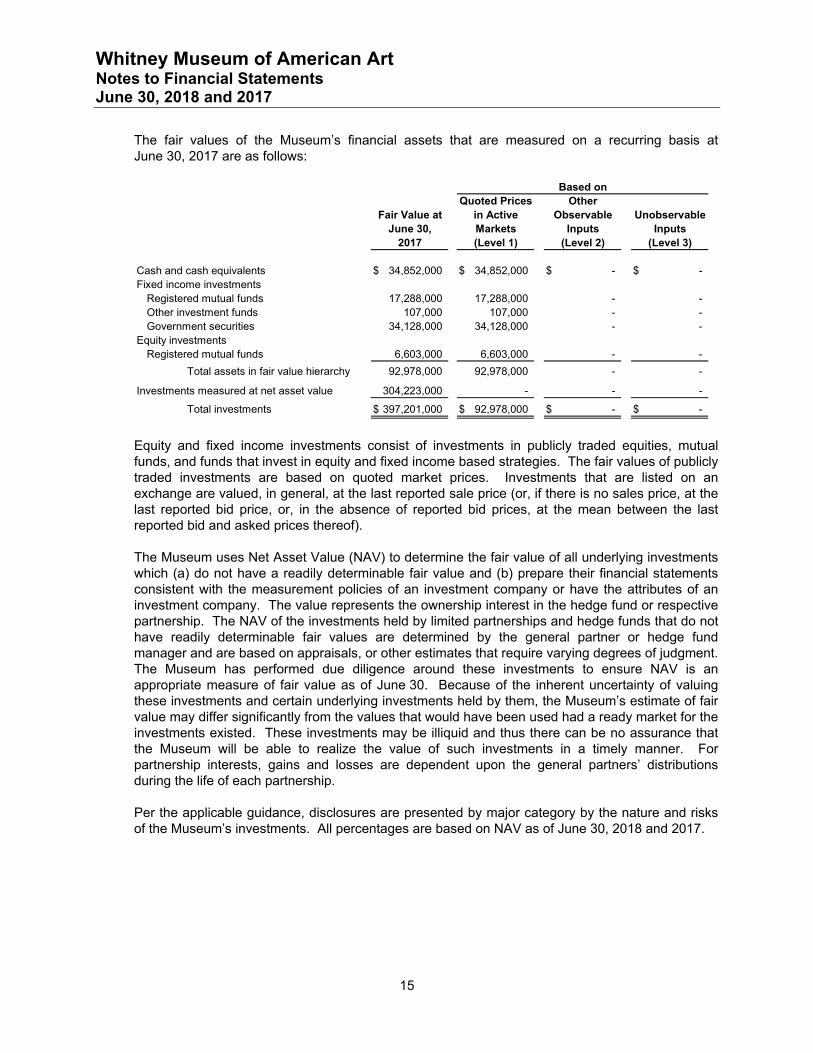
The fair values of the Museum’s financial assets that are measured on a recurring basis at June 30, 2017 are as follows:
Quoted Prices OtherFair Value at in Active Observable Unobservable
June 30, Markets Inputs Inputs2017 (Level 1) (Level 2) (Level 3)
Cash and cash equivalents 34,852,000$ 34,852,000$ -$ -$ Fixed income investments
Registered mutual funds 17,288,000 17,288,000 - -Other investment funds 107,000 107,000 - -Government securities 34,128,000 34,128,000 - -
Equity investmentsRegistered mutual funds 6,603,000 6,603,000 - -
Total assets in fair value hierarchy 92,978,000 92,978,000 - -
Investments measured at net asset value 304,223,000 - - -
Total investments 397,201,000$ 92,978,000$ -$ -$
Based on
Equity and fixed income investments consist of investments in publicly traded equities, mutual funds, and funds that invest in equity and fixed income based strategies. The fair values of publicly traded investments are based on quoted market prices. Investments that are listed on an exchange are valued, in general, at the last reported sale price (or, if there is no sales price, at the last reported bid price, or, in the absence of reported bid prices, at the mean between the last reported bid and asked prices thereof).
The Museum uses Net Asset Value (NAV) to determine the fair value of all underlying investments which (a) do not have a readily determinable fair value and (b) prepare their financial statements consistent with the measurement policies of an investment company or have the attributes of an investment company. The value represents the ownership interest in the hedge fund or respective partnership. The NAV of the investments held by limited partnerships and hedge funds that do not have readily determinable fair values are determined by the general partner or hedge fund manager and are based on appraisals, or other estimates that require varying degrees of judgment. The Museum has performed due diligence around these investments to ensure NAV is an appropriate measure of fair value as of June 30. Because of the inherent uncertainty of valuing these investments and certain underlying investments held by them, the Museum’s estimate of fair value may differ significantly from the values that would have been used had a ready market for the investments existed. These investments may be illiquid and thus there can be no assurance that the Museum will be able to realize the value of such investments in a timely manner. For partnership interests, gains and losses are dependent upon the general partners’ distributions during the life of each partnership.
Per the applicable guidance, disclosures are presented by major category by the nature and risks of the Museum’s investments. All percentages are based on NAV as of June 30, 2018 and 2017.
Whitney Museum of American Art Notes to Financial Statements June 30, 2018 and 2017
16
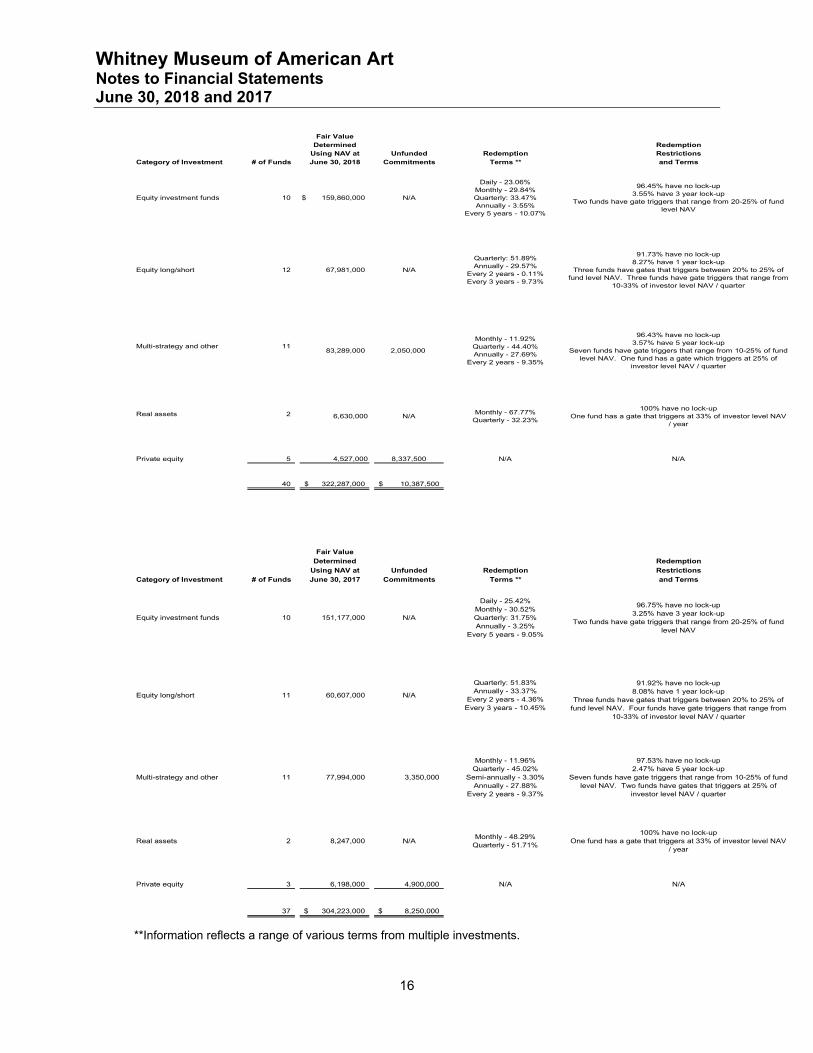
Fair ValueDetermined Redemption
Using NAV at Unfunded Redemption Restrictions
Category of Investment # of Funds June 30, 2018 Commitments Terms ** and Terms
6,630,000 N/AMonthly - 67.77%
Quarterly - 32.23%
100% have no lock-upOne fund has a gate that triggers at 33% of investor level NAV
/ year
Private equity 5 4,527,000 8,337,500 N/A N/A
40 322,287,000$ 10,387,500$
2
Multi-strategy and other 11
Real assets
Daily - 23.06%Monthly - 29.84%Quarterly: 33.47%Annually - 3.55%
Every 5 years - 10.07%
96.45% have no lock-up3.55% have 3 year lock-up
Two funds have gate triggers that range from 20-25% of fund level NAV
Equity long/short 12 67,981,000
83,289,000
N/A159,860,000$ 10Equity investment funds
Monthly - 11.92%Quarterly - 44.40%Annually - 27.69%
Every 2 years - 9.35%
96.43% have no lock-up3.57% have 5 year lock-up
Seven funds have gate triggers that range from 10-25% of fund level NAV. One fund has a gate which triggers at 25% of
investor level NAV / quarter
91.73% have no lock-up8.27% have 1 year lock-up
Three funds have gates that triggers between 20% to 25% of fund level NAV. Three funds have gate triggers that range from
10-33% of investor level NAV / quarter
N/A
Quarterly: 51.89%Annually - 29.57%
Every 2 years - 0.11%Every 3 years - 9.73%
2,050,000
Fair ValueDetermined Redemption
Using NAV at Unfunded Redemption RestrictionsCategory of Investment # of Funds June 30, 2017 Commitments Terms ** and Terms
Private equity 3 6,198,000 4,900,000 N/A N/A
37 304,223,000$ 8,250,000$
Equity investment funds 10 151,177,000 N/A
Daily - 25.42%Monthly - 30.52%Quarterly: 31.75%Annually - 3.25%
Every 5 years - 9.05%
96.75% have no lock-up3.25% have 3 year lock-up
Two funds have gate triggers that range from 20-25% of fund level NAV
Equity long/short 11 60,607,000 N/A
Quarterly: 51.83%Annually - 33.37%
Every 2 years - 4.36%Every 3 years - 10.45%
91.92% have no lock-up8.08% have 1 year lock-up
Three funds have gates that triggers between 20% to 25% of fund level NAV. Four funds have gate triggers that range from
10-33% of investor level NAV / quarter
Multi-strategy and other 11 77,994,000 3,350,000
Monthly - 11.96%Quarterly - 45.02%
Semi-annually - 3.30%Annually - 27.88%
Every 2 years - 9.37%
97.53% have no lock-up2.47% have 5 year lock-up
Seven funds have gate triggers that range from 10-25% of fund level NAV. Two funds have gates that triggers at 25% of
investor level NAV / quarter
Real assets 2 8,247,000 N/AMonthly - 48.29%
Quarterly - 51.71%
100% have no lock-upOne fund has a gate that triggers at 33% of investor level NAV
/ year
**Information reflects a range of various terms from multiple investments.
Whitney Museum of American Art Notes to Financial Statements June 30, 2018 and 2017
17
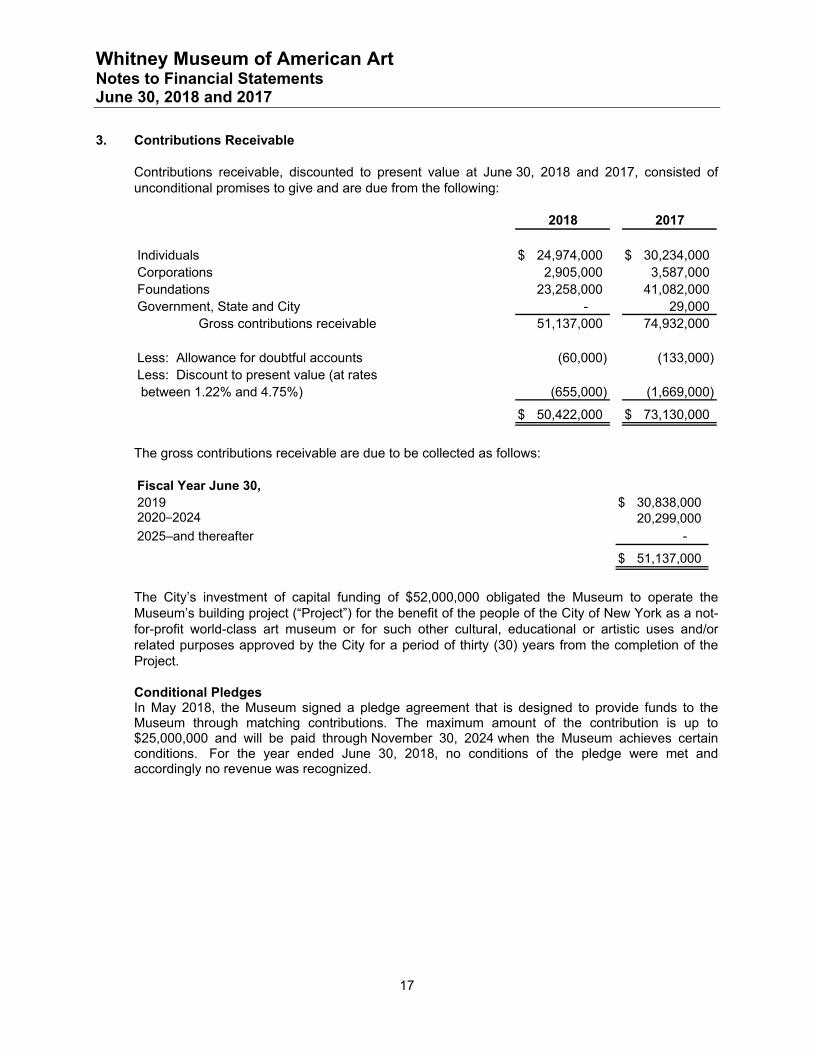
3. Contributions Receivable
Contributions receivable, discounted to present value at June 30, 2018 and 2017, consisted of unconditional promises to give and are due from the following:
2018 2017
Individuals 24,974,000$ 30,234,000$ Corporations 2,905,000 3,587,000Foundations 23,258,000 41,082,000Government, State and City - 29,000
Gross contributions receivable 51,137,000 74,932,000
Less: Allowance for doubtful accounts (60,000) (133,000)Less: Discount to present value (at rates between 1.22% and 4.75%) (655,000) (1,669,000)
50,422,000$ 73,130,000$
The gross contributions receivable are due to be collected as follows:
Fiscal Year June 30,2019 30,838,000$ 2020–2024 20,299,000 2025–and thereafter -
51,137,000$
The City’s investment of capital funding of $52,000,000 obligated the Museum to operate the Museum’s building project (“Project”) for the benefit of the people of the City of New York as a not-for-profit world-class art museum or for such other cultural, educational or artistic uses and/or related purposes approved by the City for a period of thirty (30) years from the completion of the Project.
Conditional Pledges In May 2018, the Museum signed a pledge agreement that is designed to provide funds to the Museum through matching contributions. The maximum amount of the contribution is up to $25,000,000 and will be paid through November 30, 2024 when the Museum achieves certain conditions. For the year ended June 30, 2018, no conditions of the pledge were met and accordingly no revenue was recognized.
Whitney Museum of American Art Notes to Financial Statements June 30, 2018 and 2017
18
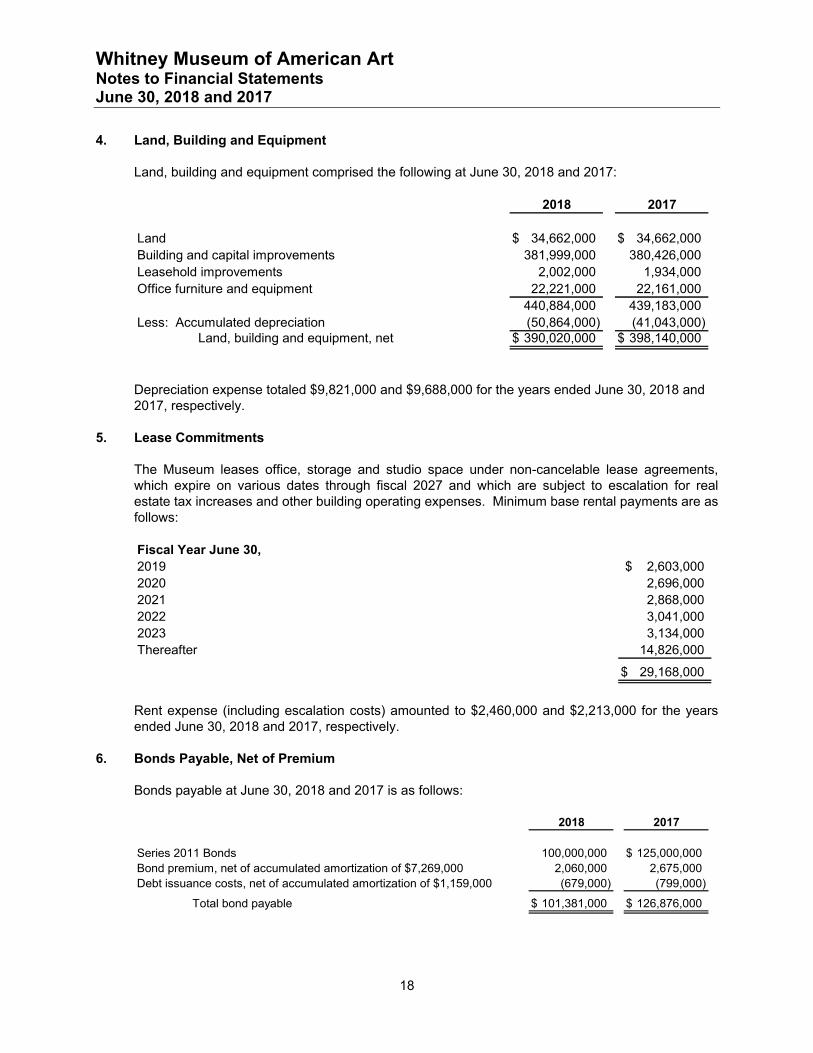
4. Land, Building and Equipment
Land, building and equipment comprised the following at June 30, 2018 and 2017:
2018 2017
Land 34,662,000$ 34,662,000$ Building and capital improvements 381,999,000 380,426,000 Leasehold improvements 2,002,000 1,934,000 Office furniture and equipment 22,221,000 22,161,000
440,884,000 439,183,000Less: Accumulated depreciation (50,864,000) (41,043,000)
Land, building and equipment, net 390,020,000$ 398,140,000$
Depreciation expense totaled $9,821,000 and $9,688,000 for the years ended June 30, 2018 and 2017, respectively.
5. Lease Commitments
The Museum leases office, storage and studio space under non-cancelable lease agreements, which expire on various dates through fiscal 2027 and which are subject to escalation for real estate tax increases and other building operating expenses. Minimum base rental payments are as follows:
Fiscal Year June 30,2019 2,603,000$ 2020 2,696,000 2021 2,868,000 2022 3,041,000 2023 3,134,000 Thereafter 14,826,000
29,168,000$
Rent expense (including escalation costs) amounted to $2,460,000 and $2,213,000 for the years ended June 30, 2018 and 2017, respectively.
6. Bonds Payable, Net of Premium
Bonds payable at June 30, 2018 and 2017 is as follows:
2018 2017
Series 2011 Bonds 100,000,000 125,000,000$ Bond premium, net of accumulated amortization of $7,269,000 2,060,000 2,675,000Debt issuance costs, net of accumulated amortization of $1,159,000 (679,000) (799,000)
Total bond payable 101,381,000$ 126,876,000$
Whitney Museum of American Art Notes to Financial Statements June 30, 2018 and 2017
19
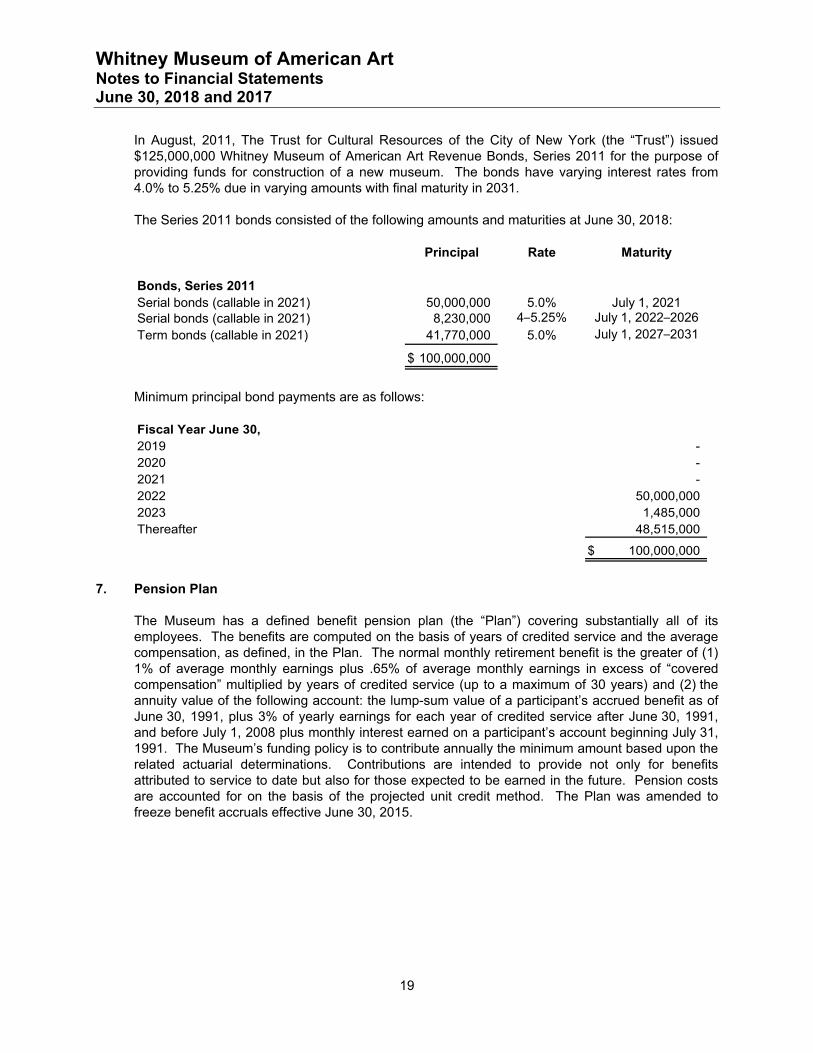
In August, 2011, The Trust for Cultural Resources of the City of New York (the “Trust”) issued $125,000,000 Whitney Museum of American Art Revenue Bonds, Series 2011 for the purpose of providing funds for construction of a new museum. The bonds have varying interest rates from 4.0% to 5.25% due in varying amounts with final maturity in 2031.
The Series 2011 bonds consisted of the following amounts and maturities at June 30, 2018:
Principal Rate Maturity
Bonds, Series 2011Serial bonds (callable in 2021) 50,000,000 5.0% July 1, 2021Serial bonds (callable in 2021) 8,230,000 4–5.25% July 1, 2022–2026Term bonds (callable in 2021) 41,770,000 5.0% July 1, 2027–2031
100,000,000$
Minimum principal bond payments are as follows:
Fiscal Year June 30,2019 -2020 -2021 -2022 50,000,0002023 1,485,000Thereafter 48,515,000
100,000,000$
7. Pension Plan
The Museum has a defined benefit pension plan (the “Plan”) covering substantially all of its employees. The benefits are computed on the basis of years of credited service and the average compensation, as defined, in the Plan. The normal monthly retirement benefit is the greater of (1) 1% of average monthly earnings plus .65% of average monthly earnings in excess of “covered compensation” multiplied by years of credited service (up to a maximum of 30 years) and (2) the annuity value of the following account: the lump-sum value of a participant’s accrued benefit as of June 30, 1991, plus 3% of yearly earnings for each year of credited service after June 30, 1991, and before July 1, 2008 plus monthly interest earned on a participant’s account beginning July 31, 1991. The Museum’s funding policy is to contribute annually the minimum amount based upon the related actuarial determinations. Contributions are intended to provide not only for benefits attributed to service to date but also for those expected to be earned in the future. Pension costs are accounted for on the basis of the projected unit credit method. The Plan was amended to freeze benefit accruals effective June 30, 2015.
Whitney Museum of American Art Notes to Financial Statements June 30, 2018 and 2017
20
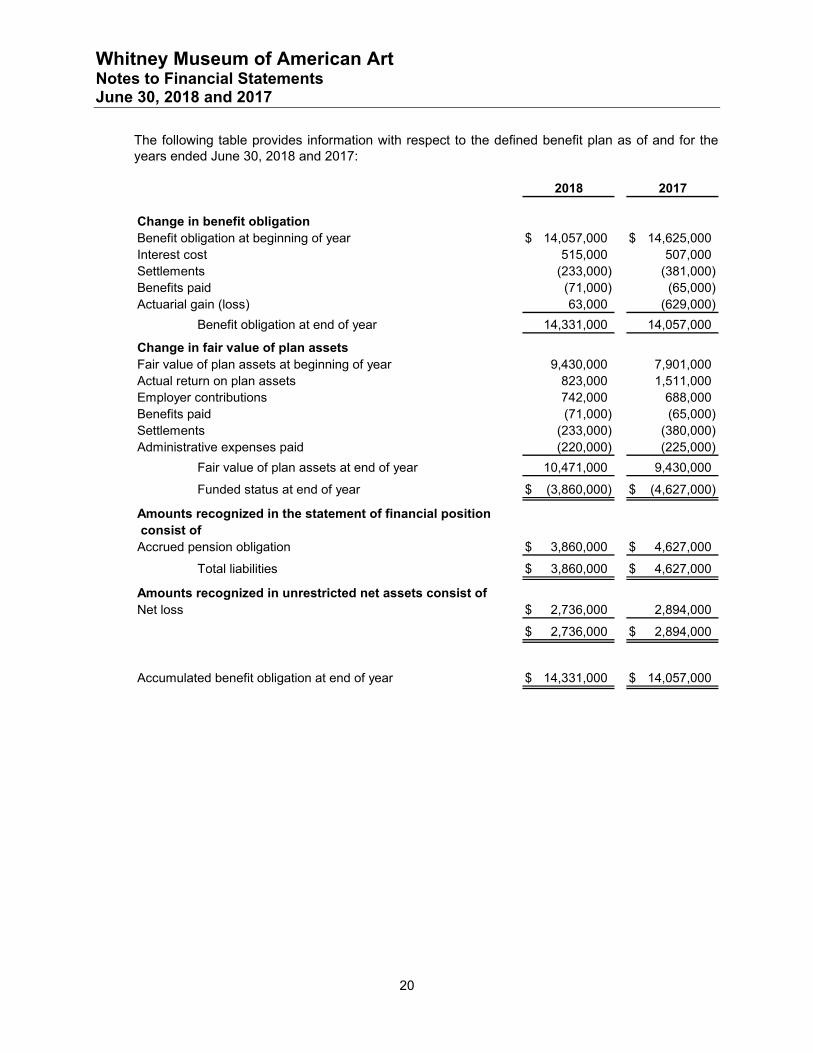
The following table provides information with respect to the defined benefit plan as of and for the years ended June 30, 2018 and 2017:
2018 2017
Change in benefit obligationBenefit obligation at beginning of year 14,057,000$ 14,625,000$ Interest cost 515,000 507,000 Settlements (233,000) (381,000) Benefits paid (71,000) (65,000) Actuarial gain (loss) 63,000 (629,000)
Benefit obligation at end of year 14,331,000 14,057,000
Change in fair value of plan assetsFair value of plan assets at beginning of year 9,430,000 7,901,000 Actual return on plan assets 823,000 1,511,000 Employer contributions 742,000 688,000 Benefits paid (71,000) (65,000) Settlements (233,000) (380,000) Administrative expenses paid (220,000) (225,000)
Fair value of plan assets at end of year 10,471,000 9,430,000
Funded status at end of year (3,860,000)$ (4,627,000)$
Amounts recognized in the statement of financial position consist ofAccrued pension obligation 3,860,000$ 4,627,000$
Total liabilities 3,860,000$ 4,627,000$
Amounts recognized in unrestricted net assets consist ofNet loss 2,736,000$ 2,894,000
2,736,000$ 2,894,000$
Accumulated benefit obligation at end of year 14,331,000$ 14,057,000$
Whitney Museum of American Art Notes to Financial Statements June 30, 2018 and 2017
21
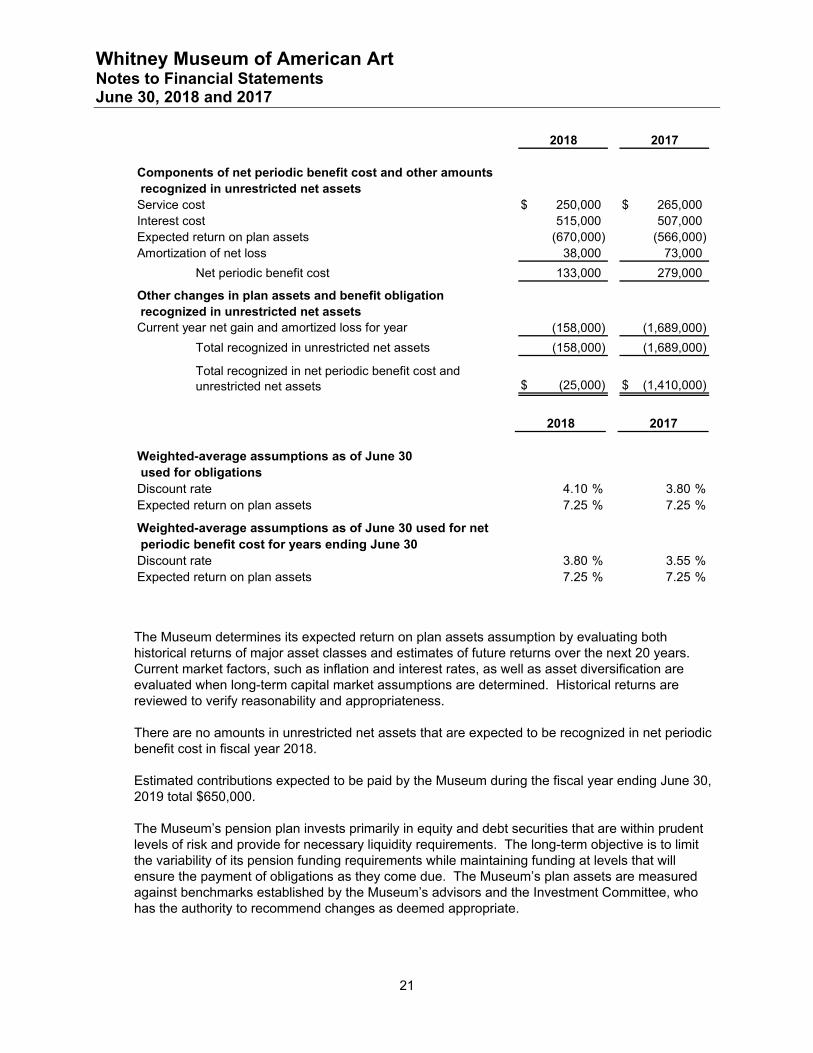
2018 2017
Components of net periodic benefit cost and other amounts recognized in unrestricted net assetsService cost 250,000$ 265,000$ Interest cost 515,000 507,000 Expected return on plan assets (670,000) (566,000) Amortization of net loss 38,000 73,000
Net periodic benefit cost 133,000 279,000
Other changes in plan assets and benefit obligation recognized in unrestricted net assets
(158,000) (1,689,000)
Total recognized in unrestricted net assets (158,000) (1,689,000)
(25,000)$ (1,410,000)$
Current year net gain and amortized loss for year
Total recognized in net periodic benefit cost and unrestricted net assets
2018 2017
Weighted-average assumptions as of June 30 used for obligationsDiscount rate 4.10 % 3.80 % Expected return on plan assets 7.25 % 7.25 %
Weighted-average assumptions as of June 30 used for net periodic benefit cost for years ending June 30Discount rate 3.80 % 3.55 % Expected return on plan assets 7.25 % 7.25 %
The Museum determines its expected return on plan assets assumption by evaluating both historical returns of major asset classes and estimates of future returns over the next 20 years. Current market factors, such as inflation and interest rates, as well as asset diversification are evaluated when long-term capital market assumptions are determined. Historical returns are reviewed to verify reasonability and appropriateness.
There are no amounts in unrestricted net assets that are expected to be recognized in net periodic benefit cost in fiscal year 2018.
Estimated contributions expected to be paid by the Museum during the fiscal year ending June 30, 2019 total $650,000.
The Museum’s pension plan invests primarily in equity and debt securities that are within prudent levels of risk and provide for necessary liquidity requirements. The long-term objective is to limit the variability of its pension funding requirements while maintaining funding at levels that will ensure the payment of obligations as they come due. The Museum’s plan assets are measured against benchmarks established by the Museum’s advisors and the Investment Committee, who has the authority to recommend changes as deemed appropriate.
Whitney Museum of American Art Notes to Financial Statements June 30, 2018 and 2017
22
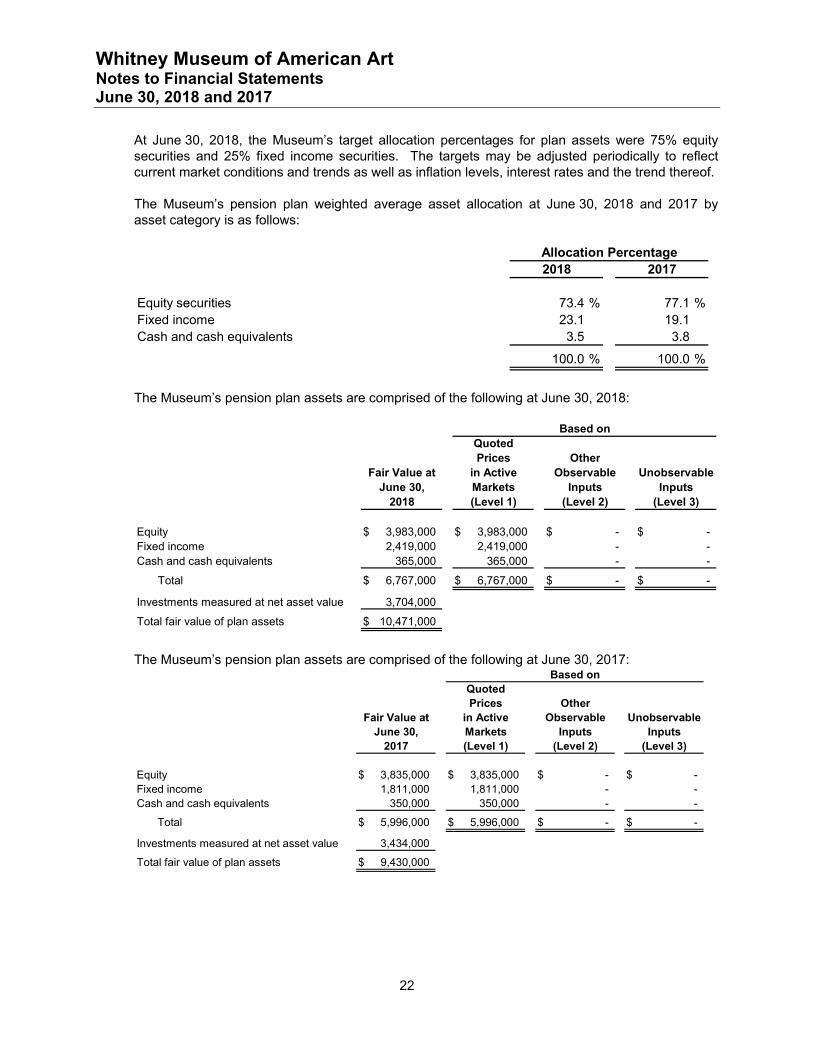
At June 30, 2018, the Museum’s target allocation percentages for plan assets were 75% equity securities and 25% fixed income securities. The targets may be adjusted periodically to reflect current market conditions and trends as well as inflation levels, interest rates and the trend thereof.
The Museum’s pension plan weighted average asset allocation at June 30, 2018 and 2017 by asset category is as follows:
2018 2017
Equity securities 73.4 % 77.1 % Fixed income 23.1 19.1 Cash and cash equivalents 3.5 3.8
100.0 % 100.0 %
Allocation Percentage
The Museum’s pension plan assets are comprised of the following at June 30, 2018:
QuotedPrices Other
Fair Value at in Active Observable UnobservableJune 30, Markets Inputs Inputs
2018 (Level 1) (Level 2) (Level 3)
Equity 3,983,000$ 3,983,000$ -$ -$ Fixed income 2,419,000 2,419,000 - -Cash and cash equivalents 365,000 365,000 - -
Total 6,767,000$ 6,767,000$ -$ -$
Investments measured at net asset value 3,704,000
Total fair value of plan assets 10,471,000$
Based on
The Museum’s pension plan assets are comprised of the following at June 30, 2017:
QuotedPrices Other
Fair Value at in Active Observable UnobservableJune 30, Markets Inputs Inputs
2017 (Level 1) (Level 2) (Level 3)
Equity 3,835,000$ 3,835,000$ -$ -$ Fixed income 1,811,000 1,811,000 - -Cash and cash equivalents 350,000 350,000 - -
Total 5,996,000$ 5,996,000$ -$ -$
Investments measured at net asset value 3,434,000
Total fair value of plan assets 9,430,000$
Based on
Whitney Museum of American Art Notes to Financial Statements June 30, 2018 and 2017
23
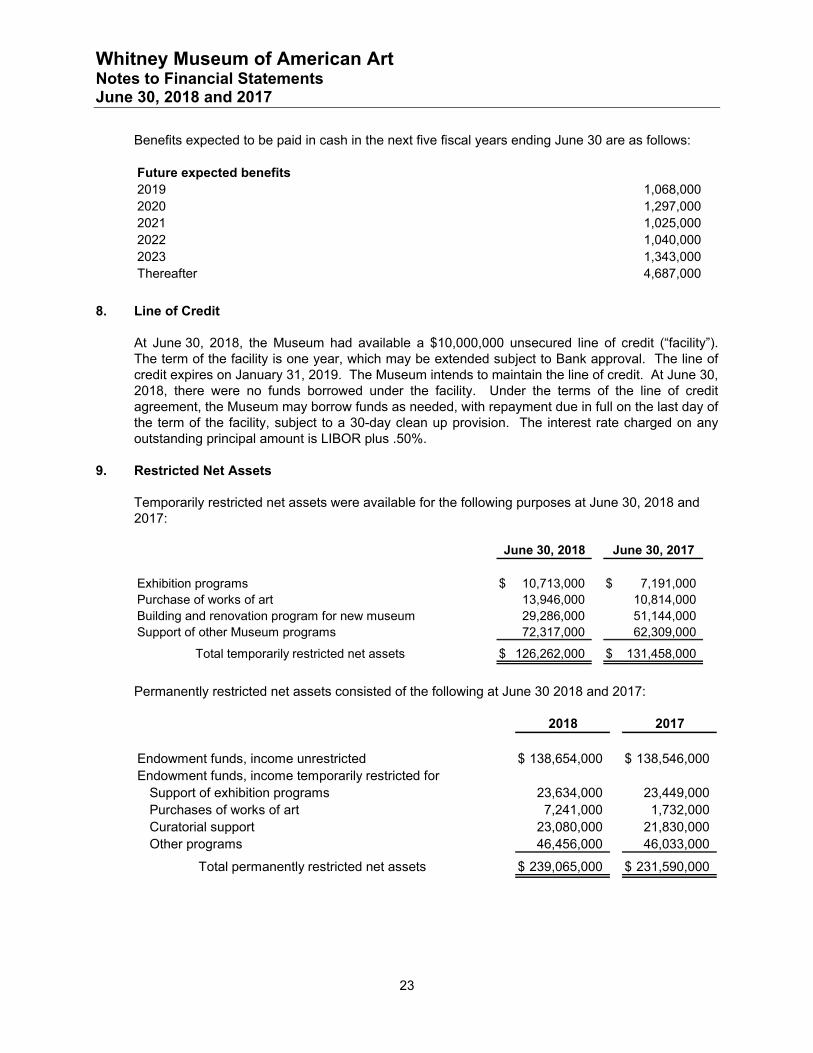
Benefits expected to be paid in cash in the next five fiscal years ending June 30 are as follows:
Future expected benefits2019 1,068,0002020 1,297,0002021 1,025,0002022 1,040,0002023 1,343,000Thereafter 4,687,000
8. Line of Credit
At June 30, 2018, the Museum had available a $10,000,000 unsecured line of credit (“facility”). The term of the facility is one year, which may be extended subject to Bank approval. The line of credit expires on January 31, 2019. The Museum intends to maintain the line of credit. At June 30, 2018, there were no funds borrowed under the facility. Under the terms of the line of credit agreement, the Museum may borrow funds as needed, with repayment due in full on the last day of the term of the facility, subject to a 30-day clean up provision. The interest rate charged on any outstanding principal amount is LIBOR plus .50%.
9. Restricted Net Assets
Temporarily restricted net assets were available for the following purposes at June 30, 2018 and 2017:
June 30, 2018 June 30, 2017
Exhibition programs 10,713,000$ 7,191,000$ Purchase of works of art 13,946,000 10,814,000 Building and renovation program for new museum 29,286,000 51,144,000 Support of other Museum programs 72,317,000 62,309,000
Total temporarily restricted net assets 126,262,000$ 131,458,000$
Permanently restricted net assets consisted of the following at June 30 2018 and 2017:
2018 2017
Endowment funds, income unrestricted 138,654,000$ 138,546,000$ Endowment funds, income temporarily restricted for
Support of exhibition programs 23,634,000 23,449,000 Purchases of works of art 7,241,000 1,732,000 Curatorial support 23,080,000 21,830,000 Other programs 46,456,000 46,033,000
Total permanently restricted net assets 239,065,000$ 231,590,000$
Whitney Museum of American Art Notes to Financial Statements June 30, 2018 and 2017
24
10. Endowment
The Museum’s endowment consists of 125 individual funds established for a variety of purposes. The Endowment includes both donor restricted endowment funds and funds designated by the Board of Trustees to function as endowments. As required by generally accepted accounting principles net assets associated with endowment funds, including funds designated by the Board of Trustees to function as endowments, are classified and reported based on the existence or absence of donor-imposed restrictions.
On September 17, 2010, New York State enacted the New York Prudent Management of Institutional Funds Act (“NYPMIFA”). NYPMIFA contains provisions that govern charitable institutions’ appropriation and use, among other things, of donor-restricted endowment funds. NYPMIFA updated certain provisions of prior endowment management law that had become outdated. Most significantly, under prior law, charitable institutions were required to maintain the “historic dollar value” of endowment funds, meaning that institutions could appropriate only a prudent portion of a fund if the value of the fund were greater than the dollar value of the donor’s contribution(s) to the fund (i.e., the “historic dollar value”), and the appropriation would not take the fund below that amount or a prudent portion only of the income from the fund, if the value of the fund were less than the historic dollar value.
Under NYPMIFA, a detailed prudence standard governs appropriation from endowment funds, and there is no longer a requirement to maintain historic dollar value. Prudent appropriation from a fund whose value is less than its historic dollar value is permitted. In particular, NYPMIFA provides that, unless a donor expresses a contrary intention in a gift instrument, a charitable institution may appropriate as much of an endowment fund as it “determines is prudent for the uses, benefits, purposes and duration for which the fund is established,” without regard for historic dollar value. As with prior law, NYPMIFA retains the requirement that in making any decision to appropriate, “the institution shall act in good faith, with the care that an ordinarily prudent person in a like position would exercise under similar circumstances.” It further provides a new requirement that the institution “shall consider, if relevant” the following eight factors in deciding whether or not to appropriate from a fund:
The duration and preservation of the endowment fund;
The purposes of the Museum and the endowment fund;
General economic conditions;
The possible effect of inflation or deflation;
The expected total return from income and the appreciation of investments;
Other resources of the Museum;
Alternatives to expenditure of the endowment fund; and
The investment policy of the Museum.
The provisions of NYPMIFA allowing prudent appropriation without regard to historic dollar value apply to funds created after its effective date of September 17, 2010. Donors of funds created before that date were given the option of requiring institutions to continue to observe the historic dollar value restrictions contained in prior law. Some donors of Museum funds have elected this
Whitney Museum of American Art Notes to Financial Statements June 30, 2018 and 2017
25
option. Moreover, as with prior law, a donor may incorporate in a gift instrument specific restrictions on appropriation that are different from either NYPMIFA or prior law. Certain of the Museum’s funds are governed by such instruments. Thus the Museum has funds that fall into three categories with respect to appropriation: those from which it may prudently appropriate without regard to historic dollar value; those from which it may prudently appropriate appreciation only above historic dollar value; and those whose appropriation is governed by specific instructions in the constitutive gift instrument.
The Museum’s spending policy rate is designed to stabilize annual spending levels and to present the real value of the investment portfolio over time. To preserve the portfolio’s long-term value, the museum makes available to be spent each fiscal year 5% of each fund’s allocable portions of the portfolio’s average market value, net of fees and taxes (if any), as of December 31st of each of the preceding three years. This spending policy is consistent with the Museum’s objectives to utilize income to support programs while preserving capital and ensuring future endowment growth.
Endowment funds are invested with Investment Managers charged with meeting or exceeding the representative index, universe or blended market index and universe that most closely corresponds to the Investment Manager’s style of investment management. The investment strategy emphasizes long-term appreciation of the assets and consistency of total portfolio returns to support general operations while ensuring the preservation of capital.
Consistent with endowment accounting for not-for-profit organizations for funds subject to an enacted version of UPMIFA, the Museum classifies as permanently restricted net assets (a) the original value of gifts donated to the permanent endowment, (b) the original value of subsequent gifts to the permanent endowment, (c) the net realizable value of future payments to permanently restricted net assets in accordance with the donor’s gift instrument (outstanding endowment pledges net of applicable discount), and (d) accumulations, including appreciation, gains and income, to the permanent endowment made in accordance with the direction of the applicable donor gift instrument at the time the accumulation is added to the fund.
For financial reporting purposes, donor-restricted endowment fund appreciation, gains and income exceeding donor restrictions are classified as temporarily restricted net assets until those amounts are appropriated for expenditure by the Museum in a manner consistent with the standard of prudence prescribed by law. Upon appropriation, appreciation and earnings are reclassified as unrestricted net assets.
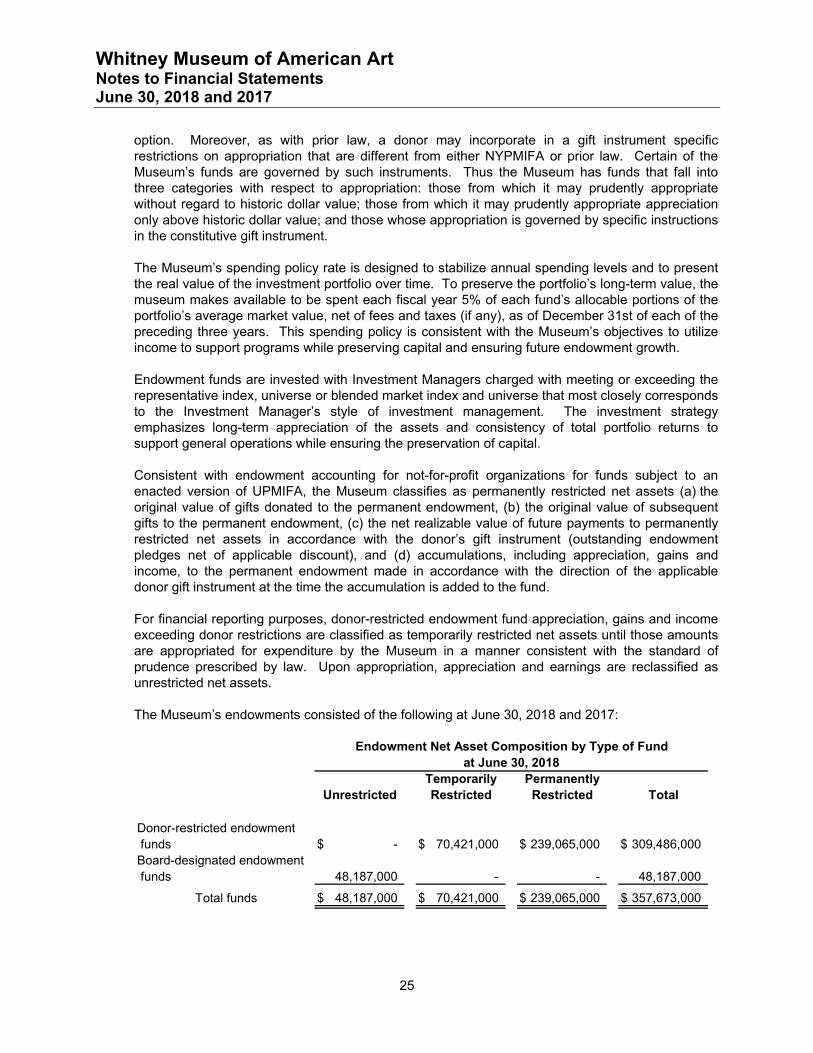
The Museum’s endowments consisted of the following at June 30, 2018 and 2017:
Temporarily PermanentlyUnrestricted Restricted Restricted Total
Donor-restricted endowment funds -$ 70,421,000$ 239,065,000$ 309,486,000$ Board-designated endowment funds 48,187,000 - - 48,187,000
Total funds 48,187,000$ 70,421,000$ 239,065,000$ 357,673,000$
Endowment Net Asset Composition by Type of Fundat June 30, 2018
Whitney Museum of American Art Notes to Financial Statements June 30, 2018 and 2017
26
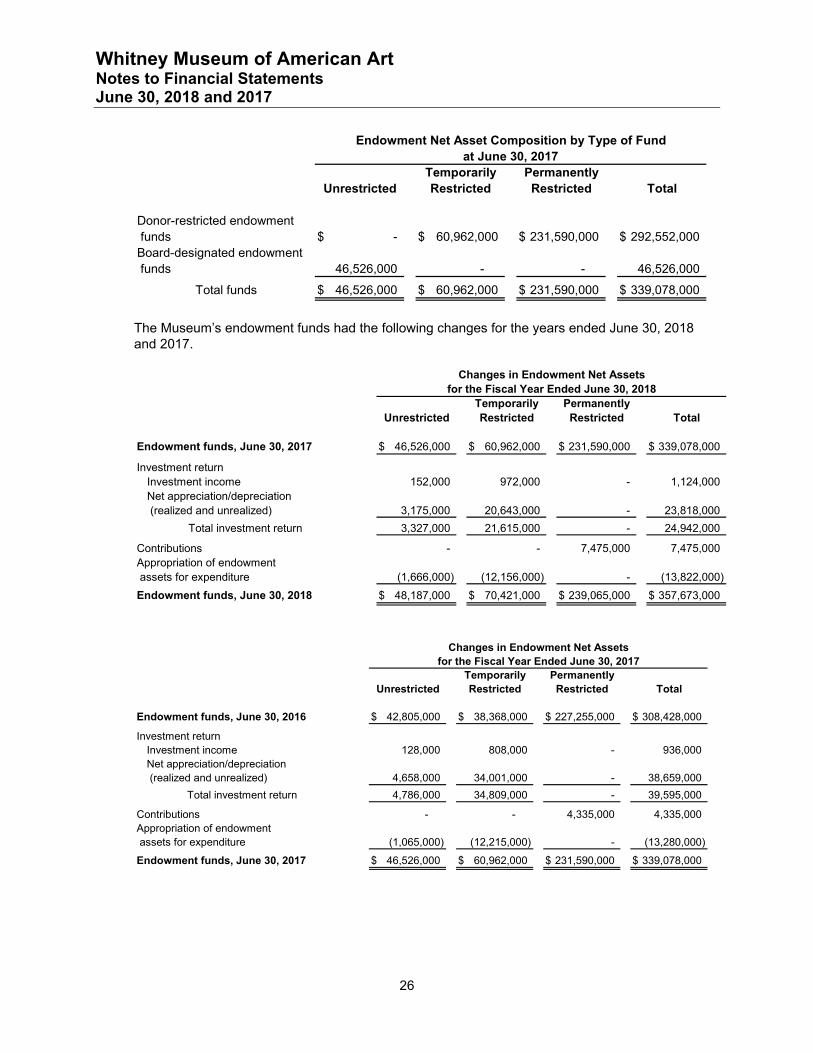
Temporarily PermanentlyUnrestricted Restricted Restricted Total
Donor-restricted endowment funds -$ 60,962,000$ 231,590,000$ 292,552,000$ Board-designated endowment funds 46,526,000 - - 46,526,000
Total funds 46,526,000$ 60,962,000$ 231,590,000$ 339,078,000$
Endowment Net Asset Composition by Type of Fundat June 30, 2017
The Museum’s endowment funds had the following changes for the years ended June 30, 2018 and 2017.
Temporarily PermanentlyUnrestricted Restricted Restricted Total
Endowment funds, June 30, 2017 46,526,000$ 60,962,000$ 231,590,000$ 339,078,000$
Investment returnInvestment income 152,000 972,000 - 1,124,000Net appreciation/depreciation (realized and unrealized) 3,175,000 20,643,000 - 23,818,000
Total investment return 3,327,000 21,615,000 - 24,942,000
Contributions - - 7,475,000 7,475,000Appropriation of endowment assets for expenditure (1,666,000) (12,156,000) - (13,822,000)
Endowment funds, June 30, 2018 48,187,000$ 70,421,000$ 239,065,000$ 357,673,000$
Changes in Endowment Net Assetsfor the Fiscal Year Ended June 30, 2018
Temporarily PermanentlyUnrestricted Restricted Restricted Total
Endowment funds, June 30, 2016 42,805,000$ 38,368,000$ 227,255,000$ 308,428,000$
Investment returnInvestment income 128,000 808,000 - 936,000Net appreciation/depreciation (realized and unrealized) 4,658,000 34,001,000 - 38,659,000
Total investment return 4,786,000 34,809,000 - 39,595,000
Contributions - - 4,335,000 4,335,000Appropriation of endowment assets for expenditure (1,065,000) (12,215,000) - (13,280,000)
Endowment funds, June 30, 2017 46,526,000$ 60,962,000$ 231,590,000$ 339,078,000$
Changes in Endowment Net Assetsfor the Fiscal Year Ended June 30, 2017
Whitney Museum of American Art Notes to Financial Statements June 30, 2018 and 2017
27
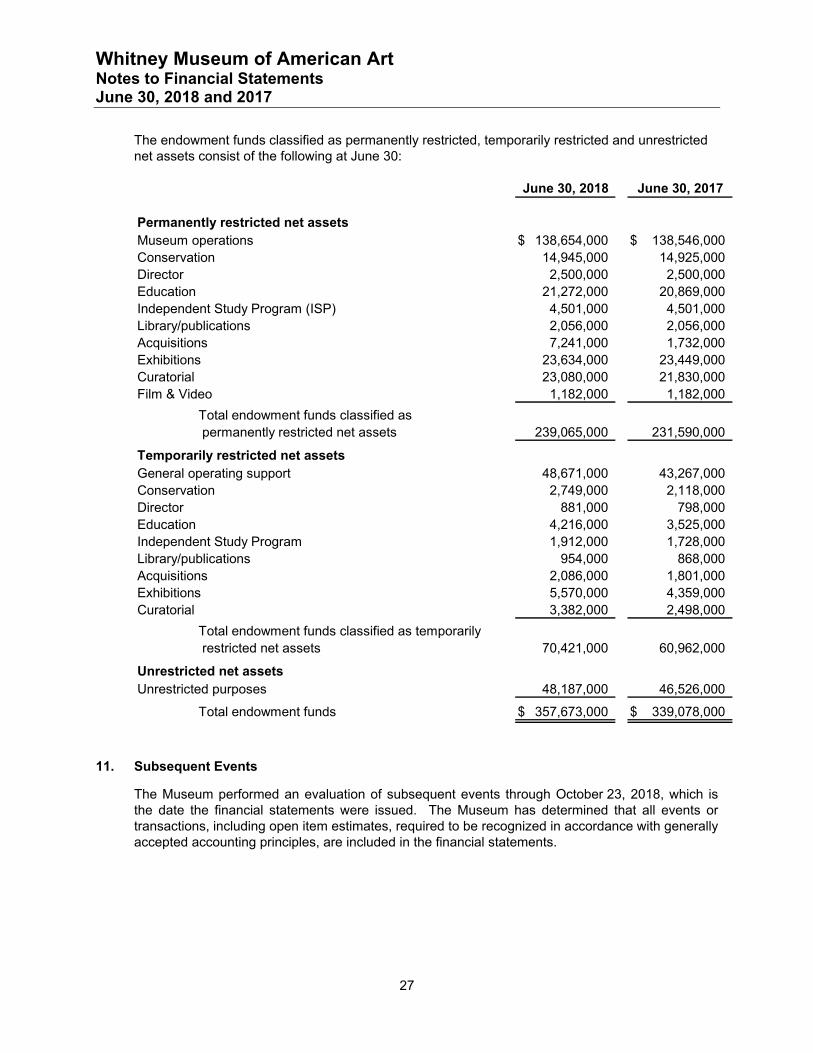
The endowment funds classified as permanently restricted, temporarily restricted and unrestricted net assets consist of the following at June 30:
June 30, 2018 June 30, 2017
Permanently restricted net assetsMuseum operations 138,654,000$ 138,546,000$ Conservation 14,945,000 14,925,000 Director 2,500,000 2,500,000 Education 21,272,000 20,869,000 Independent Study Program (ISP) 4,501,000 4,501,000 Library/publications 2,056,000 2,056,000 Acquisitions 7,241,000 1,732,000 Exhibitions 23,634,000 23,449,000 Curatorial 23,080,000 21,830,000 Film & Video 1,182,000 1,182,000
Total endowment funds classified as permanently restricted net assets 239,065,000 231,590,000
Temporarily restricted net assetsGeneral operating support 48,671,000 43,267,000 Conservation 2,749,000 2,118,000 Director 881,000 798,000 Education 4,216,000 3,525,000 Independent Study Program 1,912,000 1,728,000 Library/publications 954,000 868,000 Acquisitions 2,086,000 1,801,000 Exhibitions 5,570,000 4,359,000 Curatorial 3,382,000 2,498,000
Total endowment funds classified as temporarily restricted net assets 70,421,000 60,962,000
Unrestricted net assetsUnrestricted purposes 48,187,000 46,526,000
Total endowment funds 357,673,000$ 339,078,000$
11. Subsequent Events
The Museum performed an evaluation of subsequent events through October 23, 2018, which is the date the financial statements were issued. The Museum has determined that all events or transactions, including open item estimates, required to be recognized in accordance with generally accepted accounting principles, are included in the financial statements.