Embed Size (px)
Citation preview
An initiative of
Whitewater Township
May 2017
Does Place Matter?A Community Health Assessment
ACKNOWLEDGMENTSThis report was prepared by Hamilton County Public Health,
Department of Community Health Services.
Hamilton County Public Health Staff Timothy Ingram, Health Commissioner Craig Davidson, M.S., R.S. Assistant Health Commissioner David Carlson, MPH, Director of Epidemiology & Assessment Thomas Boeshart, MPH, Senior Epidemiologist Alexis Grimes Trotter, MPH, Epidemiologist Kevin Strobino, MPH, Epidemiologist Rebecca Stowe, M.Ed., MCHES Director of Health Promotion & Education Kim Chelf, MPH, CHES, Health Educator Mary Ellen Kramer, MPH, MCHES, Senior Health Educator Hannah Smith, MS, CHES, Health Educator Mike Samet, Public Information Officer
For questions regarding this report, contact: David Carlson Director of Epidemiology & Assessment Hamilton County Public Health 513-946-7933 [email protected]
For questions regarding WeTHRIVE!, contact: Hannah Smith Health Educator Hamilton County Public Health 513-946-7813 [email protected]
Special thanks to Whitewater Township for their contribution to this report.
All material in this report is in the public domain and may be used and reprinted without special permission. Citation as to source, however, is appreciated.

Introduction . . . . . . . . . . . . . . . . . . . . . . . . . . . . . . . . . . . . . . . . . . . . . . . 1Technical Notes . . . . . . . . . . . . . . . . . . . . . . . . . . . . . . . . . . . . . . . . . . . 2Community Context . . . . . . . . . . . . . . . . . . . . . . . . . . . . . . . . . . . . . . . 3Educational Attainment. . . . . . . . . . . . . . . . . . . . . . . . . . . . . . . . . . . . 5Economic Stability . . . . . . . . . . . . . . . . . . . . . . . . . . . . . . . . . . . . . . . . . 7Neighborhood and Built Environment . . . . . . . . . . . . . . . . . . . 10Healthcare and Health Outcomes . . . . . . . . . . . . . . . . . . . . . . . . 14Appendix . . . . . . . . . . . . . . . . . . . . . . . . . . . . . . . . . . . . . . . . . . . . . . . . .19
TABLE OF CONTENTS
Does Place Matter? A Community Health AssessmentPage 1
One of the fundamental principles of public health is that all people have a right to good health. Differences in health status - often called health inequities - are differences that are avoidable and oftentimes unfair. These inequities are, in large part, driven by determinants such as social, economic and environmental conditions, health behaviors, disease, injury and ultimately, mortality.
This report includes the following indicators and/or topics of relevance to health equity in Whitewater Township, Ohio:
z Community Context z Economic Stability z Educational Attainment z Neighborhood and Built Environment z Health and Healthcare Outcomes
This report provides a starting point to guide you in making lasting changes that will have a positive effect on your community for generations to come. Please read this report and then begin a conversation with community leaders about what you can do to improve the health of your community.
Understanding a problem is the first step to providing solutions. While we have a long way to go toward achieving health equity, a thorough review and subsequent understanding of the social determinants of health impacting residents can provide a road-map to better health for all, regardless of where one calls home.
Mortality, cancer and birth data note: “These data were provided by the Ohio Department of Health. The Department specifically disclaims responsibility for any analyses, interpretations or conclusions”.
INTRODUCTION
Does Place Matter? A Community Health Assessment Page 2
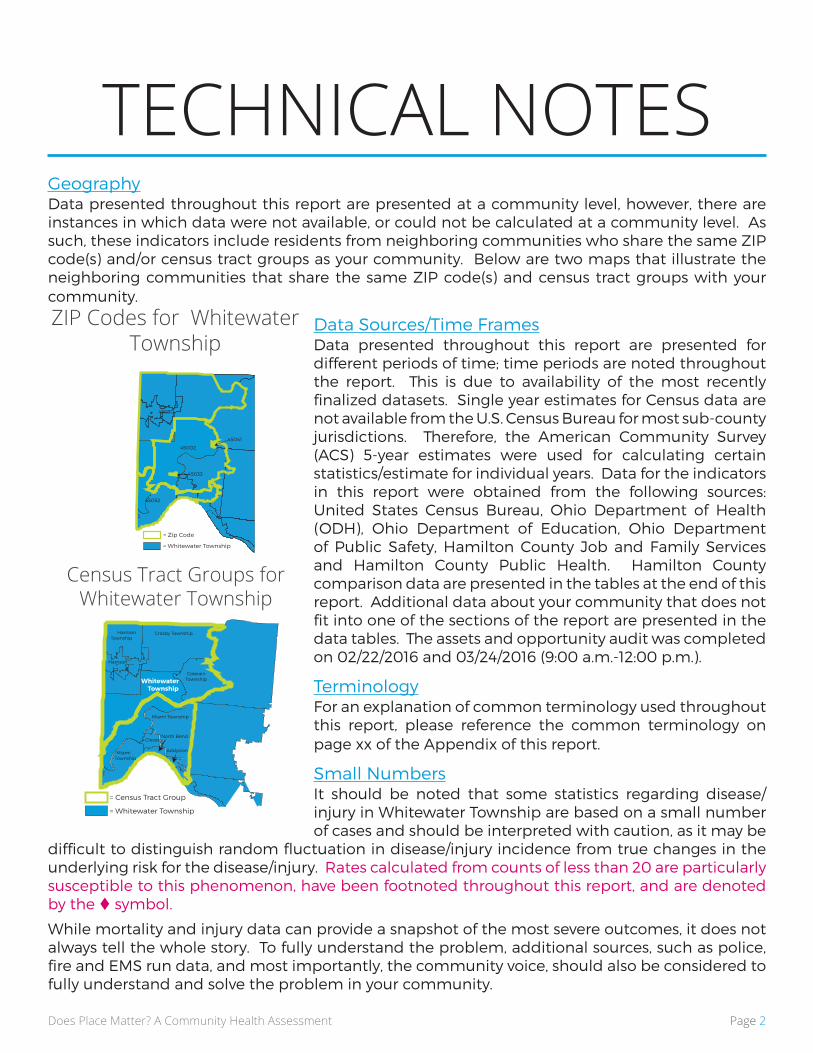
GeographyData presented throughout this report are presented at a community level, however, there are instances in which data were not available, or could not be calculated at a community level. As such, these indicators include residents from neighboring communities who share the same ZIP code(s) and/or census tract groups as your community. Below are two maps that illustrate the neighboring communities that share the same ZIP code(s) and census tract groups with your community.
Data Sources/Time FramesData presented throughout this report are presented for different periods of time; time periods are noted throughout the report. This is due to availability of the most recently finalized datasets. Single year estimates for Census data are not available from the U.S. Census Bureau for most sub-county jurisdictions. Therefore, the American Community Survey (ACS) 5-year estimates were used for calculating certain statistics/estimate for individual years. Data for the indicators in this report were obtained from the following sources: United States Census Bureau, Ohio Department of Health (ODH), Ohio Department of Education, Ohio Department of Public Safety, Hamilton County Job and Family Services and Hamilton County Public Health. Hamilton County comparison data are presented in the tables at the end of this report. Additional data about your community that does not fit into one of the sections of the report are presented in the data tables. The assets and opportunity audit was completed on 02/22/2016 and 03/24/2016 (9:00 a.m.-12:00 p.m.).
TerminologyFor an explanation of common terminology used throughout this report, please reference the common terminology on page xx of the Appendix of this report.
Small NumbersIt should be noted that some statistics regarding disease/injury in Whitewater Township are based on a small number of cases and should be interpreted with caution, as it may be
difficult to distinguish random fluctuation in disease/injury incidence from true changes in the underlying risk for the disease/injury. Rates calculated from counts of less than 20 are particularly susceptible to this phenomenon, have been footnoted throughout this report, and are denoted by the symbol.
While mortality and injury data can provide a snapshot of the most severe outcomes, it does not always tell the whole story. To fully understand the problem, additional sources, such as police, fire and EMS run data, and most importantly, the community voice, should also be considered to fully understand and solve the problem in your community.
TECHNICAL NOTES
Census Tract Groups for Whitewater Township
Miami Township
Miami Township
Addyston
Harrison Township
Crosby Township
Harrison
Colerain Township
ClevesNorth Bend
= Census Tract Group
= Whitewater Township
Whitewater Township
= Zip Code
= Whitewater Township
45041
45052
45030
45002
45033
ZIP Codes for Whitewater Township
Does Place Matter? A Community Health AssessmentPage 3
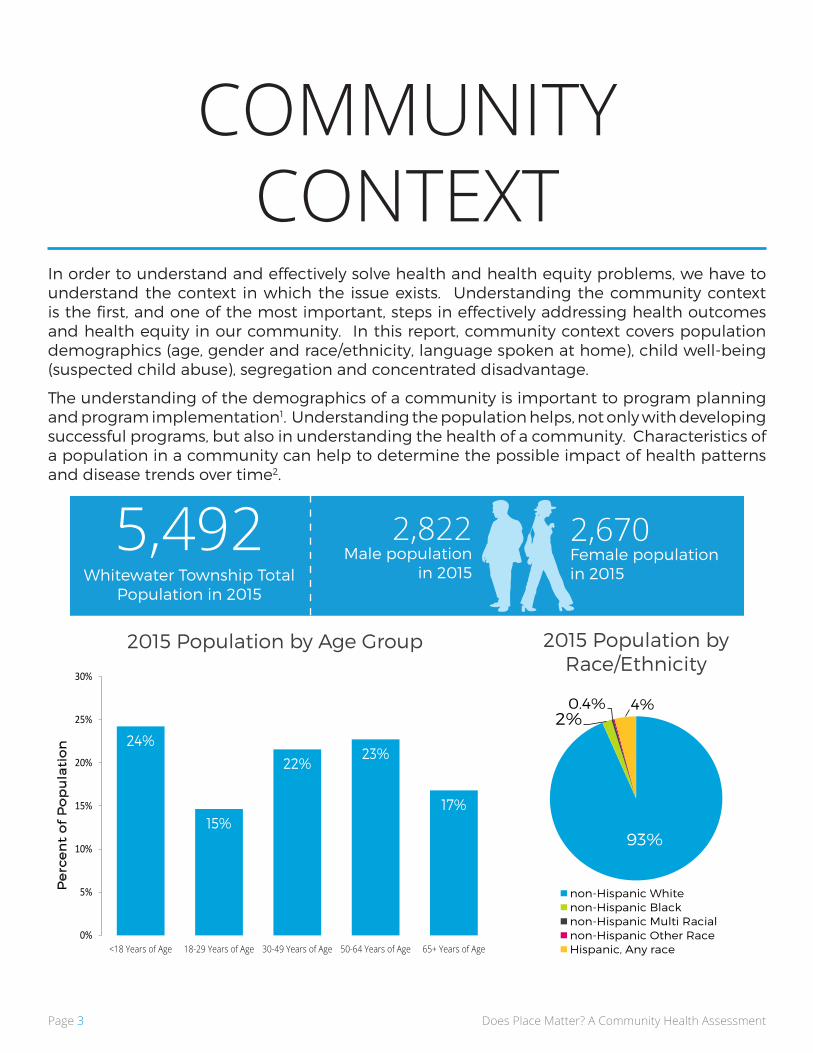
In order to understand and effectively solve health and health equity problems, we have to understand the context in which the issue exists. Understanding the community context is the first, and one of the most important, steps in effectively addressing health outcomes and health equity in our community. In this report, community context covers population demographics (age, gender and race/ethnicity, language spoken at home), child well-being (suspected child abuse), segregation and concentrated disadvantage.
The understanding of the demographics of a community is important to program planning and program implementation1. Understanding the population helps, not only with developing successful programs, but also in understanding the health of a community. Characteristics of a population in a community can help to determine the possible impact of health patterns and disease trends over time2.
COMMUNITY CONTEXT
2015 Population by Race/Ethnicity
Whitewater Township Total Population in 2015
5,492 2,822 2,670Female population in 2015
Male population in 2015
2015 Population by Age Group
93%
2%0.4% 4%
non-Hispanic Whitenon-Hispanic Blacknon-Hispanic Multi Racialnon-Hispanic Other RaceHispanic, Any race
24%
15%
22%23%
17%
0%
5%
10%
15%
20%
25%
30%
<18 Years of Age 18-29 Years of Age 30-49 Years of Age 50-64 Years of Age 65+ Years of Age
Pe
rce
nt
of
Po
pu
lati
on
Does Place Matter? A Community Health Assessment Page 4
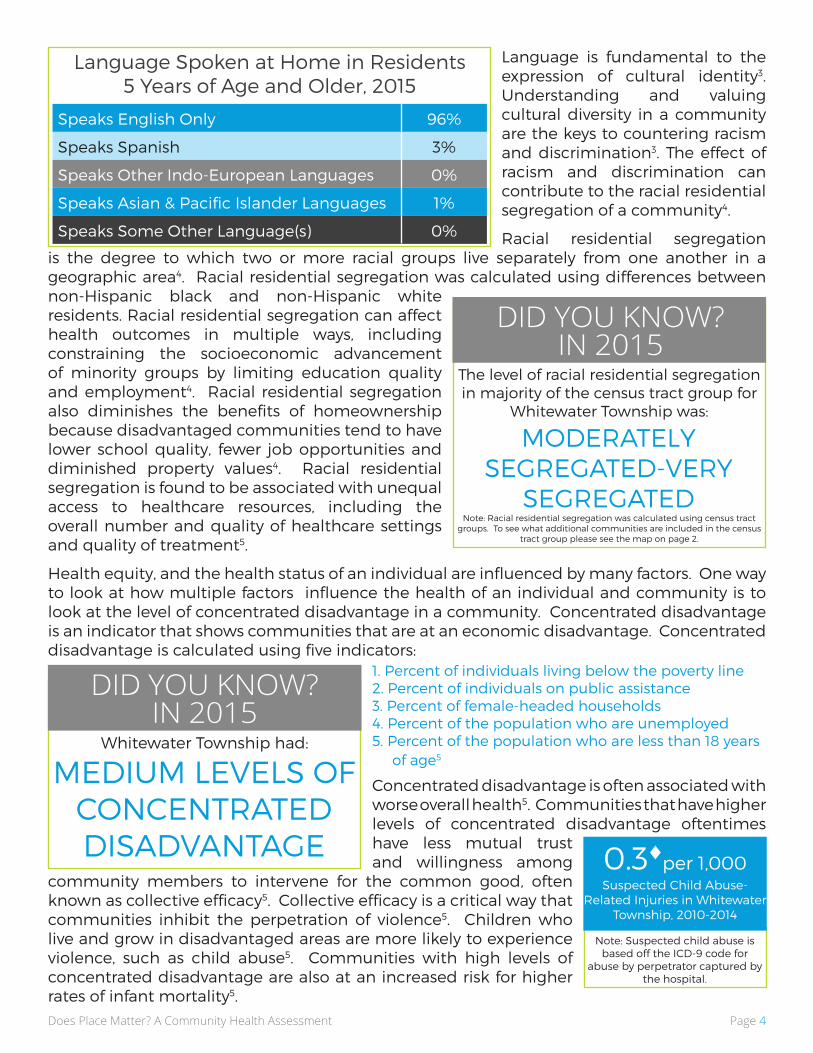
Language is fundamental to the expression of cultural identity3. Understanding and valuing cultural diversity in a community are the keys to countering racism and discrimination3. The effect of racism and discrimination can contribute to the racial residential segregation of a community4.
Racial residential segregation is the degree to which two or more racial groups live separately from one another in a geographic area4. Racial residential segregation was calculated using differences between non-Hispanic black and non-Hispanic white residents. Racial residential segregation can affect health outcomes in multiple ways, including constraining the socioeconomic advancement of minority groups by limiting education quality and employment4. Racial residential segregation also diminishes the benefits of homeownership because disadvantaged communities tend to have lower school quality, fewer job opportunities and diminished property values4. Racial residential segregation is found to be associated with unequal access to healthcare resources, including the overall number and quality of healthcare settings and quality of treatment5.
Health equity, and the health status of an individual are influenced by many factors. One way to look at how multiple factors influence the health of an individual and community is to look at the level of concentrated disadvantage in a community. Concentrated disadvantage is an indicator that shows communities that are at an economic disadvantage. Concentrated disadvantage is calculated using five indicators:
1. Percent of individuals living below the poverty line2. Percent of individuals on public assistance3. Percent of female-headed households4. Percent of the population who are unemployed5. Percent of the population who are less than 18 years of age5
Concentrated disadvantage is often associated with worse overall health5. Communities that have higher levels of concentrated disadvantage oftentimes have less mutual trust and willingness among
community members to intervene for the common good, often known as collective efficacy5. Collective efficacy is a critical way that communities inhibit the perpetration of violence5. Children who live and grow in disadvantaged areas are more likely to experience violence, such as child abuse5. Communities with high levels of concentrated disadvantage are also at an increased risk for higher rates of infant mortality5.
Speaks English Only 96%
Speaks Spanish 3%
Speaks Other Indo-European Languages 0%
Speaks Asian & Pacific Islander Languages 1%
Speaks Some Other Language(s) 0%
Language Spoken at Home in Residents 5 Years of Age and Older, 2015
The level of racial residential segregation in majority of the census tract group for
Whitewater Township was:
MODERATELY SEGREGATED-VERY
SEGREGATED
DID YOU KNOW? IN 2015
Note: Racial residential segregation was calculated using census tract groups. To see what additional communities are included in the census
tract group please see the map on page 2.
Whitewater Township had:
MEDIUM LEVELS OF CONCENTRATED DISADVANTAGE
DID YOU KNOW? IN 2015
Suspected Child Abuse-Related Injuries in Whitewater
Township, 2010-2014
0.3per 1,000
Note: Suspected child abuse is based off the ICD-9 code for
abuse by perpetrator captured by the hospital.

Does Place Matter? A Community Health AssessmentPage 5
Living in communities with higher levels of concentrated disadvantage can affect an individual’s level of educational attainment. Educational attainment is defined as the highest level of education that an individual has completed6. Educational attainment, like concentrated disadvantage, has an influence on the health of an individual. Higher educational attainment, such as a bachelor’s degree or higher, is often associated with better health7. Educational attainment measured in this report is the highest level of educational attainment or highest
degree earned for Whitewater Township residents who are 25 years of age and older.
High quality early childhood education can have significant long-term
benefits for children8. Children who participate in established early childhood interventions, particularly low-income children, oftentimes have better educational and social outcomes9. Children who are enrolled in pre-school programs are often more likely to continue with schooling and graduate from high school10.
Graduation from high school, or the equivalent, is required for any individual who seeks to obtain a college degree. Completing college, and obtaining a higher level of educational attainment contributes to an individual’s occupational status and income8. Increasing the educational attainment of an individual can have lasting impacts on the health of an individual over the course of his/her lifetime9.
EDUCATIONAL ATTAINMENT
Highest level of educational attainment among Whitewater Township residents
25 years of age and older, 2011-2015
Note: Percentages do not equal 100% due to other educational attainment options (e.g., associates degree) and trade school.
Total Population Enrolled in School 1,281
Enrolled in Nursery/Pre-School 4%
Enrolled in Elementary & Middle School (K-8th Grade) 52%
Enrolled in High School (9-12th Grade) 35%
Enrolled in College (Undergraduate & Graduate School) 9%
School Enrollment by Level of Schooling, 2015
public school district that serves children in Whitewater Township
There is
ONE
DID YOU KNOW?
19%
40%
12%
0%
5%
10%
15%
20%
25%
30%
35%
40%
45%
Less than HighSchool Graduate
High SchoolGraduate
Bachelor's Degreeor Higher
Does Place Matter? A Community Health Assessment Page 6
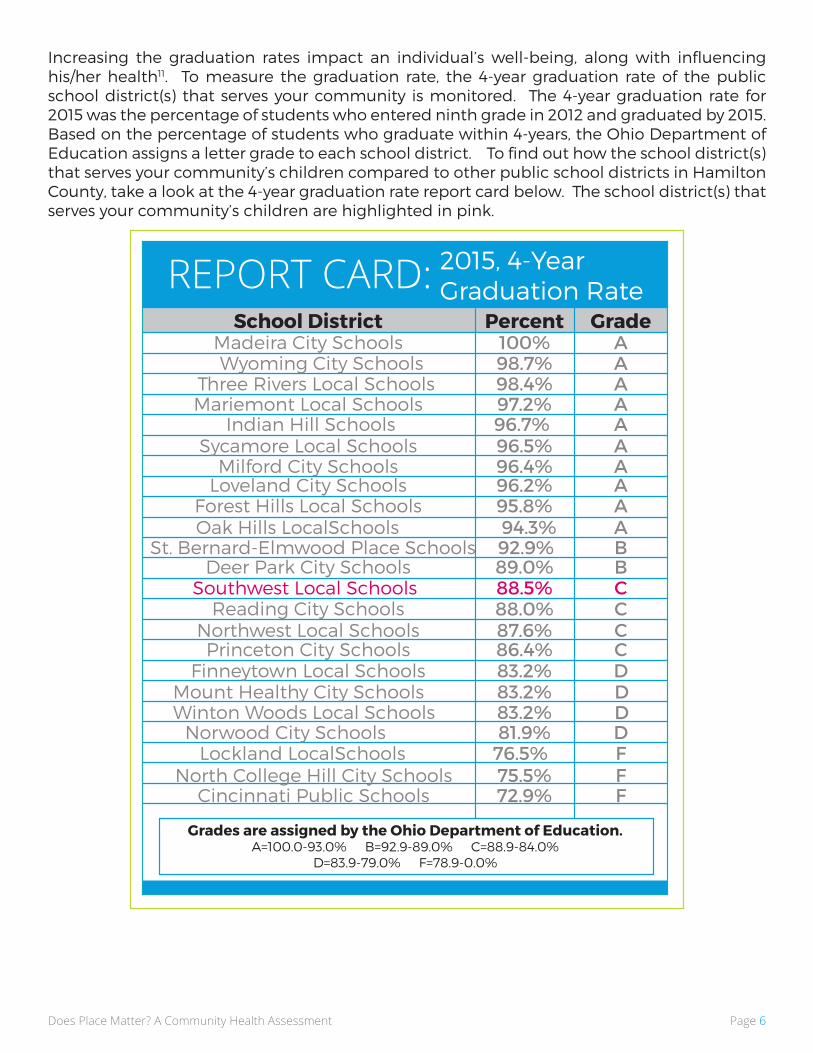
Increasing the graduation rates impact an individual’s well-being, along with influencing his/her health11. To measure the graduation rate, the 4-year graduation rate of the public school district(s) that serves your community is monitored. The 4-year graduation rate for 2015 was the percentage of students who entered ninth grade in 2012 and graduated by 2015. Based on the percentage of students who graduate within 4-years, the Ohio Department of Education assigns a letter grade to each school district. To find out how the school district(s) that serves your community’s children compared to other public school districts in Hamilton County, take a look at the 4-year graduation rate report card below. The school district(s) that serves your community’s children are highlighted in pink.
Cincinnati Public Schools 72.9% FNorth College Hill City Schools 75.5% F
Lockland LocalSchools 76.5% FNorwood City Schools 81.9% D
Winton Woods Local Schools 83.2%Mount Healthy City Schools 83.2% D
Finneytown Local Schools 83.2% DPrinceton City Schools 86.4% C
Northwest Local Schools 87.6% CReading City Schools 88.0% C
Southwest Local Schools 88.5% CDeer Park City Schools 89.0% B
St. Bernard-Elmwood Place Schools 92.9% BOak Hills LocalSchools 94.3% AForest Hills Local Schools 95.8% A
Loveland City Schools 96.2% AMilford City Schools 96.4% A
Sycamore Local Schools 96.5% A Indian Hill Schools 96.7% A
Mariemont Local Schools 97.2% AThree Rivers Local Schools 98.4% A
Wyoming City Schools 98.7% AMadeira City Schools 100% A
School District Percent Grade
Grades are assigned by the Ohio Department of Education.A=100.0-93.0% B=92.9-89.0% C=88.9-84.0%
D=83.9-79.0% F=78.9-0.0%
2015, 4-Year Graduation RateREPORT CARD:
D
Does Place Matter? A Community Health AssessmentPage 7
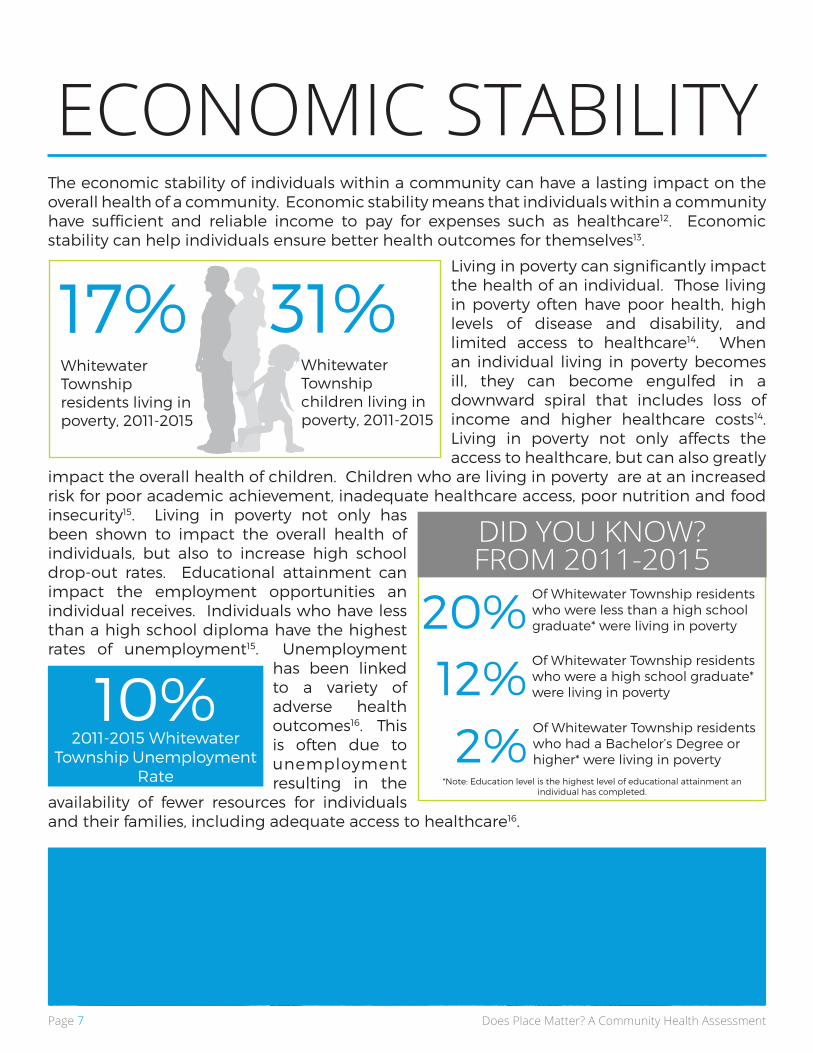
The economic stability of individuals within a community can have a lasting impact on the overall health of a community. Economic stability means that individuals within a community have sufficient and reliable income to pay for expenses such as healthcare12. Economic stability can help individuals ensure better health outcomes for themselves13.
Living in poverty can significantly impact the health of an individual. Those living in poverty often have poor health, high levels of disease and disability, and limited access to healthcare14. When an individual living in poverty becomes ill, they can become engulfed in a downward spiral that includes loss of income and higher healthcare costs14. Living in poverty not only affects the access to healthcare, but can also greatly
impact the overall health of children. Children who are living in poverty are at an increased risk for poor academic achievement, inadequate healthcare access, poor nutrition and food insecurity15. Living in poverty not only has been shown to impact the overall health of individuals, but also to increase high school drop-out rates. Educational attainment can impact the employment opportunities an individual receives. Individuals who have less than a high school diploma have the highest rates of unemployment15. Unemployment
has been linked to a variety of adverse health outcomes16. This is often due to unemployment resulting in the
availability of fewer resources for individuals and their families, including adequate access to healthcare16.
ECONOMIC STABILITY
31%17%Whitewater Township children living in poverty, 2011-2015
Whitewater Township residents living in poverty, 2011-2015
2%12%
20%
Of Whitewater Township residents who had a Bachelor’s Degree or higher* were living in poverty
Of Whitewater Township residents who were a high school graduate* were living in poverty
Of Whitewater Township residents who were less than a high school graduate* were living in poverty
*Note: Education level is the highest level of educational attainment an individual has completed.
DID YOU KNOW? FROM 2011-2015
10%2011-2015 Whitewater
Township Unemployment Rate

Does Place Matter? A Community Health Assessment Page 8
Employment oftentimes means more than just a steady job in a safe working environment, or a paycheck; employment can provide numerous benefits that are critical for individuals and families to maintain proper health17.
Many families find that they need two wage earners to pay rent/mortgage, or to maintain the family budget18. When both parents are working, the family has an increased income which can lead to fewer financial stresses18. One financial strain that a family can e x p e r i e n c e is known as housing-cost burden. H o u s i n g - c o s t burden is when families or individuals
spend 30 percent or more of their income on housing costs19. Families and individuals who spend more than 30 percent of their income on housing costs are considered housing cost-burdened and may have difficulty affording necessities such as food, clothing, transportation and medical care20.
Another way to measure economic stability of individuals and a community, is to look at the per-capita income within that community. Per-capita income, more commonly known as income per person, is the average income received in the past 12 months for every man, woman, and child21.
Per-capita income is often used as an indicator of a community’s economic health22. Median household income, another measure of a community’s economic stability, is the household income that divides the income distribution into
two equal groups23. Communities with higher median household incomes are more likely to have a higher percentage of residents with higher levels of educational attainment and lower unemployment rates24. Higher employment rates can often lead to better access to healthcare and better health outcomes for the residents of a community24.
There are, however, instances in which the level of income a family receives may make it difficult to afford necessities. In these instances, the family may qualify for cash assistance through Ohio Works First (OWF). Ohio Works First is the financial assistance portion of the State’s Temporary Assistance to Needy Families (TANF) program, which provides cash benefits to needy families for up to 36 months25. Ultimately, OWF allows
Average per-capita income in Whitewater
Township, 2011-2015
$22,326
Average median household income
in Whitewater Town-ship, 2011-2015
$43,494
Individuals who received cash assistance in Hamilton County from October 2014 - November
2015 and lived in the ZIP codes for Whitewater Township
Note: To see what additional communities are included in the ZIP code please see the map on page 2.
1.1%
Percent of Families by Number of Parents
Working, 2011-2015
44%
44%
12%
Both Parents working1 Parent(s) workingNo parent(s) working
29%Of Whitewater Township residents spend 30% or more of their monthly income on housing.
DID YOU KNOW? FROM 2011-2015

Does Place Matter? A Community Health AssessmentPage 9
for families to work toward financial stability.
Quality child care enables parents to work or go to school while providing young children with the early childhood education experiences needed for healthy development26. Financial constraints on the family can limit the accessibility of child care for low income families. To help alleviate the burden this can place on families, subsidized child care is made available to help cover part of the cost of child care for children of eligible caretakers/parents who are either working or in school27. Subsidized child care is often linked to improved employment outcomes for parents, and when parents do better economically, their children do better as well26.
Access to healthy foods is an important factor in the overall health of a community, as poor food access can cause increased risk for malnourishment and other adverse health outcomes. To help low income families and individuals, the U.S. Department of Agriculture administers the Supplemental Nutrition Assistance Program (SNAP), which was formerly known as the Food Stamp Program. One way to ensure that food is accessible to children is through the participation in the National School Lunch and Breakfast program. The National School Lunch and Breakfast Program is a federally assisted meal program that can operate in public and nonprofit private schools and residential child care institutions to provide nutritionally-balanced, low-cost or free lunches to children each school day28.
licensed child care center in Whitewater Township
There is
1licensed child care center in Whitewater
Township that serves children in publicly funded child care
There is
1DID YOU KNOW?
Of individuals who received food stamps in Hamilton
County from October 2014 - November 2015 lived in the ZIP codes for Whitewater Township
Note: To see what additional communities are included in the ZIP code please see the map on page 2.
1.3%
Of all students in participating schools in the school district that serves Whitewater Township had free and reduced lunches.
Note: To see individual schools and the school district overall, please see page vii of the appendix.
37.5%
Stores in Whitewater
Township accept SNAP as a form
of payment.
3

Does Place Matter? A Community Health Assessment Page 10
The built environment is the man-made space where individuals live, work, and play on a day-to-day basis, which includes buildings and spaces that are created or modified29. The neighborhood and built environment of a community can affect the potential for injuries related to pedestrian and motor vehicle crashes, and impact the ability of individuals in a community to exercise29. The way a community is built can affect the health of its residents.
The neighborhood and built environment of a community can include the incorporation of public transportation. Public transportation can help to reduce motor vehicle crashes that can result in injury or even death30.
Motor vehicle crashes are a leading cause of death in the United States31. Motor vehicle crashes, particularly those that involve pedestrians, are a significant public health concern.
NEIGHBORHOOD & BUILT ENVIRONMENT
parks in Whitewater Township
For a complete list of all the parks in your community please reference page vii of the appendix.
There are
EIGHTplaygrounds in Whitewater Township
SIXThere are
DID YOU KNOW?
Number of Motor Vehicle Crashes in Whitewater Township,
2011-2015
1,923
Age-Adjusted Motor Vehicle Accident Injury Rate in Whitewater
Township, 2010-2014
1,099.2 per 100,000
public transportation in Whitewater Township
There is
NO
DID YOU KNOW?
1%
Percent of car crashes in Whitewater Township were fatal, 2011-2015

Does Place Matter? A Community Health AssessmentPage 11
Motor vehicle crashes can happen to anyone, however, new teen drivers are at a high risk for causing motor vehicle crashes31. Injuries due to motor vehicle crashes are a leading cause of death among children in the United States, many of which are preventable32.
The built environment, including road infrastructure and pedestrian infrastructure (side walks), have a strong influence on not only motor vehicle
safety, but also pedestrian safety. Pedestrian injuries are injuries in which a person (not in a vehicle, or riding a bicycle or motorcycle) was struck by a car, truck, SUV, or van33. Built environmental features at intersections and crosswalks can have an impact on p e d e s t r i a n -
related injuries and motor vehicle crashes that involve a pedestrian34. The infrastructure of roads in a community can be associated with pedestrian related injuries and motor vehicle crashes34.
The built environment can also impact the rate of motor vehicle crashes that involve bicyclists. Bicycle related injuries are injuries in which an individual riding a bicycle collided, lost control and collided or crashed into either a moving vehicle or a pedestrian33. When communities provide facilities such
as sidewalks, crosswalks, and bike lanes, it gives residents the option to choose how they want to travel34. Not installing these types of facilities can force residents to
travel by their own personal cars or engage in unsafe walking and biking practices34.
Age-Adjusted Pedestrian Injury Rate in Whitewater Township, 2010-2014
52.5 per 100,000
Age-Adjusted Bicycle Injury Rate in Whitewater Township, 2010-2014
121.8 per 100,000
Percent of motor vehicle crashes in Whitewater Township that
involved a pedestrian, 2011-2015
1%
Percent of Motor Vehicle Crashes Involving a Teen
Driver (15-17 years), 2011-2015
5%
Motor vehicle crashes in Whitewater Township that
involved a bicyclist, 2011-2015
0%
Of Motor Vehicle Crashes in Whitewater Township Involved a Child as a Driver, Passenger
or Pedestrian*Note: Child is anyone younger than 18 years of age
10%
DID YOU KNOW? Between 2011-2015

Does Place Matter? A Community Health Assessment Page 12
The built environment can also influence the crime committed in a community. Zoning, street designs, housing, location of public transit and land use shape the built environment in
ways that can increase or reduce crime35. Communities that have high levels of violent crime may also increase the risk of residents experiencing violence36. Violent crime is composed of four offenses: murder and non-negligent manslaughter, rape, robbery, and aggravated
assault37. Homicides, also known as murders, are a serious public health problem and can have lasting effects on communities. Homicide is an extreme outcome of the broader public health problem of interpersonal violence38. Intentional injury is another form of interpersonal v i o l e n c e . Intentional injury is the type of injury that is sustained due to knowingly inflicting harm
to oneself or another individual. Violence, such as intentional injuries and homicides, can be fostered by the built environment by promoting feelings of alienation and isolation or by sending signals to potentially violent individuals that their actions will not be observed39. However, the design of the built environment can also help to deter crime.
There are multiple factors associated with the built environment that can influence drug use and drug overdoses40. Neighborhood deterioration can also have an influence on drug usage
and overdose40. A community with d e t e r i o r a t i n g neighborhoods can lack empowerment and collective efficacy, a critical way that communities inhibit the perpetration of violence40,5. Residents who are living in a
deteriorating built environment may experience an increase in psychological distress which may encourage an increase in risk taking and more dangerous drug abuse activity40.
Age-Adjusted Intentional Injury Rate in Whitewater
Township, 2010-2014
1,217.3 per 100,000
28.9per 100,000
Age-Adjusted Intentional Injury Mortality Rate in Whitewater
Township, 2010-2014
Age-Adjusted Homicide Rate in Whitewater Township, 2011-2015
4.6per 100,000
Age-Adjusted Overdose-Related Injury Rate in
Whitewater Township, 2010-2014
587.9 per 100,000
Age-Adjusted Firearm- Related Injury Rate in Whitewater
Township, 2010-2014
43.5
per 100,000
violent crimes committed in Whitewater Township.
In 2014, there were
15DID YOU KNOW?
Age-Adjusted Drug Overdose Mortality Rate in Whitewater
Township, 2011-2015
74.4
per 100,000
Of motor vehicle crashes in Whitewater Township
were drug related.1%
DID YOU KNOW? From 2011 - 2015
Of motor vehicle crashes in Whitewater Township
were alcohol related.3%
Does Place Matter? A Community Health AssessmentPage 13
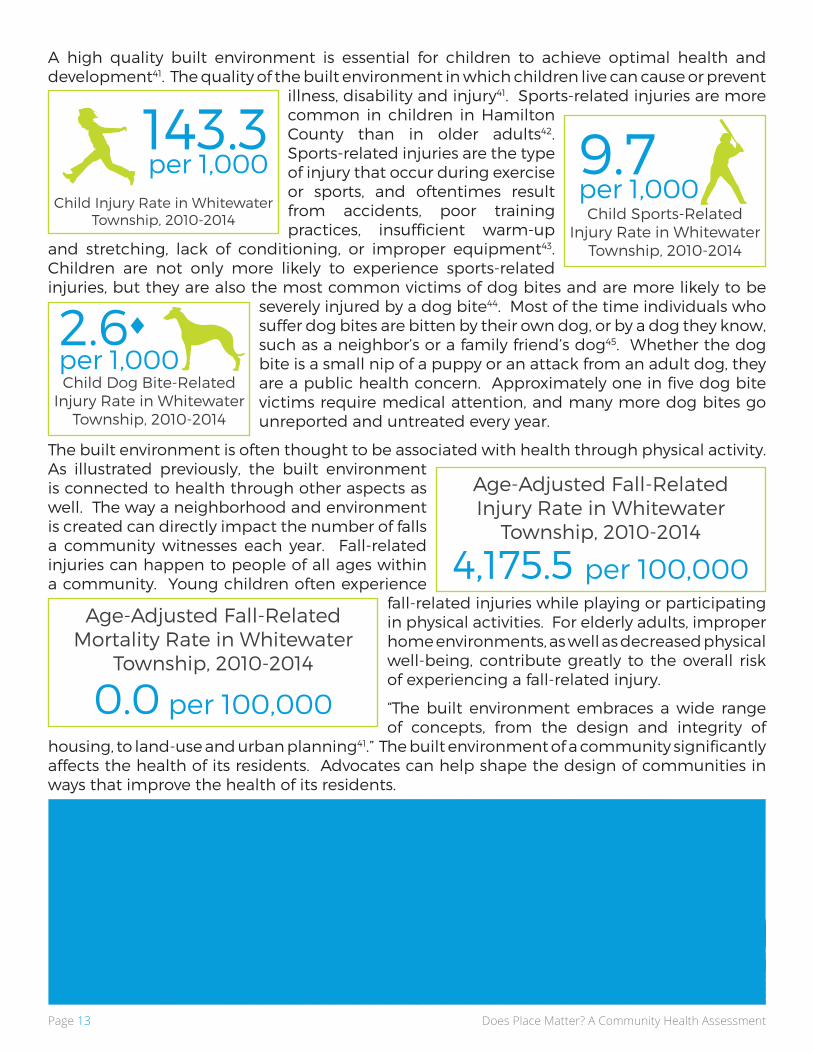
A high quality built environment is essential for children to achieve optimal health and development41. The quality of the built environment in which children live can cause or prevent
illness, disability and injury41. Sports-related injuries are more common in children in Hamilton County than in older adults42. Sports-related injuries are the type of injury that occur during exercise or sports, and oftentimes result from accidents, poor training practices, insufficient warm-up
and stretching, lack of conditioning, or improper equipment43. Children are not only more likely to experience sports-related injuries, but they are also the most common victims of dog bites and are more likely to be
severely injured by a dog bite44. Most of the time individuals who suffer dog bites are bitten by their own dog, or by a dog they know, such as a neighbor’s or a family friend’s dog45. Whether the dog bite is a small nip of a puppy or an attack from an adult dog, they are a public health concern. Approximately one in five dog bite victims require medical attention, and many more dog bites go unreported and untreated every year.
The built environment is often thought to be associated with health through physical activity. As illustrated previously, the built environment is connected to health through other aspects as well. The way a neighborhood and environment is created can directly impact the number of falls a community witnesses each year. Fall-related injuries can happen to people of all ages within a community. Young children often experience
fall-related injuries while playing or participating in physical activities. For elderly adults, improper home environments, as well as decreased physical well-being, contribute greatly to the overall risk of experiencing a fall-related injury.
“The built environment embraces a wide range of concepts, from the design and integrity of
housing, to land-use and urban planning41.” The built environment of a community significantly affects the health of its residents. Advocates can help shape the design of communities in ways that improve the health of its residents.
Child Injury Rate in Whitewater Township, 2010-2014
143.3 per 1,000
Child Sports-Related Injury Rate in Whitewater
Township, 2010-2014
9.7 per 1,000
Child Dog Bite-Related Injury Rate in Whitewater
Township, 2010-2014
2.6 per 1,000
Age-Adjusted Fall-Related Injury Rate in Whitewater
Township, 2010-2014
4,175.5 per 100,000
Age-Adjusted Fall-Related Mortality Rate in Whitewater
Township, 2010-2014
0.0 per 100,000
Does Place Matter? A Community Health Assessment Page 14
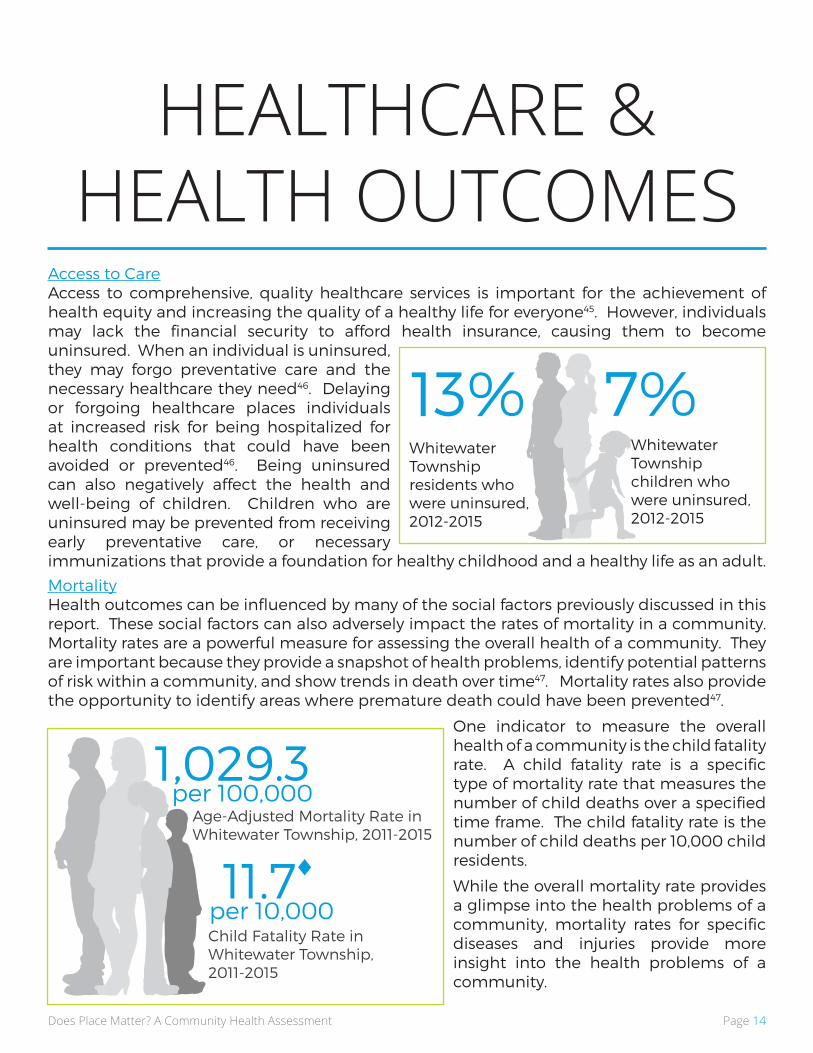
Access to CareAccess to comprehensive, quality healthcare services is important for the achievement of health equity and increasing the quality of a healthy life for everyone45. However, individuals may lack the financial security to afford health insurance, causing them to become uninsured. When an individual is uninsured, they may forgo preventative care and the necessary healthcare they need46. Delaying or forgoing healthcare places individuals at increased risk for being hospitalized for health conditions that could have been avoided or prevented46. Being uninsured can also negatively affect the health and well-being of children. Children who are uninsured may be prevented from receiving early preventative care, or necessary immunizations that provide a foundation for healthy childhood and a healthy life as an adult.
MortalityHealth outcomes can be influenced by many of the social factors previously discussed in this report. These social factors can also adversely impact the rates of mortality in a community. Mortality rates are a powerful measure for assessing the overall health of a community. They are important because they provide a snapshot of health problems, identify potential patterns of risk within a community, and show trends in death over time47. Mortality rates also provide the opportunity to identify areas where premature death could have been prevented47.
One indicator to measure the overall health of a community is the child fatality rate. A child fatality rate is a specific type of mortality rate that measures the number of child deaths over a specified time frame. The child fatality rate is the number of child deaths per 10,000 child residents.
While the overall mortality rate provides a glimpse into the health problems of a community, mortality rates for specific diseases and injuries provide more insight into the health problems of a community.
HEALTHCARE & HEALTH OUTCOMES
7% 13%Whitewater Township children who were uninsured, 2012-2015
Whitewater Township residents who were uninsured, 2012-2015
1,029.3 per 100,000
Age-Adjusted Mortality Rate in Whitewater Township, 2011-2015
Child Fatality Rate in Whitewater Township, 2011-2015
11.7 per 10,000

Does Place Matter? A Community Health AssessmentPage 15
Chronic Obstructive Pulmonary Disease (COPD)Chronic obstructive pulmonary disease, or COPD, refers to the group of diseases that cause airflow blockage and breathing-related problems that include such diseases as emphysema, chronic bronchitis and in some cases asthma48. COPD is the third leading cause of death in the Unites States with more than 11 million people having been diagnosed with COPD, with an estimated 24 million people who may have the disease without even knowing it49.
Heart DiseaseHeart Disease, like COPD, when left untreated can cause death. Heart disease is the general term that refers to several types of heart conditions. The most common type of heart disease in the United States is coronary artery disease, which can cause heart attacks and heart failure50. Heart disease can be caused by multiple reasons, including diabetes51.
DiabetesDiabetes is a disease that causes the blood glucose (sugar) levels in the body to be higher than normal51. This is caused when your body is not able to make enough insulin (used to break down the sugar) or cannot use its own insulin as it should51. Diabetes is the seventh leading cause of death in the United States51.
Cancer The second leading cause of death in the United States is cancer, and many cancer deaths can be prevented52. Cancer is the name that is given to describe over 100 different types of diseases53. While there are many different types of cancer, all cancers start the same way, and when left untreated can cause illness and even death53.
Age-Adjusted Heart Disease Mortality Rate in Whitewater Township, 2011-2015Age-Adjusted COPD
Mortality Rate in Whitewater Township,
2011-2015
Age-Adjusted Cancer Mortality Rate in
Whitewater Township, 2011-2015
Age-Adjusted Diabetes Mortality Rate in Whitewater Township, 2011-2015
599.2 per 100,000
86.8 per 100,000
219.1 per 100,000
14.9
per 100,000

Does Place Matter? A Community Health Assessment Page 16
Cancer is a complex group of diseases with many possible causes, however, lifestyle factors such as lack of physical activity and tobacco usage can cause certain types of cancer54. The majority of lung cancer cases are caused by smoking cigarettes55. Smoking cigarettes can cause cancer almost anywhere in your body including the liver, colon and rectum, and the mouth (often referred to as oral cancer)55. Heavy alcohol drinking can also increase the risk an individual has for developing cancer56. Long-term alcohol use has been linked to an increased risk for liver cancer56. Regular, heavy alcohol use can damage the liver, leading to inflammation, which can increase the risk for liver cancer56. Some types of cancer can run in certain families, and having a family history of certain types of cancer, such as breast cancer, can increase the risk an individual has for developing certain types of cancer, however, most cancers are not directly linked to the genes we inherit from our parents54,57. While cancer is a serious health issue, many of the new cancer cases can be reduced and many cancer deaths can be prevented58. Early and regular screenings for certain types of cancer (e.g., cervical, colorectal and breast cancers), as recommended, can help prevent disease through early diagnosis and treatment58. Maintaining a healthy lifestyle, such as avoiding tobacco and maintaining a healthy weight, can reduce the risk of developing cancer58.
Age-Adjusted Oral Cancer Mortality Rate in Whitewater Township, 2011-2015
Age-Adjusted Lung Cancer Mortality Rate in Whitewater Township, 2011-2015
Age-Adjusted Liver Cancer Mortality Rate in Whitewater Township, 2011-2015
Age-Adjusted Female Breast Cancer Mortality Rate in Whitewater Township, 2011-2015
Age-Adjusted Colon & Rectal Cancer Mortality Rate in Whitewater Township, 2011-2015
Age-Adjusted Oral Cancer Incidence Rate in Whitewater Township, 2009-2013
Age-Adjusted Lung Cancer Incidence Rate in Whitewater Township, 2009-2013
Age-Adjusted Liver Cancer Incidence Rate in Whitewater Township, 2009-2013
Age-Adjusted Female Breast Cancer Incidence Rate in Whitewater Township, 2009-2013
Age-Adjusted Colon & Rectal Cancer Incidence Rate in Whitewater Township, 2009-2013
2.7
per 100,000
75.2 per 100,000
103.6 per 100,000
12.2
per 100,000
6.5
per 100,000
7.2 per 100,000
17.4 per 100,000
12.1per 100,000
28.0 per 100,000
35.3 per 100,000

Does Place Matter? A Community Health AssessmentPage 17
STD/HIV/Hepatitis CRisky health behaviors can not only place an individual at risk for certain types of cancer, but also increase the risk for other diseases. Syphilis is a disease that an individual can be at an increased risk to acquire through risky sexual behaviors. Syphilis is a sexually transmitted disease that can have very serious complications when left untreated59. Syphilis can be
spread from person to person by having unprotected sex with an infected individual, but it can also be spread from an infected mother to her unborn baby59.
Risky sexual behavior not only places individuals at a risk for exposure to syphilis, but also increases the risk for Human Immunodeficiency Virus (HIV) infection. HIV is the virus that when not treated, can lead to Acquired Immunodeficiency Syndrome (AIDS)60. HIV is most commonly transmitted
through risky sexual behaviors, but can also be transmitted from sharing a needle or syringe with an individual who is HIV positive61.
Sharing needles or other equipment that is used to inject drugs can also increase the risk an individual has to become infected with hepatitis C62. Hepatitis C is a virus that can result in long-term health problems, including death62. The majority of individuals who are infected with hepatitis C may not be aware of their infection because they do not feel sick62. The best way an individual has to reduce their risk for syphilis, HIV and hepatitis C is to avoid the behaviors that can spread the diseases, like risky sexual behavior, and sharing needles while injecting drugs.
Infant MortalityWhile the mortality rates presented thus far provide a snapshot of health issues that impact communities, infant mortality is a very specific type of mortality that is often considered to be one of the most important indicators of the overall health and well-being of a community.
This is because factors that affect the health of the community as a whole can also greatly impact the rate at which infants die within a community63. Infant mortality is often associated with other factors such as maternal health, access to and quality of healthcare, and socioeconomic conditions. Infant mortality is defined by the Centers for Disease Control and Prevention (CDC) as the “death of a baby before his or her first
birthday63.” An infant mortality rate is the number of infant deaths for every 1,000 live births during a period of time. While infant mortality is one of the most important health indicators for a community, an infant mortality rate is highly sensitive to changes in the number of live births within a community. This is often the case when the size of the population within a given community is relatively small. For example, a community that experiences several infant deaths during a given year, but also only saw a small number of births during that same year, will have an elevated infant mortality rate. Also, when the typical number of infant deaths in a community is small (fewer than 20 deaths), it may be difficult to distinguish a
Rate of Newly Diagnosed HIV Cases in Whitewater
Township, 2011-2015
0.0 per 100,000
Hepatitis C Rate in Whitewater Township,
2011-2015
203.9 per 100,000
Syphilis Rate in Whitewater Township, 2011-2015
3.6
per 100,000
Infant Mortality Rate in Whitewater Township, 2011-2015
6.2 per 1,000

Does Place Matter? A Community Health Assessment Page 18
random fluctuation in the number of deaths from true changes in the underlying risk for the community. This is because small changes in the number of deaths may result in large changes in the corresponding infant mortality rate. Therefore, while it is important to show if infant deaths are occurring within a community, infant mortality rates derived from a small number (fewer than 20) of births and/or deaths should be interpreted with caution.
Quality of LifeMany of the health outcomes and socioeconomic indicators presented throughout the report can have lasting effects on an individual’s quality of life and can lead to having difficulty doing everyday tasks. One way to measure the quality of life of an individual is to look at independent living difficulties. Individuals with independent living difficulties are the percent of individuals in a community, 18 years of age and older who, due to a physical, mental, or emotional problem, have difficulty doing errands alone such as visiting a doctor’s office or shopping for necessities64.
Life ExpectancyThroughout this report, various health outcomes, and socioeconomic indicators have been presented. Each is important and can impact the overall health of a community in different ways. However, all of the indicators work together to collectively impact the average
life expectancy of an individual. Average life expectancy is the estimated number of years an individual would expect to live, if they were born today, based on mortality statistics. Life expectancy is an important indicator of the overall health of a community when compared to other areas. This is because life expectancy summarizes the mortality
patterns that prevail across all age groups65. Factors such as access to healthcare, healthy lifestyle, and disease occurrence all have an impact on the life expectancy of an individual. With the help of improved medical and public health practice, life expectancy has dramatically increased during the twentieth century66. However, while life expectancy has been increasing, individuals living in poverty and in poor communities tend to have shorter life expectancies.
The information presented throughout this report shows the connections between health outcomes, socioeconomic status, and life expectancy. In order to achieve health equity, targeted interventions and policy change are needed, otherwise the disparities will only increase. It is hoped that this report will serve as a tool that can be used to inform and empower community change to improve upon the health of the residents in Whitewater Township.
Whitewater Township Residents (18 and Older)
with an Independent Living Difficulty, 2012-2015
7%
78.77yearsAverage Life Expectancy in
Whitewater Township, 2011-2015
“Knowledge is power. With it you can create a healthier life for
your community.”

Does Place Matter? A Community Health AssessmentPage 19
APPENDICESAssets and Opportunities . . . . . . . . . . . . . . . . . . . . . . . . . . . . . . . . . . . iRecommendations . . . . . . . . . . . . . . . . . . . . . . . . . . . . . . . . . . . . . . . . iiiData Tables . . . . . . . . . . . . . . . . . . . . . . . . . . . . . . . . . . . . . . . . . . . . . . . .vAsset & Opportunity Audit Photographs . . . . . . . . . . . . . . . . . . xiiiFrequently Asked Questions. . . . . . . . . . . . . . . . . . . . . . . . . . . . . . xviiCommon Terminology . . . . . . . . . . . . . . . . . . . . . . . . . . . . . . . . . . . .xxReferences. . . . . . . . . . . . . . . . . . . . . . . . . . . . . . . . . . . . . . . . . . . . . . xxiii
Does Place Matter? A Community Health Assessment Page i
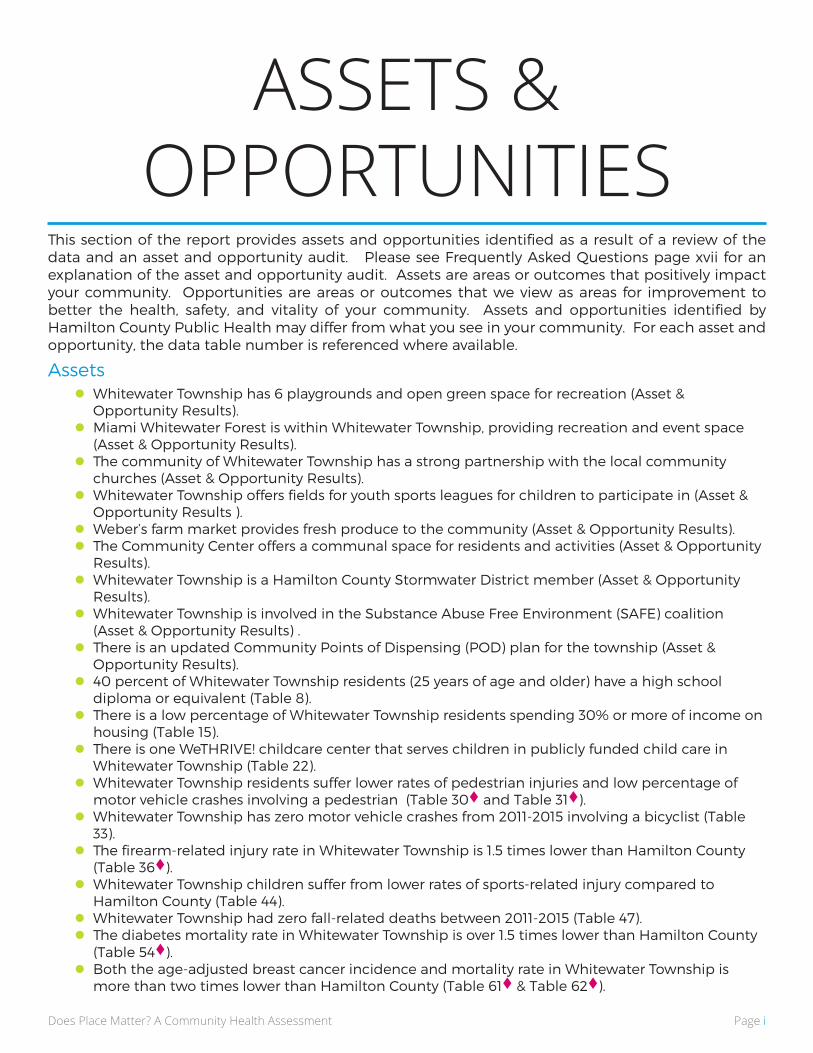
This section of the report provides assets and opportunities identified as a result of a review of the data and an asset and opportunity audit. Please see Frequently Asked Questions page xvii for an explanation of the asset and opportunity audit. Assets are areas or outcomes that positively impact your community. Opportunities are areas or outcomes that we view as areas for improvement to better the health, safety, and vitality of your community. Assets and opportunities identified by Hamilton County Public Health may differ from what you see in your community. For each asset and opportunity, the data table number is referenced where available.
Assets z Whitewater Township has 6 playgrounds and open green space for recreation (Asset &
Opportunity Results). z Miami Whitewater Forest is within Whitewater Township, providing recreation and event space
(Asset & Opportunity Results). z The community of Whitewater Township has a strong partnership with the local community
churches (Asset & Opportunity Results). z Whitewater Township offers fields for youth sports leagues for children to participate in (Asset &
Opportunity Results ). z Weber’s farm market provides fresh produce to the community (Asset & Opportunity Results). z The Community Center offers a communal space for residents and activities (Asset & Opportunity
Results). z Whitewater Township is a Hamilton County Stormwater District member (Asset & Opportunity
Results). z Whitewater Township is involved in the Substance Abuse Free Environment (SAFE) coalition
(Asset & Opportunity Results) . z There is an updated Community Points of Dispensing (POD) plan for the township (Asset &
Opportunity Results). z 40 percent of Whitewater Township residents (25 years of age and older) have a high school
diploma or equivalent (Table 8). z There is a low percentage of Whitewater Township residents spending 30% or more of income on
housing (Table 15). z There is one WeTHRIVE! childcare center that serves children in publicly funded child care in
Whitewater Township (Table 22). z Whitewater Township residents suffer lower rates of pedestrian injuries and low percentage of
motor vehicle crashes involving a pedestrian (Table 30 and Table 31). z Whitewater Township has zero motor vehicle crashes from 2011-2015 involving a bicyclist (Table
33). z The firearm-related injury rate in Whitewater Township is 1.5 times lower than Hamilton County
(Table 36). z Whitewater Township children suffer from lower rates of sports-related injury compared to
Hamilton County (Table 44). z Whitewater Township had zero fall-related deaths between 2011-2015 (Table 47). z The diabetes mortality rate in Whitewater Township is over 1.5 times lower than Hamilton County
(Table 54). z Both the age-adjusted breast cancer incidence and mortality rate in Whitewater Township is
more than two times lower than Hamilton County (Table 61 & Table 62).
ASSETS & OPPORTUNITIES
Does Place Matter? A Community Health AssessmentPage ii
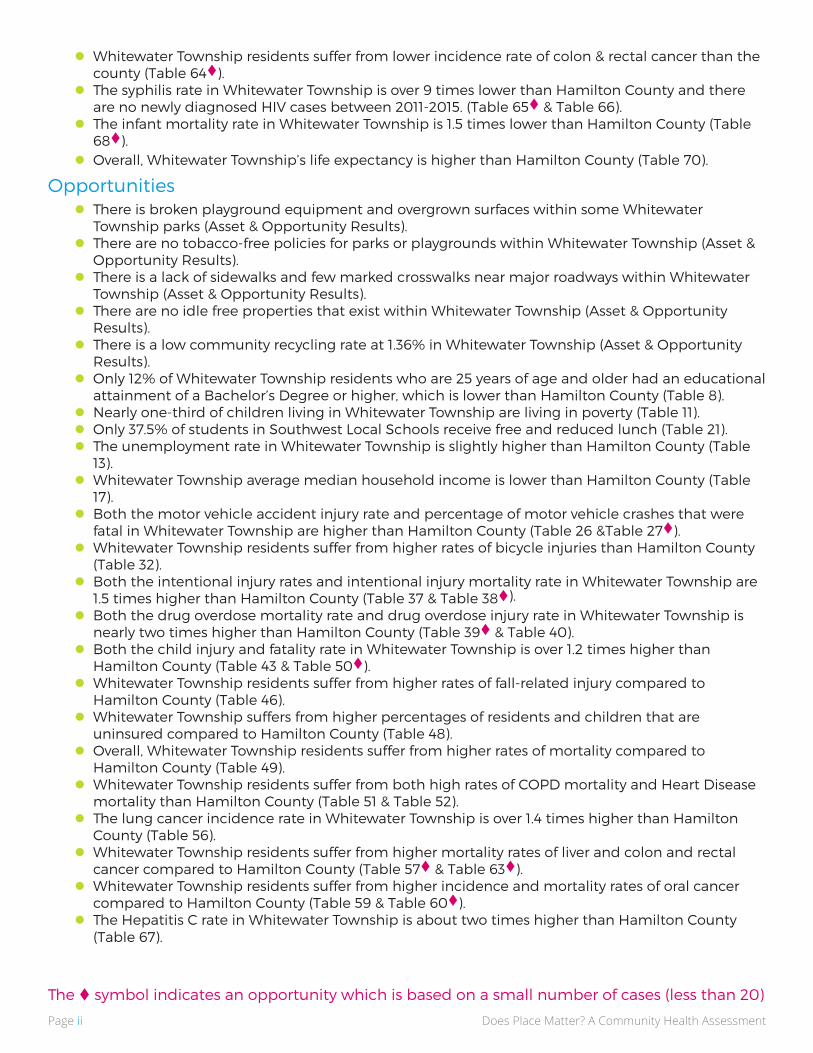
z Whitewater Township residents suffer from lower incidence rate of colon & rectal cancer than the county (Table 64).
z The syphilis rate in Whitewater Township is over 9 times lower than Hamilton County and there are no newly diagnosed HIV cases between 2011-2015. (Table 65 & Table 66).
z The infant mortality rate in Whitewater Township is 1.5 times lower than Hamilton County (Table 68).
z Overall, Whitewater Township’s life expectancy is higher than Hamilton County (Table 70).
Opportunities z There is broken playground equipment and overgrown surfaces within some Whitewater
Township parks (Asset & Opportunity Results). z There are no tobacco-free policies for parks or playgrounds within Whitewater Township (Asset &
Opportunity Results). z There is a lack of sidewalks and few marked crosswalks near major roadways within Whitewater
Township (Asset & Opportunity Results). z There are no idle free properties that exist within Whitewater Township (Asset & Opportunity
Results). z There is a low community recycling rate at 1.36% in Whitewater Township (Asset & Opportunity
Results). z Only 12% of Whitewater Township residents who are 25 years of age and older had an educational
attainment of a Bachelor’s Degree or higher, which is lower than Hamilton County (Table 8). z Nearly one-third of children living in Whitewater Township are living in poverty (Table 11). z Only 37.5% of students in Southwest Local Schools receive free and reduced lunch (Table 21). z The unemployment rate in Whitewater Township is slightly higher than Hamilton County (Table
13). z Whitewater Township average median household income is lower than Hamilton County (Table
17). z Both the motor vehicle accident injury rate and percentage of motor vehicle crashes that were
fatal in Whitewater Township are higher than Hamilton County (Table 26 &Table 27). z Whitewater Township residents suffer from higher rates of bicycle injuries than Hamilton County
(Table 32). z Both the intentional injury rates and intentional injury mortality rate in Whitewater Township are
1.5 times higher than Hamilton County (Table 37 & Table 38). z Both the drug overdose mortality rate and drug overdose injury rate in Whitewater Township is
nearly two times higher than Hamilton County (Table 39 & Table 40). z Both the child injury and fatality rate in Whitewater Township is over 1.2 times higher than
Hamilton County (Table 43 & Table 50). z Whitewater Township residents suffer from higher rates of fall-related injury compared to
Hamilton County (Table 46). z Whitewater Township suffers from higher percentages of residents and children that are
uninsured compared to Hamilton County (Table 48). z Overall, Whitewater Township residents suffer from higher rates of mortality compared to
Hamilton County (Table 49). z Whitewater Township residents suffer from both high rates of COPD mortality and Heart Disease
mortality than Hamilton County (Table 51 & Table 52). z The lung cancer incidence rate in Whitewater Township is over 1.4 times higher than Hamilton
County (Table 56). z Whitewater Township residents suffer from higher mortality rates of liver and colon and rectal
cancer compared to Hamilton County (Table 57 & Table 63). z Whitewater Township residents suffer from higher incidence and mortality rates of oral cancer
compared to Hamilton County (Table 59 & Table 60). z The Hepatitis C rate in Whitewater Township is about two times higher than Hamilton County
(Table 67).
The symbol indicates an opportunity which is based on a small number of cases (less than 20)

Does Place Matter? A Community Health Assessment Page iii
The following recommendations are based on opportunities identified for your community, as well as the corresponding WeTHRIVE! pathways that address the recommendations.
RECOMMENDATIONS
Recommendation WeTHRIVE! PathwayIncrease the community recycling rate and educate residents on community recycling
Promote resources available to residents from Hamilton County Public Health.
Work with Southwest Local Schools to increase the number of students who pursue further education.
Educate township residents on why open dumping is a problem and provide residents with resources on who to call if they see an open dumping site.
Enhance the playground and sports equipment at the local parks.
Educate residents on their rights as a renter.
Develop community gardens within the township.
Partner with the Sheriff’s Department and Fire Department to create a Quick Response Team for overdose victims.
Increase opportunities for access to healthy foods in the township.
Implement an idle free policy on school property and township owned parks.
Implement a tobacco free policy on township owned property.
Work with local police stations and other secure facilities to place a prescription drug drop box for residents to dispose of any unwanted prescription drugs.
Partner with Weber’s Farm for healthy food education opportunities for the township.
Educate township families on how to respond to overdose victims and how to administer Narcan.
Continue hosting annual clean up days in the township.
Work to improve the conditions and visibility of crosswalks in the township.
Work to host Drug Take Back Days for residents to dispose of any unwanted prescription drugs.
Continue to label storm drains throughout the township to reduce stormwater pollution.
= Chronic Disease Pathway = Emergency Preparedness Pathway
= Environmental Health Pathway = Injury Prevention Pathway
= Substance Use/Abuse Pathway = Social Health Pathway

Does Place Matter? A Community Health AssessmentPage iv
RECOMMENDATIONS CONTINUEDRecommendation WeTHRIVE! PathwayEducate residents on resources and the importance of getting regular preventative screenings for cancer.
Partner with Fire/EMS to implement strategies to help reduce the number of fall-related injuries for Whitewater Township Residents.
Identify partnerships to help develop strategies that will reduce the number of children who live in poverty within the Township.
Identify problem intersections or roadways and install traffic calming measures to prevent motor vehicle accidents.
Partner with Cincinnati Children’s Hospital Medical Center, Sheriff’s Department, and Fire Department, to identify the sources of child injuries and ways to prevent them.

Does Place Matter? A Community Health Assessment Page v
Please Note: Some percentages may not equal 100 percent due to rounding.Hamilton County comparison percentages and rates are provided where available/applicable.
DATA TABLES
Table 5: Racial Residential Segregation2015
Level of Racial Residential Segregation
Very Segregated-Moderately Segregated
Source: U.S. Census Bureau/FactFinder, 2015 American Community Survey 5-Year Estimates. Methodology: Association of Maternal and Child Health Programs
Table 6: Concentrated Disadvantage2015
Level of Concentrated Disadvantage
Medium Level
Source: U.S. Census Bureau/FactFinder, 2015 American Community Survey 5-Year Estimates. Methodology: Association of Maternal and Child Health Programs
Table 2: Population by Age2015
<18 Years of Age 1,331 24%
18-29 Years of Age 805 15%
30-49 Years of Age 1,185 22%
50-64 Years of Age 1,248 23%
65+ Years of Age 923 17%Source: U.S. Census Bureau/FactFinder, 2015 American Community Survey 5-Year Estimates
Table 3: Population by Race/Ethnicity2015
non-Hispanic white 5,092 93%
non-Hispanic black 96 2%
non-Hispanic multi-racial 20 0.4%
non-Hispanic other race 12 0.2%
Hispanic, Any Race 219 4%Source: U.S. Census Bureau/FactFinder, 2015 American Community Survey 5-Year Estimates
Table 4: Language Spoken at Home in Residents 5-Years-of-Age and Older2015
Speaks English Only 4,956 96%
Speaks Spanish 146 3%
Speaks Other Indo-European Languages 0 0%
Speaks Asian & Pacific Islander Languages 53 1.0%
Speaks Some Other Language(s) 0 0.0%Source: U.S. Census Bureau/FactFinder, 2015 American Community Survey 5-Year Estimates
Table 1: Population2015
Total Population 5,492
Male Population 2,822
Female Population 2,670Source: U.S. Census Bureau/FactFinder, 2015 American Community Survey 5-Year Estimates
Does Place Matter? A Community Health AssessmentPage vi
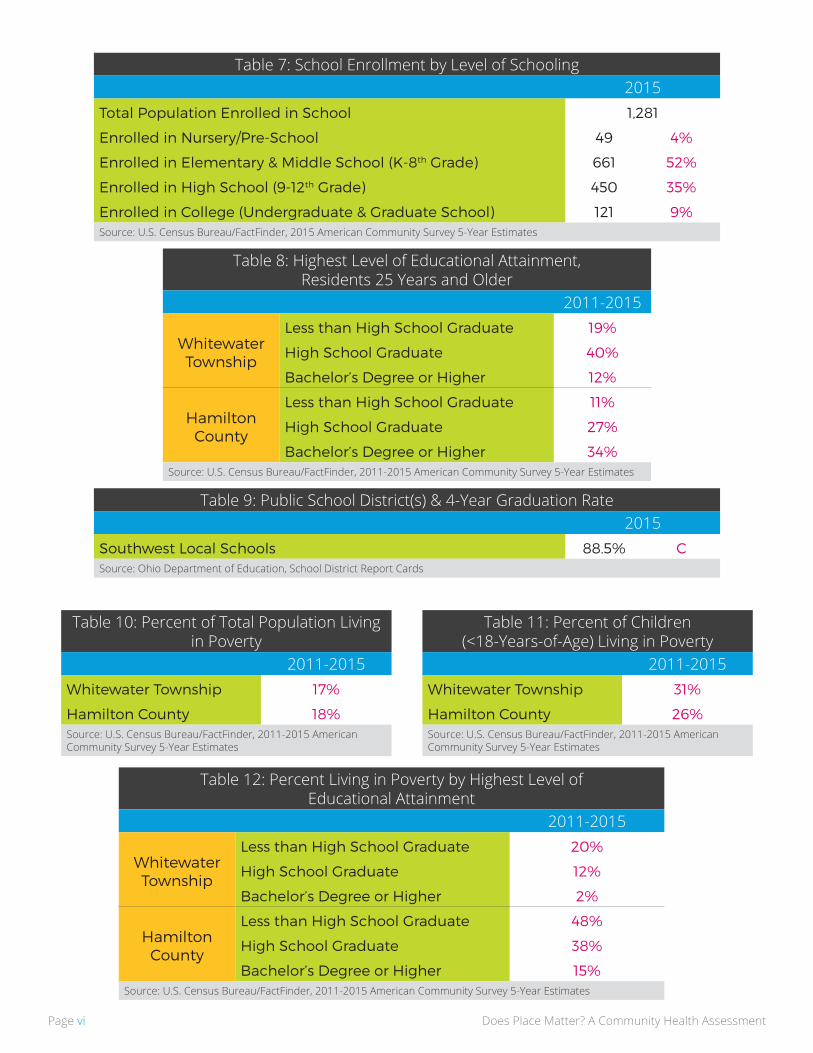
Table 7: School Enrollment by Level of Schooling2015
Total Population Enrolled in School 1,281
Enrolled in Nursery/Pre-School 49 4%
Enrolled in Elementary & Middle School (K-8th Grade) 661 52%
Enrolled in High School (9-12th Grade) 450 35%
Enrolled in College (Undergraduate & Graduate School) 121 9%Source: U.S. Census Bureau/FactFinder, 2015 American Community Survey 5-Year Estimates
Table 10: Percent of Total Population Living in Poverty
2011-2015Whitewater Township 17%
Hamilton County 18%Source: U.S. Census Bureau/FactFinder, 2011-2015 American Community Survey 5-Year Estimates
Table 11: Percent of Children (<18-Years-of-Age) Living in Poverty
2011-2015Whitewater Township 31%
Hamilton County 26%Source: U.S. Census Bureau/FactFinder, 2011-2015 American Community Survey 5-Year Estimates
Table 9: Public School District(s) & 4-Year Graduation Rate2015
Southwest Local Schools 88.5% CSource: Ohio Department of Education, School District Report Cards
Table 8: Highest Level of Educational Attainment, Residents 25 Years and Older
2011-2015
Whitewater Township
Less than High School Graduate 19%
High School Graduate 40%
Bachelor’s Degree or Higher 12%
Hamilton County
Less than High School Graduate 11%
High School Graduate 27%
Bachelor’s Degree or Higher 34%Source: U.S. Census Bureau/FactFinder, 2011-2015 American Community Survey 5-Year Estimates
Table 12: Percent Living in Poverty by Highest Level of Educational Attainment
2011-2015
Whitewater Township
Less than High School Graduate 20%
High School Graduate 12%
Bachelor’s Degree or Higher 2%
Hamilton County
Less than High School Graduate 48%
High School Graduate 38%
Bachelor’s Degree or Higher 15%Source: U.S. Census Bureau/FactFinder, 2011-2015 American Community Survey 5-Year Estimates
Does Place Matter? A Community Health Assessment Page vii
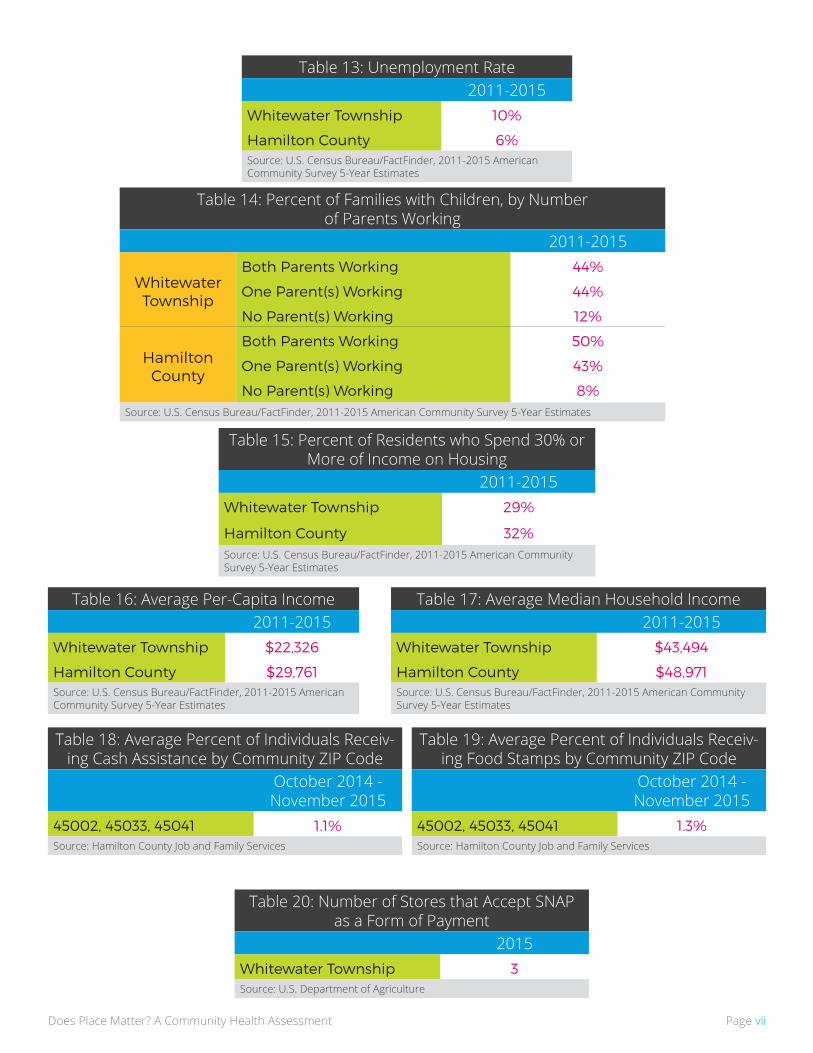
Table 14: Percent of Families with Children, by Number of Parents Working
2011-2015
Whitewater Township
Both Parents Working 44%
One Parent(s) Working 44%
No Parent(s) Working 12%
Hamilton County
Both Parents Working 50%
One Parent(s) Working 43%
No Parent(s) Working 8%Source: U.S. Census Bureau/FactFinder, 2011-2015 American Community Survey 5-Year Estimates
Table 13: Unemployment Rate2011-2015
Whitewater Township 10%
Hamilton County 6%Source: U.S. Census Bureau/FactFinder, 2011-2015 American Community Survey 5-Year Estimates
Table 15: Percent of Residents who Spend 30% or More of Income on Housing
2011-2015Whitewater Township 29%
Hamilton County 32%Source: U.S. Census Bureau/FactFinder, 2011-2015 American Community Survey 5-Year Estimates
Table 16: Average Per-Capita Income2011-2015
Whitewater Township $22,326
Hamilton County $29,761Source: U.S. Census Bureau/FactFinder, 2011-2015 American Community Survey 5-Year Estimates
Table 17: Average Median Household Income2011-2015
Whitewater Township $43,494
Hamilton County $48,971Source: U.S. Census Bureau/FactFinder, 2011-2015 American Community Survey 5-Year Estimates
Table 19: Average Percent of Individuals Receiv-ing Food Stamps by Community ZIP Code
October 2014 - November 2015
45002, 45033, 45041 1.3%Source: Hamilton County Job and Family Services
Table 18: Average Percent of Individuals Receiv-ing Cash Assistance by Community ZIP Code
October 2014 - November 2015
45002, 45033, 45041 1.1%Source: Hamilton County Job and Family Services
Table 20: Number of Stores that Accept SNAP as a Form of Payment
2015Whitewater Township 3Source: U.S. Department of Agriculture

Does Place Matter? A Community Health AssessmentPage viii
Table 22: Number of Licensed Child Care Centers
2015Whitewater Township 1Source: Hamilton County Job and Family Services
Table 23: Percent of Licensed Child Care Centers that Serve Children in Publicly Funded
Child Care2015
Whitewater Township 1Source: Hamilton County Job and Family Services
Table 21: Percent of Students who Receive Free & Reduced Lunch by Participating School District & Individual Schools
2015 School YearSouthwest Local School District 37.5%
Crosby Elementary School 24.5%
Harrison Elementary School 44.5%
Miamitown Elementary School 79.8%
Whitewater Valley Elementary School 23.4%
Harrison Junior School 36.8%
William Henry Harrison High School 32.3%Source: Ohio Department of Education
Table 24: Outdoor and Physical Activity SpacesPlayground?
Elizabethtown Park Yes
Farwick Fields Yes
Hooven Elementary Yes
Miamitown Elementary Playground Yes
Miami Whitewater Forest Yes
Miami Whitewater Soccer Complex No
Riverview Park No
Rosealta Park No
Shawnee Lookout Conservation Easements No
Simmonds Family Dog Park No
Smith Tract County Park No
Whitewater Township Community Park Yes Source: Whitewater Township Community

Does Place Matter? A Community Health Assessment Page ix
Table 27: Percent of Motor Vehicle Crashes that were Fatal
2011-2015Whitewater Township 1%
Hamilton County 0.2%Source: Ohio Department of Public Safety, Crash Data Extracts
Table 30: Percent of Motor Vehicle Crashes Involving a Pedestrian
2011-2015Whitewater Township 1%
Hamilton County 2%Source: Ohio Department of Public Safety, Crash Data Extracts
Table 31: Age-Adjusted Pedestrian Injury Rate, per 100,000
2010-2014Whitewater Township 52.5
Hamilton County 56.0Source: Hamilton County Injury Surveillance System
Table 32: Age-Adjusted Bicycle Injury Rate, per 100,000
2010-2014Whitewater Township 121.8
Hamilton County 111.2Source: Hamilton County Injury Surveillance System
Table 33: Percent of Motor Vehicle Crashes Involving a Bicyclist
2011-2015Whitewater Township 0%
Hamilton County 0.5%Source: Ohio Department of Public Safety, Crash Data Extracts
Table 34: Number of Violent Crimes2014
Whitewater Township 15Source: Hamilton County Sheriff
Table 35: Age-Adjusted Homicide Rate, per 100,000
2011-2015Whitewater Township 4.6
Hamilton County 9.7Source: Ohio Department of Health,Public Health Information Warehouse Death Data Set
Table 36: Age-Adjusted Firearm-Related Injury rate
2010-2014Whitewater Township 43.5
Hamilton County 64.9Source: Hamilton County Injury Surveillance System
Table 28: Percent of Motor Vehicle Crashes Involving a Teen Driver
(15-17 years of age)2011-2015
Whitewater Township 5%
Hamilton County 5%Source: Ohio Department of Public Safety, Crash Data Extracts
Table 29: Percent of Motor Vehicle Crashes Involving a Child Driver, Passenger or
Pedestrian2011-2015
Whitewater Township 10%
Hamilton County 13%Source: Ohio Department of Public Safety, Crash Data Extracts
Table 25: Number of Motor Vehicle Crashes
2011-2015Whitewater Township 1,923Source: Ohio Department of Public Safety, Crash Data Extracts
Table 26: Age-Adjusted Motor Vehicle Accident Injury Rate, per 100,000
2010-2014Whitewater Township 1,099.2
Hamilton County 1,087.0Source: Hamilton County Injury Surveillance System
Does Place Matter? A Community Health AssessmentPage x
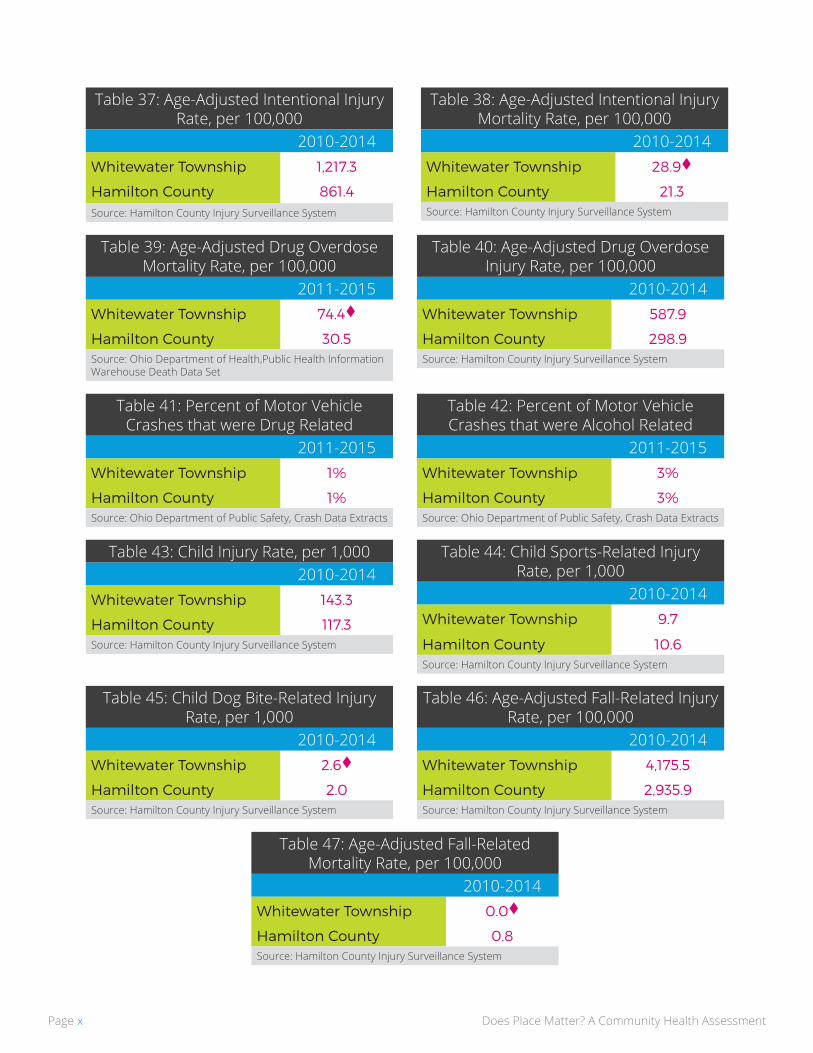
Table 37: Age-Adjusted Intentional Injury Rate, per 100,000
2010-2014Whitewater Township 1,217.3
Hamilton County 861.4Source: Hamilton County Injury Surveillance System
Table 38: Age-Adjusted Intentional Injury Mortality Rate, per 100,000
2010-2014Whitewater Township 28.9
Hamilton County 21.3Source: Hamilton County Injury Surveillance System
Table 40: Age-Adjusted Drug Overdose Injury Rate, per 100,000
2010-2014Whitewater Township 587.9
Hamilton County 298.9Source: Hamilton County Injury Surveillance System
Table 41: Percent of Motor Vehicle Crashes that were Drug Related
2011-2015Whitewater Township 1%
Hamilton County 1%Source: Ohio Department of Public Safety, Crash Data Extracts
Table 42: Percent of Motor Vehicle Crashes that were Alcohol Related
2011-2015Whitewater Township 3%
Hamilton County 3%Source: Ohio Department of Public Safety, Crash Data Extracts
Table 43: Child Injury Rate, per 1,0002010-2014
Whitewater Township 143.3
Hamilton County 117.3Source: Hamilton County Injury Surveillance System
Table 44: Child Sports-Related Injury Rate, per 1,000
2010-2014Whitewater Township 9.7
Hamilton County 10.6Source: Hamilton County Injury Surveillance System
Table 45: Child Dog Bite-Related Injury Rate, per 1,000
2010-2014Whitewater Township 2.6
Hamilton County 2.0Source: Hamilton County Injury Surveillance System
Table 46: Age-Adjusted Fall-Related Injury Rate, per 100,000
2010-2014Whitewater Township 4,175.5
Hamilton County 2,935.9Source: Hamilton County Injury Surveillance System
Table 47: Age-Adjusted Fall-Related Mortality Rate, per 100,000
2010-2014Whitewater Township 0.0
Hamilton County 0.8Source: Hamilton County Injury Surveillance System
Table 39: Age-Adjusted Drug Overdose Mortality Rate, per 100,000
2011-2015Whitewater Township 74.4
Hamilton County 30.5Source: Ohio Department of Health,Public Health Information Warehouse Death Data Set
Does Place Matter? A Community Health Assessment Page xi
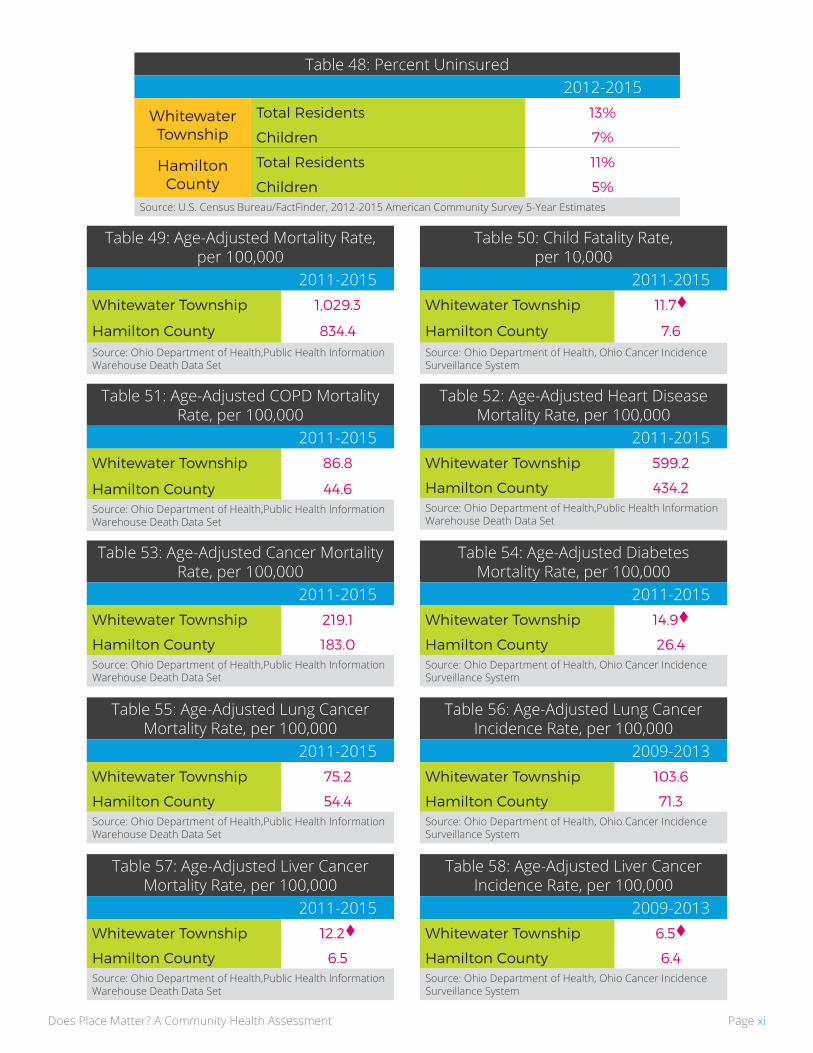
Table 49: Age-Adjusted Mortality Rate, per 100,000
2011-2015Whitewater Township 1,029.3
Hamilton County 834.4Source: Ohio Department of Health,Public Health Information Warehouse Death Data Set
Table 51: Age-Adjusted COPD Mortality Rate, per 100,000
2011-2015Whitewater Township 86.8
Hamilton County 44.6Source: Ohio Department of Health,Public Health Information Warehouse Death Data Set
Table 53: Age-Adjusted Cancer Mortality Rate, per 100,000
2011-2015Whitewater Township 219.1
Hamilton County 183.0Source: Ohio Department of Health,Public Health Information Warehouse Death Data Set
Table 55: Age-Adjusted Lung Cancer Mortality Rate, per 100,000
2011-2015Whitewater Township 75.2
Hamilton County 54.4Source: Ohio Department of Health,Public Health Information Warehouse Death Data Set
Table 57: Age-Adjusted Liver Cancer Mortality Rate, per 100,000
2011-2015Whitewater Township 12.2
Hamilton County 6.5Source: Ohio Department of Health,Public Health Information Warehouse Death Data Set
Table 52: Age-Adjusted Heart Disease Mortality Rate, per 100,000
2011-2015Whitewater Township 599.2
Hamilton County 434.2Source: Ohio Department of Health,Public Health Information Warehouse Death Data Set
Table 54: Age-Adjusted Diabetes Mortality Rate, per 100,000
2011-2015Whitewater Township 14.9
Hamilton County 26.4Source: Ohio Department of Health, Ohio Cancer Incidence Surveillance System
Table 56: Age-Adjusted Lung Cancer Incidence Rate, per 100,000
2009-2013Whitewater Township 103.6
Hamilton County 71.3Source: Ohio Department of Health, Ohio Cancer Incidence Surveillance System
Table 58: Age-Adjusted Liver Cancer Incidence Rate, per 100,000
2009-2013Whitewater Township 6.5
Hamilton County 6.4Source: Ohio Department of Health, Ohio Cancer Incidence Surveillance System
Table 50: Child Fatality Rate, per 10,000
2011-2015Whitewater Township 11.7
Hamilton County 7.6Source: Ohio Department of Health, Ohio Cancer Incidence Surveillance System
Table 48: Percent Uninsured2012-2015
Whitewater Township
Total Residents 13%
Children 7%
Hamilton County
Total Residents 11%
Children 5%Source: U.S. Census Bureau/FactFinder, 2012-2015 American Community Survey 5-Year Estimates

Does Place Matter? A Community Health AssessmentPage xii
Table 59: Age-Adjusted Oral Cancer Mortality Rate, per 100,000
2011-2015Whitewater Township 2.7
Hamilton County 2.2Source: Ohio Department of Health,Public Health Information Warehouse Death Data Set
Table 61: Age-Adjusted Female Breast Cancer Mortality Rate, per 100,000
2011-2015Whitewater Township 7.2
Hamilton County 14.0Source: Ohio Department of Health,Public Health Information Warehouse Death Data Set
Table 63: Age-Adjusted Colon & Rectal Cancer Mortality Rate, per 100,000
2011-2015Whitewater Township 17.4
Hamilton County 16.2Source: Ohio Department of Health,Public Health Information Warehouse Death Data Set
Table 65: Syphilis Rate, per 100,000 2011-2015
Whitewater Township 3.6
Hamilton County 34.9Source: Ohio Department of Health, Ohio Disease Reporting System
Table 67: Hepatitis C Rate, per 100,0002011-2015
Whitewater Township 203.9
Hamilton County 120.8Source: Ohio Department of Health, Ohio Disease Reporting System
Table 68: Infant Mortality Rate, per 1,000
2011-2015Whitewater Township 6.2
Hamilton County 9.3Source: Ohio Department of Health,Public Health Information Warehouse Death and Birth Data Set
Table 70: Average Life Expectancy in Years
2011-2015Whitewater Township 78.77
Hamilton County 76.1Source: Ohio Department of Health,Public Health Information Warehouse Death Data Set
Table 60: Age-Adjusted Oral Cancer Incidence Rate, per 100,000
2009-2013Whitewater Township 12.1
Hamilton County 9.3Source: Ohio Department of Health, Ohio Cancer Incidence Surveillance System
Table 62: Age-Adjusted Female Breast Cancer Incidence Rate, per 100,000
2009-2013Whitewater Township 28.0
Hamilton County 68.2Source: Ohio Department of Health, Ohio Cancer Incidence Surveillance System
Table 64: Age-Adjusted Colon & Rectal Cancer Incidence Rate, per 100,000
2009-2013Whitewater Township 35.3
Hamilton County 38.7Source: Ohio Department of Health, Ohio Cancer Incidence Surveillance System
Table 66: Newly Diagnosed HIV Rate, per 100,000
2011-2015Whitewater Township 0.0
Hamilton County 15.9Source: Ohio Department of Health, Ohio Disease Reporting System
Table 69: Percent of Residents with an Independent Living Difficulty
2012-2015Whitewater Township 7%
Hamilton County 6%Source: U.S. Census Bureau/FactFinder, 2012-2015 American Community Survey 5-Year Estimates
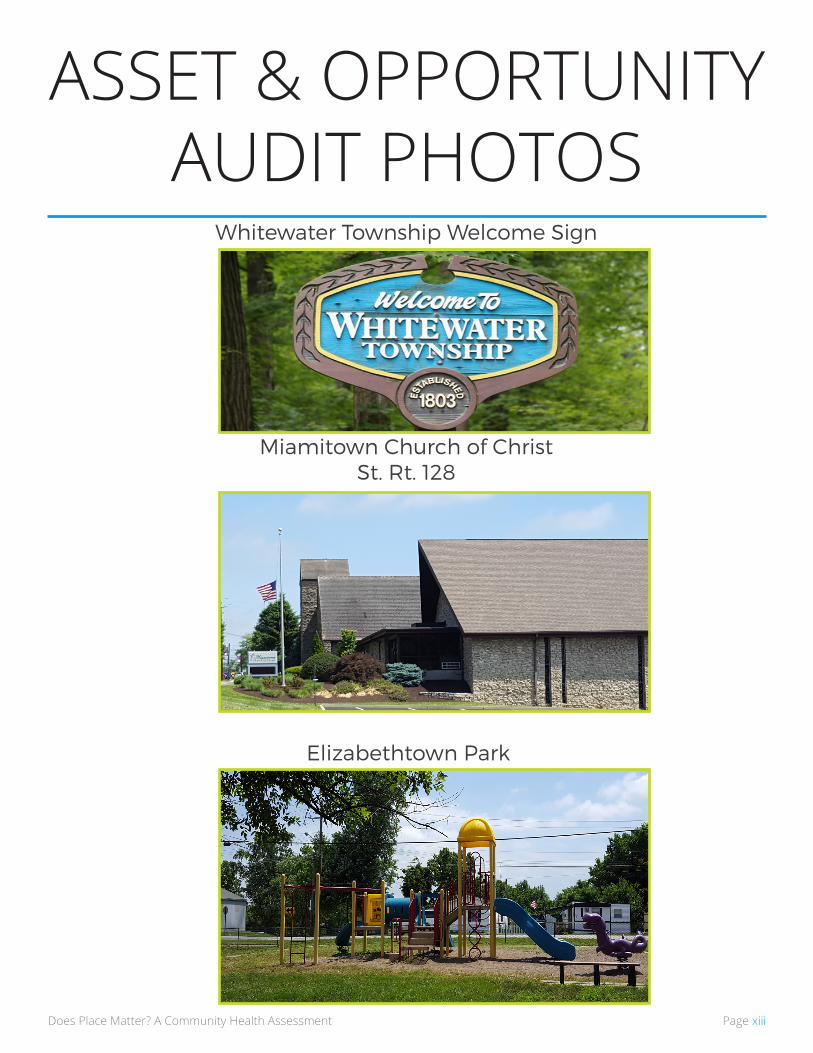
Whitewater Township Welcome Sign
Miamitown Church of ChristSt. Rt. 128
Elizabethtown Park
Does Place Matter? A Community Health Assessment Page xiii
ASSET & OPPORTUNITY AUDIT PHOTOS

Simmonds Family Dog ParkHamilton Cleves Pike Road
Rosealta Park
Does Place Matter? A Community Health AssessmentPage xiv

Whitewater Township
Miamitown Playground
Does Place Matter? A Community Health Assessment Page xv

Whitewater Township Community Park
Does Place Matter? A Community Health AssessmentPage xvi

Does Place Matter? A Community Health Assessment Page xvii
The following provides answers to some of the most frequently asked questions about the WeTHRIVE! Community Health Assessment.
How are you determining if someone lives in my community?We have access to the address of every injury, death, birth and reported cases of notifiable cancer and infectious diseases. We geocode, or map out, each address to determine the exact location within Hamilton County to determine if that individual resides within your community.
What is a rate?A rate is the measure of an outcome of interest (e.g., injury, death, etc.) over a specific time frame within your community.
Why is the rate per 100,000 residents?In order to compare your community to Hamilton County, rates are typically standardized (e.g., per 100,000 residents) to allow them to be compared to other communities and geographic areas. It allows for a more “apples-to-apples” comparison.
What is a mortality rate?A mortality rate is a specific type of rate that measures the number of deaths in your community’s population over a specific time frame.
What is an incidence rate?An incidence rate is a specific type of rate that measures the number of NEW cases of a disease within your community.
What are age-adjusted rates and why do we use them?Age-adjusted rates are a specific type of rate that takes into account the age structure of your community to help get a better picture of how a certain disease or injury is affecting your community.Age-adjusted rates are important to use because it allows us to compare your community with other areas that may be very different in terms of the age of their residents. This allows for an “apples-to-apples” comparison of your community with another area. For example, a community with more young residents is able to be compared to a community with more older residents.
Why are you indicating when a rate is based on less than 20 cases, and why is it a concern?When a rate is based on a small number of cases (less than 20), it can be difficult to determine if there was a true change in the underlying risk for the disease/injury, or if it was due to random changes in the disease/injury. It is a concern because it is difficult to make assumptions about an entire community’s problem when the incidence of the disease/injury is sporadic and/or infrequent.
FREQUENTLY ASKED QUESTIONS

Does Place Matter? A Community Health AssessmentPage xviii
Why is my community grouped with other communities using census tracts?Certain indicators are only available at the census tract level. In order to perform the necessary calculations, the indicator groupings of the census tracts had to be done. The grouping of the census tracts was done by grouping census tracts that were in the same area.
What is racial residential segregation, why is it important and what does it mean?Racial residential segregation is the degree to which two or more racial groups live separately from one another in a geographic area. Racial residential segregation is important because it can constrain the socioeconomic advancement of minority groups by limiting education quality and employment. Racial residential segregation is associated with unequal access to healthcare resources including healthcare settings and quality of treatment.
In this report racial residential segregation is calculated using non-Hispanic white and non-Hispanic black populations. When an area is highly segregated this means that whites live in white only census tracts and blacks live in black only census tracts. When an area is well integrated, white and black residents live in the same census tracts in nearly equal numbers. Areas that are moderately segregated means that there are census tracts in which both white and black residents live together in and census tracts in which only white residents live and census tracts in which only black residents live.
What is concentrated disadvantage and how is it calculated?Concentrated disadvantage is an indicator that shows areas that are at an economic disadvantage. Communities that have higher levels of concentrated disadvantage oftentimes have less mutual trust and willingness among community members to intervene for the common good, often known as collective efficacy. Collective efficacy is a critical way that communities inhibit the perpetration of violence; children who live and grow in disadvantage areas are more likely to experience violence. Communities with high levels of concentrated disadvantage are also at an increased risk for higher rates of infant mortality.
Concentrated disadvantage is calculated using five indicators:1. Percent of individuals living below the poverty line;2. Percent of individuals on public assistance;3. Percent of female-headed households;4. Percent of the population who are unemployed;5. Percent of the population who are less than 18 years of age
Concentrated disadvantage shows how the indicators interact with each other to influence the overall health of individuals living in a particular community.
What do you mean by educational attainment?Educational attainment is the highest level of education that an individual has completed. For example, the percent of individuals who are less than a high school graduate means that those individuals did not finish and graduate from high school.
What is an asset and opportunity audit?The asset and opportunity audit is when Hamilton County Public Health, health educators gathered information about your community using a variety of methods, including internet searches, data review, making visual observations while driving and walking and taking photographs to illustrate the story. The asset and opportunity audit focused on the physical environment, nutrition environment, air and water quality, housing, waste management, and emergency preparedness. Information gathered

Does Place Matter? A Community Health Assessment Page xix
as part of the asset and opportunity audit is used to provide a snapshot of existing risk and protective factors in your community, as well as to shape recommendations for interventions that can directly be tied back to your community. Assets and opportunities identified provide context on how the community’s social, economic, and physical environment may impact its health, safety, and vitality.
How did you determine what was a park in my community?A park was determined through an assets and opportunities audit of your community where our Health Educators went out into your community. Parks were classified if they had signs that indicated the open green space (area with grass and/or trees and plants), there were signs it was a park or contained a playground.
How did you determine if there was public transportation in my community?Through an assets and opportunities audit of your community, our Health Educators went out into your community to find bus stops. If there were bus stops in your community, it was determined that there was public transportation in your community. If no bus stops were found in your community, it was determined that there was no public transportation in your community.
How did you know how many car crashes occurred in my community?Access to crash data was obtained from the Ohio Department of Public Safety that contained community-level data.
Do motor vehicle injuries include those where a person was hit by a car?No. Motor vehicle injuries are only those injuries where a person was inside the car, either as the driver or passenger, and was involved in a car accident. If a person is riding their bike and is hit by a car, it is classified as a bicycle-related injury. If the person was walking across the street and was hit by a car, it is classified as a pedestrian-related injury.
Why are you only reporting the number of people who died from a chronic disease and not how many people are living with the disease in my community?
Unfortunately, there is no way to determine the number of individuals living with a chronic disease such as diabetes or heart disease within your community. This is because there is no national, or state reporting database that will allow us to see how many people are currently living with the disease below a county level. Providing death information on chronic disease gives some insight into whether a chronic disease is a problem within your community. If your community has higher rates of death due to chronic diseases such as diabetes or heart disease, it can be expected that a community may have a large number of residents currently living with the chronic disease.
Is there a way to find rates for other types of cancer in my community?Yes. The rates presented in this report are for the most frequently reported types of cancer, or cancer that can be associated with certain health behaviors. Rates for additional types of cancer may be available upon request.
What can I do to improve the health of my community?There are many things you can do to improve the health of your community. Throughout the health assessment of your community, assets (areas of positive outcomes) and opportunities (areas for improvement) were identified. Recommendations on how to address the opportunities or elevate the assets in your community to better the health of residents are provided. Also be sure to join your WeTHRIVE! team to find additional ways you can help to improve the health of your community.
Does Place Matter? A Community Health AssessmentPage xx
The following provides information on some of the terms used throughout the WeTHRIVE! Community Health Assessment.
4-Year Graduation Rate:The 4-year graduation rate is the percentage of students who entered high school as a freshman and graduated in four years.
Age-Adjusted Mortality Rate:An age-adjusted mortality rate is a type of mortality rate that has been statistically modified to eliminate the effect of different age distributions among different populations.
Bicycle-Related Injury:Injury to a bicyclist from a collision, loss of control crash, or some other event involving a moving vehicle or pedestrian.
Cause-Specific Mortality Rate:A cause-specific mortality rate is a rate calculated as the number of deaths attributed to a specific cause during a specified time period among a population, divided by the size of the population.
Census:The census is a measurement of a population’s demographics performed by the United States Census Bureau.
Concentrated Disadvantage:Concentrated disadvantage is an indicator that shows areas/communities that are at an economic disadvantage.
Demographic Information:Demographic information are the characteristics of a person or group (i.e., age, sex, race/ethnicity, residence, and occupation). Demographic information is used to characterize individuals or populations.
Educational Attainment:Educational attainment is the highest level of education that an individual has completed.
Frequency:A frequency is the amount or number of occurrences of an attribute or health outcome in a population.
Health Indicator:A health indicator is any of a variety of measure (e.g., mortality rate) that indicates the state of health of a population.
COMMON TERMINOLOGY

Does Place Matter? A Community Health Assessment Page xxi
High-Risk Group:A high risk group is a group of persons whose risk for a particular disease, injury or other health condition is greater than that of the rest of their community or population.
Incidence:Incidence is a measure of the frequency with which new cases of illness, injury, or other health condition occurs among a population during a specified period.
Incidence Rate:An incidence rate is a measure of the frequency with which new cases of illness, injury, or other health conditions occur, expressed explicitly per a time frame, usually per 100,000 population.
Infant Mortality Rate:An infant mortality rate is a type of mortality rate for infants, children less than one year of age, and is calculated as the number of infant deaths divided by the number of live births during the same period, and is expressed per 1,000 live births. An infant mortality rate is a universally accepted indicator of the health of a nation’s population and adequacy of its health-care system.
Intentional Injury:Intentional injury is a type of injury that is sustained due to knowingly inflicting harm to oneself or another individual.
Life Expectancy:Life expectancy is a statistical projection of the average number of years a person of a given age is expected to live, if the current mortality rates continue to apply.
Mean:The mean is also known as the average.
Median Household Income:The amount of income that divides all income in a community into two equal groups, half having income above that amount, and half having income below that amount.
Mortality Rate:A mortality rate is a measure of the frequency of occurrence of death among a defined population during a specified time interval.
Notifiable Disease:A notifiable disease is a type of disease that, by law, must be reported to public health authorities upon diagnosis.
Pedestrian-Related Injury:Injury to a person involved in a collision, where the person was not, at the time of the collision, riding in or on a motor vehicle, motorcycle, bicycle, or streetcar. This also includes individuals who were struck by cars, pick-up trucks, vans, buses and SUVs.
Per-Capita Income:The average money income received in the past 12 months for every man, woman, and child in a geographic area. Per-capita income is more commonly known as income per person.

Does Place Matter? A Community Health AssessmentPage xxii
Population:The population is the total number of inhabitants of a geographic area or the total number of persons in a particular group (e.g., the number of persons engaged in a certain occupation).
Prevalence:Prevalence is the number or proportion of cases, events, or attributes among a given population.
Prevalence Rate:A prevalence rate is the proportion of a population that has a particular disease, injury, other health condition, or attribute at a specified point in time, or during a specified period.
Racial Residential Segregation:Racial residential segregation is the degree to which two or more racial groups live separately from one another in a geographic region.
Rate:A rate is an expression of the relative frequency with which an event occurs among a defined population per unit of time, calculated as the number of new cases or deaths during a specified period per the population and/or the time period in which the population was at risk.
Risk Factor:A risk factor is an aspect of personal behavior or lifestyle, an environmental exposure, or a hereditary characteristic that is associated with an increase in the occurrence of a particular disease, injury, or health condition.
Trend:A trend is the movement or change in frequency over time, usually upward or downward.
Vital Statistics:Vital statistics are data about recorded births and deaths.

Does Place Matter? A Community Health Assessment Page xxiii
1. University of Arkansas, Division of Agriculture. (n.d). Understanding Demographics. Retrieved June 29, 2015, from https://www.uaex.edu/business-communities/Understanding%20Community%20Demographics.pdf
2. Centers for Disease Control and Prevention. (2012, August 24). Population Characteristics. Retrieved June 29, 2015, from http://ephtracking.cdc.gov/showPcMain.action
3. New South Wales Government, Department of Education. (2015). Understanding Racism. Retrieved November 20, 2015, from http://www.racismnoway.com.au/about-racism/understanding/culture-language-identity.html
4. Association of Maternal & Child Health Programs. (2013, January 1). Life Course Indicator: Racial Residential Segregation, by Community. Retrieved October 22, 2014, from http://www.amchp.org/programsandtopics/data-assessment/LifeCourseIndicatorDocuments/LC-16_Racial%20Residential%20Segregation_9-4-2014.pdf
5. Association of Maternal & Child Health Programs. (2013, January 1). Life Course Indicator: Concentrated Disadvantage. Retrieved October 22, 2014, from http://www.amchp.org/programsandtopics/data-assessment/LifeCourseIndicatorDocuments/LC-06_ConcentratedDisad_Final-4-24-2014.pdf
6. New Zealand Ministry of Education. (2010, February 1). Effects of Poverty, Hunger, and Homelessness on Children and Youth. Retrieved October 22, 2014, from http://www.educationcounts.govt.nz/indicators/main/education-and-learning-outcomes/1903
7. Centers for Disease Control and Prevention. (2012, May 16). Higher Education and Income Levels Key to Better Health, According to Annual Report on Nation’s Health. Retrieved February 19, 205 from http://www.cdc.gov/media/releases/2012/p0516_higher_education.html
8. National Education Association. (n.d.) Early Childhood Education. Retrieved November 20, 2015, from: http://www.nea.org/home/18163.htm
9. Reynolds, A., Temple, J., Robertson, D., Mann, E. (2001, May 9). Long-term Effects of an Early Childhood Intervention on Educational Achievement and Juvenile Arrest. The Journal of the American Medical Association. 285(18), 2339-2346. doi:10.1001/jama.285.18.2339. Retrieved November 23, 2015, from http://jama.jamanetwork.com/article.aspx?articleid=193816#RESULTS
10. National Education Association. (2008). An NEA Policy Brief: Early Childhood Education and School Readiness. Retrieved November 23, 2015, from http://www.nea.org/assets/docs/HE/mf_PB03_EarlyChildhood.pdf
11. Association of Maternal & Child Health Programs. (2013, January 1). Life Course Indicator: High School Graduation Rate. Retrieved October 22, 2014, from http://www.amchp.org/programsandtopics/data-assessment/LifeCourseIndicatorDocuments/LC-20_HS_gradrate_Final_3-26-2014.pdf
REFERENCES

Does Place Matter? A Community Health AssessmentPage xxiv
12. Partners for a Hunger-Free Oregon. (n.d.) Goal 1: Increase Economic Stability for People. Communities, and the State. Retrieved December 1, 2015, from https://oregonhunger.org/increase-economic-stability
13. Michael & Susan Dell Foundation. (n.d.). Family Economic Stability. Retrieved December 1, 2015, from http://www.msdf.org/programs/family-economic-stability/
14. World Health Organization. (2003, January 1). DAC Guidelines and Reference Series: Poverty and Health. Retrieved October 22, 2014, from http://www.who.int/tobacco/research/economics/publications/oecd_dac_pov_health.pdf
15. U.S. Department of Labor. (2015, April 2). Earnings and Unemployment Rates by Educational Attainment. Retrieved April 14, 2015, from http://www.bls.gov/emp/ep_chart_001.htm
16. Association of Maternal & Child Health Programs. (2013, January 1). Life Course Indicator: Unemployment. Retrieved October 22, 2014, from http://www.amchp.org/programsandtopics/data-assessment/LifeCourseIndicatorDocuments/LC-22_Unemployment_Final-11-6-2013.pdf
17. Robert Wood Johnson Foundation. (2013, March). Health Policy Snapshot: How Does Employment - or Unemployment - Affect Health?. Retrieved December 3, 2015, from http://www.rwjf.org/content/dam/farm/reports/issue_briefs/2013/rwjf403360
18. American Academy of Pediatrics:: Healthy Children.org. (2015, November 21). Working Parents. Retrieved December 3, 2015, from https://www.healthychildren.org/English/family-life/work-play/Pages/Working-Parents.aspx
19. U.S. Census Bureau. (n.d.). Who Can Afford to Live in a Home?: A Look at Data From the 2006 American Community Survey. Retrieved December 4, 2015, from http://www.census.gov/housing/census/publications/who-can-afford.pdf
20. U.S. Department of Housing and Urban Development. (n.d.). Affordable Housing. Retrieved July 6, 2015, from http://portal.hud.gov/hudportal/HUD?src=/program_offices/comm_planning/affordablehousing/
21. U.S. Census Bureau. (n.d.). Per Capita Income. Retrieved December 4, 2015, from http://quickfacts.census.gov/qfd/meta/long_INC910213.htm
22. Berger. M., (n.d.). Kentucky’s Per Capita Income: Catching Up to the Rest of the Country. Retrieved December 10, 2015, from http://cber.uky.edu/Downloads/berger97.htm
23. U.S. Census Bureau. (n.d.). Median Household Income. Retrieved December 10, 2015, from http://quickfacts.census.gov/qfd/meta/long_INC110213.htm
24. Rhode Island Health Care Matters. (n.d.). Median Household Income. Retrieved December 10, 2015, from http://www.rihealthcarematters.org/modules.php?op=modload&name=NS-Indicator&file=indicator&iid=14094769
25. Hamilton County Job & Family Services. (n.d.). Cash Assistance. Retrieved December 29, 2015, from https://www.hcjfs.org/services/cash-assistance/
26. CLASP: Policy Solutions That Work for low-Income People. (2015, June). Child care Assistance: A Vital Support for Working Families. Retrieved January 6, 2016, from http://www.clasp.org/resources-and-publications/publication-1/CCDBG-Advocacy-Fact-Sheet.pdf

Does Place Matter? A Community Health Assessment Page xxv
27. Hamilton County Job & Family Services. (n.d.) Child Care. Retrieved January 6, 2016, from https://www.hcjfs.org/services/child-care/
28. U.S. Department of Agriculture. (2016, January 7). National School Lunch Program. Retrieved January 7, 2016, from http://www.fns.usda.gov/nslp/national-school-lunch-program-nslp
29. Roof, K., Oleru, Ngozi., (2008). Public Health: Seattle and King County’s Push for the Built Environment. Journal of Environmental Health. 71(1). 24-27. Retrieved January 7, 2016, from http://www.cdc.gov/nceh/ehs/docs/jeh/2008/july-aug_w_case_studies/jeh_jul-aug_08_seattle.pdf
30. U.S. Department of Transportation, Federal Transit Administration. (n.d.). Alternative Transportation and Your Health. Retrieved January 7, 2016, from http://www.fta.dot.gov/14504.htm
31. The National Center for Review & Prevention of Child Deaths. (.n.d.). Motor Vehicle. Retrieved November 13, 2015, from https://www.childdeathreview.org/reporting/motor-vehicle/
32. Centers for Disease Control and Prevention. (2015, December 29). Injury Prevention & Control: Motor Vehicle Safety - Cost data and Prevention Policies. Retrieved January 7, 2016, from http://www.cdc.gov/motorvehiclesafety/costs/index.html
33. Centers for Disease Control and Prevention. (2007, March 17). Definitions for WISQARS Nonfatal Injury. Retrieved December, 28, 2015, from http://www.cdc.gov/ncipc/wisqars/nonfatal/definitions.htm#pedestrian
34. U.S. Department of Transportation, Federal Highway Administration. (n.d.). Pedestrian and Bicycle Information Center. Retrieved December, 28, 2015, from http://www.pedbikeinfo.org/data/factsheet_social.cfm
35. MacDonald, J. (2015, September). Community Design and Crime: The Impact of Housing and the Built Environment. Retrieved January 4, 2016, from http://www.jstor.org/stable/10.1086/681558?seq=1#page_scan_tab_contents
36. Curry, A., Latkin, C., Davey-Rothwell, M. (2009, July 1). Pathways to Depression: The Impact of Neighborhood Violent Crime on Inner-City Residents in Baltimore, Maryland, U.S.A. Social Science & Medicine. 67(1). 23-30. Retrieved January 4, 2016, from http://www.ncbi.nlm.nih.gov/pmc/articles/PMC2684449/
37. The Federal Bureau of Investigation. (n.d.). Violent Crime. Retrieved January 6, 2016, from https://www.fbi.gov/about-us/cjis/ucr/crime-in-the-u.s/2014/crime-in-the-u.s.-2014/offenses-known-to-law-enforcement/violent-crime
38. Centers for Disease Control and Prevention. (2014, December 24). Suicide: Consequences. Retrieved April 14, 2015, from http://www.cdc.gov/violenceprevention/suicide/consequences.html
39. Dannenberg, A., Frumkin, H. (2012, September 18). Making Healthy Place: Designing and Building for Health, Well-being, and Sustainability, Washington:Island Press.
40. Hembree, C., Galea, S. Ahern, J., Tracy, M., Markham Piper, T., Miller, J., Vlahov, D.k, Tardiff, KD. (2005). The Urban Built Environment and Overdose Mortality in New York City Neighborhoods. Health & Place 11(2005). 147-156. Retrieved January 6, 2016, from https://pubweb.bnl.gov/~frenkel/BTO/weill.pdf

Does Place Matter? A Community Health AssessmentPage xxvi
41. Cummins, S., Jackson, R. (n.d.). The Built Environment and CHildren’s Health. Retrieved January, 6, 2016, from http://www.cdc.gov/healthyplaces/articles/the_built_environment_and_children_health.pdf
42. Hamilton County Public Health. (2014, January 9). Sports-Related Injuries, 2004-2011. Retrieved January 6, 2016, from http://www.hamiltoncountyhealth.org/files/files/Reports/Sports_Related_Injury.pdf
43. National Institute of Arthritis and Musculoskeletal and Skin Diseases. (2013, November). Handout on Health: Sports Injuries. Retrieved January 6, 2016, from http://www.niams.nih.gov/Health_Info/Sports_Injuries/default.asp#ra_2
44. Hamilton County Public Health. (2015, September). Dog Bite-Related Injuries. Retrieved January 6, 2016 from http://www.hamiltoncountyhealth.org/files/files/Forms/EPI/Dog_Bite_Related_Injuries.pdf
45. Healthy People.gov. (.n.d). Access to Health Services. Retrieved January 7, 2016, from http://www.healthypeople.gov/2020/topics-objectives/topic/Access-to-Health-Services
46. PBS.org. (n.d.). The Uninsured. Retrieved October 22, 2014, from http://www.pbs.org/healthcarecrisis/uninsured.html
47. Centers for Disease Control and Prevention. (2011, April). Census Tract Level State Maps the Modified Retail Food Enviroinment Index (mRFEI). Retrieved May 26, 2015, from http://www.cdc.gov/obesity/downloads/childrensfoodenvironment.pdf
48. Centers for Disease Control and Prevention. (2015, March 1). Chronic Obstructive Pulmonary Disease (COPD). Retrieved January 7, 2016, from http://www.cdc.gov/copd/index.html
49. American Lung Association. (n.d.). How Serious is COPD. Retrieved January 7, 2016, from http://www.lung.org/lung-health-and-diseases/lung-disease-lookup/copd/learn-about-copd/how-serious-is-copd.html
50. Centers for Disease Control and Prevention. (2009, November 16). About Heart Disease. Retrieved October 22, 2014, from http://www.cdc.gov/heartdisease/about.htm
51. Centers for Disease Control and Prevention. (2015, March 31). Basics About Diabetes. Retrieved January 7, 2016, from http://www.cdc.gov/diabetes/basics/diabetes.html
52. Centers for Disease Control and Prevention. (2015, September 30). Leading Causes of Death. Retrieved January 7, 2016 , from http://www.cdc.gov/nchs/fastats/leading-causes-of-death.htm
53. American Cancer Society. (n.d.). What Causes Cancer?. Retrieved April 13, 2015, from http://www.cancer.org/cancer/cancercauses/index
54. Centers for Disease Control and Prevention. (2016, January 18). Retrieved January 7, 2016, from http://www.cdc.gov/tobacco/campaign/tips/diseases/cancer.html
55. American Cancer Society. (n.d.). Alcohol Use and Cancer. Retrieved January 7, 2016 from http://www.cancer.org/cancer/cancercauses/dietandphysicalactivity/alcohol-use-and-cancer
56. American Cancer Society. (n.d.). What are the risks for breast cancer?. Retrieved January 7, 2016, from http://www.cancer.org/cancer/breastcancer/detailedguide/breast-cancer-risk-factors

Does Place Matter? A Community Health Assessment Page xxvii
57. Centers for Disease Control and Prevention. (2015, July 21). Retrieved January 7, 2016 from http://www.cdc.gov/cancer/dcpc/prevention/index.htm
58. Centers for Disease Control and Prevention (2015, November 12). Syphilis - CDC Fact Sheet.Retrieved January 7, 2016 from http://www.cdc.gov/std/syphilis/stdfact-syphilis.htm
59. Centers for Disease Control and Prevention. (n.d.). General HIV Information. Retrieved January 7, 2016, from https://wwwn.cdc.gov/hivrisk/what_is/what_is_hiv.html
60. Centers for Disease Control and Prevention. (n.d.). Can I get or transmit HIV from...?. Retrieved January 7, 2016, from https://wwwn.cdc.gov/hivrisk/transmit/
61. Centers for Disease Control and Prevention. (2015, May 31). Viral Hepatitis-Hepatitis C Information. Retrieved January 7, 2016 from http://www.cdc.gov/hepatitis/hcv/
62. Centers for Disease Control and Prevention. (2016. January 12). Infant Mortality. Retrieved January 7, 2016, from http://www.cdc.gov/reproductivehealth/maternalinfanthealth/infantmortality.htm
63. United States Census Bureau. (2014, June 9). American Community Survey. Disability Methodology. Retrieved January 8, 2016 from https://www.census.gov/people/disability/methodology/acs.html
64. Government of Canada. (2010, January 11). Life Expectancy. Retrieved October 22, 2014 from http://www.statcan.gc.ca/pub/82-229-x/2009001/demo/lif-eng.htm
65. National Institutes of Health. (2011, October). Global Health and Aging: Living Longer. Retrieved April 14, 2015, from https://www.nia.nih.gov/research/publication/global-health-and-aging/living-longer

(513) 946.7800
(513) 946.7890
@WatchUsThrive
Phone Number
Website
Follow us on Social Media
Fax Number
Address
WatchUsThrive.org
250 William Howard Taft Road2nd Floor
Cincinnati, Ohio 45219
CONTACT US.