Embed Size (px)
Citation preview
COUNTY PROFILE: Hamilton County, Ohio
http://www.healthdata.org Hamilton County, Ohio | page 1
US COUNTY PERFORMANCEThe Institute for Health Metrics and Evaluation (IHME) at the University of Washington analyzed the performance of all 3,142US counties or county-equivalents in terms of life expectancy at birth, mortality rates for select causes, alcohol use, smokingprevalence, obesity prevalence, and recommended physical activity using novel small area estimation techniques and themost up-to-date county-level information.
Explore more results using the interactive US Health Map data visualization (http://vizhub.healthdata.org/subnational/usa).
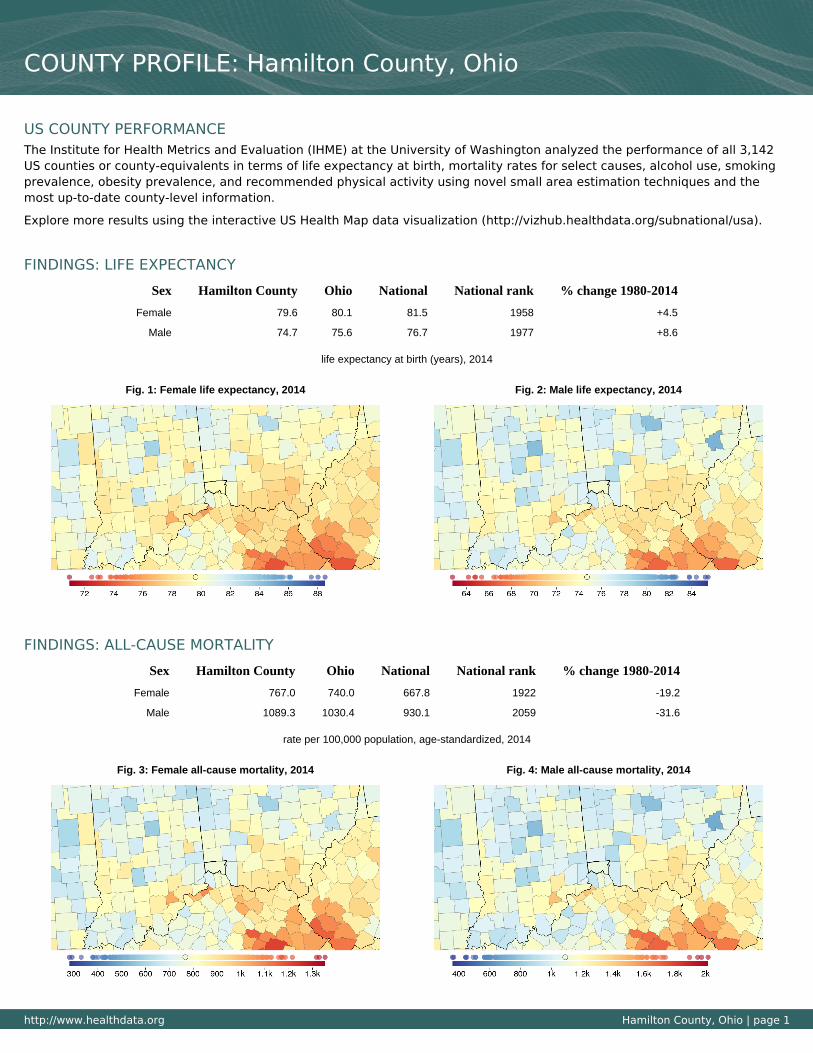
FINDINGS: LIFE EXPECTANCY
Sex Hamilton County Ohio National National rank % change 1980-2014
Female 79.6 80.1 81.5 1958 +4.5
Male 74.7 75.6 76.7 1977 +8.6
life expectancy at birth (years), 2014
Fig. 1: Female life expectancy, 2014 Fig. 2: Male life expectancy, 2014
FINDINGS: ALL-CAUSE MORTALITY
Sex Hamilton County Ohio National National rank % change 1980-2014
Female 767.0 740.0 667.8 1922 -19.2
Male 1089.3 1030.4 930.1 2059 -31.6
rate per 100,000 population, age-standardized, 2014
Fig. 3: Female all-cause mortality, 2014 Fig. 4: Male all-cause mortality, 2014
http://www.healthdata.org Hamilton County, Ohio | page 2
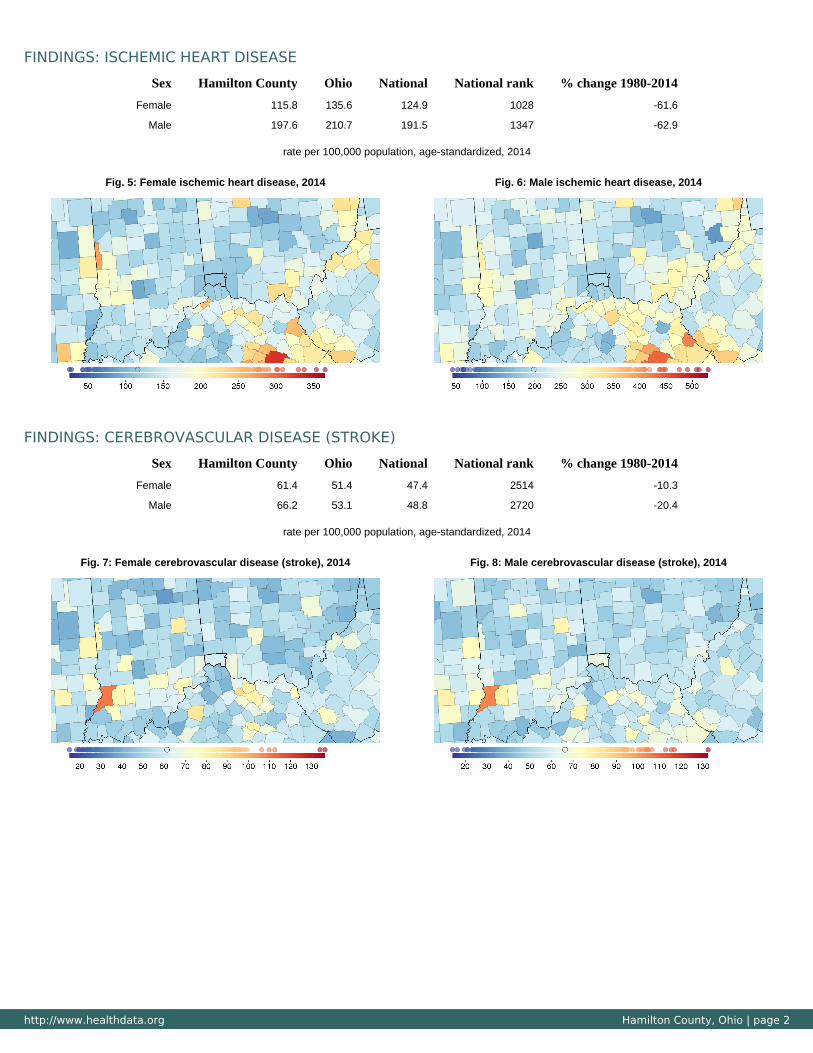
FINDINGS: ISCHEMIC HEART DISEASE
Sex Hamilton County Ohio National National rank % change 1980-2014
Female 115.8 135.6 124.9 1028 -61.6
Male 197.6 210.7 191.5 1347 -62.9
rate per 100,000 population, age-standardized, 2014
Fig. 5: Female ischemic heart disease, 2014 Fig. 6: Male ischemic heart disease, 2014
FINDINGS: CEREBROVASCULAR DISEASE (STROKE)
Sex Hamilton County Ohio National National rank % change 1980-2014
Female 61.4 51.4 47.4 2514 -10.3
Male 66.2 53.1 48.8 2720 -20.4
rate per 100,000 population, age-standardized, 2014
Fig. 7: Female cerebrovascular disease (stroke), 2014 Fig. 8: Male cerebrovascular disease (stroke), 2014
http://www.healthdata.org Hamilton County, Ohio | page 3
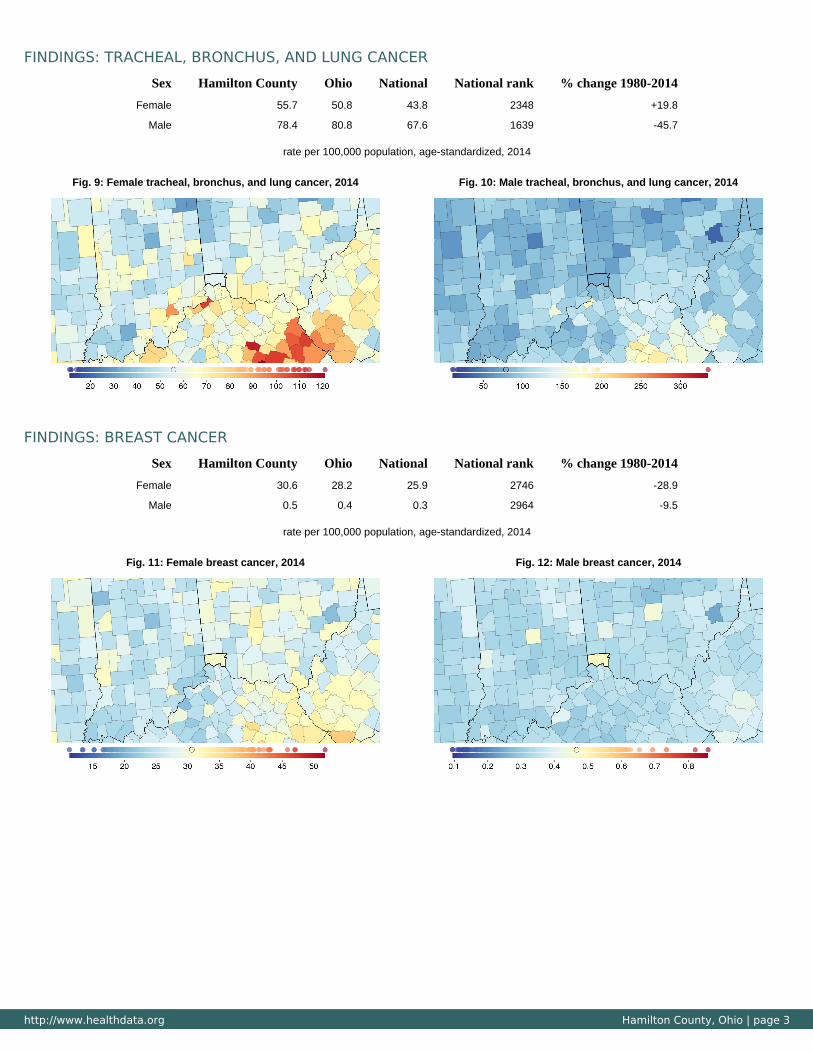
FINDINGS: TRACHEAL, BRONCHUS, AND LUNG CANCER
Sex Hamilton County Ohio National National rank % change 1980-2014
Female 55.7 50.8 43.8 2348 +19.8
Male 78.4 80.8 67.6 1639 -45.7
rate per 100,000 population, age-standardized, 2014
Fig. 9: Female tracheal, bronchus, and lung cancer, 2014 Fig. 10: Male tracheal, bronchus, and lung cancer, 2014
FINDINGS: BREAST CANCER
Sex Hamilton County Ohio National National rank % change 1980-2014
Female 30.6 28.2 25.9 2746 -28.9
Male 0.5 0.4 0.3 2964 -9.5
rate per 100,000 population, age-standardized, 2014
Fig. 11: Female breast cancer, 2014 Fig. 12: Male breast cancer, 2014
http://www.healthdata.org Hamilton County, Ohio | page 4
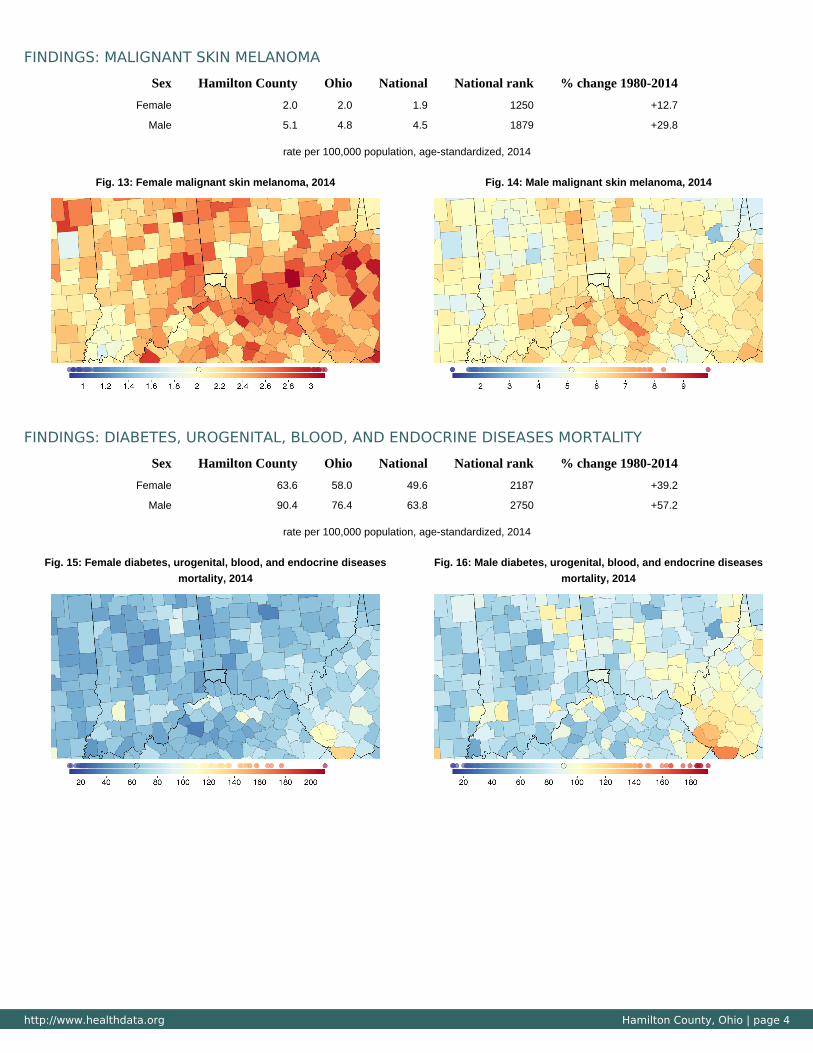
FINDINGS: MALIGNANT SKIN MELANOMA
Sex Hamilton County Ohio National National rank % change 1980-2014
Female 2.0 2.0 1.9 1250 +12.7
Male 5.1 4.8 4.5 1879 +29.8
rate per 100,000 population, age-standardized, 2014
Fig. 13: Female malignant skin melanoma, 2014 Fig. 14: Male malignant skin melanoma, 2014
FINDINGS: DIABETES, UROGENITAL, BLOOD, AND ENDOCRINE DISEASES MORTALITY
Sex Hamilton County Ohio National National rank % change 1980-2014
Female 63.6 58.0 49.6 2187 +39.2
Male 90.4 76.4 63.8 2750 +57.2
rate per 100,000 population, age-standardized, 2014
Fig. 15: Female diabetes, urogenital, blood, and endocrine diseases
mortality, 2014
Fig. 16: Male diabetes, urogenital, blood, and endocrine diseases
mortality, 2014
http://www.healthdata.org Hamilton County, Ohio | page 5
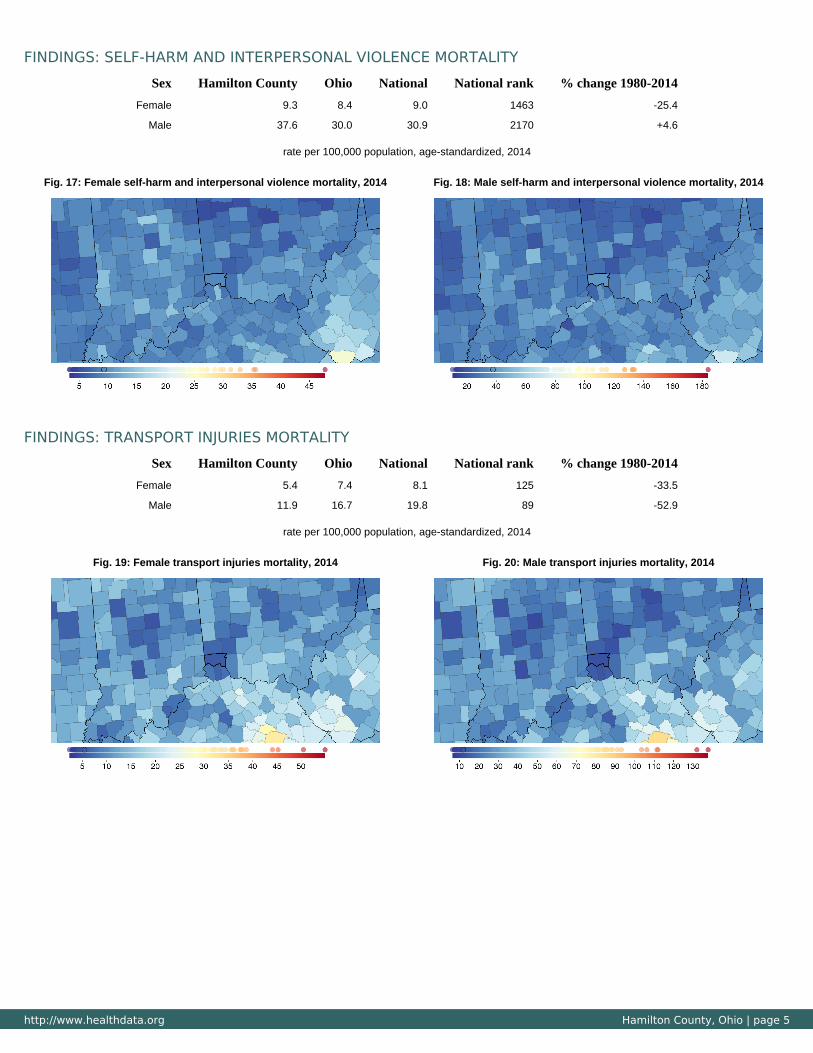
FINDINGS: SELF-HARM AND INTERPERSONAL VIOLENCE MORTALITY
Sex Hamilton County Ohio National National rank % change 1980-2014
Female 9.3 8.4 9.0 1463 -25.4
Male 37.6 30.0 30.9 2170 +4.6
rate per 100,000 population, age-standardized, 2014
Fig. 17: Female self-harm and interpersonal violence mortality, 2014 Fig. 18: Male self-harm and interpersonal violence mortality, 2014
FINDINGS: TRANSPORT INJURIES MORTALITY
Sex Hamilton County Ohio National National rank % change 1980-2014
Female 5.4 7.4 8.1 125 -33.5
Male 11.9 16.7 19.8 89 -52.9
rate per 100,000 population, age-standardized, 2014
Fig. 19: Female transport injuries mortality, 2014 Fig. 20: Male transport injuries mortality, 2014
http://www.healthdata.org Hamilton County, Ohio | page 6
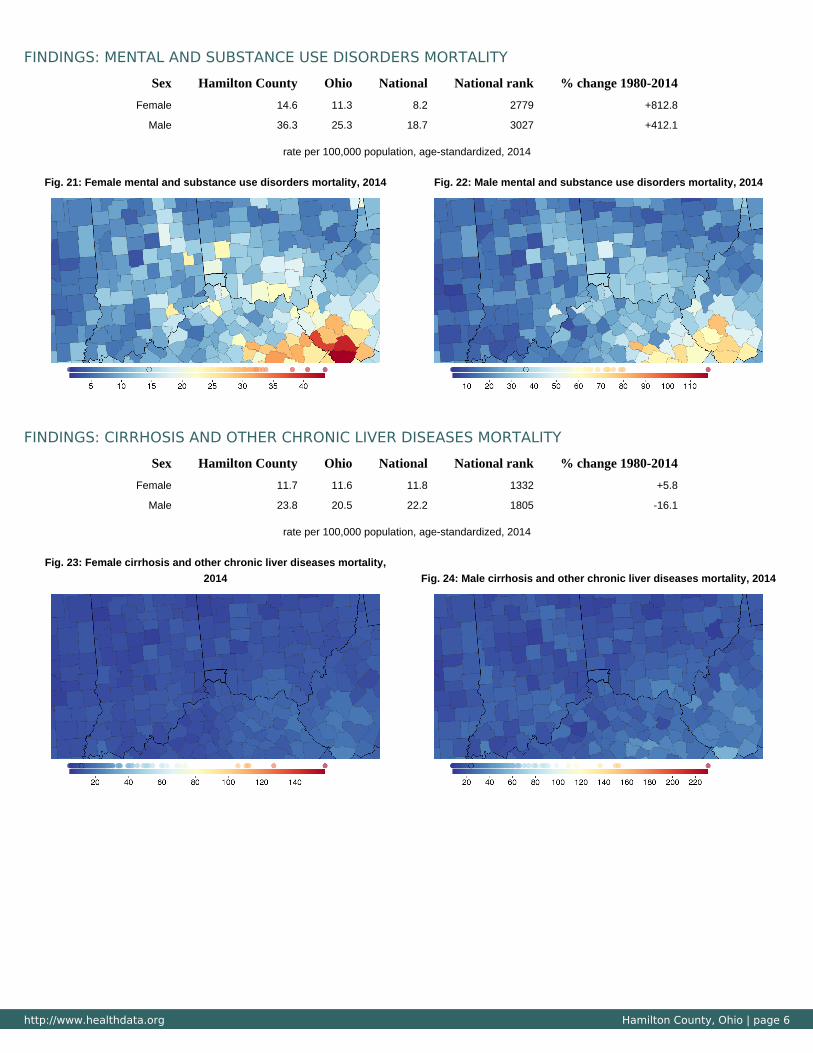
FINDINGS: MENTAL AND SUBSTANCE USE DISORDERS MORTALITY
Sex Hamilton County Ohio National National rank % change 1980-2014
Female 14.6 11.3 8.2 2779 +812.8
Male 36.3 25.3 18.7 3027 +412.1
rate per 100,000 population, age-standardized, 2014
Fig. 21: Female mental and substance use disorders mortality, 2014 Fig. 22: Male mental and substance use disorders mortality, 2014
FINDINGS: CIRRHOSIS AND OTHER CHRONIC LIVER DISEASES MORTALITY
Sex Hamilton County Ohio National National rank % change 1980-2014
Female 11.7 11.6 11.8 1332 +5.8
Male 23.8 20.5 22.2 1805 -16.1
rate per 100,000 population, age-standardized, 2014
Fig. 23: Female cirrhosis and other chronic liver diseases mortality,
2014 Fig. 24: Male cirrhosis and other chronic liver diseases mortality, 2014
http://www.healthdata.org Hamilton County, Ohio | page 7
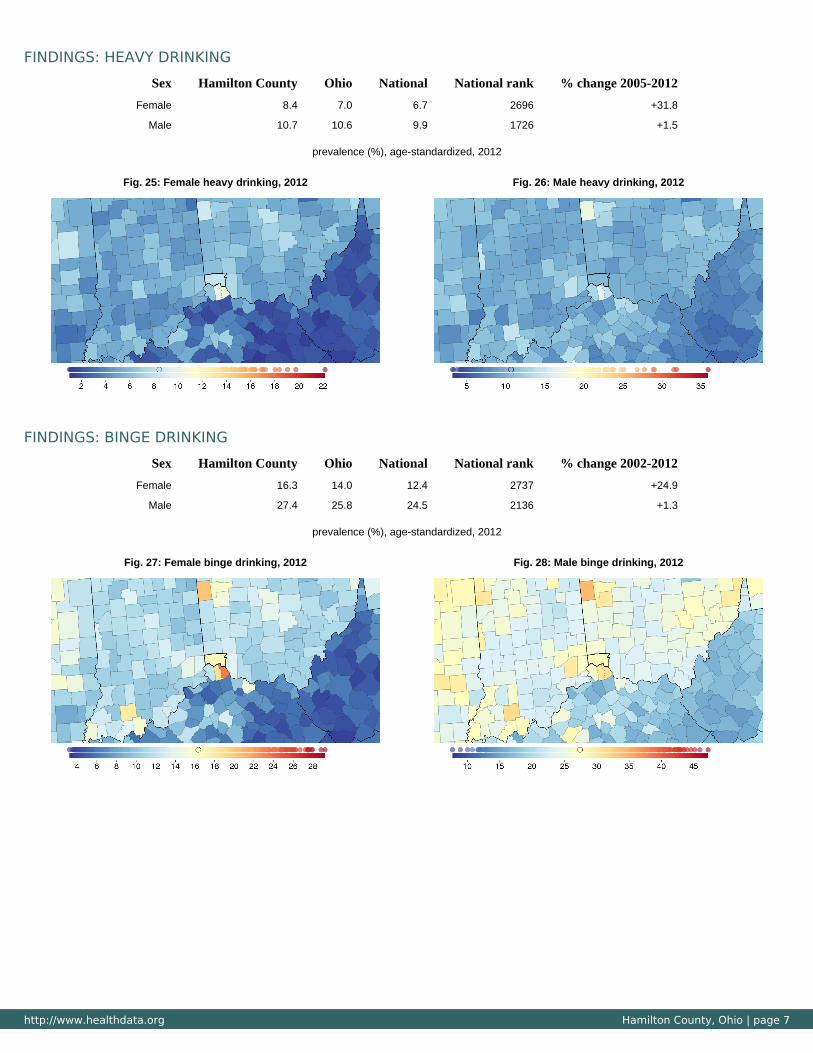
FINDINGS: HEAVY DRINKING
Sex Hamilton County Ohio National National rank % change 2005-2012
Female 8.4 7.0 6.7 2696 +31.8
Male 10.7 10.6 9.9 1726 +1.5
prevalence (%), age-standardized, 2012
Fig. 25: Female heavy drinking, 2012 Fig. 26: Male heavy drinking, 2012
FINDINGS: BINGE DRINKING
Sex Hamilton County Ohio National National rank % change 2002-2012
Female 16.3 14.0 12.4 2737 +24.9
Male 27.4 25.8 24.5 2136 +1.3
prevalence (%), age-standardized, 2012
Fig. 27: Female binge drinking, 2012 Fig. 28: Male binge drinking, 2012
http://www.healthdata.org Hamilton County, Ohio | page 8
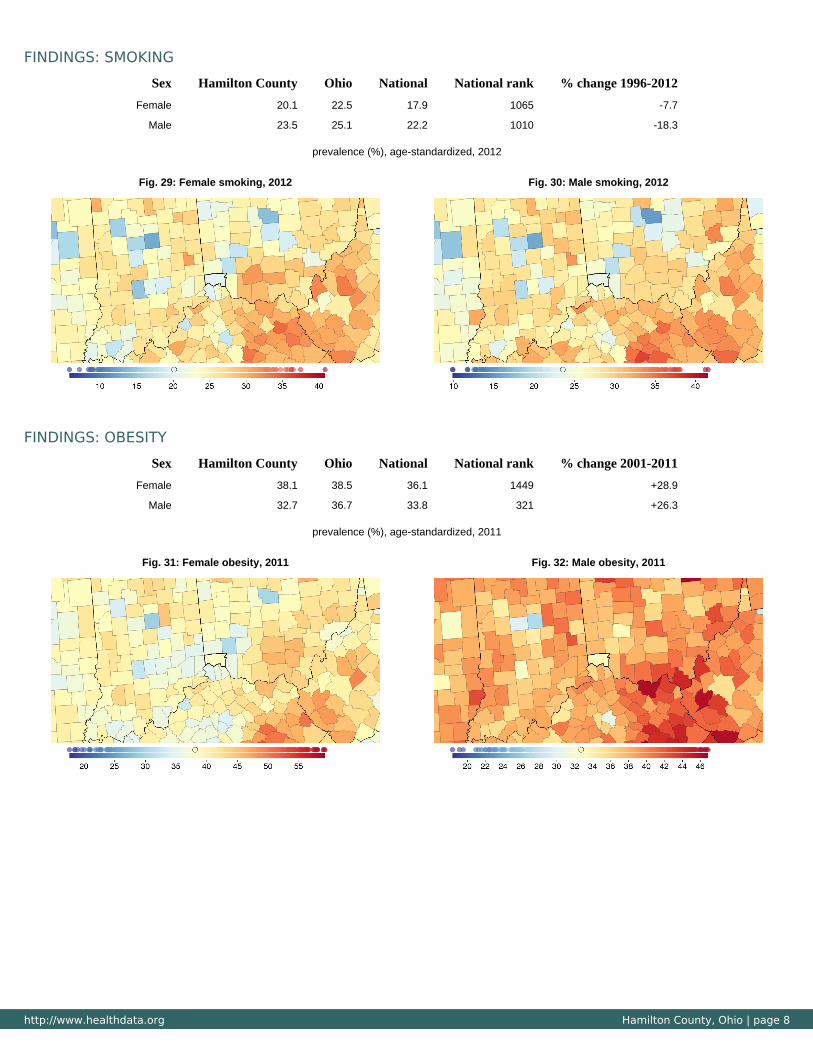
FINDINGS: SMOKING
Sex Hamilton County Ohio National National rank % change 1996-2012
Female 20.1 22.5 17.9 1065 -7.7
Male 23.5 25.1 22.2 1010 -18.3
prevalence (%), age-standardized, 2012
Fig. 29: Female smoking, 2012 Fig. 30: Male smoking, 2012
FINDINGS: OBESITY
Sex Hamilton County Ohio National National rank % change 2001-2011
Female 38.1 38.5 36.1 1449 +28.9
Male 32.7 36.7 33.8 321 +26.3
prevalence (%), age-standardized, 2011
Fig. 31: Female obesity, 2011 Fig. 32: Male obesity, 2011
http://www.healthdata.org Hamilton County, Ohio | page 9
Institute for Health Metrics and Evaluation2301 Fifth Ave., Suite 600Seattle, WA 98121 USA
Telephone: +1-206-897-2800E-mail: [email protected]
Institute for Health Metrics and Evaluation (IHME),US County Profile: Hamilton County, Ohio.Seattle, WA: IHME, 2016.
CITATION:
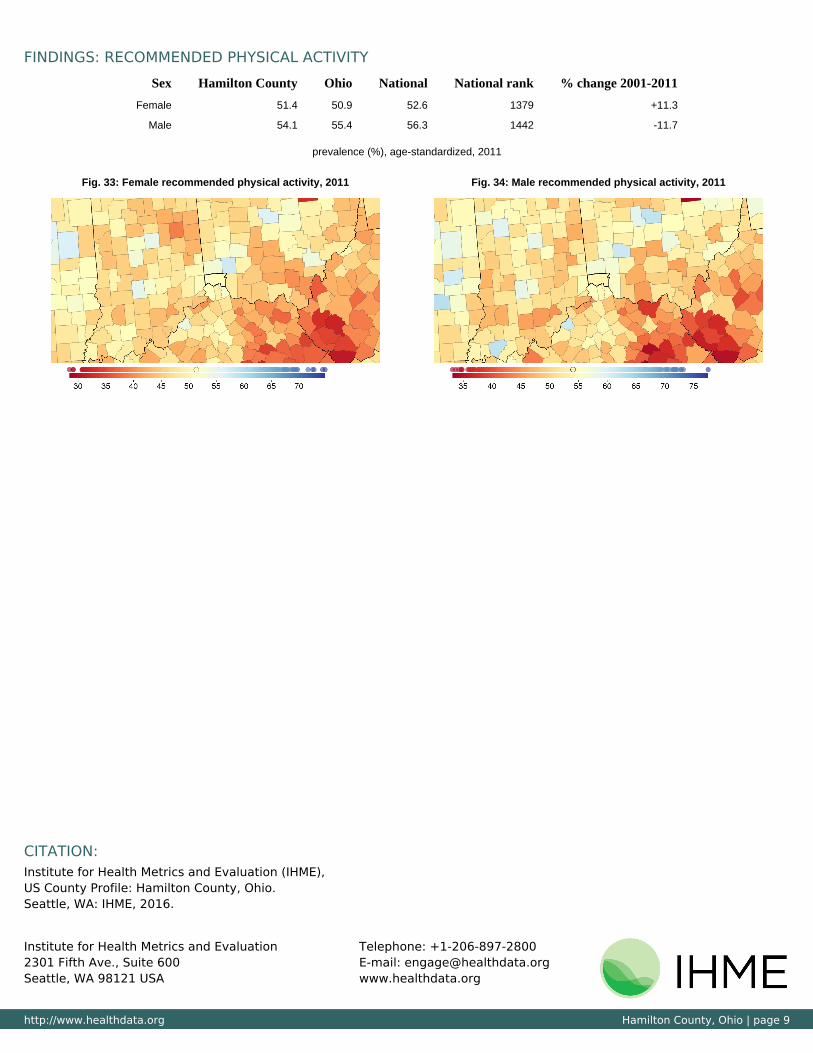
FINDINGS: RECOMMENDED PHYSICAL ACTIVITY
Sex Hamilton County Ohio National National rank % change 2001-2011
Female 51.4 50.9 52.6 1379 +11.3
Male 54.1 55.4 56.3 1442 -11.7
prevalence (%), age-standardized, 2011
Fig. 33: Female recommended physical activity, 2011 Fig. 34: Male recommended physical activity, 2011


![The Butler County press. (Hamilton, Ohio), 1923-03-30, [p ]](https://img.pdfslide.us/doc/110x75/6276798f91278e7334515229/the-butler-county-press-hamilton-ohio-1923-03-30-p-.jpg)