Embed Size (px)
Citation preview

White-tailed Deer Management on the Domain
Prepared by W. N. Wilson and J. K. Hiers
Finalized January 2016 Introduction Populations of White-tailed Deer have fluctuated widely on the Domain over the last 100 years.
Pre-settlement densities are little more than speculation, but by the turn of the 20th century deer
had been largely extirpated from the plateau by human hunting. Reintroduction efforts from the
1930s-80s reestablished the population, and absent natural predators and sufficient hunting the
population rebounded such that a Fall 2003 estimate of forest deer herd density on Breakfield
Road estimated 73 deer per square mile and a Fall 2010 estimate of deer centered on campus
estimated approximately 148 animals per square mile (Torreano, pers. comm). In the spring of
2011, a second class-led survey (McGrath) found similar numbers. This level of population is
almost 5 times the 25 deer per square mile average density recommended by Tennessee Wildlife
Resources Agency for high quality habitats in the state. Estimates by the Domain Natural
Resource Manager placed the 2010 sex ratio of the population in town close to 6 does for every
buck. The suburban community provides ideal conditions for deer to thrive due to edge habitat
with high fertility of fertilized yards and limited hunting pressure.
The result of this high population density has been felt on the Domain in many ways. Residents
interface with this increased density mostly through unwanted garden browsing and deer-vehicle
collisions Ecologically this increased population has reduced available browse in the forest and
is shifting the species composition of the understory. Numerous complaints of leaseholders
throughout the late 90s and early 2000s made it clear that the deer population in Sewanee had
reached social carrying capacity.
Harvest Objectives
Sewanee has been actively controlling the population through hunting since 2000, but was
originally limited to police sharpshooting of a few individuals. Later, more broad-based archery
hunts centered around the village population increased harvest totals, but did not affect

fundamental population issues. Since 2010 the hunting focus has been on both lowering the
population and balancing the sex ratio. Various classes have been annually monitoring
population trends and quantifying browse and the effects of that browse on the species
composition. Since 2010 annual census numbers have document a 70% decline in population
density and the sex ratio has been reduced to 2.5 does for every buck. Fall 2015 census
estimated white-tailed deer density of 52 deer per square mile. These deer herd management
program will continue with the following objectives in mind:
Establish a density of 20-30 deer per square mile measured through annual census.
Maintain sex ratio as close to 1:1 as possible.
Manipulate harvest regulations to promote an older age structure with mature buck
harvests of 3.5-6.5 years old at harvest.
Establishing extensive, periodic vegetation monitoring to classify browse impacts and
hunting effectiveness.
Reduce impacts on vegetation in a diversity of habitats.
By 2020, it is the objective of this program that the entire outer Domain be within the
harvest planning areas and within recommended density of 25-30 deer per square mile.
Population Monitoring
Continuous monitoring of the deer population in our area is critical for management to adapt
herd reduction efforts to achieve desirable densities. With the current urban focus, spotlight
sampling using distance estimation has been effectively used to estimate population size. The
spot light sampling technique employed on the actively hunted areas consists of 6 transects,
totaling 9.3 miles of roadside monitoring (Figure 2). Typically, each transect will be visited
repeatedly in the fall prior to hunting season until a total of 60 unique clusters of deer are
encountered. This sampling design presupposes a 2500 acre central campus closed population,
and makes the following assumptions: (1) Individuals on the transect line are all detected (β= 1);
(2) individuals are only observed once; (3) individuals are observed at their first position; (4)
distance measurements are accurate, and (5) individual detections are independent from one

another. Appendix C contains the specific sampling procedures and safety planning for spotlight
surveys on the Domain.
The sampling transects, there landscape designation and distance are as follows:
#1 Greensview (from Mississippi Ave.); suburban, 1.9 miles
#2 Morgan’s Steep; suburban, 1.3 miles
#3 Lake Cheston (to Wiggens Creek); suburban, 1.7 miles
#4 Brakefield (to Gate 7); forest, 1.7 miles
#5 The Cross (along Tennessee Ave.); suburban; 1.1 miles
#6 Ballpark (to Hatrock Rd.); suburban, 1.6 miles

Figure 2. Deer herd harvest and population trends and harvest levels since 2007.
Year
Density estimate (deer/sq. mile)
Effective Strip Width (yards)
Density Lower confidence level (deer/sq. mile)
Density upper confidence level (deer/sq. mile)
Density Coeficcient of Variation
GOF Chi‐p
2015 52.078 74.84 30.908 87.75 0.266 0.063
2014 40.281 60.04 26.56 61.092 0.212 0.045
2013 88.209 68.61 53.851 144.489 0.248 0.034
2012 117.367 69.72 80.974 170.117 0.188 0.066
2011 148.975 29.1 74.17 299.225 0.359 0.009
2010 148.829 88.32 94.555 234.257 0.229 0.011
Figure 3. Density estimates with statistical parameters since 2010.
Recent monitoring trends have shown positive effect of management efforts on the urban deer
population, (See figure 3) but these spotlight counts may become more limited in their ability to
detect deer densities in a forested setting with few regularly traveled roads. Thus expansion of
the cull into the outer Domain must be accompanied by additional monitoring techniques
appropriate to the habitat type. In 2014 we initiated camera population monitoring in cooperation
with hunters and Dr. McGrath’s Ecology students. The camera survey followed the technique
outlined by Jacobson (1997) involving baited camera stations and identification of unique bucks
photographed to create a population estimate. Future herd management and hunting rules in the
0
50
100
150
200
250
300
2007 2008 2010 2011 2012 2013 2014 2015
male harvested
female harvested
estimated density
sex ratio

forested portions of the outer Domain will be developed from monitoring data generated by this
technique.
Vegetation Monitoring
With reduction of vegetative impacts as a stated objective of this program, monitoring of deer
brown on vegetation is critical for measuring program success. Due to resource limitations,
however, the approach to vegetative monitoring will be more targeted than population
monitoring of the herd. A number of studies and class projects have been initiated on the
Domain to document the effects of deer herd browse pressure including a number of deer
exclosures(Figure 3) . Student projects from 2008 and 2010 by Torreano and Dolan quantified
effects of browse on plant communities, but were limited in spatial extent and do not follow the
same methodologies.

Figure 3: Locations of Deer exclosures on the Domain.
In 2012 an extensive sampling effort was completed by an independent study project (Armstead
2014) that provides the best baseline data of browse pressure to date (Figure 3). While it was
confined to the western portion of the Domain, it will serve as a foundation to correlate deer
density with sapling density as our primary measure of herd management efficacy.
Fieldwork for initial sampling of browse monitoring plots was performed between June
and August 2012 with the establishment of 46 randomly stratified, 20 m x 50 m box transects.
Each transect contained 10 randomly distributed, circular plots. A plot consisted of two nested
circles: 5-m diameter circle for saplings (0.25–3 m height) and 1-m diameter circle for seedlings
(<0.25 m height). All tree seedlings and saplings were recorded by species and density and
ranked into 3 browse categories based on percent defoliation by deer (0%, 1-50%, >50%). A
photograph was taken and used in the calculation of percent vegetative cover of each plot. Four
fenced exclosures (2 – 16m2, 2 – 24m2), established prior to 2000 were used to assess the plant
community condition in the absence of deer within the study site. After excluding a buffer zone
near the fence, the entire area within each exclosure was sampled as plots described above.
Vegetation in exclosure showed no evidence of browse and is a reference for sampling density
and vegetation development in the absence of browse pressure. Exclosures will need to some
maintenance in 2015-2016 to refresh fences.
Each plot has sapling density, percent vegetative cover, percent recruitment, tree richness and
tree diversity. Using the photographs taken in each plots, percent cover was determined using
Adobe Photoshop following the procedure of Luscier et al. (2006). Percent recruitment
( )
was an indicator of successful seedling to sapling transition.
In 2015, the resampling of these original 40 plot locations will be undertaken prior to the cull to
evaluate a gradient of deer browse pressure and associate it with numbers of harvested deer,
landscape position, and habitat type. Additional sites below the bluff were added in 2015 and
additional sampling added to the design (See appendix for sampling design) It is anticipated that
these vegetative sampling plots will become permanent and revisited every 3 years until
populations reach targeted levels. At that time, the periodicity of sampling will be evaluated.
# Sapling
# Seedling # Sapling

Figure 3. Interpolated sampling density from 40 vegetation plots measured in 2012. Deer exclosure
locations are shown in black squares.
Other Monitoring
Hunters regularly track several parameters upon harvest. For each harvested individual, field
dressed weight, sex, lactation presence, and age by dentition aging is collected. These datasest
are compiled and analyzed semiannually through the Wildlife Management class taught by Dr.
Torreano. This information provides critical information on the herd health, growth rates, and
age structure. Periodic sampling for other deer herd pathogens and disease may be conducted on
an as needed basis when observations are sent to the Domain Manager.
As the number of harvested animals declines with the population, increased monitoring of hunter
effort and success will be necessary to maintain a level of hunter satisfaction sufficient to
maintain hunting pressure. Hunting on the Domain requires a more complex set of rules and
regulations. Historically the burden of those rules was offset by the sheer volume of deer
present, making hunter success very high. As hunter success wanes adjustments to the hunt may
be necessary to maintain hunter participation. Measurements of hunter effort and success may
be added during the 2016 season.
Management Approach
Current efforts to reduce the population are consistent with the Tennessee State hunting
regulations and work within the parameters of the state designated hunting season. Though early
harvest efforts were done outside of the normal hunting season with state issued damage permits,
current liberal harvest limits within the state regulations make these permits unnecessary at this
time. The last damage permits used on the domain were for issued Spring of 2012. The
University hunt is modelled on Quality Deer Management practices. In addition to liberal doe
harvest mandates, there is an antler restriction currently set at 15 inch outside spread intended to
protect bucks younger than 2.5 years. This antler restriction may grow as the population ages.
Since 2010, harvest targets and sex ratio manipulations have been accomplished with a
combination of various incentive programs within the standard hunt and allowing a subset of
hunters move liberally across the suburban portions of the Domain to increase hunting success
with urban doe groups.
The regular hunt on the Domain is open to faculty, staff, students, and limited guests and is
broken into two sections. The archery only portion begins at state season opening day and runs
until students leave for Christmas break. The archery and muzzleloader season begins as soon as
students leave and runs until the state season end.
During the Archery only hunt, there are 7 designated hunting zones. Each hunter must check in
to each zone every time he or she wishes to hunt. Hunters participating in AM and PM must
check in separately for each hunt. Check in is done by initialing the check in board for the
appropriate zone upon arrival and departure of the zone. There are also separate maps where a
hunter can locate his or her stand so that other hunters can know where the stand is and avoid
that area. Stands may be left in the woods unattended, so a stand location on the map does not
mean that there is a hunter there at any given time. The check in board determines presence or
absence.
Doe harvest during the archery only season is incentivized through an “earn a buck” program.
For each legal buck harvested (button bucks excluded) each hunter must harvest 3 does in
addition to the buck. The buck may be harvested prior to doe harvest, but does must be
harvested prior to any additional buck harvested to avoid sanction. In addition to earn a buck,
there are other incentives for doe harvest that have changed through the years as the population
has been reduced. In 2011, an “earn a gun” program was initiated which required all hunters to
have harvested 5 does before being allowed to use muzzleloader or shotgun during the Christmas
hunt. This requirement has been reduced in recent years as the population has declined.
Additionally, the Christmas hunt offers many opportunities for hunters to hunt in smaller areas in
and around central campus. Historically these zones were drawn for exclusive use through a
lottery system. In 2011 this policy was changed so that zones are drawn in order of the number
of does harvested in the Archery only season so that more successful hunters get first choice on
the best zones.
The Christmas hunt adds more than 30 interior zones to the 7 zones open during the archery
season. As indicated above, hunters may receive first preference for these zones based on the
number of animals harvested in the archery season, but that preference is only retained if the area
is actively hunted. Hunters who are not hunting their drawn zone must write “open” in the zone.
Hunters who do not “open” their zone and do not hunt it regularly will have their preference for
that zone revoked. During the Christmas hunt, some zones previously open during Archery
season are open muzzle loader and shotgun hunting to approved hunters. As stated above, there
are doe harvest requirements with a bow prior to firearm use. This restriction not only incentives
doe harvest, it also requires demonstrated hunting competence prior to use of firearm.
Additionally hunters are required to have harvested at least one animal in one of the smaller
urban zones prior to using a firearm in the outer zones. This rule ensures good hunter
participation in the urban areas.
Beginning in 2013, we allowed a limited number of hunters, (in coordination with cooperating
leaseholders) greater flexibility to move in the residential areas of the Domain to manage specific
herds. The result of this effort was a 236% increase in overall animal harvest, and a more than
doubling of the percentage of animals harvested in residential areas. In 2014, we repeated the
2013 harvest plan. In addition to the regular hunting times and zones for the cull and precull, a

select group of the most productive hunters from 2013 were allowed greater movement in the
residential areas. Like last year, the boundaries of this greater movement were determined by
census of the leaseholders through email to assess problem areas and areas of special safety
concern.
With the successful reduction of deer herd populations around the urban core, it is the
University’s stated objective to manage over all deer populations at the 25 deer per square mile
density recommended by TWRA. The continued expansion of intense hunting pressure to the
outer Domain will continue in 2015 with the addition of the units to the SW towards the King
Farm.
Prior to any expansion of the cull, we will collect vegetation browse data (sapling density) and
estimate herd population size through camera surveys. By 2020, it is the objective of this
harvest program that all of the outer Domain average the recommended density of 25 individuals
per square mile.
Each year a cull unit map will be produced and coordinated with appropriate stakeholders by the
Domain Natural Resource Manager. An example of this map is found in Figure 4. Each year this
map will be made available on the website for informational purposes, but also for download to
mobile devices to ensure hunters are within designated areas, and recreationist are aware of
harvest activities.

Figure 4. Example of harvest area mapped produced annually and briefed to all hunters and
made available to the recreating public on the Domain.

APPENDIX A: RULES OF THE CULL 2014-2015
1. Safety and courtesy are paramount. Do not endanger the opportunity for future hunts by participating in a confrontation with the public, dogs, etc. Report incidents to University Cull Official ‐‐ Nate Wilson. Do not try to resolve the problem. Let us take care of it!
2. All TWRA hunting rules and limits will apply. All deer must be tagged against the hunter’s license and count against the hunter’s statewide limits. All check‐in will be via the Internet. If the hunter does not want to take the deer home please let dispatch know immediately so that it can be given away in the community.
3. This hunt is comprised of numbered interior zones and exterior zones where hunting is permitted only from elevated treestands. In exterior zones with the “M” designation, muzzleloaders, shotguns, and bows may all be used by eligible cull participants (for eligiblility see item 4). Orange blaze must be worn at all times by all participants, regardless of weapon.
4. Gun hunting privileges in zones designated M will be granted to all hunters who have harvested one doe during the 2014 Pre‐cull.
5. Do not hunt within the 100 yard safety zone of all open walking trails or fire lanes. 6. Field dressing is permitted only in exterior zones 1‐6. 7. For each deer taken all columns of the check‐in sheet should be filled in. 8. Only persons on the approved list are permitted to hunt. A drawing will be held for interior zones
starting with the hunter who has harvested the most does during precull. Where there are multiple hunters with the same number of does, a drawing will be held.
9. All hunters must be signed in and have location on the check in map when hunting The whiteboard in the Police bay must be initialed by the hunter for checking in and out of zones for all hunts.
10. All participants are required to sign “release” and “rules of the cull” forms and fill out an online application.
11. If a hunter knows in advance that he will not be present for a hunt he should write “open” in the zone so that other hunters may hunt in the unused zone. Failure to do this within the allotted time renders the zone open to all.
12. The dates for this deer cull are: Thursday Dec. 18th through Sunday, Jan 4th (except no hunting on Christmas Eve or Christmas Day.)
13. No hunting between 10:00 a.m. and 2:00 p.m. at any time. 14. All participants are required to sign “release” and “rules of the cull” forms. 15. All participants are required to shoot three does for every buck taken. Button bucks do not apply to
doe quota. 16. No buck shall be taken with an inside spread of less than 13 inches at the main beam. This is
equivalent to outside the ear spread of a deer with alert ears. 17. Failure to comply with any of the above regulations or any TWRA regulation will be grounds for
removal from the university hunt.
I have read these rules, I understand them, and I agree to abide by them fully.
____________________________ ___________________ _______________________
Signature Date Sponsor

APPENDIX B: RULES OF THE ARCHERY-ONLY PRE-CULL 2014
1. Safety and courtesy are paramount. Do not endanger the opportunity for future hunts by participating in a confrontation with the public, dogs, etc. Report incidents to Nate Wilson.
2. All TWRA hunting rules and limits will apply. All deer must be tagged against the hunter’s license and count against the hunter’s statewide limits. All check‐in will be via the Internet. If the hunter does not want to take the deer home please let dispatch know immediately so that it can be given away in the community.
3. Enter and leave hunting areas discretely. Park discretely. Minimize the intrusion into neighborhoods. 4. Only bowhunting from elevated positions in treestands is permitted. No permanent stands are to be
attached. There is no gun hunting of any type. 5. Do not hunt within the 100 yard safety zone of all open walking trails or fire lanes. 6. Field dressing in zones is permitted in the pre‐cull. 7. For each deer taken all columns of the check‐in sheet should be filled in. 8. Only Persons on the approved list are permitted to hunt. There are no assigned zones. Since the
zones are very large, any hunter can sign in for any zone. All hunters must be signed in and have location on the check in map when hunting The whiteboard in the Police bay must be initialed by the hunter for checking in and out of zones for all hunts.
9. No hunting between 10:00 a.m. and 2:00 p.m. on any day. 10. Hunting is allowed on all WEEKDAYS starting September 27th and ending December 17th from first
morning light until 8:30 a.m. in all pre‐cull zones AND 3:30 p.m. until dusk in pre‐cull zones 3, 4, and 6 only (except Thanksgiving Day. There is no hunting on Thanksgiving Day period. )
11. All participants are required to sign “release” and “rules of the cull” forms. 12. There will be no hunting October 17‐19th or November 7th‐9th. Weekend hunting rules apply during
Fall Break October 4th through 7th. 13. All guests who killed at least two animals during the 2012/2013 season are full members this year. 14. All full members in 2013 will be allowed to bring one guest during the season. Hunter must submit
guest names to Chief of Police for approval. ALL NEW GUESTS MUST SHOOT AT LEAST THREE ANIMALS DURING THE 2013/2014 SEASON IN ORDER TO QUALIFY FOR GUEST STATUS NEXT YEAR. Guests must hunt with their sponsor on three occasions before hunting alone.
15. All participants are required to shoot three does for every buck taken. Button bucks do not apply to doe quota.
16. No buck shall be taken with an inside spread of less than 13 inches at the main beam. This is equivalent to outside the ear spread of a deer with alert ears.
17. Failure to comply with any of the above regulations or any TWRA regulation will be grounds for removal from the university hunt.
I have read these rules, I understand them, and I agree to abide by them fully.
____________________________ ___________________
Signature Date

APPENDIX C: DEER SPOTTING PROCEDURE
Four‐person teams:
Driver (faculty or staff only)
Spot light operator
Range Finder operator and counter
Data collector
Meet in Snowden 215 at 6:30 pm to review procedure
Fill out sampling data sheet (date, observers, transect number & name, start time, start miles, etc)
Inform Police that you are planning to census.
Begin driving transect at dark (around 8 pm) – use Biology truck with rack attached.
All persons in back of truck must sit on bottom of bed(not fenderwells or bedrails) when truck speed exceeds 15mph. Truck should never exceed 25 mph with passengers in rear of truck.
Sample only the right side of the road
Must drive slowly (2.5 – 5 mph when sampling)
Spot light operator moves light back and forth
When cluster is seen, driver stops, spotter gives a distance using the rangefinder and everyone works together to get a cluster number and sex ratio (when possible)
Record data
Continue until the end of the transect
Finish filling out data sheet (stop time, stop miles, total distance, etc)
If doing a short transect, begin driving it
Will end around 10 pm (don’t go later because deer start to bed down for the night)
Goal is to have 4 replications of each of the 6 transects below (need 60 unique clusters of deer) by
September 22.
As the driver, I have read and understand the spotlighting procedure and agree to follow listed safety
recommendations
_________________________________________ ___________________________
Signature Date

Appendix D
Vegetation Sampling Procedures
Deer Sapling Study Methods Plateau Top:
There are 46 randomly stratified points on the plateau for
the purpose of measuring deer browse. At each point, a 50
meter tape was laid out running north, or the direction that
best maintains a constant elevation (note on datasheet).
The north and south points of the transect were marked at
the end with flags giving the plot name and sponsoring
professor.
Once the 50 meter tape was laid out, we walked a 2 meter
pole parallel to one edge of the tape. We counted and
identified all tree saplings with a height of 0.5‐2 meters
within the 2 meters. When we reached the end of the tape,
we repeated the same methods on the other side.
Equipment needed:
50 meter tapes 2 meter long poles Meter sticks Flags
Notes:
We did not count shrubs or other woody herbaceous plants, such as blueberry, Smilax, Grapevine, or
maple leaf viburnum.
We did count small trees, such as mountain laurel, farkleberry, rusty black haw, and hackberry.
For our purposes, we did not identify hickories down to species.
In the deer manuscript, the methods differ so that seedlings are also counted, and saplings are counted
in circular plots. We changed the methods for the purpose of our 2015 resurvey.
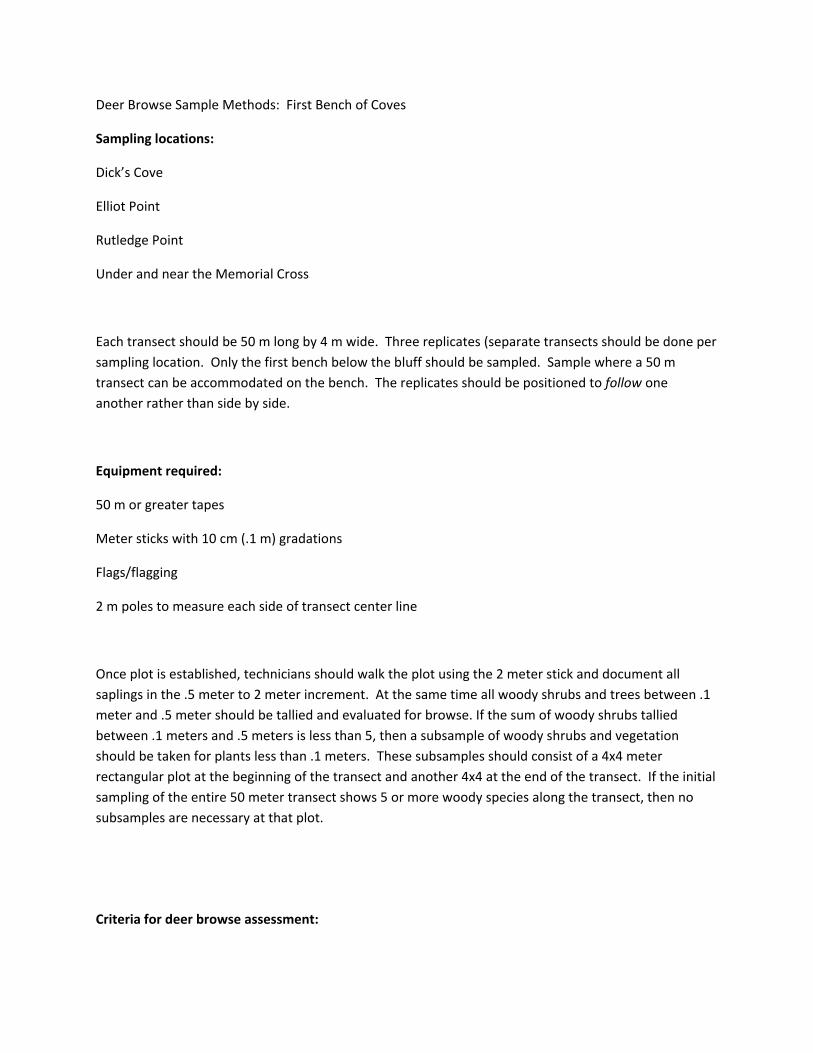
Deer Browse Sample Methods: First Bench of Coves
Sampling locations:
Dick’s Cove
Elliot Point
Rutledge Point
Under and near the Memorial Cross
Each transect should be 50 m long by 4 m wide. Three replicates (separate transects should be done per
sampling location. Only the first bench below the bluff should be sampled. Sample where a 50 m
transect can be accommodated on the bench. The replicates should be positioned to follow one
another rather than side by side.
Equipment required:
50 m or greater tapes
Meter sticks with 10 cm (.1 m) gradations
Flags/flagging
2 m poles to measure each side of transect center line
Once plot is established, technicians should walk the plot using the 2 meter stick and document all
saplings in the .5 meter to 2 meter increment. At the same time all woody shrubs and trees between .1
meter and .5 meter should be tallied and evaluated for browse. If the sum of woody shrubs tallied
between .1 meters and .5 meters is less than 5, then a subsample of woody shrubs and vegetation
should be taken for plants less than .1 meters. These subsamples should consist of a 4x4 meter
rectangular plot at the beginning of the transect and another 4x4 at the end of the transect. If the initial
sampling of the entire 50 meter transect shows 5 or more woody species along the transect, then no
subsamples are necessary at that plot.
Criteria for deer browse assessment:

Intensity of browse on plant
0 = 0 to none 1 = 0 to 10% 2 = 10 to 50% 3 = >50%
For each plant, measure height to nearest 0.1 m. Count and ID all tree and shrub species up to 2m tall.
Make sure that woody species such as farkleberry (sparkleberry), viburnum, blueberry, Smilax and grape
(Vitis sp.) are measured and recorded. Do your best when Id’ing the species within a Genus. The
hickories can be difficult.
In each transect, estimate the BA of the trees using the BA guage at 5 points along the centerline in each
transect . Walk 5m in and take the first of five points. Just count the trees seen as “in” and ID by
species. Then walk 10 m to the next point. The last point will be about 5 m from the end of the
transect.